3.1. Evolution of the Pattern of Net Trade-Embodied Carbon Flows
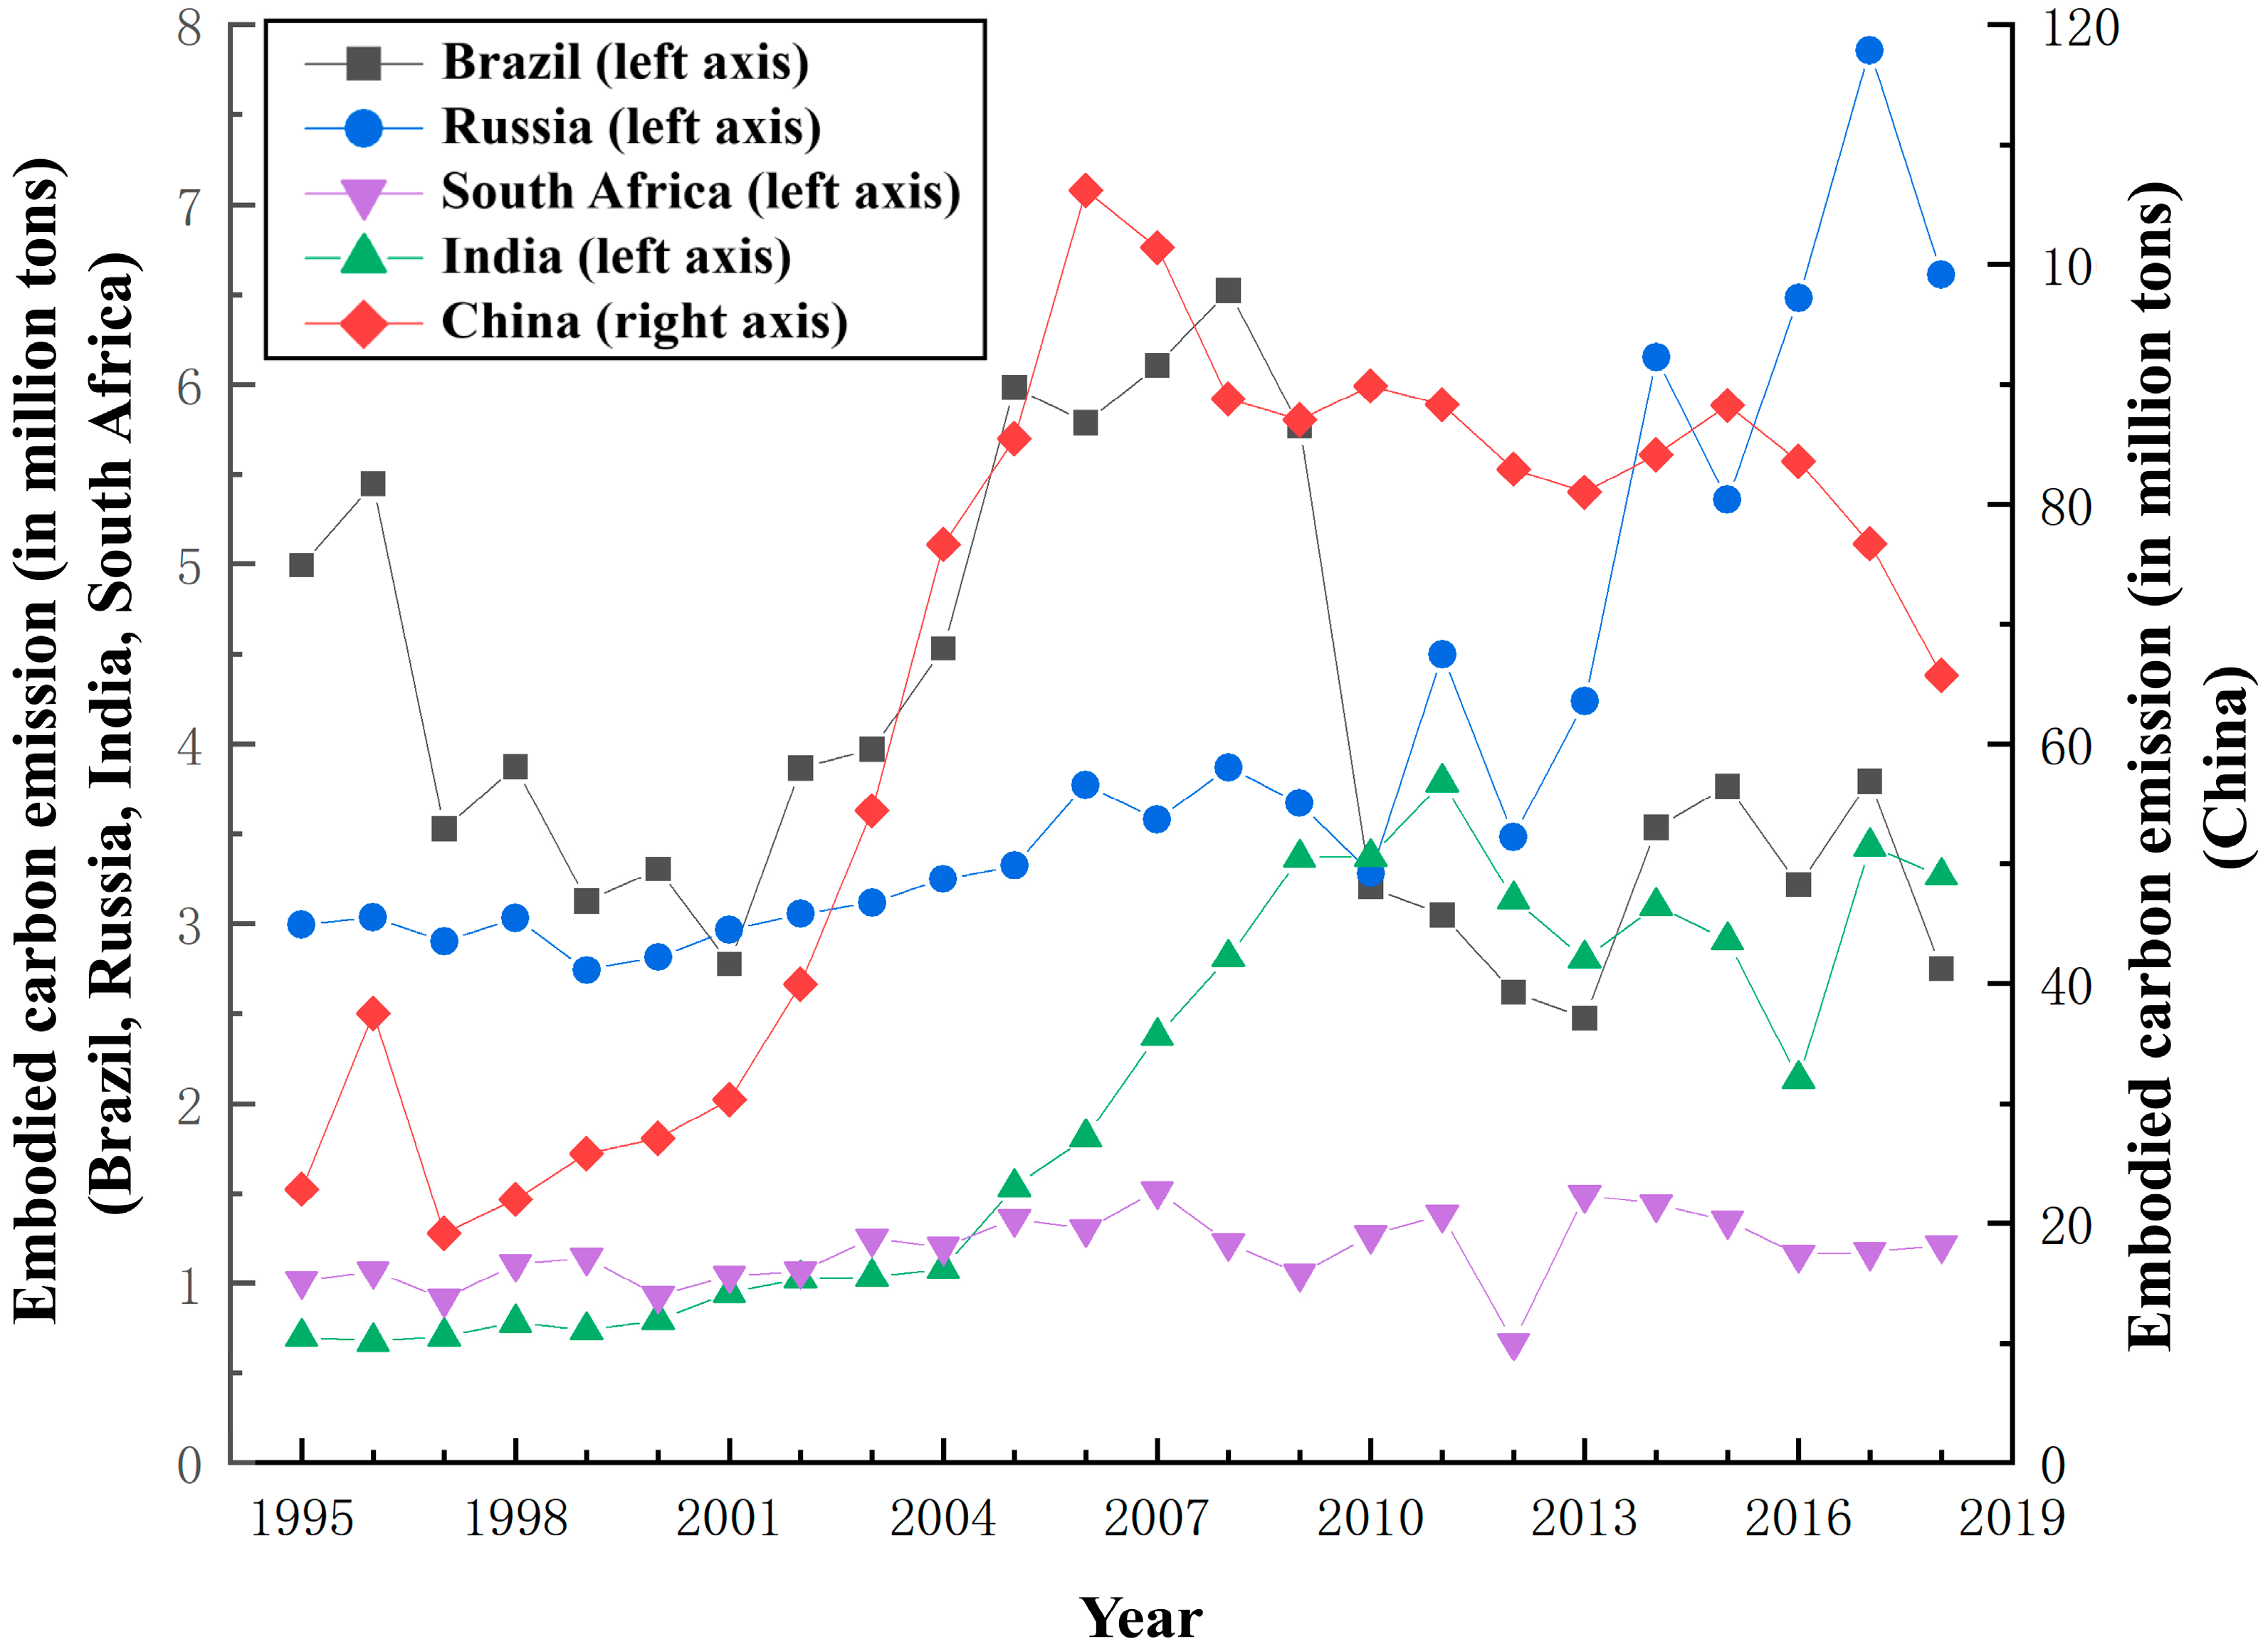
The embodied carbon in export trade was calculated and is shown in
Figure 1. China’s waterway transport industry continues to lead in total embodied carbon for export trade, increasing from 22.81 Mt in 1995 to 65.74 Mt in 2018, with an average annual growth rate of 4.71 percent. Notably, its growth rate shows phased fluctuations: it grew at an average annual rate of 6.24 percent from 2003 to 2011 due to trade expansion, and then slowed down to −9.35 percent from 2015 to 2018 due to the impact of emission reduction policies. Among the other four countries, Brazil’s embodied carbon in export trade in the waterway transport industry showed a “U-shaped” fluctuation: it dropped by 44.3 percent from 1995 to 2001, and then rebounded to 6.11 Mt (an increase of 120 percent) from 2001 to 2007. India’s embodied carbon in export trade in the waterway transport industry has been growing steadily, from 0.7 Mt in 1995 to 3.27 Mt in 2018, with the growth rate of the waterway transport industry in the past two years continuing to rise. South Africa’s total embodied carbon in export trade in the waterway transport sector was the lowest, fluctuating gently, increasing from 1.01 Mt in 1995 to 1.21 Mt in 2018. Notably, during the global financial crisis (2007–2010), embodied carbon in export trade in China’s waterway transport sector declined by 11.39 percent, while Russia led the trend of growth, and India maintained positive growth, reflecting the resilience of its trade.
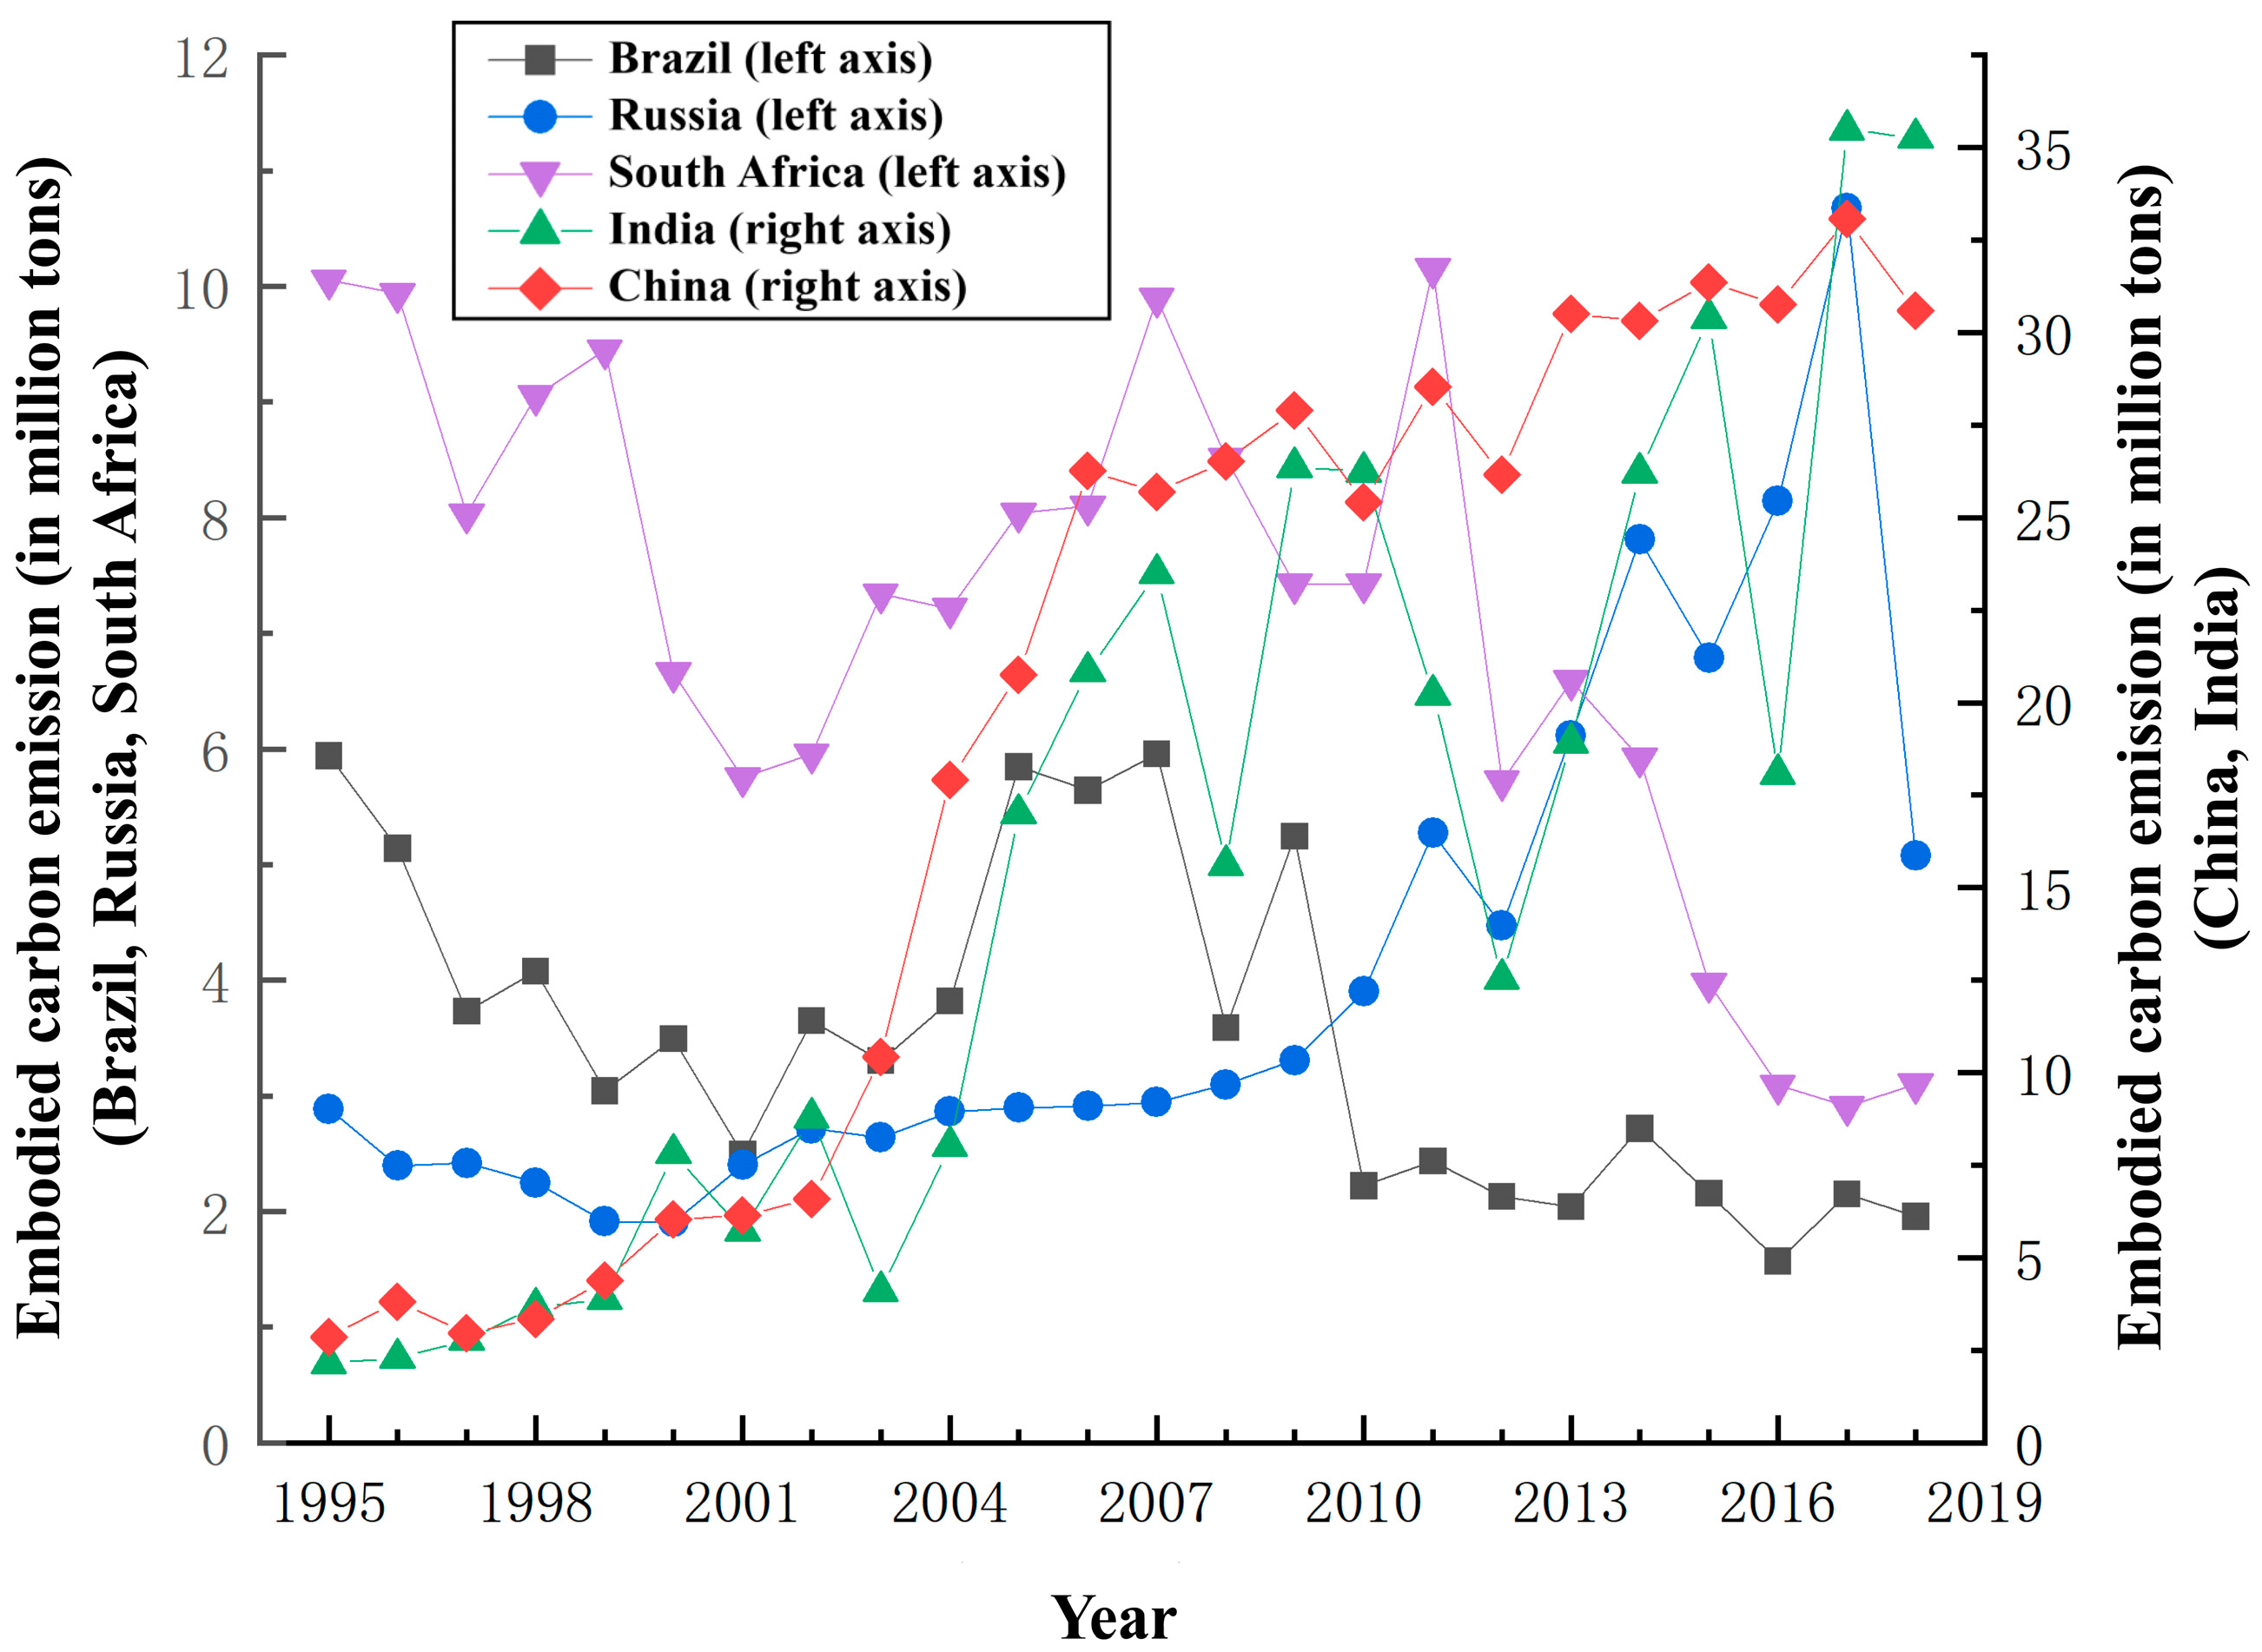
The embodied carbon in import trade was calculated and is shown in
Figure 2. India’s embodied carbon emissions in water transport import trade have experienced the highest growth rate, surging from 2.15 Mt in 1995 to 35.27 Mt in 2018, with an average annual growth rate of 12.93%. Notably, this growth accelerated after 2010, with an average annual increase of 3.77% from 2010 to 2018. China ranks second in terms of growth rate, with the highest total embodied carbon emissions in water transport import trade, reaching 30.59 Mt in 2018. However, its growth rate is slower than India’s, with an average annual increase of 10.85%. In contrast, Brazil, Russia, and South Africa showed a downward trend. Brazil’s embodied carbon emissions in water transport import trade decreased from 5.94 Mt in 1995 to 1.96 Mt in 2018, reflecting an average annual decline of 4.68%. Russia’s emissions rose from 2.89 Mt to 5.08 Mt, though this was influenced by a peak of 10.67 Mt in 2017. South Africa saw its emissions drop from 10.05 Mt to 3.10 Mt, with an average annual decrease of 4.98%, indicating a significant reduction.
Looking at the data in phases, the global financial crisis of 2008 triggered a pullback in import carbon emissions across several countries. For instance, China’s import carbon emissions fell from 26.51 Mt in 2008 to 25.43 Mt in 2010, while Brazil’s emissions dropped from 3.59 Mt to 2.22 Mt in the same period. In contrast, India’s emissions increased from 15.61 Mt to 26.24 Mt, reflecting a rebound of 68%. After 2015, South Africa experienced a sharp decline in import carbon emissions, from 9.90 Mt to 3.10 Mt, aligning with its low-carbon port renovation policies.
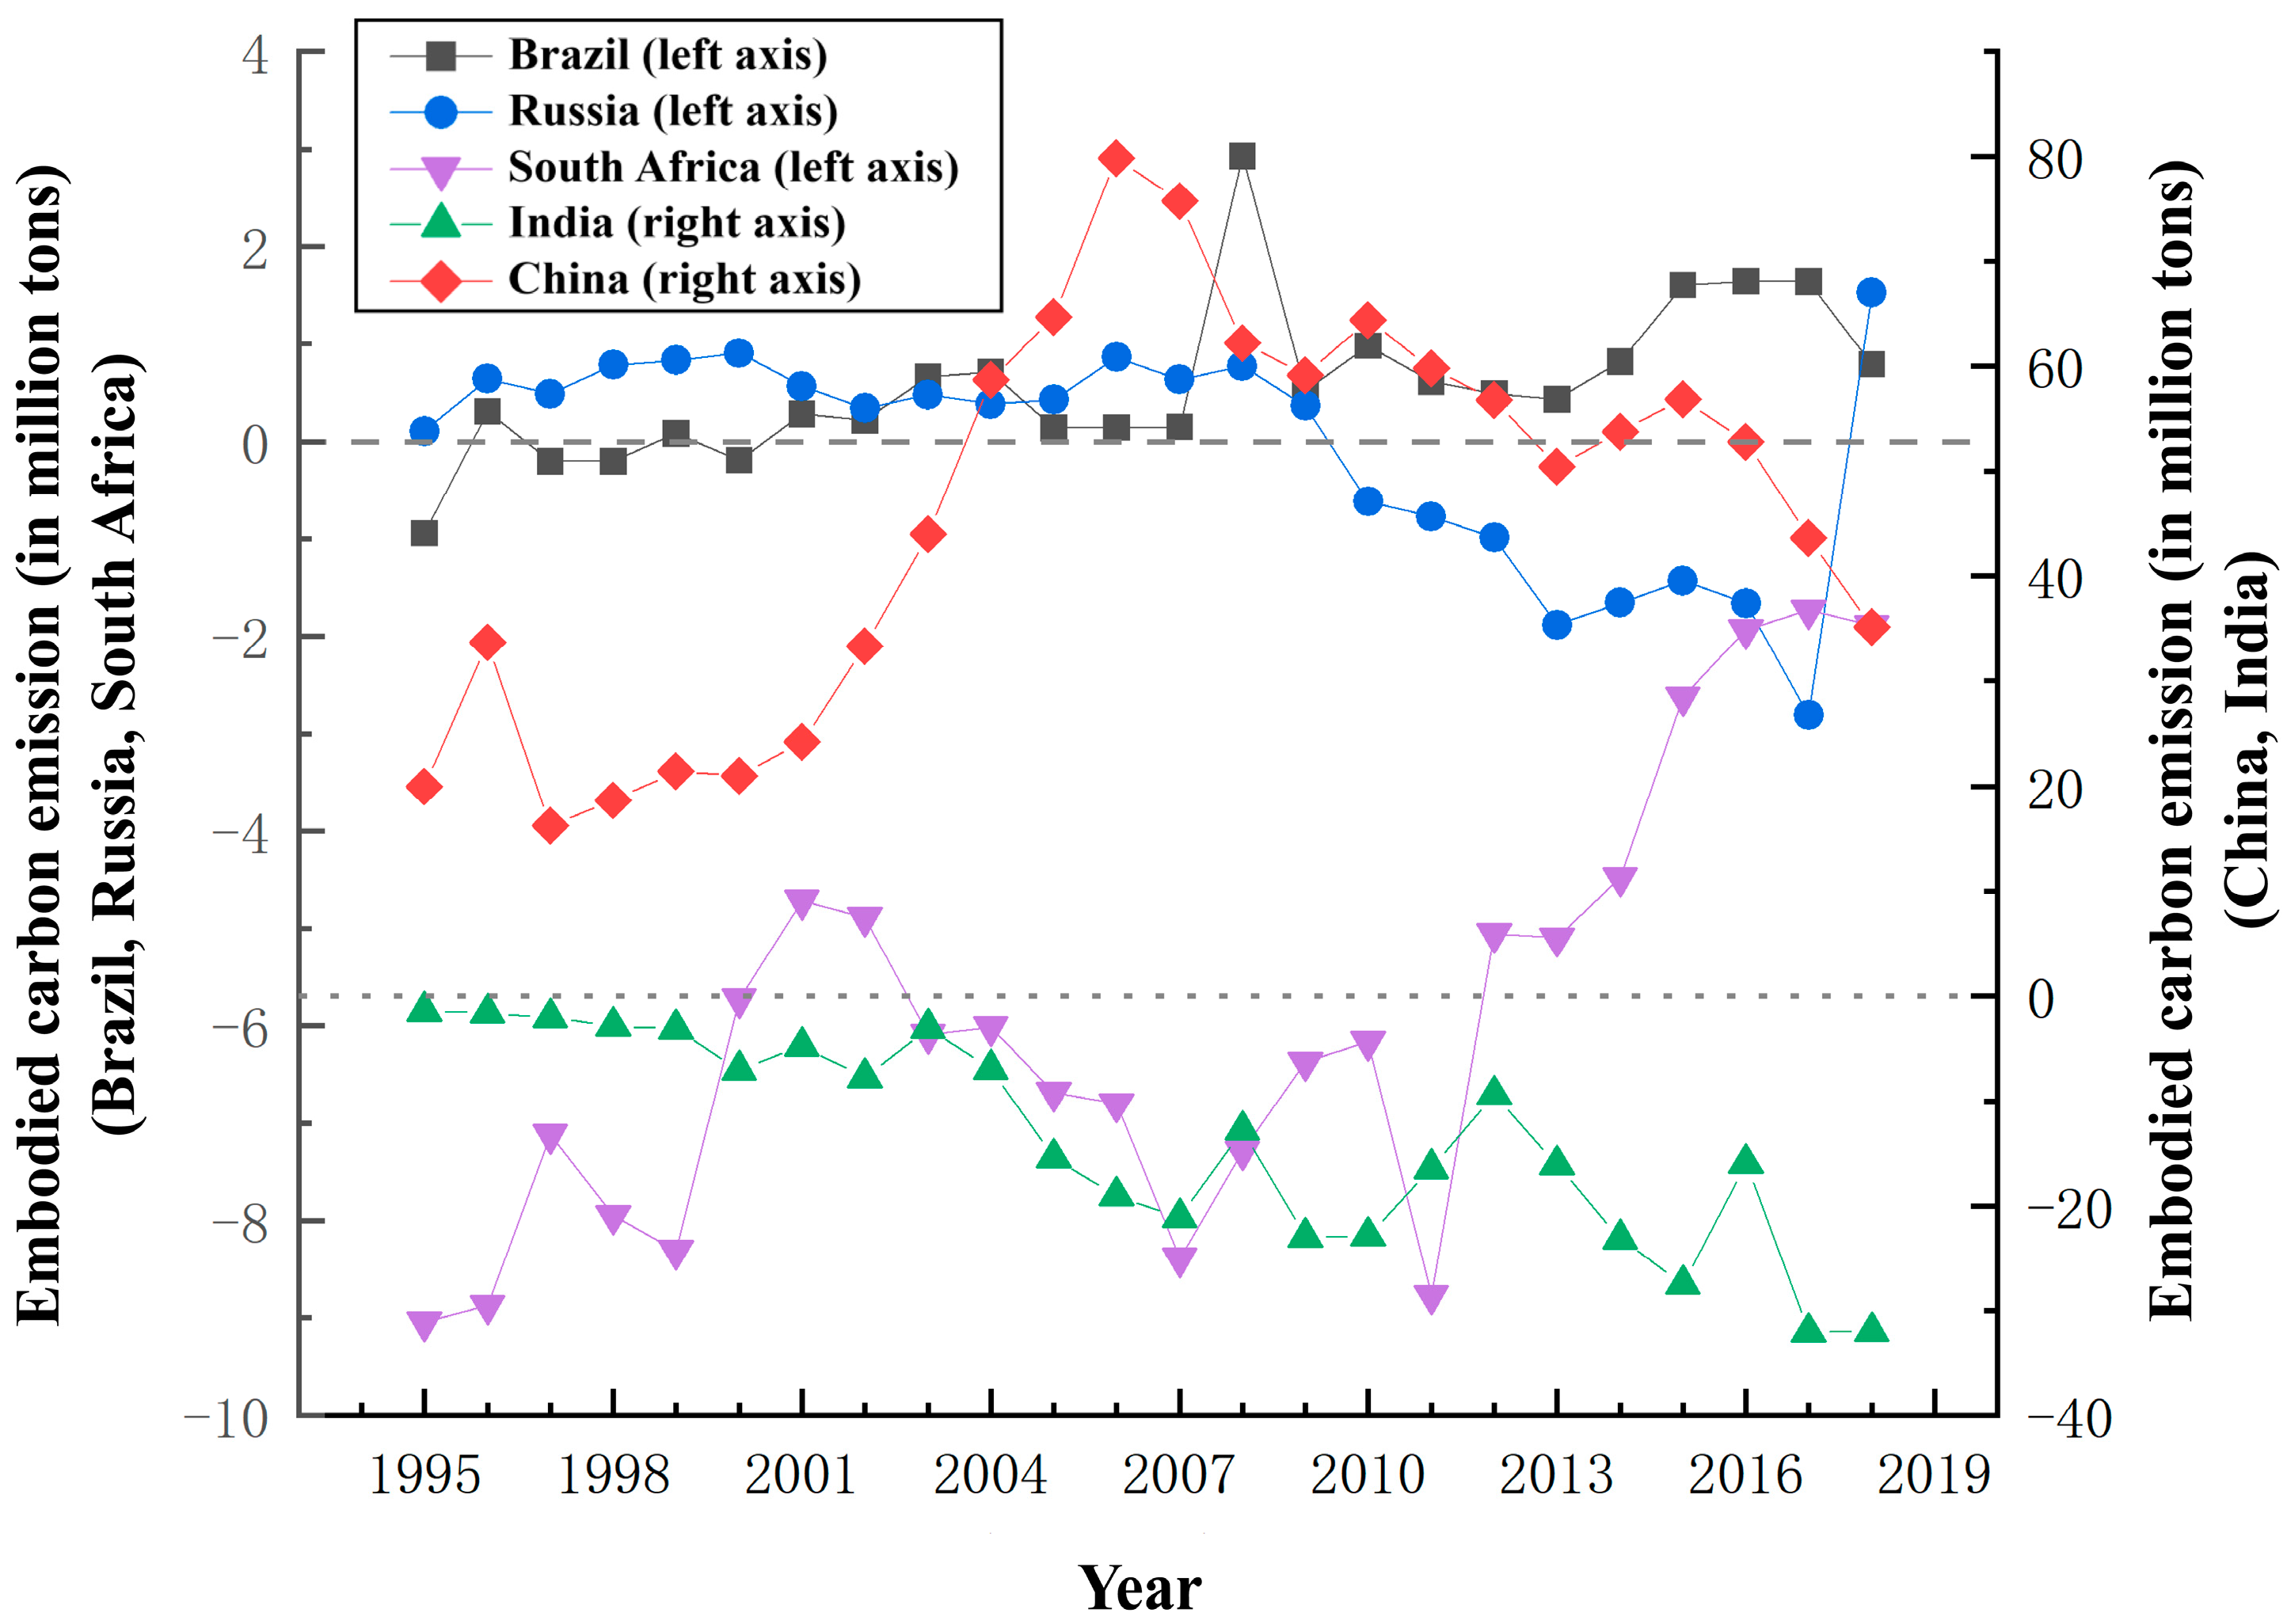
The embodied carbon in net export trade was calculated and is shown in
Figure 3. China has consistently been a net exporter, with its net transfer increasing from 19.95 Mt in 1995 to a peak of 79.91 Mt in 2006, before declining to 35.15 Mt in 2018, a decrease of 56.01%. This decline supports the assertion that “emission reduction policies have begun to show results.” India’s net import gap has continued to expand, from −1.45 Mt in 1995 to −32.00 Mt in 2018, with an average annual growth rate of 11.3%. Since 2000, Brazil has shifted from a net importer (−0.19 Mt) to a net exporter (0.79 Mt in 2018), though with significant fluctuations, peaking at 2.93 Mt in 2008. Russia, after a role reversal in 2009, remained a net importer from 2010 to 2017, but in 2018 became a net exporter of 1.53 Mt, reflecting its shift in energy export structure. South Africa’s net import gap has gradually narrowed from −9.04 Mt in 1995 to −1.89 Mt in 2018, due to reductions in its import scale and improvements in energy efficiency.
3.2. Decomposition of Driving Effects in Temporal Dimension
Leveraging the temporal LMDI model, this study decomposes the driving factors of embodied carbon emissions within the export and import trade of the water transport industry across BRICS nations from 1995 to 2018, with a particular focus on the temporal heterogeneity characteristics of scale, structure, and intensity effects. The findings reveal significant national disparities and stage-wise fluctuations in both export and import trade effects (
Table 2: Export trade,
Table 3: Import trade).
The scale effect is the core driver of carbon emission growth, but the paths differ significantly across countries. Specifically, in terms of exports, China’s export scale effect contribution is the highest, reaching 119.72 Mt from 1995 to 2018, with a total contribution rate of 278.91%. Notably, from 2003 to 2011, the contribution rate surged to 296.87%, primarily due to the sharp increase in port throughput driving bulk commodity exports. India’s export scale effect contribution is relatively low, at just 4.33 Mt, but from 2011 to 2018, its contribution rate turned negative, dropping by −144.86%, reflecting stagnation in water transport exports, likely due to bottlenecks in port infrastructure. South Africa’s scale effect showed significant volatility, with a contribution rate of 929.12% from 2003 to 2011, mainly driven by a short-term surge in coal exports. However, from 2011 onwards, the contribution turned negative, possibly due to fluctuations in international energy prices leading to a contraction in exports. Russia’s export scale effect remained overall positive, contributing 7.95 Mt, but from 2011 to 2018, it turned negative (−0.68 Mt). Brazil’s export scale effect was relatively stable, with a contribution of 5.98 Mt, experiencing a slight decline only from 2011 to 2018.
In terms of imports, scale expansion is particularly evident in developing countries. India’s import scale effect contributed the most, with 32.06 Mt from 1995 to 2018, accounting for 96.79% of its total embodied carbon emissions. However, after 2010, the growth rate slowed to 28.46%, reflecting the gradual substitution of imports by domestic manufacturing. China’s import scale effect exhibited a phased characteristic: from 2003 to 2011, the contribution rate was 141.52%, corresponding to the deep integration of global supply chains; after 2011, it surged to 528.28%, indicating the carbon leakage risks associated with domestic consumption upgrades.
Structural effects exhibit regional heterogeneity. China’s structural effect contribution remains positive, indicating its impact on embodied carbon emissions is above the average, promoting carbon emissions. Brazil’s contribution value sharply dropped to −0.18 Mt in 2011, but it remained positive in other years with a decreasing trend, suggesting that while its impact was above the average, it was gradually converging towards the mean. The structural effect contributions of the other three countries were all negative, indicating their structural effects were below the average, thus inhibiting export-related embodied carbon emissions. Overall, before 2011, the structural effect differences between countries expanded, but in recent years, due to industrial adjustments and optimization, these contributions have decreased, narrowing the spatial distribution gap between countries.
The import structural optimization effect is significantly influenced by policy tools. South Africa’s import structural effect contribution rate was 91.01% (contribution value of −6.42 Mt) from 2011 to 2018, closely linked to its implementation of a green tariff policy. Brazil’s import structural effect was unusually negative from 2003 to 2011 (−93.62%), primarily due to the substitution of iron ore imports with local mining. India’s import structural effect contributed 54.79% (contribution value of 8.25 Mt) from 2011 to 2018, reflecting its expanding industry’s increasing dependence on high-carbon intermediate goods.
Intensity effects generally play a role in emission reduction. In terms of exports, intensity effects reflect the differences in technological advancements, with China showing the most notable improvement. From 1995 to 2018, China’s intensity effect contributed −59.08 Mt, with a contribution rate of −137.62%. Particularly from 2003 to 2011, the contribution rate reached −232.55%, confirming that China’s energy efficiency revolution in the water transport sector had begun to show results. India’s intensity effect was overall negative, with a cumulative contribution rate of −76.19%, but from 2011 to 2018, it turned positive, with a contribution rate of 87.23%, indicating that the technological upgrades in India’s water transport industry lagged behind its economic growth. Russia’s intensity effect exhibited fluctuations, being positive from 2011 to 2018, with a contribution rate of 54.09%, and negative in other years.
For imports, the intensity effect reveals the asymmetry of technological spillovers. China’s import intensity effect from 2011 to 2018 had a contribution rate of −483.46%, the highest among the five countries. This could be attributed to the adoption of ultra-large container ships (ULCVs), which reduced carbon emissions per unit of freight, reflecting China’s strong ability to absorb low-carbon technologies. South Africa, in contrast, had a contribution rate of −4.51% during the same period, reflecting limited improvements in technology. Brazil’s import intensity effect was unusually positive in 2003–2011 (685.32%), which may be linked to the rebound effect due to the failure of biofuel technology promotion.
In terms of total effects, from 1995 to 2018, China’s export total effect was 42.93 Mt, ranking the highest among the five countries, with the scale effect contributing 278.91%. India had the fastest growth, with a total effect of 2.56 Mt, and the structural effect contributed 41.45%. Russia’s total effect increased from 0.12 Mt from 1995 to 2003 to 2.11 Mt from 2011 to 2018, driven by energy strategy adjustments.
For import total effects, from 1995 to 2018, India had the largest total effect, contributing 33.12 Mt, predominantly driven by the scale effect (96.79%). China’s import total effect was 27.73 Mt, far exceeding other countries, with technological improvements (intensity effect) offsetting some of the growth (−74.15%). South Africa’s import total effect worsened from −2.72 Mt (1995–2003) to −6.95 Mt (2011–2018), primarily driven by structural effects (contribution rate of 98.36%).
3.3. Characteristics of the Distribution in Spatial Dimensions
This study employs the spatial LMDI model, using the average embodied carbon emissions in the import/export trade of the water transport industry in the BRICS countries from 1995 to 2018 as a benchmark. The model reveals the spatial heterogeneity characteristics of the scale, structure, intensity, and total effects. By comparing the differences between each influencing factor and the average level, the model facilitates direct comparisons between regions. A positive decomposition result indicates that the factor’s impact on carbon emissions is above the average, contributing to an increase in emissions. Conversely, a negative result suggests that the factor’s impact is below the average, leading to a suppression of carbon emissions.
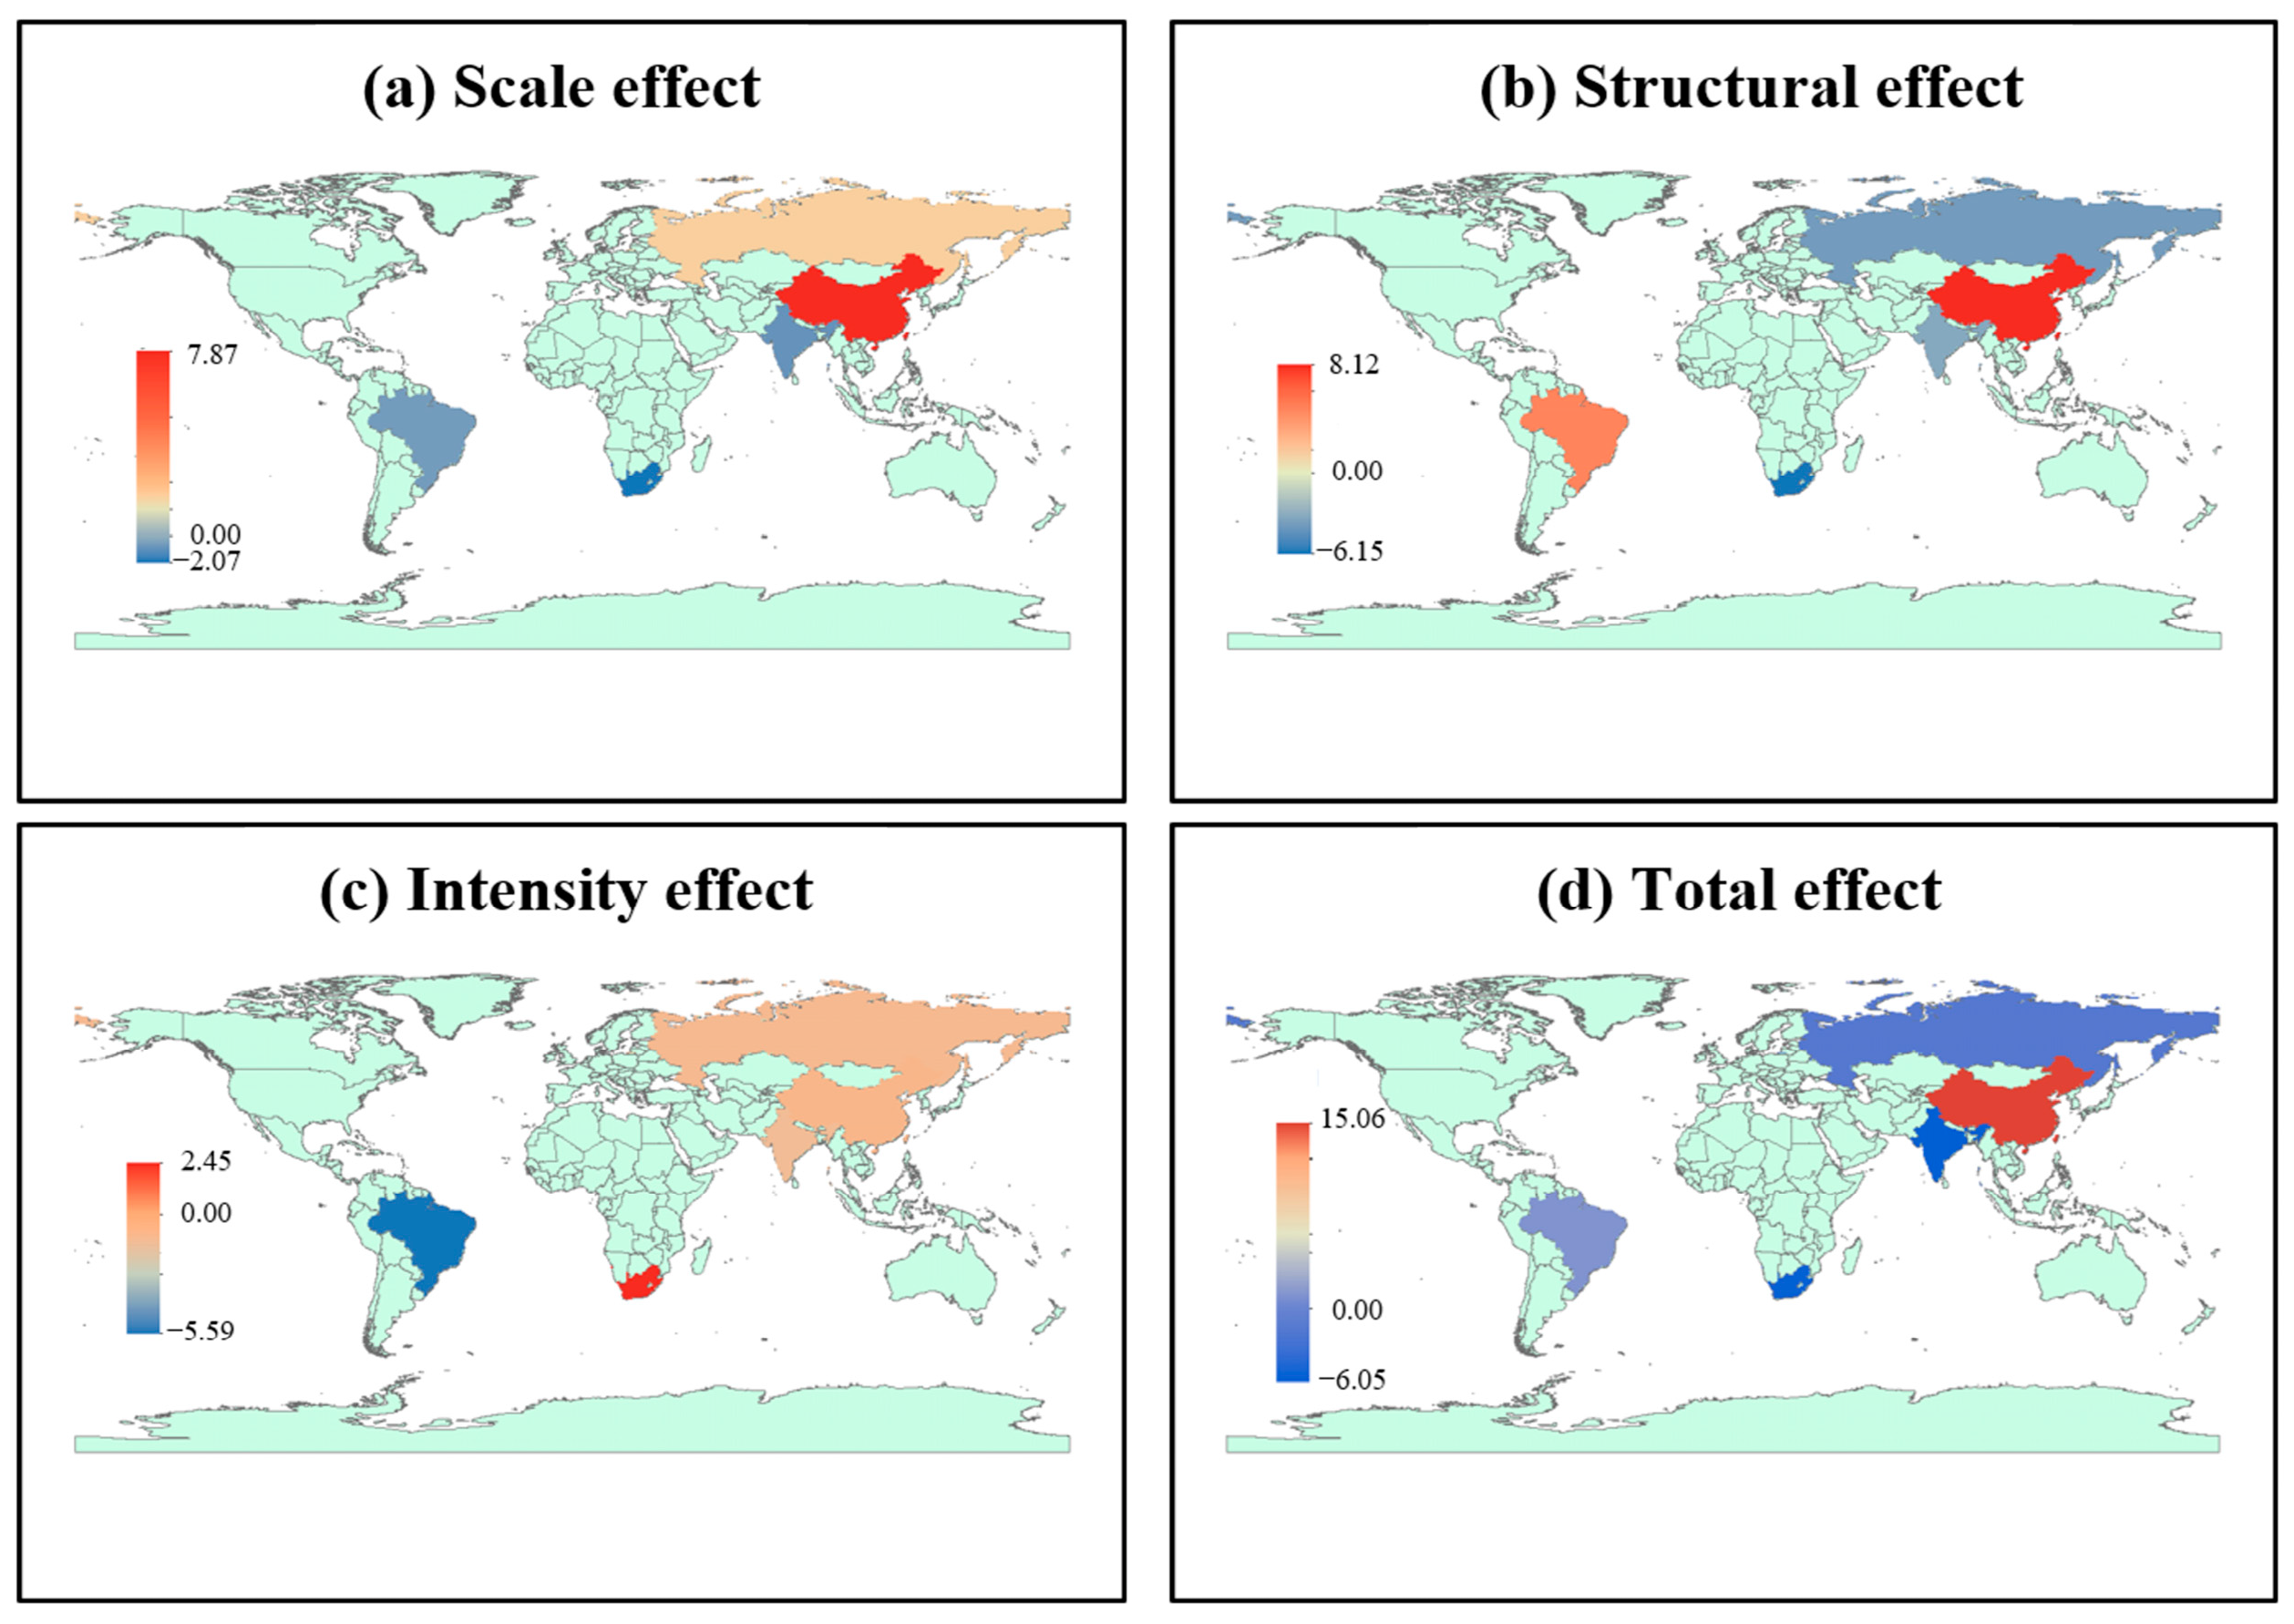
3.3.1. Spatial Dimension Analysis of Embodied Carbon in Export Trade
The spatial differentiation characteristics of export-related embodied carbon in the water transport trade of BRICS countries exhibit distinct country-specific differences (see
Figure 4 and
Figure 5).
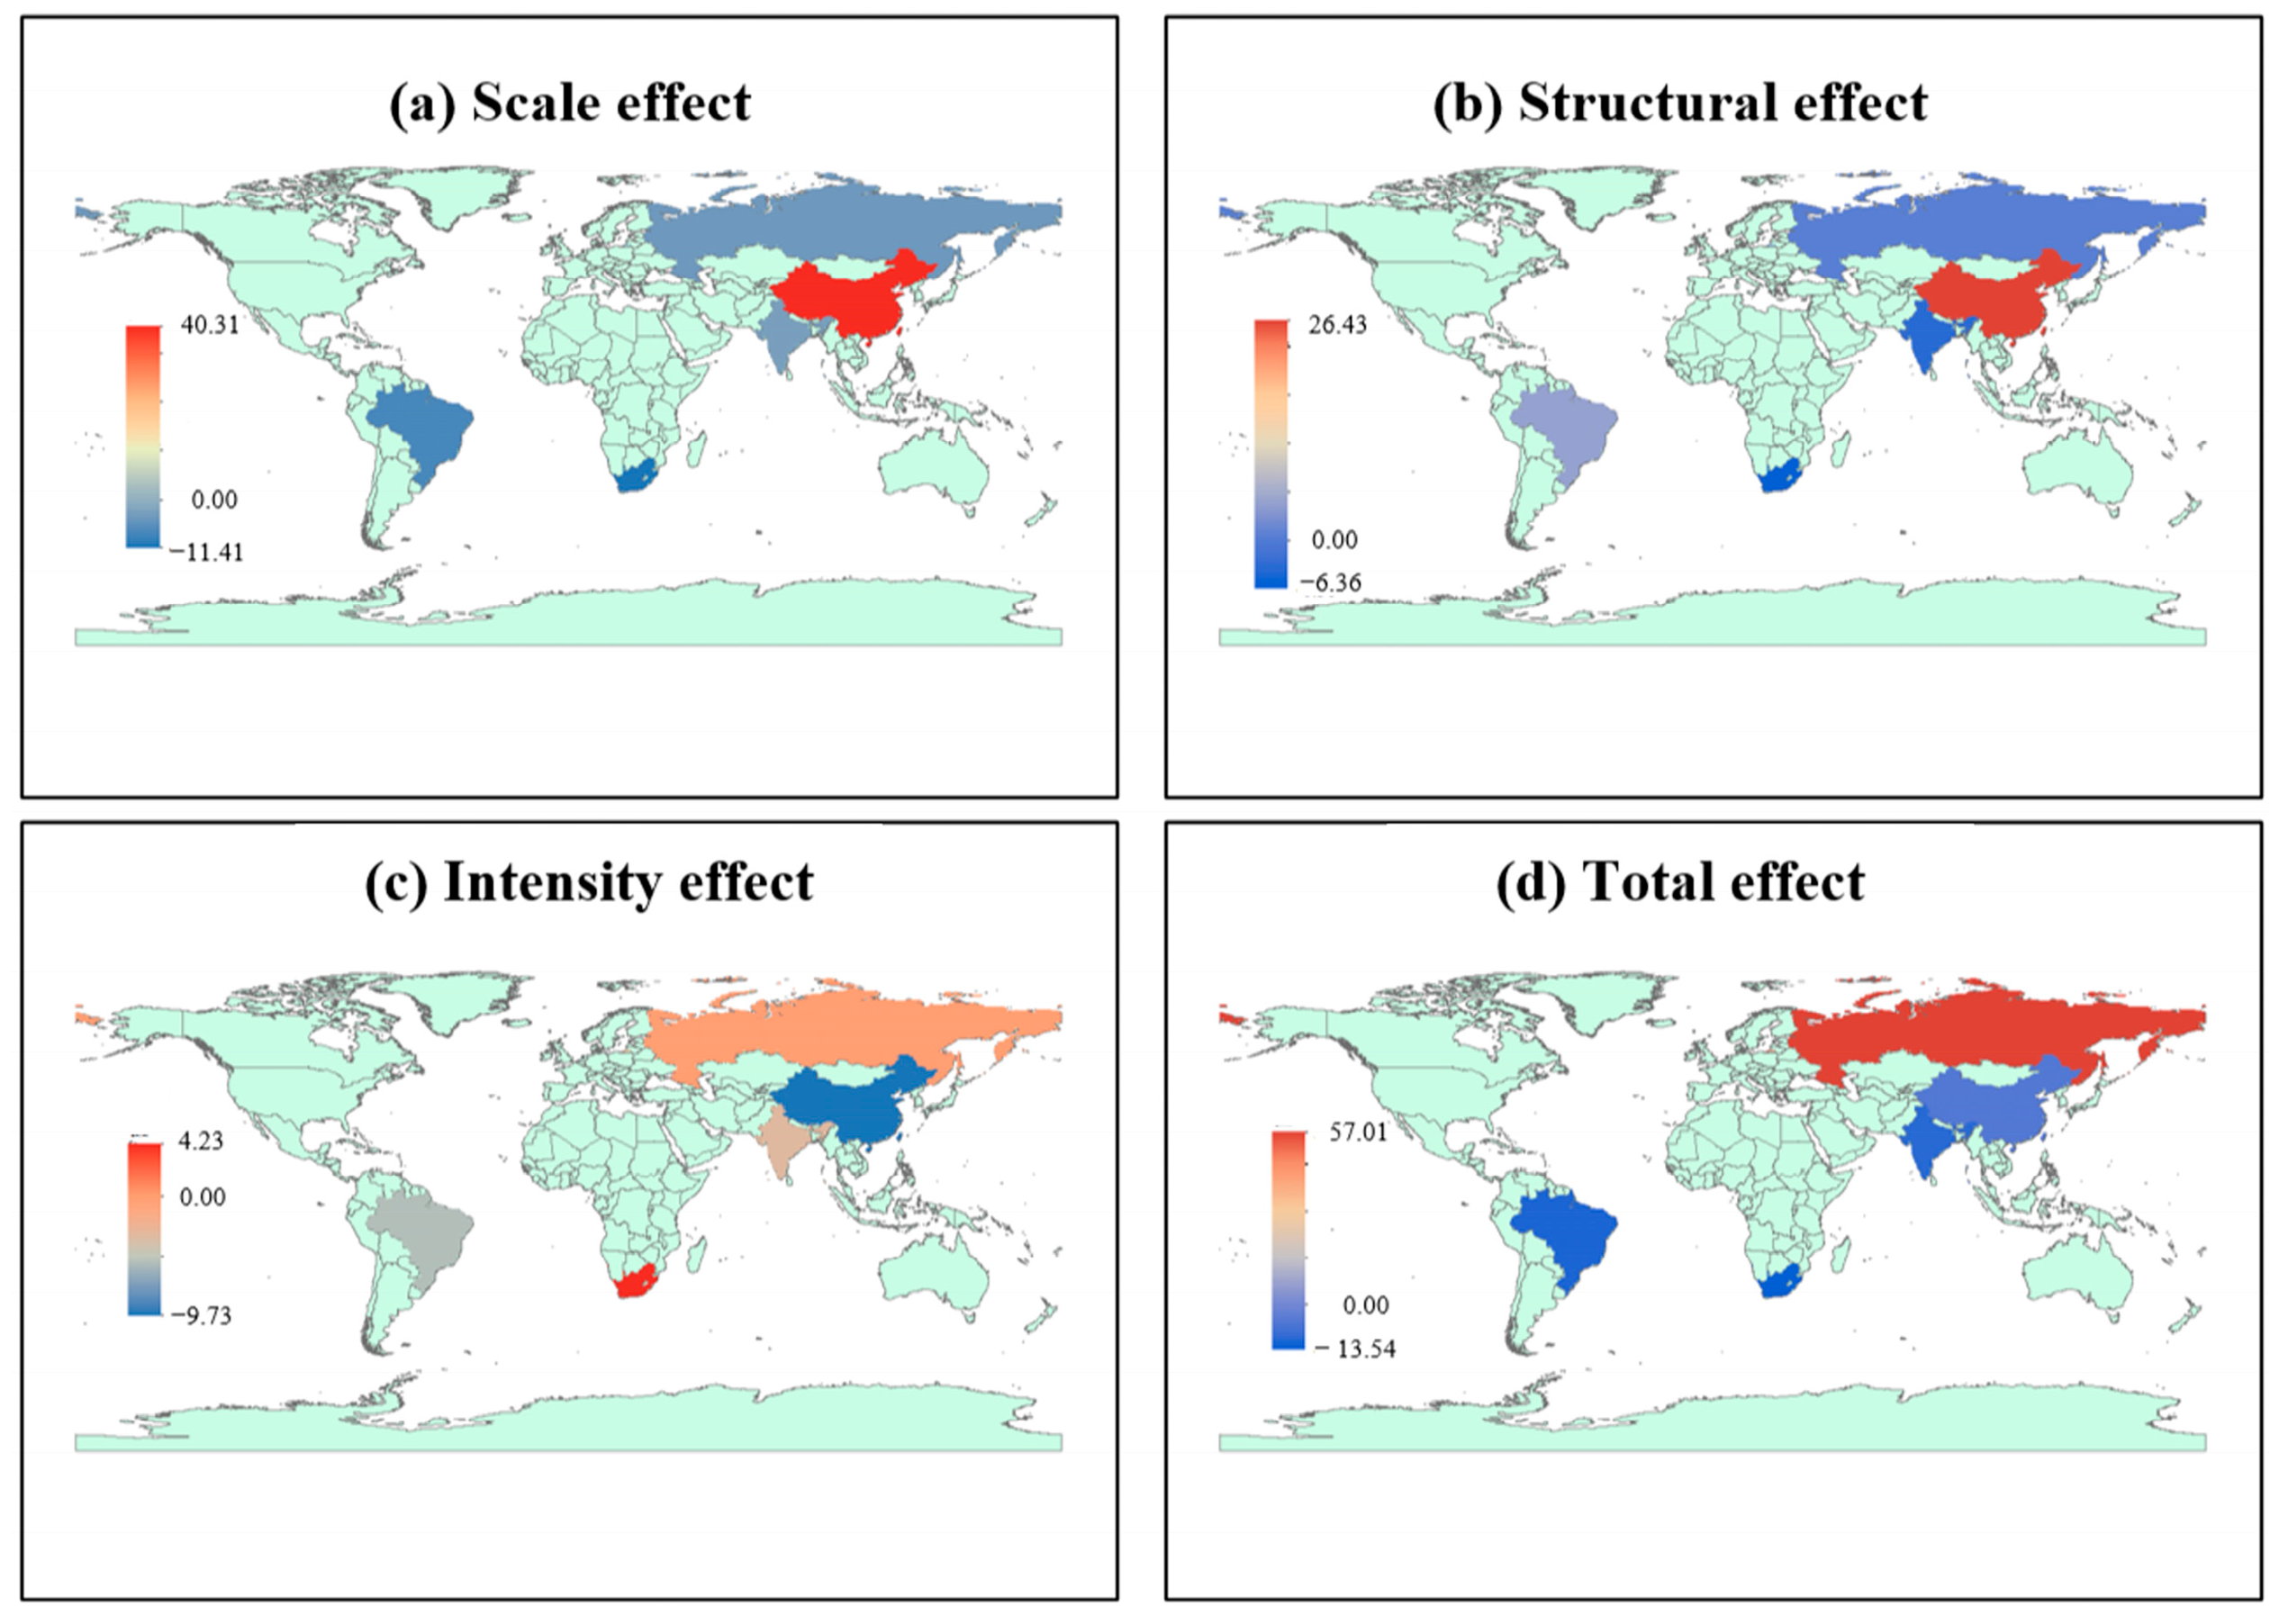
In terms of scale effects, the export scale effects of the BRICS countries significantly influence the spatial differences in embodied carbon emissions. China’s export scale effect contribution is the highest, increasing from 7.87 Mt in 1995 to 40.31 Mt in 2018, and peaking at 46.92 Mt in 2011, far exceeding the average level of the five countries. This indicates that the expansion of China’s trade volume plays a dominant role in the growth of embodied carbon emissions. The contributions of the other four countries are negative, indicating that their export scale effects are below the average level and have a suppressive effect on carbon emissions. Since 2003, due to international trade friction, China’s export growth has slowed, while the total trade volume of the other four countries has increased, reducing the spatial differences in scale effects.
Structural effects show obvious regional heterogeneity. China’s structural effect contribution remains positive, indicating that its structural effect has a greater impact than the average level, promoting carbon emissions. Brazil’s contribution sharply dropped to −0.18 Mt in 2011, but remained positive in other years, showing a decreasing trend. This suggests that Brazil’s structural effect, though above the average level, is gradually converging to the mean. The contributions of the other three countries are all negative, indicating that their structural effects are below the average, thus suppressing carbon emissions. Overall, before 2011, the structural effect differences between the countries expanded. However, in recent years, due to industrial adjustments and optimization, the contribution rates have declined, narrowing the spatial distribution gap between the countries.
The intensity effects reflect technological differences. South Africa’s spatial intensity effect contribution has always been positive, with a contribution of 4.23 Mt in 2018, indicating that its energy efficiency level is above the average of the five countries. The intensity effect contributions of Brazil, Russia, and India are all negative, suggesting that their energy efficiency improvements and environmental policies are less effective than the regional average. Before 2003, China’s intensity effect was below the average, but its contribution value of 1.93 Mt in 2003 exceeded the average level, reflecting that during this period, China’s water transport trade expanded at the cost of the environment. After 2011, China’s intensity effect turned negative, indicating that technological progress in China’s water transport industry effectively suppressed spatial embodied carbon emissions.
In terms of total effects, from 1995 to 2018, China’s export total effect was always positive and far exceeded the average of the five countries, with a contribution of 42.93 Mt. Russia and India had contribution values close to the mean, indicating the “high in the East, low in the West” spatial distribution of embodied carbon emissions in BRICS exports. From the perspective of changes, the export embodied carbon is gradually shifting towards Southeast Asia, and countries are narrowing the spatial distribution gap with average levels.
3.3.2. The Spatial Dimension Analysis of Embodied Carbon in Import Trade
The spatial differentiation characteristics of embodied carbon in the import trade of the BRICS countries exhibit significant asymmetry compared to export trade, with the driving mechanisms of the scale, structure, and intensity effects showing distinct country-specific heterogeneity (see
Figure 6 and
Figure 7).
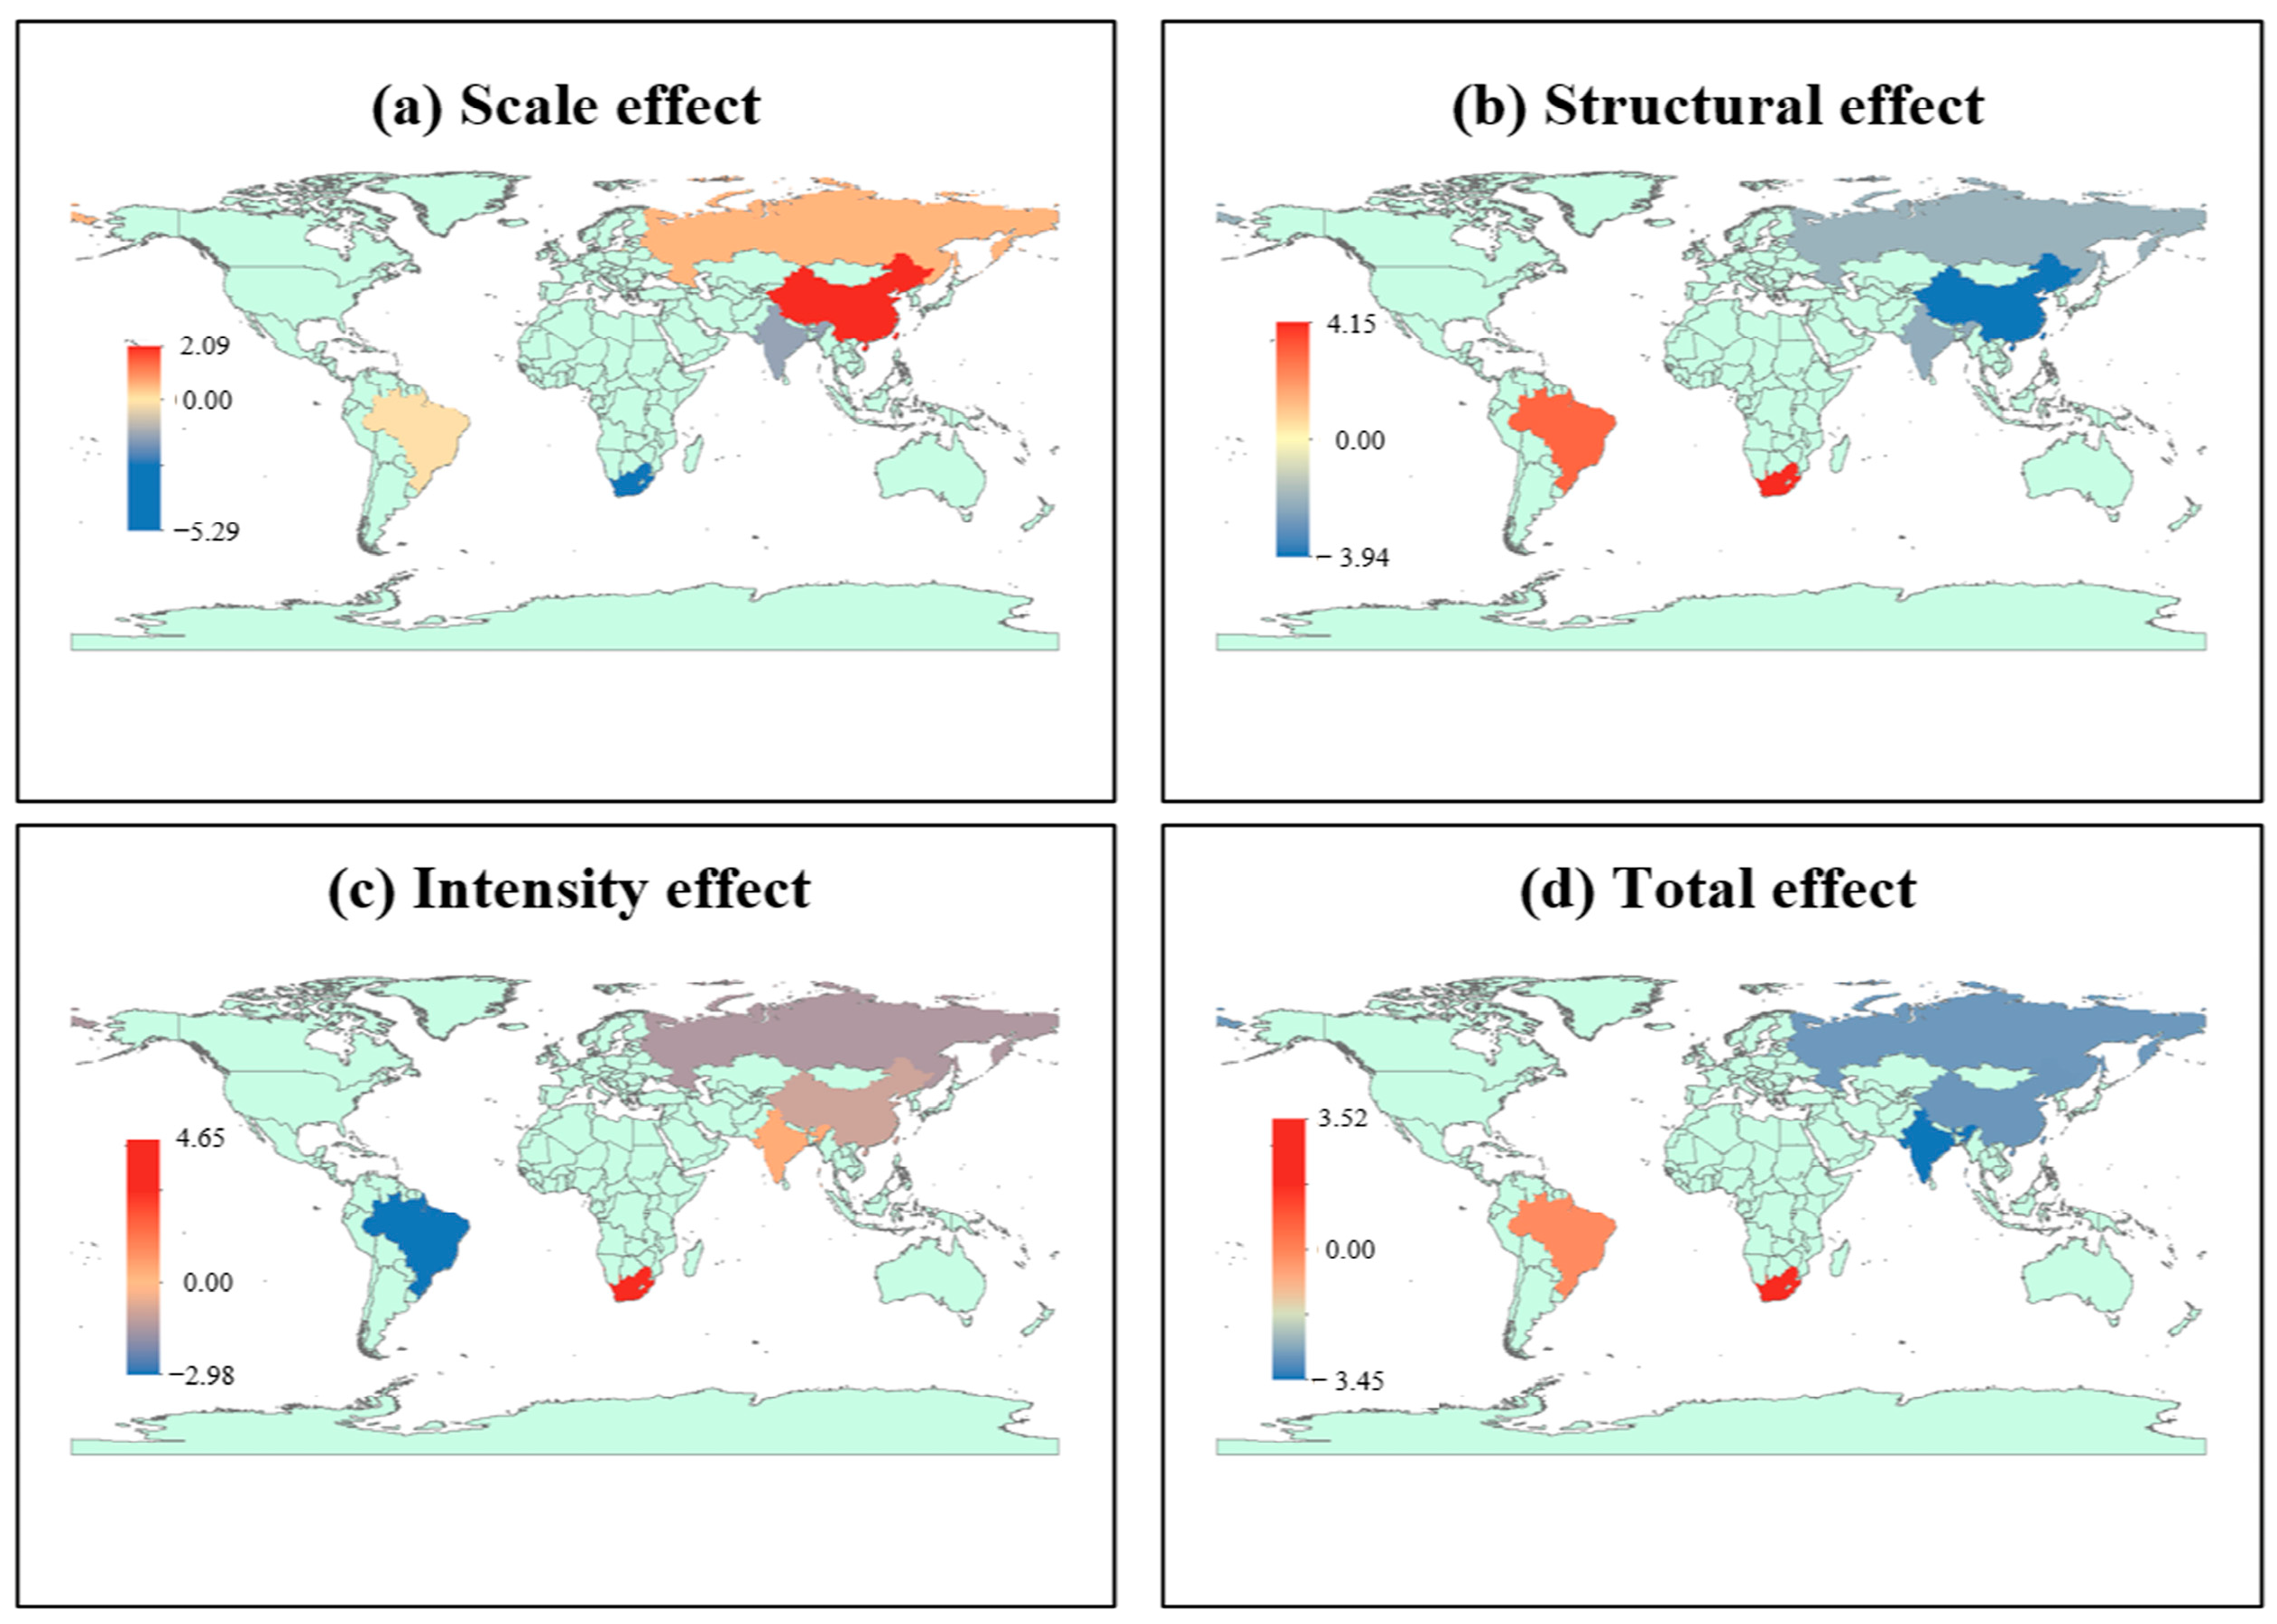
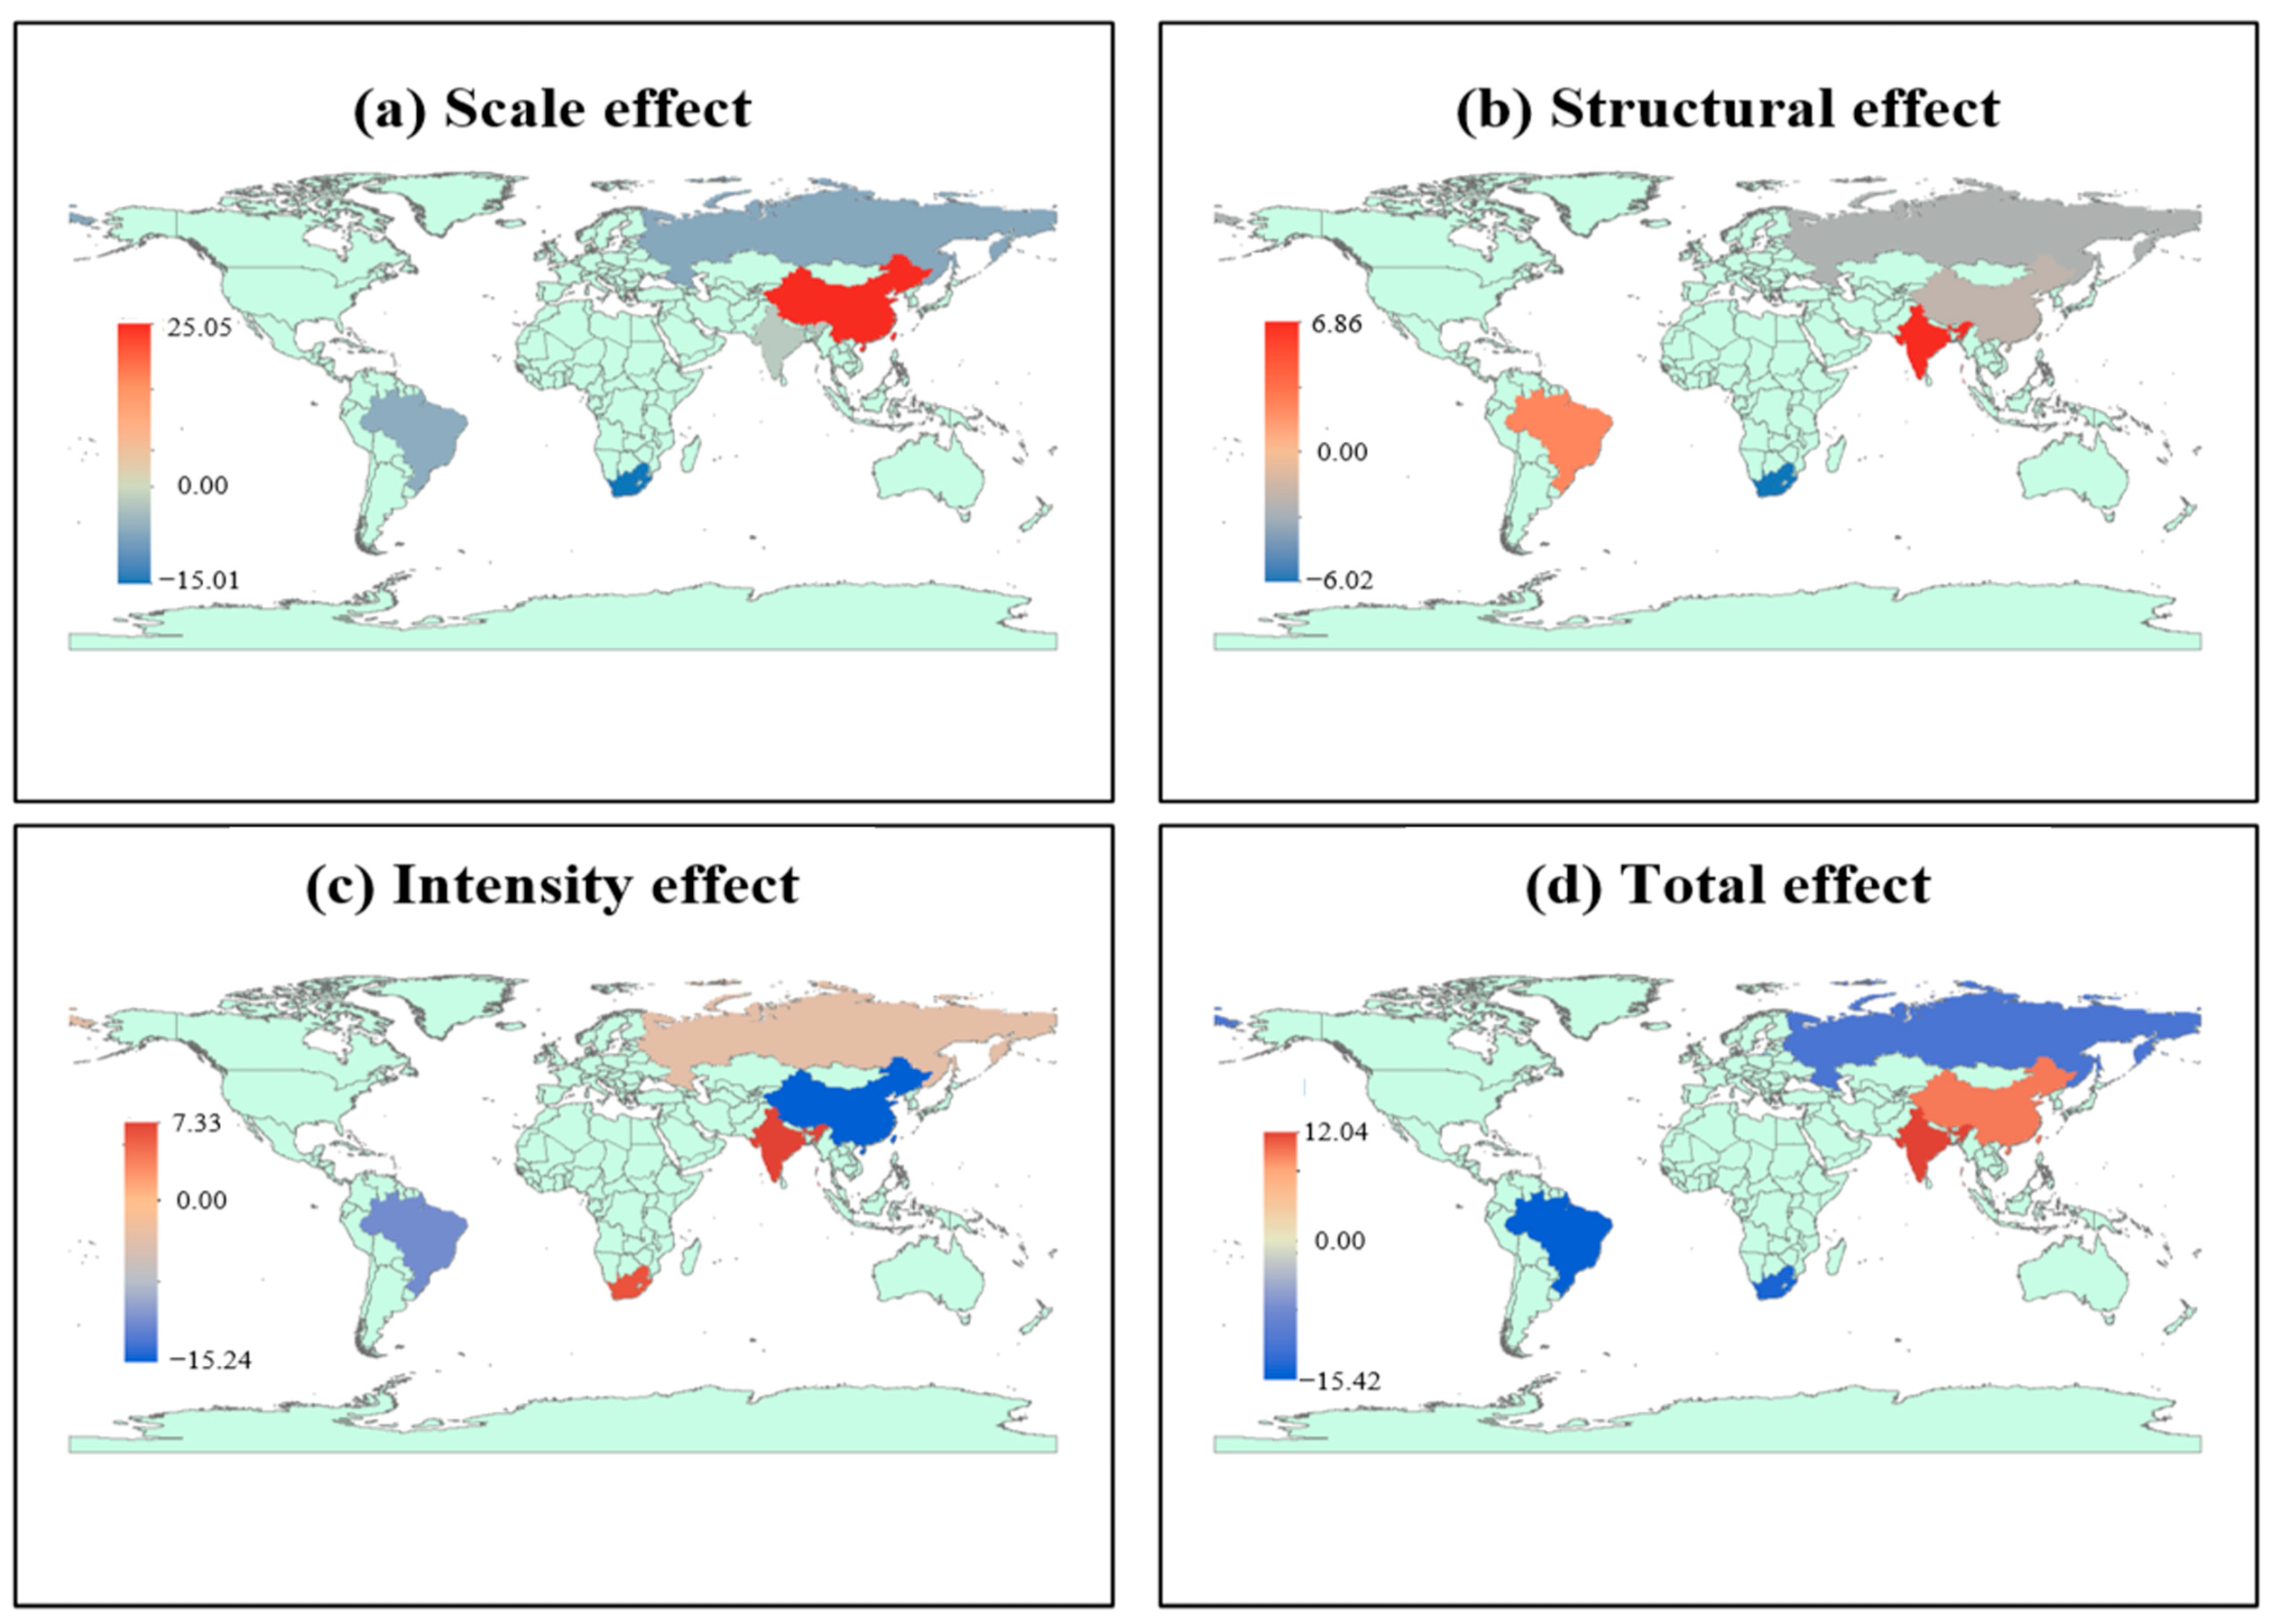
In terms of import scale effects, the spatial distribution of the countries is similar to that of export trade. China’s import scale effect contribution steadily increased from 2.09 Mt in 1995 to 25.05 Mt in 2018; although its growth rate was slower than exports, it still shows significant growth. The import scale effect contributions of the other four countries remained negative, suppressing the spatial emissions of embodied carbon in water transport trade. Over time, the gap between each country’s scale effect and the average level has widened, indicating that the spatial distribution differences in the embodied carbon emissions from import trade in water transport have increased.
Import structural effects exhibited significant fluctuations. Brazil’s import structural effect contribution decreased from 2.97 Mt in 1995 to 2.70 Mt in 2018, but it remained above the average level, indicating that Brazil’s water transport industry’s structural effect promoted carbon emissions. South Africa’s contribution turned negative in 2018 (−6.02 Mt), and this value was much lower than the average level of the five countries, further widening the gap with the mean. India, in contrast, had a positive contribution in 2018 (6.86 Mt), indicating that its import structural effect promoted carbon emissions. China and Russia’s import structural effects remained negative, and their gap with the average level gradually shrank. Meanwhile, Brazil, India, and South Africa showed increasing gaps, demonstrating that different import trade structures either promoted or suppressed the embodied carbon emissions in water transport trade.
In terms of import intensity effects, South Africa’s contributions were high and consistently positive. Brazil and Russia’s contributions were negative, suggesting their impact was lower than the average level. Both India and China experienced sudden changes in their intensity effect contribution rates in 2003. However, the trends were opposite: China shifted from promoting carbon emissions growth to suppressing it, indicating that technological advancements in China’s import trade and increased environmental awareness effectively suppressed spatial embodied carbon emissions.
Throughout the study period, the total effects of each country showed a “dual-core drive” pattern. Brazil, Russia, and South Africa had total effects below the average level of the five countries, while China and India had total effects above the average level, promoting carbon emission growth. India’s growth continued to rise, while China’s growth showed a slight decline. In terms of spatial distribution changes, the embodied carbon from import trade is gradually shifting towards Southeast Asia, with all countries, except India, striving to reduce embodied carbon emissions from water transport export trade.


