Article

Influence Mechanism of Spatial Variability of Permeability Coefficient on Seepage Characteristics of High Core Rockfill Dams: Insights from Numerical Simulations

1
School of Environment and Safety Engineering, North University of China, Taiyuan 030051, China
2
State Laboratory of Hydraulic and Mountain River Engineering, College of Water Resources & Hydropower, Sichuan University, Chengdu 610065, China
3
College of Water Conservancy Science and Engineering, Taiyuan University of Technology, Taiyuan 030024, China
*
Author to whom correspondence should be addressed.
Water 2025, 17(7), 1064; https://doi.org/10.3390/w17071064
Submission received: 28 February 2025 / Revised: 27 March 2025 / Accepted: 1 April 2025 / Published: 3 April 2025

Abstract

:
The spatial variability of permeability coefficients in multi-component materials poses significant challenges for the seepage safety of high core rockfill dams. This study systematically investigates the influence mechanism of the spatial variability of permeability coefficients on seepage characteristics through a stochastic framework combining random field simulation, non-intrusive finite element analysis, and multi-scheme numerical experiments. Based on the measured data and statistical analysis, random fields of permeability coefficients are constructed, and eight computational schemes are designed to analyze the differential impacts of spatial variability in zones of the core wall, cut-off wall, rockfill, overburden, and curtain. The results show that the spatial variability of permeability coefficients in the rockfill, overburden, and curtain materials has a negligible effect on the seepage behavior, with the coefficient of variation of the hydraulic gradient at feature points remaining below 0.04. In contrast, the spatial variability of permeability in the core wall and cut-off walls significantly affects the seepage characteristics. Specifically, the hydraulic gradient in the core wall increases by an average of 4.8%, with a maximum increase of 34%, and the coefficient of variation of the hydraulic gradient at feature points ranges from 0.15 to 0.18. The maximum hydraulic gradient at the release point of the core wall rises from 1.67 to 1.75 when the spatial variability is considered. Additionally, the spatial variability of permeability in the core wall leads to greater discreteness in the hydraulic gradient of the cut-off walls, weakening the coordinated anti-seepage effect between the main and secondary cut-off walls. The statistical analysis reveals that the hydraulic gradient at feature points follows a normal distribution. Furthermore, when the coefficient of variation of the core wall permeability increases from 1.46 to 2.03, the maximum hydraulic gradient at key points rises from 2.0 to 2.3. These findings highlight the necessity for the strict quality control of permeability parameters in core wall and cut-off wall materials to ensure the long-term seepage safety of high core rockfill dams.

1. Introduction

China ranks first in the world in terms of the number of constructed high earth dams. Particularly over the past 20 years, the number of high earth dams with a height of 100 m or more in operation has rapidly increased, exceeding 100. These high dams have become key regulatory hubs for basin-wide water control and storage within the national water network infrastructure, generating significant economic, social, and ecological benefits. However, during the long-term operation of earth dams, seepage problems have always been one of the core factors affecting the safety and stability of dams [1,2,3,4]. If seepage is not effectively controlled, it may cause an increase in pore water pressure inside the dam body, leading to a decrease in the strength of the dam material, and even possible seepage damage such as piping and soil flow, posing a serious threat to the safety of residents’ lives and property downstream of the dam. For instance, when the Teton Dam in the United States [5,6] was first filled with water on 5 June 1976, there was seepage downstream of the dam toe firstly, followed by seepage on the downstream surface of the dam body, which washed away the stone slope protection material on the dam surface. At the point when flowing water became audible, the area gradually expanded, and, finally, the dam collapsed (as shown in Figure 1), resulting in 11 deaths and economic losses of up to USD 2 billion.
The parameters of soil in earth dams exhibit spatial variability, driven by multiple factors. These include variations in dam fill material sources, differences in construction techniques, stress and seepage conditions across different sections of the dam, and long-term physical and chemical changes that modify the soil structure over time. The spatial variability of material parameters in earth dams has been widely studied by researchers around the world [7,8,9]. Guo et al. [10] investigated the influence of the spatial variability of the internal friction angle and cohesion on the earth dam slope stability reliability of earth dams using the Karhunen–Loève series expansion method and found that neglecting the spatial variability of these parameters would lead to an overestimation of the probability of slope failure. Li et al. [11] proposed a finite element method—Bayesian kriging for estimating the deformation field of earth dams based on the random field theory. Ran et al. [12] developed a hybrid stochastic finite element model to analyze deformation in rockfill dams, incorporating the spatial variability of rockfill mechanical parameters, which significantly enhances the prediction accuracy and effectiveness. In addition, some researchers have also studied random field modeling method through site data [13,14,15,16,17], providing reliable basic data for studying the impact of parameter randomness on the structural behavior of dams.
The permeability coefficient, as a core parameter that characterizes the permeability characteristics of soil in the earth dam–foundation system, has a significant impact on the distribution of the seepage field, the position of the seepage line, the seepage flow rate, and the seepage failure mode of the earth dams. Mouyeaux et al. [18] evaluated the spatial variability of the pore water pressure field in the earth dam considering the spatial variability of the permeability of the materials based on field data. Tan et al. [19] used the midpoint method to simulate the random field of seepage parameters of a homogeneous earth dam and studied the influence of parameter spatial variability on the seepage characteristics of the dam. Xu et al. [20] proposed a random seepage safety assessment method considering the spatial variability of hydraulic parameters and concluded that the hydraulic conductivity of the core wall has the greatest influence on the seepage safety of the dam. Chi et al. [21] discussed the influence of the type of random fields on the seepage properties and found that the spatial variability of hydraulic parameters caused by different random fields has a significant impact on flow velocity. In summary, many current studies focus on the random field modeling method of the permeability coefficient and the influence of the spatial variability of the permeability coefficient on the permeability characteristics of earth dams. As a whole, homogeneous dam bodies are adopted in current research; however, the anti-seepage system of high core rockfill dams is complex, including anti-seepage structures such as the core wall, the cut-off walls, and the curtain, which are included in multi-level anti-seepage systems [22,23,24,25]. Although these anti-seepage structures mitigate leakage by reducing the permeability or blocking seepage paths, their working principles and mechanisms vary [26]. Moreover, the spatial variability of permeability coefficients affects different anti-seepage structures to varying degrees. Therefore, a comprehensive and systematic evaluation of how this spatial variability influences dam seepage characteristics is crucial for enhancing the collaborative efficiency of the anti-seepage system and ensuring the overall seepage safety of dams.
This paper aims to study the influence mechanism of the spatial variability of permeability coefficient on the seepage characteristics of high core rockfill dams. To achieve this, different realizations of permeability coefficient random fields for different anti-seepage structures are considered. The objectives of the current research are to (a) investigate the random field simulation techniques for the spatial variability of the permeability coefficient; (b) estimate the autocorrelation distance based on the field data; (c) study the influence mechanism of the spatial variability of the permeability coefficient in different material zones of high core rockfill dams on the seepage characteristics of the dam–foundation system through a multi-scheme seepage simulation of the spatial variability of the permeability coefficient of multi-component materials in the dam–foundation system.

2. Methodology

2.1. Random Field Simulation Techniques for the Spatial Variability of Permeability Coefficient

In the theory of random fields, the random field K x , y of material parameters can be assumed to be composed of a smoothly varying trend function τ ( x , y ) and a fluctuation component χ ( x , y ) [27], as expressed in Equation (1). Therefore, based on the probability distribution and autocorrelation function of the soil permeability coefficient, a spatially correlated random field for the permeability coefficient can be constructed.
K x , y = τ ( x , y ) + χ ( x , y )
where x and y are the coordinates.
Currently, the main methods for discretizing random fields include the midpoint method, integration point method, shape function method, local averaging method, and Karhunen–Loève (K-L) series expansion method [28,29,30]. The midpoint method uses the material parameters at the center of each element to represent the material parameters of the entire element. This method is simple and convenient for constructing the spatial correlation coefficient matrix of material parameters, and thus has been widely applied [28,31].
In the finite element simulation of seepage in rockfill dams, an exponential-type autocorrelation function can be used to establish the spatial correlation between different locations within the solution domain. The correlation ρ i , j between material parameters of any two elements in the dam body can be expressed as follows [32,33]:
ρ i , j = exp ( x i x j δ h + y i y j δ v )
where x i , y i and x j , y j are the central coordinates of elements i and j, respectively; δ h and δ v are the autocorrelation distances in the horizontal and vertical directions for the permeability coefficient.
Based on Equation (2), the overall correlation coefficient matrix for the discrete random field can be obtained, as shown in Equation (3):
ρ n × n = ρ 11 ρ 12 ρ 1 n ρ 21 ρ 22 ρ 2 n ρ n 1 ρ n 2 ρ n n
For sampling correlated random variables, the orthogonal transformation method is commonly used to convert correlated random variables into independent ones. One widely used orthogonal transformation method is the Cholesky decomposition method [34,35], which can be employed to obtain the upper triangular matrix of the correlation coefficient matrix B n × n . Through linear transformation, a sample matrix D n of the n-dimensional correlated standard normal distribution random variables can be generated, that is,
D n = A n B n × n
where A n represents a sequence of standard normal distribution random variables, which is generated based on n independent standard normal random numbers.
The permeability properties of different materials in rockfill dam and foundation systems vary significantly, and their statistical distribution forms are also different. For the normally distributed correlated random fields, the samples can be directly obtained from the standard normal distribution sample matrix generated using Equation (4). For non-normal distributions such as log-normal and Weibull distributions, the samples of the correlated random fields can be obtained through the following mapping procedure [36]:
D = F 1 Φ D n
where F 1 · is the inverse function of the non-normal cumulative distribution function; Φ · is the cumulative distribution function of the standard normal distribution.
The technique process of the method above is shown in Figure 2.

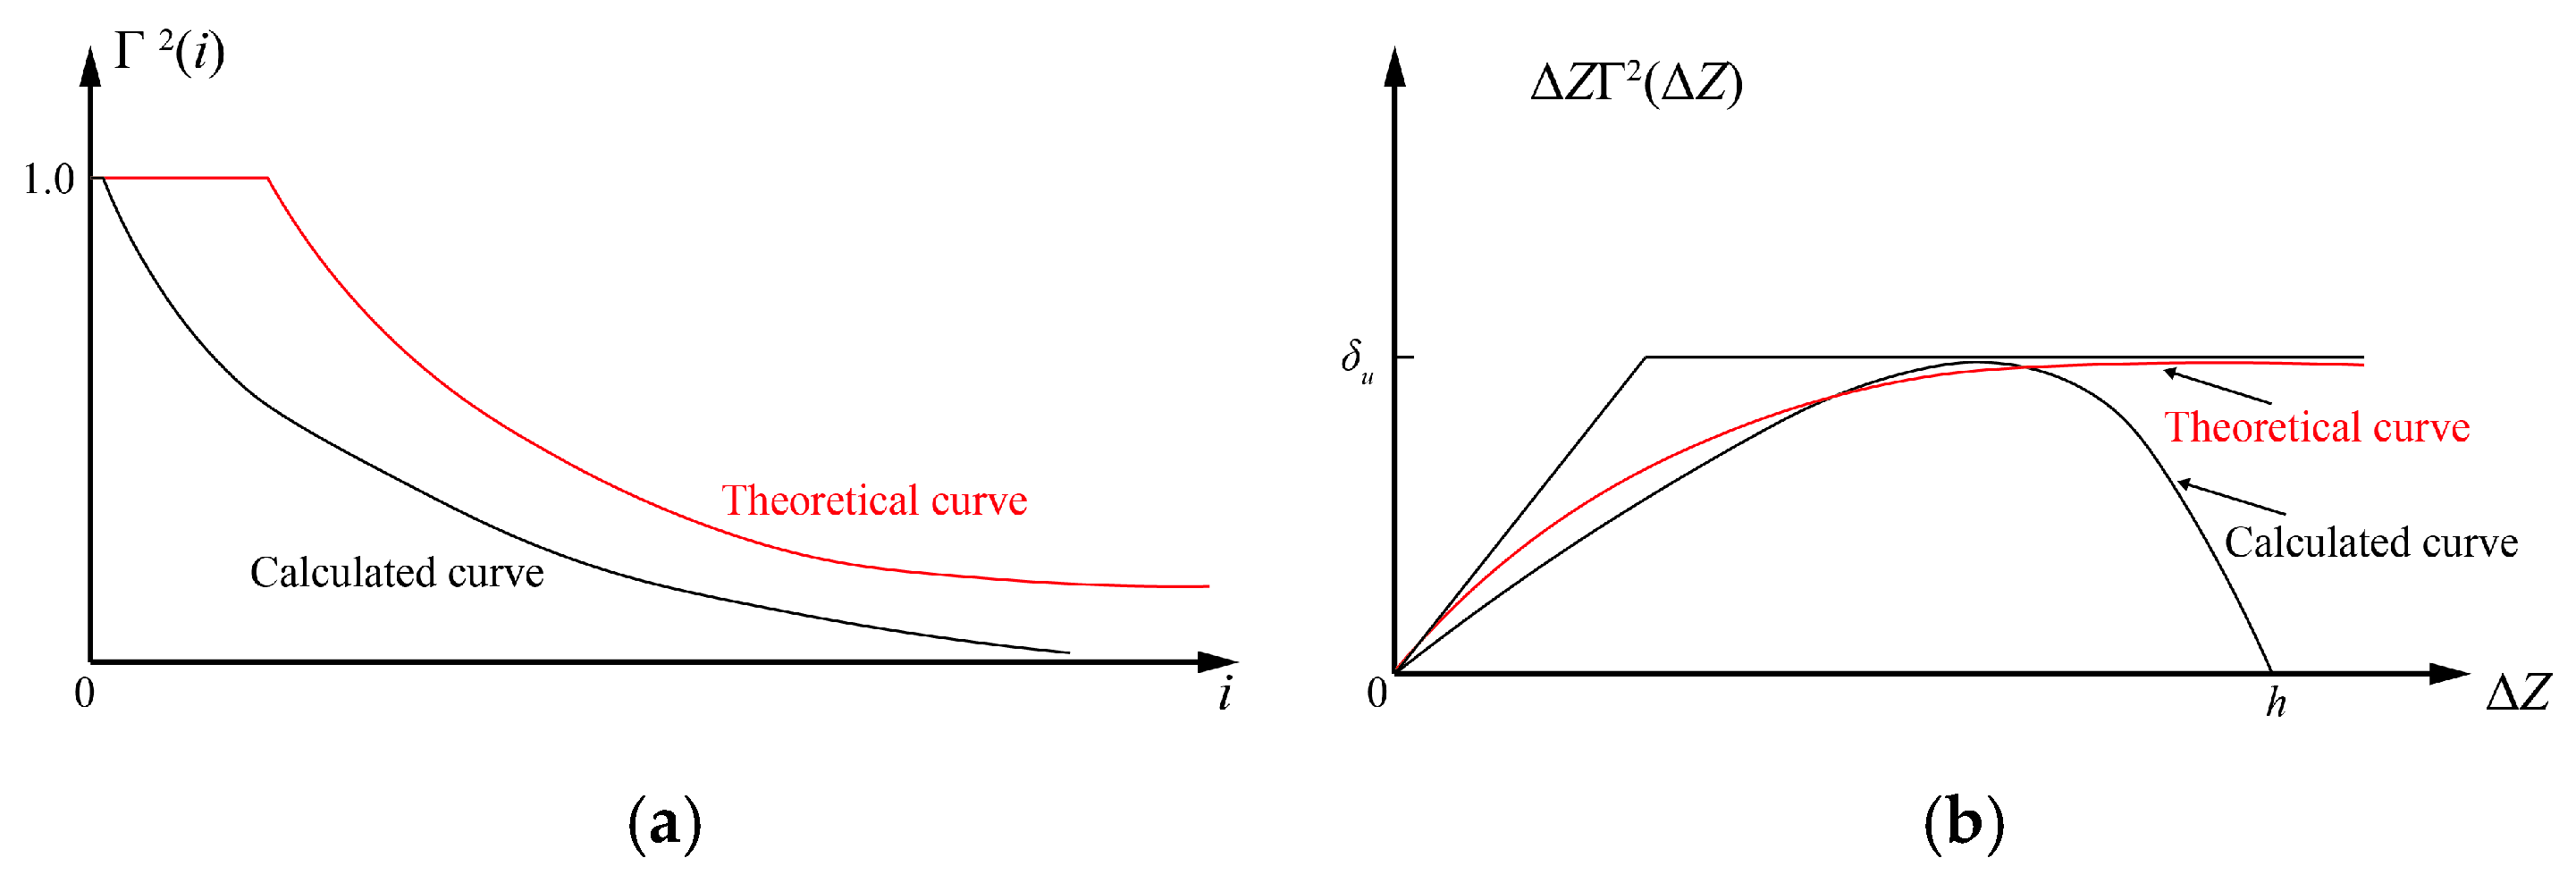
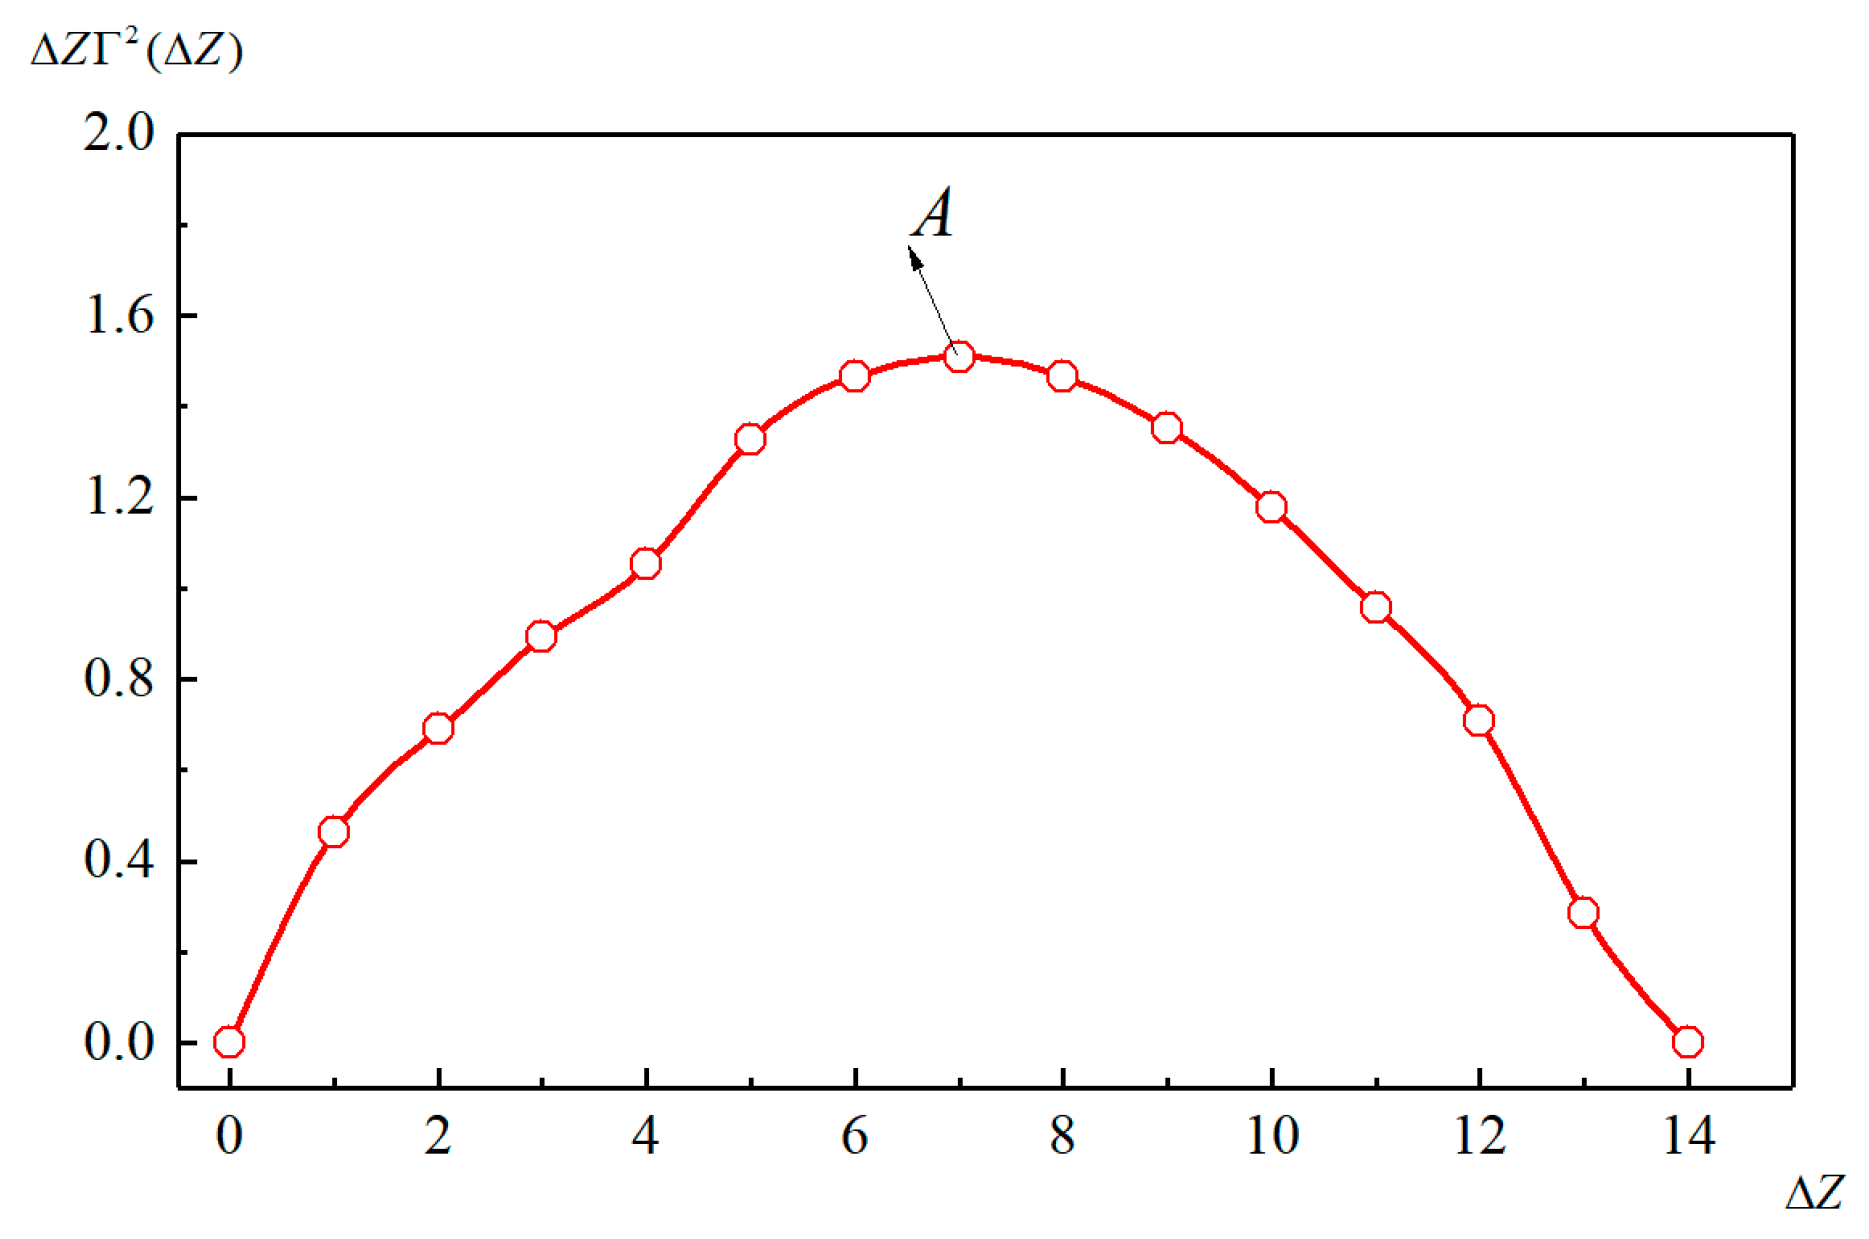
2.2. Estimation Method for Autocorrelation Distance

The commonly used estimation methods for autocorrelation distance include the expeditive method, the spatial average method, the fitting theoretical variance reduction function (VRF) method, fitting simplified VRF method. Since Vanmarcke [37] introduced the spatial average method, it has been widely adopted due to its straightforward concept, clear principles, and fewer constraining factors [38].
The spatial average method solves the autocorrelation distance δ u through the variance reduction coefficient Γ 2 ( Δ Z ) . According to the definition of the autocorrelation distance, when Δ Z is a multiple of the sampling interval Δ Z 0 , the autocorrelation distance expressed in terms of the sampling interval Δ Z 0 is given by
δ u = i Δ Z 0 Γ 2 ( i Δ Z 0 )
In this case, the calculation steps for δ u based on the spatial average method are as follows:
Step 1: Discretely select sample points u ( i ) at equal intervals in the depth direction or horizontal direction of the soil, and calculate the mean E [ u ( i ) ] and standard deviation σ .
Step 2: Set i = 2, and form a new dataset using the means of two adjacent sample points; then, calculate the mean and variance (named D ( 2 ) ) of this dataset.
Step 3: Calculate the variance reduction coefficient: Γ 2 ( 2 ) = D ( 2 ) / σ 2 .
Step 4: Draw the variance reduction coefficient on the figure of Γ 2 ( i ) ~ i .
Step 5: Set i = 3,4,5…, repeat Steps 2 to 4, and continuously update the figure of Γ 2 ( i ) ~ i .
Step 6: Find the stationary point i * in the figure of Γ 2 ( i ) ~ i ; then, calculate the autocorrelation distance δ u = i * Δ Z 0 Γ 2 ( i * Δ Z 0 ) based on the stationary point.
However, for the figure of Γ 2 ( i ) ~ i , the stationary point i * is very difficult to find, as shown in Figure 3a. In fact, as the spatial average range Δ Z becomes larger, the amount of data used for calculation decreases, and the credibility of information greatly decreases, so when the value of Δ Z is sufficient, the recursive product will approach zero, meaning that the curve of Δ Z Γ 2 ( Δ Z ) ~ Δ Z must have a descending branch (see the “Calculated curve” in Figure 3b). But only the ascending branch in the calculated curve is meaningful for solving the autocorrelation distance, so the highest point ( Δ Z Γ 2 ( Δ Z ) ) max of the curve Δ Z Γ 2 ( Δ Z ) ~ Δ Z is the autocorrelation distance, which can be achieved by drawing the curve of Δ Z Γ 2 ( Δ Z ) ~ Δ Z .

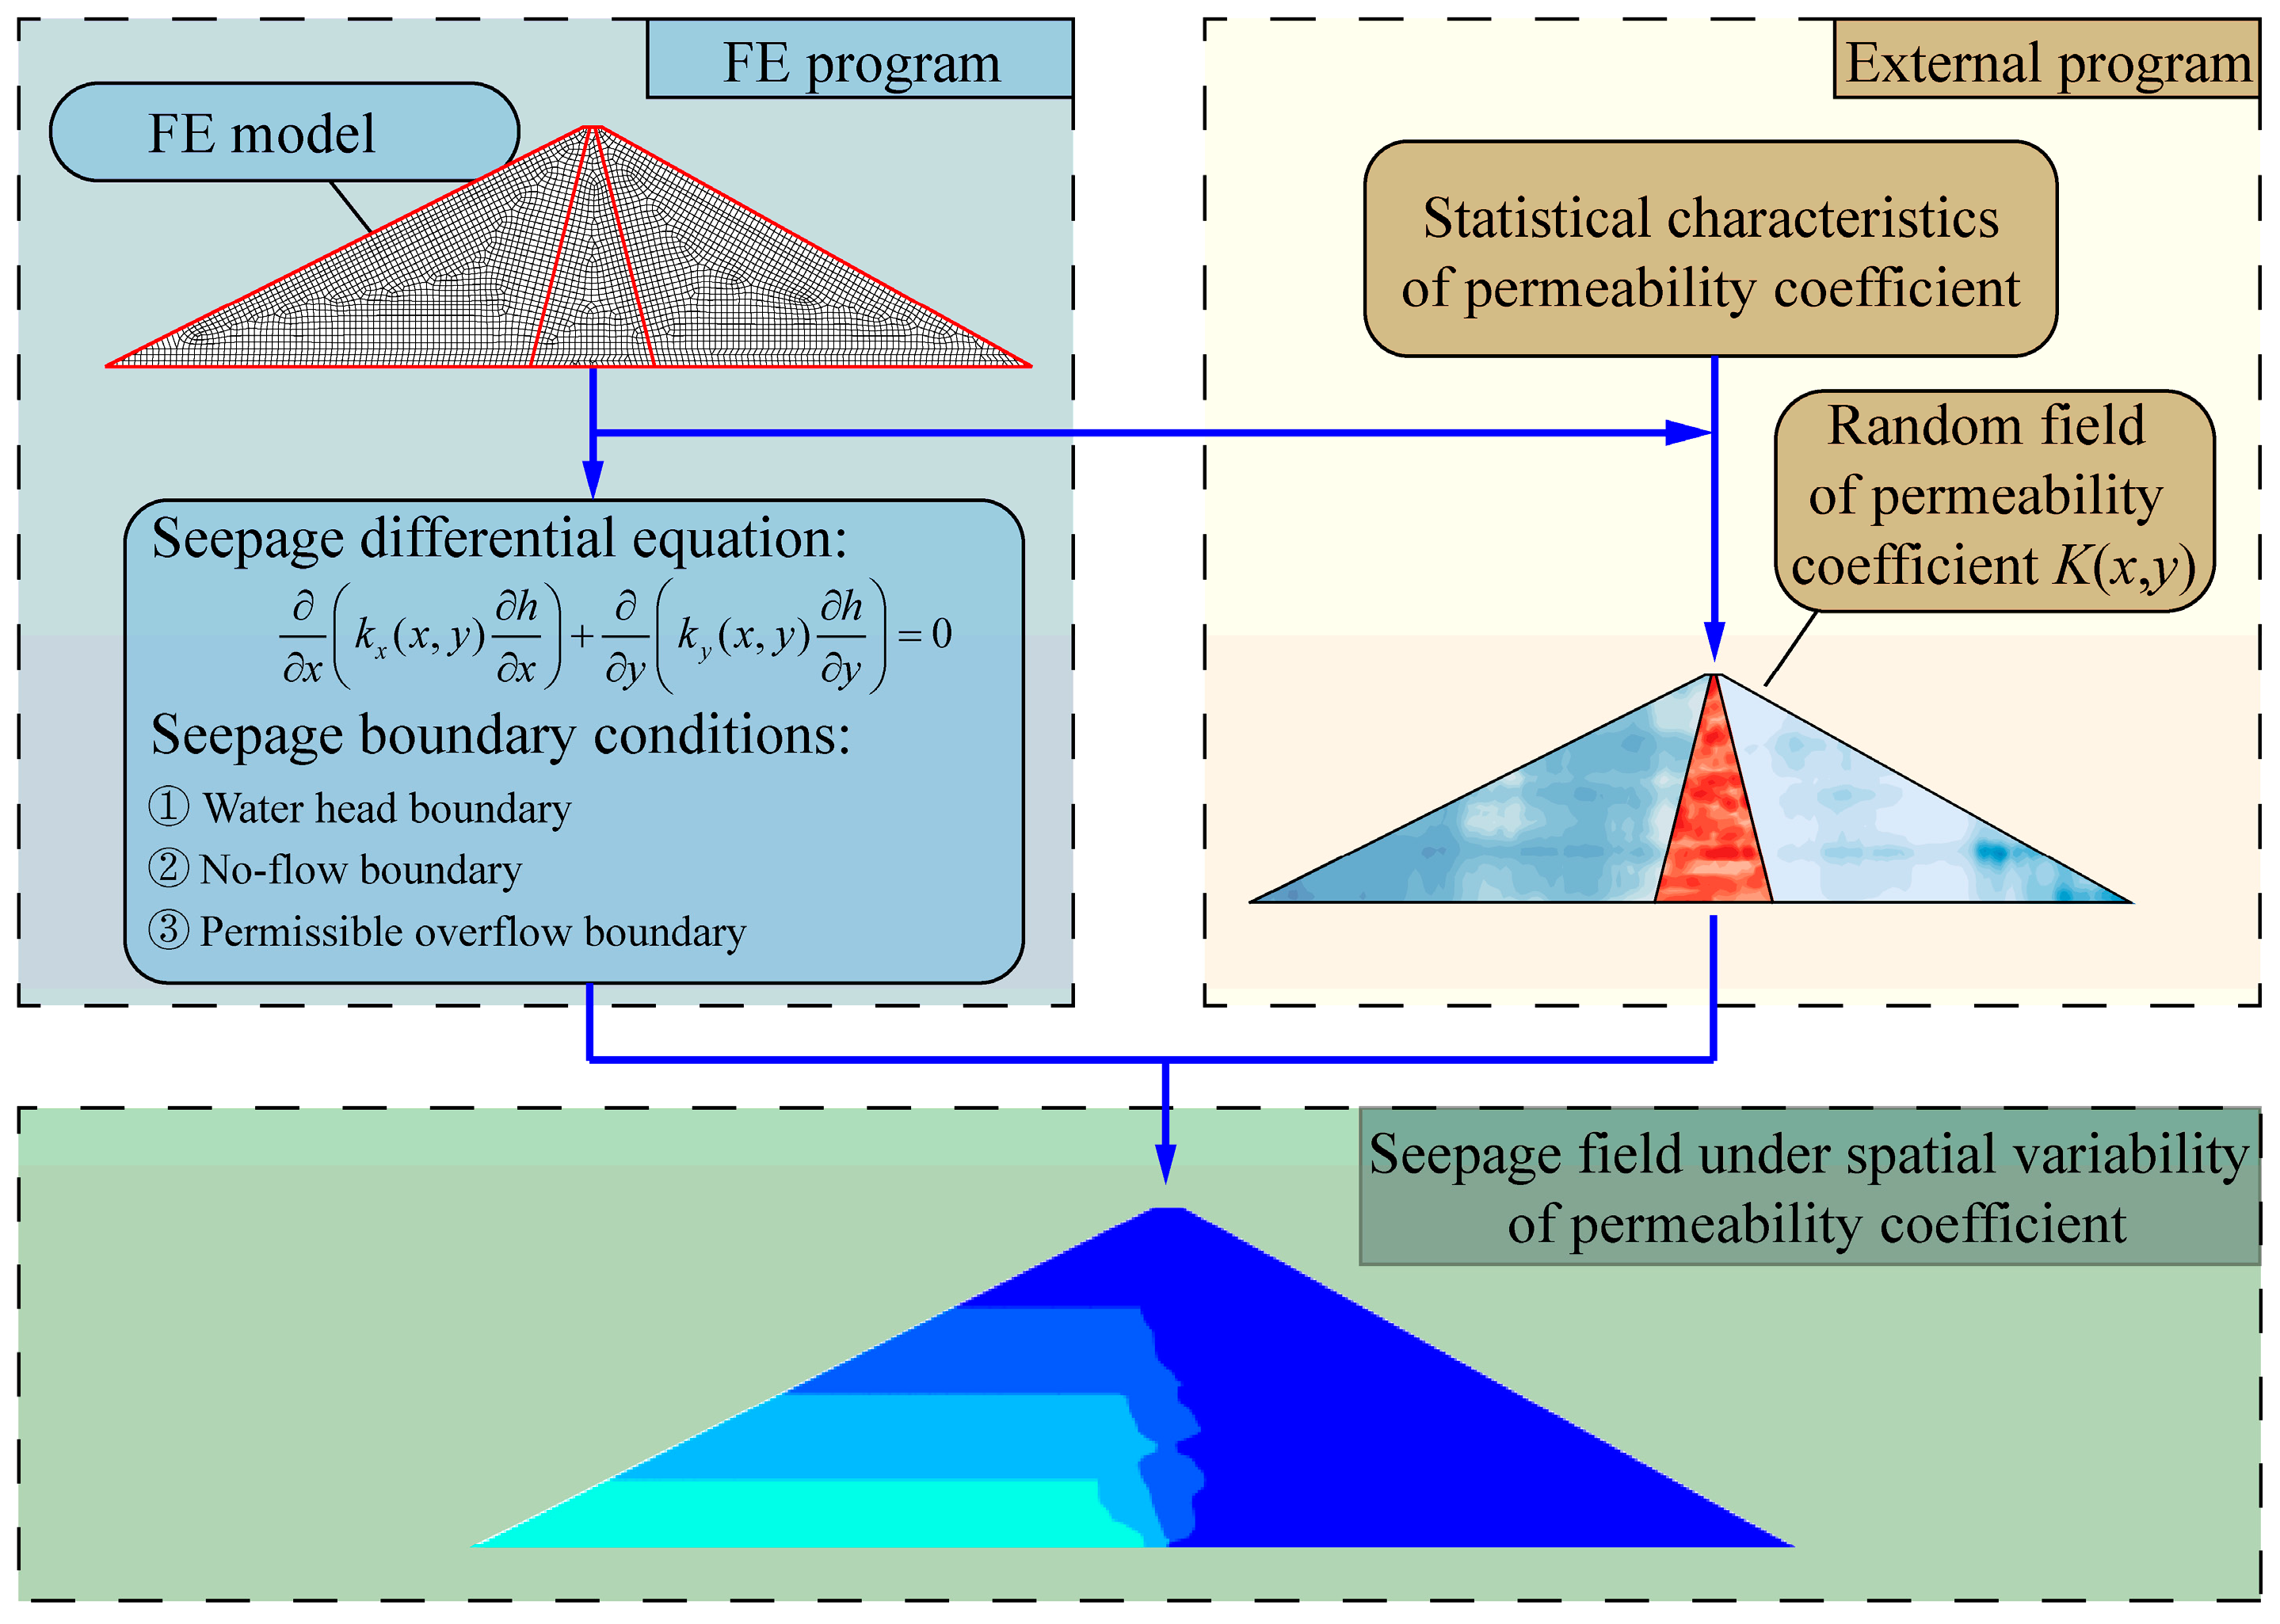
2.3. Seepage Numerical Simulation

In the finite element (FE) numerical simulation of stress, deformation, and seepage random fields in geomaterials, the non-intrusive random field simulation method has been widely applied in the analysis of spatial variability in geotechnical engineering. Its main advantage lies in it not requiring modification of finite element program codes, achieving organic integration between random fields and finite element programs through the invocation of random fields. This paper employs the non-intrusive finite element method to conduct seepage characteristic simulations for high core rockfill dams considering the spatial variability of permeability coefficients, with the main workflow illustrated in Figure 4.

3. Analysis and Results

3.1. Model and Parameters

3.1.1. Finite Element Model

Referring to high core rockfill dams, such as the Pubugou Dam and the Changheba Dam, a finite element generalized model is constructed for this study, as shown in Figure 5. The dam height is 200 m, with a water depth of 196 m in front of the dam, a crest width of 16 m, upstream and downstream slope ratios of 1:2.0 and 1:1.8, and a thickness of the overburden layer of 70 m, respectively. The anti-seepage system of this dam consists of the core wall, the main and secondary cut-off walls, and the curtain. The cut-off walls are embedded 1 m into the bedrock, with a depth of 71.0 m and a thickness of 1.2 m. The bottom of the cut-off walls connects to the curtain. The first curtain has a depth of 10 m, and the second curtain has a depth of 100 m. ABAQUS 6.14 [39,40] software was used to discretize the dam–foundation system with elements of 19,612 (Dam element number: 3292; foundation element number: 16320). The element size (4–5 m) is consistent with the commonly used dam seepage simulation element size, and the results of our simulation using similar models are consistent with the actual engineering monitoring data [22,24]. The boundary is set as follows: the water head boundary is the upstream and downstream water head, the no-flow boundary is the side and bottom surfaces of the foundation, and the permissible overflow boundary is the downstream rockfill boundary above the downstream water level.

3.1.2. Material Parameters

To investigate the autocorrelation distance of the permeability coefficient of dam construction materials in high core rockfill dams, this paper collects field test data on the permeability coefficient of the core wall of the Pubugou high core rockfill dam [41]. The field test involved in situ drilling to measure the permeability coefficient along the elevation on the central axis of the core wall at Sections 0 + 131 and 0 + 434 of the dam. The distribution of the permeability coefficient of the core wall along the elevation is illustrated in Figure 6.
Based on the field test data on the permeability coefficient and the spatial average method, the curve Δ Z Γ 2 ( Δ Z ) ~ Δ Z between the recursive product and the distance is shown in Figure 7. As seen in Figure 7, the distance ( Δ Z Γ 2 ( Δ Z ) ) max corresponding to the highest point A is the vertical autocorrelation distance of the permeability coefficient of the core wall, with a value of 1.5 m.
Due to layered sedimentation, the horizontal autocorrelation distance of the soil physical and mechanical parameters is usually greater than the vertical autocorrelation distance. The statistical analysis based on relevant studies [42,43] indicates that the horizontal autocorrelation distance of the parameters of undisturbed clay is approximately 10 to 35 times the vertical autocorrelation distance. The construction of high rockfill dams typically employs layered rolling and filling techniques, resulting in directional differences in the soil properties of dam materials. Due to the limited availability of experimental data on the horizontal permeability coefficient of the core wall, it is reasonable—by referring to similar statistical patterns—to assume that the horizontal autocorrelation distance is approximately 30 times the vertical autocorrelation distance.
The strength of the spatial correlation of material parameters is also related to the paving layer thickness, so the autocorrelation distance of the rockfill material can be determined by referring to the core wall material, that is, the vertical autocorrelation distance of the permeability coefficient of the core wall is about 1.5 m, which is 4–5 times the thickness of its paving layer (ranging from 0.3 to 0.4 m). The vertical autocorrelation distance of the permeability coefficient of the rockfill material can also be approximately 4–5 times the paving layer thickness, ranging from 0.8 to 1.0 m. The horizontal autocorrelation distance can be similarly determined [44].
Relevant studies [45,46] indicate that the vertical autocorrelation distance of the permeability coefficient for riverbed gravel and pebble materials typically ranges from 0.4 m to 4.1 m, while the horizontal and longitudinal autocorrelation distances can extend to tens of meters and even kilometers, respectively. Based on this, the vertical autocorrelation distance of the permeability coefficient for the sand and gravel overburden in the foundation is assumed to be 2.0 m, with the horizontal autocorrelation distance determined according to the simulation range of the finite element model.
The construction of the cut-off walls usually adopts a continuous pouring method from bottom to top in segmented sections, so the vertical size of the cut-off wall can be taken as the vertical autocorrelation distance of the permeability coefficient. As for the curtain, the length of a grouting section with a value of 5 m is selected as the vertical autocorrelation distance [47]. Their horizontal autocorrelation distances can be determined by their thickness.
To analyze the statistical characteristics of the permeability coefficients of different materials in high core rockfill dams, this paper collected 335 sets of experimental data [48] on the permeability coefficients of main materials from 100 m high core rockfill dams, and the parameters are shown in Table 1.

3.2. Numerical Experiment Design

To investigate the influence of considering or ignoring the spatial variability of the permeability coefficient in different material zones of the high core rockfill dams on the seepage characteristics of the dam, a total of eight schemes are designed for a comparative analysis, as shown in Table 2. Among them, Case 0 represents the homogeneous experiment scheme (without considering the spatial variability of the permeability coefficient); Cases 1 to 5 represent the experiment schemes considering the spatial variability of the permeability coefficient in the rockfill, the core wall, the overburden, the cut-off wall, and the curtain, respectively; Case 6 stands for the experiment scheme considering the spatial variability of the permeability coefficient in the anti-seepage system composed of the core wall, the cut-off wall, and the curtain; Case 7 stands for the experiment scheme considering the spatial variability of the permeability coefficient in all material zones.

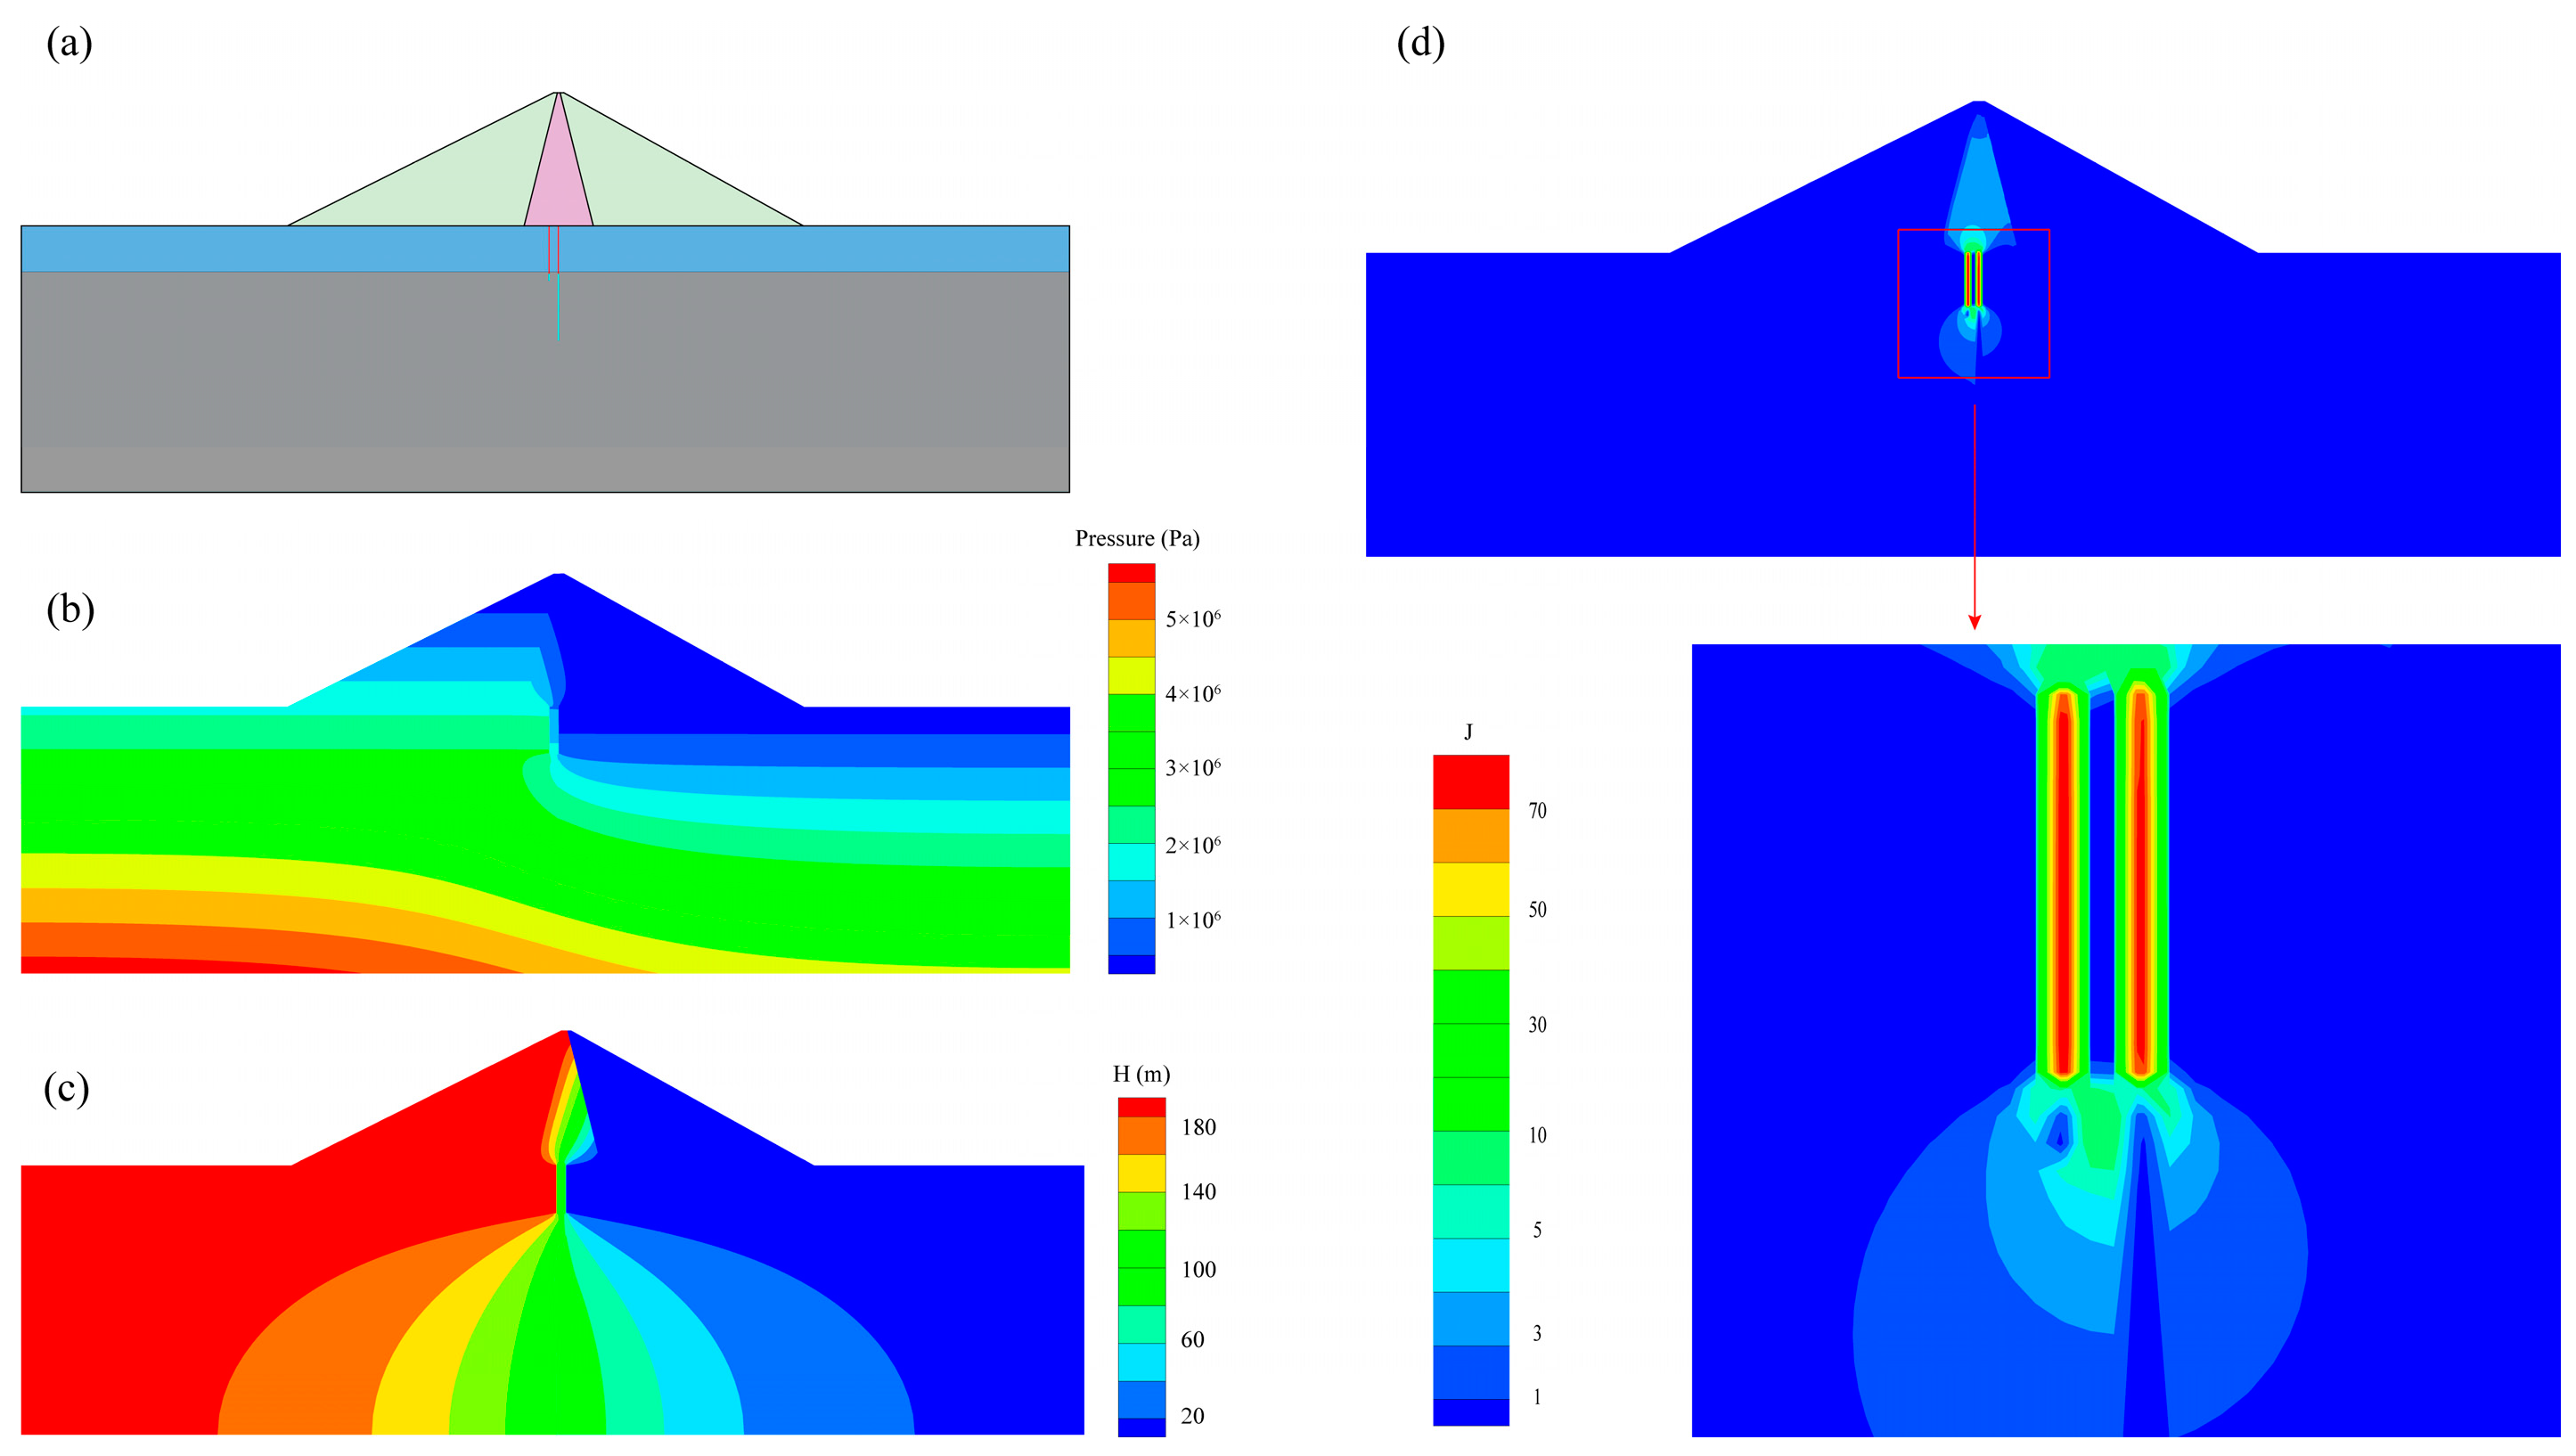
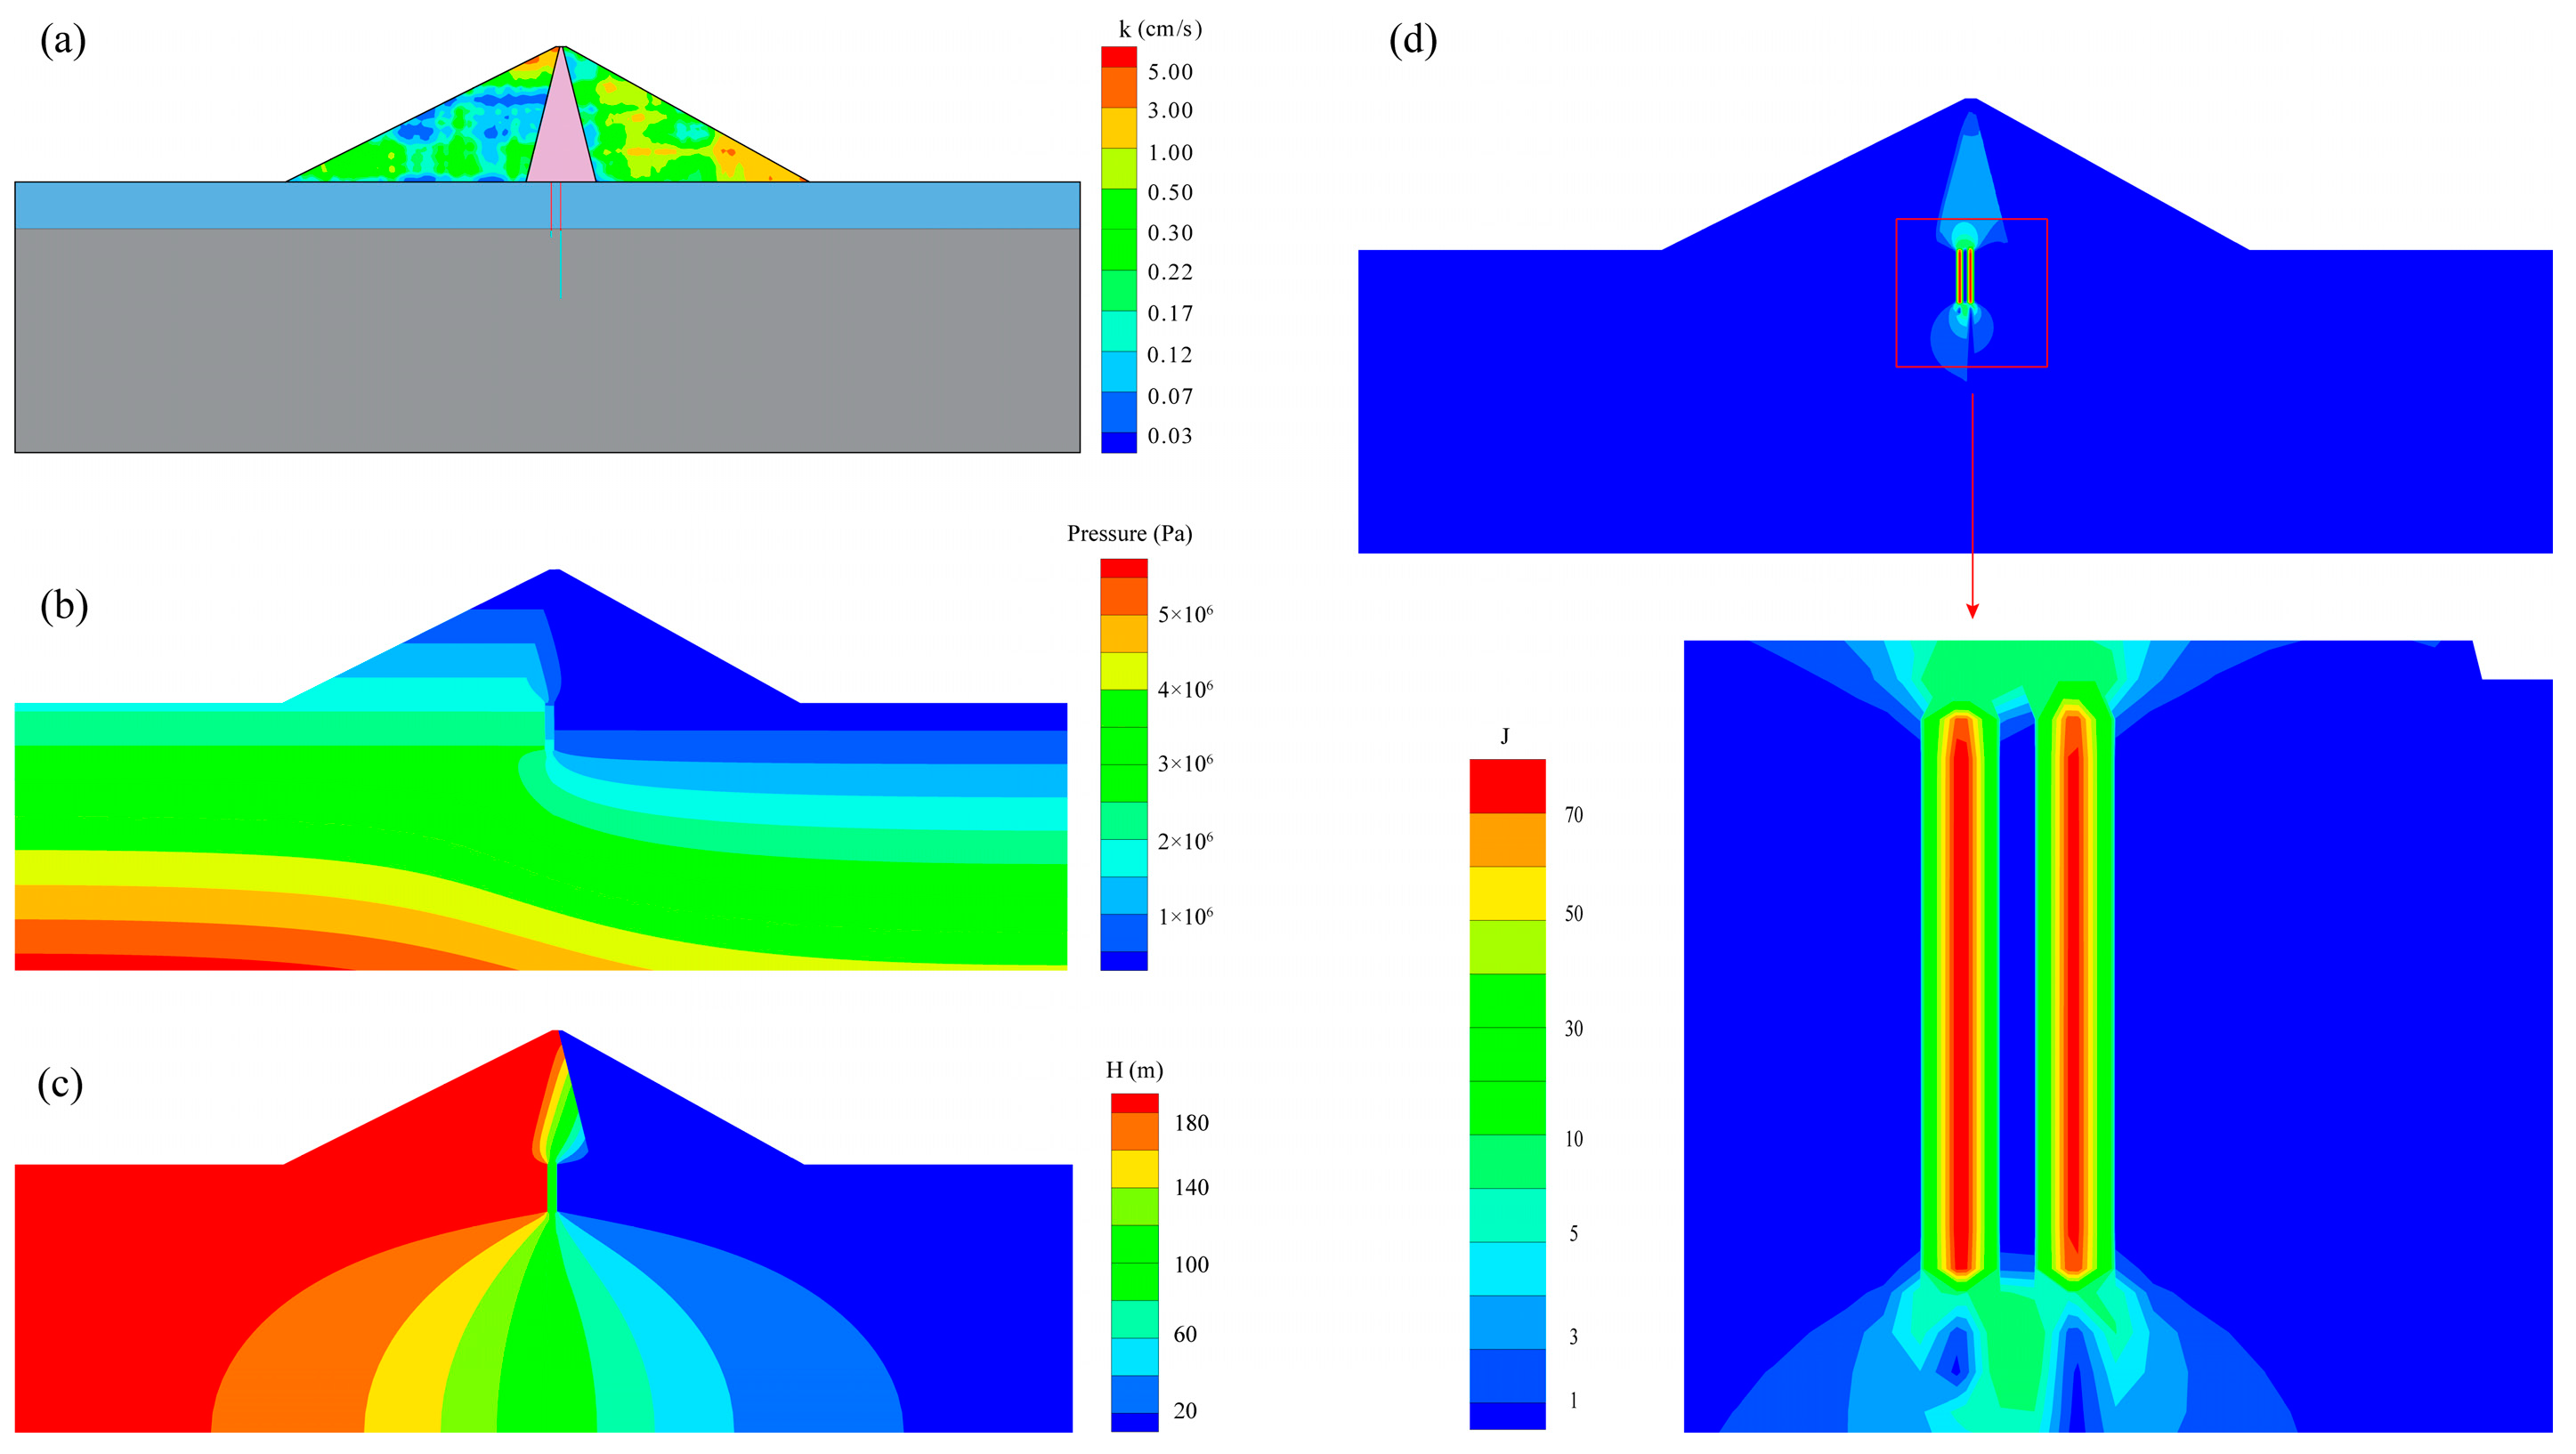
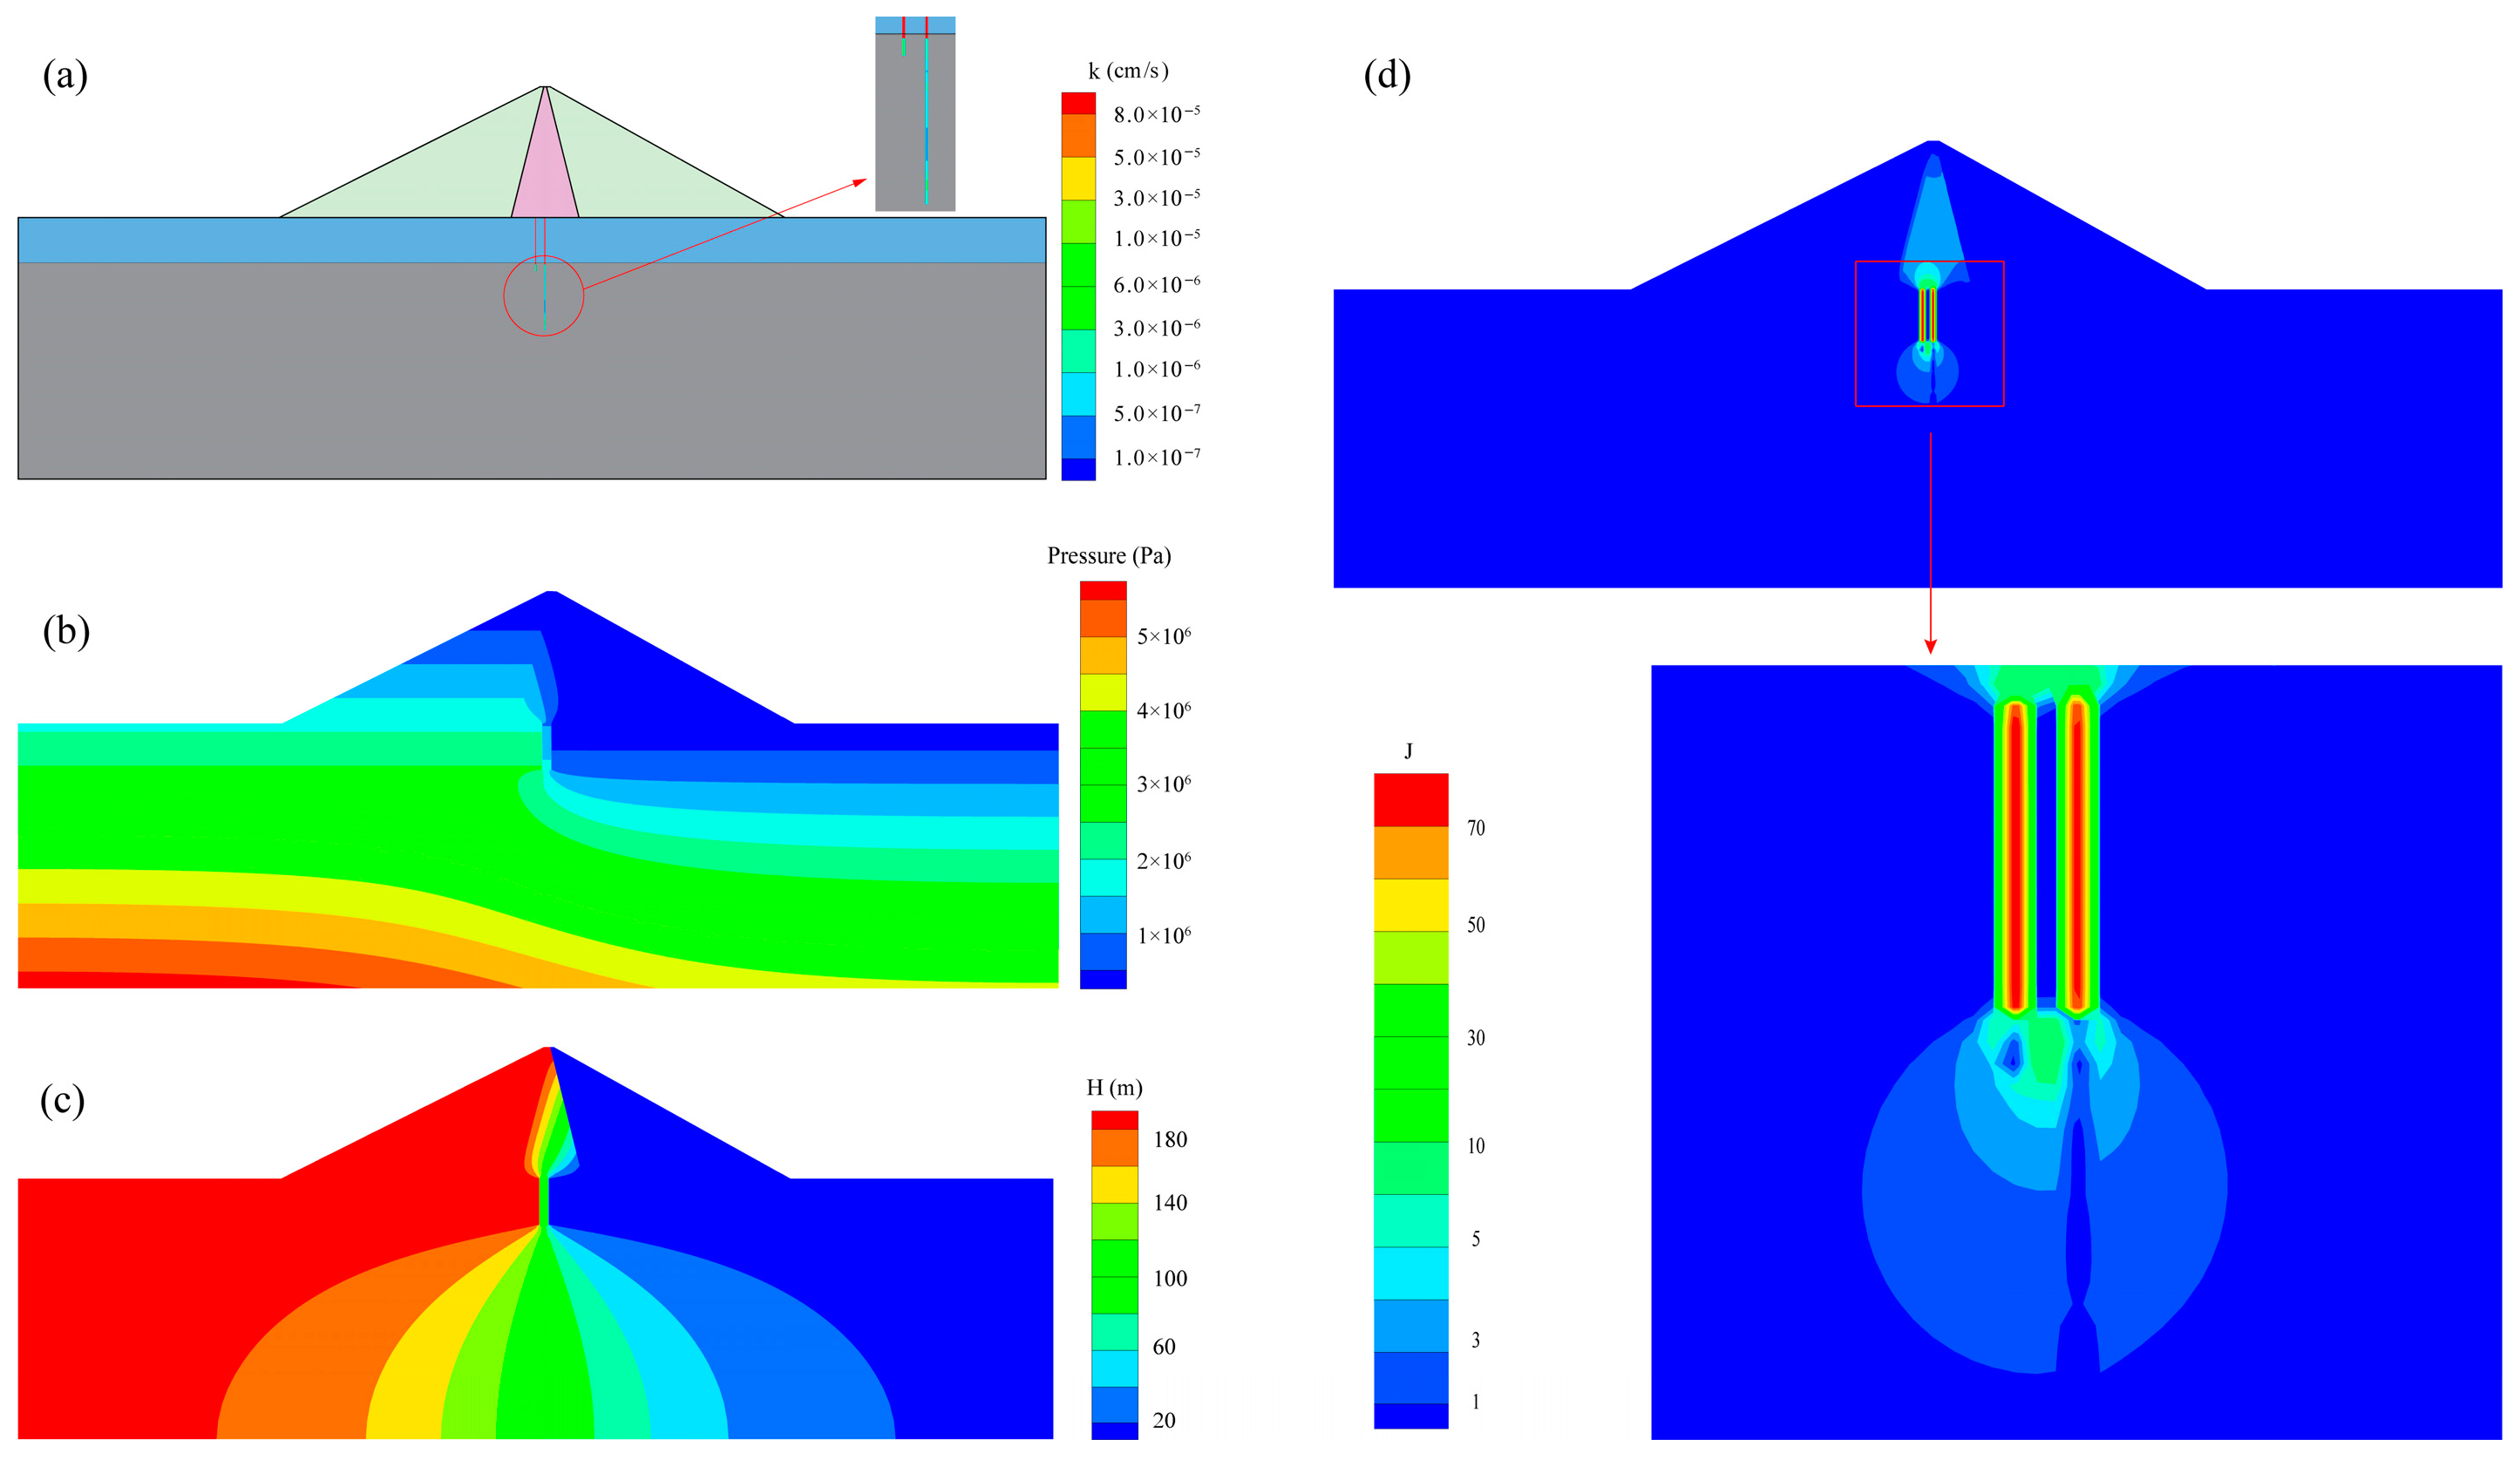
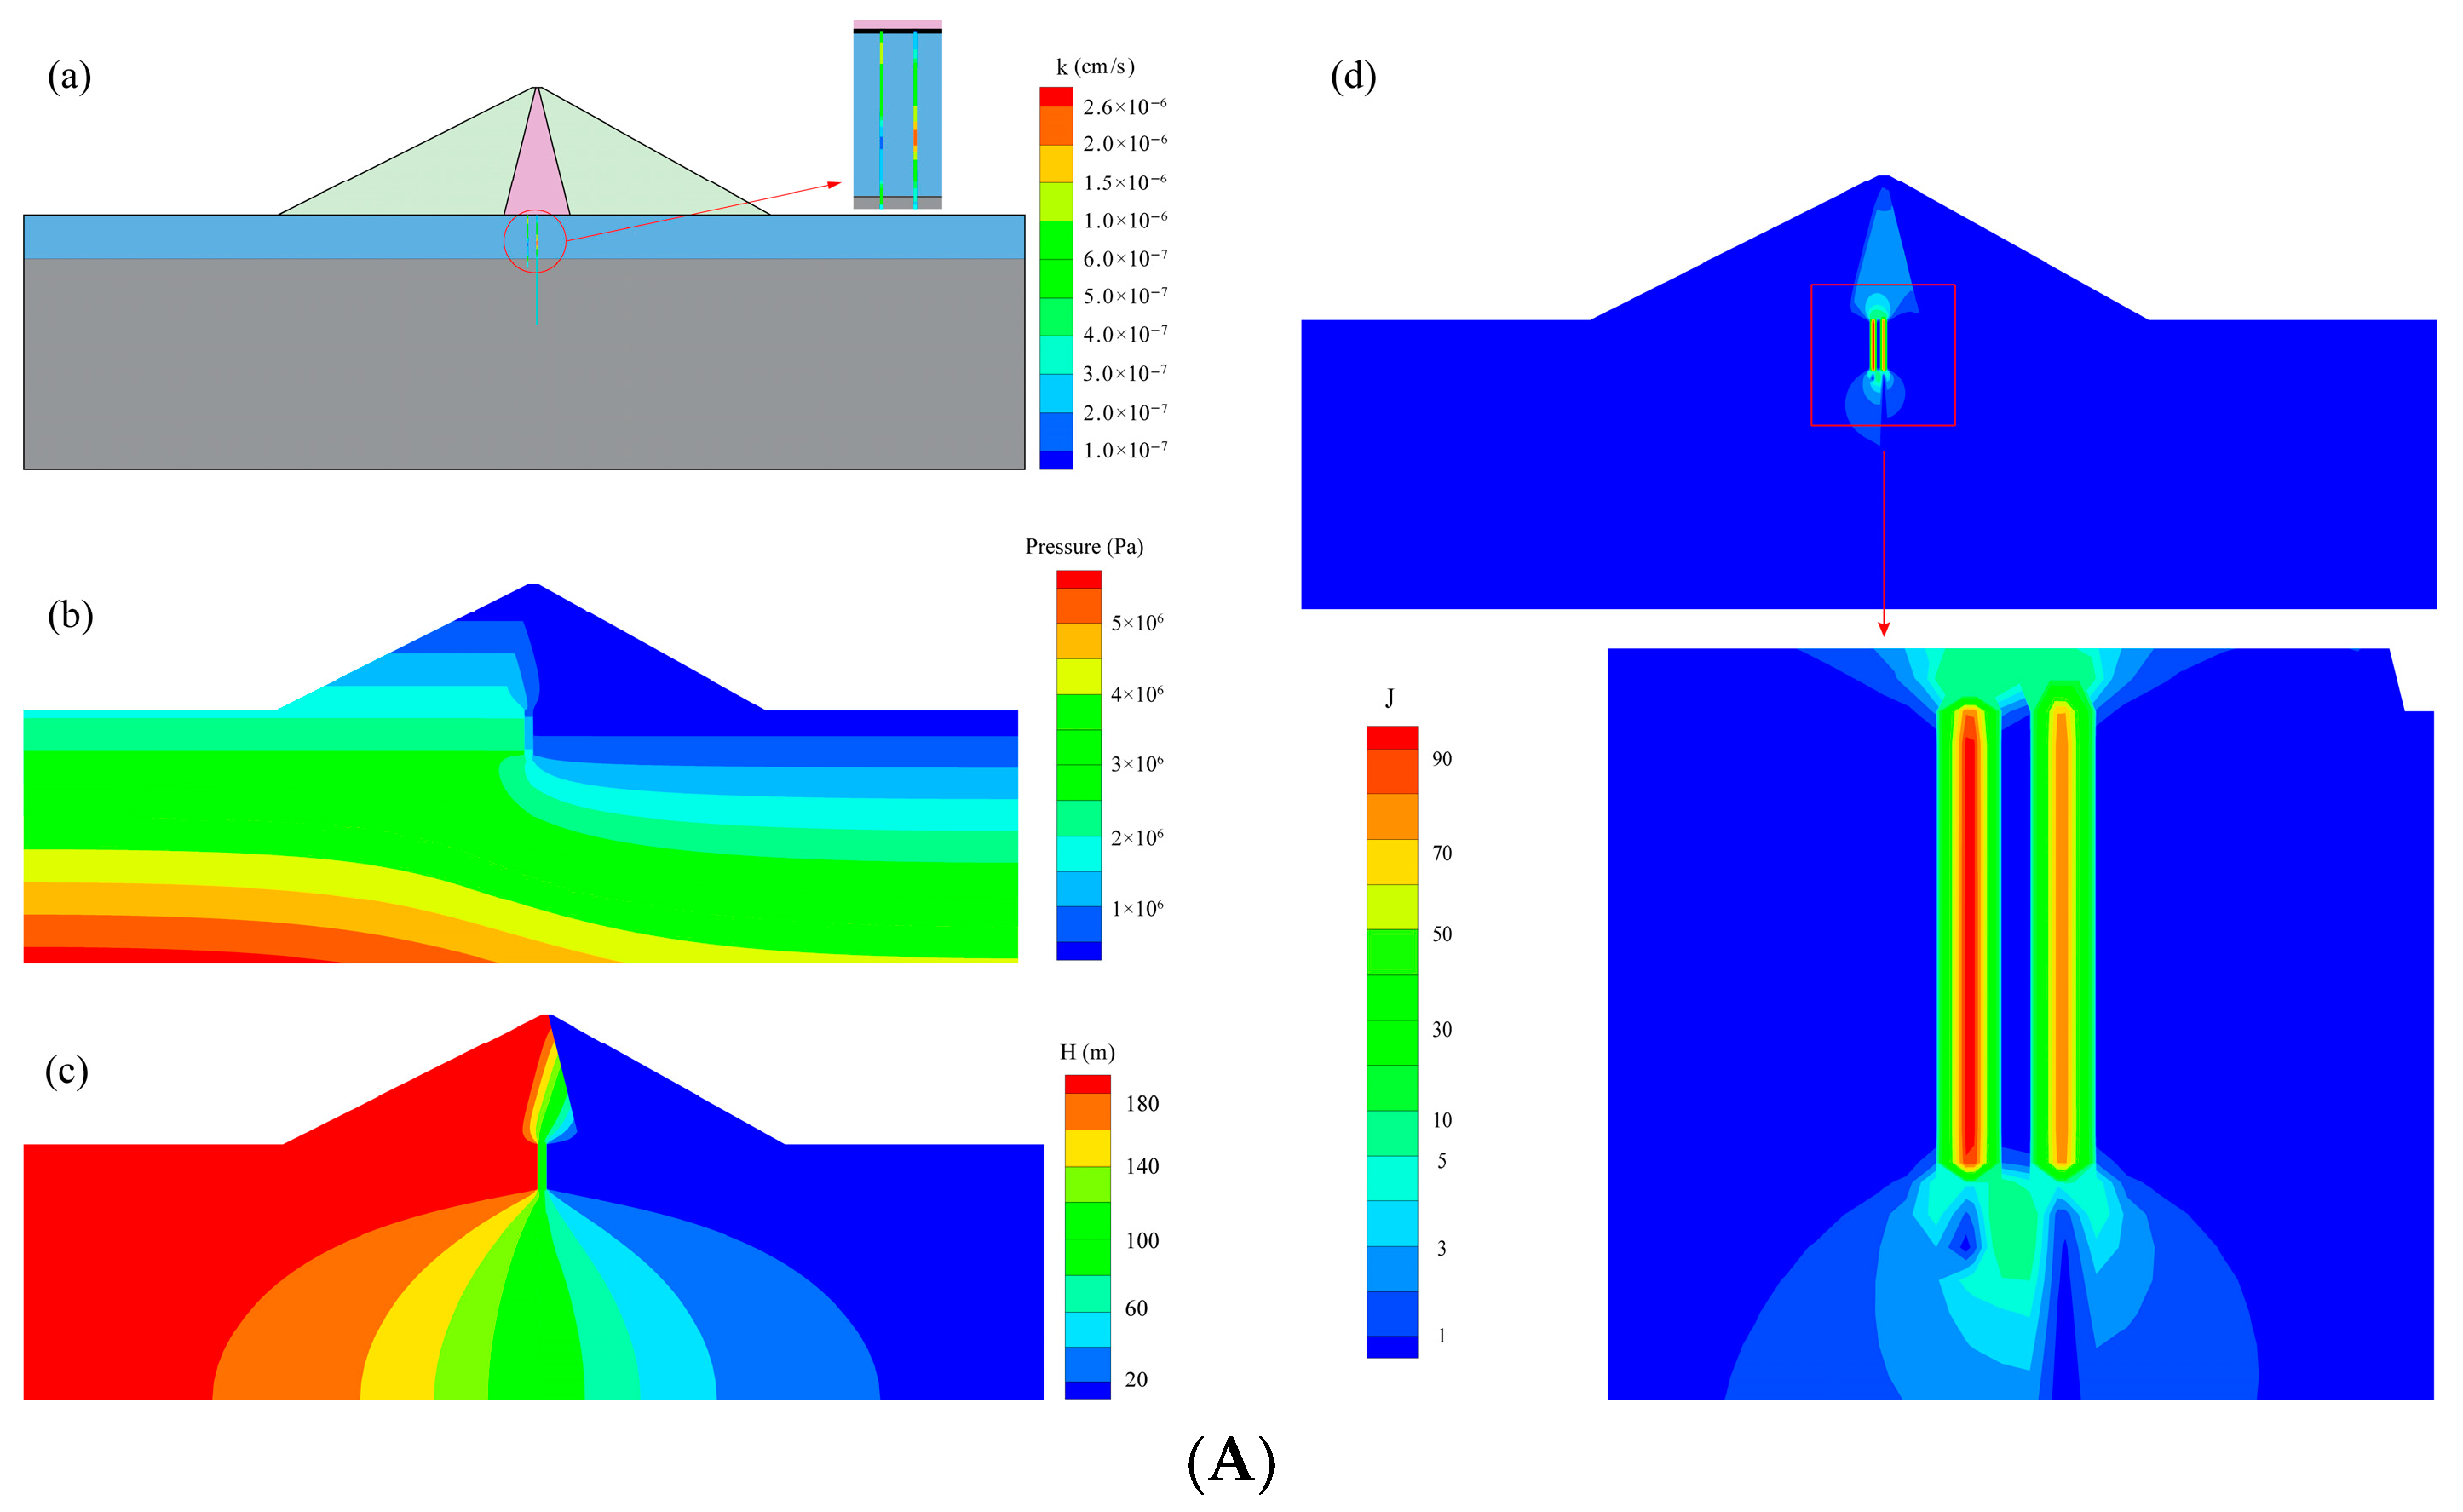
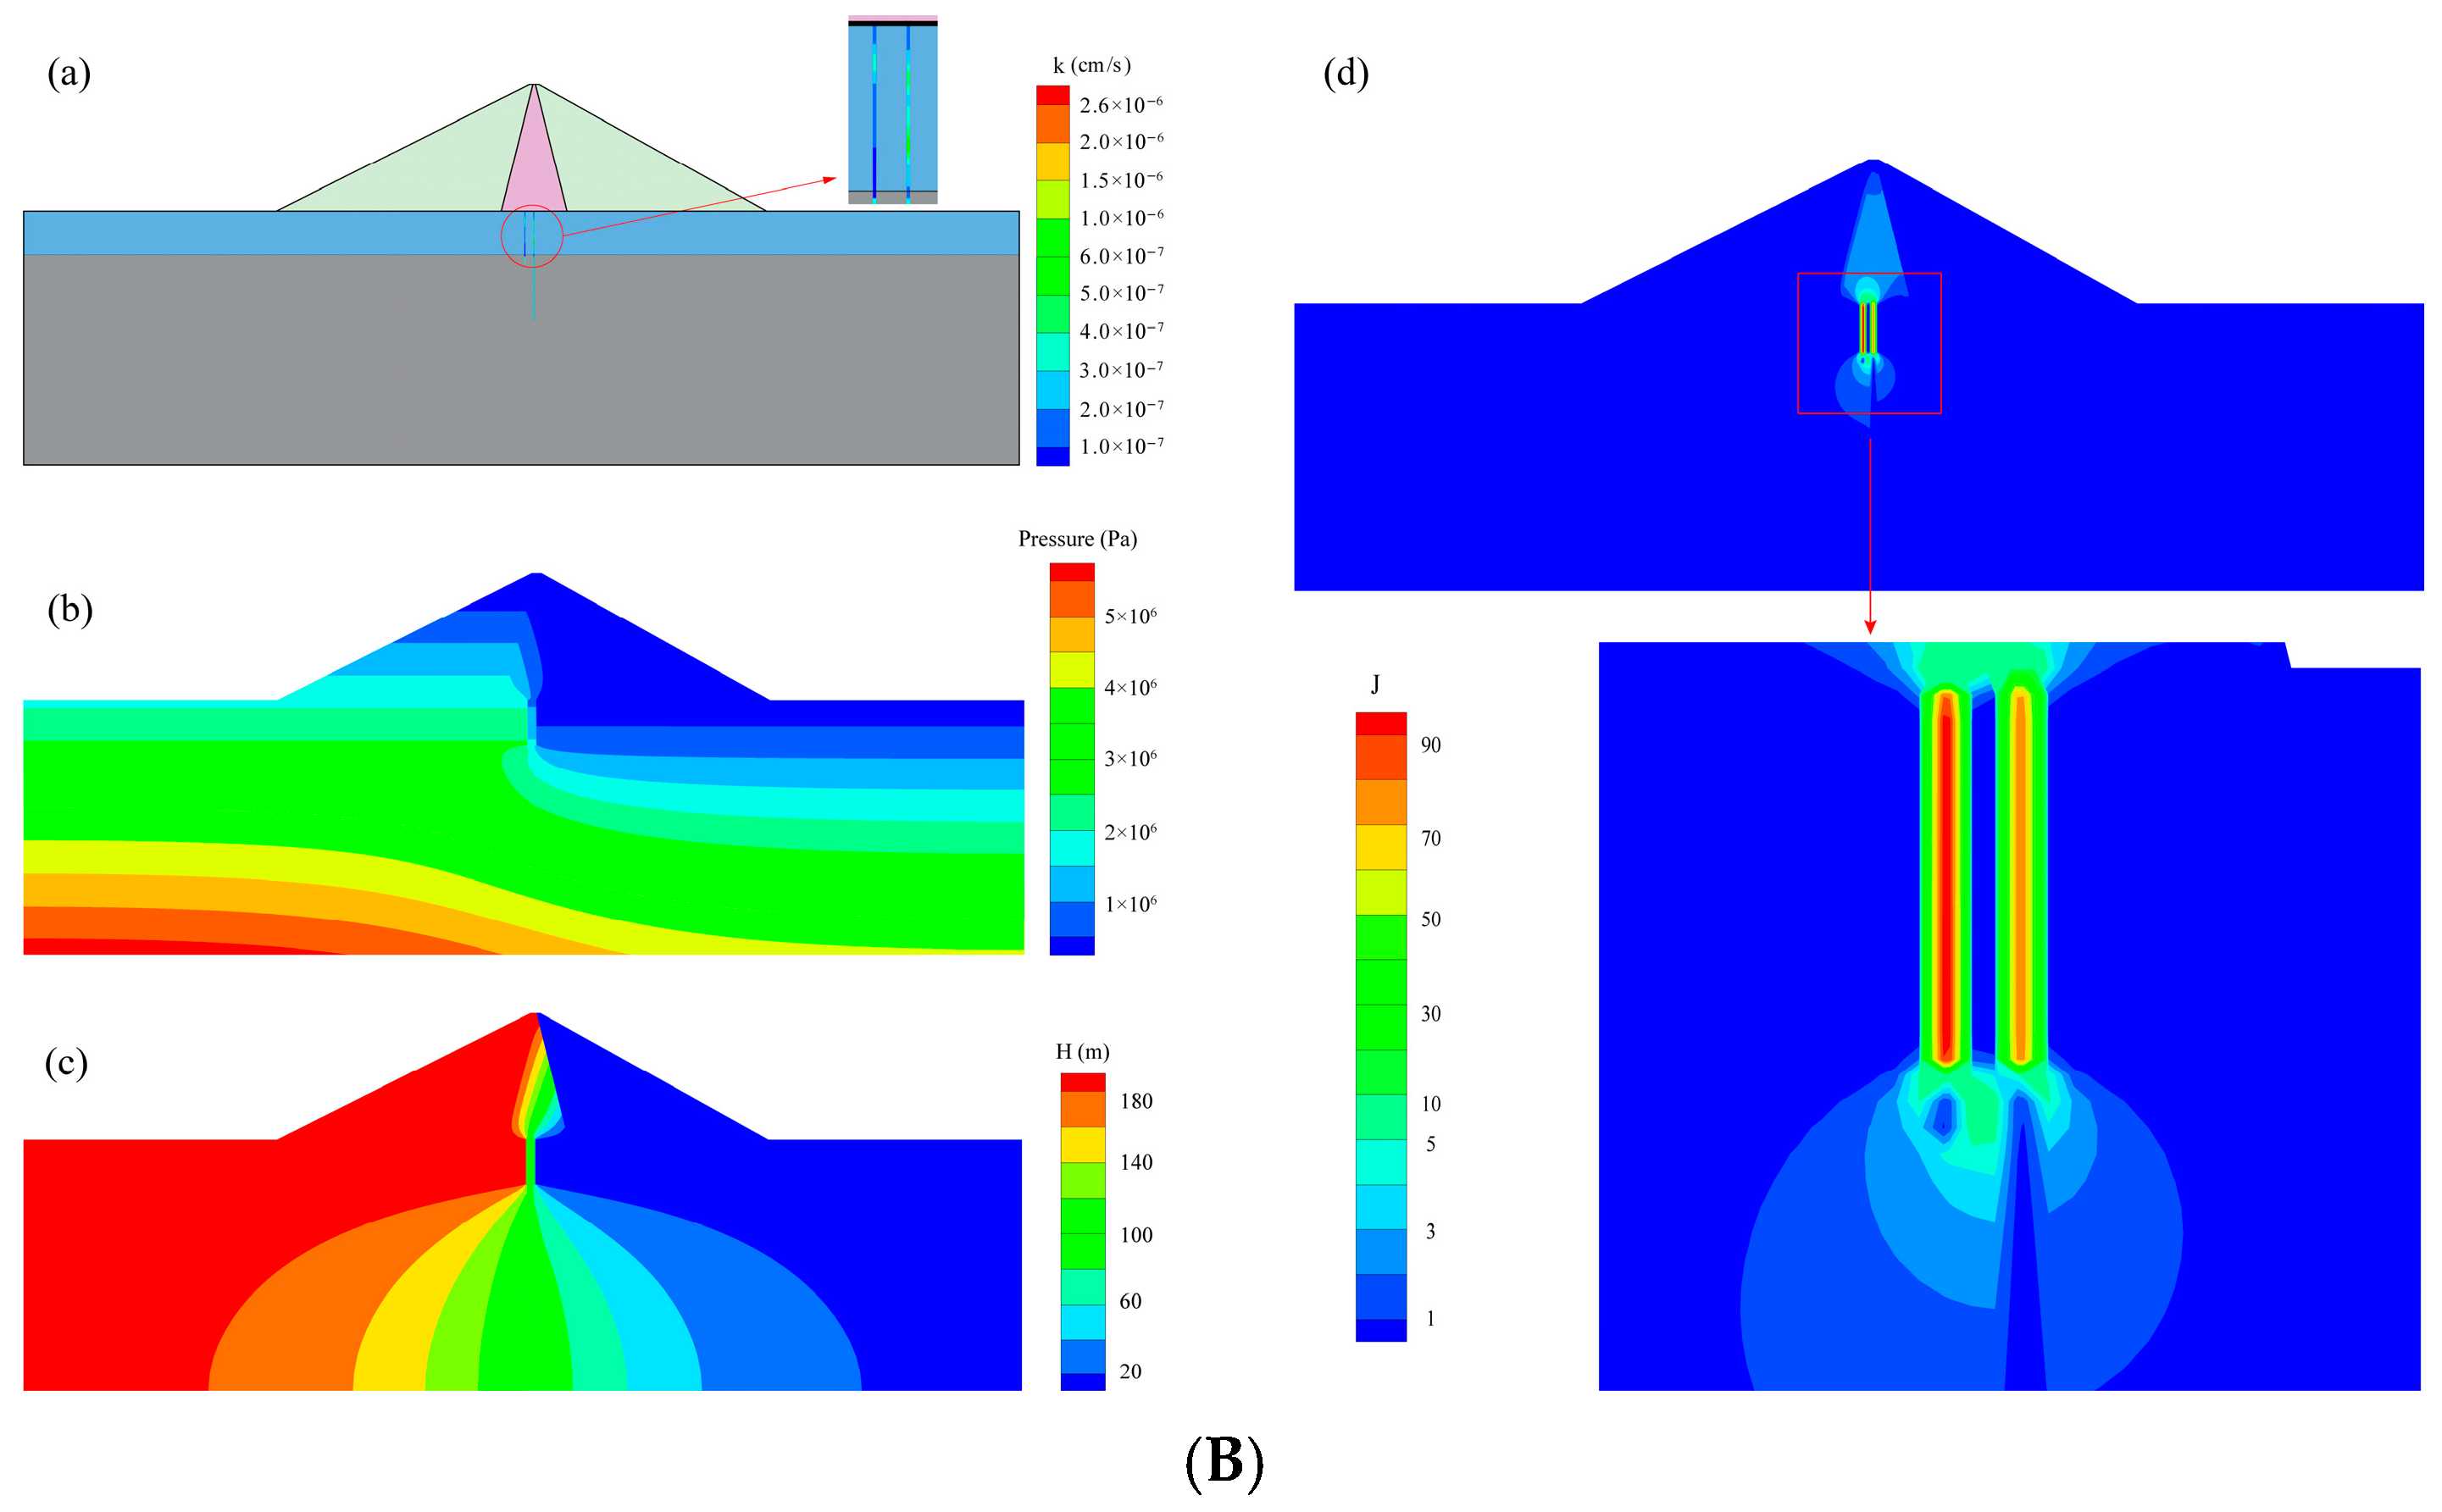
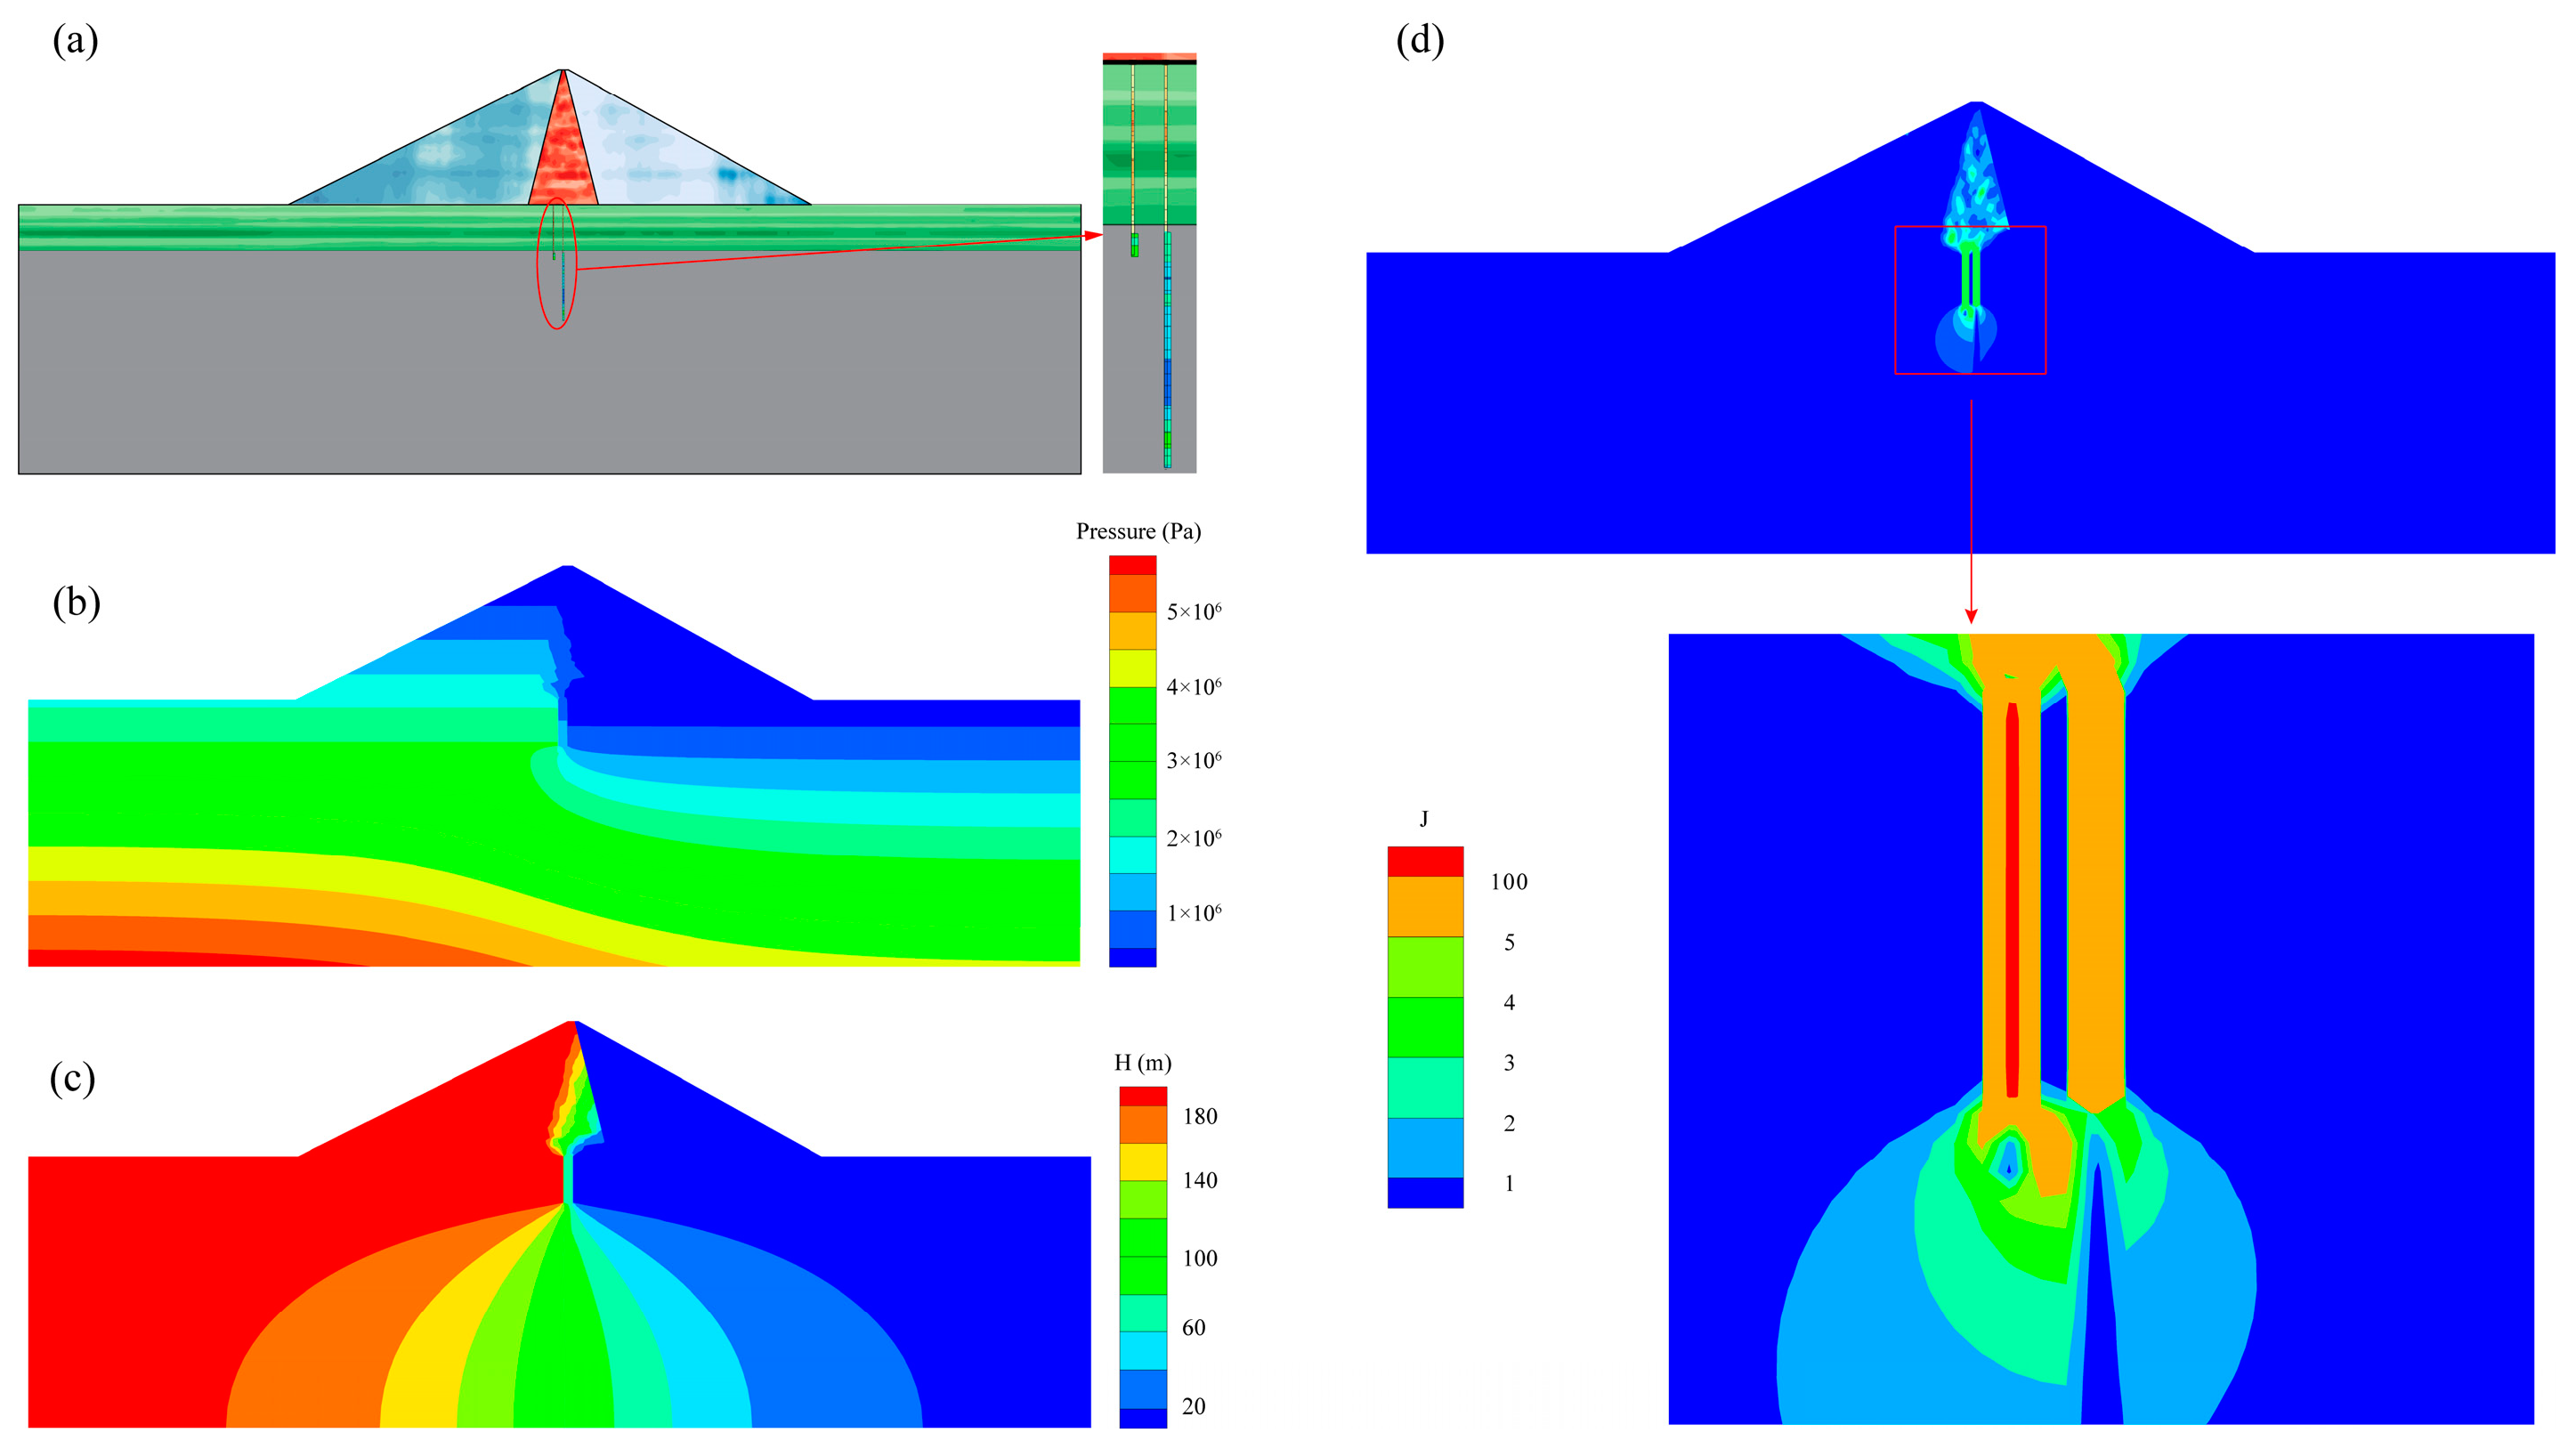
3.3. Effect of the Spatial Variability of Permeability Coefficient on the Seepage Characteristics

Using the spatial variability random field simulation technique for the permeability coefficient of the rockfill dams, 7 × 50 sets of permeability coefficient random fields were generated for the numerical schemes. Then, numerical simulations of seepage in the dam–foundation system were conducted, and the results are shown in Figure 8, Figure 9, Figure 10, Figure 11, Figure 12, Figure 13, Figure 14 and Figure 15, in which (a) stands for one random field of permeability coefficient, (b) stands for the pore water pressure, (c) stands for the head of water, and (d) stands for the hydraulic gradient.
As seen from Figure 8a, Figure 9a, Figure 10a, Figure 11a, Figure 12a, Figure 13a, Figure 14a and Figure 15a, after considering the spatial variability of parameters, the permeability coefficients at different locations within the same material of the dam and foundation exhibit variations. The differences in their magnitudes are significantly correlated with the distances between the points, reflecting the spatial variability and spatial correlation of the permeability coefficients of the dam and foundation materials. The simulation results of the seepage characteristics show the following.
(1) When the spatial variability of the permeability coefficient is not considered (Case 0, as shown in Figure 8), the distribution of the pore water pressure, head of water, and hydraulic gradient in the core wall is uniform. The relatively higher values of the hydraulic gradient appear in the middle-lower part of the core wall and the middle-upper part of the cut-off walls. Near the seepage release point of the core wall, the hydraulic gradient is between 1 and 2. The seepage hydraulic gradient in the main and secondary cut-off walls are essentially the same, with a value of approximately 70.
(2) When only considering the spatial variability of the permeability coefficient of the rockfill, overburden, or curtain (Cases 1 to 3, see Figure 9, Figure 10 and Figure 11), the seepage law of the dam–foundation system is basically the same as that without considering the spatial variability. Only the seepage hydraulic gradient of the core wall and the cut-off walls have slight changes. The maximum variation range of the seepage hydraulic gradient at the release point of the core wall is 0.05, and the maximum variation range of the seepage hydraulic gradient of the cut-off walls is 3. The main reason for this is that the permeability coefficient of the rockfill and the overburden are relatively large, endowing them with strong water permeability. Meanwhile, the permeability coefficient of the curtain is comparable to that of the bedrock, and the volume of the curtain is relatively small. Therefore, the spatial variability of the permeability coefficient of the rockfill, the overburden, and the curtain will not lead to significant changes in the overall seepage characteristics of the dam–foundation system.
(3) The simulation results considering only the spatial variability of the permeability coefficient of the core wall or the cut-off walls (Cases 4 to 5) show that the spatial variability of the permeability coefficient of the core wall and the cut-off walls has a relatively obvious impact on the seepage law of the dam–foundation system, as shown in Figure 12 and Figure 13. At this time, the spatial distribution of the pore pressure in the core wall is uneven, and the values of the hydraulic gradient of the core wall and the cut-off walls corresponding to different random fields exhibit obvious discreteness. Due to the relatively small thickness of the cut-off walls, the spatial variability of the permeability coefficient has a relatively small impact on the distribution of the hydraulic gradient inside the walls. However, it has a significant impact on the proportion of the head of water by the main and secondary cut-off walls, and there is a certain difference in the hydraulic gradient between the main and secondary cut-off walls. As shown in Figure 12a,b, for the main and secondary cut-off walls, if the permeability coefficient of one wall is relatively large, the hydraulic gradient of the other wall will increase, indicating that the spatial variability of the permeability coefficient is not conducive to the coordinated anti-seepage effect of the main and secondary cut-off walls. The statistical analysis of 50 sets of seepage simulation results for Cases 4 to 5 indicates that the maximum hydraulic gradients of the core wall and the cut-off walls increased by 34% and 29%, respectively, compared to the homogeneous case, which demonstrates that the spatial variability of the permeability coefficients in the core wall and the cut-off walls is detrimental to the seepage safety of the dam’s anti-seepage system.
(4) When considering the permeability coefficient spatial variability of the anti-seepage system materials and all materials, the simulated seepage laws of the dam–foundation system are fundamentally consistent, and the hydraulic gradients at the release point of the core wall and the top of the cut-off walls are comparable in both cases (see Figure 14 and Figure 15), which once again underscores that the spatial variability of the permeability coefficients in the anti-seepage system is the dominant factor influencing the seepage characteristics of high core rockfill dams.

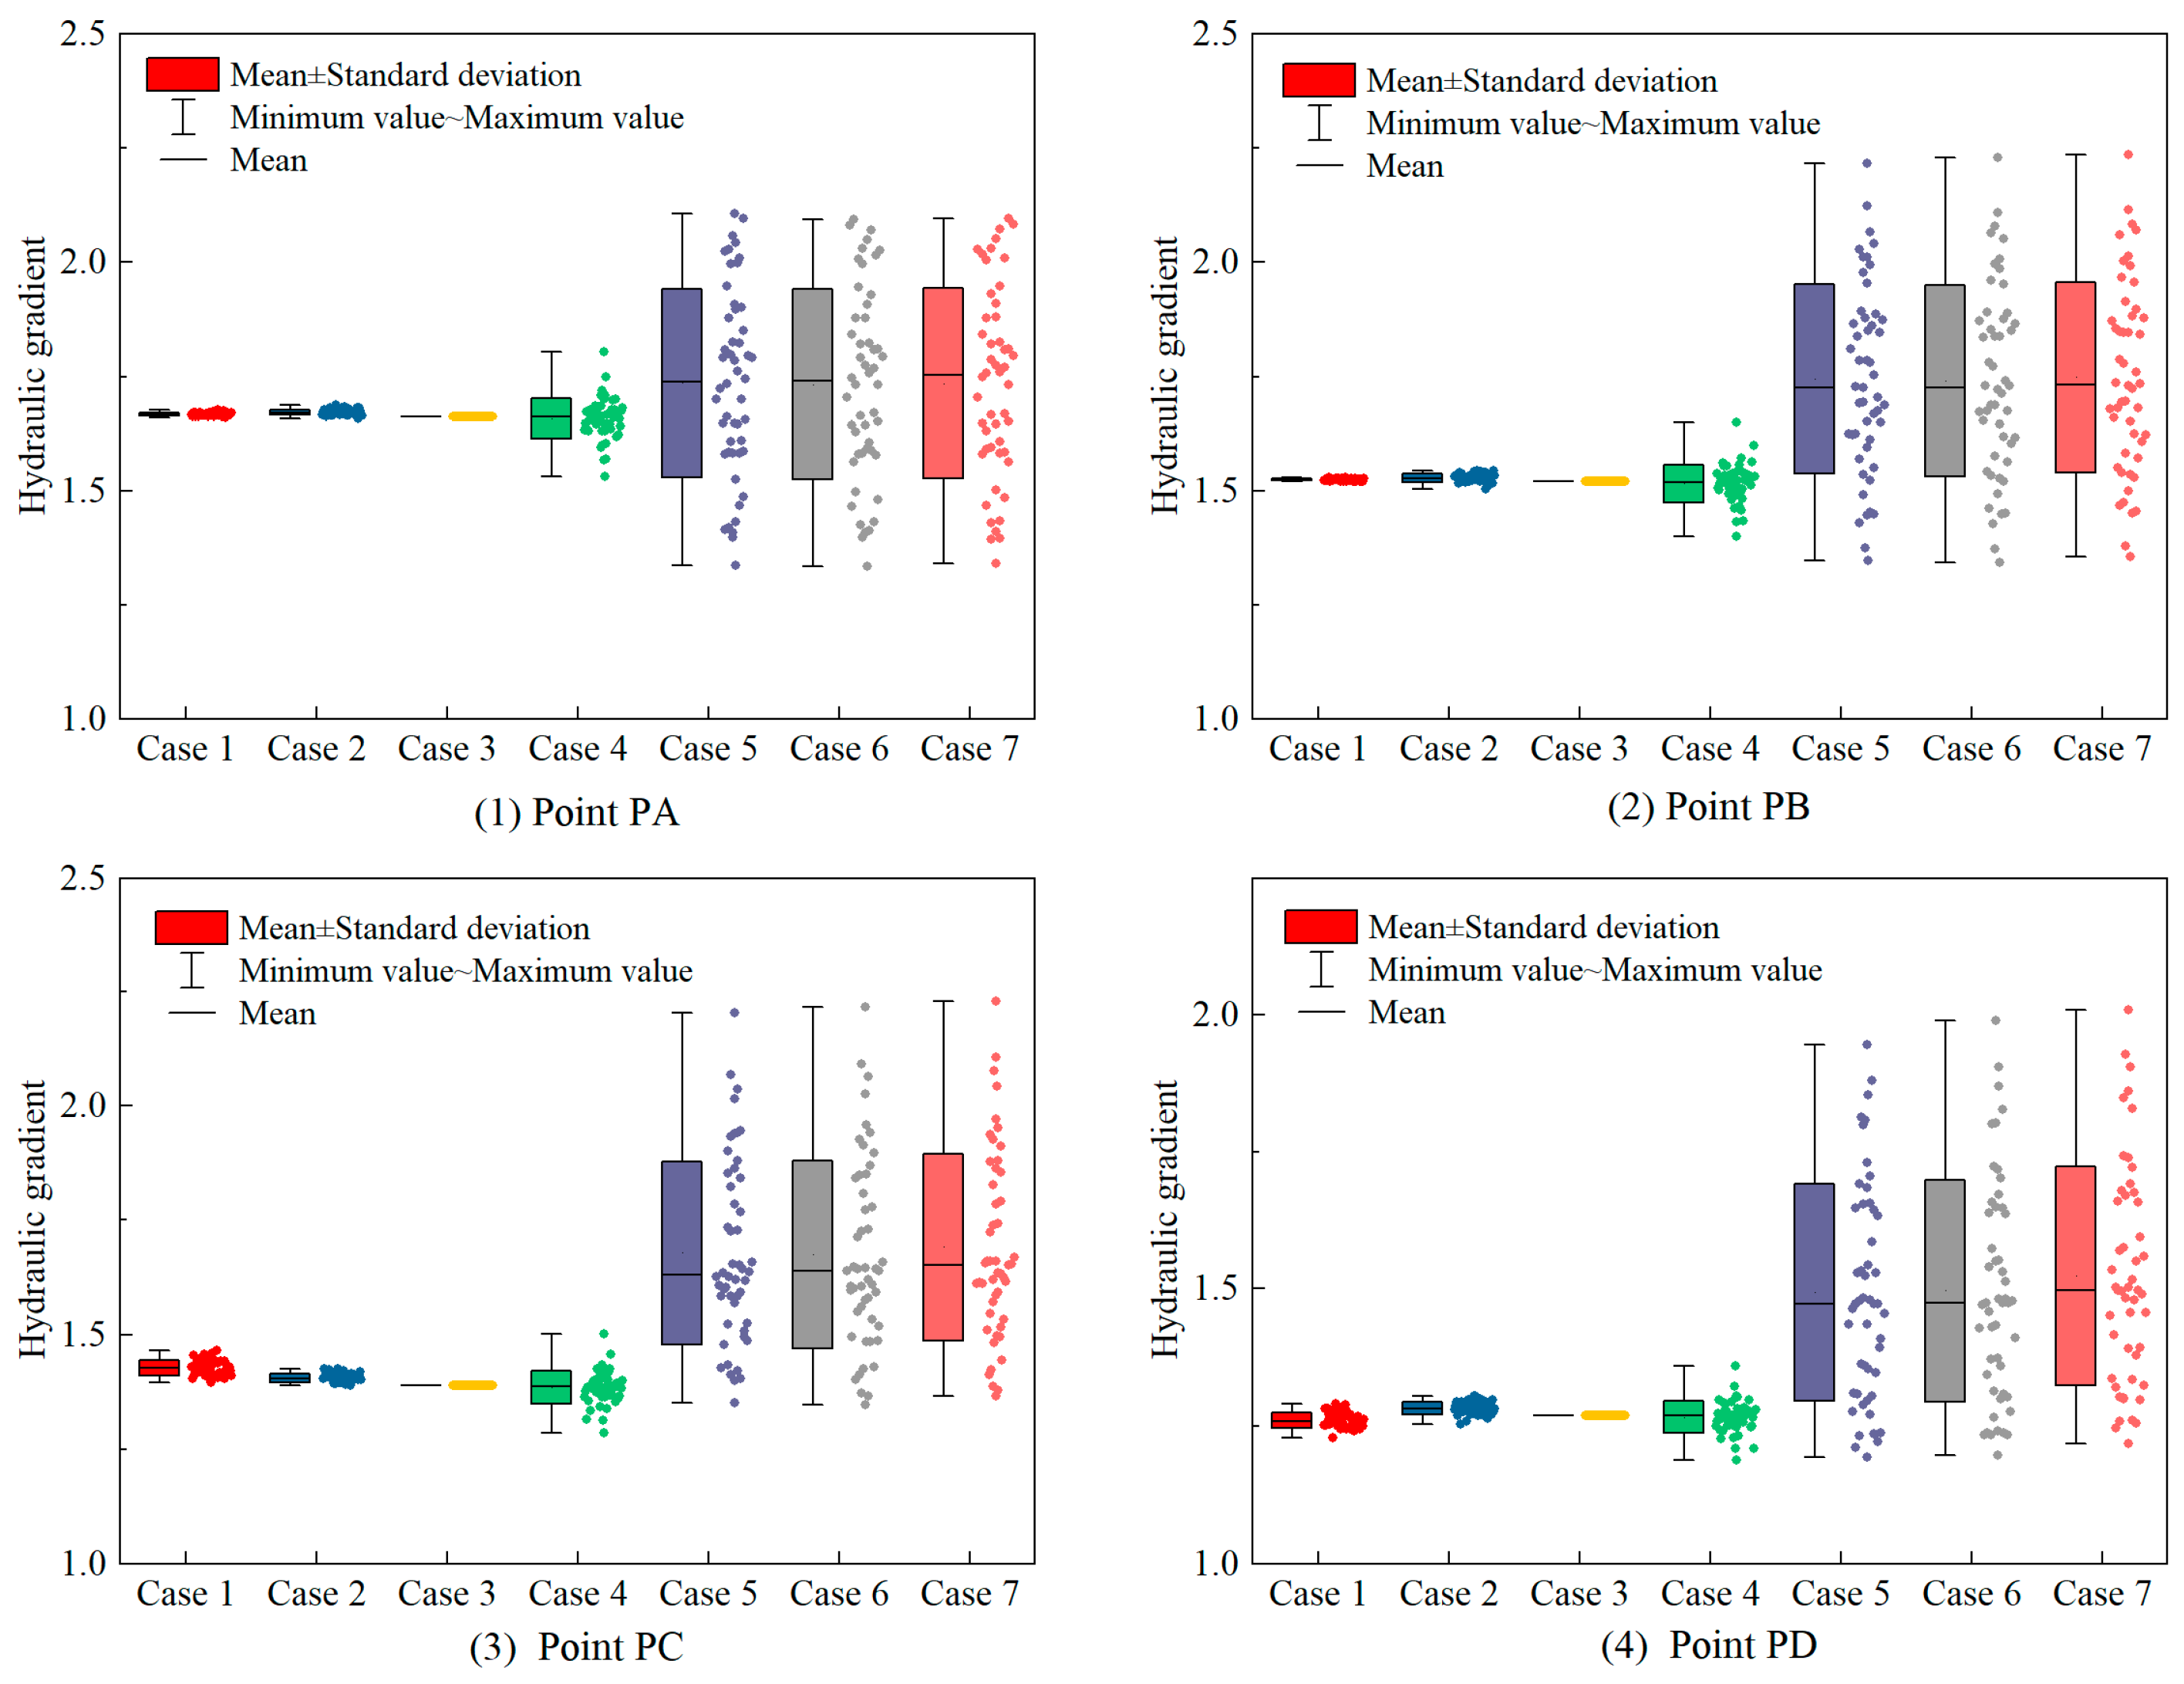
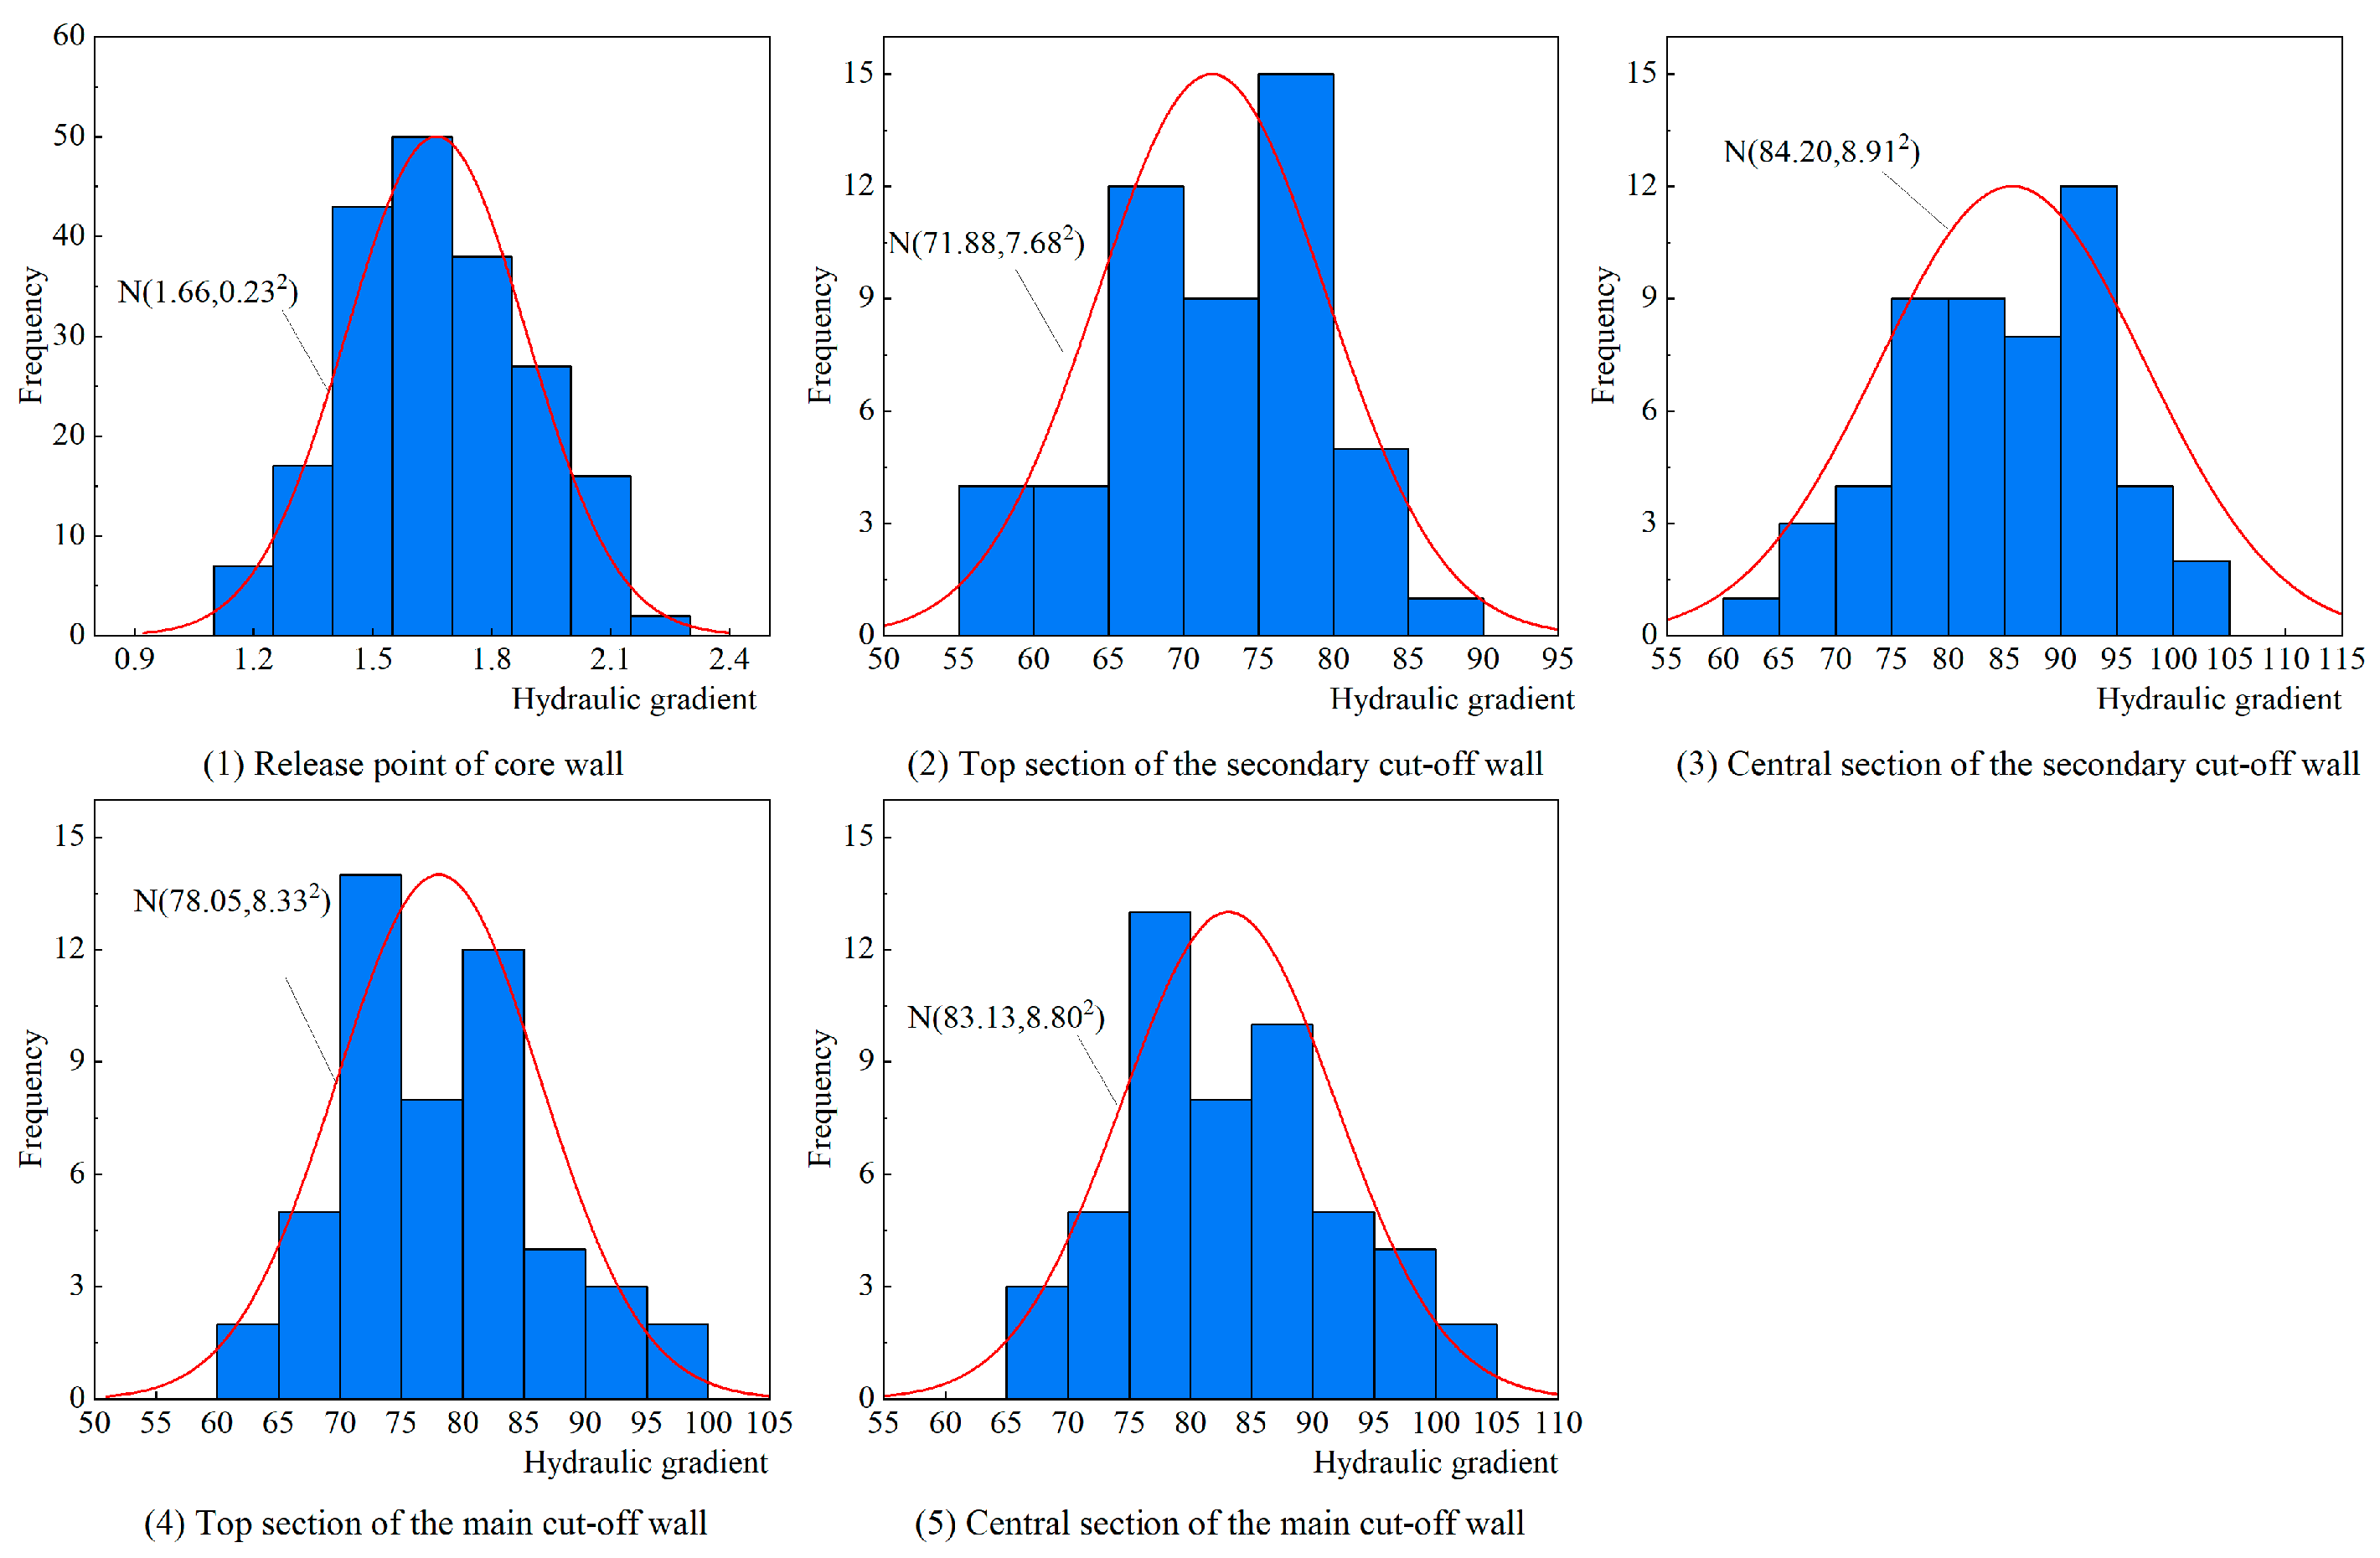
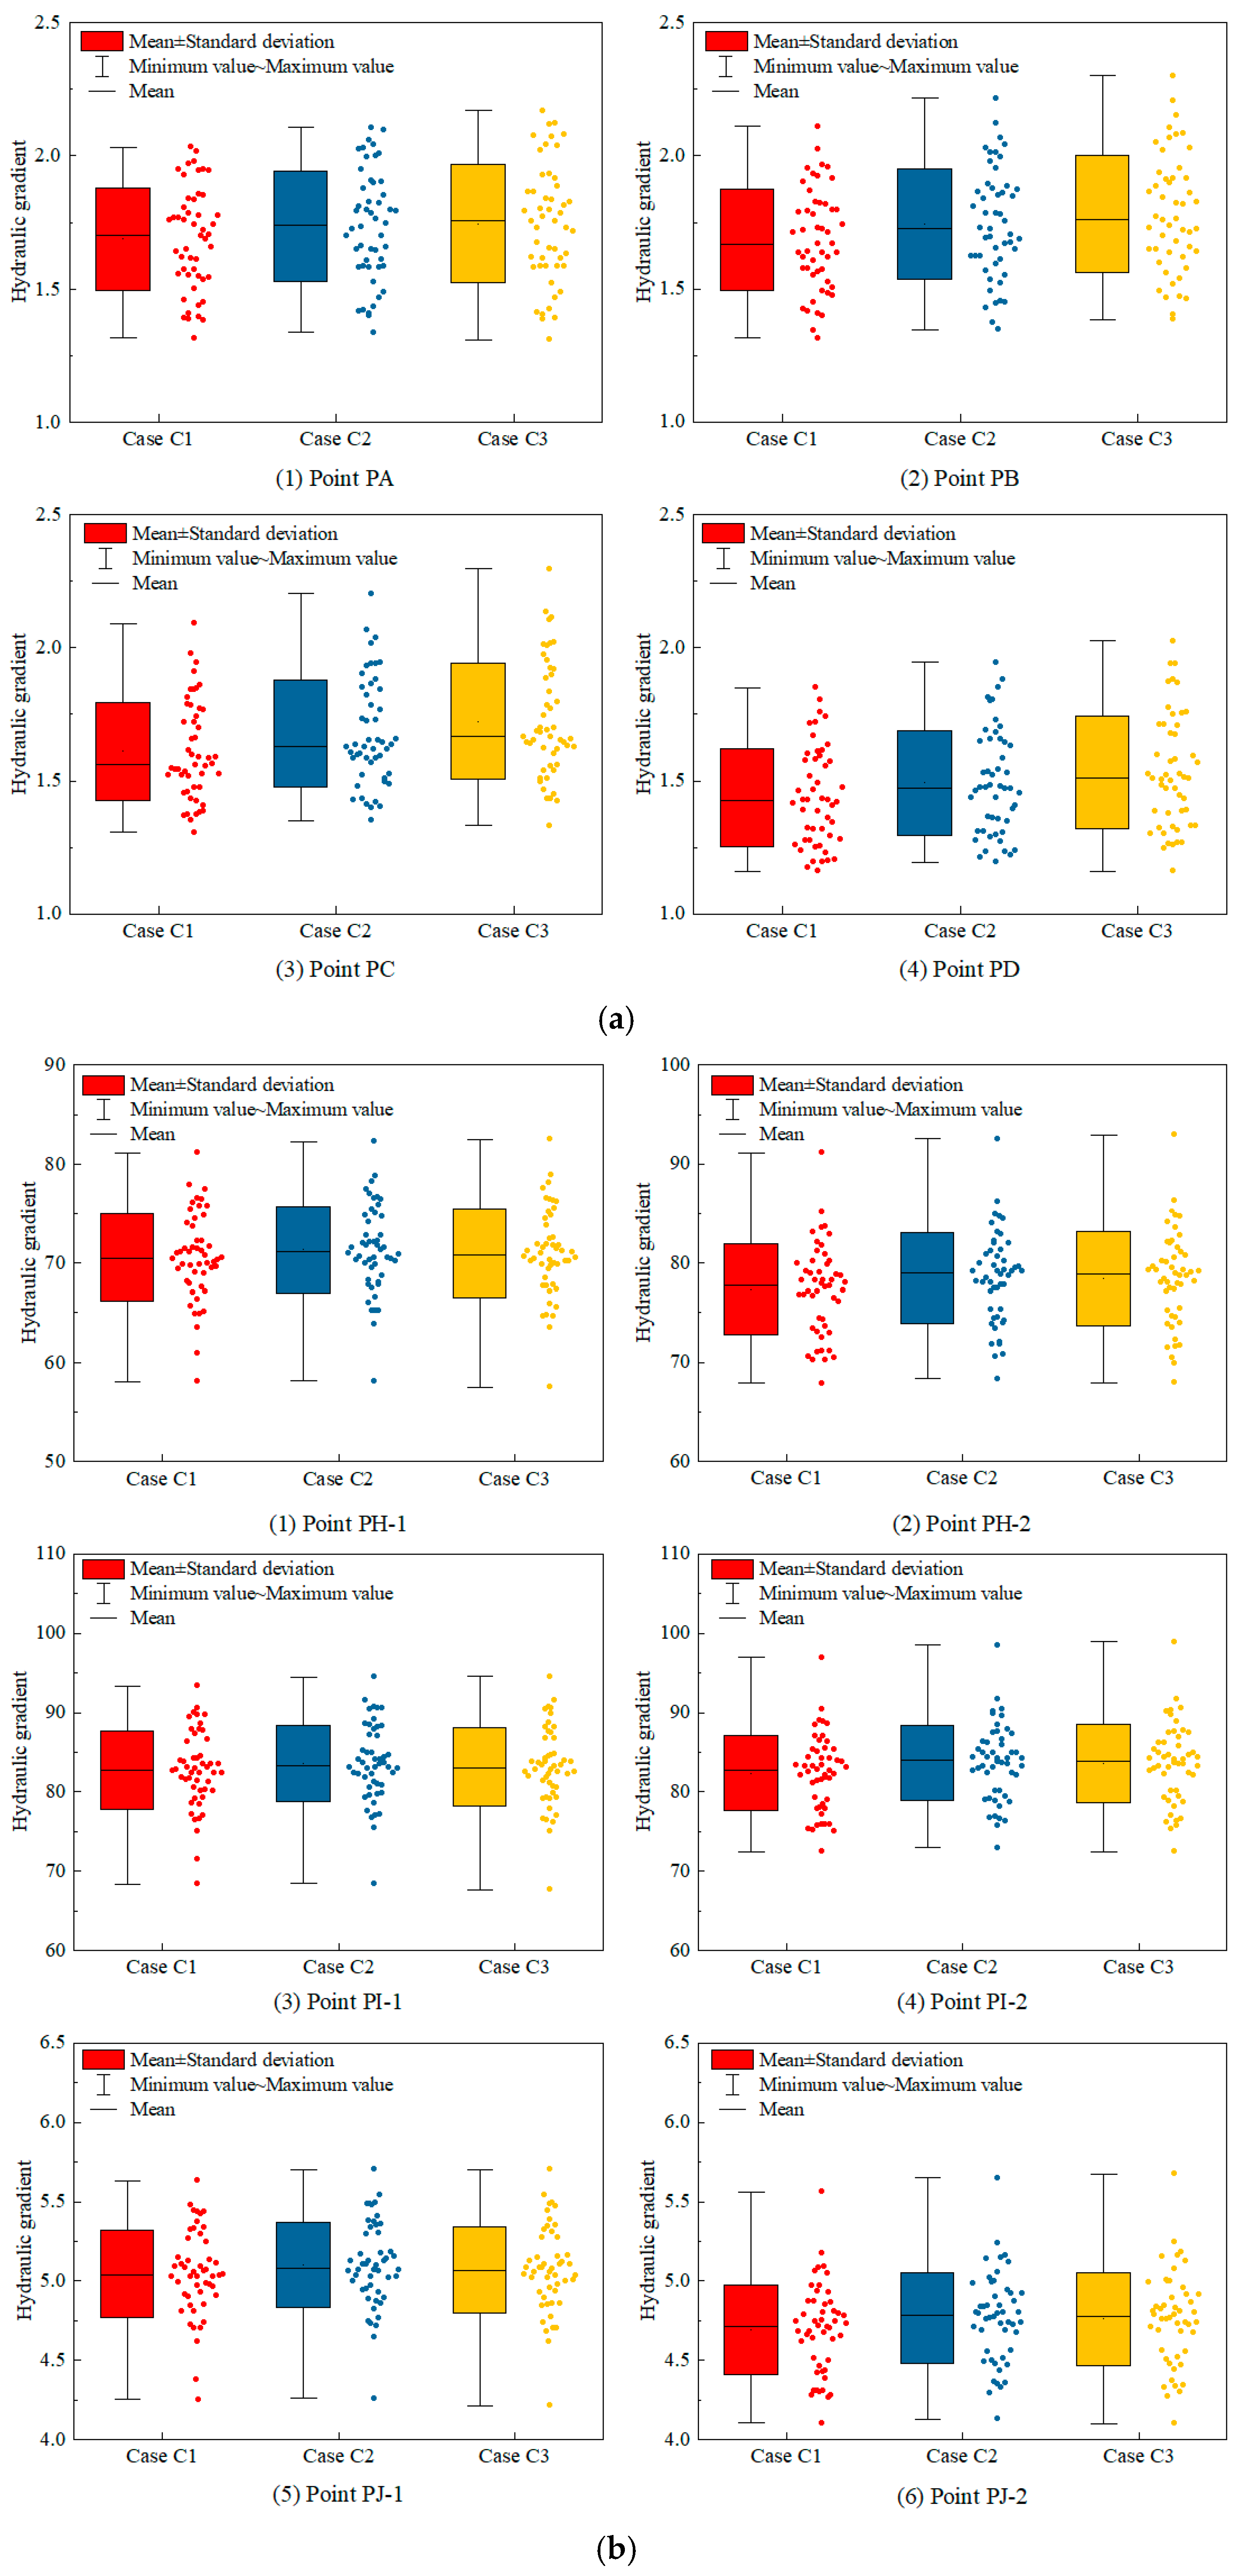
3.4. Effect of the Spatial Variability of Permeability Coefficient on the Hydraulic Gradient

To further analyze the influence of the spatial variability of permeability coefficients on the seepage characteristics of the anti-seepage system in the dam–foundation system, a statistical analysis was conducted on the hydraulic gradients at key points near the release point of the core wall and within the main and secondary cut-off walls (as shown in Figure 16). The results are presented in Figure 17 and Figure 18.
The results considering the spatial variability of permeability coefficients in the rockfill, the overburden, or the curtain show that the spatial variability of the permeability coefficient has a relatively small impact on the hydraulic gradients of the anti-seepage system. The coefficient of variation of the hydraulic gradient at the points PA-PD of the core wall is within 0.003, and the coefficient of variation of the hydraulic gradient at points PH-1, PI-1, PH-2, and PI-2 in the main and secondary cut-off walls is within 0.04. Although there are some fluctuations in the hydraulic gradient at points PJ-1 and PJ-2 at the top of the curtain, the total value and amplitude are relatively small, and the corresponding hydraulic gradient for different random fields is within 2–10.
Under the condition of spatial variability of the permeability coefficient of the core wall and cut-off walls, the hydraulic gradient of the dam exhibits strong discreteness. Among them, the coefficients of variation of the hydraulic gradient at points PA~PD in the core wall are between 0.15 and 0.18. Compared with the homogeneous situation, the average value of the hydraulic gradient increases significantly. Taking point PA in Figure 17 as an example, For Cases 0~4 (homogeneity scheme, considering the spatial variability of the permeability coefficient of the rockfill, overburden, cut-off wall, and curtain), the average value of the hydraulic gradient at point PA is approximately 1.67. However, when considering the spatial variability of the permeability coefficient of the core wall, the average value of the hydraulic gradient at point PA increases to 1.75. This shows that the spatial variability of the permeability coefficient of the core wall not only leads to greater discreteness and uncertainty of the seepage in the core wall but also causes an overall increase in the hydraulic gradient at the release point, which is unfavorable for the anti-seepage safety of the core wall.
In addition, when considering only the spatial variability of the core wall’s permeability coefficient, the hydraulic gradient of the cut-off walls also shows significant discreteness (see Figure 18). This suggests that the spatial variability of the core wall’s permeability coefficient not only influences the seepage behavior of the core wall itself but also affects that of the cut-off walls, highlighting the coupling relationship between the seepage characteristics of the various anti-seepage structures within the anti-seepage system. The influence of the spatial variability of the cut-off walls’ permeability coefficient on the seepage behavior of the dam–foundation system is generally similar to that of the core wall, though its effect on the hydraulic gradient is comparatively weaker. Moreover, the seepage behaviors of the core wall and the cut-off walls exhibit a clear mutual coupling relationship.
For Cases 6~7, the statistical values of the hydraulic gradients at each feature point are basically the same. The coefficients of variation difference of the hydraulic gradients at points PA to PD in the core wall are within 0.004, the maximum hydraulic gradient difference is less than 0.06, and the same difference in the main and secondary cut-off walls (excluding the bottom of the wall) is within 0.002, and the maximum difference in the hydraulic gradient is not greater than 1.
The comparison between Cases 6~7 and Cases 4~5 shows that in the seepage analysis, the impacts of the spatial variability of the permeability coefficient of both the core wall and the cut-off walls should be paid attention to simultaneously. Through the statistical test and interval estimation of the hydraulic gradients at the release points of the core wall in Case 7 and the feature points of the cut-off walls, it is shown that the hydraulic gradients at each feature point all follow a normal distribution (see Figure 19). The 95% confidence interval estimates of the hydraulic gradients at the release point of the core wall, and the top and middle parts of the two cut-off walls are [1.22, 2.11], [56.83, 86.94], [66.74, 101.67], [61.73, 94.38], and [65.89, 100.37], respectively.

4. Discussions

According to the research results, the core wall and the cut-off wall are key structures that affect the permeability safety of high core rockfill dams, especially the core wall. Related studies have shown that the coefficient of variation of material parameters significantly affects the structural state [28,49]. Therefore, this paper investigates the influence of the coefficient of variation of the permeability coefficient of the core wall on the permeability gradient of the characteristic points of the anti-seepage structure. Based on the results in reference [48], three levels of core wall permeability coefficients are selected, with values of 1.46, 1.72, and 2.03, named Case C1, Case C2, and Case C3. The results are shown in Figure 20. It can be found that when the coefficient of variation of the permeability coefficient of the core wall increases from 1.46 to 2.03, the maximum, mean, and coefficient of variation of the hydraulic gradient at the feature points of the core wall all show an increase, but the increase is relatively small. Specifically, the maximum hydraulic gradient at point PA increased from 2.0 to 2.2, the coefficient of variation increased from 0.11 to 0.13, and the mean increased from 1.70 to 1.75. In addition, due to the coupling relationship between the seepage characteristics of the core wall and the cut-off wall, the random distribution characteristics of the hydraulic gradient at the feature points of the main and secondary cut-off walls also change accordingly with the coefficient of variation of the core wall permeability coefficient. When the coefficient of variation of the core wall permeability coefficient increases to 2.03, the maximum hydraulic gradient of the core wall increases to 2.3, as shown at Point PB in Figure 20b.
The research highlights the critical importance of precise permeability control in core walls and cut-off walls for effective seepage management in dam engineering. Therefore, in the design and construction of high core rockfill dams, quality control of anti-seepage structures (i.e., the core wall and the cut-off walls) must be prioritized. This will mitigate the adverse effects of spatial variability in permeability parameters of multi-component materials on the seepage characteristics of the dam–foundation system, ultimately ensuring the operational safety of the dam. Similarly, for some buildings built on complex foundations [50], the impact of the spatial variability of material parameters on their seepage and stability safety cannot be ignored. The research results of this article have important reference significance for the safety assessment of such projects.

5. Conclusions

The spatial variability characteristics of the permeability coefficient of the core wall are investigated based on the statistically analyzing relevant engineering test data. Using random field simulation techniques and non-intrusive finite element methods, the influence mechanism of the spatial variability of the permeability coefficients of various material zones in high core wall rockfill dams on the seepage characteristics is revealed.
The simulation analysis of multi-scheme stochastic seepage fields reveals significant differences in the influence of the spatial variability of permeability coefficients in various material zones on the seepage characteristics of the dam–foundation system:
(1)
The spatial variability of permeability coefficients in the rockfill, the overburden, and the curtain shows relatively minor impacts on the seepage.
(2)
The spatial variability of permeability coefficients in the core wall and the cut-off walls significantly affects the seepage characteristics of the dam–foundation system, including the enhanced discreteness of the hydraulic gradient in the anti-seepage structures and an increased difference in the water head between the main and secondary cut-off walls, which is not conducive to the coordinated anti-seepage of the main and secondary cut-off walls.
(3)
Notably, the permeability characteristics of the core wall and the cut-off walls demonstrate distinct coupling behaviors, indicating their interdependent hydraulic relationship.
During the long-term operation of high core rockfill dams, the material parameters of the dam are affected by environmental loads, water loads, and other factors, and exhibit time-varying characteristics. In this study, the time-varying characteristics of the permeability coefficient have not been taken into account. When analyzing the seepage problem of the practical engineering projects, it is recommended to invert the permeability coefficient through monitoring data to obtain the true permeability coefficient, so as to make the research results more valuable for engineering applications.

Author Contributions

Conceptualization, Q.G., X.L. (Xiang Lu) and X.L. (Xiaolian Liu); Methodology, Q.G., X.L. (Xiang Lu) and J.C.; Formal analysis, X.L. (Xiaolian Liu); Resources, X.L. (Xiaolian Liu) and J.C.; Writing—original draft, Q.G.; Writing—review & editing, X.L. (Xiang Lu); Supervision, J.C.; Project administration, Q.G.; Funding acquisition, X.L. (Xiang Lu). All authors have read and agreed to the published version of the manuscript.

Funding

This research was supported by the Fundamental Research Program of Shanxi Province (202203021212133) and the Natural Science Foundation of Sichuan Province (2025ZNSFSC0414).

Data Availability Statement

The original contributions presented in this study are included in the article. Further inquiries can be directed to the corresponding author.

Conflicts of Interest

The authors declare that they have no known competing financial interests or personal relationships that could have appeared to influence the work reported in this paper.

References

  1. Nourani, V.; Ojaghi, A.; Zhang, Y. Saturated and unsaturated seepage analysis of earth-fill dams using fractal hydraulic conductivity function and its verification. J. Hydrol. 2022, 612, 128302. [Google Scholar] [CrossRef]
  2. Zhao, L.; Zhang, H.; Mao, J.; Guan, G. Numerical simulation of the bubbling phenomenon ahead of the dam using a two-phase seepage free surface model. Comput. Geotech. 2023, 155, 105239. [Google Scholar] [CrossRef]
  3. Nan, S.; Ren, J.; Ma, Z.; Kang, J.; Sui, J. Inversion of the seepage parameters of earth/rockfill dams considering the coupling effect of seepage and thermal transfer. Comput. Geotech. 2024, 165, 105882. [Google Scholar]
  4. Wang, R.; Zhao, Y.; Qi, Y.; Sun, Z. Study on the changing law of three-dimensional electric field during the evolution of seepage field in earth and rock embankment dams. Measurement 2025, 239, 115483. [Google Scholar] [CrossRef]
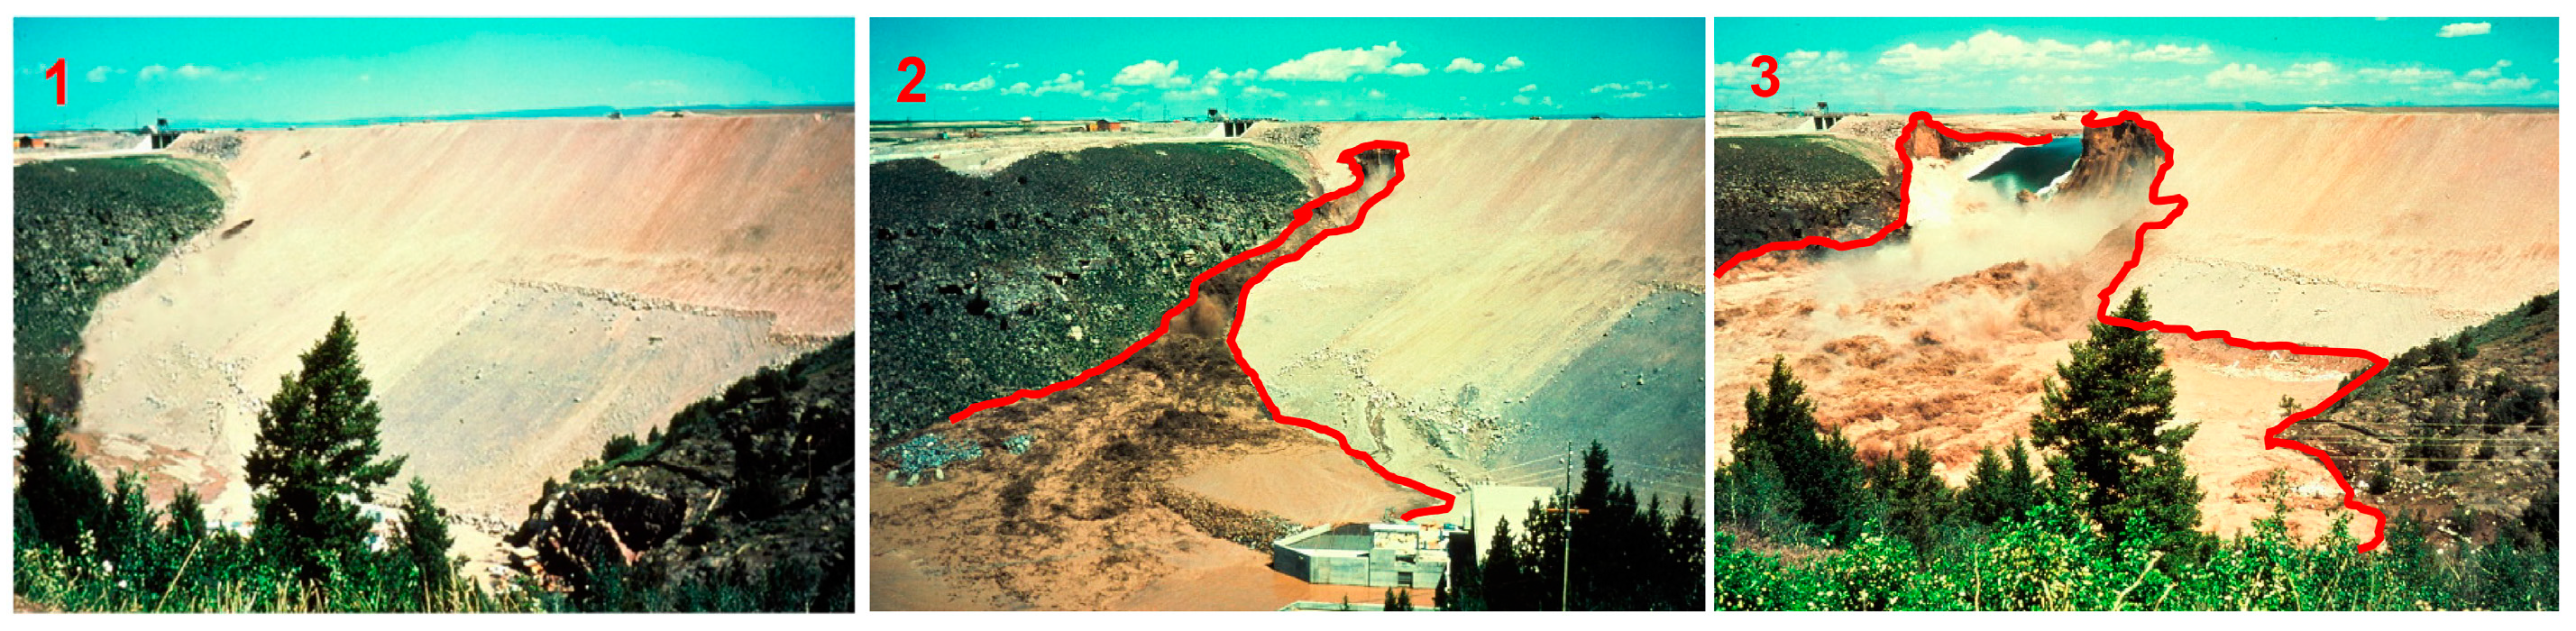
  5. Zhang, X.; Wang, C.; Wong, H.; Jiang, T.; Dong, J. Modeling dam deformation in the early stage of internal seepage erosion—Application to the Teton Dam, Idaho, before the 1976 incident. J. Hydrol. 2022, 605, 127378. [Google Scholar] [CrossRef]
  6. Yang, X.; Xu, Z.; Chai, J.; Qin, Y.; Cao, J. Numerical investigation of the seepage mechanism and characteristics of soil-structure interface by CFD-DEM coupling method. Comput. Geotech. 2023, 159, 105430. [Google Scholar]
  7. Guo, X.; Dias, D.; Carvajal, C.; Peyras, L.; Breul, P. Modelling and comparison of different types of random fields: Case of a real earth dam. Eng. Comput. 2022, 38, 4529–4543. [Google Scholar]
  8. Li, Y.; Liu, H.; Wen, L.; Xu, Z.; Zhang, Y. Reliability analysis of high core rockfill dam against seepage failure considering spatial variability of hydraulic parameters. Acta. Geotech. 2024, 19, 4091–4106. [Google Scholar] [CrossRef]
  9. Yu, X.; Li, Z.; Wang, Y.; Pang, R.; Lv, X.; Fu, M. Stress-deformation analysis of concrete anti-seepage structure in earth-rock dam on overburden considering spatial variability of geomechanical parameter. Probabilistic Eng. Mech. 2023, 79, 103725. [Google Scholar] [CrossRef]
  10. Guo, X.; Dias, D.; Pan, Q. Probabilistic stability analysis of an embankment dam considering soil spatial variability. Comput. Geotech. 2019, 113, 103093. [Google Scholar] [CrossRef]
  11. Li, J.; Wu, Z.; Chen, J.; Lu, X.; Li, Z. FEM-Bayesian Kriging method for deformation field estimation of earth dams with limited monitoring data. Comput. Geotech. 2022, 148, 104782. [Google Scholar]
  12. Ran, L.; Yang, J.; Zhang, P.; Wang, J.; Ma, C.; Cui, C.; Cheng, L.; Wang, J.; Zhou, M. A hybrid monitoring model of rockfill dams considering the spatial variability of rockfill materials and a method for determining the monitoring indexes. J. Civ. Struct. Health Monit. 2022, 12, 817–832. [Google Scholar]
  13. Li, Y.; Hicks, M.; Vardon, P. Uncertainty reduction and sampling efficiency in slope designs using 3D conditional random fields. Comput. Geotech. 2016, 79, 159–172. [Google Scholar]
  14. Yang, Z.; Ching, J. Simulation of three-dimensional random field conditioning on incomplete site data. Eng. Geol. 2021, 281, 105987. [Google Scholar]
  15. Wu, L. Preliminary analysis of elastic modulus stochastic field’s effect on concrete dam stress. Yunnan Water Power 2002, 18, 79–81. [Google Scholar]
  16. Chen, H.; Liu, D. Stochastic finite element analysis of rockfill dam considering spatial variability of dam material porosity. Eng. Comput. 2019, 36, 2929–2959. [Google Scholar]
  17. Chi, S.; Feng, W.; Jia, Y.; Zhang, Z. Stochastic finite-element analysis of earth-rockfill dams considering the spatial variability of soil parameters. Int. J. Geomech. 2022, 22, 04022224. [Google Scholar]
  18. Mouyeaux, A.; Carvajal, C.; Bressolette, P.; Peyras, L.; Breul, P.; Bacconnet, C. Probabilistic analysis of pore water pressures of an earth dam using a random finite element approach based on field data. Eng. Geol. 2019, 259, 105190. [Google Scholar] [CrossRef]
  19. Tan, X.; Wang, X.; Khoshnevisan, S.; Hou, X.; Zha, F. Seepage analysis of earth dams considering spatial variability of hydraulic parameters. Eng. Geol. 2017, 228, 260–269. [Google Scholar]
  20. Xu, M.; Pang, R.; Zhou, Y.; Xu, B. Seepage safety evaluation of high earth-rockfill dams considering spatial variability of hydraulic parameters via subset simulation. J. Hydrol. 2023, 626, 130261. [Google Scholar]
  21. Chi, F.; Breul, P.; Carvajal, C.; Peyras, L. Stochastic seepage analysis in embankment dams using different types of random fields. Comput. Geotech. 2023, 162, 105689. [Google Scholar]
  22. Li, J.; Chen, C.; Wu, Z.; Chen, J. Multi-source data-driven unsaturated seepage parameter inversion: Application to a high core rockfill dam. J. Hydrol. 2023, 617, 129171. [Google Scholar]
  23. Huang, Z.; Shen, Z.; Xu, L.; Sun, Y.; Li, H.; Liu, D. Seepage characteristics of core rockfill dam foundation with double cutoff walls in deep overburden: A case study. Case Stud. Constr. Mater. 2023, 21, e03576. [Google Scholar]
  24. Wu, Z.; Chen, C.; Zheng, Y.; Chen, J.; Bian, K.; Li, J. Analysis of seepage failure probability for high core rockfill dams during rapid drawdown of reservoir water level. J. Hydrol. 2024, 633, 131046. [Google Scholar] [CrossRef]
  25. Xu, M.; Zhou, Y.; Pang, R.; Xu, B.; Zhang, Y. A novel finite element limit equilibrium method and its application in instability analysis for 3-D high core rockfill dams. Structures 2024, 68, 107066. [Google Scholar]
  26. Xiang, Z.; Yu, S.; Wang, X. Modeling the hydraulic fracturing processes in shale formations using a meshless method. Water 2024, 16, 1855. [Google Scholar] [CrossRef]
  27. Hariri-Ardebili, M.; Seyed-Kolbadi, S.; Saouma, V.; Salamon, J.; Rajagopalan, B. Random finite element method for the seismic analysis of gravity dams. Eng. Struct. 2018, 171, 405–420. [Google Scholar]
  28. Lu, X.; Wu, Z.; Pei, L.; He, K.; Chen, J.; Li, Z.; Yang, Z. Effect of the spatial variability of strength parameters on the dynamic damage characteristics of gravity dams. Eng. Struct. 2019, 183, 281–289. [Google Scholar]
  29. Metya, S.; Bhattacharya, G. Accounting for 2D spatial variation in slope reliability analysis. Int. J. Geomech. 2020, 20, 04019190. [Google Scholar]
  30. Jiang, S.; Huang, J.; Griffiths, D.; Deng, Z.-P. Advances in reliability and risk analyses of slopes in spatially variable soils: A state-of-the-art review. Comput. Geotech. 2022, 141, 104498. [Google Scholar]
  31. Lu, X.; Pei, L.; Chen, J.; Wu, Z.; Li, Z. Comparison of homogenous and random fields of tensile strength effects on the nonlinear dynamical response of Guandi concrete gravity dams under strong earthquake waves. Struct. Infrastruct. Eng. 2021, 17, 1684–1697. [Google Scholar]
  32. Li, K.S.; Lumb, P. Probabilistic design of slopes. Can. Geotech. J. 1987, 24, 520–535. [Google Scholar]
  33. Li, Z.; Wu, Z.; Chen, J.; Pei, L.; Lu, X. Fuzzy seismic fragility analysis of gravity dams considering spatial variability of material parameters. Soil Dyn. Earthq. Eng. 2021, 140, 106439. [Google Scholar]
  34. Dang, V.; Ha Mac, V.; Huh, J.; Kwak, K.; Park, J.H. Response surface method-based efficient approach for the load and resistance factors calibration of breakwater foundation considering soil spatial variability. Appl. Ocean Res. 2024, 151, 104160. [Google Scholar]
  35. Jiang, S.; Hu, H.; Wang, Z. Improved Bayesian model updating of geomaterial parameters for slope reliability assessment considering spatial variability. Struct. Saf. 2025, 112, 102536. [Google Scholar] [CrossRef]
  36. Jiang, S.; Huang, J.; Yao, C.; Yang, J. Quantitative risk assessment of slope failure in 2-D spatially variable soils by limit equilibrium method. Appl. Math. Model. 2017, 47, 710–725. [Google Scholar]
  37. Vanmareke, E.H. Probability modeling of soil profile. J. Geotech. Eng. Div. 1977, 103, 1227–1245. [Google Scholar]
  38. Daneshkhah, A.; Remesan, R.; Chatrabgoun, O.; Holman, I.P. Probabilistic modeling of flood characterizations with parametric and minimum information pair-copula model. J. Hydrol. 2016, 540, 469–487. [Google Scholar] [CrossRef]
  39. Qi, W. ABAQUS 6.14 Super Learning Manual; Posts & Telecom Press: Beijing, China, 2016. [Google Scholar]
  40. Li, Z.; Wu, Z.; Chen, J.; Lu, X.; Pei, L.; Chen, C. Effect of correlated random fields on nonlinear dynamic responses of gravity dam. Nat. Hazards 2021, 106, 79–96. [Google Scholar]
  41. Hu, W.; Chen, X.; Lin, J.; Kuang, L. In-situ drilling tests of seepage in gravel soil core wall during the first impoundment in Pubugou hydropower station. Rock Soil Mech. 2013, 34, 1259–1263+1273. [Google Scholar]
  42. El-Ramly, H.; Morgenstern, N.R.; Cruden, D.M. Probabilistic stability analysis of a tailings dyke on presheared clay-shale. Can. Geotech. J. 2003, 40, 192–208. [Google Scholar]
  43. Phoon, K.K.; Kulhawy, F.H. Characterization of geotechnical variability. Can. Geotech. J. 1999, 36, 612–624. [Google Scholar]
  44. Ran, C.; Zhou, Z.; Pei, L.; Lu, X.; Gong, B.; He, K. A method for evaluating systematic risk in dams with random field theory. Appl. Sci. 2024, 14, 4349. [Google Scholar] [CrossRef]
  45. Jie, F. Spatial Variability of Streambed Hydraulic Conductivity in Yurungqash River. Master’s Thesis, Xinjiang University, Urumqi, China, 2018. [Google Scholar]
  46. Zhao, J. Spatial Variability of Streambed Hydraulic Conductivity in Golmud River. Master’s Thesis, Chang’an University, Xi’an, China, 2014. [Google Scholar]
  47. Zhou, Q. Anti-seepage treatment technology of lower reservoir dam foundation of Yangjiang Pumped Storage Power Station. Guangdong Water Resour. Hydropower 2023, 12, 63–68. [Google Scholar]
  48. Guo, Q. Method of Safety Risk Analysis for the Anti-Seepage System in High Core Rockfill Dams. Ph.D. Thesis, Sichuan University, Chengdu, China, 2020. [Google Scholar]
  49. Brunetti, G.; Maiolo, M.; Fallico, C.; Severino, G. Unraveling the complexities of a highly heterogeneous aquifer under convergent radial flow conditions. Eng. Comput. 2024, 40, 3115–3130. [Google Scholar] [CrossRef]
  50. Brunetti, G.; Bevacqua, M.; Maiolo, M.; Amisano, M. Optimizing the Reuse of Building Demolition Materials for Coastal Dunes Reestablishment. In Numerical Computations: Theory and Algorithms (NUMTA 2023); Sergeyev, Y.D., Kvasov, D.E., Astorino, A., Eds.; Springer: Cham, Switzerland, 2025; Lecture Notes in Computer Science; Volume 14477, pp. 184–191. [Google Scholar]
Figure 1. The seepage failure process of the Teton Dam.
Water 17 01064 g001
Figure 2. Technique process of random field for spatial variability of permeability coefficient in rockfill dams.
Water 17 01064 g002
Figure 3. Relationship between variance reduction coefficient and distance. (a) Γ 2 ( i ) ~ i ; (b) Δ Z Γ 2 ( Δ Z ) ~ Δ Z .
Water 17 01064 g003
Figure 4. Simulation process of seepage in earth rock dams considering spatial variability of permeability coefficient.
Water 17 01064 g004
Figure 5. Generalized model of a high core rockfill dam.
Water 17 01064 g005
Figure 6. Distribution of permeability coefficient along elevation in the core wall of the Pubugou Dam.
Water 17 01064 g006
Figure 7. The relationship curve between Δ Z Γ 2 ( Δ Z ) and Δ Z .
Water 17 01064 g007
Figure 8. Results of Case 0. (a) One random field of permeability coefficient, (b) Pore water pressure, (c) Head of water, and (d) Hydraulic gradient.
Water 17 01064 g008
Figure 9. Results of Case 1. (a) One random field of permeability coefficient, (b) Pore water pressure, (c) Head of water, and (d) Hydraulic gradient.
Water 17 01064 g009
Figure 10. Results of Case 2. (a) One random field of permeability coefficient, (b) Pore water pressure, (c) Head of water, and (d) Hydraulic gradient.
Water 17 01064 g010
Figure 11. Results of Case 3. (a) One random field of permeability coefficient, (b) Pore water pressure, (c) Head of water, and (d) Hydraulic gradient.
Water 17 01064 g011
Figure 12. Results of Case 4. (A) Random field 1. (B) Random field 2. (a) One random field of permeability coefficient, (b) Pore water pressure, (c) Head of water, and (d) Hydraulic gradient.
Water 17 01064 g012aWater 17 01064 g012b
Figure 13. Results of Case 5. (A) Random field 1. (B) Random field 2. (a) One random field of permeability coefficient, (b) Pore water pressure, (c) Head of water, and (d) Hydraulic gradient.
Water 17 01064 g013
Figure 14. Results of Case 6. (a) One random field of permeability coefficient, (b) Pore water pressure, (c) Head of water, and (d) Hydraulic gradient.
Water 17 01064 g014
Figure 15. Results of Case 7. (a) One random field of permeability coefficient, (b) Pore water pressure, (c) Head of water, and (d) Hydraulic gradient.
Water 17 01064 g015
Figure 16. Schematic diagram of feature point position in core wall and cut-off wall.
Water 17 01064 g016
Figure 17. Hydraulic gradient of feature points in the core wall.
Water 17 01064 g017
Figure 18. Hydraulic gradient of feature points in the cut-off wall.
Water 17 01064 g018
Figure 19. Probability distribution of hydraulic gradient in different positions of the core wall and the cut-off wall (Case 7).
Water 17 01064 g019
Figure 20. Hydraulic gradient of feature points in the core wall and cut-off walls under different coefficients of variation of the permeability coefficient. (a) Core wall. (b) Cut-off wall.
Water 17 01064 g020
Table 1. Permeability coefficients of the model.
Permeability
Coefficients
Core WallCut-Off WallRockfillOverburdenCurtainBedrock
Mean (cm/s) 3.40 × 10 - 5 2 . 77 × 10 - 7 1.20 × 10 - 1 5 . 74 × 10 - 3 1 . 0 × 10 - 5 3 . 0 × 10 - 5
Coefficient of variation1.720.860.921.480.98/
δ h (m)45.01.2120.015763.0/
δ v (m)1.571.04.02.05.0/
Table 2. Calculation experiment scheme.
Material ZoningRockfillOverburdenCurtainCut-Off WallCore Wall
Homogeneity scheme: Case 0
Spatial variability schemeCase 1
Case 2
Case 3
Case 4
Case 5
Case 6
Case 7
Note: √ represents the permeability coefficient in the corresponding zoning considering the spatial variability; 〇 represents the permeability coefficient in the corresponding zoning without considering the spatial variability.
Disclaimer/Publisher’s Note: The statements, opinions and data contained in all publications are solely those of the individual author(s) and contributor(s) and not of MDPI and/or the editor(s). MDPI and/or the editor(s) disclaim responsibility for any injury to people or property resulting from any ideas, methods, instructions or products referred to in the content.

