Article

Realistic Environmental Exposure of Microplastics in European Flat Oyster, Ostrea edulis: Evaluation of Accumulation and Depuration Under Controlled Conditions and Molecular Assessment of a Set of Reference Genes

1
Istituto Zooprofilattico Sperimentale dell’Abruzzo e Molise (IZSAM), 64100 Teramo, Italy
2
Istituto per lo Studio degli Impatti Antropici e Sostenibilità in Ambiente Marino (IAS-CNR)—Località Sa Mardini, 09170 Torregrande, Italy
*
Author to whom correspondence should be addressed.
Water 2025, 17(7), 1063; https://doi.org/10.3390/w17071063
Submission received: 14 February 2025 / Revised: 31 March 2025 / Accepted: 1 April 2025 / Published: 3 April 2025
(This article belongs to the Special Issue Microplastics Pollution in Aquatic Environments)

Abstract

:
Marine plastic waste represents, in recent decades, a major threat to the environment, as plastics degrade into microplastics (MPs) that a wide range of organisms ingest. Filter-feeding taxa, including bivalves, serve as indicators of environmental contamination due to their ingestion of MPs. This study investigated (a) the bioaccumulation and depuration capacities of Ostrea edulis exposed to MPs and (b) the identification of reference genes for assessing stress responses in bivalves under MP exposure. The experimental protocol comprised a 28-day exposure to MPs followed by a 7-day depuration period. The mean concentration of accumulated MPs was 5.31 ± 0.86 particles/g, comprising filaments (79%), beads (19%), and fragments (2%). Depuration reduced MP concentrations by 69% after 24 h and by an additional 23% after 120 h. In conclusion, a two-day depuration period significantly reduced MPs in oysters intended for human consumption. Additionally, the molecular analysis identified EF-1α, GAPDH, and L5 as stable reference markers for MPs exposure experiments, supporting the development of a monitoring toolkit for MPs in marine environments.

1. Introduction

Global plastic production continues to rise and may reach 33 billion tonnes by 2050 [1,2]. Urban runoff and maritime activities, including fishing, introduce plastic waste into the marine environments [3]. The sharp increase in plastic pollution ranks among the most pressing environmental challenges in recent decades [4]. Plastic waste degrades into microplastics (MPs), particles smaller than 5 mm [4,5], which disperse through ecosystems and infiltrate food chains [6,7,8,9,10].
Filter-feeding organisms, such as bivalves, accidentally or intentionally ingest MPs while drawing seawater through their gills due to their small size and their close resemblance to natural food [11]. As they reflect environmental conditions [12,13], bivalves serve as bioindicators of environmental pollution and are an integral part of monitoring programs such as the Mussel Watch Program [14] and the Joint Assessment and Monitoring Program [15].
Studies show a direct correlation between MP concentrations in marine environments and their accumulation in bivalves [12,16,17,18]. Once ingested, MPs are transferred through the trophic chain, posing risks to food safety and human health. Researchers [19,20,21,22] have linked MPs to genotoxicity, cytotoxicity in human peripheral blood lymphocytes [23], oxidative stress, endocrine disruption, and toxicity in gastrointestinal, hepatic, and neuronal systems [24]. Studies on oysters report MP-induced oxidative stress [25,26,27], metabolic dysfunction [2,28,29,30], reproductive toxicity [28], and impaired larval development [31].
Among bivalves, oysters, found worldwide, hold commercial value as seafood [29,30,32]. Their sessile nature, high filtration rate, and wide distribution increase their susceptibility to MP accumulation [27,33]. Depuration, a process that removes contaminants, enhances food safety. Standard methods include relaying oysters in treated seawater and applying ozone, ultraviolet light, or other purification techniques [34,35]. The European Union mandates depuration for shellfish intended for human consumption to mitigate pathogen-related health risks, such as fecal bacteria [36].
This study assesses depuration efficacy in reducing MP levels in mollusks [37,38,39,40,41,42]. Research on MP accumulation and depuration in Ostrea edulis remains limited [37,41,43,44,45,46,47]. This study addresses this gap by exposing bivalves to controlled MP concentrations. Previous studies [40,48,49,50] have often used uniform microplastic particles, which do not represent the diversity found in marine environments. Here, we used (i) a mixture of MPs types (filaments, fragments, and beads) commonly found in the marine environment and (ii) aged MPs covered in biofilms to simulate natural conditions and enhance the resemblance to food particles [51].
Furthermore, this research evaluated used a qPCR analysis to evaluate a set of potential target genes to be used as a reference in the marine environment in response to prolonged microplastic exposure in bivalves.

2. Materials and Methods

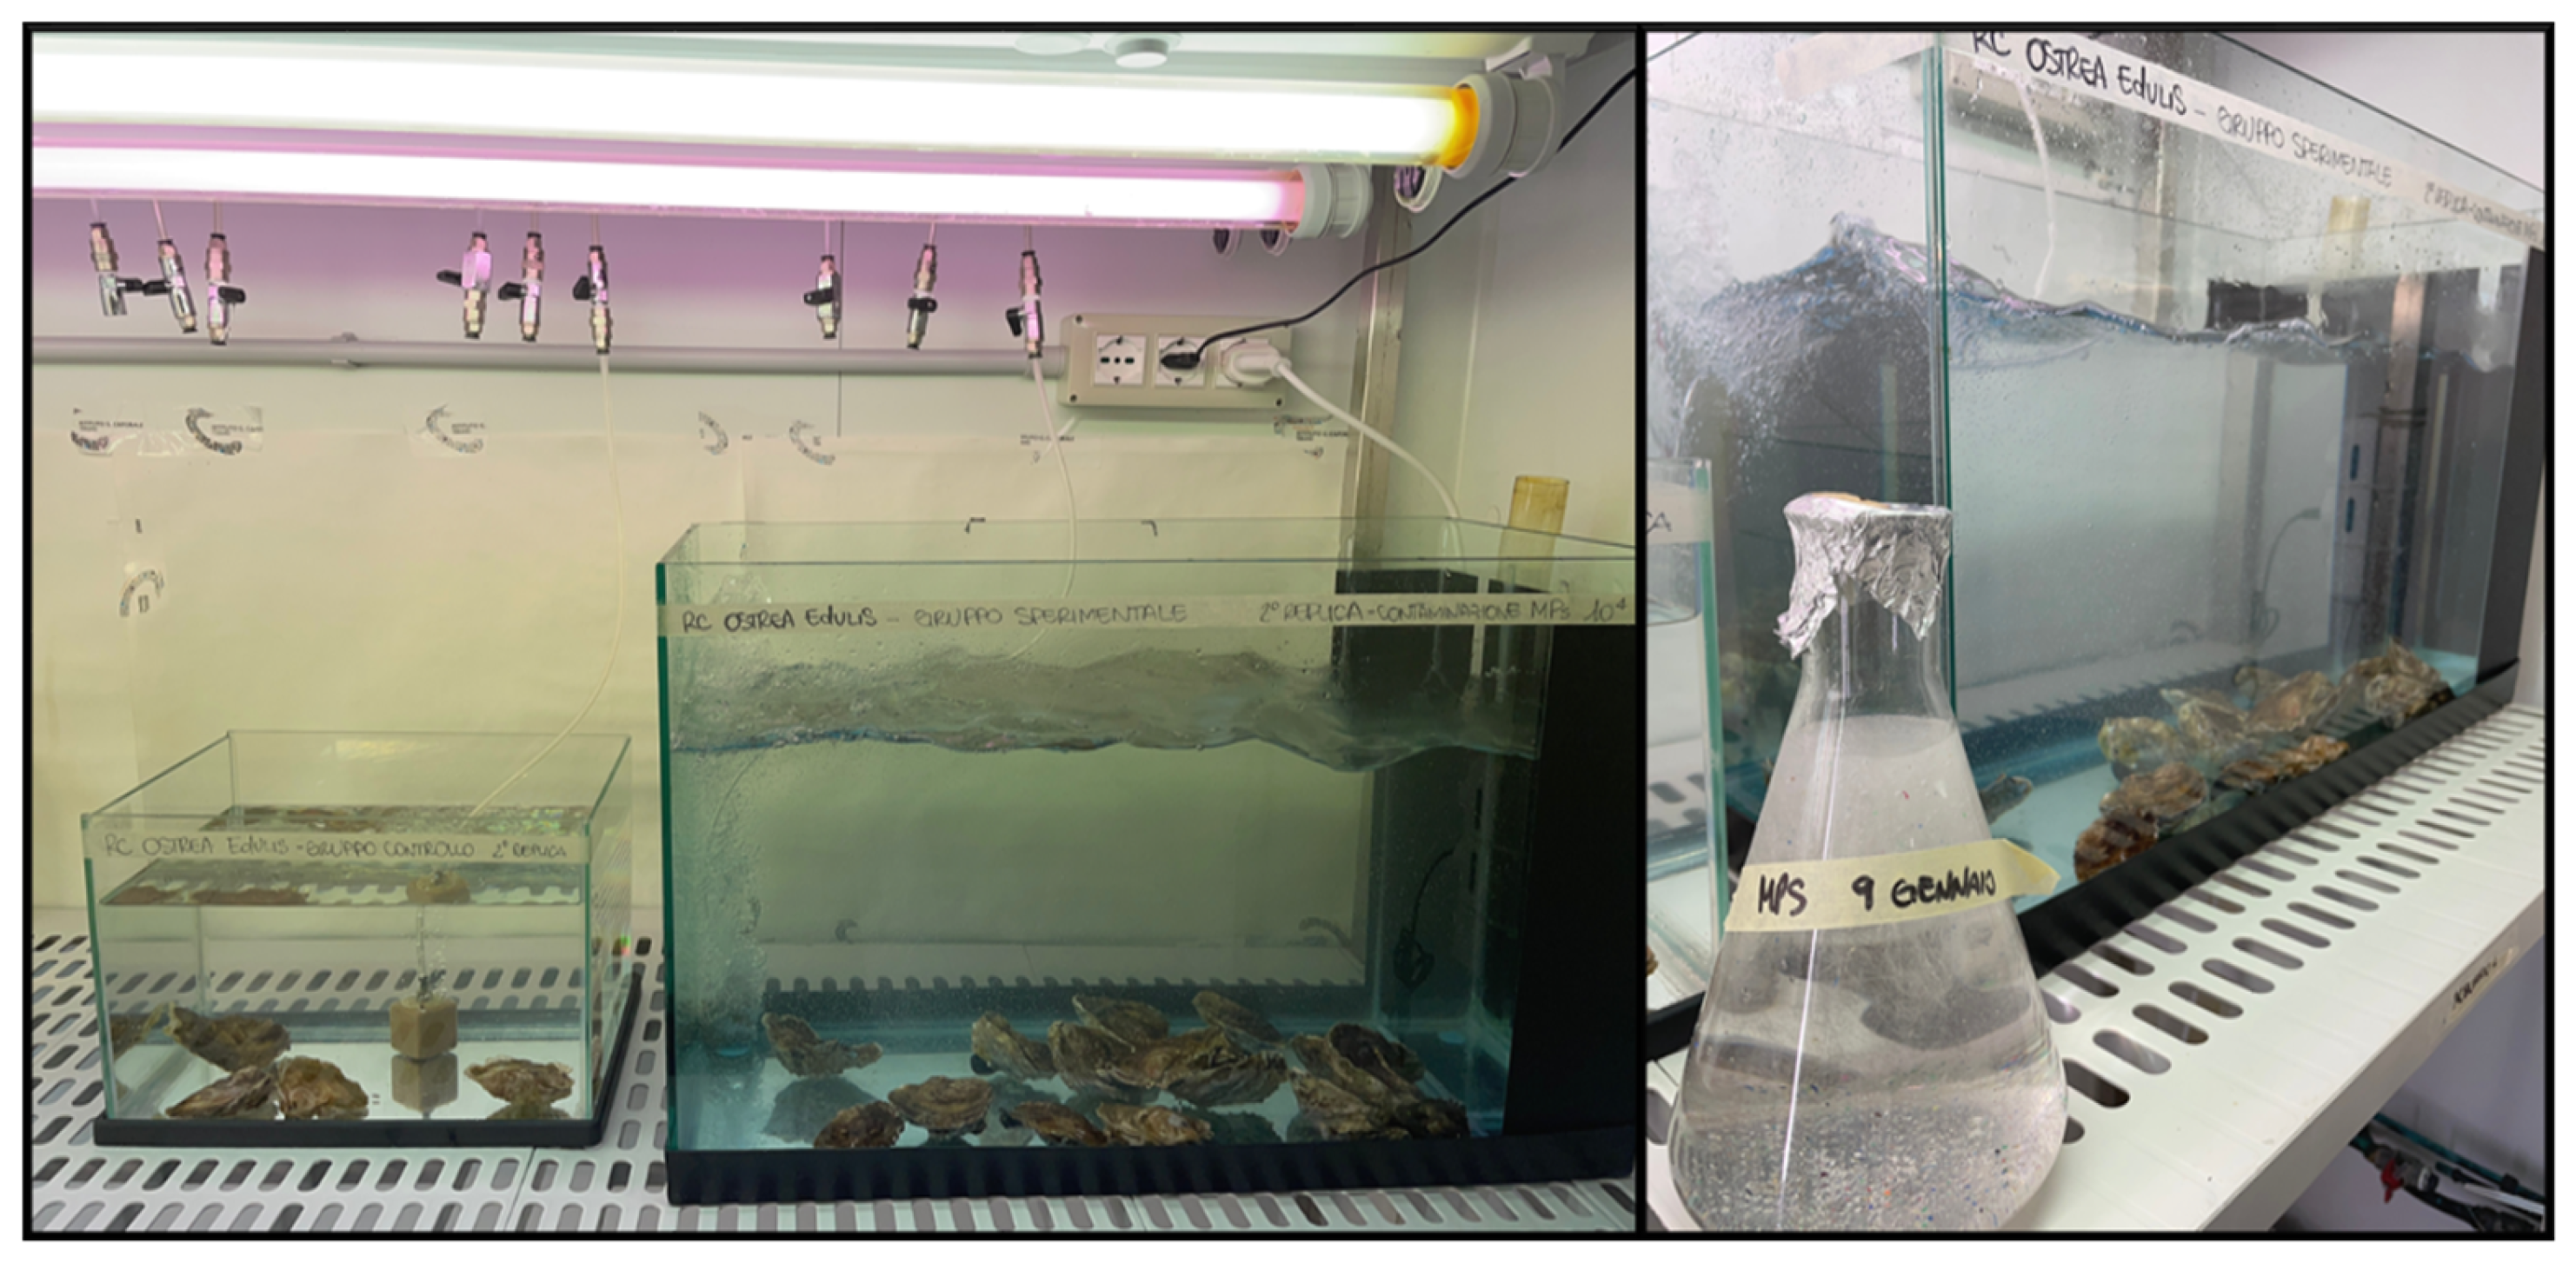
2.1. Ostrea Edulis and Experimental Set-Up

Local fishermen collected three replicates of wild adult flat oysters (Ostrea edulis, 20 per replicate) from natural banks along the coastal area in Termoli (CB, Italy). After collection, the oysters were washed with seawater to remove external silt and transported to the laboratory. Upon arrival, oysters were measured, and biometric parameters, such as length, width, thickness, and weight, were recorded. All individuals met commercial size standards (5.0–8.0 cm). Oysters were then placed in two glass aquariums: a 50 L experimental tank and a 10 L control tank. Both contained filtered synthetic seawater (Instant Ocean®; 0.8 mm membrane filter, Supor® 800). Oysters underwent a 15-day acclimation under controlled conditions: temperature 18 ± 1 °C, salinity 32–35‰, dissolved oxygen ≥ 80%, pH 7.5–8.5, and a 12 h:12 h photoperiod (Figure 1).
Each aquarium included a porous stone connected to an aerator for continuous oxygenation of the organisms. Water parameters, including temperature, salinity, dissolved oxygen, and pH, were monitored daily using a portable multimeter (Hach Lange HQ2200, Lainate, MI, Italy). The physico-chemical parameters of water were kept constant by daily water replacement.
Oysters were fed daily with mass cultures of Isochrysis galbana and Diacronema lutheri at a daily dose equal to 2–3% of their dry weight [52]. Microalgae were cultivated using the succession technique. Certified original strains from the CCAP-Culture Collection of Algae and Protozoa (Scotland) were subcultured by inoculating 25 mL of algal strain into 50 mL of F2-Guillard mediumcontaining 0.2 µm-filtered seawater supplemented with phosphates, nitrates, silicates, and micronutrients (trace metals and vitamins).
Primary cultures were maintained at 18 ± 1 °C in a thermostatic chamber under continuous artificial light (3000 lux) until an algal density of 2.8 × 10⁶ cells/mL was reached. The multiplication phase consisted of four sequential transfers, progressively increasing the culture volumes from 250 mL to 10 L. The final production culture for oyster feeding was prepared in 150 L containers. Throughout the growth phase, researchers monitored the algae concentration before each transfer using a Bürker counting chamber (VWR, Milano, Italy).

2.2. MPs’ Preparation and Ageing

Three types of MPs were used for the exposure phase of Ostrea edulis specimens: polystyrene (EPS) beads with a diameter of 100 and 200 µm, polypropylene (PP) filaments with a size range from 50 to 4000 µm, and polyethylene terephthalate (PET) fragments with a size range from 2 to 300 µm.
Filaments and fragments came as by-products of industrial processes and, therefore, did not come with a certificate of analysis related to their concentration. To determine this parameter, we carried out 10 separate measurements of 1 mg of particles using an analytical balance (B154 College, Mettler Toledo, Milano Italy) and then counted them under a stereomicroscope. On the other hand, the beads were purchased from a commercial company (ChromoSphere Dry Dyed Polymer Particles; ThermoScientific, Waltham, MA, USA), and therefore came with a certificate of analysis indicating the concentration.
After determining the concentration of the three types of microplastics (200 filaments/g, 300 fragments/g, and 2.2 × 10⁶ beads/g), 1 L stock suspensions of the mixture of the three polymers were prepared in glass bottles.
The concentration used was 1 × 10⁴ particles/L, which is the most frequently found in marine environments, according to some authors [28,53].
The ratio of the three main types of MPs used for the contamination (52% filaments, 29% fragments, and 3% beads) reflects the actual presence in the seawater column, according to [54]. The remaining percentage represents a small proportion of other particle morphologies, including films, foams, and others.
The solutions were prepared in seawater previously filtered through nylon mesh filters with a porosity of 60 µm and a diameter of 47 mm in order to remove plankton and larger debris. These suspensions were incubated in an oscillating system in the dark at 18 ± 1 °C for three weeks to allow biofilm formation [51]. To prevent polymer aggregation and adhesion to the bottle walls, the surfactant Tween-80 (0.00001% v/v in seawater) was added to MPs stock solution [55].
At the end of the ageing period, 1 L of the prepared MPs stock solution was added daily after each water change (50 L experimental tank) for 28 days to maintain a final concentration of 1 × 10⁴ MPs’ particles/L.

2.3. MPs’ Exposure and Accumulation Phase

The experiment took place in two phases: (i) the exposure of Ostrea edulis specimens to MPs’ particles for 28 days and (ii) the depuration phase lasting a total of 7 days, according to other authors [40,41,44,56].
During the exposure period, the experimental oysters (n = 15) were exposed every 24 h through a daily renewal of seawater and a subsequent addition of MPs’ stock suspension. Throughout the entire exposure period, Ostrea edulis were fed once daily at a ratio equal to 2–3% of their dry weight, and the physico-chemical parameters of pH, dissolved oxygen, salinity, and temperature were monitored daily. The exposure assay lasted for 28 days, and no mortality was observed during exposure.
A control group of 5 oysterswas placed in another glass aquarium under the same conditions as the experimental group.
A subset of oysters was collected weekly (T7, T14, T21, T28) from both the experimental and control groups. The gills and digestive glands of each individual were sectioned, placed in sterile containers, labelled and stored at −80 °C for subsequent gene expression analyses.
Since secondary contamination with airborne particles may occur during the entire experimental period, an environmental blank consisting of MilliQ-filtered water was used.

2.4. Gene Expression

2.4.1. RNA Extraction

A quantity of 50 mg from each organ (i.e., gills or digestive glands) was weighed using an analytical balance and randomly numbered to ensure unbiased analysis. In detail, 3 gill samples and 3 digestive gland samples for each of the 9 treatments (T0, T7-CTRL, T7-MPs, T14-CTRL, T14-MPs, T21-CTRL, T21-MPs, T28-CTRL, T28-MPs) were processed for total RNA extraction using the Quick-RNA Miniprep Plus Kit (Zymo Research, Irvine, CA, USA), with an additional DNase I digestion step to remove any DNA contamination. RNA was then resuspended in 100 μL of DNase/RNase-free water and stored at −80 °C for subsequent gene expression analyses.

2.4.2. cDNA Synthesis

Complementary DNA (cDNA) was synthesised from the extracted RNA using the LunaScript RT SuperMix kit (New England BioLabs, Ipswich, MA, USA). The following thermal profile was used for cDNA synthesis: 25 °C for 2 min, 55 °C for 20 min, and 95 °C for one minute. To standardise the samples, as recommended by [57], total cDNA was quantified using a fluorimeter (FluoSTAR Omega, BMG LABTECH, Ortenberg, Germany), and the same amount for each sample (100 ng) was used for subsequent RT-qPCR analyses.

2.4.3. Gene Expression Analysis

Primers were selected for amplification of the elongation factor 1 alpha EF1-α, 60S ribosomal protein L5, glyceraldehyde 3-phosphate dehydrogenase GAPDH, polyubiquitin Ubiq, and β-actin ACT gene targets, according to [58]. PCR assays for the 5 reference genes were validated by the authors in terms of specificity and efficiency [58]. The primers used are defined as reference genes suitable for real-time PCR analysis for the flat oyster Ostrea edulis, i.e., genes whose expression is defined as stable and little influenced by external factors such as prolonged exposure to stress factors. They are, therefore, used for internal normalization of target gene expression.
qPCR reactions were performed using 5 μL of cDNA in combination with 10 μL of KAPA SYBR® FAST qPCR Master Mix (2X) (Roche, Basel, Switzerland), consisting of a unique mix containing the fluorescent dye SYBR Green I, MgCl2, dNTPs and stabilizers in combination with 0.60 μL of each primer (final concentration 300 nM) and 3.80 μL of nuclease-free water. Reactions were performed on a QuantStudio 7 Flex Real-Time PCR System (Qiagen, Hilden, Germany). The amplification conditions used were as follows: 1 cycle at 95 °C for 20 s, 40 cycles at 95 °C for 1 s, and 60 °C for 20 s. The specificity of the primers was verified with the melting curve having the following conditions: 1 cycle 95 °C for 15 s, 60 °C for 1 min, and 95 °C for 15 s. The negative controls were included together with the samples and the specificity of the primers, and the possible absence of secondary products was confirmed by checking the melting peaks at the end of the reactions.
The cycle threshold (Ct) values, resulting from the qPCR analysis of each gene, were normalized against the Ct values of the most stable reference gene (GAPDH for gills and digestive gland) defined by the RefFinder software calculating the ΔCt value as
ΔCt = Ct (Gene of Interest) − Ct (GAPDH).
Furthermore, for each treatment, ΔCt values were normalized against the ΔCt of the control condition at time 0 (T0), calculating the ΔΔCt value as
ΔΔCt = ΔCt (Treatment) − ΔCt (Control T0).
The 2−ΔΔCt value was then calculated as reported in the literature [59,60].

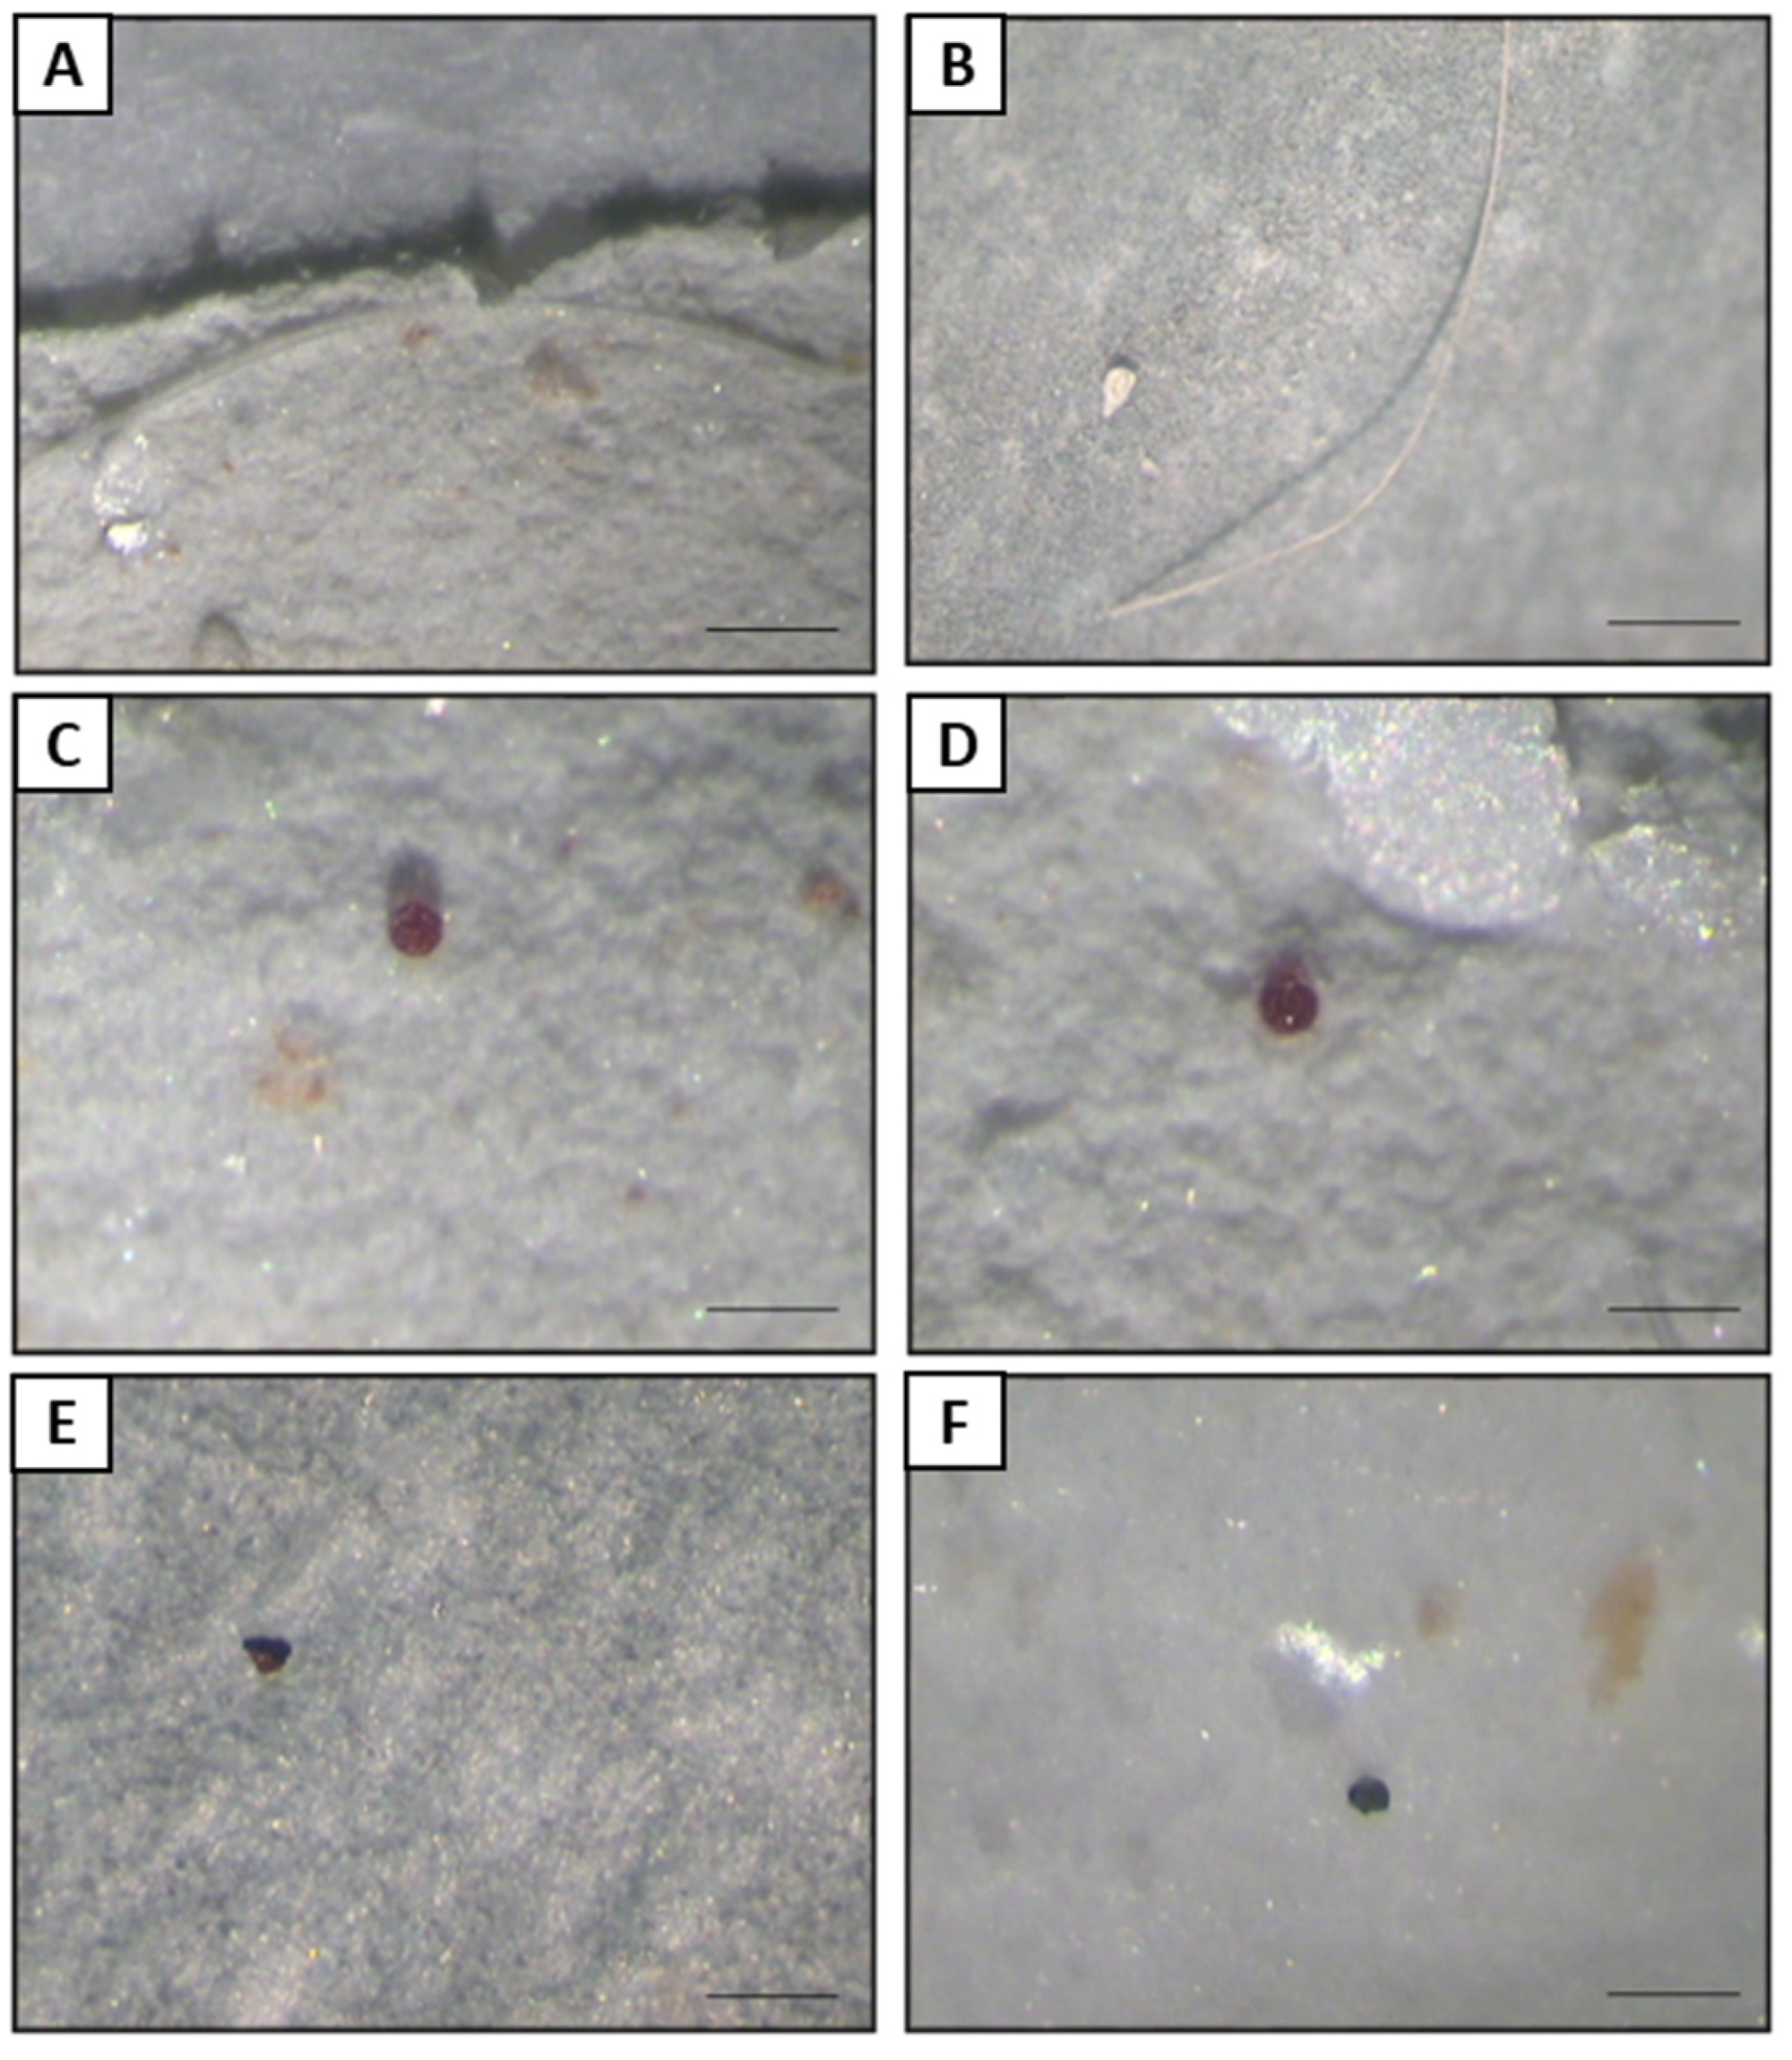
2.5. Depuration, Sample Digestion and Stereomicroscope Analysis

At the end of the 28-day exposure period, the remaining oysters were collected and carefully washedto ensure that no microplastics were adhering to their valves. They were then transferred to a new glass aquarium filled with filtered synthetic seawater and kept under the same experimental conditions (photoperiod 12 h:12 h, temperature 18 ± 1 °C, salinity 32–35‰, dissolved oxygen ≥80%, and pH 7.5–8.5). Finally, one oyster was collected for MPs’ analysis and used as time 0 for the depuration phase (D0).
To assess the presence of MPs, one oyster was collected from the depuration tank, washed, and opened at 24 h intervals for a total of 168 h (7 days). The sampling intervals were identified as D24h, D48h, D72h, D96h, D120h, D144h, and D168h. Soft tissues were removed from the shell and digested with 30% hydrogen peroxide (H2O2) at 60–65 °C for 7 days [61]. The digested material was filtered on a special ramp with the aid of a vacuum pump, using glass microfiber filters with a diameter of 47 mm and a porosity of 2.7 µm (Whatman® glass microfiber filters, Grade GF/D, GE Healthcare, Maidstone, UK). The obtained filters were placed in glass Petri dishes and left to dry for 24 h at room temperature. Subsequently, the collected MPs were counted and categorized using a stereomicroscope (Leika MZ6, Leica Microsystem Ltd., Heerbrugg, Switzerland) (Figure 2). Additional criteria were implemented to enhance the accuracy of MP analysis and to minimise the risk of underestimating MP concentrations, as suggested by [62]. The entire surface of the filter was observed, and each particle found was identified and recorded on a specific worksheet, reporting its type, size, and color. To avoid external contamination, the staff used 100% cotton lab coats and nitrile gloves during the entire course of the analysis. Sample digestion was performed in glass beakers covered with aluminium foil, and filters were stored in glass Petri dishes until stereomicroscope analysis.
For each sampling, three blank samples consisting of 30% H2O2 (m/v) and the resulting filters were analysed under a stereomicroscope to assess the level of external contamination. The average number of the MPs particles for each size, shape, and color counted in the blanks was subtracted from the total number of particles found in samples at corresponding times.
All bioaccumulation and depuration experiments, including biomolecular analyses, were performed in triplicate.

2.6. Statistical Analysis

Statistical analyses of the data obtained were conducted using R v4.2.2 [63] with asignificance threshold of 0.05. Comparison between the three replicates was carried out using the non-parametric Kruskal–Wallis test and, where statistically significant, multiple comparisons were performed in pairs using Dunn’s post hoc test.
Considering MPs/g particles (accumulation, decrease, trend over time by type, and size class), the 95% confidence intervals were calculated using a Bayesian approach applying a beta distribution.
Similarly, the Kruskal–Wallis test and the RefFinder software [64] were used to determine the stability of the genes analysed in the microplastic exposure [65].
Regarding the effect of the two treatments (exposure time, T, and exposure to microplastics, MPs) and their interaction (T*MPs) on the expression of each gene, the non-parametric Scheirer–Ray–Hare test (SRH, rcompanion) [66] was used on the 2−ΔΔCt values after checking the non-normal distribution of the data (Shapiro–Wilk test) and the homogeneity of the variances (Levene test). Dunn’s post hoc test (Benjamini–Hochberg p adjustment) was then used to compare the treatments in the case of significance of the SRH test. Possible outliers were identified using the Grubbs test [67], and sample values with significance α ≥ 0.05 were rejected [68].

3. Results

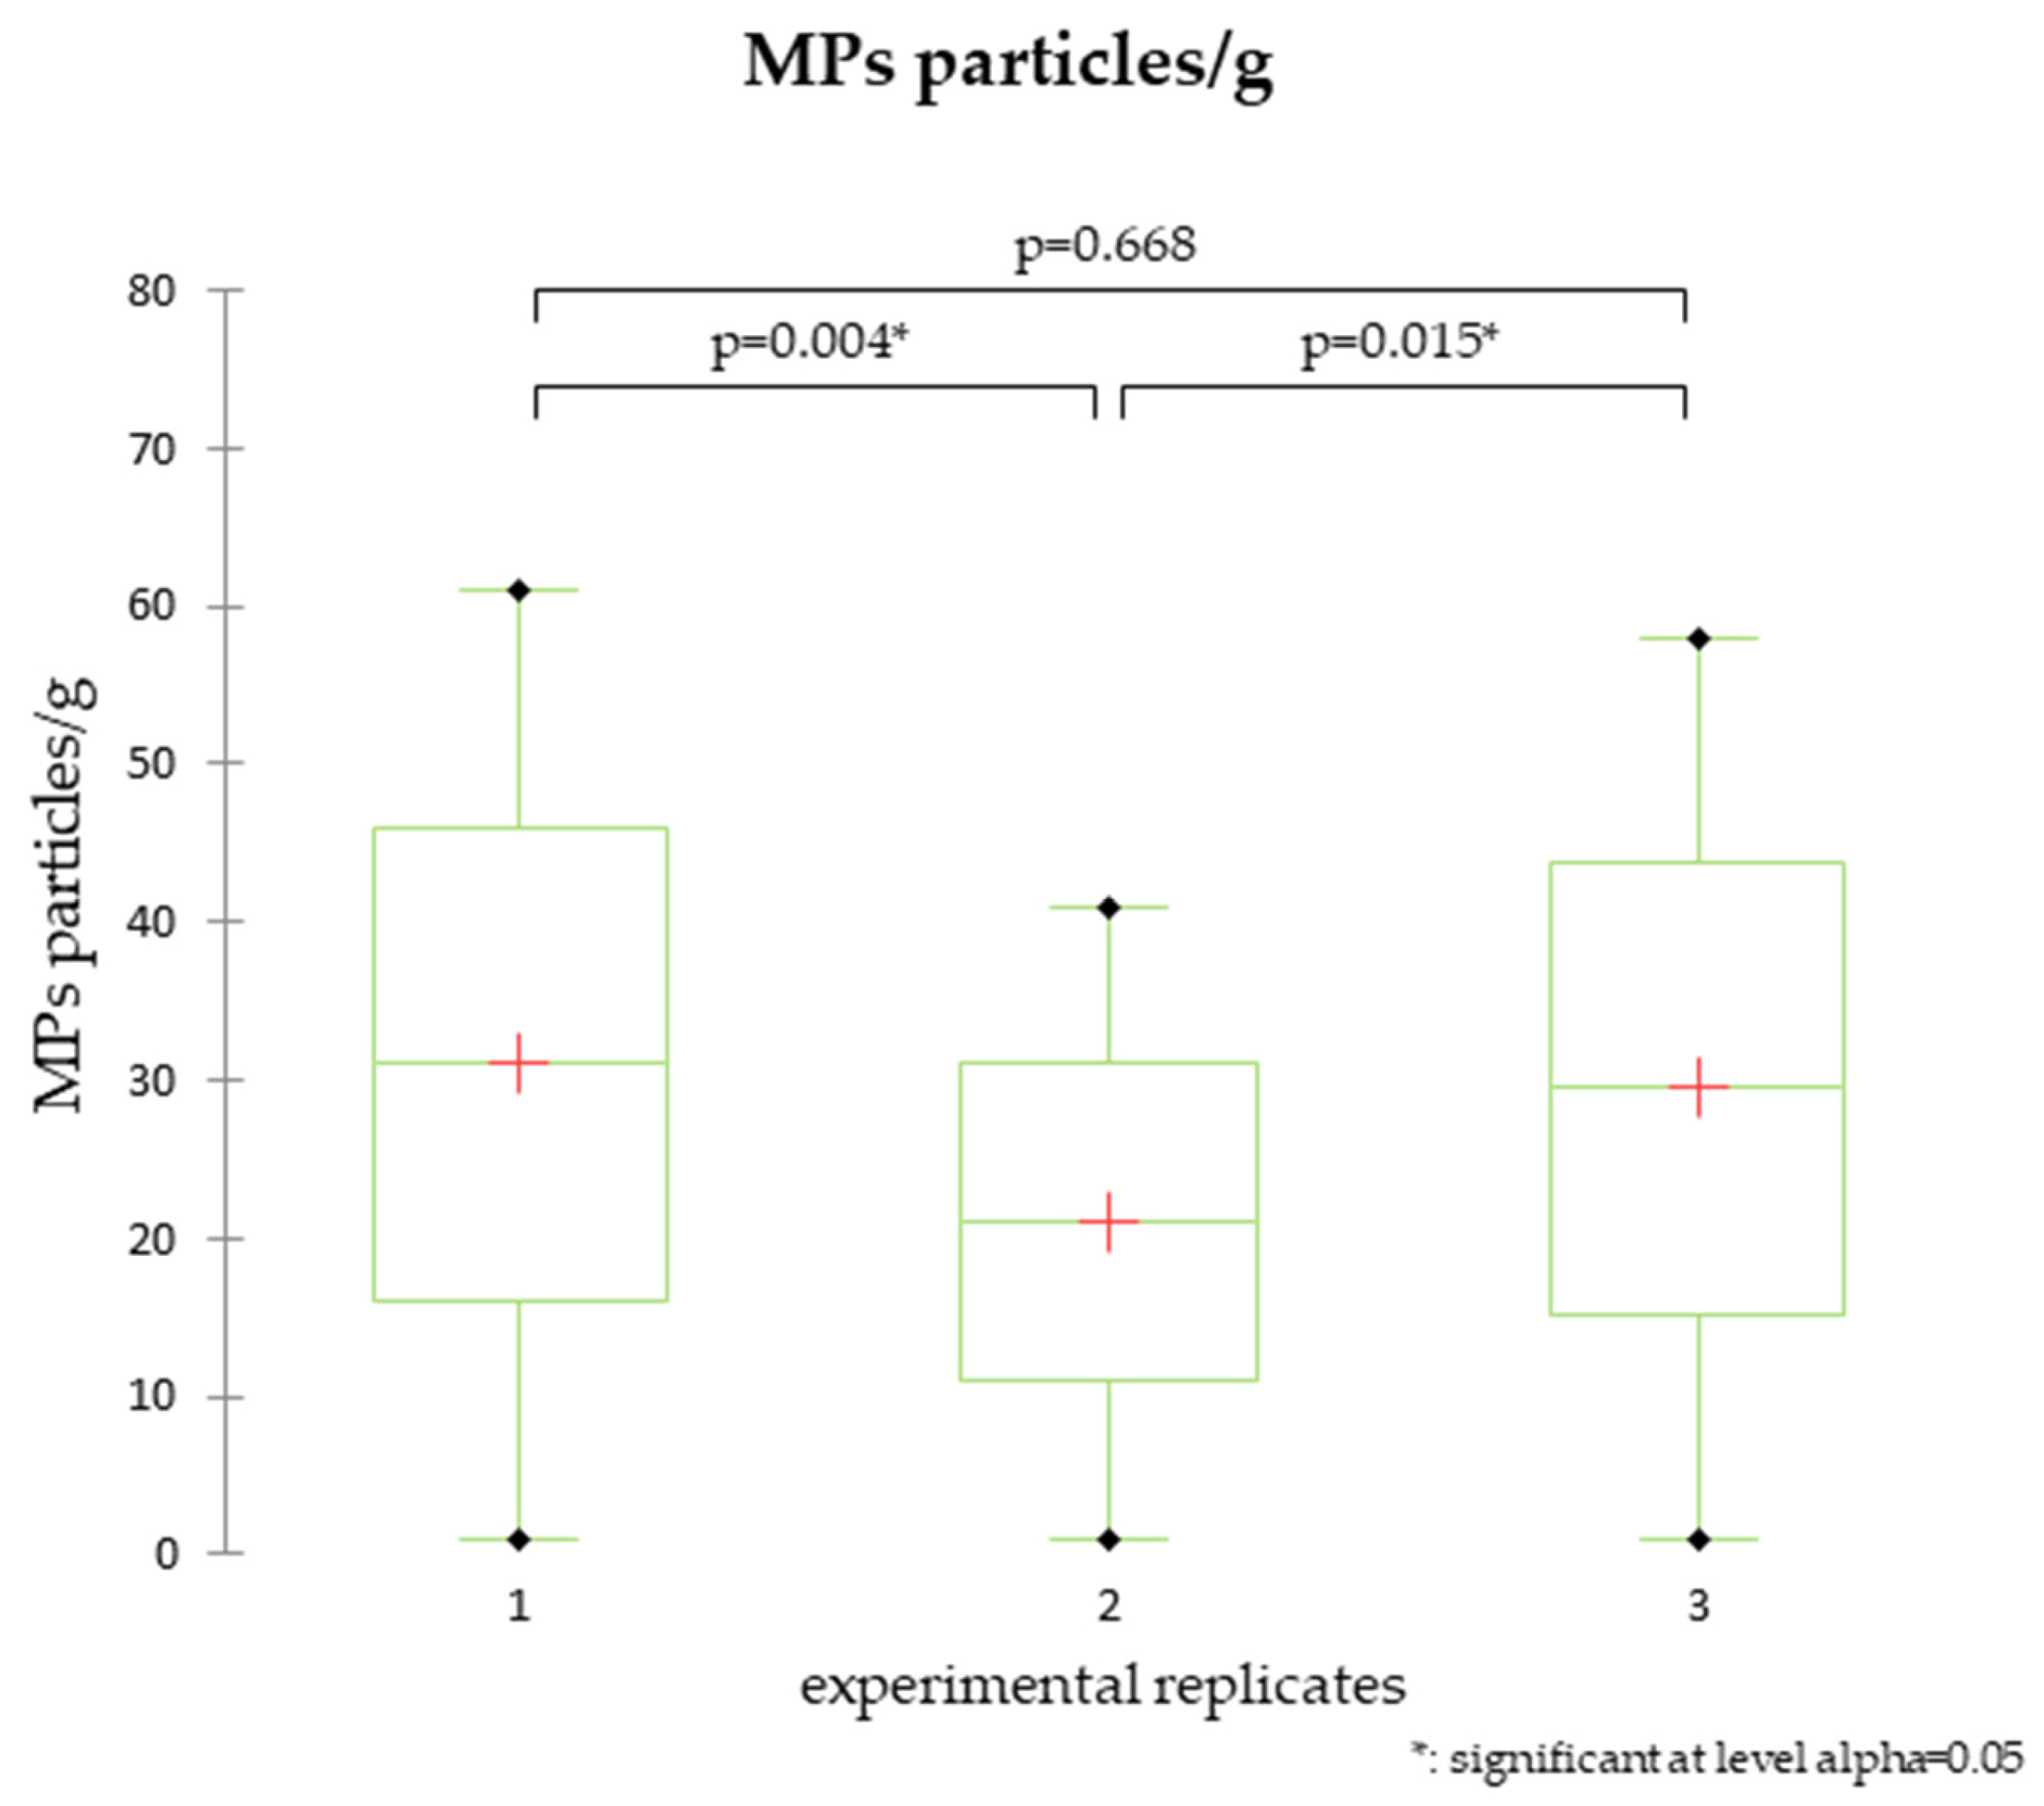
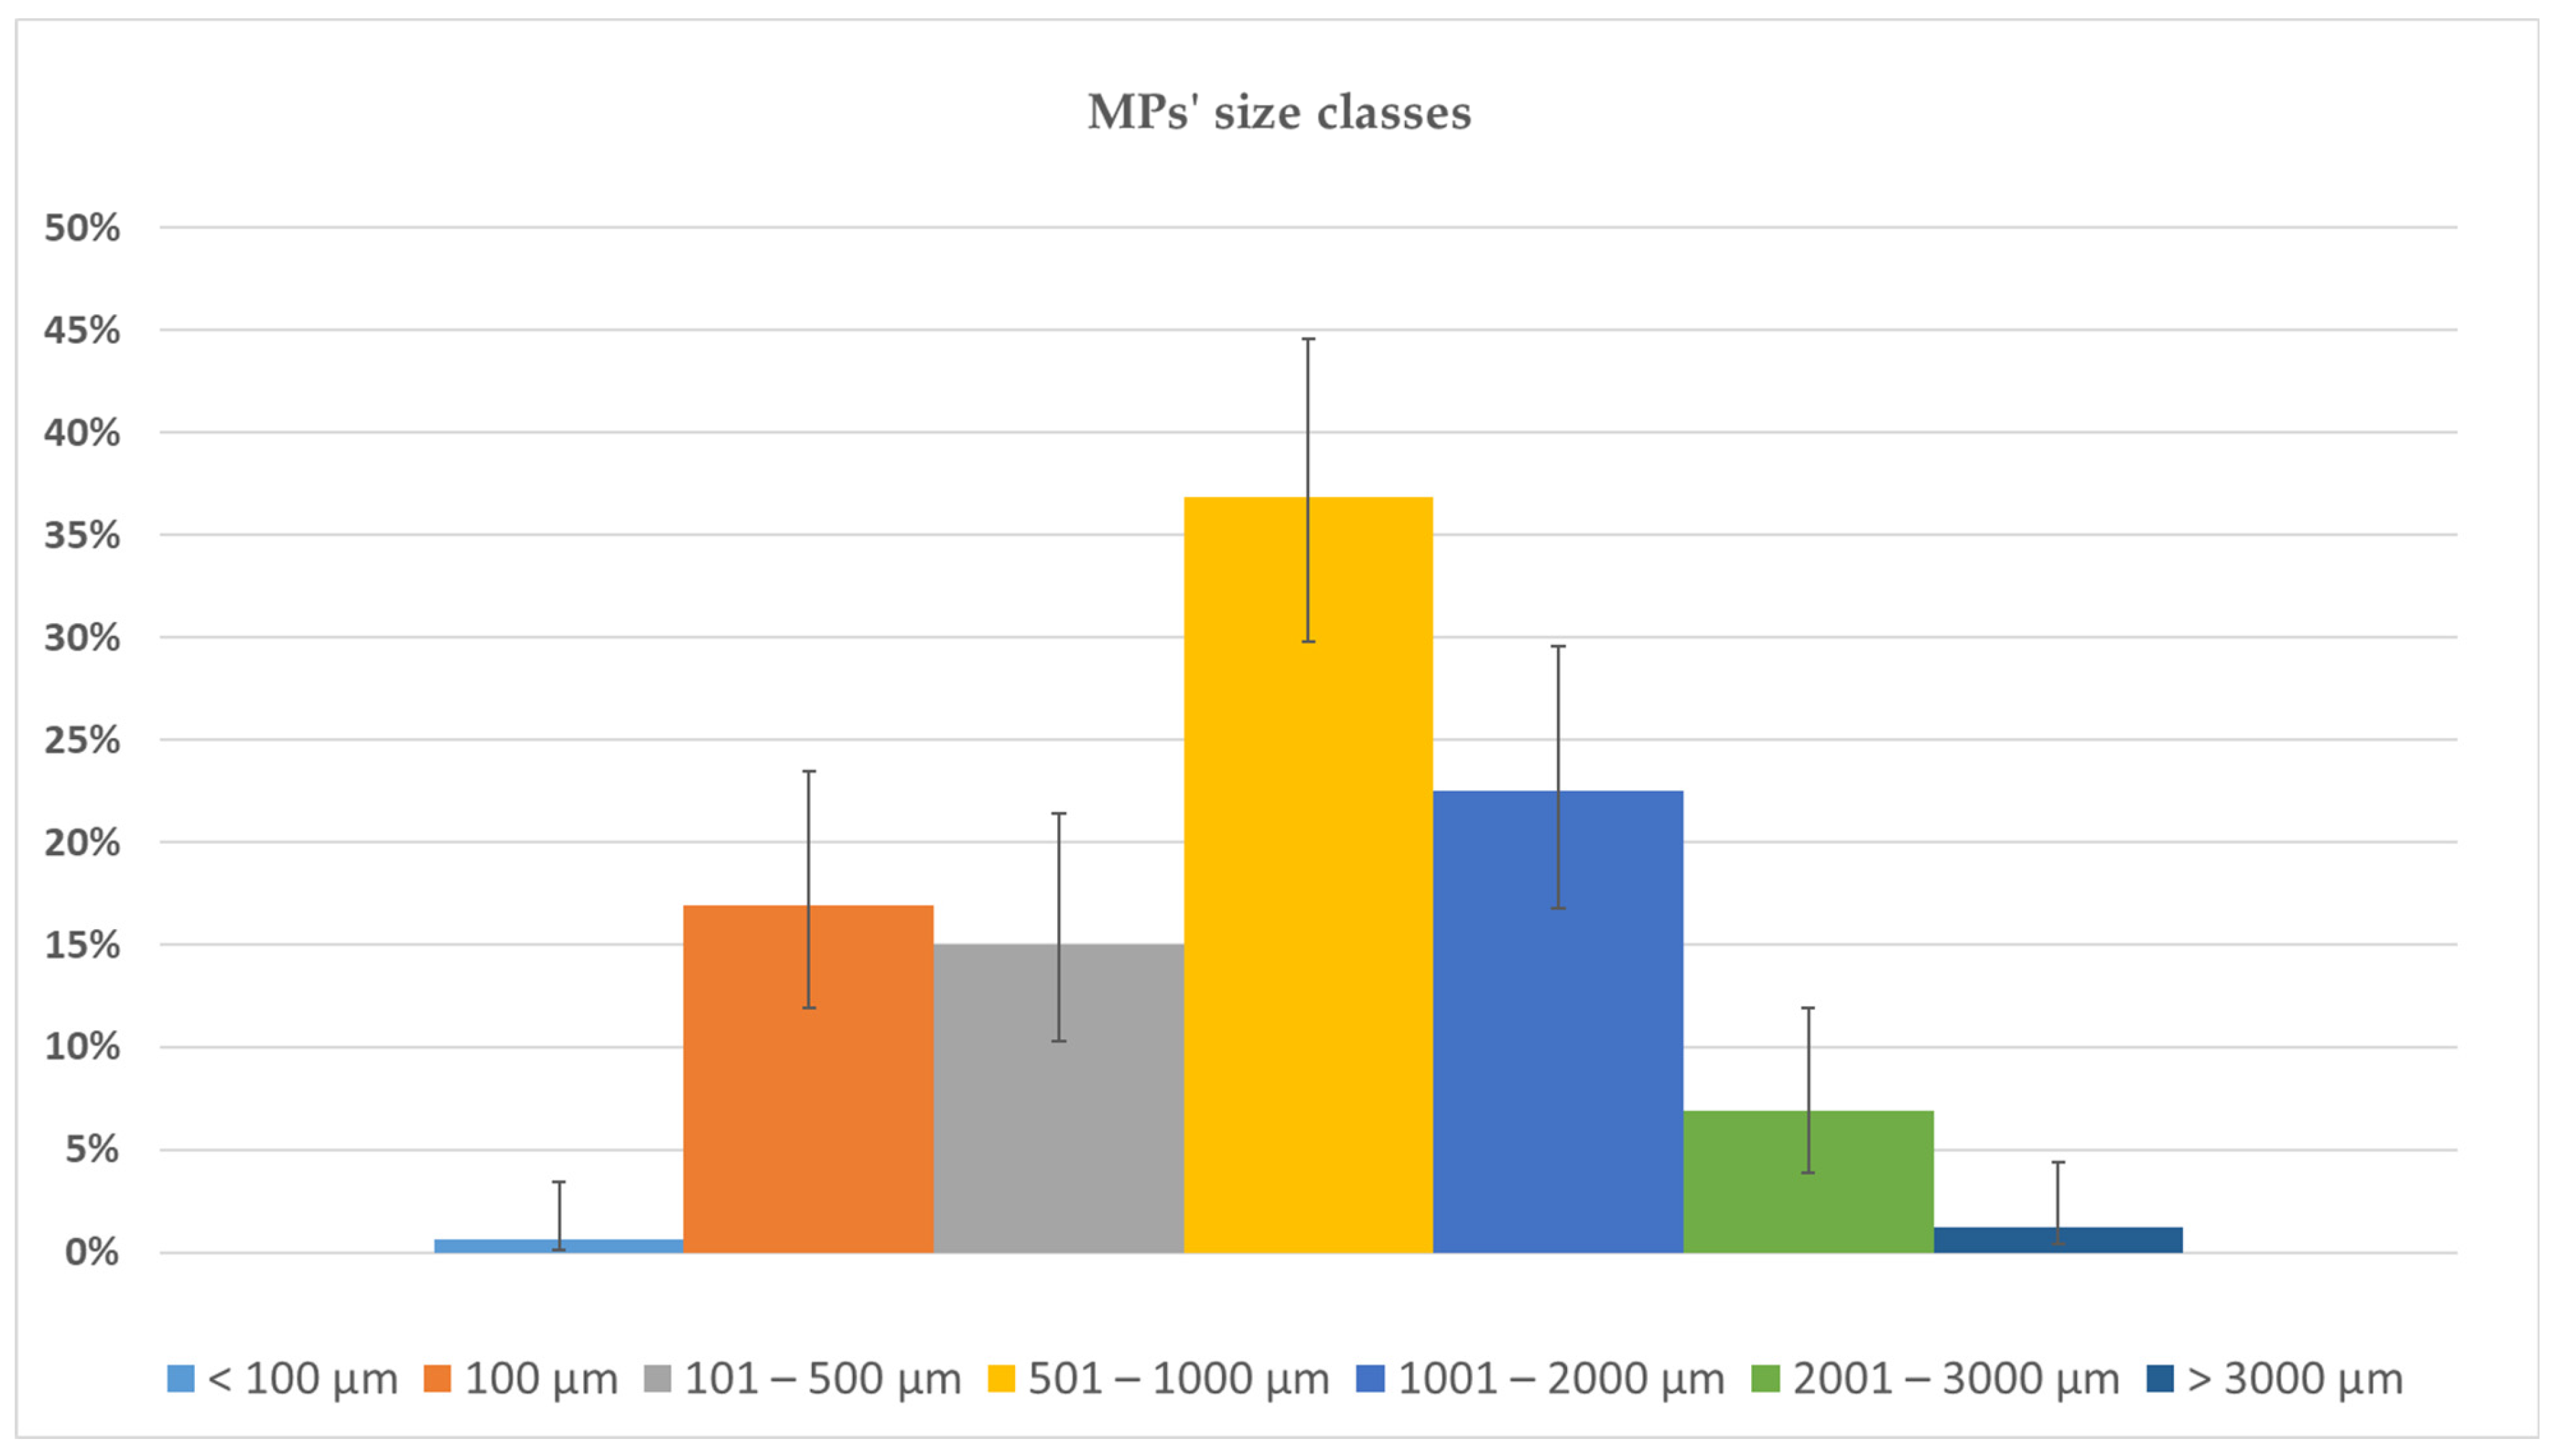
3.1. Bioaccumulation of MPs in Ostrea edulis

Adult specimens of Ostrea edulis with a height of 2.65 ± 0.68 cm, length of 8.7 ± 1.28 cm, width of 7.69 ± 0.99 cm, and wet weight of 11.62 ± 3.29 g (mean ± standard deviation) were used in the study described,.
Analysis of MP counts in flat oysters after 28 days of exposure showed statistically significant differences between replicate 1 vs. replicate 2 (p = 0.004) and replicate 3 vs. replicate 2 (p = 0.015), probably due to the low number of bivalves used in each replicate (Figure 3).
The precautions we used during the experimental period allowed us to consider secondary contamination negligible. Furthermore, within the environmental blank, MPs were found to be different in shape, size class, and colour compared to those used in the contamination phase.
The resultsobtained after the accumulation phase showed that the MPs’ particles, ingested after 28 days of exposure, had an average concentration of 5.31 ± 0.86 MPs particles/g.
The most common types of MPs in bivalves the soft tissue were filaments, which accounted for 79% of the total, followed by beads (19%) and fragments (2%).
There was a significant accumulation of MPs during the exposure phase (36.9% with l.c.l. 16.7% and u.c.l. 29.6%) in the 501–1000 µm size class, followed by 1001–2000 µm (22.5%), 100 µm (17%), 101–500 µm (15%), and 2001–3000 µm (7%). The >3000 µm and <100 µm size classes were the least accumulated (1.3% and 0.6%, respectively) (Figure 4).
Regarding filaments, the most abundant size class in the accumulation phase was 100–1000 µm, with an observed percentage of 61% (l.c.l. 52.4% and u.c.l. 69.2%), followed by the 1001–2000 µm, 2001–3000 µm, and >3000 µm classes (with observed percentages of 29%, 9%, and 2%, respectively) (Figure 5).

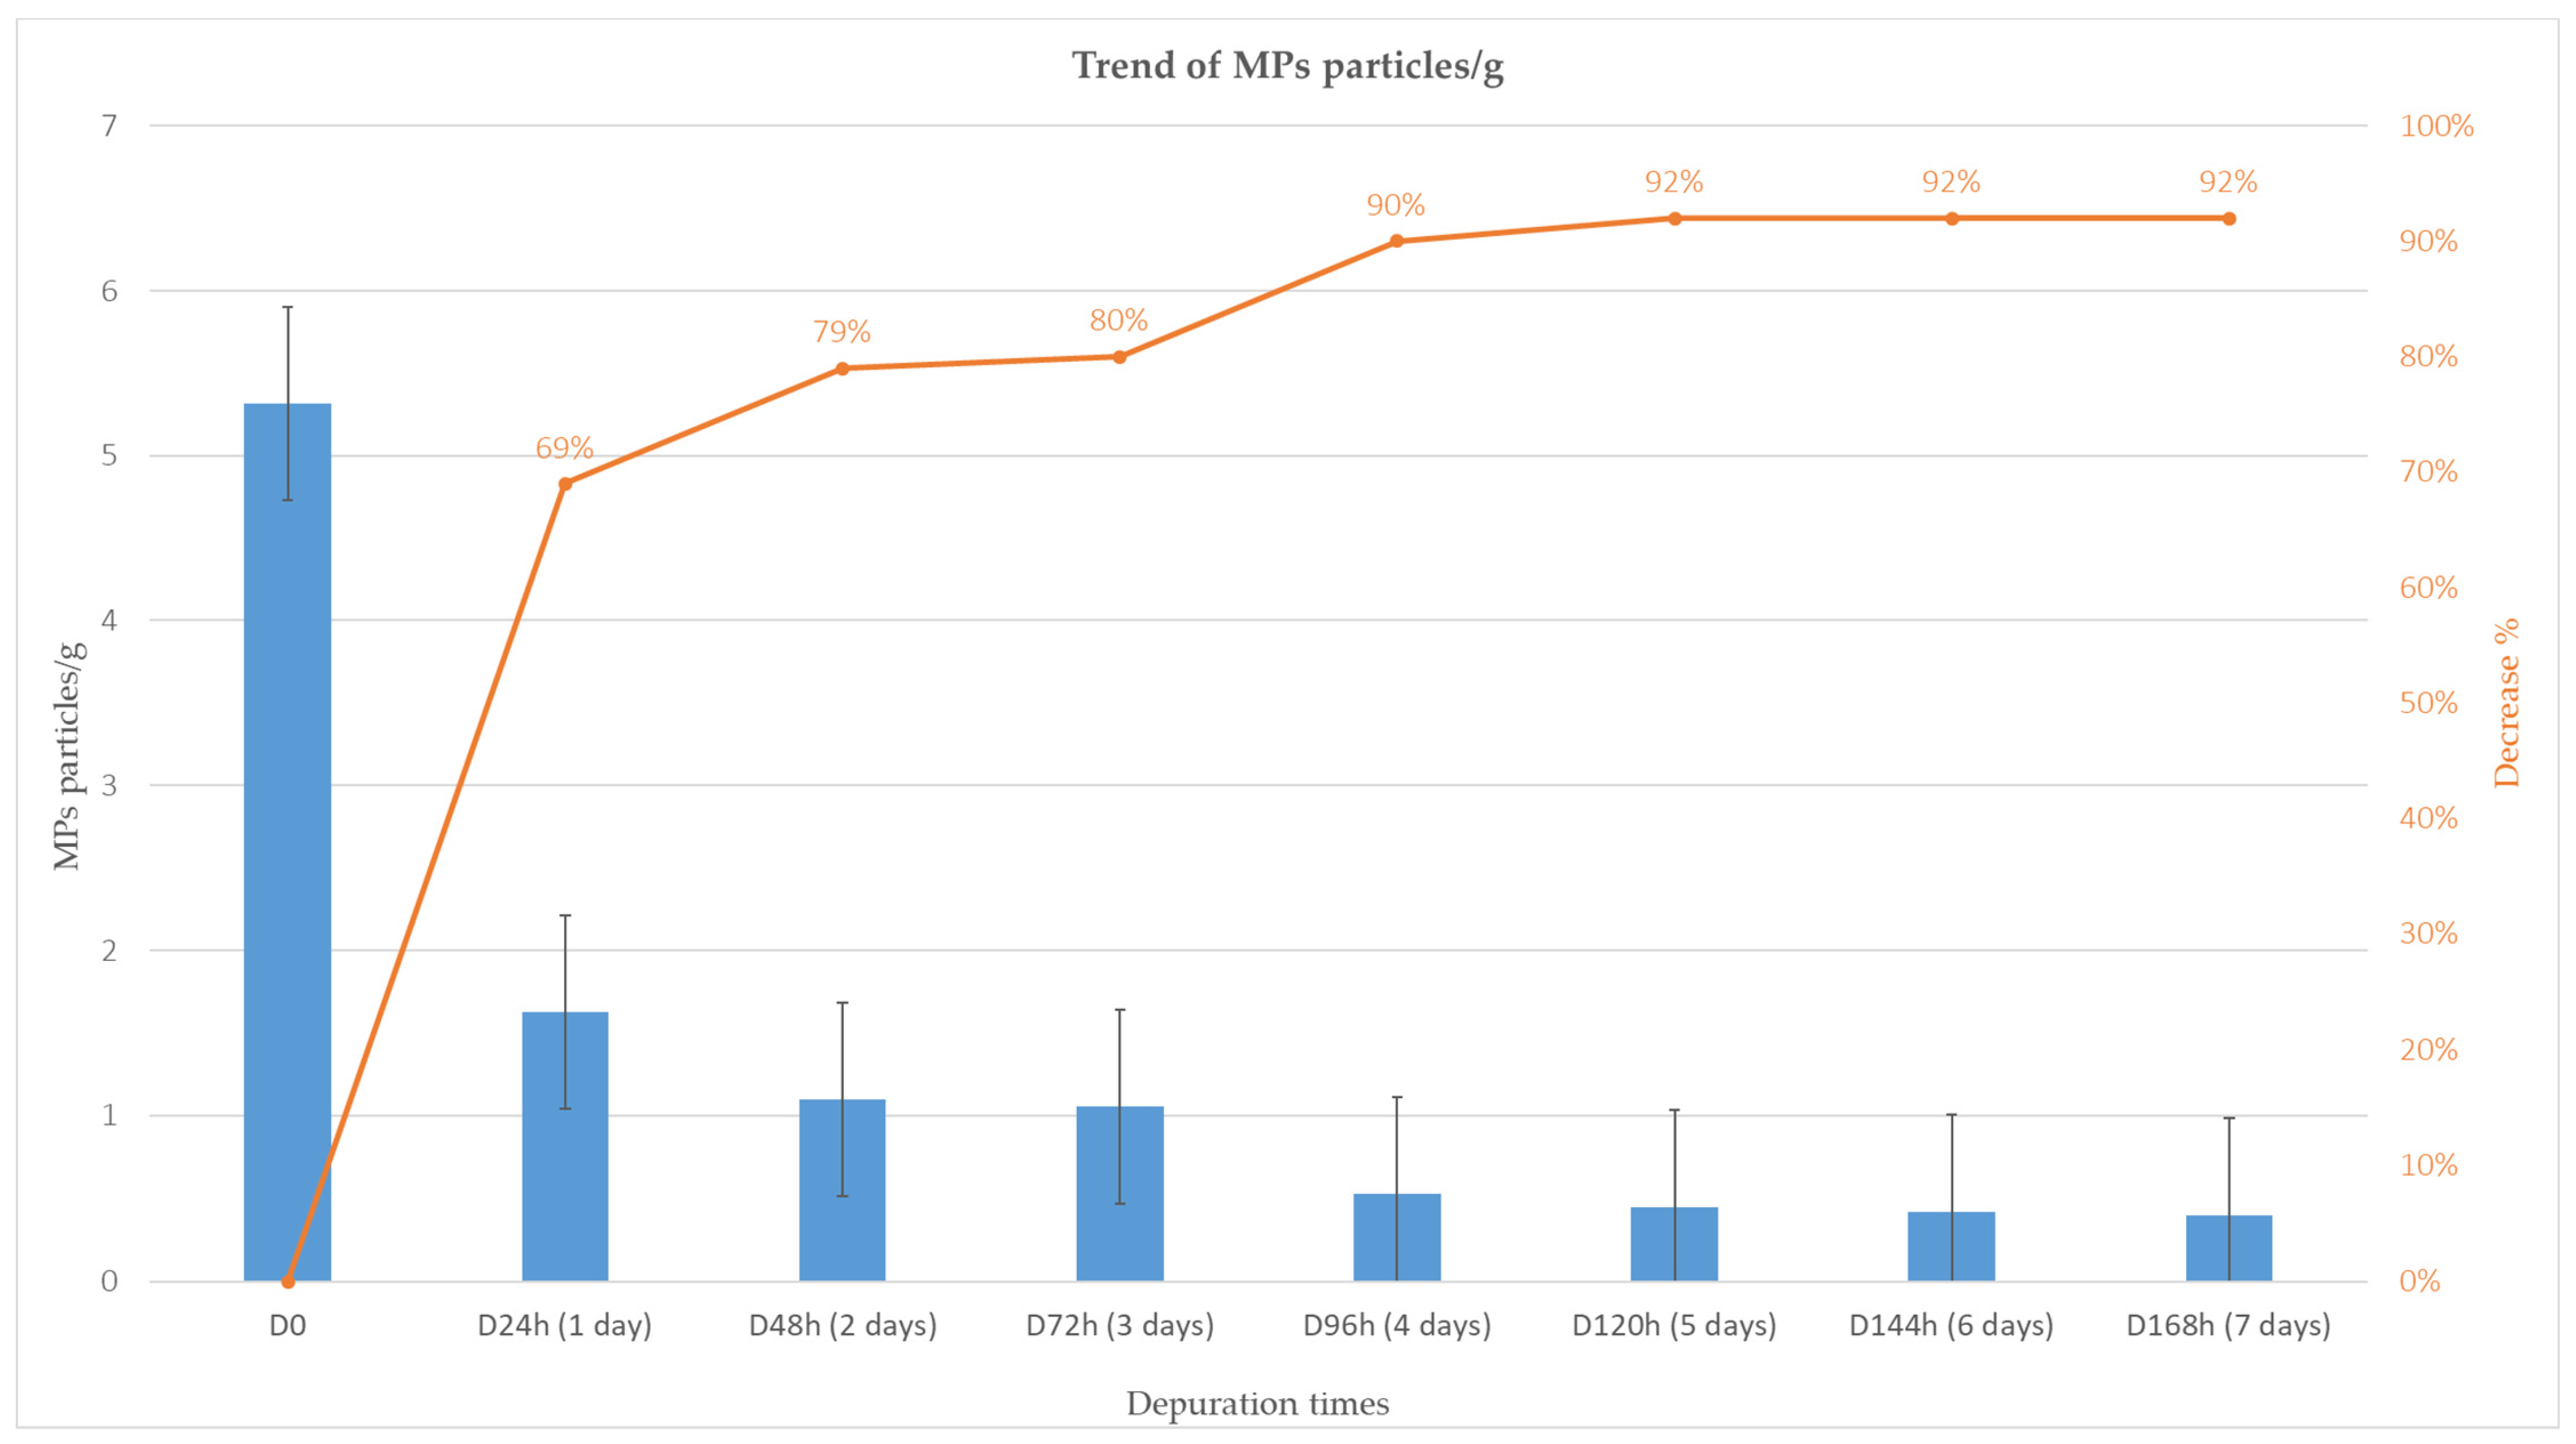
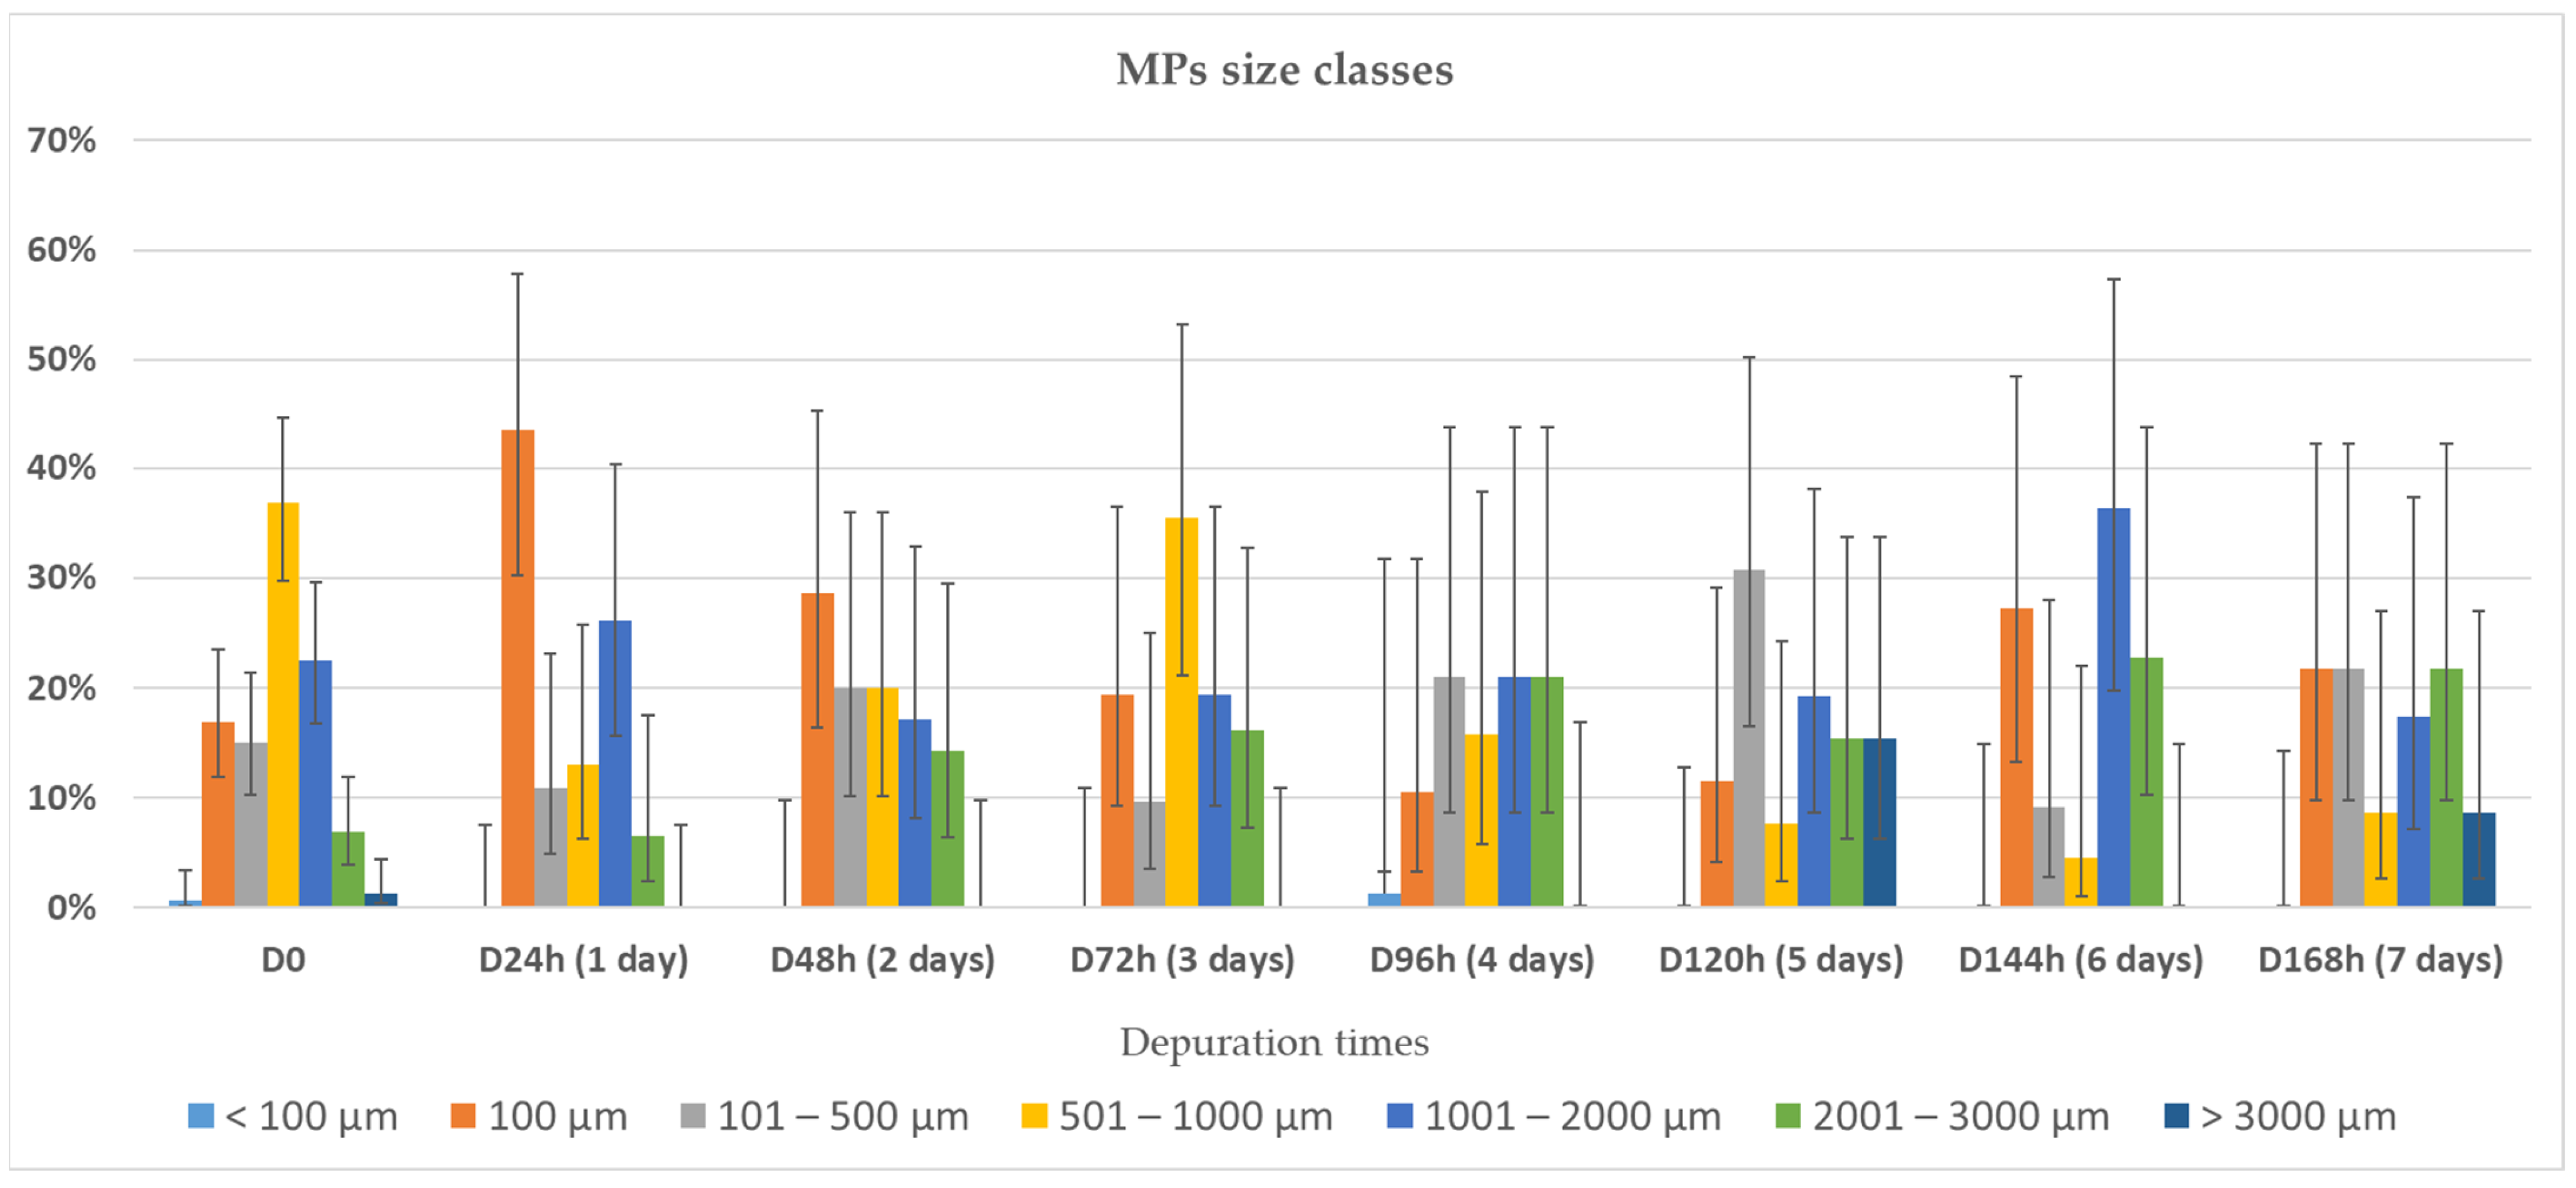
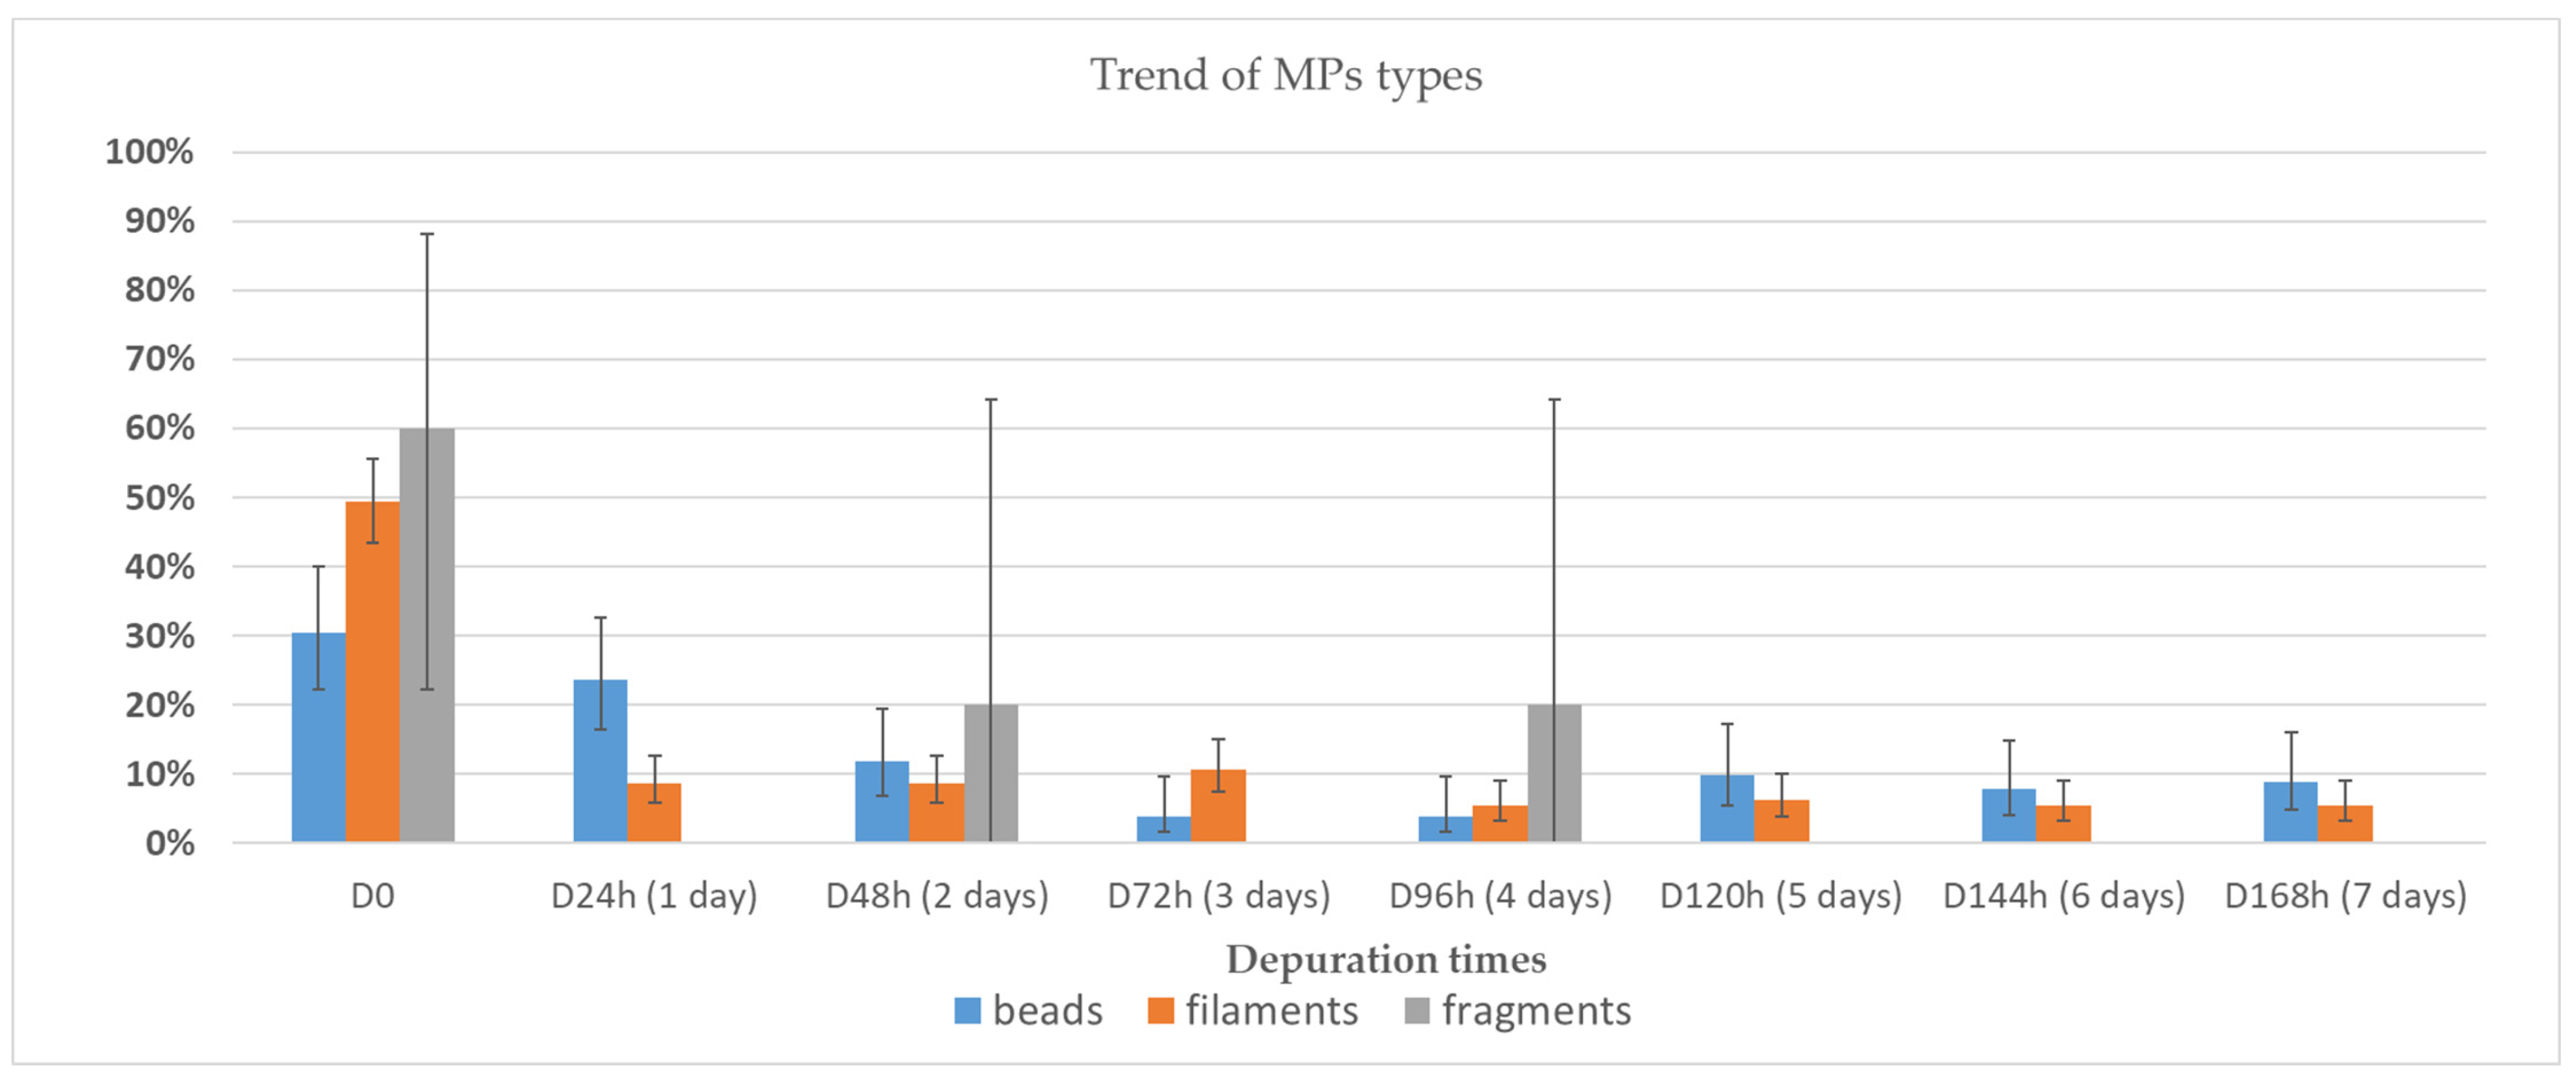
3.2. Depuration and Elimination of MPs in Ostrea edulis

During the depuration period, which lasted a total of 7 days (168 h), we observed a 69% decrease in MPs in the samples analysedafter 24 h of purification and up to 92% after 120 h of purification (5 days). This decrease remained unchanged after 144 h (6 days) and 168 h (7 days) of depuration. Only 8% of MP particles remained in the oysters after 7 days of purification (Table 1).
MP levels decreased significantly (Figure 6) during the first 24 h of the depuration process (from 5.31 MPs particles/g at time D0 to 1.63 MPs particles/g at time D24h). Therefore, the elimination of MPs’ particles was significantly higher during the first 24 h compared to subsequent depuration times.
No significant correlation was highlighted between the variables “oyster size” and “number of MPs particles/g”. As reported in another study on bivalves [38], the ability of these organisms to accumulate microplastics, as well as to eliminate them, is not strictly correlated with their size.
Regarding “MPs size class” in relation to the depuration times, it was observed (Figure 7) that the 501–1000 µm class decreased significantly after 24 h from the start of the depuration process. The percentage of MPs decresead from 37% (l.c.l. 29.8% and u.c.l. 44.6%) to 13% (l.c.l. 6.2% and u.c.l. 25.7%). The same size class (501–1000 µm) also showed a statistically significant reduction in the last three depuration times (D120h, D144h, and D168h). However, for the size classes 100 µm, 101–500 µm, 1001–2000 µm, and 2001–3000 µm, no statistically significant decrease was observed over time (Figure 7).
Among the three types of microplastics used during the exposure phase, it was observed that filaments were purified more easily after 24 h of depuration, showing a statistically significant decrease. The percentage of filaments observed at D0, which marks the end of the exposure phase, of 49.4% (l.c.l. 43.3% and u.c.l. 55.5%) decreased to 8.2% (l.c.l. 5.8% and u.c.l. 12.7%) at D24h, after 24 h of depuration (Figure 8).
Within the filament typology (Figure 5), the results highlighted that the smallest size class, i.e., 100–1000 µm, was the one that purified most rapidly after 24 h (decrease of 89%), although this was not statistically significant. On the other hand, larger size classes, such as 2000–3000 µm and >3000 µm, were more difficult to eliminate, and therefore, we did not observe any significant change.

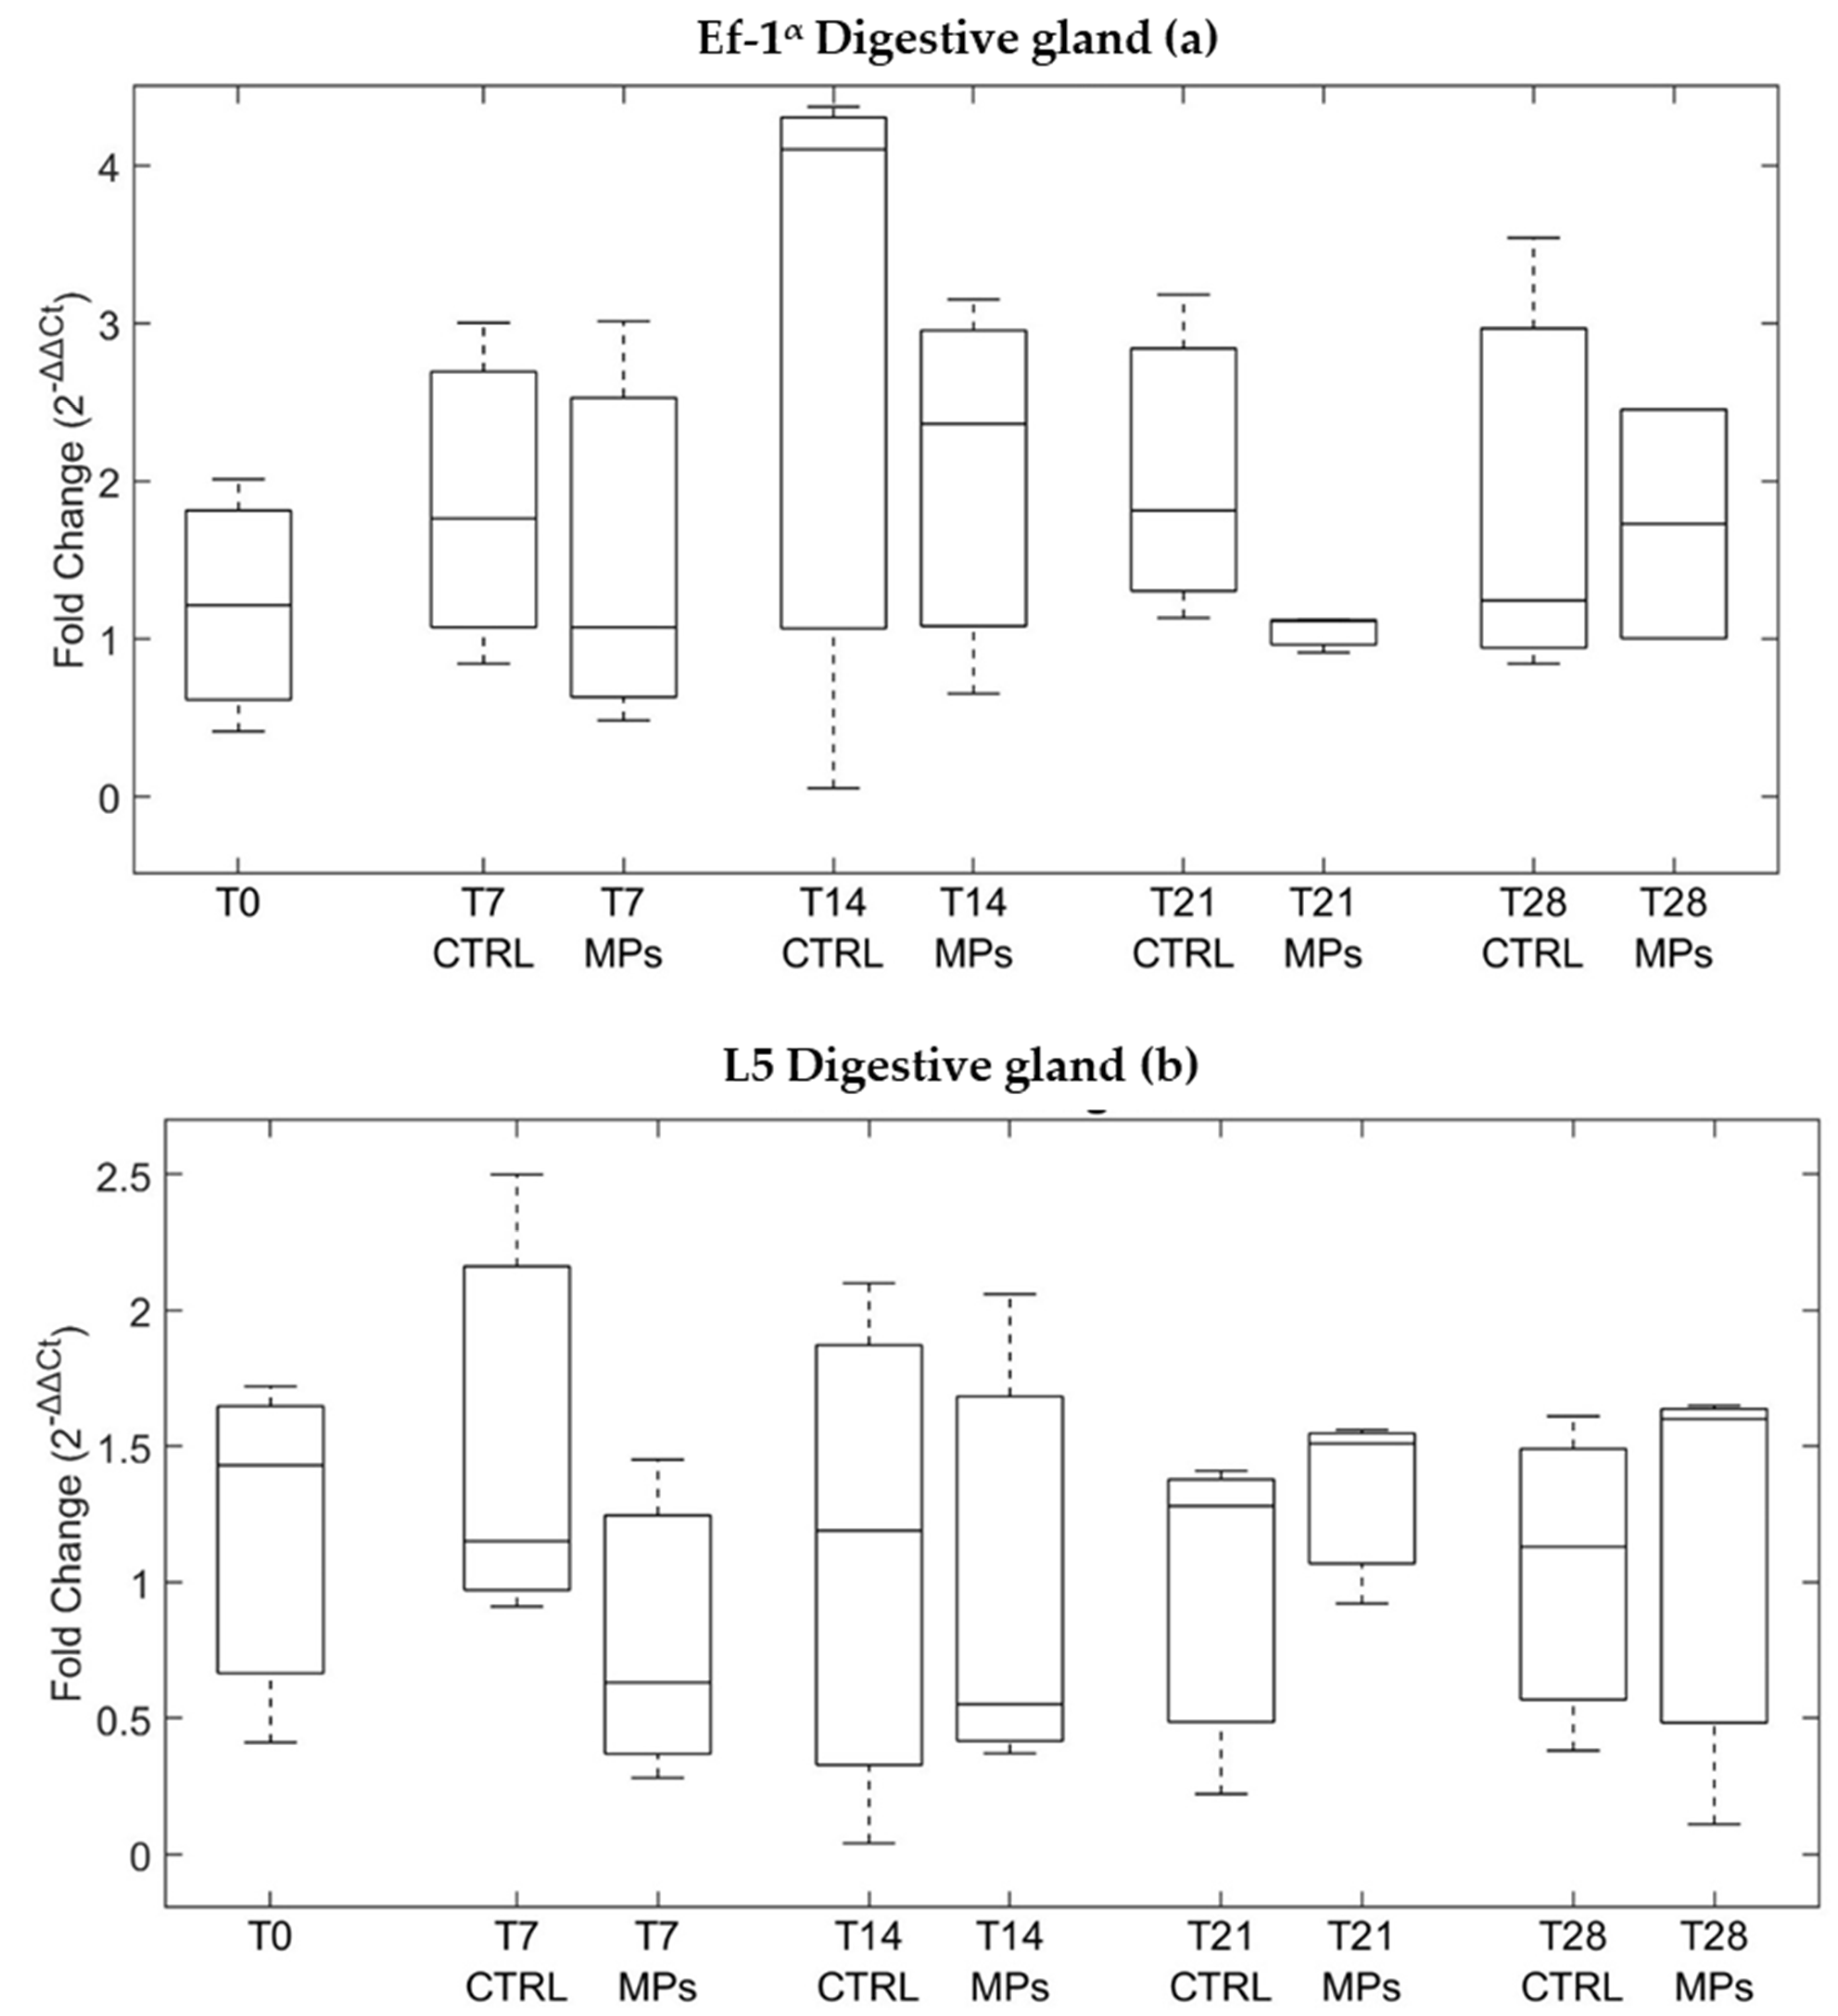
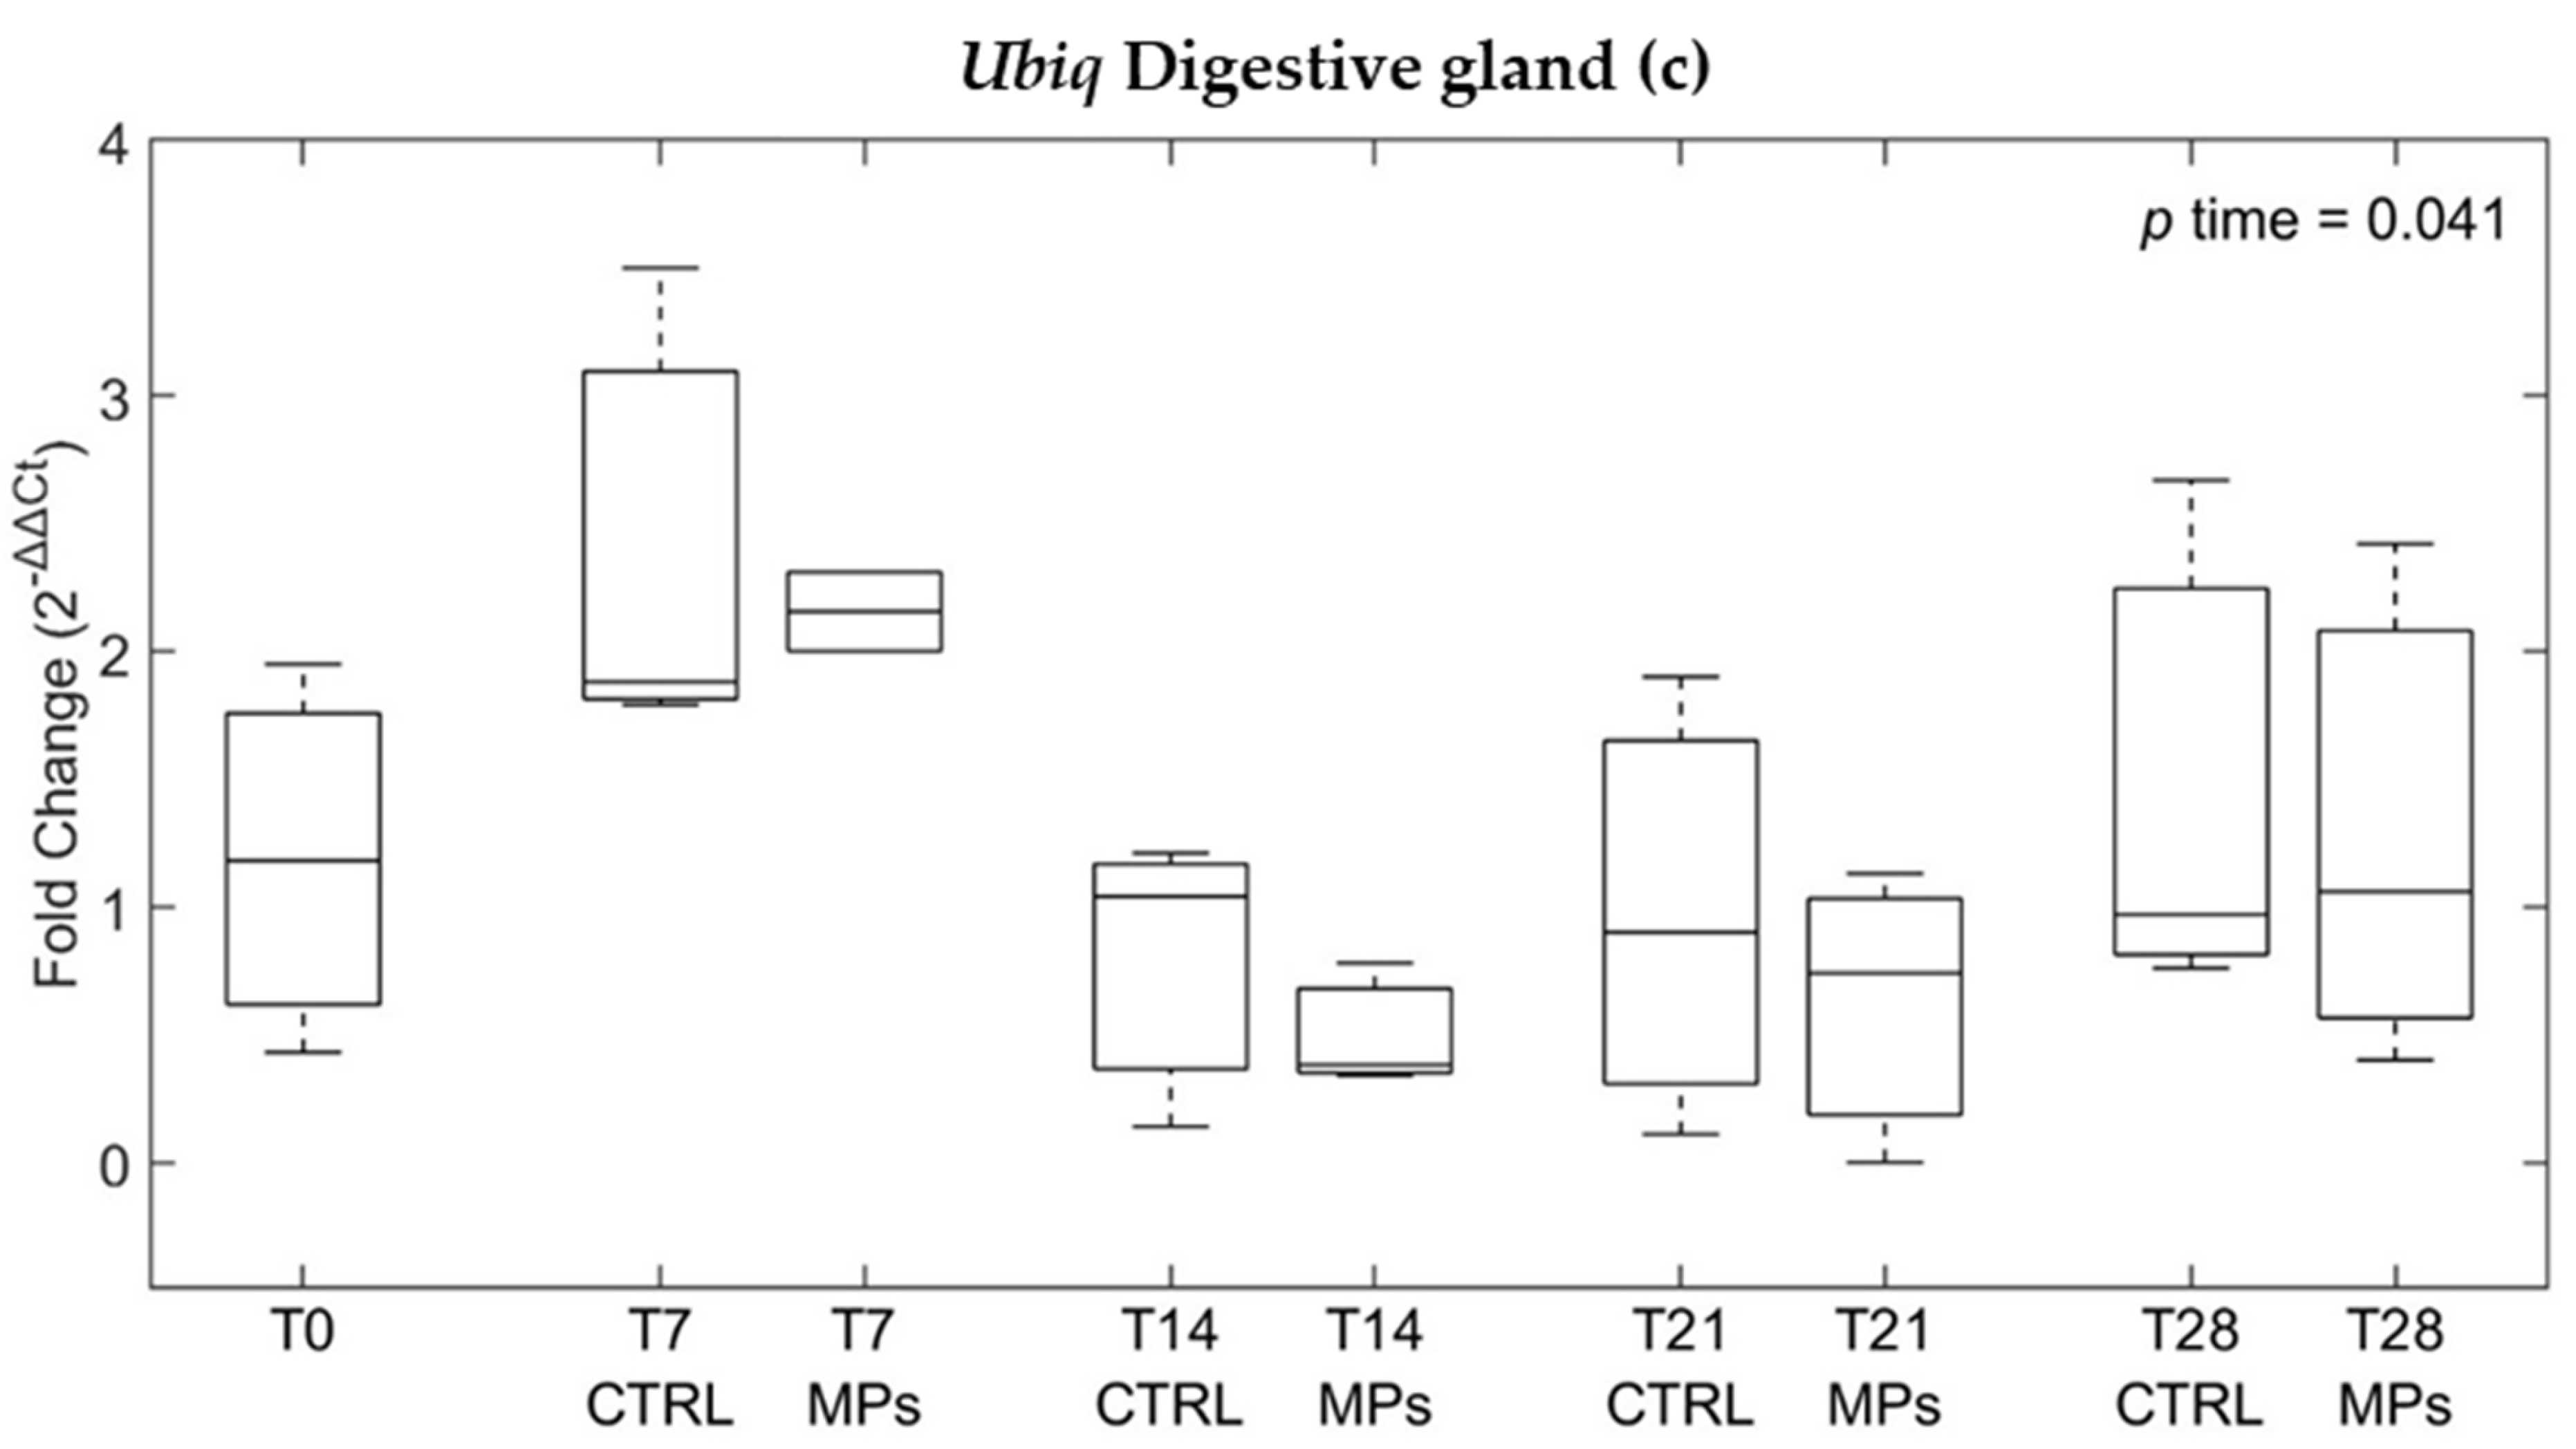
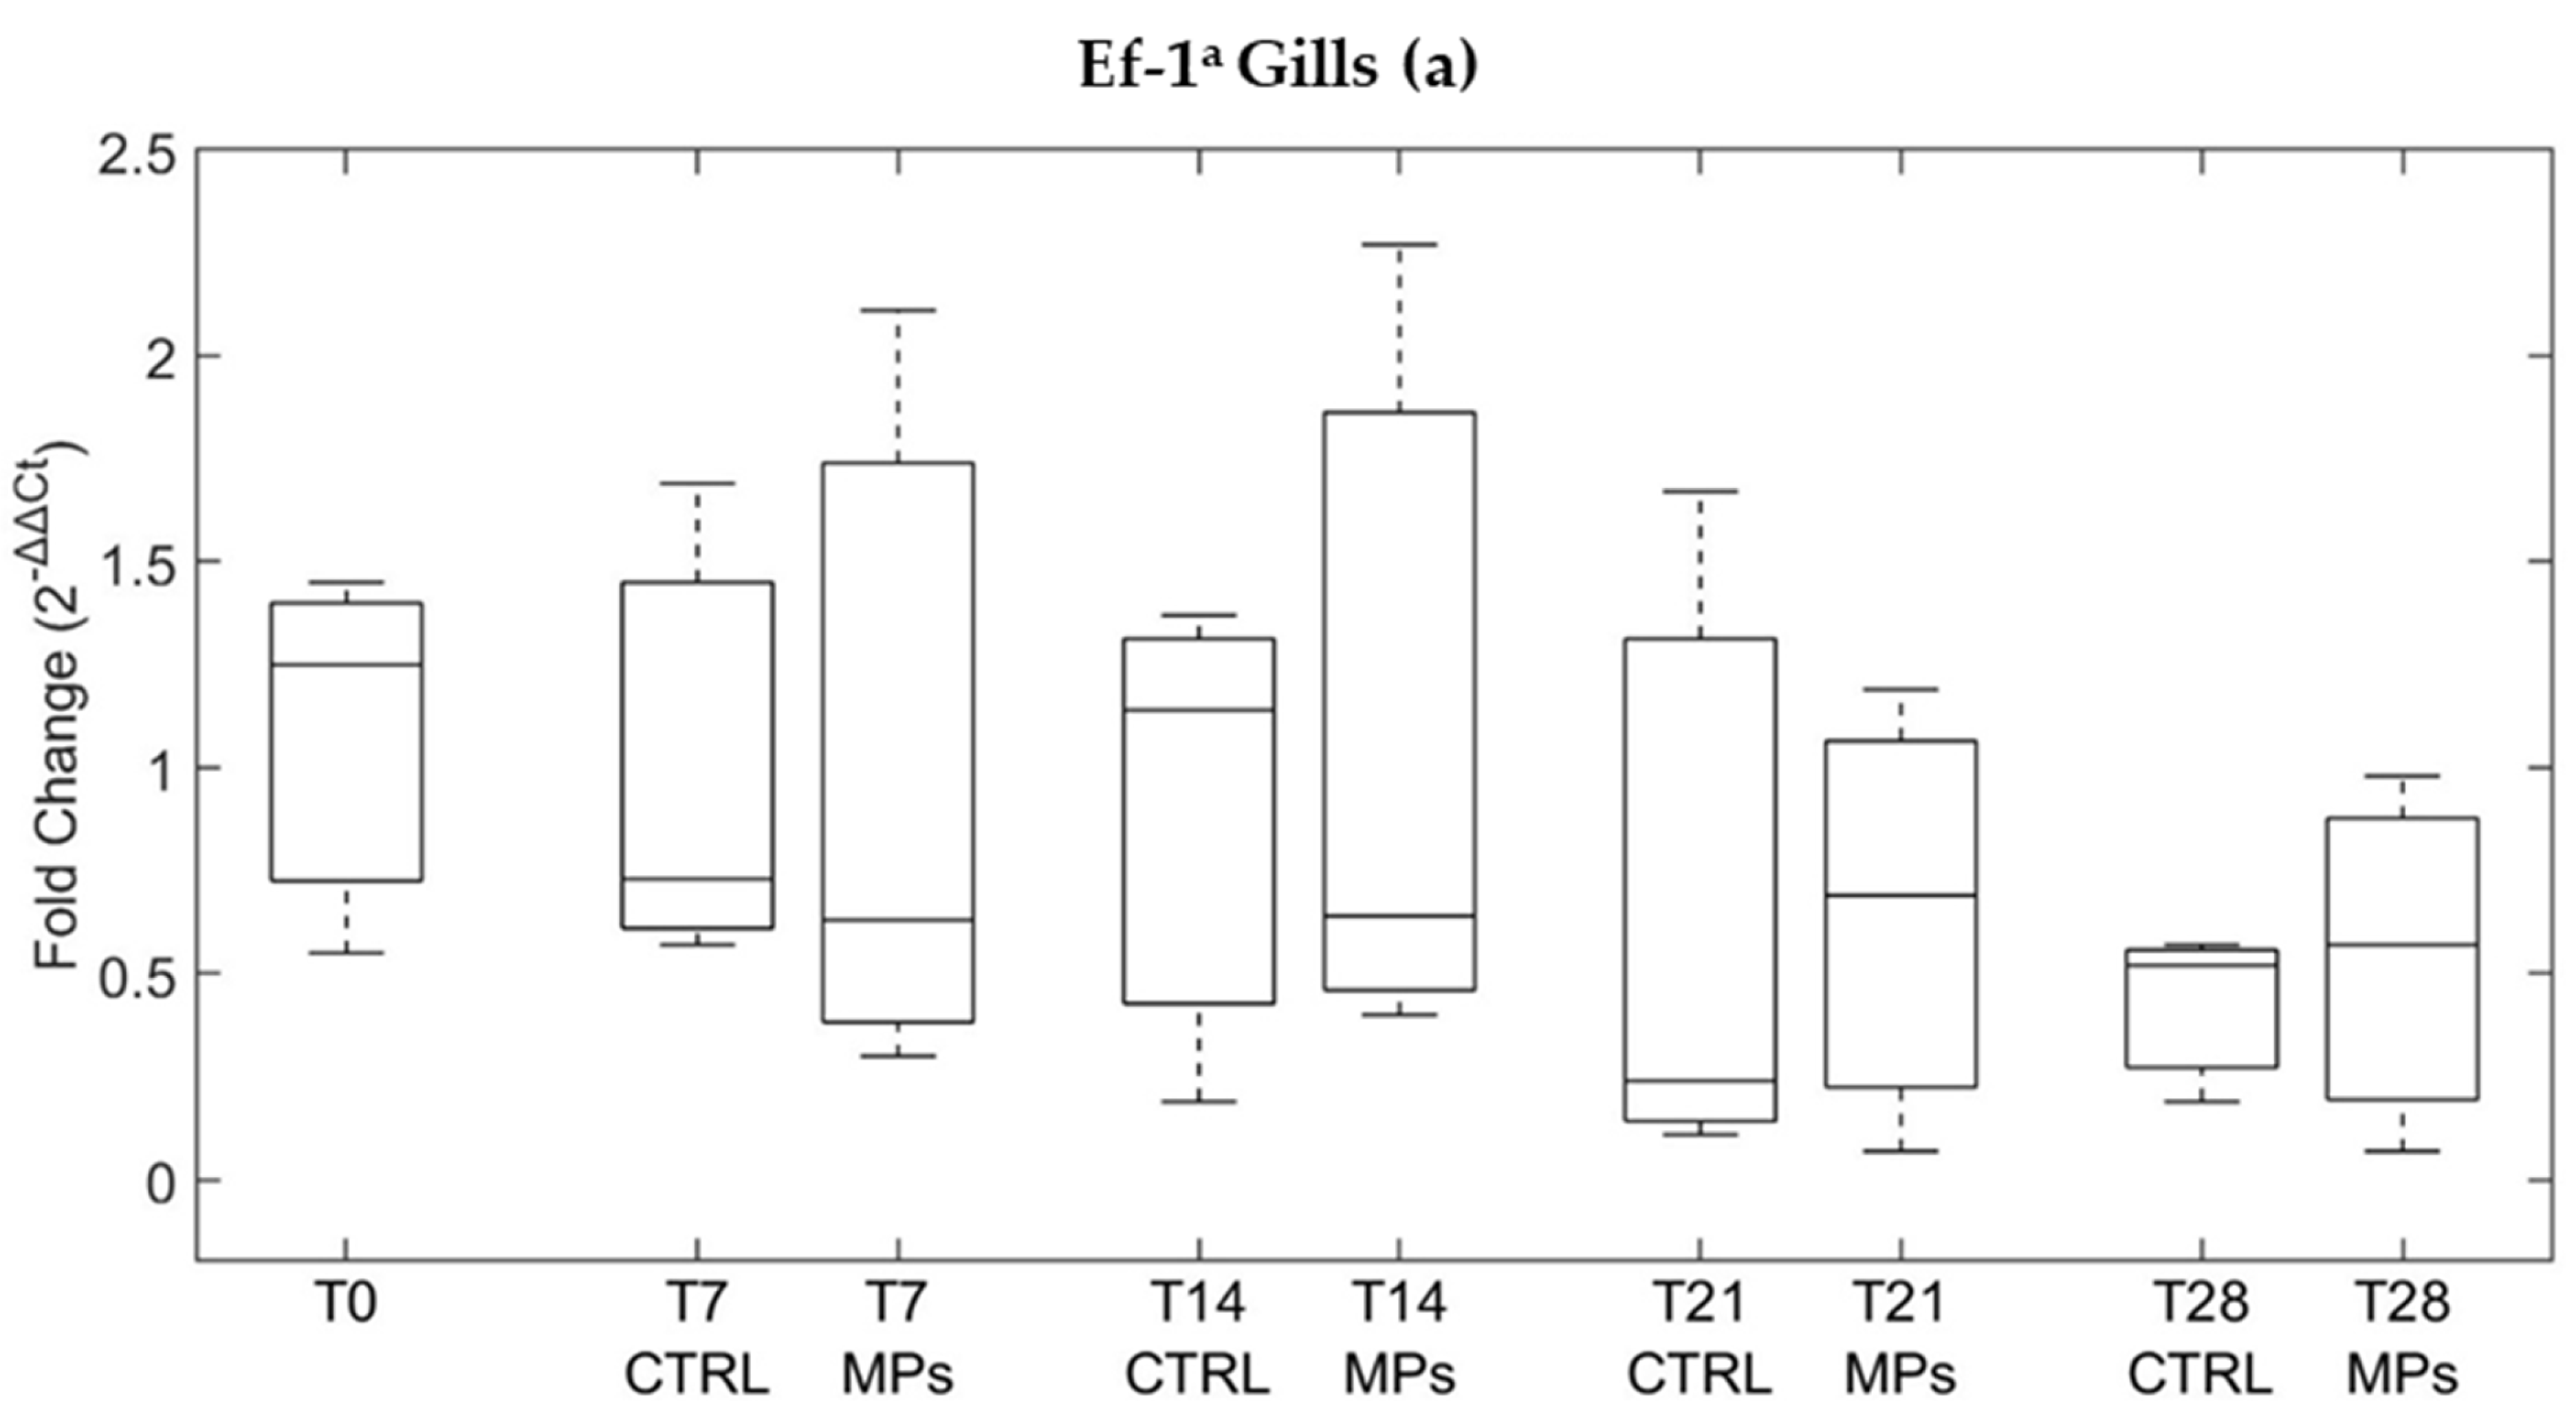
3.3. Gene Expression

Biomolecular analyses were performed on the two target organs, digestive glands and gills, both of which are of significant interest for the gene expression analyses [49,56,69,70].
qPCR confirmed the amplification of four of the five candidate housekeeping genes (EF1-α, L5, GAPDH, and Ubiq), while for β-actin (ACT) no target amplification was observed. Thus, we excluded ACT from the list of candidate normalizer genes. The order of stability defined by the RefFinder software was EF-1α > GAPDH > L5 > Ubiq for the digestive gland and L5 > GAPDH > EF-1α > Ubiq for the gills.
Furthermore, the Kruskal–Wallis test did not reveal any significant changebetween treatments in the stability of the EF-1α, GAPDH, L5 and Ubiq genes for eithertissues studied (p > 0.05).
Regarding the individual expression of each gene, the results were internally normalized (i.e., 2−ΔΔCt values) against the gene whose average expression was more stable in the gills and digestive glands (i.e., GAPDH). The non-parametric SRH test then analyzed the influence of the two variables “exposure time (T)” and “exposure to microplastics (MPs)” and their interaction “T*MPs” on the 2−ΔΔCt values. No significant effect was found for the EF-1α and L5 genes (p > 0.05) either in the digestive gland or in the gills (Figure 9 and Figure 10).
As for the Ubiq gene, a significant effect was recognized for the variable “exposure time (T)” for both the digestive gland (p = 0.041, Figure 9) and the gills (p = 0.047, Figure 10). No significant effect was found for the variable “exposure to microplastics (MPs)” and for the variable “T*MPs interaction” (p > 0.05).

4. Discussion

This study provides further data on both the accumulation and depuration dynamics of MPs ingested by bivalve molluscs s intended for human consumption, such as Ostrea edulis. Furthermore, this research contributes to improving the management of molluscs in depuration centers, as our work extended throughout a 28-day contamination experiment followed by a subsequent 7-day (168 h) depuration period.
Experimental studies conducted to date [37,38,39,40,41,42,43,44,45,46,50] have often not evaluated the impact of MP particles in marine organisms, which represents a significant challenge due to a variety of polymers of different compositions, shapes, and sizes present in marine environments. In laboratory experiments, many variables can be considered, such as the type of MPs, the exposure concentrations, the accumulation and depuration times, and the possible association of MPs with environmental contaminants. Therefore, we attempted to fill these gaps by relying on an experimental design that simulated realistic conditions of the marine environment, i.e., using MPs of various shapes, sizes, different compositions and subjected to an aging process [28,51,54]. The concentration of 1 × 10⁴ MPs particles/L used in the exposure phase was chosen for its environmental relevance [28,53].
Analysis of MP counts in flat oysters after 28 days of exposure revealed statistically significant differences between replicates. However, the possible influence of biological variability on the results was not assessed due to the difficulty of managing several animals.
After 28 days of contamination, the oysters had accumulated an average concentration of 5.31 ± 0.86 MPs particles/g. The results highlighted that filaments were the most aabundant type of MPs (79%), followed by beads (19%) and fragments (2%). In the study by [47], the oysters tested were more efficient in accumulating tire particles than fibers or fragments. According to some authors [43,71], this depends on various factors such as size, shape, and physicochemical properties of their surface.
The MP particle size class between 501 and 1000 µm was the most retained (36.9%). However, no significant difference was observed in the retention of the other size classes. As an example, ref. [43] showed that Crassostrea virginica specimens largely accumulated particles of smaller diameters, displaying capture efficiencies of 76.3%, 44.0%, and 20.4% for microspheres with diameters of 19, 113, and 287 µm, respectively. Similarly, in the present study, filaments of smaller diameter (100–1000 µm) were accumulated to a greater extent (61%) than those of larger diameters (2001–3000 µm and >3000 µm). Therefore, the capture efficiencies would appear to be inversely correlated with particles diameter [43]. This result may as well be related to the smaller size of microplastics, which is comparable in size to phytoplankton, the food source for these organisms [71].
In this study, European flat oysters showed a high depuration rate in the first 24 h, eliminating 69% of the MPs’ particles ingested during the exposure phase and reaching a plateau of 92% after 120 h of depuration (5 days). A residual 8% of these particles were retained in the bivalves at the end of the depuration period. Other studies [38,43,72] have shown that some types of microplastics are more likely to be retained or translocated to other tissues due to their size and shape, making it impossible to achieve 100% removal.
The effectiveness of the MP depuration process is not only influenced by the size of the particles, but also by the time factor, as already highlighted by several studies. The authors of [37] found that a depuration period of 72 h (3 days) was able to reduce particle levels by 25.5%, with significant reductions for those with a size > 25 µm µm in the Pacific oysters Crassostrea gigas. Following the exposure of C. gigas specimens to 100–500 µm polystyrene particles, ref. [41] observed a significant reduction in the abundance of microplastics (about 85%) within 72 h (3 days) from the start of depuration. Ref. [44] also observed a 73% reduction after 120 h (5 days) of purification, but no further reduction at subsequent times in C. gigas samples. These results suggest that a depuration period ranging from 24 to 120 h (1–5 days) allows a significant overall purification of oysters from microplastic particles. Longer depuration periods (over 5 days) would probably not be effective to allow a complete decontamination of bivalve from MPs, as already suggested by other studies [41,73]. In fact, this appears to be inefficient due to the difficulty in depurating some types and size classes of MP particles and recontamination from the experimental environment ([44], Exposito 2025), thus leading to persistent background contamination in the bivalves under study. Other studies have shown that a depuration period of 120 h (5 days) in oysters allowed the reduction below the detection limits of chemical contaminants such as perfluorooctane sulfonate (PFOS) [74] and polycyclic aromatic hydrocarbons (PAHs) [75]. Heavy metals, on the other hand, can persist in oysters for a long time and require additional practices, such as the addition of chelating agents, to facilitate their depuration [76].
Research conducted with biological contaminants, such as bacteria and viruses, has shown that, for example, Vibrio parahaemolyticus would require four or more days to be completely eliminated, while the times requiredfor the elimination of norovirus could be three or more days [77,78,79]. This aspect should not be underestimated, considering that the average increase in water temperature could lead to the presence of these biological agents in the marine environment, requiring an adaptation of the purification process currently implemented in bivalve mollusc processingcenters [80]. Considering all the MPs used in the experiment, the size class of 501–1000 µm showed a significant decrease after 24 h of purification, unlike all the other size classes analyzed, which did not show a significant decrease during the different purification times. The type of MPs removed most quickly were filaments, with a significant reduction of 86% after 24 h of the depuration process. Specifically, the smallest size filaments, i.e., 100–1000 µm, were removed most rapidly after 24 h of depuration, with a reduction of 89%, in contrast to the larger size classes (2000–3000 µm and >3000 µm), which were more challenging to remove. In fact, as previously suggested by other authors [43,72], longer filaments may adhere to mussel gills, resulting in longer retention times. Therefore, in addition to ingestion [81], the adhesion of these particles to the internal tissues of bivalves significantly influenced the accumulation and depuration processes of MPs [41].
According to other studies [37,41,44], our data indicate that depuration processes lasting up to 120 h (5 days) are remarkably effective in achieving a significant reduction in the presence of MPs’ particles in oysters intended for human consumption. Such practices are commonly used in European and non-European countries to reduce the concentration of various contaminants for food safety purposes in bivalve depuration centers [45,78,82,83,84].
Moreover, in order to obtain significant results in the decontamination of bivalve molluscs, the present study confirms the importance of taking the following precautions: (i) using plastic-free materials and structures; (ii) filtering the water in which the bivalves are placed to be stabled; (iii) covering the tanks to avoid contamination with airborne MPs particles, as pointed out by other authors [44]. It is not yet clear whether these precautions can be easily applied and managed in the centers dedicated to the purification of bivalve molluscs, and how much longer purification times could potentially increase the final cost of molluscs to the consumer. This cost could be justified by the creation fo a specific food label, as suggested by [85], which would certify the cleaning of certain percentage of microplastics. In fact, the data presented in the study [85] show that there is a segment of consumers wgo are willing to pay a premium for a product that is certified as having been cleaned of microplastics.
During the 28-day MPs phase, the expression stability of the four genes, EF-1α, GAPDH, Ubiq, and L5, was tested in the gills and digestive glands of Ostrea edulis. The analysis highlighted that the four genes could be used as references for future experiments on prolonged exposure of the flat oyster to stressors such as the presence of microplastics in the environment. The results obtained confirm what was reported by [58], who described the GAPDH and EF-1α genes as more stable in haemocytes during exposure to the protozoan Bonamia ostrea.
In our study, both GAPDH and EF-1α were found to be the most stable in the digestive glands. In the gills, in addition to GAPDH, the L5 gene was found to be the most stable. This suggests that the tissue specificity of the reference genes must be considered during the exposure experiments. On the other hand, the Ubiq gene was found to be significantly influenced by the exposure time, showing especially a marked divergence for the seventh day in the digestive gland. In fact, T7 showed high levels of up-regulation compared to the pre-exposure control time (T0) and to the other exposure times (T14, T21, T28). It was also observed that time significantly affected Ubiq on gills.This instability has also beenobserved by [58] and attributedit to the involvement of polyubiquitin in the removal of damaged proteins by non-lysosomal degradation [86,87,88]. Therefore, it may be hypothesized that this pathway could be influenced by short-term exposure to laboratory conditions.
As already described by [89] regarding the stability analysis of reference genes for Mytilus galloprovincialis, the selection of genes to be used universally for each molecular analysis is challenging. This is related to the fact that numerous variables must be considered, such as the biological state of the animal and the exposure to contaminants that could alter the molecular pathways. Similarly, our study also demonstrates the importance of optimizing reference genes by considering the target tissue on which to perform gene expression analyses.

5. Conclusions

The data presented in this work represent a grounded basis for reducing the levels of MPs in oysters through depuration processes that exploit bivalves natural filtering capacity. This process aims to reduce the probability of MP transmission within the food chain, thereby ensuring food safety and safeguarding human health.
In addition, the gene expression analysis defined EF-1α, GAPDH, and L5 as reference genes for Ostrea edulis, as they showed marked stability under the different experimental conditions used in the project.
These data are valuable for the future development of a novel toolkit designed to monitor MPs damage in marine environments by analyzing the expression of candidate genes, with a focus on filter-feeding species, thus contributing to MPs research under field conditions.

Author Contributions

Conceptualization, F.P., E.N., S.R., M.A. and M.D.D.; methodology, F.P., E.N., S.R., M.A. and M.D.D.; formal analysis, F.P., S.R., M.A., M.D.D. and L.F.M.; investigation, F.P., E.N., S.R., M.A., M.D.D. and L.F.M.; data curation, F.P., L.F.M. and R.S.; writing—original draft preparation, F.P., S.R., E.N., M.A., M.D.D. and L.F.M.; writing—review and editing, F.P., S.R., E.N., S.F., L.D.R., M.A., M.D.D. and L.F.M.; supervision, L.D.R. and S.F.; project administration, S.R. All authors have read and agreed to the published version of the manuscript.

Funding

This research was supported by funding from the Italian Ministry of Health, Italy (Ricerca Corrente IZS AM 07/20 RC).

Data Availability Statement

Data are presented in this article in the form of figures and tables.

Acknowledgments

We would like to acknowledge the fishermen of Termoli (CB, Italy) for providing us with the oysters.

Conflicts of Interest

The authors declare no conflicts of interest.

References

  1. Xu, S.; Ma, J.; Ji, R.; Pan, K.; Miao, A.J. Microplastics in aquatic environments: Occurrence, accumulation, and biological effects. Sci. Total Environ. 2020, 703, 134699. [Google Scholar] [CrossRef] [PubMed]
  2. Teng, J.; Zhao, J.; Zhu, X.; Shan, E.; Zhang, C.; Zhang, W.; Wang, Q. Toxic effects of exposure to microplastics with environmentally relevant shapes and concentrations: Accumulation, energy metabolism and tissue damage in oyster Crassostrea gigas. Environ. Pollut. 2021, 269, 116169. [Google Scholar] [CrossRef] [PubMed]
  3. Jambeck, J.R.; Geyer, R.; Wilcox, C.; Siegler, T.R.; Perryman, M.; Andrady, A.; Narayan, R.; Law, K.L. Plastic waste inputs from land into the ocean. Science 2015, 347, 768–771. [Google Scholar] [CrossRef]
  4. GESAMP. Guidelines or the Monitoring and Assessment of Plastic Litter and Microplastics in the Ocean; Kershaw, P.J., Turra, A., Galgani, F., Eds.; IMO/FAO/UNESCO-IOC/UNIDO/WMO/IAEA/UN/UNEP/UNDP/ISA Joint Group of Experts on the Scientific Aspects of Marine Environmental Protection. Reports and Studies GESAMP No. 99; GESAMP: London, UK, 2019; 130p. [Google Scholar]
  5. Thompson, R.C.; Moore, C.J.; vom Saal, F.S.; Swan, S.H. Plastics, the environment and human health: Current consensus and future trends. Philos. Trans. R. Soc. Lond. B Biol. Sci. 2009, 364, 2153–2166. [Google Scholar] [CrossRef] [PubMed]
  6. Farrell, P.; Nelson, K. Trophic level transfer of microplastic: Mytilus edulis (L.) to Carcinus maenas (L.). Environ. Pollut. 2013, 177, 1–3. [Google Scholar] [CrossRef]
  7. Setälä, O.; Fleming-Lehtinen, V.; Lehtiniemi, M. Ingestion and transfer of microplastics in the planktonic food web. Environ. Pollut. 2014, 185, 77–83. [Google Scholar] [CrossRef]
  8. Guzzetti, E.; Sureda, A.; Tejada, S.; Faggio, C. Microplastic in marine organism: Environmental and toxicological effects. Environ. Toxicol. Pharmacol. 2018, 64, 164–171. [Google Scholar] [CrossRef]
  9. Gouin, T. Toward an Improved Understanding of the Ingestion and Trophic Transfer of Microplastic Particles: Critical Review and Implications for Future Research. Environ. Toxicol. Chem. 2020, 39, 1119–1137. [Google Scholar] [CrossRef]
  10. Sarkar, S.; Diab, H.; Thompson, J. Microplastic Pollution: Chemical Characterization and Impact on Wildlife. Int. J. Environ. Res. Public Health 2023, 20, 1745. [Google Scholar] [CrossRef]
  11. Lozano-Hernández, E.A.; Ramírez-Álvarez, N.; Rios Mendoza, L.M.; Macías-Zamora, J.V.; Sánchez-Osorio, J.L.; Hernández-Guzmán, F.A. Microplastic concentrations in cultured oysters in two seasons from two bays of Baja California, Mexico. Environ. Pollut. 2021, 290, 118031. [Google Scholar] [CrossRef]
  12. Li, J.; Yang, D.; Li, L.; Jabeen, K.; Shi, H. Microplastics in commercial bivalves from China. Environ. Pollut. 2015, 207, 190–195. [Google Scholar] [CrossRef]
  13. Salini, R.; Tora, S.; Filipponi, F.; Conte, A.; Giansante, C.; Ippoliti, C. Analyzing trend and heatwaves of 15 Years of Sea Surface Temperature Variations along the Italian Adriatic Coast. Vet. Ital. 2024, 60. [Google Scholar] [CrossRef] [PubMed]
  14. NCCCOS. Coastal Science Website. 2023. Available online: https://coastalscience.noaa.gov (accessed on 25 November 2023).
  15. OSPAR. Joint assessment and monitoring programme (JAMP) 2017–2023. OSPAR Comission—Agreement 2014-2. 2014. [Google Scholar]
  16. Mathalon, A.; Hill, P. Microplastic fibers in the intertidal ecosystem surrounding Halifax Harbor, Nova Scotia. Mar. Pollut. Bull. 2014, 81, 69–79. [Google Scholar] [CrossRef]
  17. Qu, X.; Su, L.; Li, H.; Liang, M.; Shi, H. Assessing the relationship between the abundance and properties of microplastics in water and in mussels. Sci. Total Environ. 2018, 621, 679–686. [Google Scholar] [CrossRef] [PubMed]
  18. Hantoro, I.; Löhr, A.J.; van Belleghem, F.G.A.J.; Widianarko, B.; Ragas, A.M.J. Microplastics in coastal areas and seafood: Implications for food safety. Food Addit. Contam. Part A 2019, 36, 674–711. [Google Scholar] [CrossRef]
  19. Stock, V.; Böhmert, L.; Lisicki, E.; Block, R.; Cara-Carmona, J.; Pack, L.K.; Selb, R.; Lichtenstein, D.; Voss, L.; Henderson, C.J.; et al. Uptake and effects of orally ingested polystyrene microplastic particles in vitro and in vivo. Arch. Toxicol. 2019, 93, 1817–1833. [Google Scholar] [CrossRef] [PubMed]
  20. Poma, A.; Vecchiotti, G.; Colafarina, S.; Zarivi, O.; Aloisi, M.; Arrizza, L.; Chichiriccò, G.; Di Carlo, P. In Vitro Genotoxicity of Polystyrene Nanoparticles on the Human Fibroblast Hs27 Cell Line. Nanomaterials 2019, 9, 1299. [Google Scholar] [CrossRef]
  21. Ballesteros, S.; Domenech, J.; Barguilla, I.; Cortés, C.; Marcos, R.; Hernández, A. Genotoxic and immunomodulatory effects in human white blood cells after ex vivo exposure to polystyrene nanoplastics. Environ. Sci. Nano 2020, 7, 3431–3446. [Google Scholar] [CrossRef]
  22. Dong, C.D.; Chen, C.W.; Chen, Y.C.; Chen, H.H.; Lee, J.S.; Lin, C.H. Polystyrene microplastic particles: In vitro pulmonary toxicity assessment. J. Hazard. Mater. 2020, 385, 121575. [Google Scholar] [CrossRef]
  23. Çobanoğlu, H.; Belivermiş, M.; Sıkdokur, E.; Kılıç, Ö.; Çayır, A. Genotoxic and cytotoxic effects of polyethylene microplastics on human peripheral blood lymphocytes. Chemosphere 2021, 272, 129805. [Google Scholar] [CrossRef]
  24. Expósito, N.; Rovira, J.; Sierra, J.; Gimenez, G.; Domingo, J.L.; Schuhmacher, M. Levels of microplastics and their characteristics in molluscs from North-West Mediterranean Sea: Human intake. Mar. Pollut. Bull. 2022, 181, 113843. [Google Scholar] [CrossRef] [PubMed]
  25. Teng, J.; Zhao, J.; Zhu, X.; Shan, E.; Wang, Q. Oxidative stress biomarkers, physiological responses and proteomic profiling in oyster (Crassostrea gigas) exposed to microplastics with irregular-shaped PE and PET microplastic. Sci. Total Environ. 2021, 786, 147425. [Google Scholar] [CrossRef]
  26. Bringer, A.; Cachot, J.; Dubillot, E.; Prunier, G.; Huet, V.; Clérandeau, C.; Evin, L.; Thomas, H. Intergenerational effects of environmentally-aged microplastics on the Crassostrea gigas. Environ. Pollut. 2022, 294, 118600. [Google Scholar] [CrossRef] [PubMed]
  27. Liu, Y.; Shi, H.; Chen, L.; Teng, X.; Xue, C.; Li, Z. An overview of microplastics in oysters: Analysis, hazards, and depuration. Food Chem. 2023, 422, 136153. [Google Scholar] [CrossRef]
  28. Gardon, T.; Morvan, L.; Huvet, A.; Quillien, V.; Soyez, C.; le Moullac, G.; le Luyer, J. Microplastics induce dose-specific transcriptomic disruptions in energy metabolism and immunity of the pearl oyster Pinctada margaritifera. Environ. Pollut. 2020, 266, 115180. [Google Scholar] [CrossRef]
  29. Du, Y.; Zhao, J.; Teng, J.; Ren, J.; Shan, E.; Zhu, X.; Zhang, W.; Wang, L.; Hou, C.; Wang, Q. Combined effects of salinity and polystyrene microplastics exposure on the Pacific oysters Crassostrea gigas: Oxidative stress and energy metabolism. Mar. Pollut. Bull. 2023, 193, 115153. [Google Scholar] [CrossRef]
  30. Liu, Y.; Teng, X.; Chen, L.; Wu, S.; Xue, C.; Li, Z. Changes in Flavor-Related Biomarkers in Pacific Oysters (Crassostrea gigas) Following Microplastic Exposure. Foods 2024, 13, 765. [Google Scholar] [CrossRef]
  31. Bringer, A.; Thomas, H.; Prunier, G.; Dubillot, E.; Bossut, N.; Churlaud, C.; Clérandeau, C.; le Bihanic, F.; Cachot, J. High density polyethylene (HDPE) microplastics impair development and swimming activity of Pacific oyster D-larvae, Crassostrea gigas, depending on particle size. Environ. Pollut. 2020, 260, 113978. [Google Scholar] [CrossRef]
  32. Felici, A.; Vittori, S.; Meligrana, M.C.T.; Roncarati, A. Quality traits of raw and cooked cupped oysters. Eur. Food J. Technol. Res. 2020, 246, 349–353. [Google Scholar] [CrossRef]
  33. Liu, Y.; Wu, S.; Chen, L.; Teng, X.; Shi, H.; Xue, C.; Li, Z. Metabolic profiles and protein expression responses of Pacific oyster (Crassostrea gigas) to polystyrene microplastic stress. Food Chem. 2025, 462, 140961. [Google Scholar] [CrossRef]
  34. Lee, R.; Lovatelli, A.; Ababouch, L. Bivalve depuration: Fundamental and practical aspects. In FAO Fisheries Technical Paper (Arabic Edition); FAO: Rome, Italy, 2008. [Google Scholar]
  35. Chen, L.; Shi, H.; Li, Z.; Yang, F.; Zhang, X.; Xue, Y.; Zhang, H.; Xue, C. Molecular mechanism of protein dynamic change in Pacific oyster (Crassostrea gigas) during depuration at different salinities uncovered by mass spectrometry-based proteomics combined with bioinformatics. Food Chem. 2022, 394, 133454. [Google Scholar] [CrossRef] [PubMed]
  36. Anon. Regulation (EC) No. 853/2004 of the European Parliament and of the Council of 29 April 2004 laying down specific hygiene rules for food of animal origin. 2004. [Google Scholar]
  37. van Cauwenberghe, L.; Janssen, C.R. Microplastics in bivalves cultured for human consumption. Environ. Pollut. 2014, 193, 65–70. [Google Scholar] [CrossRef]
  38. Birnstiel, S.; Soares-Gomes, A.; da Gama, B.A.P. Depuration reduces microplastic content in wild and farmed mussels. Mar. Pollut. Bull. 2019, 140, 241–247. [Google Scholar] [CrossRef] [PubMed]
  39. Fernández, B.; Albentosa, M. Dynamic of small polyethylene microplastics (≤10 μm) in mussel’s tissues. Mar. Pollut. Bull. 2019, 146, 493–501. [Google Scholar] [CrossRef]
  40. Fernández, B.; Albentosa, M. Insights into the uptake, elimination and accumulation of microplastics in mussel. Environ. Pollut. 2019, 249, 321–329. [Google Scholar] [CrossRef] [PubMed]
  41. Graham, P.; Palazzo, L.; Andrea de Lucia, G.; Telfer, T.C.; Baroli, M.; Carboni, S. Microplastics uptake and egestion dynamics in Pacific oysters, Magallana gigas (Thunberg, 1793), under controlled conditions. Environ. Pollut. 2019, 252, 742–748. [Google Scholar] [CrossRef]
  42. Chae, Y.; An, Y.-J. Effects of food presence on microplastic ingestion and egestion in Mytilus galloprovincialis. Chemosphere 2020, 240, 124855. [Google Scholar] [CrossRef]
  43. Ward, J.E.; Zhao, S.; Holohan, B.A.; Mladinich, K.M.; Griffin, T.W.; Wozniak, J.; Shumway, S.E. Selective Ingestion and Egestion of Plastic Particles by the Blue Mussel (Mytilus edulis) and Eastern Oyster (Crassostrea virginica): Implications for Using Bivalves as Bioindicators of Microplastic Pollution. Environ. Sci. Technol. 2019, 53, 8776–8784. [Google Scholar] [CrossRef]
  44. Covernton, G.A.; Dietterle, M.; Pearce, C.M.; Gurney-Smith, H.J.; Dower, J.F.; Dudas, S.E. Depuration of anthropogenic particles by Pacific oysters (Crassostrea gigas): Feasibility and efficacy. Mar. Pollut. Bull. 2022, 181, 113886. [Google Scholar] [CrossRef]
  45. Choi, H.; Im, D.-H.; Park, Y.-H.; Lee, J.-W.; Yoon, S.-J.; Hwang, U.-K. Ingestion and egestion of polystyrene microplastic fragments by the Pacific oyster, Crassostrea gigas. Mar. Pollut. Bull. 2022, 307, 119217. [Google Scholar] [CrossRef]
  46. Weinstein, J.E.; Ertel, B.M.; Gray, A.D. Accumulation and depuration of microplastic fibers, fragments, and tire particles in the eastern oyster, Crassostrea virginica: A toxicokinetic approach. Environ. Pollut. 2022, 308, 119681. [Google Scholar] [CrossRef] [PubMed]
  47. Expósito, N.; Barrientos-Riosalido, A.; Santini, S.; Cincinelli, A.; Alcalde, L.; Castell, V.; Nadal, M.; Sierra, J.; Rovira, J. Microplastics levels in cultured or harvested mollusks non-depurated and commercially depurated at different times. Mar. Pollut. Bull. 2025, 212, 117568. [Google Scholar] [CrossRef] [PubMed]
  48. Avio, C.G.; Gorbi, S.; Milan, M.; Benedetti, M.; Fattorini, D.; d’Errico, G.; Pauletto, M.; Bargelloni, L.; Regoli, F. Pollutants bioavailability and toxicological risk from microplastics to marine mussels. Environ. Pollut. 2015, 198, 211–222. [Google Scholar] [CrossRef] [PubMed]
  49. Brandts, I.; Teles, M.; Gonçalves, A.P.; Barreto, A.; Franco-Martinez, L.; Tvarijonaviciute, A.; Martins, M.A.; Soares, A.M.V.M.; Tort, L.; Oliveira, M. Effects of nanoplastics on Mytilus galloprovincialis after individual and combined exposure with carbamazepine. Sci. Total Environ. 2018, 643, 775–784. [Google Scholar] [CrossRef]
  50. Revel, M.; Châtel, A.; Perrein-Ettajani, H.; Bruneau, M.; Akcha, F.; Sussarellu, R.; Rouxel, J.; Costil, K.; Decottignies, P.; Cognie, B.; et al. Realistic environmental exposure to microplastics does not induce biological effects in the Pacific oyster Crassostrea gigas. Mar. Pollut. Bull. 2020, 150, 110627. [Google Scholar] [CrossRef]
  51. Vroom, R.J.E.; Koelmans, A.A.; Besseling, E.; Halsband, C. Aging of microplastics promotes their ingestion by marine zooplankton. Environ. Pollut. 2017, 231, 987–996. [Google Scholar] [CrossRef]
  52. Albentosa, M.; Sánchez-Hernández, M.; Campillo, J.A.; Moyano, F.J. Relationship between physiological measurements (SFG -scope for growth-) and the functionality of the digestive gland in Mytilus galloprovincialis. Comp. Biochem. Physiol. A Mol. Integr. Physiol. 2012, 163, 286–295. [Google Scholar] [CrossRef]
  53. Collignon, A.; Hecq, J.-H.; Glagani, F.; Voisin, P.; Collard, F.; Goffart, A. Neustonic microplastic and zooplankton in the North Western Mediterranean Sea. Mar. Pollut. Bull. 2012, 64, 861–864. [Google Scholar] [CrossRef]
  54. Burns, E.E.; Boxall, A.B.A. Microplastics in the aquatic environment: Evidence for or against adverse impacts and major knowledge gaps. Environ. Toxicol. Chem. 2018, 37, 2776–2796. [Google Scholar] [CrossRef]
  55. Kılıç, Ö.; Belivermiş, M.; Sıkdokur, E.; Sezer, N.; Aksüt, Y.; Pekmez, M.; Kösesakal, T.; Gerçek, Y.C. The combined effects of polyethylene microplastics and benzoanthracene on Manila clam Ruditapes philippinarum. Chemosphere 2023, 329, 138664. [Google Scholar] [CrossRef]
  56. Pizzurro, F.; Nerone, E.; Ancora, M.; Di Domenico, M.; Mincarelli, L.F.; Cammà, C.; Salini, R.; Di Renzo, L.; Di Giacinto, F.; Corbau, C.; et al. Exposure of Mytilus galloprovincialis to Microplastics: Accumulation, Depuration and Evaluation of the Expression Levels of a Selection of Molecular Biomarkers. Animals 2023, 14, 4. [Google Scholar] [CrossRef] [PubMed]
  57. Bustin, S.A.; Benes, V.; Garson, J.A.; Hellemans, J.; Huggett, J.; Kubista, M.; Mueller, R.; Nolan, T.; Pfaffl, M.W.; Shipley, G.L.; et al. The MIQE Guidelines: Minimum Information for Publication of Quantitative Real-Time PCR Experiments. Clin. Chem. 2009, 55, 611–622. [Google Scholar] [CrossRef] [PubMed]
  58. Morga, B.; Arzul, I.; Faury, N.; Renault, T. Identification of genes from flat oyster Ostrea edulis as suitable housekeeping genes for quantitative real time PCR. Fish Shellfish Immunol. 2010, 29, 937–945. [Google Scholar] [CrossRef]
  59. Livak, K.J.; Schmittgen, T.D. Analysis of Relative Gene Expression Data Using Real-Time Quantitative PCR and the 2−ΔΔCT Method. Methods 2001, 25, 402–408. [Google Scholar] [CrossRef] [PubMed]
  60. Schmittgen, T.D.; Livak, K.J. Analyzing real-time PCR data by the comparative CT method. Nat. Protoc. 2008, 3, 1101–1108. [Google Scholar] [CrossRef]
  61. Liao, C.-P.; Chiu, C.-C.; Huang, H.-W. Assessment of microplastics in oysters in coastal areas of Taiwan. Environ. Pollut. 2021, 286, 117437. [Google Scholar] [CrossRef]
  62. Hidalgo-Ruz, V.; Gutow, L.; Thompson, R.C.; Thiel, M. Microplastics in the Marine Environment: A Review of the Methods Used for Identification and Quantification. Environ. Sci. Technol. 2012, 46, 3060–3075. [Google Scholar] [CrossRef]
  63. R Core Team. R: A Language and Environment for Statistical Computing; R Foundation for Statistical Computing: Vienna, Austria, 2022; Available online: https://www.r-project.org/ (accessed on 22 January 2024).
  64. RefFinder. Available online: https://blooge.cn/RefFinder/ (accessed on 27 December 2023).
  65. Xie, F.; Wang, J.; Zhang, B. RefFinder: A web-based tool for comprehensively analyzing and identifying reference genes. Funct. Integr. Genom. 2023, 23, 125. [Google Scholar] [CrossRef]
  66. Mangiafico, S. Package ‘rcompanion’. Cran Repos 2017, 20, 1–71. Available online: https://CRAN.R-project.org/package=rcompanion (accessed on 22 January 2024).
  67. Grubbs, F.E. Procedures for Detecting Outlying Observations in Samples. Technometrics 1969, 11, 1–21. [Google Scholar] [CrossRef]
  68. Burns, M.J.; Nixon, G.J.; Foy, C.A.; Harris, N. Standardisation of data from real-time quantitative PCR methods—Evaluation of outliers and comparison of calibration curves. BMC Biotechnol. 2005, 5, 31. [Google Scholar] [CrossRef]
  69. Lacroix, C.; Coquillé, V.; Guyomarch, J.; Auffret, M.; Moraga, D. A selection of reference genes and early-warning mRNA biomarkers for environmental monitoring using Mytilus spp. as sentinel species. Mar. Pollut. Bull. 2014, 86, 304–313. [Google Scholar] [CrossRef] [PubMed]
  70. Paul-Pont, I.; Lacroix, C.; González Fernández, C.; Hégaret, H.; Lambert, C.; le Goïc, N.; Frère, L.; Cassone, A.-L.; Sussarellu, R.; Fabioux, C.; et al. Exposure of marine mussels Mytilus spp. to polystyrene microplastics: Toxicity and influence on fluoranthene bioaccumulation. Environ. Pollut. 2016, 216, 724–737. [Google Scholar] [CrossRef] [PubMed]
  71. Ward, J.; Shumway, S.E. Separating the grain from the chaff: Particle selection in suspension- and deposit-feeding bivalves. J. Exp. Mar. Biol. Ecol. 2024, 300, 83–130. [Google Scholar] [CrossRef]
  72. Li, J.; Wang, Z.; Rotchell, J.M.; Shen, X.; Li, Q.; Zhu, J. Where are we? Towards an understanding of the selective accumulation of microplastics in mussels. Environ. Pollut. 2021, 286, 117543. [Google Scholar] [CrossRef] [PubMed]
  73. Ribeiro, F.; Garcia, A.R.; Pereira, B.P.; Fonseca, M.; Mestre, N.C.; Fonseca, T.G.; Ilharco, L.M.; Bebianno, M.J. Microplastics effects in Scrobicularia plana. Mar. Pollut. Bull. 2017, 122, 379–391. [Google Scholar] [CrossRef]
  74. O’Connor, W.A.; Zammit, A.; Dove, M.C.; Stevenson, G.; Taylor, M.D. First observations of perfluorooctane sulfonate occurrence and depuration from Sydney Rock Oysters, Saccostrea glomerata, in Port Stephens NSW Australia. Mar. Pollut. Bull. 2018, 127, 207–210. [Google Scholar] [CrossRef]
  75. Pittinger, C.A.; Buikema, A.L.; Hornor, S.G.; Young, R.W. Variation in tissue burdens of polycyclic aromatic hydrocarbons in indigenous and relocated oysters. Environ. Toxicol. Chem. 1985, 4, 379–387. [Google Scholar] [CrossRef]
  76. Martinez-Albores, A.; Lopez-Santamarina, A.; Rodriguez, J.A.; Ibarra, I.S.; Mondragón, A.d.C.; Miranda, J.M.; Lamas, A.; Cepeda, A. Complementary Methods to Improve the Depuration of Bivalves: A Review. Foods 2020, 9, 129. [Google Scholar] [CrossRef]
  77. Shen, X.; Su, Y.-C.; Liu, C.; Oscar, T.; DePaola, A. Efficacy of Vibrio parahaemolyticus depuration in oysters (Crassostrea gigas). Food Microbiol. 2019, 79, 35–40. [Google Scholar] [CrossRef]
  78. Phuvasate, S.; Chen, M.-H.; Su, Y.-C. Reductions of Vibrio parahaemolyticus in Pacific oysters (Crassostrea gigas) by depuration at various temperatures. Food Microbiol. 2012, 31, 51–56. [Google Scholar] [CrossRef]
  79. Battistini, R.; Masotti, C.; Listorti, V.; Suffredini, E.; Maurella, C.; Garcia-Vozmediano, A.; Costa, E.; Iacona, F.; Orlandi, M.; Ercolini, C.; et al. Norovirus Persistence in Oysters to Prolonged Commercial Purification. Pathogens 2021, 10, 944. [Google Scholar] [CrossRef] [PubMed]
  80. Baker-Austin, C.; Trinanes, J.A.; Taylor, N.G.H.; Hartnell, R.; Siitonen, A.; Martinez-Urtaza, J. Emerging Vibrio risk at high latitudes in response to ocean warming. Nat. Clim. Change 2013, 3, 73–77. [Google Scholar] [CrossRef]
  81. Kolandhasamy, P.; Su, L.; Li, J.; Qu, X.; Jabeen, K.; Shi, H. Adherence of microplastics to soft tissue of mussels: A novel way to uptake microplastics beyond ingestion. Sci. Total Environ. 2018, 610–611, 635–640. [Google Scholar] [CrossRef] [PubMed]
  82. Doré, W.J.; Lees, D.N. Behavior of Escherichia coli and male-specific bacteriophage in environmentally contaminated bivalve molluscs before and after depuration. Appl. Environ. Microbiol. 1995, 61, 2830–2834. [Google Scholar] [CrossRef] [PubMed]
  83. Lees, D. Viruses and bivalve shellfish. Int. J. Food Microbiol. 2000, 59, 81–116. [Google Scholar] [CrossRef]
  84. European Commission. Regulation (EC) n. 854/2004 of the European Parliament and of the Council of 29 April 2004 laying down specific rules for the organisation of official controls on products of animal origin intended for human consumption. 2004. [Google Scholar]
  85. Barrientos, M.; Vásquez Lavín, F.; Ponce Oliva, R.D.; Nayga, R.M., Jr.; Gelcich, S. Microplastics in seafood: Consumer preferences and valuation for mitigation technologies. Food Res. Int. 2024, 187, 114342. [Google Scholar] [CrossRef]
  86. Finley, D. An alternative to destruction. Nature 2001, 412, 283–285. [Google Scholar] [CrossRef]
  87. Marques, C.; Pereira, P.; Taylor, A.; Liang, J.N.; Reddy, V.N.; Szweda, L.I.; Shang, F. Ubiquitin-dependent lysosomal degradation of the HNE-modified proteins in lens epithelial cells. FASEB J. 2004, 18, 1424–1426. [Google Scholar] [CrossRef]
  88. Araya, M.T.; Siah, A.; Mateo, D.; Markham, F.; McKenna, P.; Johnson, G.; Berthe, F.C.J. Selection and evaluation of housekeeping genes for haemocytes of soft-shell clams (Mya arenaria) challenged with Vibrio splendidus. J. Invertebr. Pathol. 2008, 99, 326–331. [Google Scholar] [CrossRef]
  89. Cubero-Leon, E.; Ciocan, C.M.; Minier, C.; Rotchell, J.M. Reference gene selection for qPCR in mussel, Mytilus edulis, during gametogenesis and exogenous estrogen exposure. Environ. Sci. Pollut. Res. 2012, 19, 2728–2733. [Google Scholar] [CrossRef] [PubMed]
Figure 1. The experimental setup consisted of two glass aquariums containing filtered synthetic seawater, placed in a thermostatic chamber at 18 ± 1 °C, in which the Ostrea edulis specimens were tested.
Water 17 01063 g001
Figure 2. Images of MPs particles used in the experiment: fibers (A,B), beads (C,D), and fragments (E,F), scale bar: 50 µm.
Water 17 01063 g002
Figure 3. Box plot of the MPs particles/g distribution observed in the three experimental replicates.
Water 17 01063 g003
Figure 4. Size classes of MPs accumulated in Ostrea edulis following the 28-day experimental exposure phase.
Water 17 01063 g004
Figure 5. Trend in filament size classes in Ostrea edulis during the 7 days (168 h) of the depuration phase.
Water 17 01063 g005
Figure 6. Trend in “percentage” and in “number” of MPs particles/g in Ostrea edulis during the 7 days (168 h) of the depuration phase.
Water 17 01063 g006
Figure 7. Trend of MP size classes in Ostrea edulis during the 7 days (168 h) of the depuration phase.
Water 17 01063 g007
Figure 8. Trend of MPs types (filaments, fragments, and beads) in Ostrea edulis during the 7 days (168 h) of the depuration phase.
Water 17 01063 g008
Figure 9. EF-1α (a), L5 (b), and Ubiq (c) expression in the digestive gland. Data are expressed as Fold Change values (2−ΔΔCt) at time 0 (T0), control at time 7 (T7 CTRL), microplastic exposure at time 7 (T7 MPs), control at time 14 (T24 CTRL), microplastic exposure at time 14 (T14 MPs), control at time 21 (T21 CTRL), microplastic exposure at time 21 (T21 MPs), control at time 28 (T28 CTRL), microplastic exposure at time 28 (T7 MPs).
Water 17 01063 g009aWater 17 01063 g009b
Figure 10. EF-1α (a), L5 (b), and Ubiq (c) expression in the gills. Data are expressed as Fold Change values (2−ΔΔCt) at time 0 (T0), control at time 7 (T7 CTRL), microplastic exposure at time 7 (T7 MPs), control at time 14 (T24 CTRL), microplastic exposure at time 14 (T14 MPs), control at time 21 (T21 CTRL), microplastic exposure at time 21 (T21 MPs), control at time 28 (T28 CTRL), microplastic exposure at time 28 (T7 MPs).
Water 17 01063 g010aWater 17 01063 g010b
Table 1. Trend (%) of the number of MPs’ particles during the 7 days (168 h) of the depuration phase.
IDDepuration Time (Days)MPs Particles/
Individual
MPs/gDecrease %
D0 53.35.3
D24h115.31.669%
D48h212.01.179%
D72h310.31.180%
D96h49.00.590%
D120h58.70.592%
D144h67.90.492%
D168h77.70.492%
Disclaimer/Publisher’s Note: The statements, opinions and data contained in all publications are solely those of the individual author(s) and contributor(s) and not of MDPI and/or the editor(s). MDPI and/or the editor(s) disclaim responsibility for any injury to people or property resulting from any ideas, methods, instructions or products referred to in the content.

