1. Introduction
The increasing demand for freshwater resources is a critical global challenge, as highlighted in the 2021 World Water Development Report published by UNESCO. This report reveals that global freshwater usage has surged sixfold over the past century and continues to grow at an approximate annual rate of 1% since the 1980s [
1,
2]. Although water is abundant on Earth’s surface, only a small fraction is freshwater, accounting for merely 2.6%, with less than 1% being directly accessible for human consumption and other uses; the majority exists in the form of glaciers and ice caps [
3,
4]. This limited availability underscores the urgent need for sustainable water management, particularly given the extensive use of freshwater by various industries such as textiles, tanning, paper manufacturing, plastics, and dye production [
5,
6].
Industrialization, coupled with rapid urbanization and a lack of environmental awareness, has led to the widespread discharge of untreated industrial effluents, hazardous chemicals, and other pollutants into natural water bodies [
4]. Such practices have significantly degraded freshwater resources, rendering them unsuitable for consumption or other applications. Statistics indicate that approximately 80% of wastewater, originating from both industrial and urban activities, is released into the environment without undergoing any form of treatment [
7]. This issue is especially pronounced in developing countries, where the lack of wastewater treatment infrastructure and sanitation facilities exacerbates the problem. Untreated wastewater is a major environmental concern as it introduces toxic and persistent pollutants into ecosystems, posing serious risks to both human health and biodiversity [
8,
9,
10].
One of the most significant contributors to water pollution is synthetic dyes, extensively utilized in numerous industries for coloring textiles, plastics, papers, and other materials [
10]. Between 2016 and 2023, the dye industry, dominated by Asia, experienced substantial growth, with an estimated annual increase of 8.13% [
11]. Among the industrial sectors, the textile industry is responsible for the largest share of dye pollution, releasing approximately 54% of all dye effluents into the environment. These pollutants cause a range of environmental issues, such as the discoloration of water, a reduction in dissolved oxygen levels, and the destruction of aquatic ecosystems, which negatively impact flora and fauna [
12]. As a result, it is essential to implement effective treatment methods to remove dyes from wastewater before discharge.
Numerous methods have been developed to address dye contamination in water, including advanced physicochemical techniques such as coagulation [
13], advanced oxidation [
14,
15,
16], microalgae [
17], and membrane filtration [
18,
19,
20,
21]. While these methods are effective in certain contexts, they often face limitations such as high operational costs, the generation of secondary pollutants, and a reliance on potentially hazardous chemicals. This has led researchers to focus on alternative remediation approaches that are environmentally friendly, cost-effective, and free from undesirable side effects.
Among these approaches, adsorption has emerged as a highly promising technique for dye removal due to its simplicity, efficiency, and adaptability [
22]. The effectiveness of an adsorption process depends largely on the properties of the adsorbent material, including its mechanical stability, selectivity for specific pollutants, adsorption capacity, cost of regeneration, and environmental compatibility [
23]. Therefore, adsorption technologies have gained widespread attention as an effective solution for wastewater treatment due to their high capability to remove organic and inorganic pollutants from aquatic environments. Sustainable adsorbent materials, such as activated carbon and nanocomposites, are promising alternatives to conventional techniques due to their efficiency, ease of use, and potential for regeneration and reuse [
24]. Moreover, recycling solid waste to produce adsorptive materials enhances environmental sustainability by reducing industrial and agricultural waste while providing cost-effective solutions for treating contaminated water [
25]. Among the promising applications, hybrid materials, such as nanomaterials supported by activated carbon, have emerged as effective adsorbents for removing various pollutants from wastewater. These materials enhance adsorption efficiency by increasing the specific area and improving the physicochemical properties of the adsorbent [
26]. These advancements highlight the importance of continuous research in optimizing adsorption technologies and solid waste recycling to develop more efficient and sustainable solutions for wastewater treatment. In recent years, there has been growing interest in the use of low-cost, eco-friendly adsorbents derived from agricultural and industrial waste. Examples of such materials include potato peel [
27], apple peel [
28], orange peel [
29], coffee waste [
30], wheat husk [
31], and loofah cylindrica [
21]. These biomaterials offer dual benefits: they provide an efficient solution for wastewater treatment while also addressing the issue of waste management [
30,
31,
32,
33,
34,
35].
In Algeria, a significant amount of animal bones is generated as waste from the food industry [
35,
36,
37,
38,
39,
40]. These bones are often discarded, contributing to environmental pollution. However, their abundance and natural composition make them a viable candidate for valorization as biosorbents in wastewater treatment [
41,
42,
43,
44]. Utilizing these waste materials aligns with the principles of sustainability, as it promotes resource recovery and environmental protection [
45,
46,
47,
48]. It has two benefits: it addresses the rising issue of wastewater tainted with dyes and offers a useful recycling solution for poultry waste, which would otherwise contribute to environmental pollution [
48,
49,
50,
51,
52]. Furthermore, its low cost, availability, and eco-friendly nature make it an attractive alternative to synthetic adsorbents, promising an efficient and sustainable approach to wastewater treatment.
Traditional modeling approaches for adsorption process optimization often rely on empirical equations and linear regression models [
32]. While these techniques provide valuable insights, they may struggle to capture complex, nonlinear interactions between multiple adsorption parameters. Moreover, their predictive accuracy is often limited when dealing with large datasets or diverse experimental conditions exhibiting nonlinear relationships [
32]. Machine learning (ML) and artificial intelligence (AI) techniques have emerged as powerful alternatives, offering enhanced predictive capabilities by learning nonlinear relationships from experimental data [
32].
Among AI-based models, decision trees (DTs) have gained attention due to their ability to handle nonlinear relationships and provide interpretable models [
33,
34]. A DT is a supervised learning model that segments data based on successive criteria, forming a hierarchical structure [
33,
34]. Each internal node of the tree represents a rule or condition on a specific data feature, while each leaf corresponds to a final prediction or class. Despite their advantages, decision trees can be prone to overfitting, particularly when applied to noisy datasets or highly complex systems, and they may struggle to fully capture intricate interactions between adsorption parameters [
33,
34].
To overcome these limitations, ensemble learning techniques such as Least Squares Boosting (LSBOOST) have been introduced [
33,
34]. LSBOOST is an iterative boosting algorithm that combines the predictions of multiple weak models to generate a robust final model. Unlike traditional ensemble methods, LSBOOST corrects errors at each iteration, improving predictive accuracy and reducing overfitting. By integrating LSBOOST with decision trees (DT_LSBOOST), it is possible to enhance the accuracy and reliability of adsorption process modeling, effectively capturing both linear and nonlinear interactions while maintaining model interpretability [
33,
34].
In this work, an in-depth study was conducted to evaluate the potential of chicken biomass as a sustainable biosorbent for the treatment of water contaminated with synthetic dyes. Two distinct forms of biomass were prepared: a native form and a calcined form, obtained by high-temperature thermal treatment. The work began with the preparation of the biosorbents, including meticulous cleaning, grinding, and controlled calcination to remove organic impurities and modify the structure of the biomass. These samples were then characterized using techniques such as Fourier-transform infrared spectroscopy (FTIR), scanning electron microscopy (SEM), and X-ray diffraction (XRD), allowing the documentation of their structural and morphological properties. The specific surface area of the biosorbents was also determined using a method based on methylene blue adsorption. A comprehensive experimental study was carried out to evaluate the adsorption performance of both biosorbents with respect to two dyes, basic fuchsine and methylene blue. The effects of several operational parameters, including contact time, initial dye concentration, and adsorbent mass, were examined to understand the underlying adsorption mechanisms. The data obtained were analyzed using kinetic models (pseudo-first order, pseudo-second order, and intra-particle diffusion) to explore the adsorption kinetics mechanisms. Additionally, Langmuir and Freundlich adsorption isotherms were fitted to the experimental data to describe the adsorbent–adsorbate interactions and characterize the adsorption capacities at equilibrium. A thermodynamic analysis was also conducted to determine the spontaneity and the energetic nature of the adsorption processes. Additionally, a predictive model based on a coupling of a decision tree and a Least Squares Boosting method (DT_LSBOOST) was developed. This model allows the prediction of adsorption capacities based on experimental parameters, integrating continuous variables (time, concentration, and mass) and categorical variables (dye type and biosorbent type). Finally, a MATLAB R2022b application was developed to facilitate the prediction of biosorbent adsorption capacities based on experimental parameters. This application utilized the DT_LSBOOST model, allowing researchers to simulate different adsorption conditions and obtain reliable predictive results, thereby contributing to the optimization of the water treatment process. This comprehensive approach enabled the understanding of the biosorbents’ properties and the optimization of their use for dye adsorption under varying conditions, while also proposing an innovative predictive methodology for future applications.
This study presents a novel approach to valorizing chicken bone biomass, emphasizing its potential as a sustainable and efficient biosorbent for wastewater treatment. By exploring both (NBio) and (CBio) forms, it provides a comprehensive understanding of how thermal treatment enhances adsorption performance. The dual-state comparison is a key innovation, shedding light on the structural, morphological, and functional transformations induced by calcination. The research employs characterization techniques, including FTIR, SEM, XRD, and specific surface area analysis, to investigate the changes in properties of the biosorbents. These analyses reveal how calcination impacts the surface area, crystallinity, and porosity, offering detailed insights into the mechanisms underlying improved adsorption capacity. This thorough structural assessment is a critical step forward in understanding and optimizing biosorbent performance. A significant contribution of this study lies in its integration of experimental and predictive modeling methodologies. Adsorption kinetics and equilibrium studies are coupled with thermodynamic analyses, offering a holistic view of the biosorption process. The kinetic models help identify the dominant adsorption mechanisms, while thermodynamic evaluations provide insights into the energy dynamics and feasibility of the process under various conditions. Additionally, a predictive modeling application was developed using a decision tree coupled with Least Squares Boosting (DT_LSBOOST) to estimate adsorption capacities with exceptional accuracy. This MATLAB-based application allows users to input key experimental parameters, including contact time, adsorbent dosage, dye concentration, and the type of dye and biosorbent, to instantly predict adsorption outcomes. This application bridges the gap between research and practical implementation, providing a user-friendly tool for optimizing wastewater treatment processes. Finally, this research aligns with sustainability principles by repurposing a widely available food industry byproduct into an effective solution for environmental remediation. By transforming waste materials into high-performance adsorbents, this study addresses critical challenges in pollution control and resource recovery, offering a scalable and environmentally friendly approach to tackling water pollution.
3. Results and Discussion
3.1. XRD Analysis of Native and Calcined Biomasses
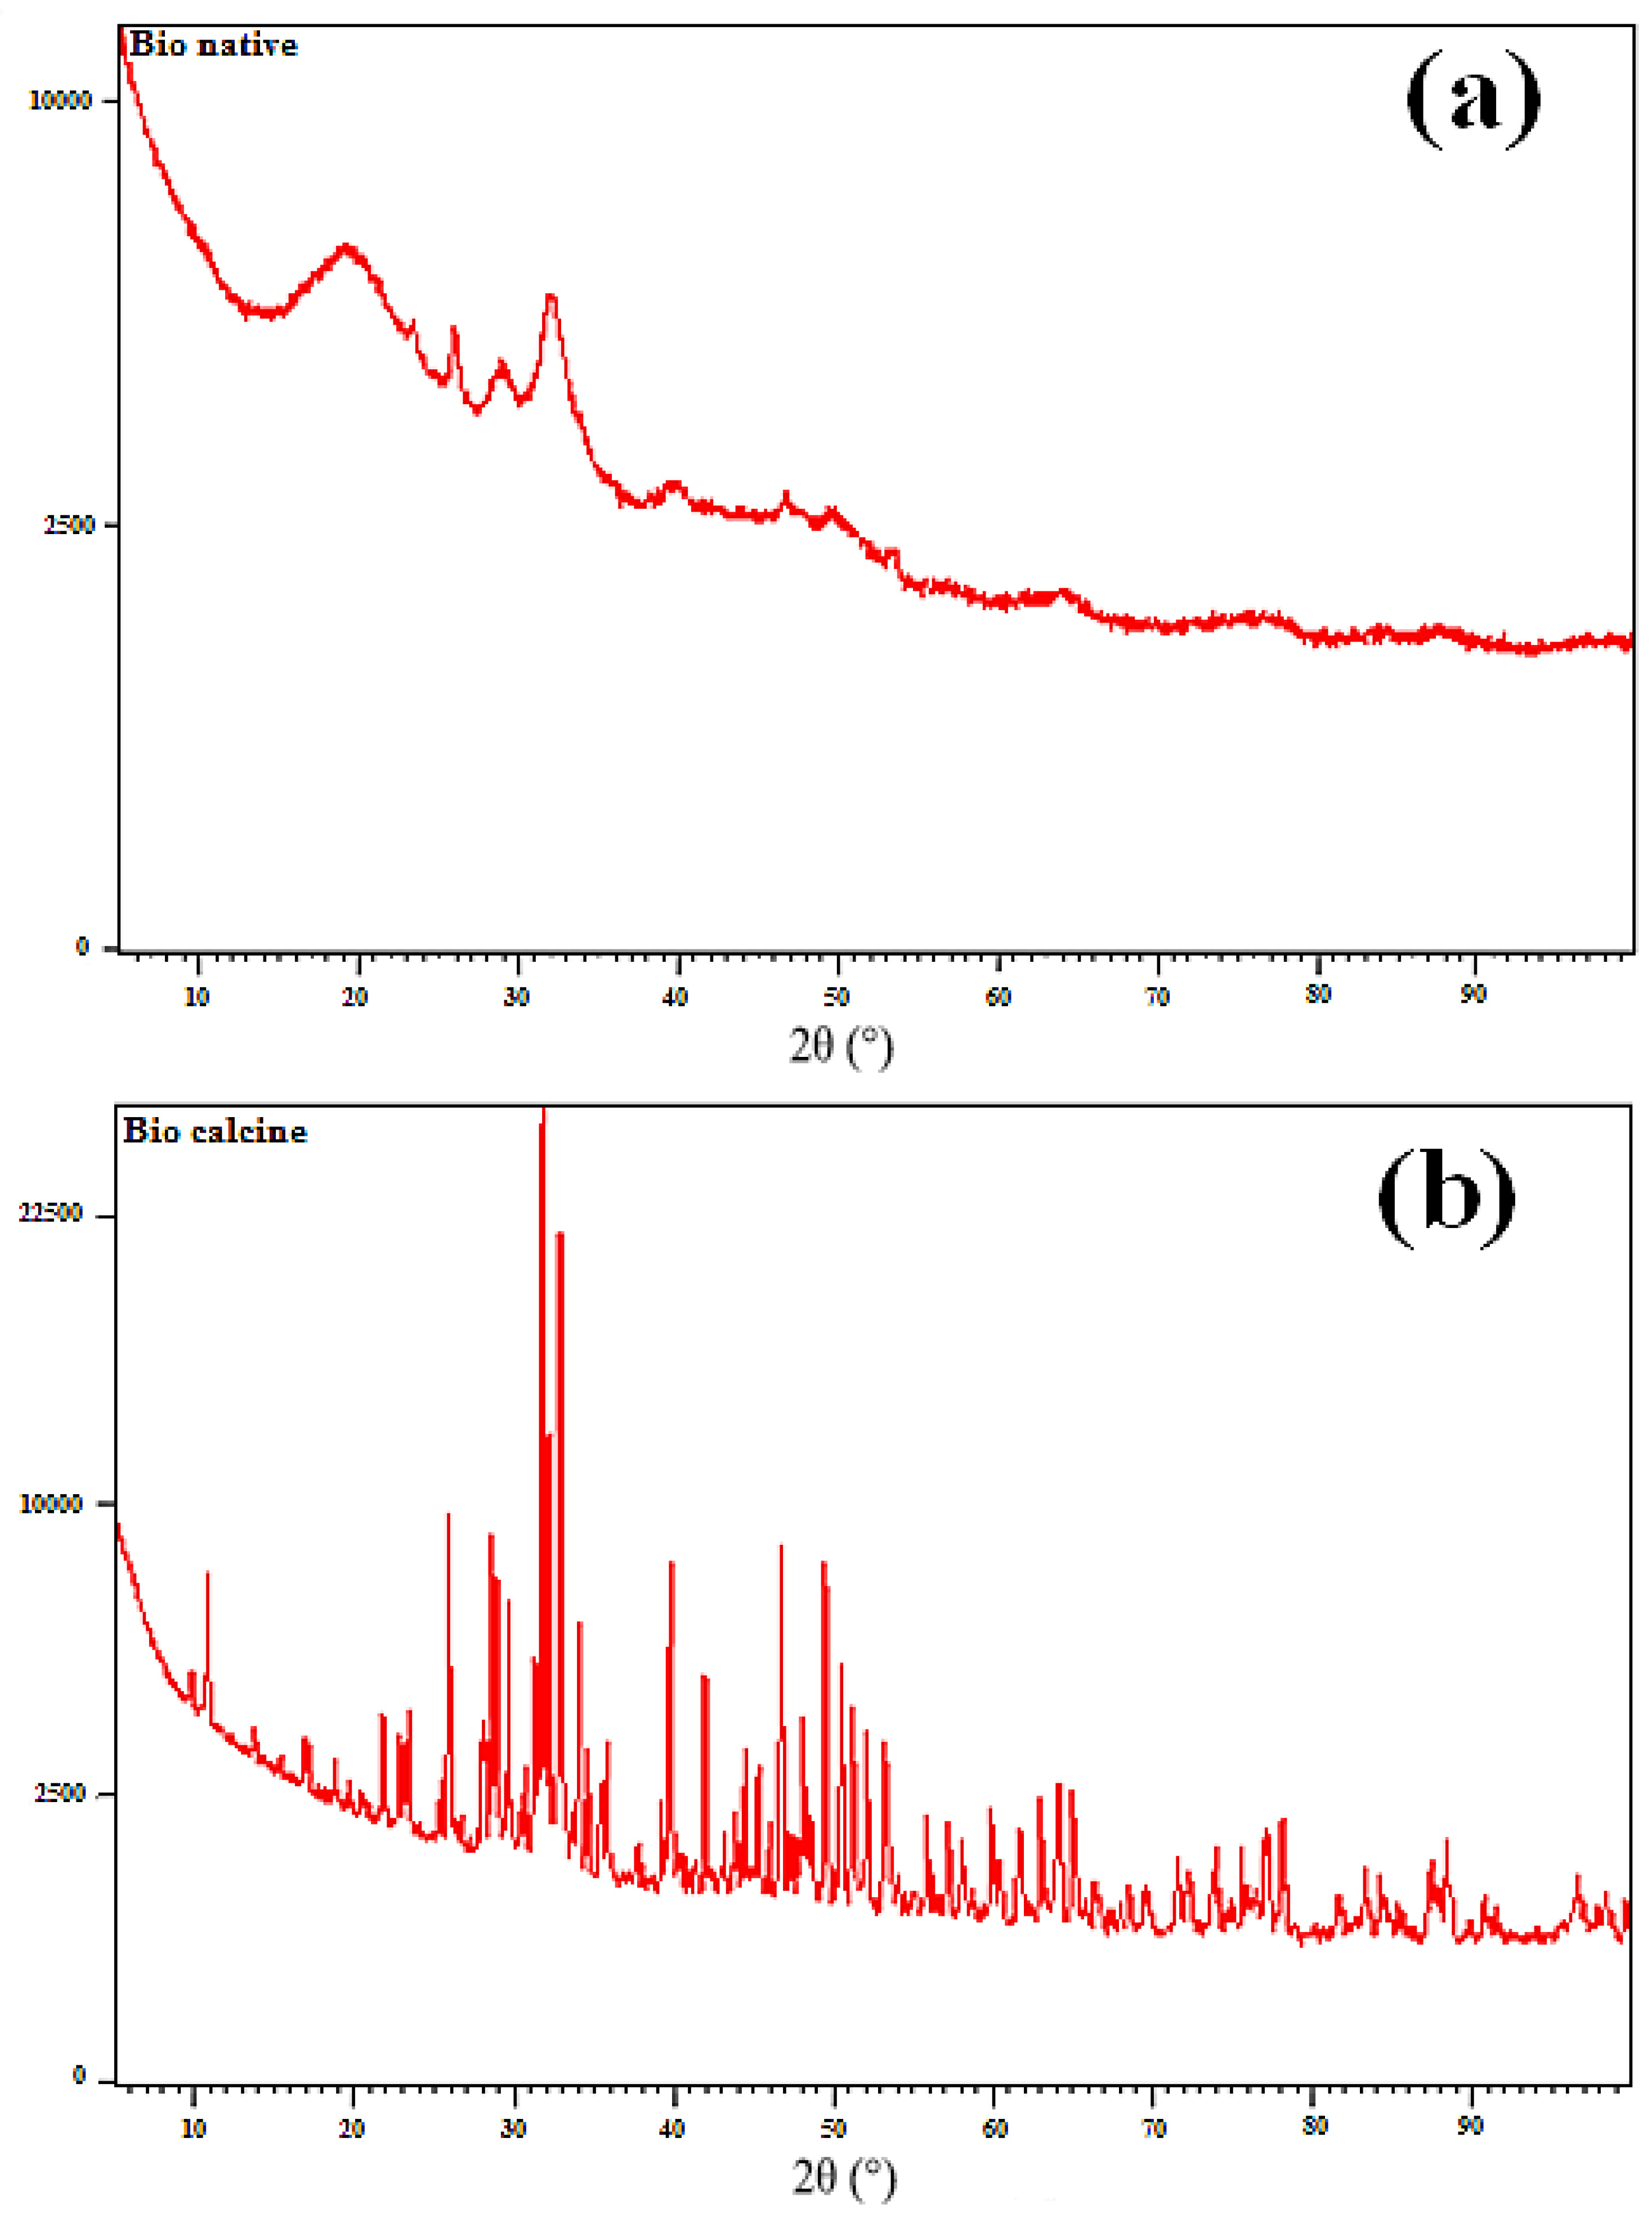
The XRD analysis of the NBio and CBio samples is presented in
Figure 1, providing valuable insight into the crystallographic structure of both the native and calcined biomasses. The diffractogram of the NBio shown in
Figure 1a reveals a broad peak at 19.8°, which can be associated with the amorphous phase of the sample. Additionally, two broad peaks are observed at 25.9° and 32.22°, which correspond to the (002) and (211) planes, respectively, as previously reported for hydroxyapatite (HAP) (JCPDS cards for XRD analysis) [
54]. These peaks are characteristic of hydroxyapatite’s crystalline structure, albeit in a less defined form due to the presence of amorphous materials in the native biomass. The peak at 29.22° further indicates the presence of calcite, suggesting that the native biomass contains a mixture of mineral phases.
In contrast, the XRD pattern of the CBio presented in
Figure 1b displays several sharp and intense peaks, indicating a significant change in crystallinity after calcination. The peaks observed at 10.1°, 26°, 28.98°, 31.8°, 32.9°, 39.7°, 46.75°, and 49.96° correspond to specific Miller indices: (100), (002), (210), (211), (300), (310), (222), and (213), as listed in JCPDS card No. 00-009-0432. These peaks reflect the well-ordered crystalline structure that forms after the calcination of the native biomass. The difference in the sharpness and intensity of the peaks between NBio and CBio suggests that calcination enhances the crystallinity of the material, reducing the number of amorphous components and improving the overall order of the crystal lattice.
This improvement in crystallinity is further highlighted by the pronounced triplet between 31° and 33°, which becomes more distinct in the CBio sample, indicating that the material is more crystalline after calcination. This result supports the hypothesis that calcination leads to the decomposition of organic matter and the reorganization of inorganic phases, leading to the formation of a more crystalline structure, similar to that of hydroxyapatite.
The lattice constant parameters, denoted as a, b, and c, were calculated from the XRD data using Equation (1). These values provide information on the dimensions of the unit cell and the overall symmetry of the crystal structure. The average crystallite size of both NBio and CBio was estimated using Scherrer’s formula (Equation (2)), which allows for the determination of the size of the crystalline domains based on the width of the XRD peaks. The results, summarized in
Table 1, show that the crystallite size increases significantly after calcination, from 38.6 nm for NBio to 54.76 nm for CBio. This increase in crystallite size indicates that calcination promotes the growth of the crystalline domains, bringing the size closer to that of standard hydroxyapatite (HAP), which has a crystallite size of 68.84 nm. This trend highlights the effect of calcination in improving the crystallinity and structural integrity of the biomass-derived material, making it more suitable for applications that require well-defined crystalline structures, such as in adsorption processes or biomaterial synthesis.
3.2. FTIR Characterization
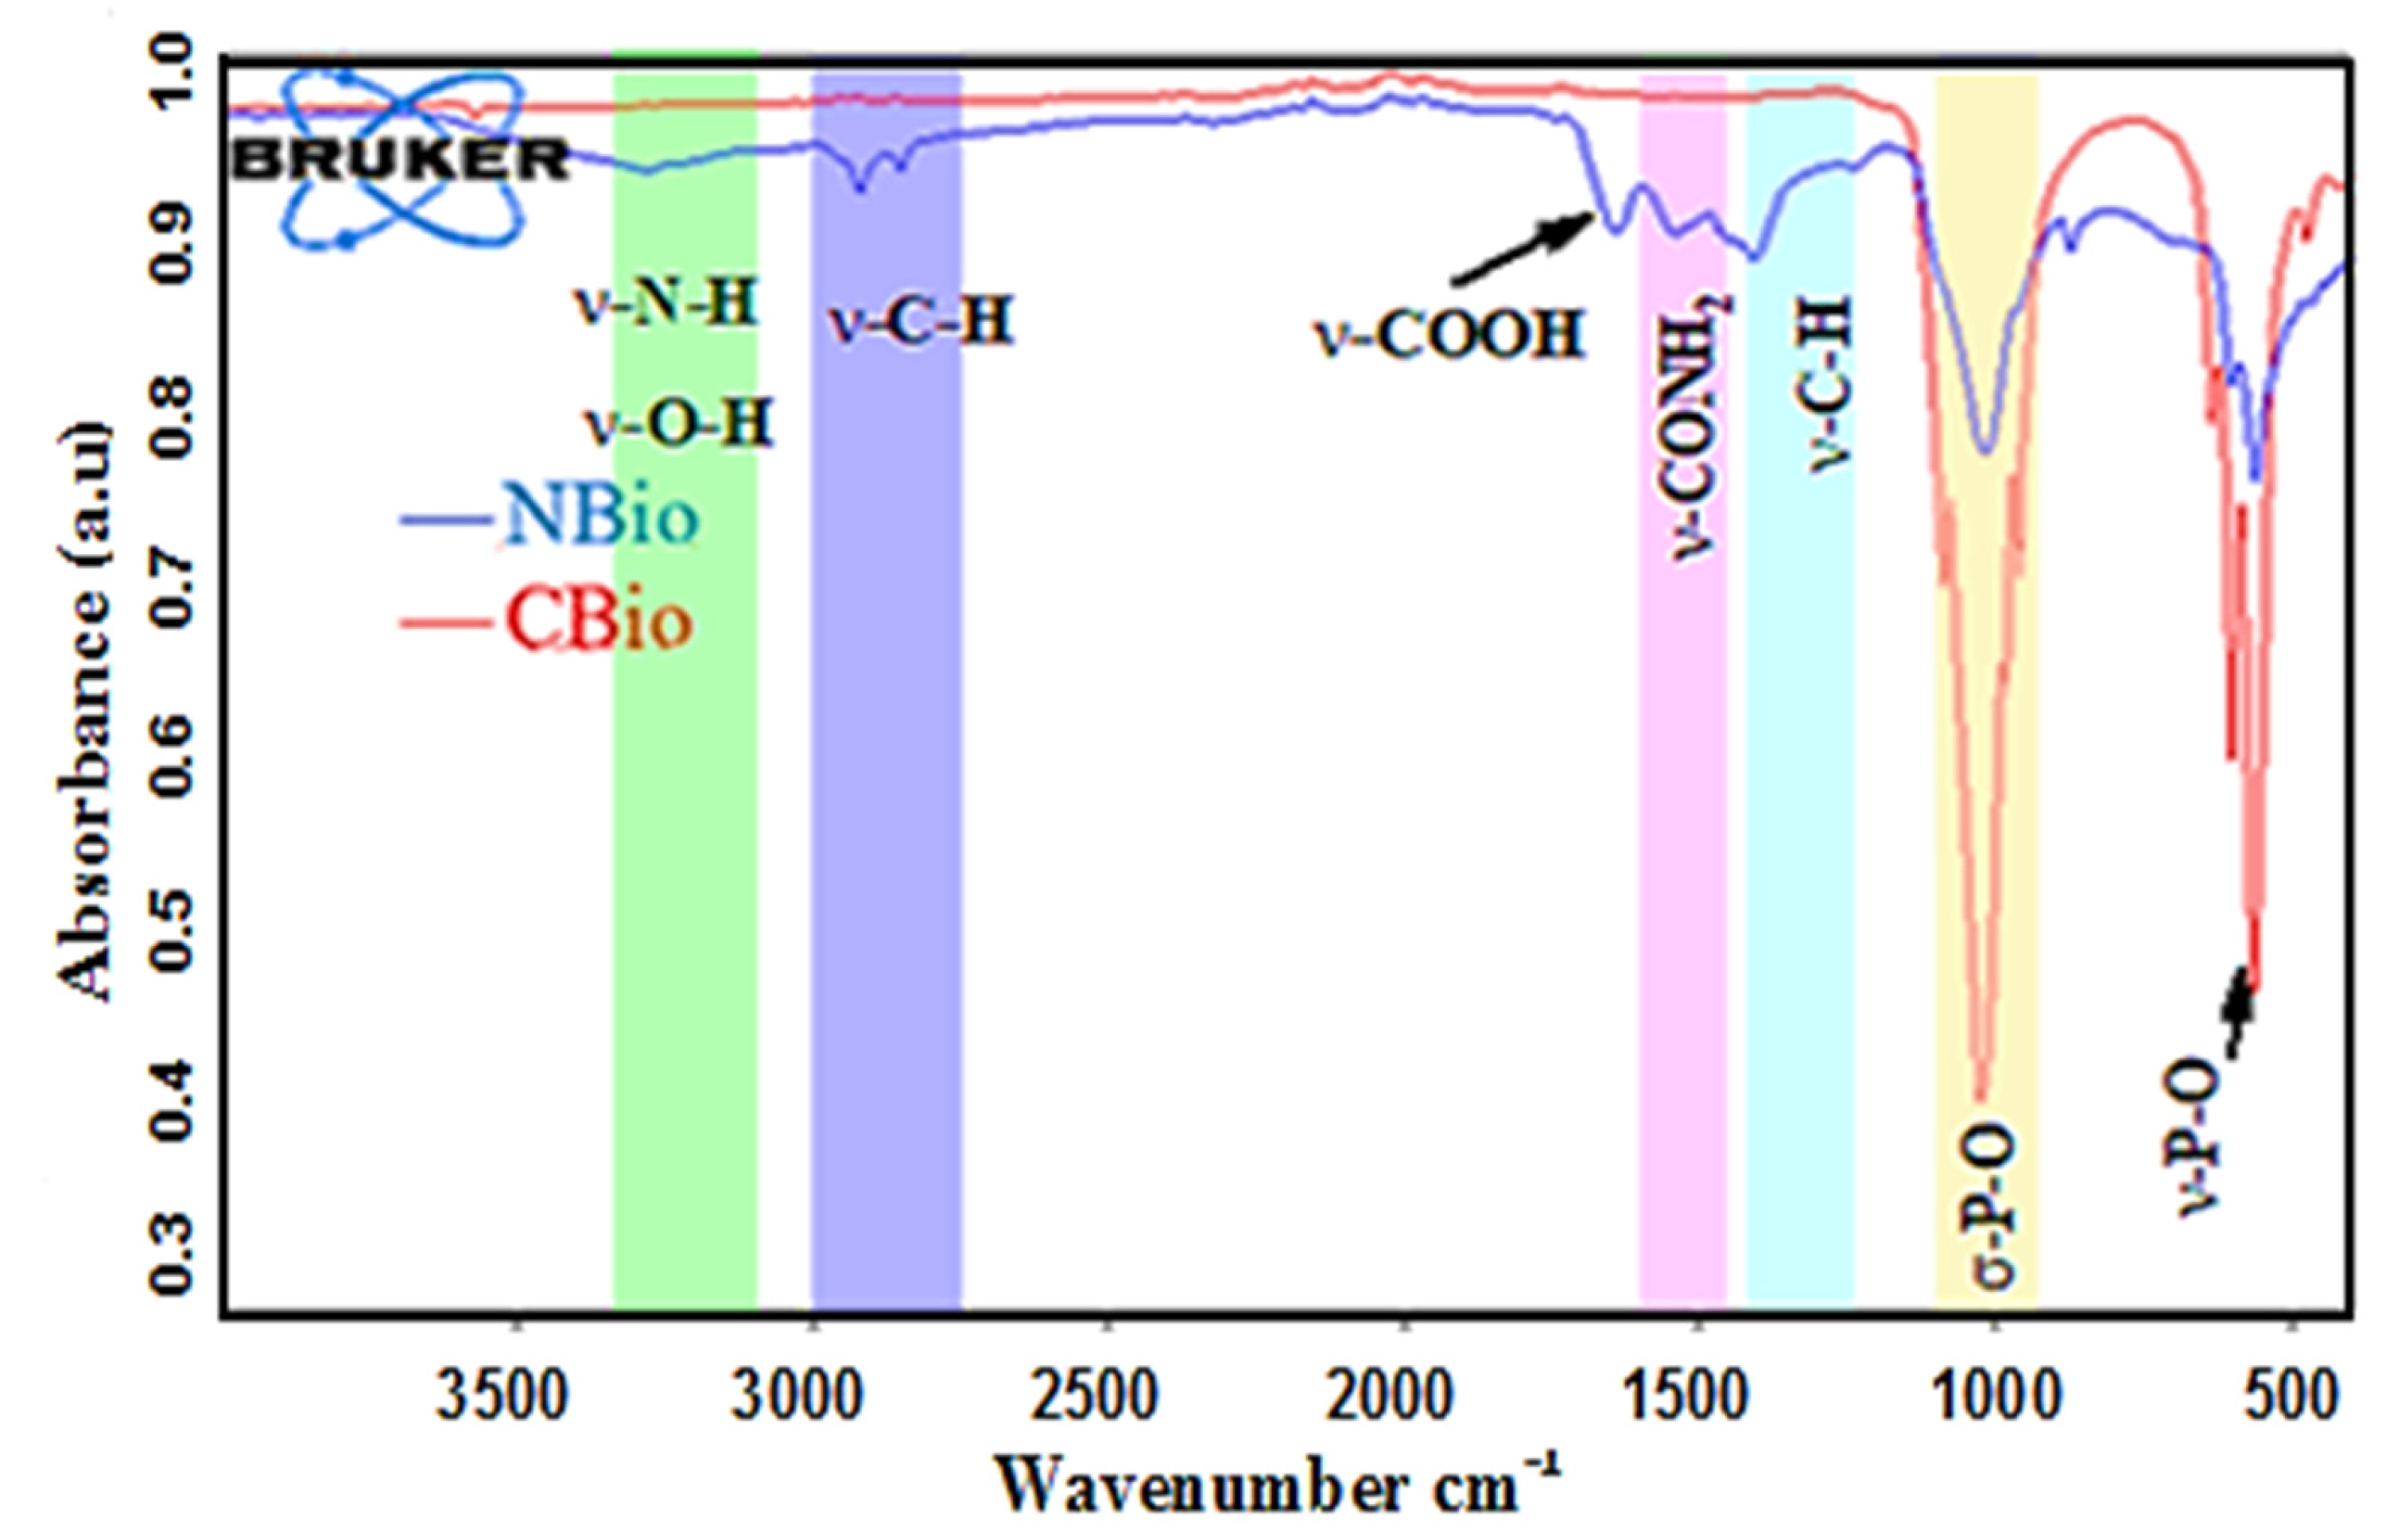
The infrared spectra of native and calcined chicken bone, shown in
Figure 2, clearly exhibit the effects of heat treatment, which causes significant changes in the material’s composition. The primary difference between the two spectra lies in the removal of organic compounds such as fats and proteins during calcination, as a result of the high temperature.
In the spectrum of the NBio, shown in
Figure 2 (in blue), a broad band near 3278.33 cm
−1 is observed, corresponding to the stretching vibrations of hydroxyl (O-H) and amine (N-H) groups. This band is characteristic of the presence of moisture and certain functional groups in the organic matrix of the bone. The bands at 2922.18 cm
−1 and 2853.51 cm
−1 are due to the C-H stretching vibrations of the alkyl groups (CH
3 and CH
2), which are associated with the fats present in the native biomass. These fatty acids and other lipids are part of the organic content of the chicken bone before calcination. The peak at 1458.24 cm
−1 is related to the C-H deformation vibrations of the CH
3 groups, along with the C-O stretching of the carbonate groups [
55], further indicating the presence of organic and mineral components in the native bone.
Additionally, the peaks at 1741.85 cm
−1 and 1538.08 cm
−1 are associated with the carboxyl (C=O) and amide (N-H) groups, which are typical of proteins and fats found in the native chicken bone. These peaks suggest the presence of proteinaceous material, such as collagen, and fat molecules. The peak at 1637.02 cm
−1 is due to the bending vibrations of water molecules that are physically adsorbed onto the surface of the bone. The 1163.33 cm
−1 peak corresponds to the C-N stretching vibrations of amines or amides, further supporting the presence of proteins in the native bone. Finally, the peaks at 1024.71 cm
−1 and 555.15 cm
−1 are attributed to the P-O bond vibrations of the phosphate groups [
22], which are representative of hydroxyapatite (HAP), a major inorganic mineral component of bone. These peaks confirm the bone’s mineral content, which is primarily composed of HAP.
After calcination, the spectrum of the CBio shows a significant transformation, as can be seen from
Figure 2 (in red). The intense peaks at 1021.81 cm
−1, 598.98 cm
−1, and 561.60 cm
−1 correspond to the P-O bond vibrations in phosphate groups (PO
43−), which are indicative of the preservation of the mineral phase after heat treatment. These peaks are similar to those found in the hydroxyapatite structure, demonstrating that calcination has maintained the mineral composition of the bone, despite the removal of the organic components.
The absence of the other peaks observed in the NBio spectrum, such as those related to the C-H, C-N, and carboxyl groups, strongly suggests that calcination has effectively decomposed the organic matter, including fats, proteins, and other volatile compounds. This removal process is essential for producing a more crystalline form of the bone’s inorganic components, leaving behind a highly mineralized structure primarily composed of HAP. Therefore, the calcination process not only removes organic impurities but also enhances the crystallinity of the mineral phase, as confirmed by the more defined and intense peaks in the CBio spectrum.
The infrared spectra highlight the significant structural and compositional changes that occur when chicken bone undergoes calcination. The heat treatment removes most organic matter, resulting in a cleaner, more crystalline mineral structure, while preserving the fundamental phosphate-based mineral content.
3.3. SEM Characterization
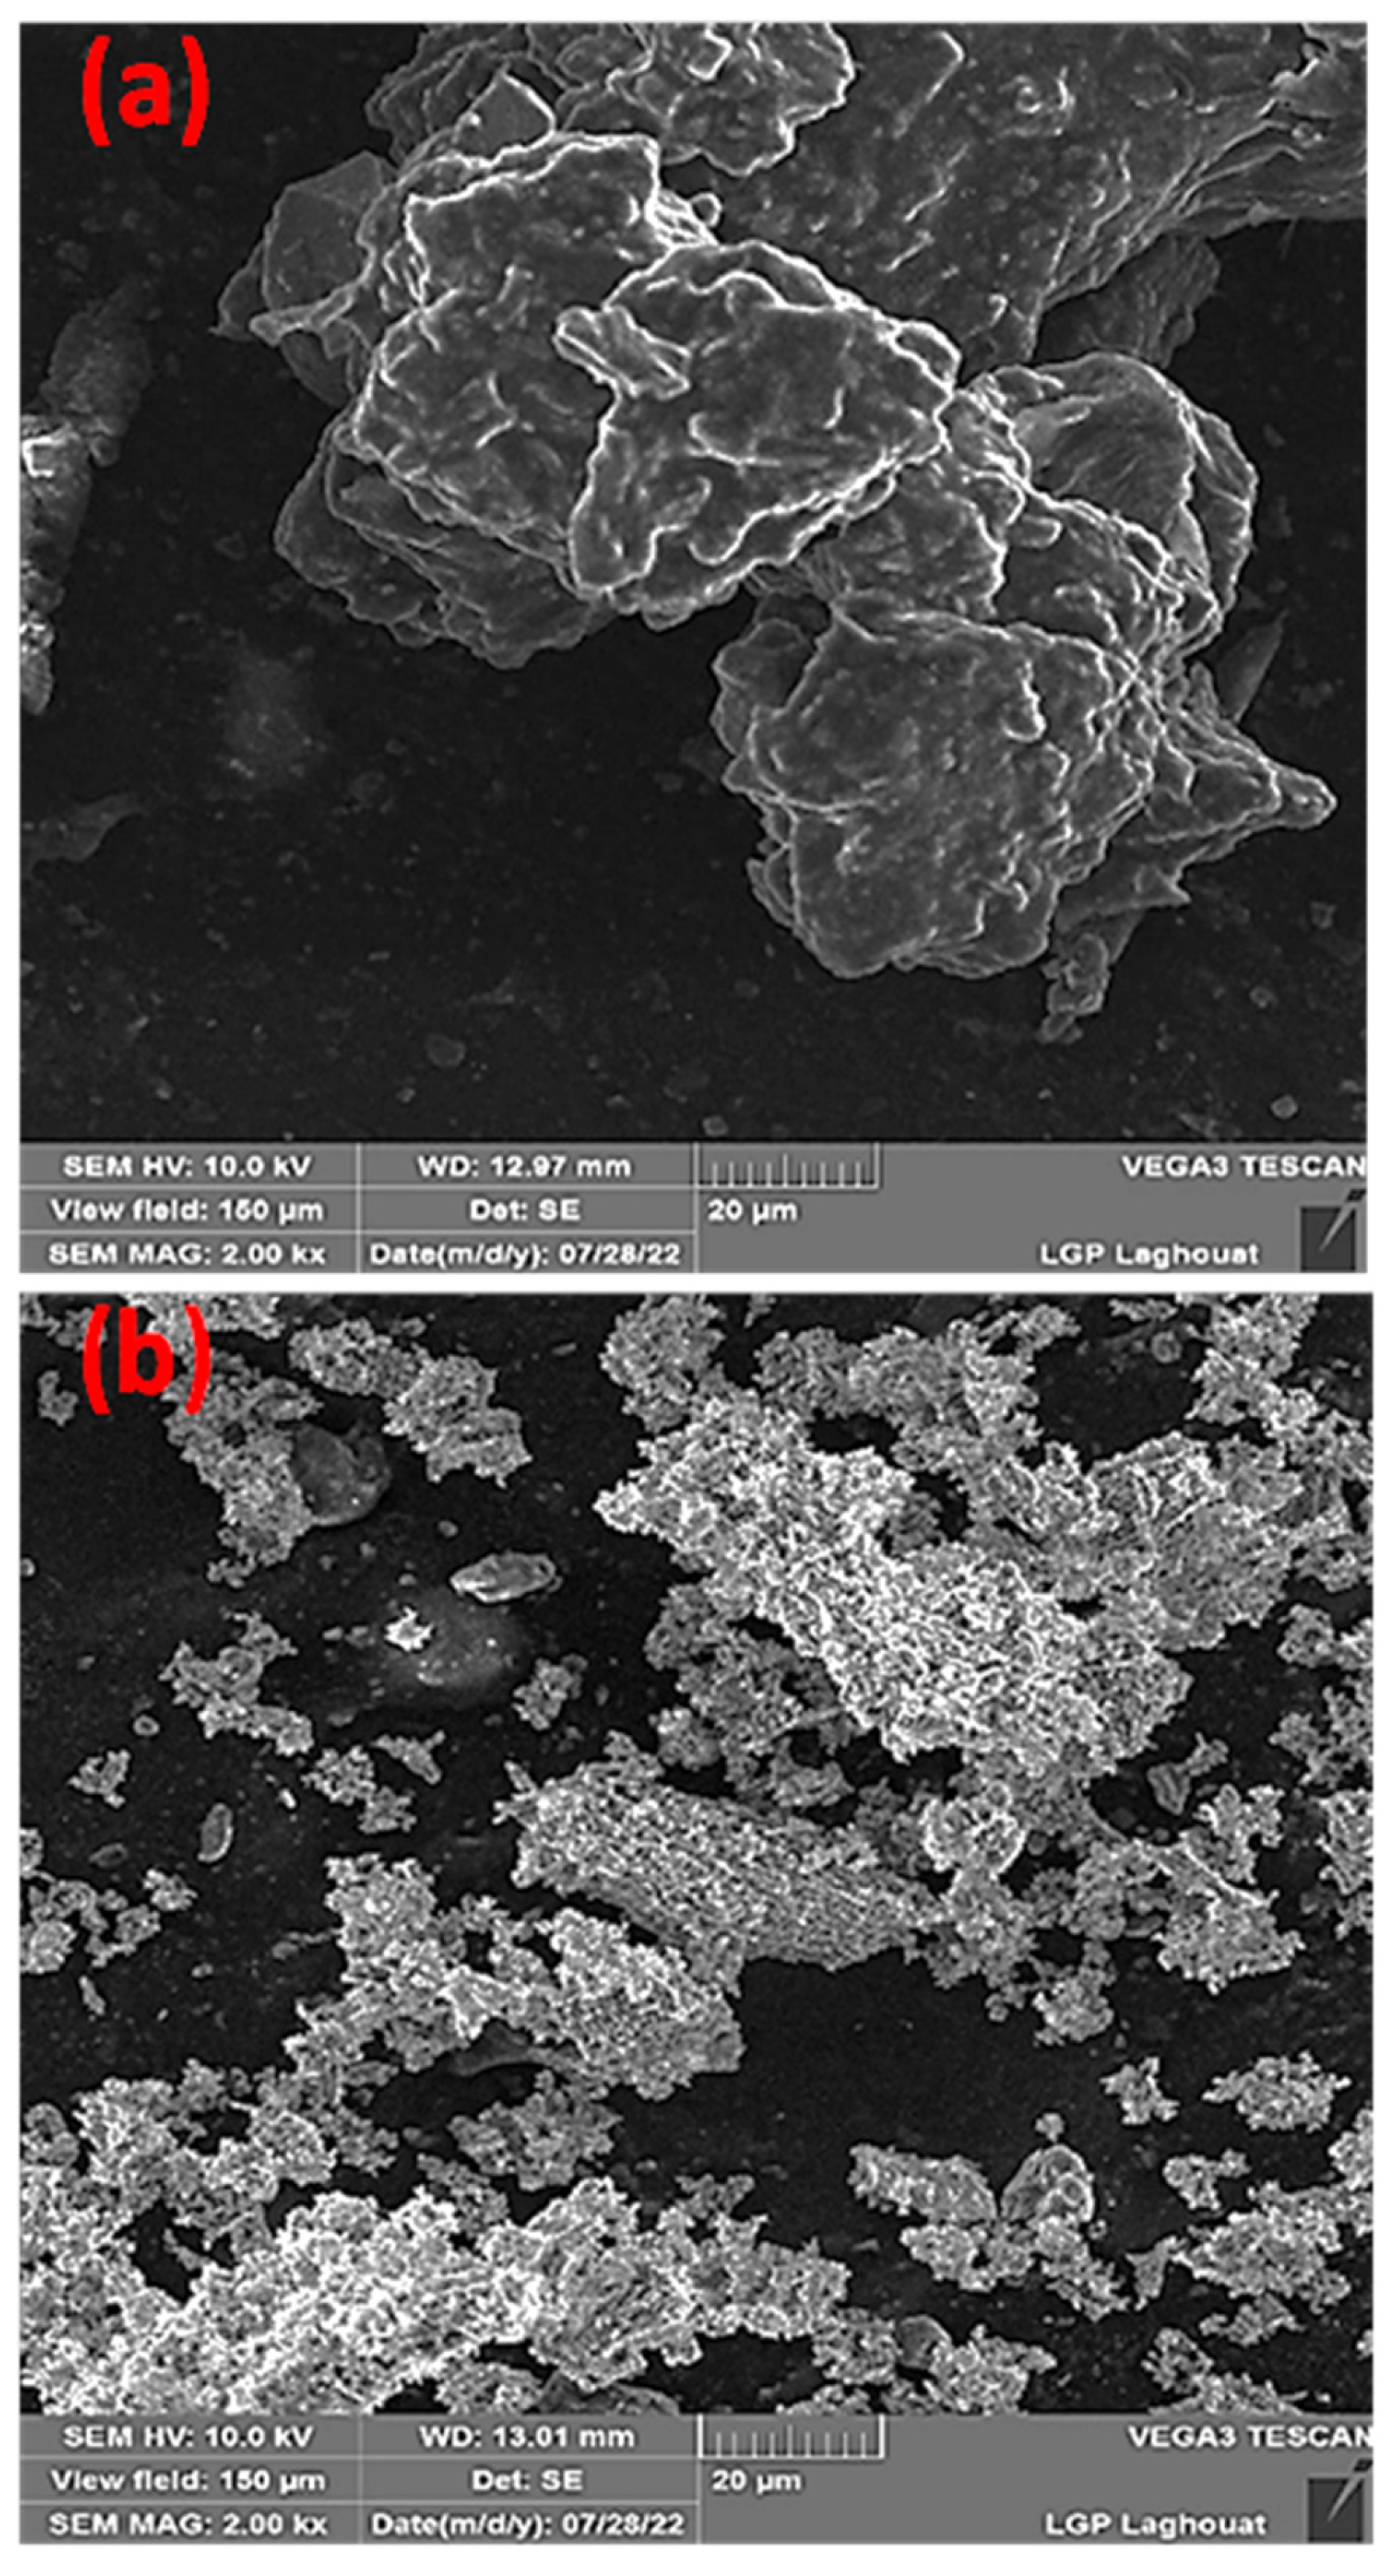
The surface properties of the biomass, both before and after thermal treatment, were carefully analyzed using SEM.
Figure 3 provides SEM images of both the NBio and the CBio, captured at a magnification of 2.00 kx after a heat treatment at 900 °C for 3 h. The SEM images clearly demonstrate that the surface morphology of the biomass undergoes a significant transformation following thermal treatment.
In the case of the NBio (
Figure 3a), the surface appears dense and agglomerated, with a smooth, non-porous texture. The homogeneous nature of the NBio suggests a compact structure with minimal surface irregularities or voids. This surface structure is characteristic of a biomass sample before any high-temperature treatment, where organic matter remains intact, and the biomass does not exhibit significant crystallinity or porosity.
Conversely, the SEM image of CBio (
Figure 3b) shows a markedly different morphology. The surface of CBio is irregular, with a noticeable rough texture and increased porosity. The calcined biomass underwent substantial structural changes due to the high-temperature treatment. This rougher and more irregular surface can be attributed to the thermal decomposition of organic materials, such as fats and proteins, during calcination, leaving behind a more crystalline and porous structure. The increased porosity of the small agglomerates in the CBio also suggests a significant transformation in the biomass’s internal structure, likely leading to more available surface area for adsorption processes.
These findings are consistent with the XRD analysis, which revealed a higher degree of crystallinity in CBio compared to NBio. The increase in crystallinity is linked to the removal of amorphous organic components and the formation of a more defined crystalline structure under high-temperature conditions. The enhanced porosity and roughness of CBio, as observed in the SEM images, suggest that the thermal treatment not only enhances the crystallinity but also significantly alters the surface texture, which can be beneficial for various applications, such as adsorption processes.
3.4. Specific Surface Area
Table 2 provides a detailed summary of the specific surface area (A) values of the two biosorbents utilized in this study, as well as the values for other adsorbents reported in the previous literature. A significant increase in the specific surface area of the NBio was observed after subjecting it to thermal treatment at 900 °C, which is consistent with the changes in surface morphology identified earlier. Specifically, the surface area of the CBio was found to be 370 m
2 g
−1, which is notably higher than that of the NBio at 247 m
2 g
−1. This increase in surface area suggests a substantial alteration in the biomass structure due to calcination, contributing to enhanced adsorption properties.
Furthermore, when compared to other adsorbents mentioned in the literature, the surface area of NBio (247 m
2 g
−1) was found to be comparable to that of a bioadsorbent derived from the agricultural waste of Cucumeropsis mannii Naudin (252 m
2 g
−1), as reported by Kifuani et al. [
49]. This indicates that the thermal treatment applied in this study significantly enhances the adsorptive capacity of the biomass, bringing it on par with other bioadsorbents that have been successfully used in similar applications. The increased surface area can be attributed to the removal of organic components during calcination, resulting in a more crystalline and porous structure that is better suited for adsorbing contaminants, as observed from both the surface morphology and surface area analysis.
3.5. Parametric Study
3.5.1. Effect of Contact Time
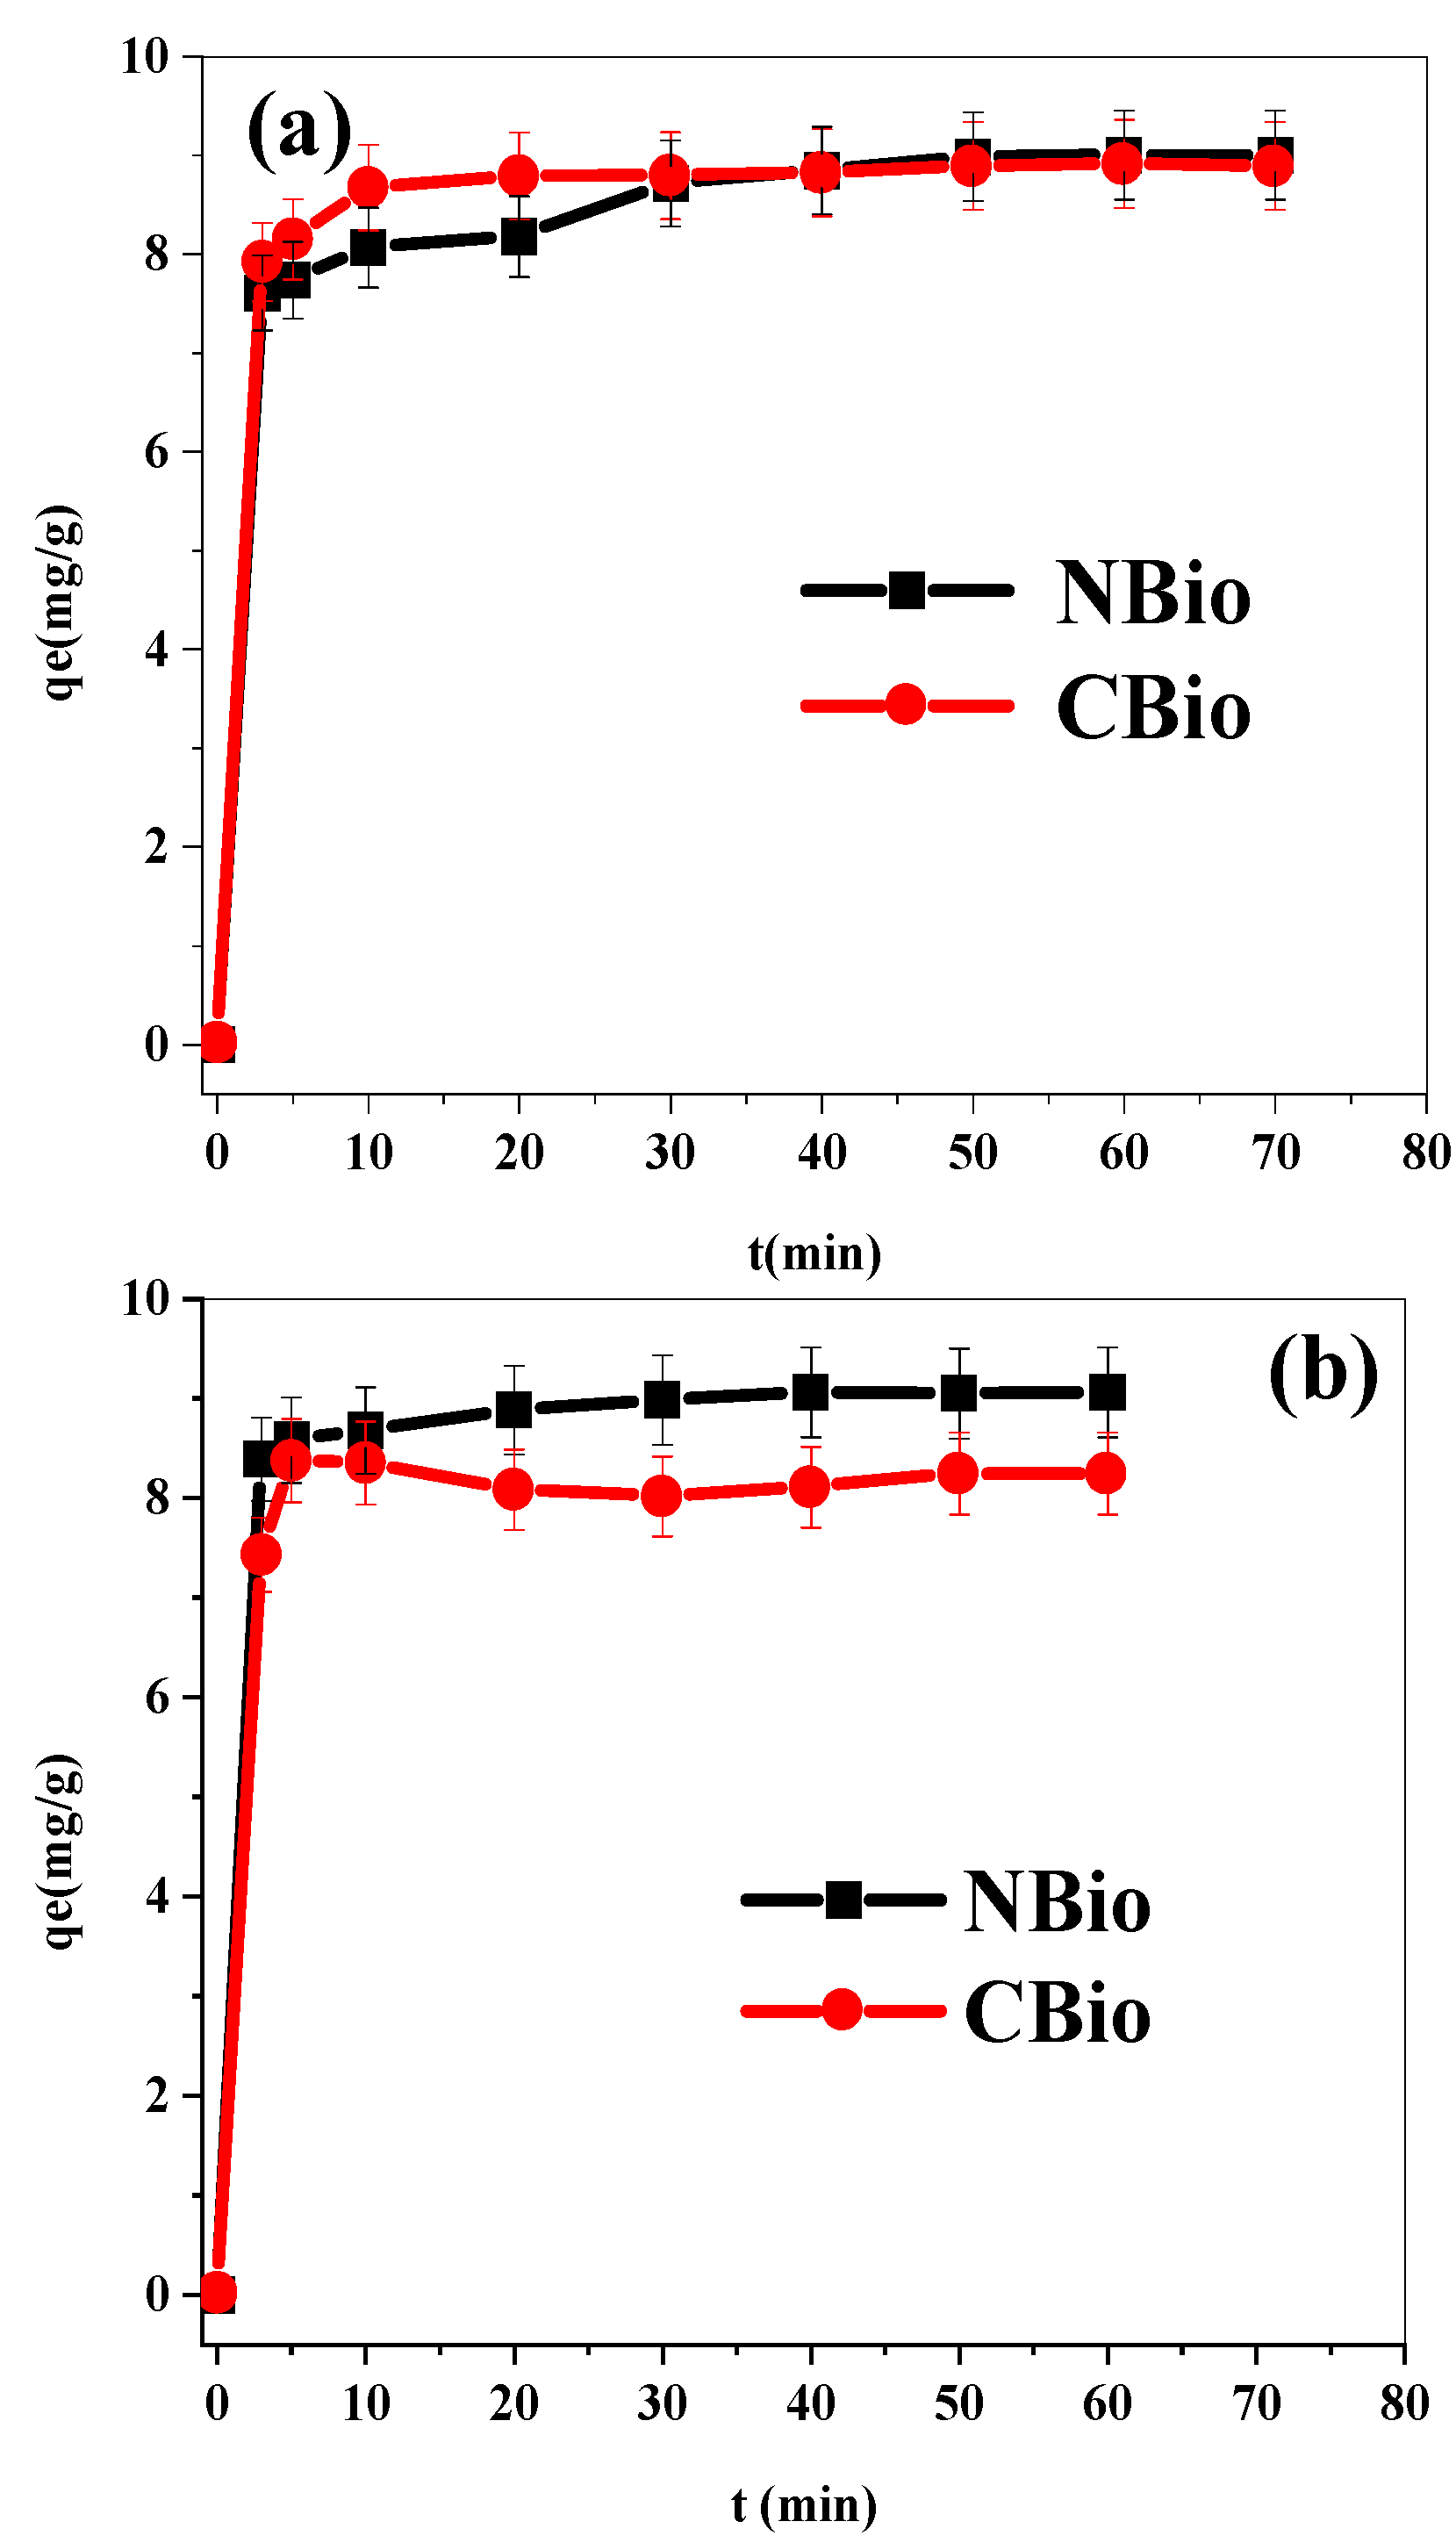
The adsorption kinetics shown in
Figure 4 can be divided into three distinct phases, each representing a different rate of adsorption and providing insights into the interaction between the adsorbate and the biosorbent.
This phase is characterized by a very high biosorption rate, as reflected in the steep rise in the adsorption curve. During the initial 10 min, there are many vacant adsorption sites on the surface of the adsorbent, allowing the adsorbate molecules (either BF or MB) to be rapidly captured. The adsorption process is fast because of the abundance of unoccupied sites available for the adsorbates, and there are minimal interactions between the adsorbed molecules at this stage. The molecules easily diffuse to the available sites on the adsorbent surface, leading to a sharp increase in the amount of adsorbed material. This phase reflects the high availability of free sites, allowing for quick adsorption.
In the second phase, the rate of biosorption slows significantly. This is due to the fact that a large portion of the surface sites are already occupied by the adsorbate molecules, leaving fewer sites available for further adsorption. As more molecules adsorb, the repulsive forces between the adsorbed molecules start to become significant. These repulsive interactions between the adsorbate molecules hinder the access of new adsorbate molecules to the available sites. The rate of adsorption continues to decrease as the system moves closer to equilibrium. This phase typically represents the transition from the rapid initial adsorption to the more gradual filling of the remaining adsorption sites.
During this stage, the adsorbent surface is being saturated, and fewer binding sites are available for the remaining molecules. The adsorption process becomes progressively slower due to the increasing resistance to adsorption and the greater tendency for already adsorbed molecules to repel additional molecules. The overall decrease in the rate of biosorption in this phase suggests that the system is approaching saturation [
58].
In the final phase, after 60 min, the adsorption process reaches equilibrium. This stage is marked by a stabilization of the adsorption rate, where the number of molecules adsorbed onto the surface equals the number of molecules desorbed. The surface sites of the adsorbent are fully occupied, meaning no further adsorption can occur under the experimental conditions. At this point, the adsorption capacity of the biosorbent is reached. For both NBio and CBio, the adsorption capacities are measured as 9.001 mg g−1 and 8.912 mg g−1, respectively, for BF, and 9.05 mg g−1 and 8.24 mg g−1 for MB. These values represent the maximum amount of adsorbate that can be held by the adsorbent at equilibrium.
It is also worth noting that the equilibrium time of 60 min is consistent with findings from other studies in the literature, where similar adsorption processes have been observed to reach equilibrium within this timeframe. This suggests that 60 min is a suitable duration for the adsorption process to stabilize under the experimental conditions used in this study.
In summary, the adsorption process progresses through three stages. Initially, rapid adsorption occurs as there are abundant free sites for the adsorbate molecules. As more molecules adsorb, the process slows down due to the occupation of surface sites and the repulsive forces between adsorbate molecules. Finally, the process reaches equilibrium when the adsorbent surface is saturated with adsorbate molecules, and no further adsorption takes place. These observations confirm that the biosorption of BF and MB on NBio and CBio follows a well-defined kinetic pattern with clear phases of rapid adsorption, slowing as sites fill, and eventual equilibrium. The adsorption capacities at equilibrium provide valuable information for the potential application of these biosorbents in real-world adsorption processes.
3.5.2. Effect of Initial Concentration
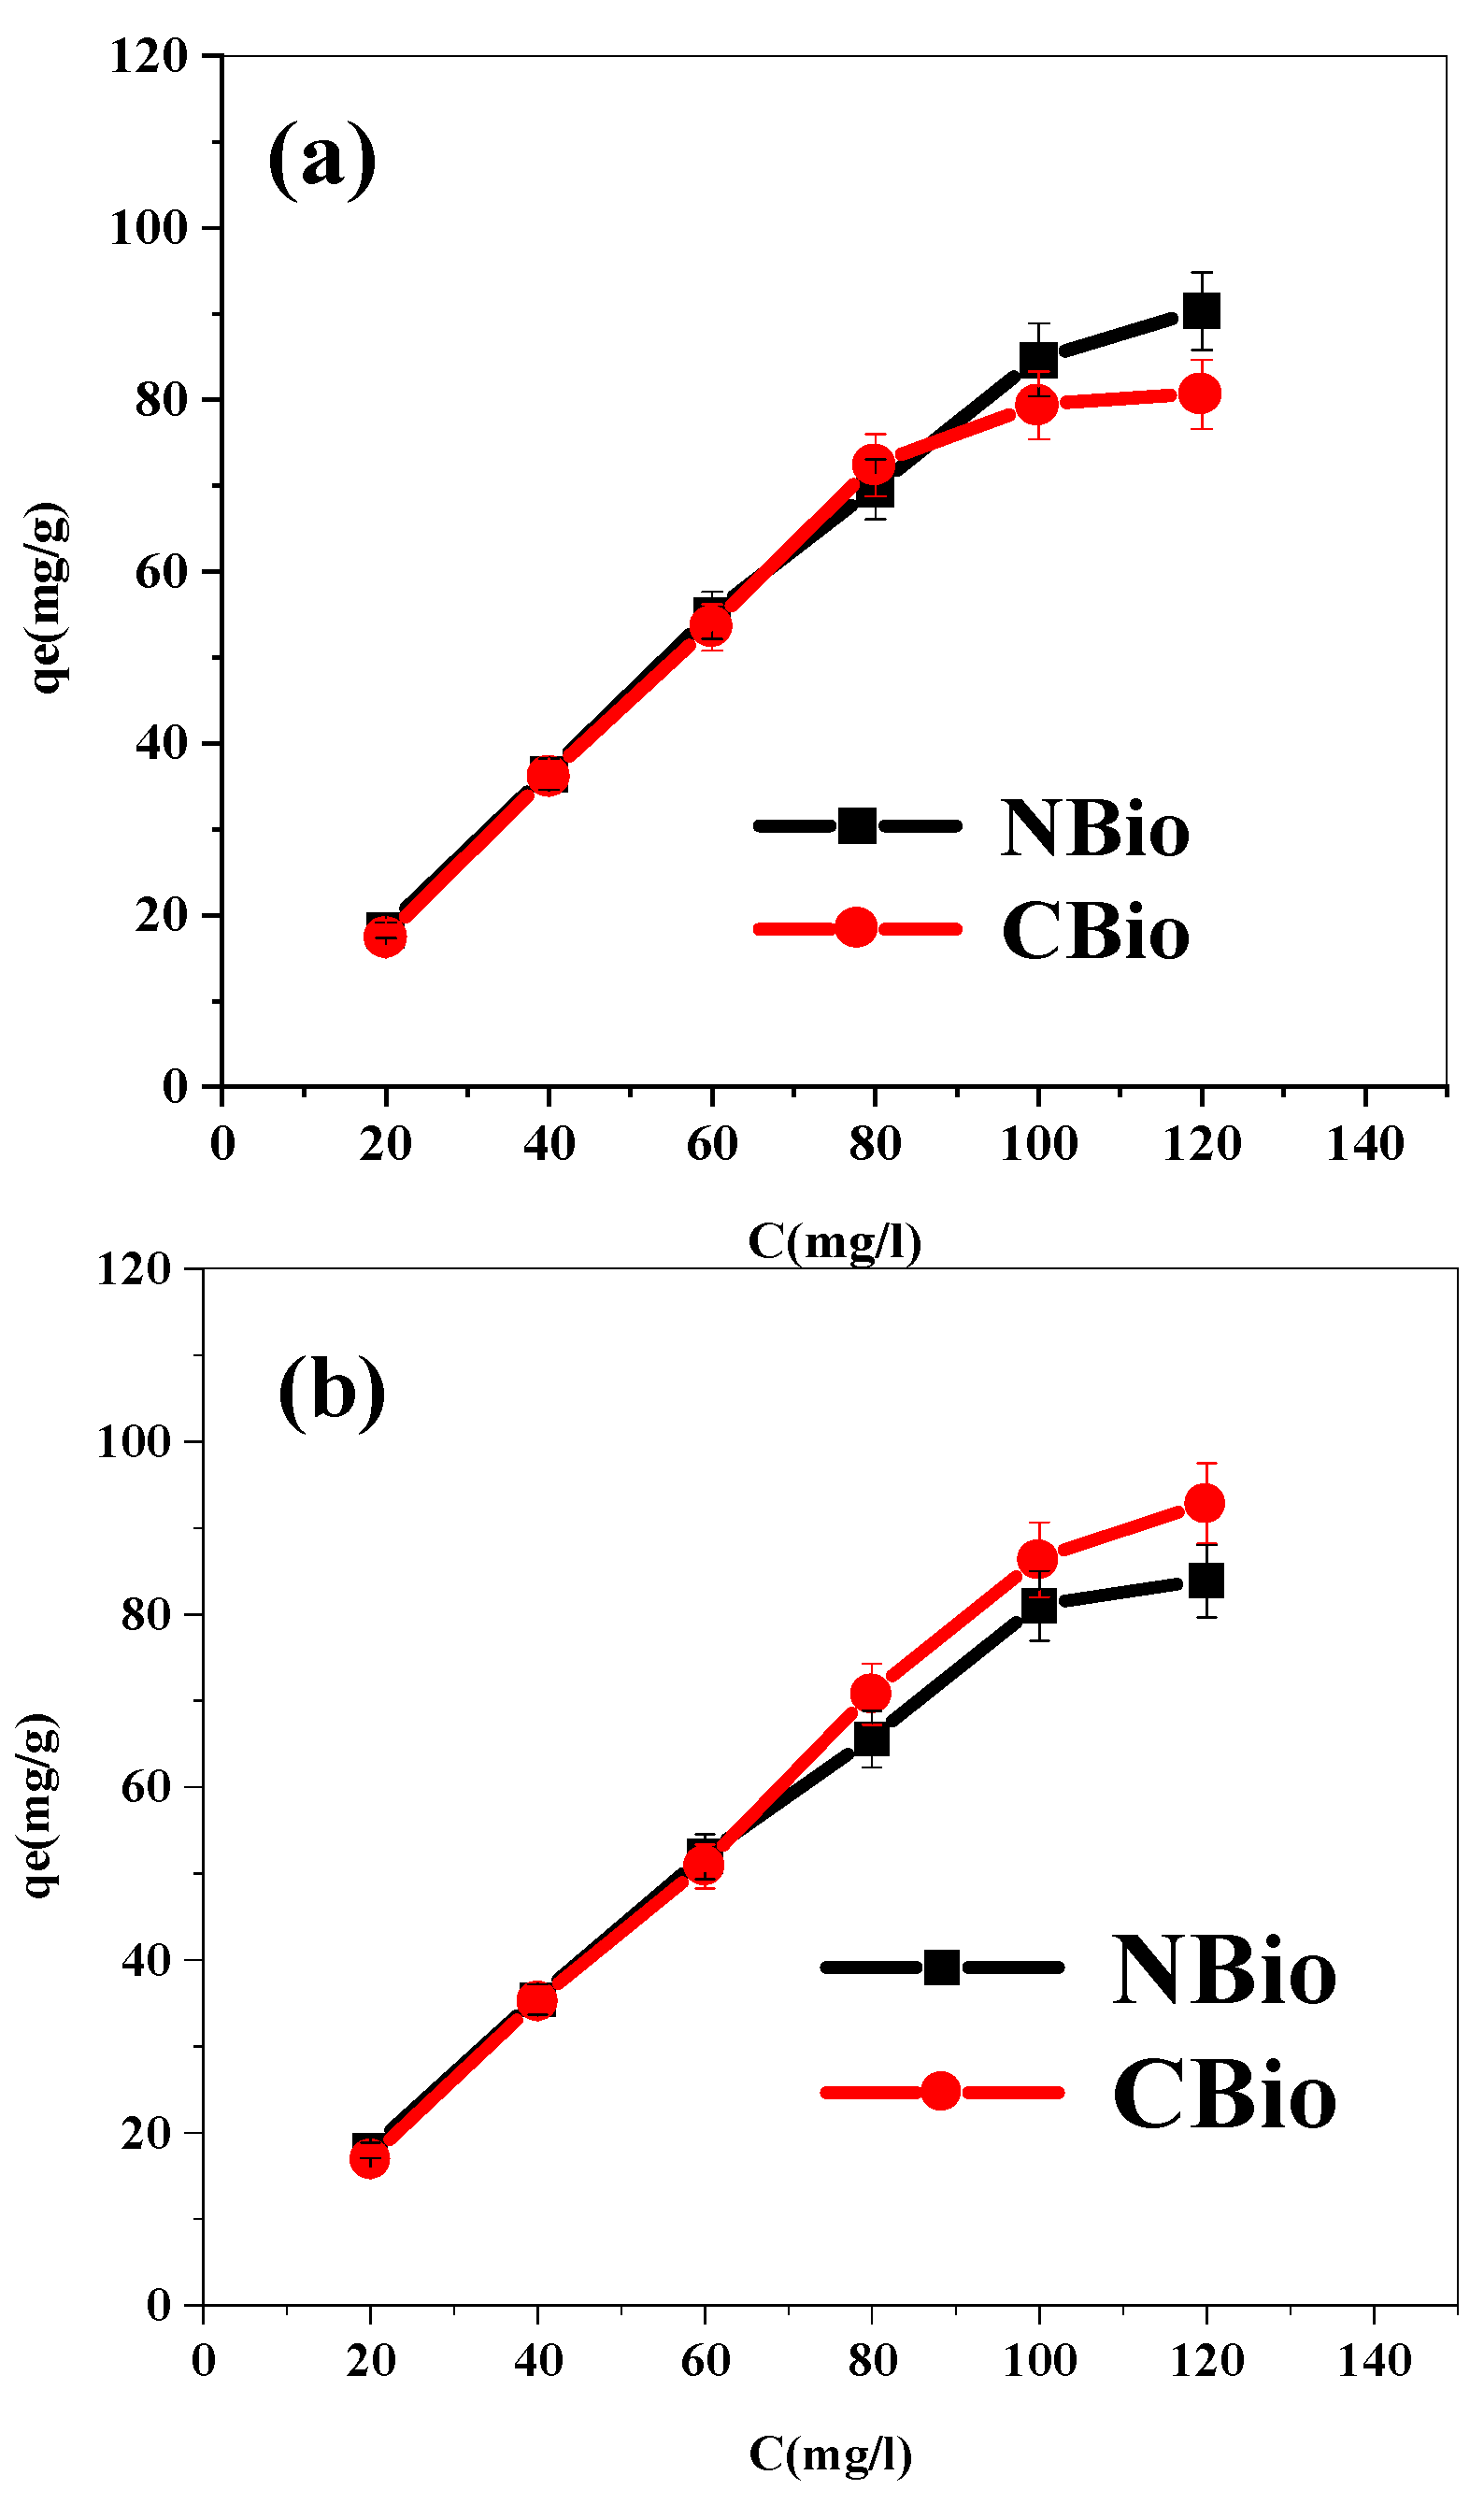
In
Figure 5, the biosorption capacity for both NBio and CBio demonstrates a clear positive correlation with the initial concentrations of BF and MB. This trend is attributed to the higher availability of biosorption sites compared to the concentration of dye molecules in the solution. As the concentration of the dyes increases, more molecules diffuse from the solution to the adsorbent surface, resulting in an enhanced adsorption rate. The initial phase of biosorption is rapid, as there are plenty of unoccupied sites for the dye molecules to bind. However, as more dye molecules are adsorbed, the adsorption rate starts to decrease as the available surface sites become increasingly occupied.
This behavior confirms that biosorption is highly dependent on the initial concentration of the dye solution, as is commonly observed in the literature [
59]. At higher initial dye concentrations, typically greater than 100 mg L
−1, the adsorption process eventually reaches a steady state. This steady state signifies that all the available biosorption sites on the adsorbent have been filled, and no further dye molecules can be adsorbed. Consequently, this leads to the attainment of the saturation point, where the biosorbent can no longer effectively adsorb additional dye molecules, and the process of adsorption slows down. In this study, the saturation concentration was identified as 100 mg L
−1, which coincides with similar findings reported in various research articles. Such saturation concentrations represent the point at which the adsorbent reaches its maximum adsorption capacity, after which any increase in the initial dye concentration will not significantly affect the adsorption rate. This saturation behavior is essential in optimizing the biosorption process for practical applications, ensuring that the adsorbent’s capacity is fully utilized without excessive waste [
60].
3.5.3. Effect of the Amount of Biosorbent
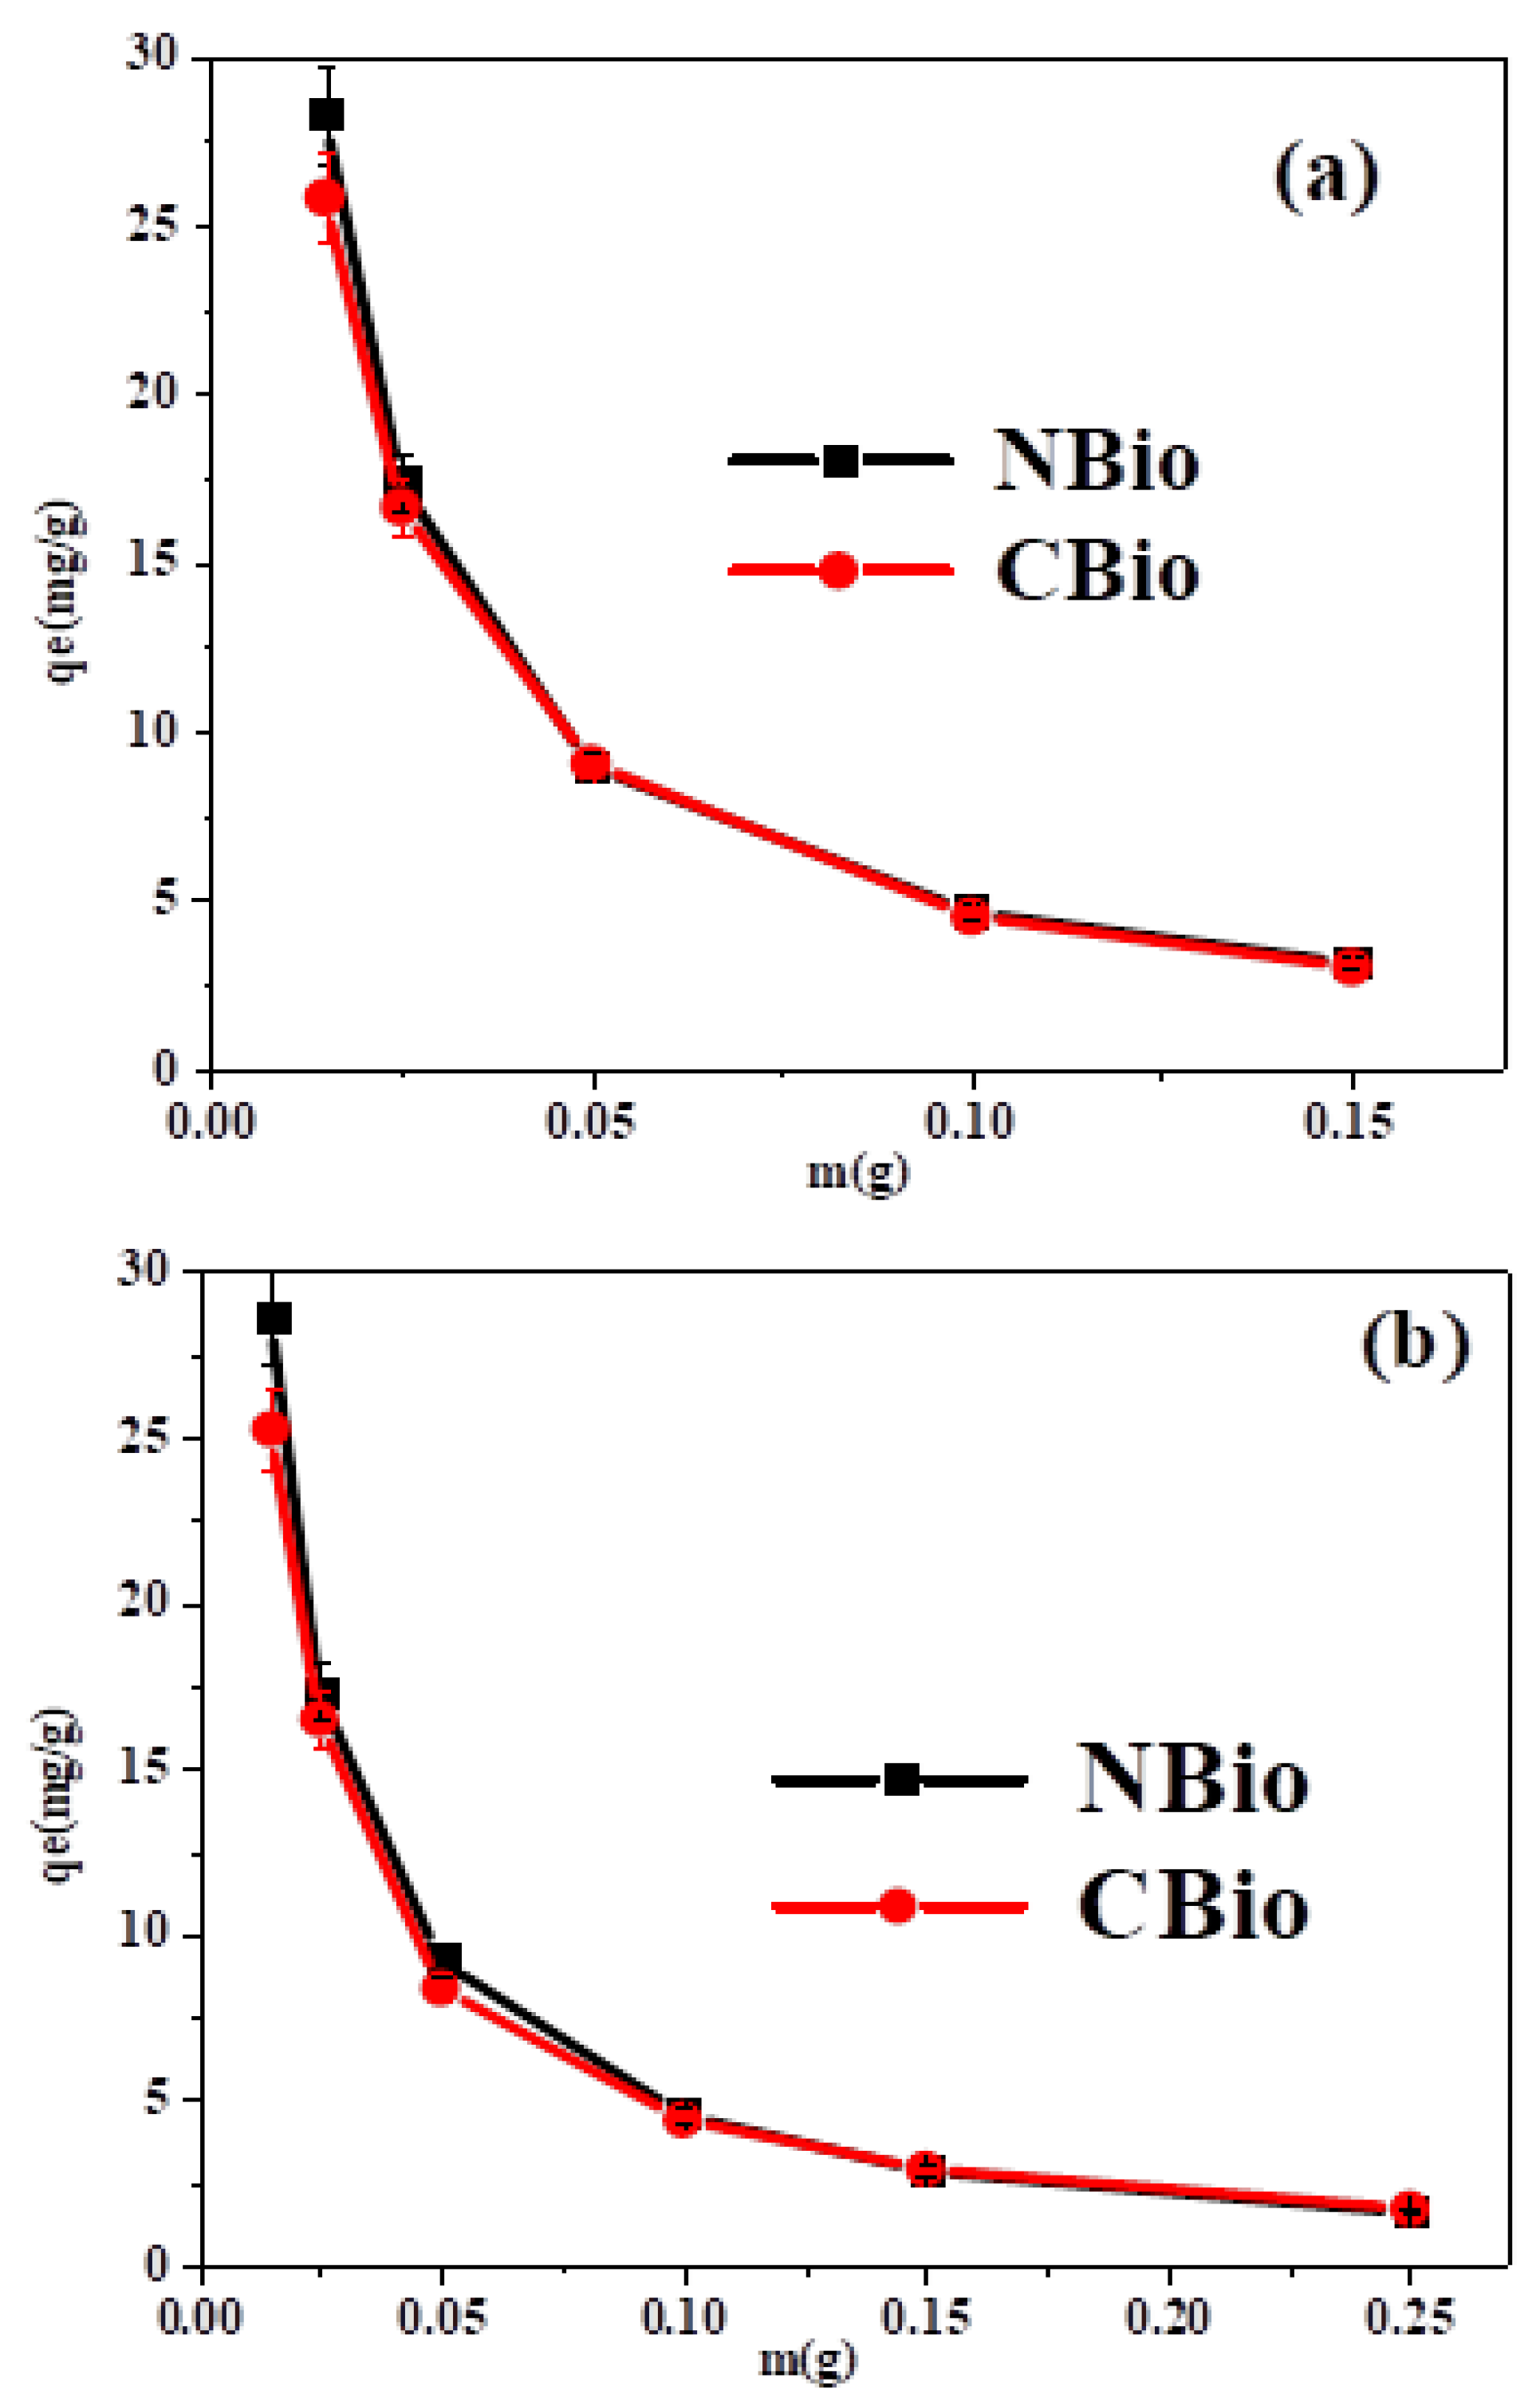
The data presented in
Figure 6 indicate that as the amount of biosorbent is increased, the biosorption capacity tends to decrease (
Figure 6a,b). This observation suggests that an excessive amount of biosorbent may lead to the agglomeration of its particles, which reduces the overall surface area available for dye molecules to interact with. When the particles cluster together, there is a smaller area for the dye molecules to adhere to, and this, in turn, increases competition among the dye molecules trying to access these limited adsorption sites. As a result, the biosorption process becomes less efficient [
61]. This phenomenon of particle agglomeration and its negative impact on adsorption capacity has also been reported in other studies. Furthermore, a comparable pattern of reduced adsorption efficiency was observed for MB adsorption on Safi clay in a study by Karim et al. [
62] and Mohammad et al. [
63], indicating that this issue is not unique to the current biosorbents but might be a general trend observed with various adsorbents.
In terms of discoloration yield (DY), as shown in
Figure 6, the best results were achieved with 0.05 g of biosorbent, which demonstrated approximately 90% of discoloration for both BF and MB dyes. This suggests that 0.05 g is the optimal amount of biosorbent for achieving high biosorption efficiency. Therefore, this value was selected as the optimal biosorbent mass for further experimental work, providing a balance between an adequate surface area for adsorption and the efficient use of the biosorbent material.
3.6. Equilibrium Study
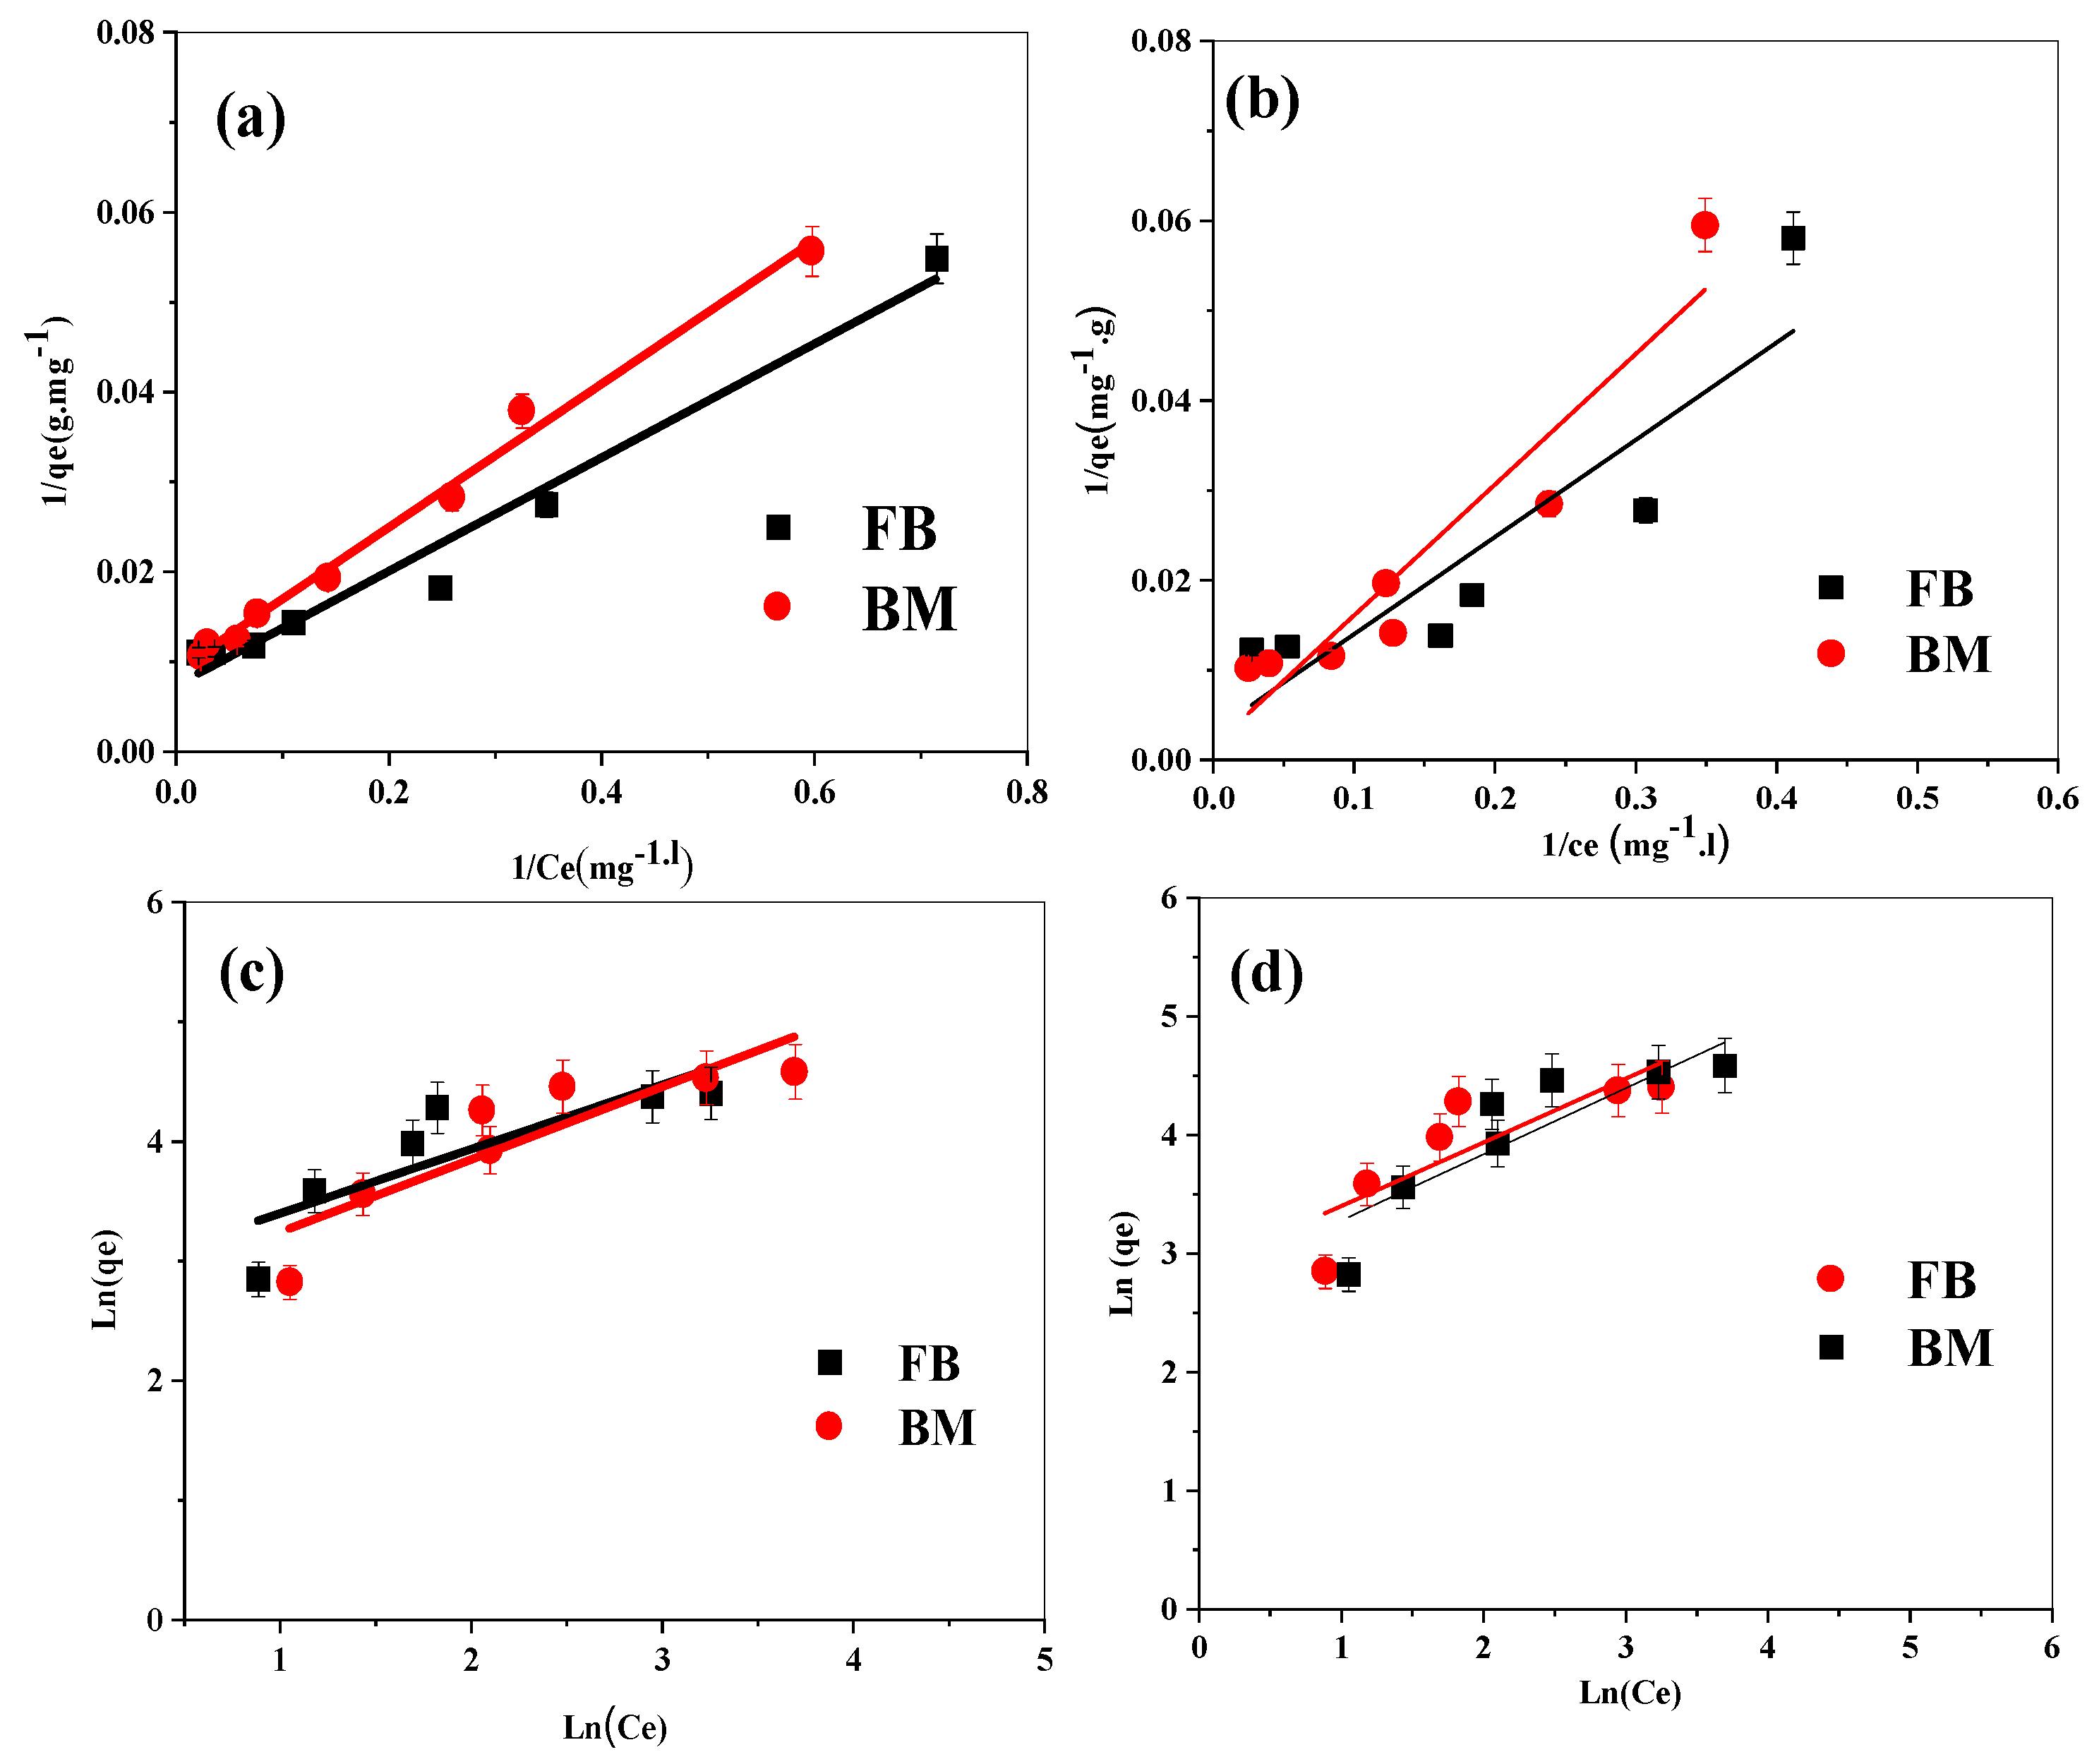
The analysis of the biosorption data using the Langmuir isotherm was carried out by plotting 1/Q
e against 1/C
e, as shown in
Figure 7a,b. The linearity of these plots enables the determination of the Q
m and the Langmuir constant, as well as the correlation coefficients. These values, summarized in
Table 3, indicate the goodness of fit for the Langmuir model in describing the biosorption equilibrium of the dyes (BF and MB) on both NBio and CBio. The high correlation coefficients (0.97 for BF and 0.98 for MB) demonstrate that the Langmuir model adequately describes the adsorption process, confirming that the biosorption follows a monolayer adsorption mechanism with a uniform distribution of adsorption sites. The R
L values, ranging between 0 and 1, further support the conclusion that the biosorption process is favorable. An R
L value in this range suggests that the process is reversible and that the adsorption of BF and MB on both biosorbents is efficient and favorable, as evidenced by previous studies in similar contexts [
28].
In addition to the Langmuir model, the Freundlich isotherm was also applied to the data.
Figure 7c,d present linear plots of ln(Q
e) versus ln(C
e), which are used to derive the Freundlich constants, 1/n and K
f. These parameters provide insight into the nature of the adsorption process. The 1/n parameter, in particular, is indicative of the adsorption intensity and the heterogeneity of the biosorption sites. A value of 1/n less than 1 indicates favorable adsorption, which is consistent with the results obtained for both dyes on NBio and CBio. In this study, all 1/n values were found to be less than 1, confirming the favorable adsorption of BF and MB on both biosorbents, in agreement with the R
L values derived from the Langmuir model. The favorable adsorption characteristics are further corroborated by the magnitude of K
f, which reflects the adsorption capacity.
The coefficient of determination (R2) values obtained for both models provide a quantitative measure of how well the experimental data fit the theoretical isotherms. For both NBio and CBio, the Langmuir model exhibits strong coefficients of determination, indicating a well-defined monolayer adsorption process. However, when comparing the two models, it is evident that the Freundlich model better describes the adsorption on NBio, as indicated by higher R2 values in comparison to CBio. This suggests that the adsorption on NBio is more heterogeneous, with a broader range of adsorption sites and varying adsorption energies. In contrast, the biosorption process on CBio is more uniform and follows the Langmuir model more closely, suggesting fewer variations in adsorption sites and energies.
Overall, the combination of the Langmuir and Freundlich models provides valuable insights into the nature of the biosorption processes, indicating that both biosorbents exhibit favorable adsorption properties, with NBio demonstrating more heterogeneity in adsorption sites and CBio showing a more uniform adsorption process.
The Q
m values of the NBio and CBio adsorbents, determined from the Langmuir model, are higher than those of some reported adsorbents for MB and BF removal, as shown in
Table 4. These higher values are related to the crystallinity and the morphology of the NBio and CBio adsorbents shown in
Section 3.1 and
Section 3.3, respectively, which are different from those of other adsorbents. These findings indicate that NBio and CBio are economic, effective, and eco-friendly new materials to be utilized for the adsorption of dyes, especially MB and BF.
3.7. Kinetic Study
The kinetic analysis of biosorption provides crucial insights into the mechanisms and dynamics governing the adsorption process. In this study, two widely used kinetic models, the pseudo-first-order and pseudo-second-order models, were applied to evaluate the adsorption behaviors of BF and MB onto NBio and CBio.
3.7.1. Analysis of the Pseudo-First-Order Model
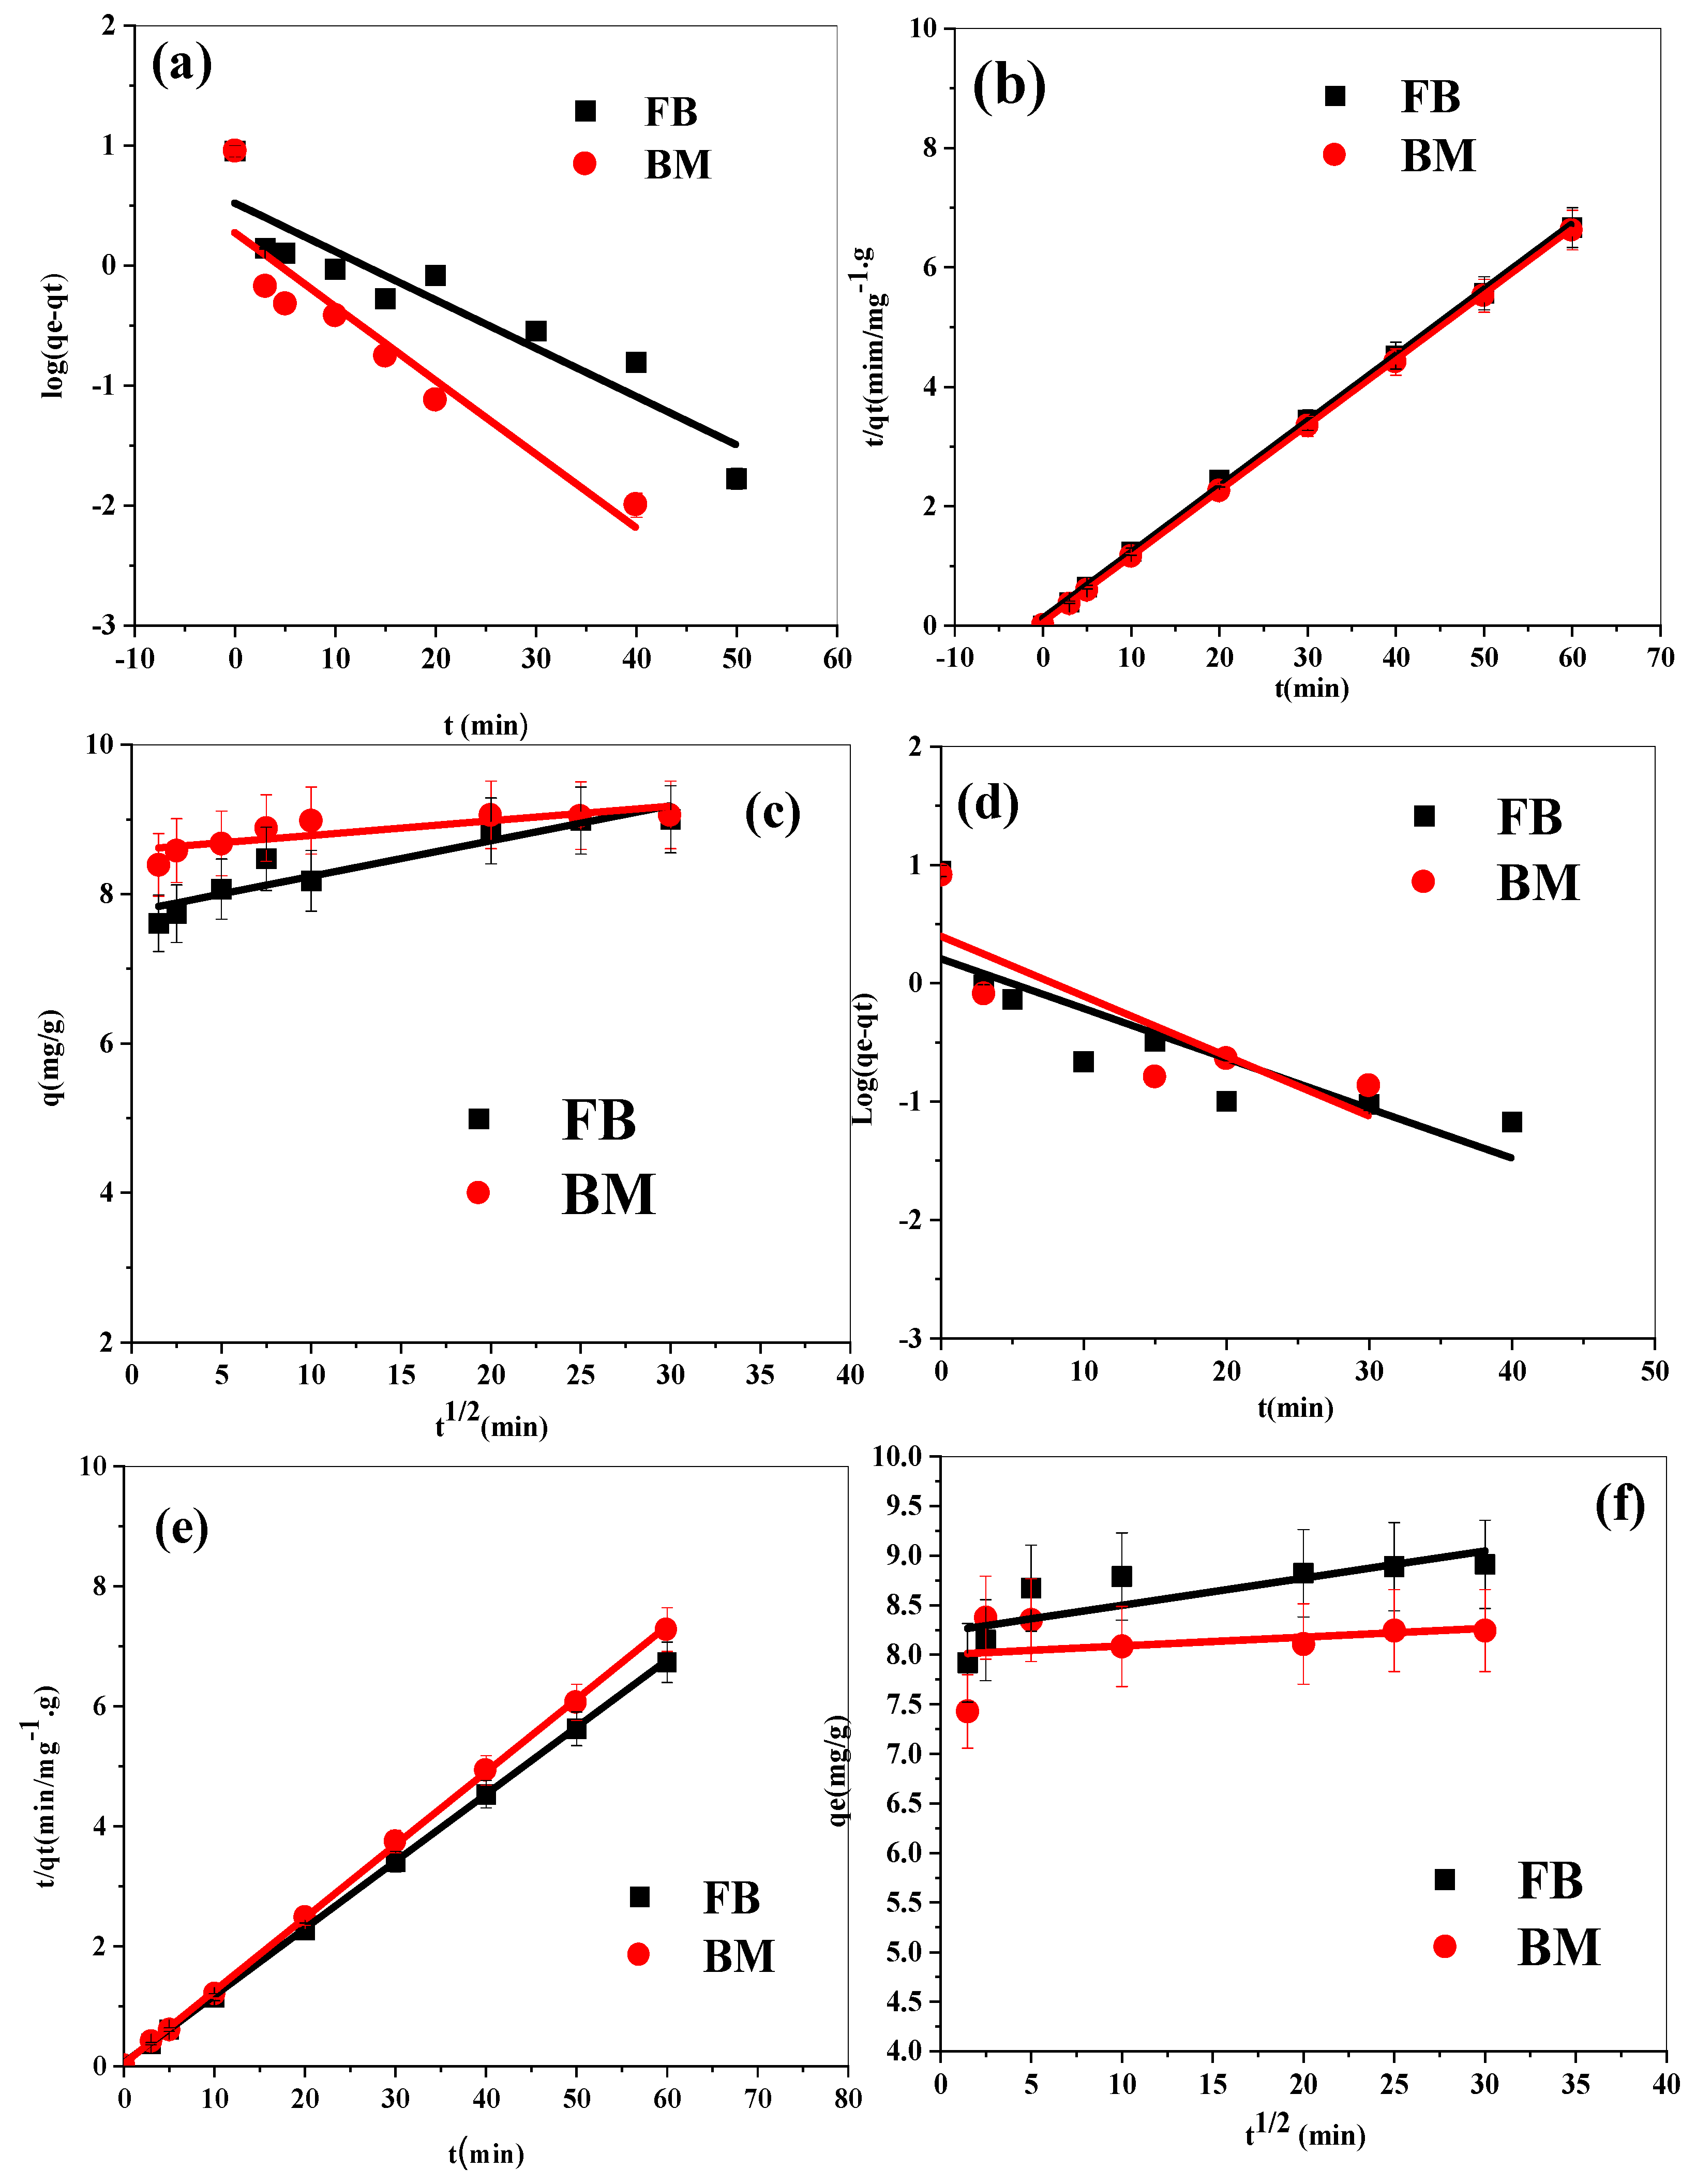
The linear form of the pseudo-first-order model, illustrated in
Figure 8a,d, highlights the limitations of this approach in describing the experimental data. The R
2 for this model ranged from 0.69 to 0.87, suggesting a moderate fit at best. More critically, the calculated adsorption capacities (Q
e (th)) derived from this model deviate significantly from the experimentally measured values (Q
e (ex)). This discrepancy indicates that the pseudo-first-order model does not accurately represent the adsorption mechanism for either BF or MB on the biosorbents studied.
Such a mismatch between the calculated and experimental values points to the inadequacy of the pseudo-first-order model in capturing the underlying kinetics of the adsorption process. This conclusion aligns with previous studies reporting similar findings. For instance, the adsorption of safranin-O onto pineapple peels was found to be poorly described by the pseudo-first-order model [
67], as was the adsorption of MB onto microwave-irradiated hydroxyapatite [
68]. These results collectively suggest that the pseudo-first-order model is not suitable for adsorption processes involving complex biosorbents like NBio and CBio.
3.7.2. Analysis of the Pseudo-Second-Order Model
In contrast, the pseudo-second-order model provided a much better representation of the experimental data, as shown in
Figure 8b,e. The rate constants and adsorption capacities calculated using this model are presented in
Table 5. Notably, the calculated adsorption capacities (Q
e (th)) for BF and MB closely match the experimental values (Q
e (ex)). This agreement underscores the validity of the pseudo-second-order model in describing the adsorption kinetics.
Moreover, the value of R
2 for the pseudo-second-order model exceeded 0.8 for all cases, indicating a strong linear relationship and a superior fit compared to the pseudo-first-order model. This high degree of correlation demonstrates the model’s ability to accurately predict the dynamics of the adsorption process. The pseudo-second-order model’s reliability is further supported by its frequent application in similar studies. For example, the adsorption of MB onto low-cost adsorbents has been shown to conform well to the pseudo-second-order model [
69]. Additionally, earlier research has highlighted the model’s effectiveness in describing adsorption processes involving solutes in solution [
70].
3.7.3. Mechanistic Implications
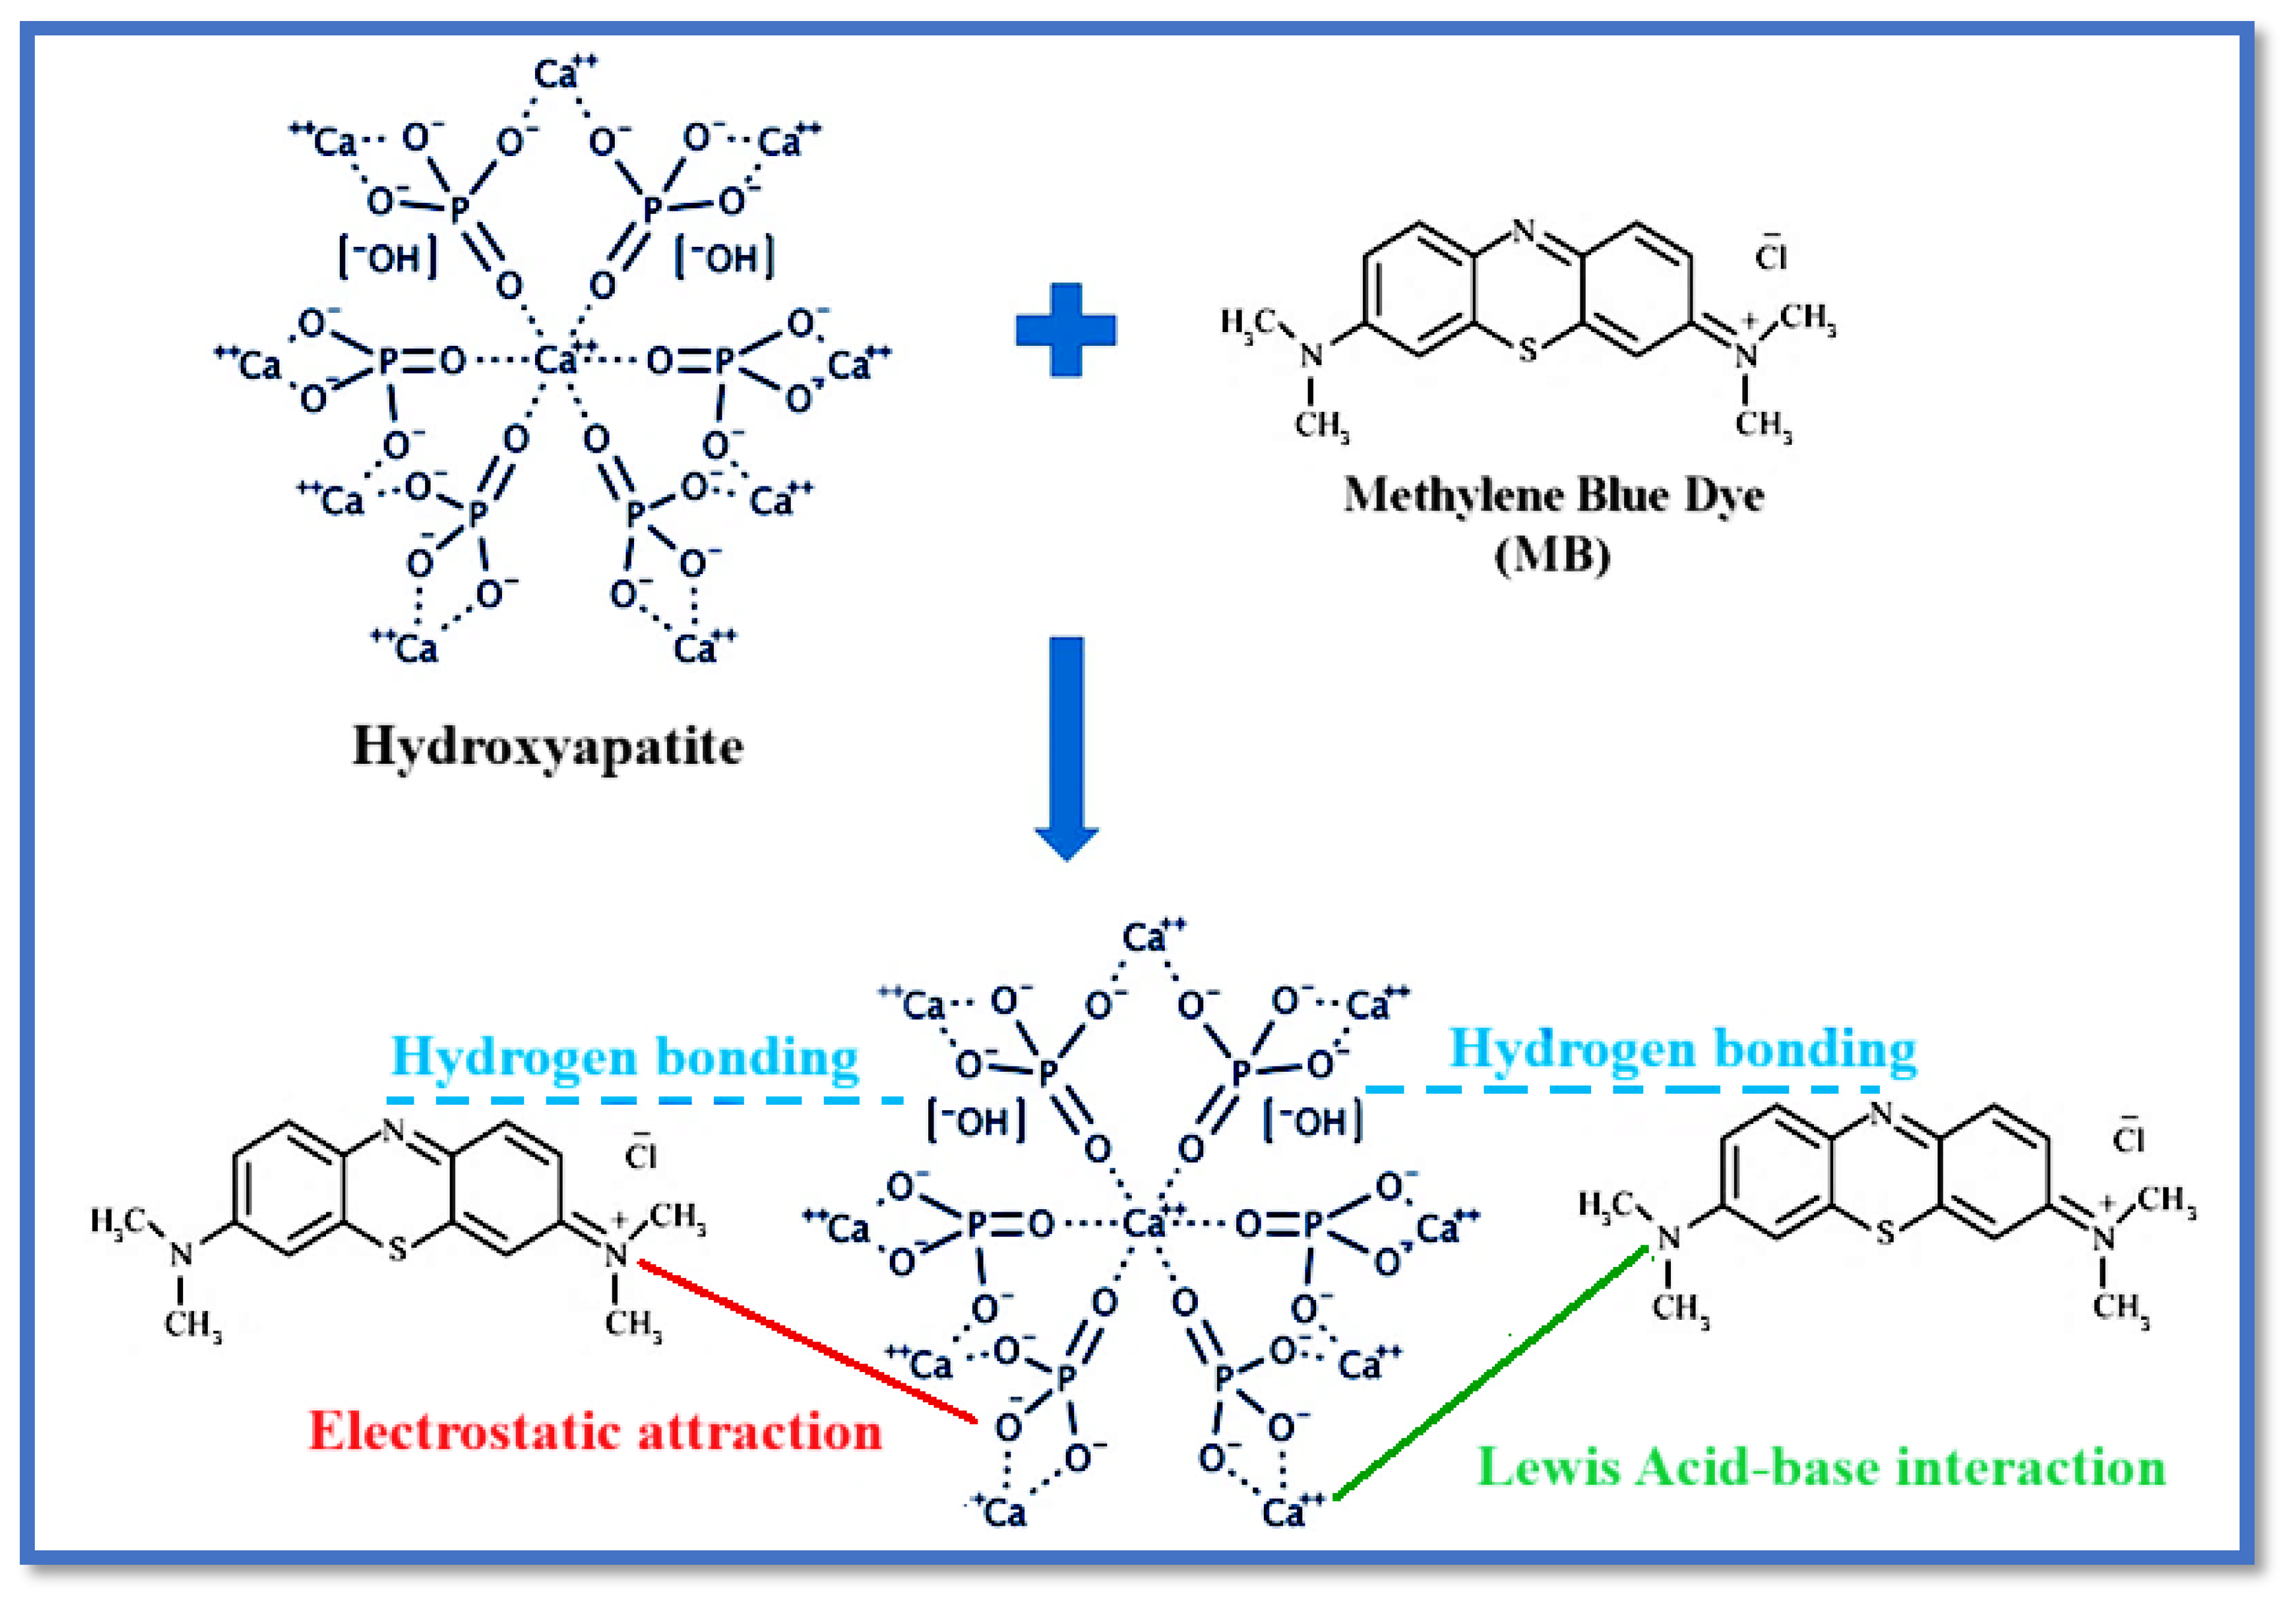
The superior fit of the pseudo-second-order model suggests that the adsorption process is likely governed by chemisorption, involving the sharing or exchange of electrons between the dye molecules and the active sites on the biosorbent surfaces. The possible interactions between MB and hydroxyapatite (that is, the principal constituent of bone) are shown in
Figure 9. This mechanism is consistent with the model’s assumption that adsorption is controlled by the availability of active sites and the interaction energy between adsorbent and adsorbate.
The findings also indicate that the adsorption process is not solely influenced by the physical characteristics of the biosorbents but also by the chemical interactions occurring at the surface. For NBio and CBio, the differences in surface morphology, as previously characterized, could further influence the adsorption dynamics and contribute to the observed kinetics.
The kinetic analysis confirms that the pseudo-second-order model provides a more accurate and reliable description of the adsorption process for BF and MB onto NBio and CBio than the pseudo-first-order model. These results not only validate the applicability of the pseudo-second-order model but also offer insights into the adsorption mechanism, suggesting chemisorption as the dominant process. Such findings are invaluable for optimizing biosorption systems and developing more effective biosorbents for dye removal in wastewater treatment applications.
The parameters of the intra-particle diffusion model, namely the intercept (
C) and the diffusion rate constant (K
id), were determined from the linear segments of the plots in
Figure 8c,f. These plots represent the relationship between the amount of dye adsorbed over time and the square root of time, following the intra-particle diffusion model. The corresponding values are compiled in
Table 5 for both NBio and CBio biosorbents.
The
C parameter reflects the contribution of the boundary layer to the overall biosorption process. A higher C value implies a stronger boundary layer effect, which limits the penetration of dye molecules into the inner pores of the biosorbent [
71]. In this study, the intercept values for all samples exceed 4, indicating a significant boundary layer influence. Additionally, the low correlation coefficients, all below 0.5, further confirm that the intra-particle diffusion is not the sole mechanism governing the biosorption process.
This observation suggests that the biosorption of BF and MB on both NBio and CBio involves multiple mechanisms, with the boundary layer playing a predominant role in restricting dye molecule diffusion into the pores. Consequently, the adsorption process cannot be accurately described solely by the intra-particle diffusion model.
Comparable trends have been documented in the literature. For example, Benaissa et al. [
21] reported a similar boundary layer effect in the biosorption of MB and BF onto Luffa cylindrica. Jia et al. [
56] observed analogous results for MB adsorption onto bone char, where the intra-particle diffusion model was insufficient to fully describe the process due to significant boundary layer influences.
These findings underline the complex nature of the biosorption process, where factors such as surface characteristics, pore accessibility, and molecular interactions with the boundary layer collectively determine the adsorption efficiency. This highlights the importance of employing complementary models and analyses to gain a comprehensive understanding of the underlying mechanisms in biosorption systems.
3.8. Thermodynamic Study
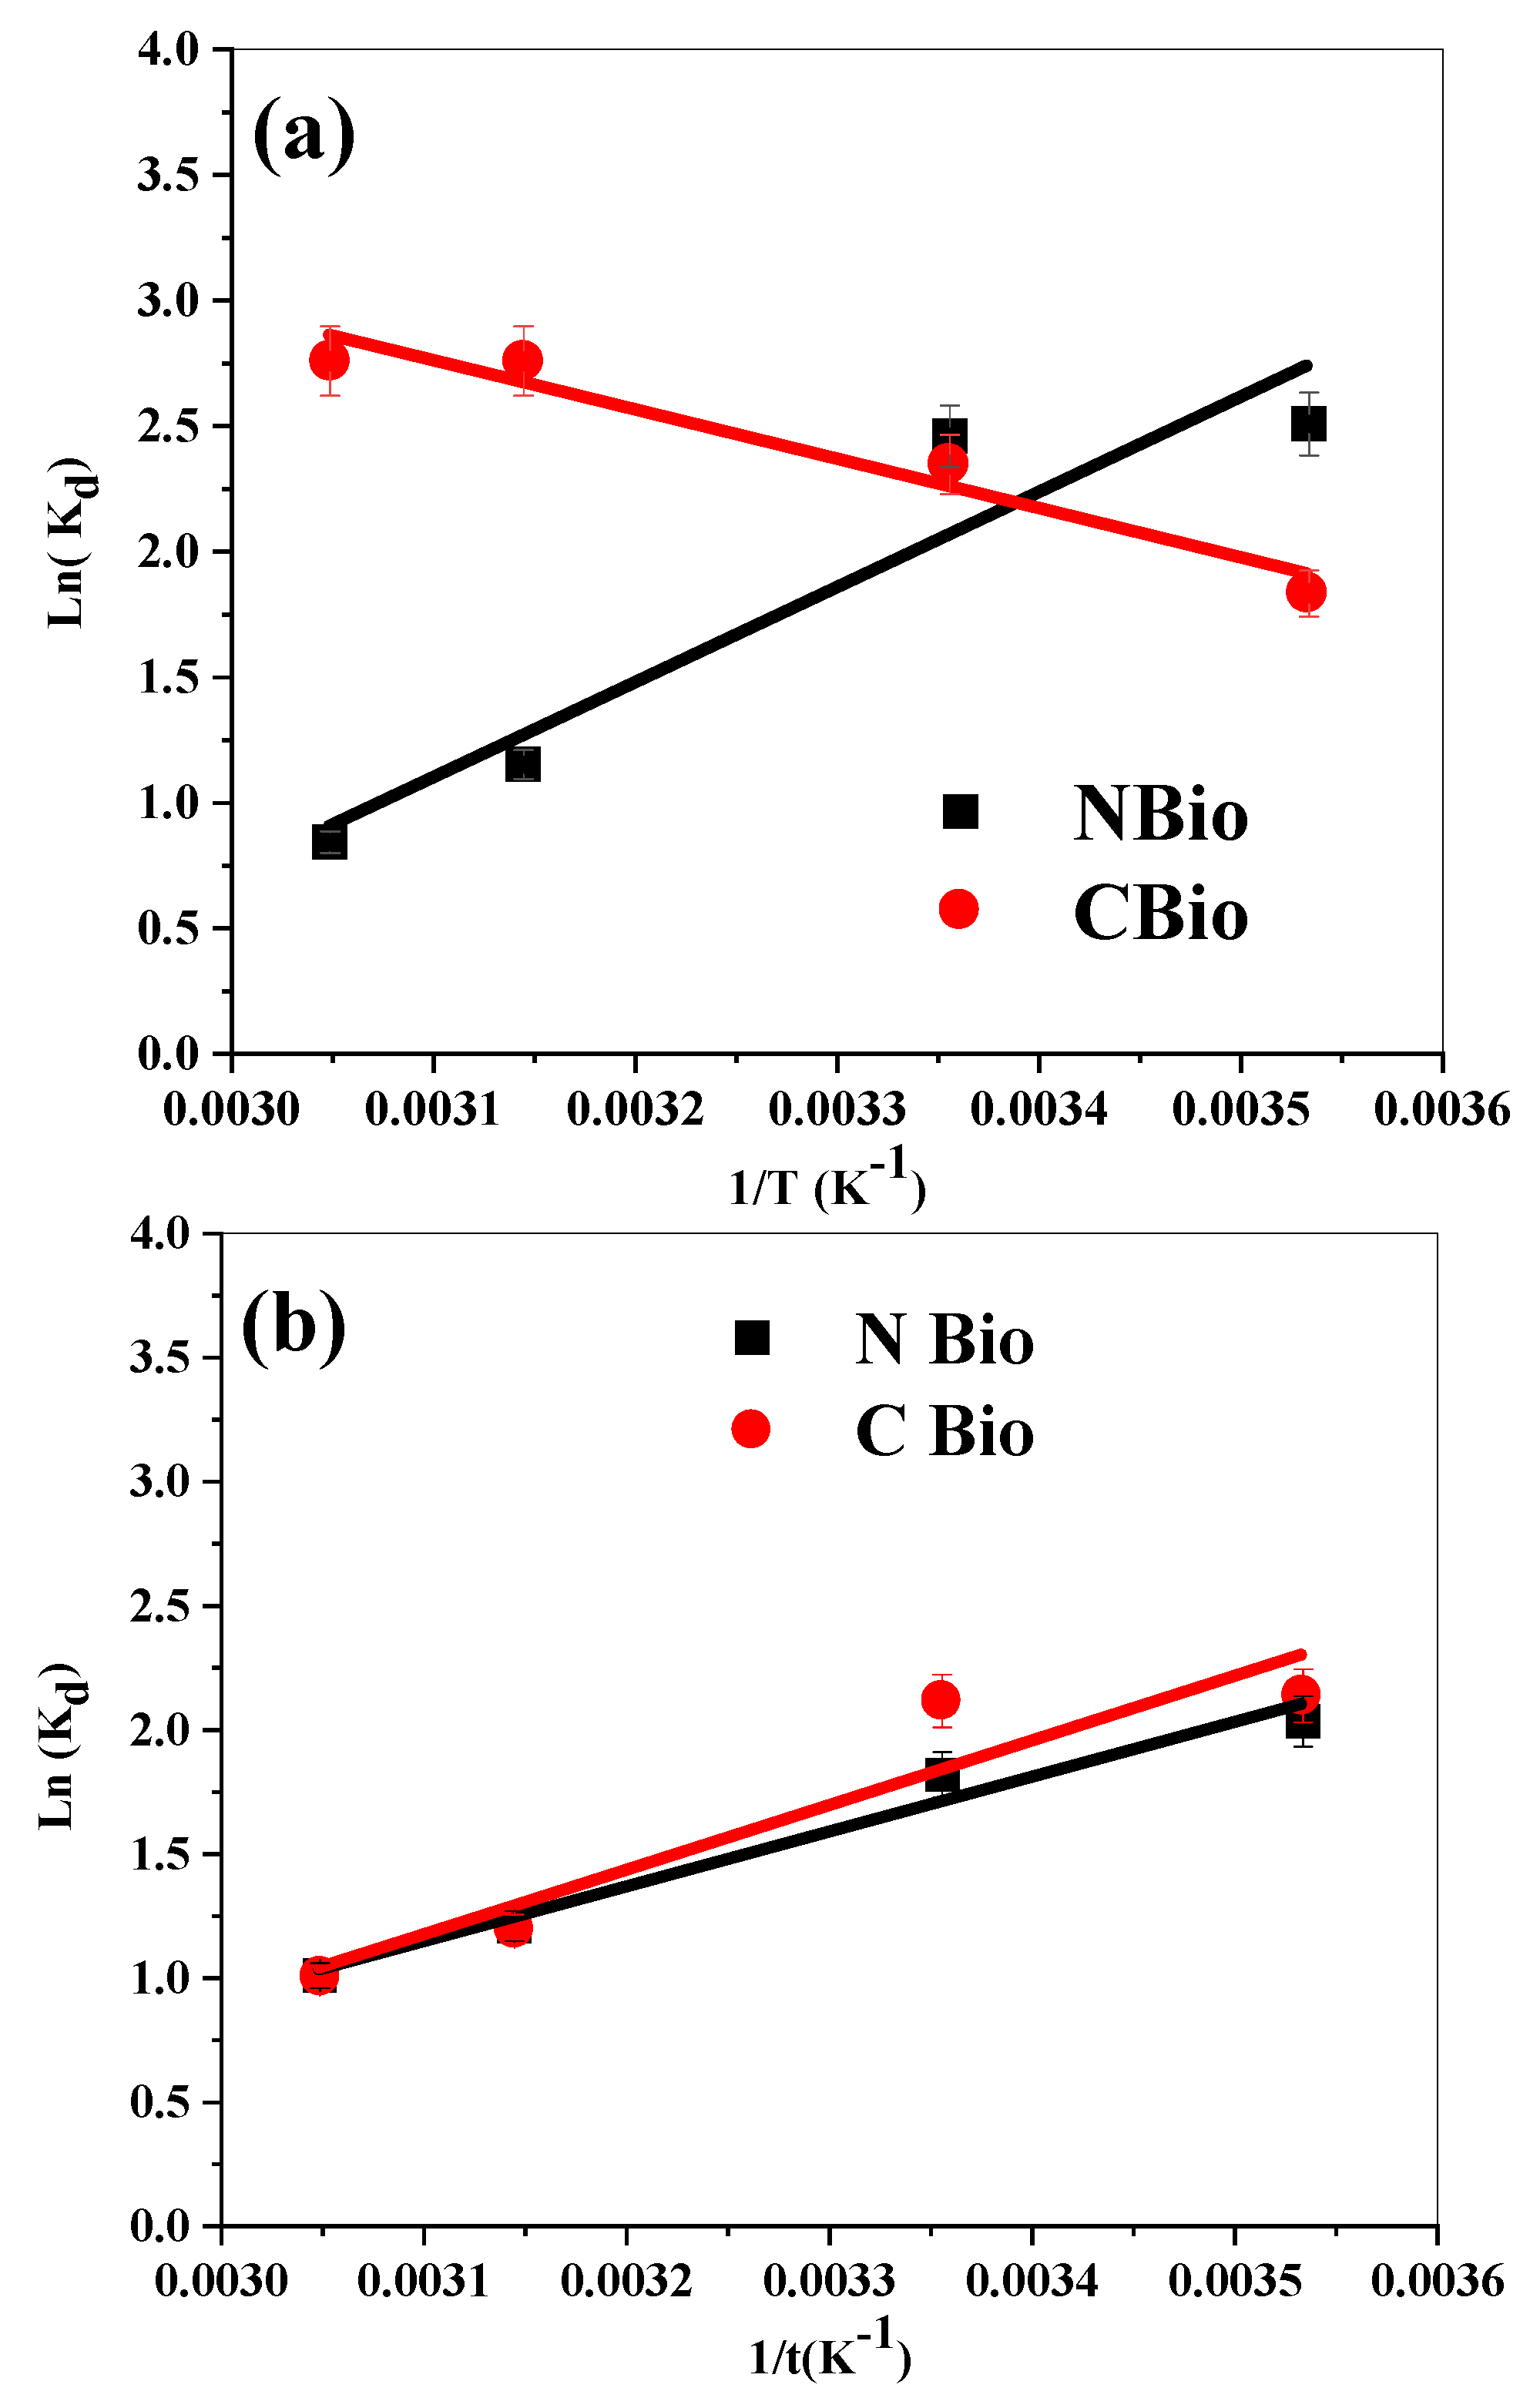
The thermodynamic analysis provides crucial insights into the nature of the biosorption processes for MB and BF on both NBio and CBio. These parameters, derived from the linear plots of ln K
d versus 1/T (
Figure 10), include enthalpy (enthalpy (∆H°), entropy (∆S°), and free energy (∆G°)), and their calculated values are presented in
Table 6.
3.8.1. Biosorption on NBio
For NBio, the negative ∆H° values indicate that the biosorption is both physical in nature and exothermic. This suggests that the interaction forces between the adsorbent (NBio) and the dye molecules are dominated by van der Waals forces, hydrogen bonding, or electrostatic interactions, which do not require significant energy input. The process releases heat, further confirming its exothermic nature.
The negative Δ
S° values imply an increase in the order at the interface between the adsorbent and the adsorbate. This could be attributed to the structuring or alignment of the dye molecules on the biosorbent surface. Such structuring often occurs due to strong binding or the orientation of the adsorbate molecules, potentially involving rearrangement at the molecular level or even weak chemical bond formations, as highlighted by Yang et al. [
72].
The spontaneity of the biosorption is supported by the negative ΔG° values, which indicate that the process is thermodynamically favorable under the studied conditions. The combined effect of exothermic heat release and increased interfacial order suggests a robust interaction mechanism for NBio.
3.8.2. Biosorption on CBio
In contrast, the biosorption process on CBio exhibits distinctly different thermodynamic characteristics. The positive ΔH° values signify an endothermic process, implying that the adsorption requires external energy input. This is typical of processes where adsorbate molecules overcome repulsive forces or desolvation barriers before adhering to the adsorbent surface. The endothermic nature may also suggest weaker initial interactions compared to NBio, requiring energy to facilitate adsorbent–adsorbate contact.
The positive Δ
S° values reflect an increase in randomness or disorder at the solid–liquid interface. According to Amellal et al. [
73], this increase could stem from the displacement of water molecules or the desolvation of dye molecules as they migrate from the bulk solution to the biosorbent surface. Additionally, surface structural changes in CBio or the partial aggregation of dye molecules on the adsorbent could contribute to the observed entropy gain.
Despite the endothermic nature of the process, the negative ΔG° values confirm the feasibility and spontaneity of the biosorption under the experimental conditions. This indicates that the entropy gain, rather than the enthalpy change, drives the biosorption process for CBio.
3.8.3. Comparative Analysis
The contrasting thermodynamic behaviors of NBio and CBio underline their distinct adsorption mechanisms. For NBio, the exothermic and ordered process points to strong and favorable interactions between the adsorbent and the dye molecules, emphasizing its efficiency in adsorption. Conversely, the endothermic and entropy-driven process on CBio suggests a greater reliance on external energy and surface modifications to facilitate adsorption. This distinction highlights the importance of selecting suitable biosorbents based on the desired thermodynamic profile for specific applications.
In conclusion, the thermodynamic parameters not only validate the feasibility and spontaneity of the biosorption processes for both NBio and CBio but also provide a deeper understanding of the underlying mechanisms. These findings can guide the optimization of biosorption systems for dyes and other pollutants in wastewater treatment.
3.9. Decision Tree Modeling
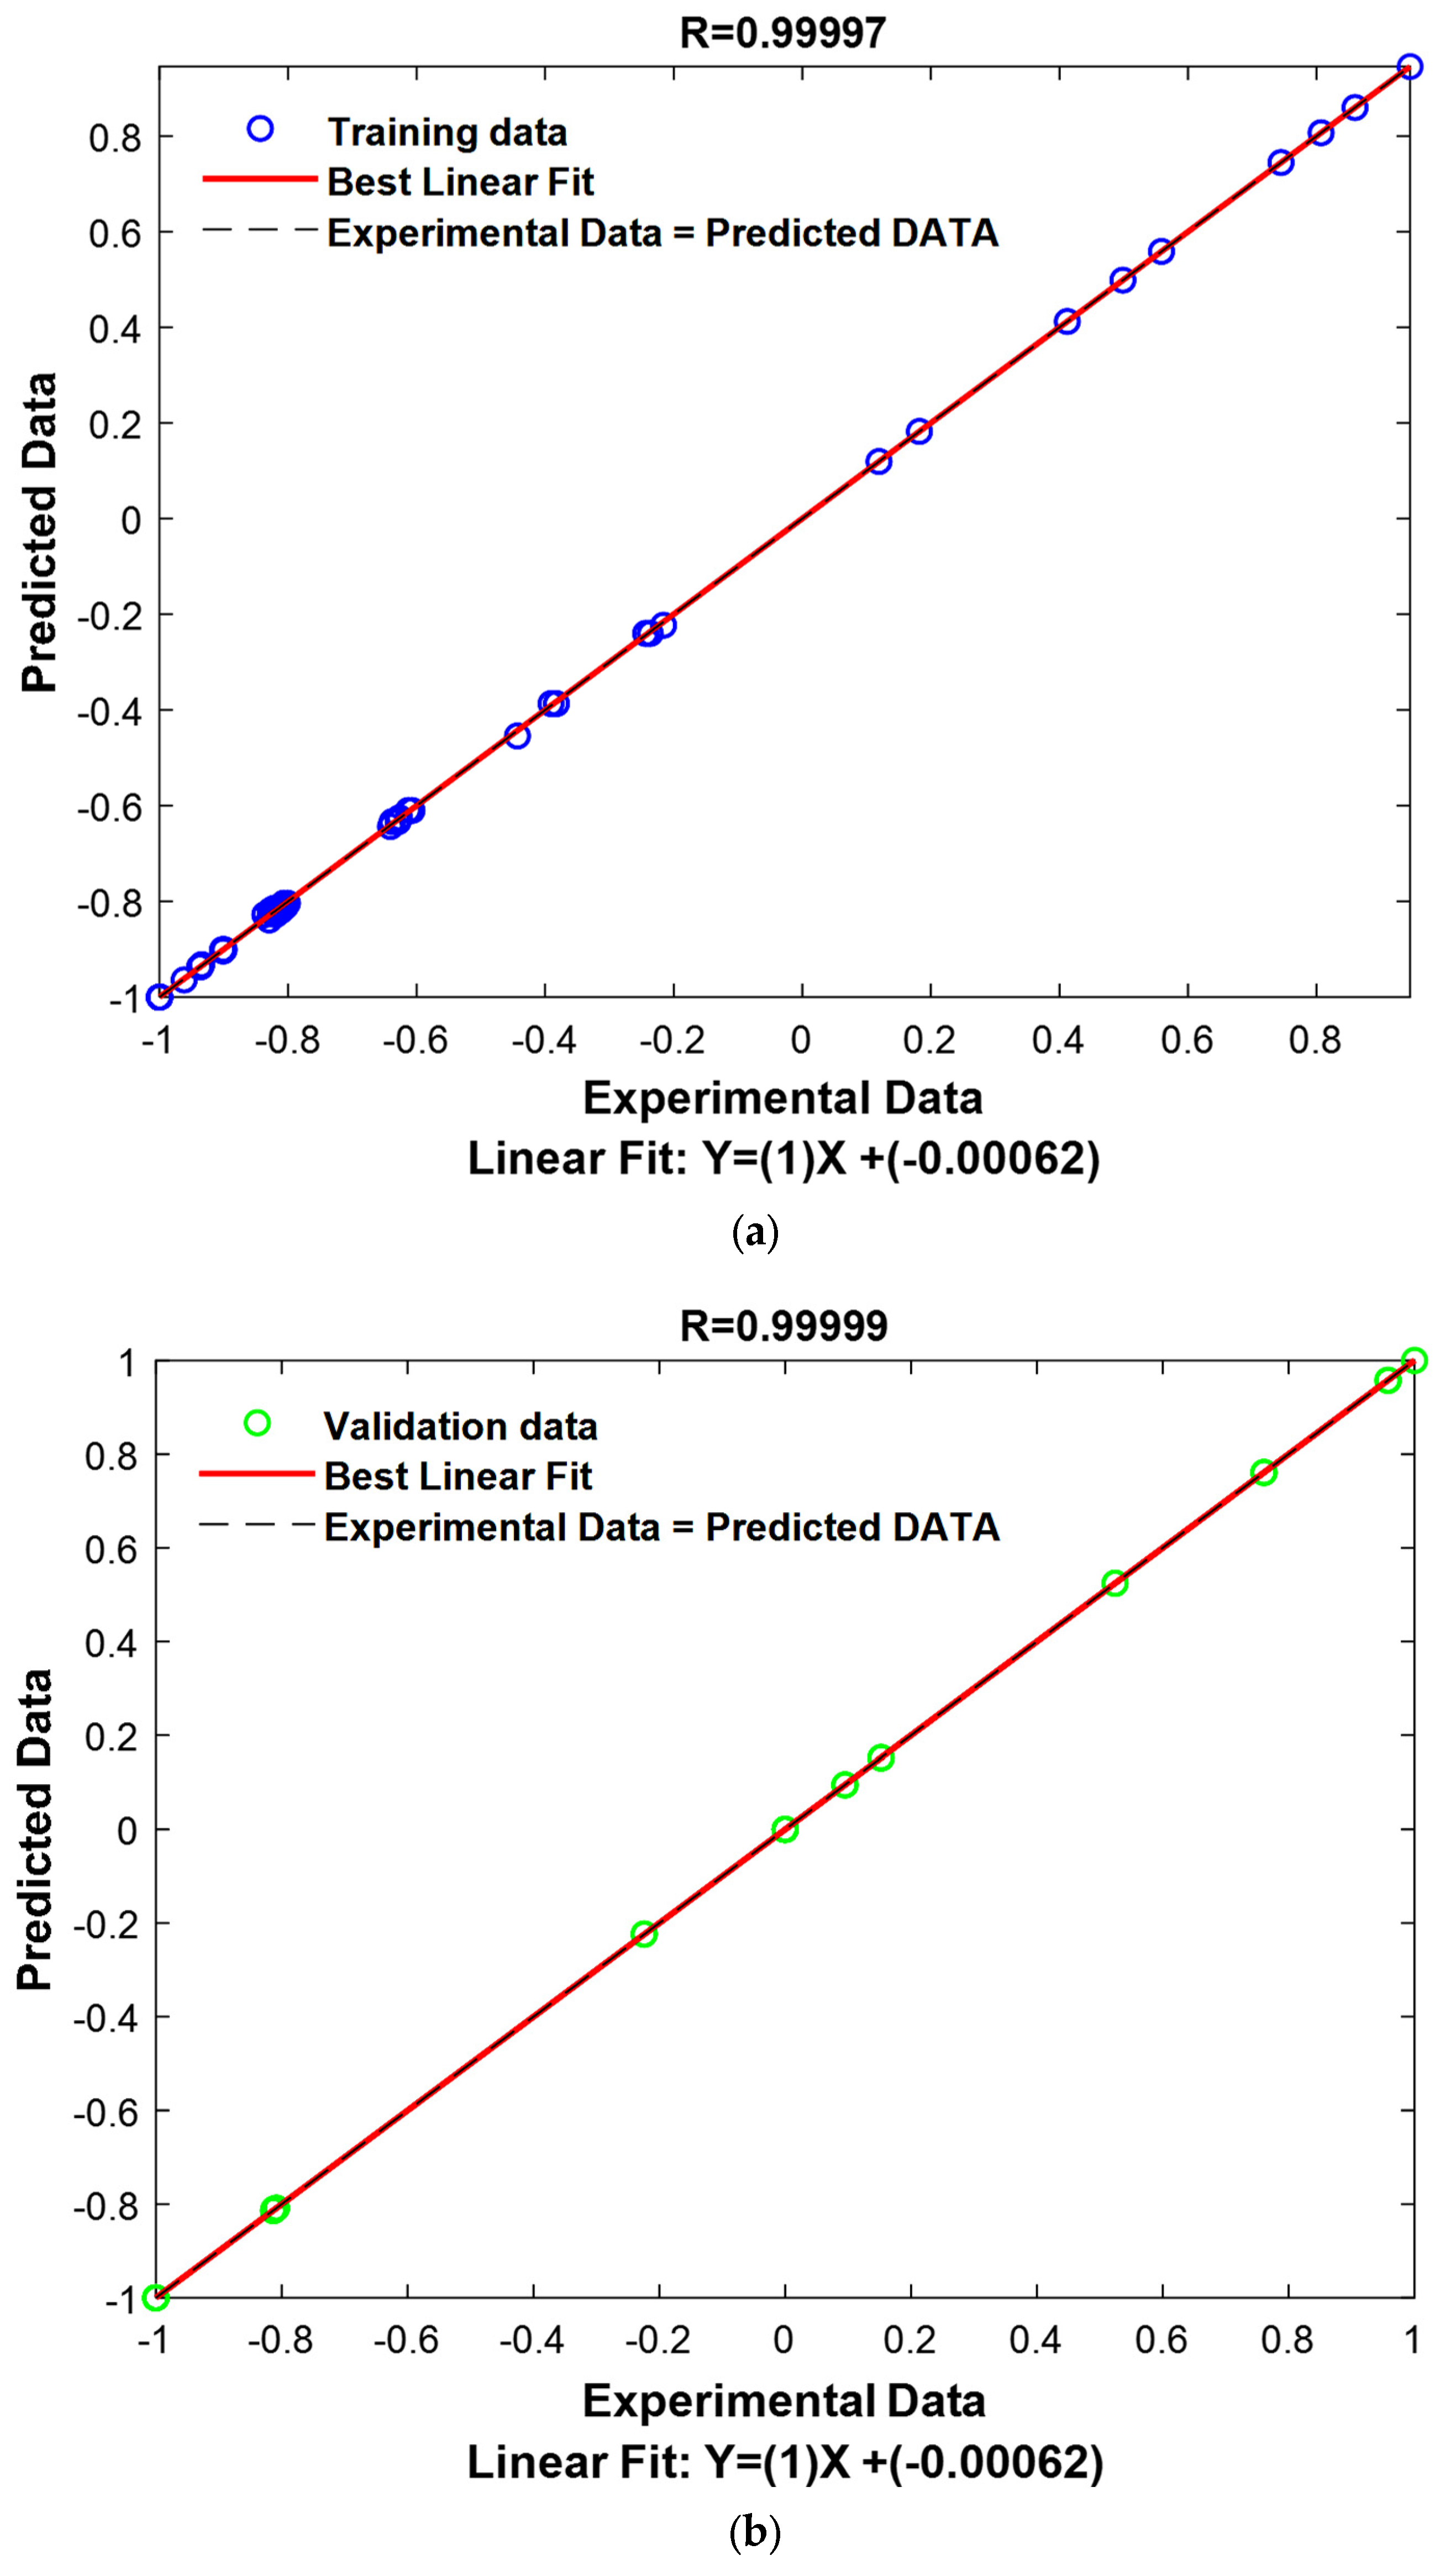
The optimization results presented in
Table 7 for the best DT_LSBOOST model provide valuable insights into the model’s performance and predictive capabilities. The Min. Leaf Size parameter is set to 1, meaning that the Decision Tree can create leaf nodes with very small data subsets. This setting allows the tree to capture detailed patterns in the data, which can be beneficial for making highly specific predictions. However, it also increases the potential for overfitting if the model becomes too tailored to the training data. In this case, the low RMSE and high R values on the validation data suggest that the model has avoided overfitting, implying it has generalization capabilities despite the sensitivity to small data subsets.
The learning rate of 0.1 in the LSBoost algorithm plays a crucial role in controlling the magnitude of updates made during each boosting iteration. This learning rate value indicates a balance between making significant improvements to the model without overshooting or converging too slowly. A moderate learning rate like this ensures that the model iteratively corrects its errors while maintaining stability, resulting in a refined predictive model. This helps avoid instability, allowing for a steady improvement in the model’s performance over multiple boosting cycles.
The Surrogate = “ALL” setting allows the model to use Surrogate splits when the primary split is not available due to missing data. This increases the model’s robustness by ensuring that the Decision Tree can still function effectively even when some data points are missing. The ability to use Surrogate splits also reduces the likelihood of prediction failure when the data are incomplete, ensuring that the model remains stable and continues to make predictions in the presence of such challenges. This feature contributes to the overall reliability and adaptability of the model.
The Min. Parent Size parameter is set to 2, meaning that a node will only split if there are at least two samples in the parent node. This restriction helps prevent overfitting by ensuring that splits are only made when there is sufficient data to support them. A lower Min. Parent Size allows for a more detailed model, but with this setting, the model avoids creating overly specific splits based on too few data points, striking a balance between model complexity and generalization.
The Number of Learning Cycles is set to 10, indicating that the model undergoes 10 iterations in the boosting process. Each cycle corrects the errors made by the previous cycle, which allows the model to progressively refine its predictions. A higher number of cycles allows the model to learn from residual errors, improving the accuracy and reducing bias. The relatively high number of cycles indicates that the model has undergone extensive learning, which has likely contributed to its superior performance.
The max. number of splits is set to 97, which allows the tree to make a significant number of splits. A higher number of splits gives the model the flexibility to capture complex relationships between the input variables. While a large number of splits can lead to overfitting, the performance metrics on the validation data suggest that the model has been able to capture complex patterns while maintaining generalization. This suggests that the model structure is appropriate for the complexity of the data.
The exact number of nodes is not provided in
Table 7, but it can be inferred that the tree has a relatively high number of nodes based on the maximum number of splits. Each node represents a decision point in the tree, and the number of nodes typically increases with the number of splits. A higher number of nodes reflects a more detailed tree structure capable of capturing intricate relationships in the data.
The R values for the application, validation, and all datasets are exceptionally high, with values of 0.9999. This indicates that the model has a near-perfect fit to the data, meaning it explains nearly all of the variance in the target variable. The high R values across the different subsets (training, validation, and testing) highlight the robustness of the model, suggesting that it is highly reliable in both training and real-world applications.
The RMSE values for the training, validation, and testing datasets are all very low, with values of 0.0031, 0.0029, and 0.0030, respectively. RMSE is a common metric for assessing the accuracy of a model’s predictions, and these low values indicate that the model’s predictions are very close to the actual values. The small RMSE values across all datasets demonstrate that the model is highly accurate and that its predictions are consistent and reliable, further confirming the model’s ability to generalize well to new, unseen data.
The optimization results of the DT_LSBOOST model demonstrate that it is an exceptionally effective predictive tool, providing highly accurate predictions with minimal errors. The fine-tuning of the hyperparameters such as the learning rate, the Number of Learning Cycles, and the max. number of splits has resulted in a model that balances complexity and generalization. The high coefficients of correlation and the low RMSE values indicate that the model has learned the underlying patterns in the data and can make precise predictions. This performance reflects the model’s suitability for accurately predicting the adsorption capacities for the removal of methylene blue and basic fuchsin dyes, showcasing its potential for real-world applications.
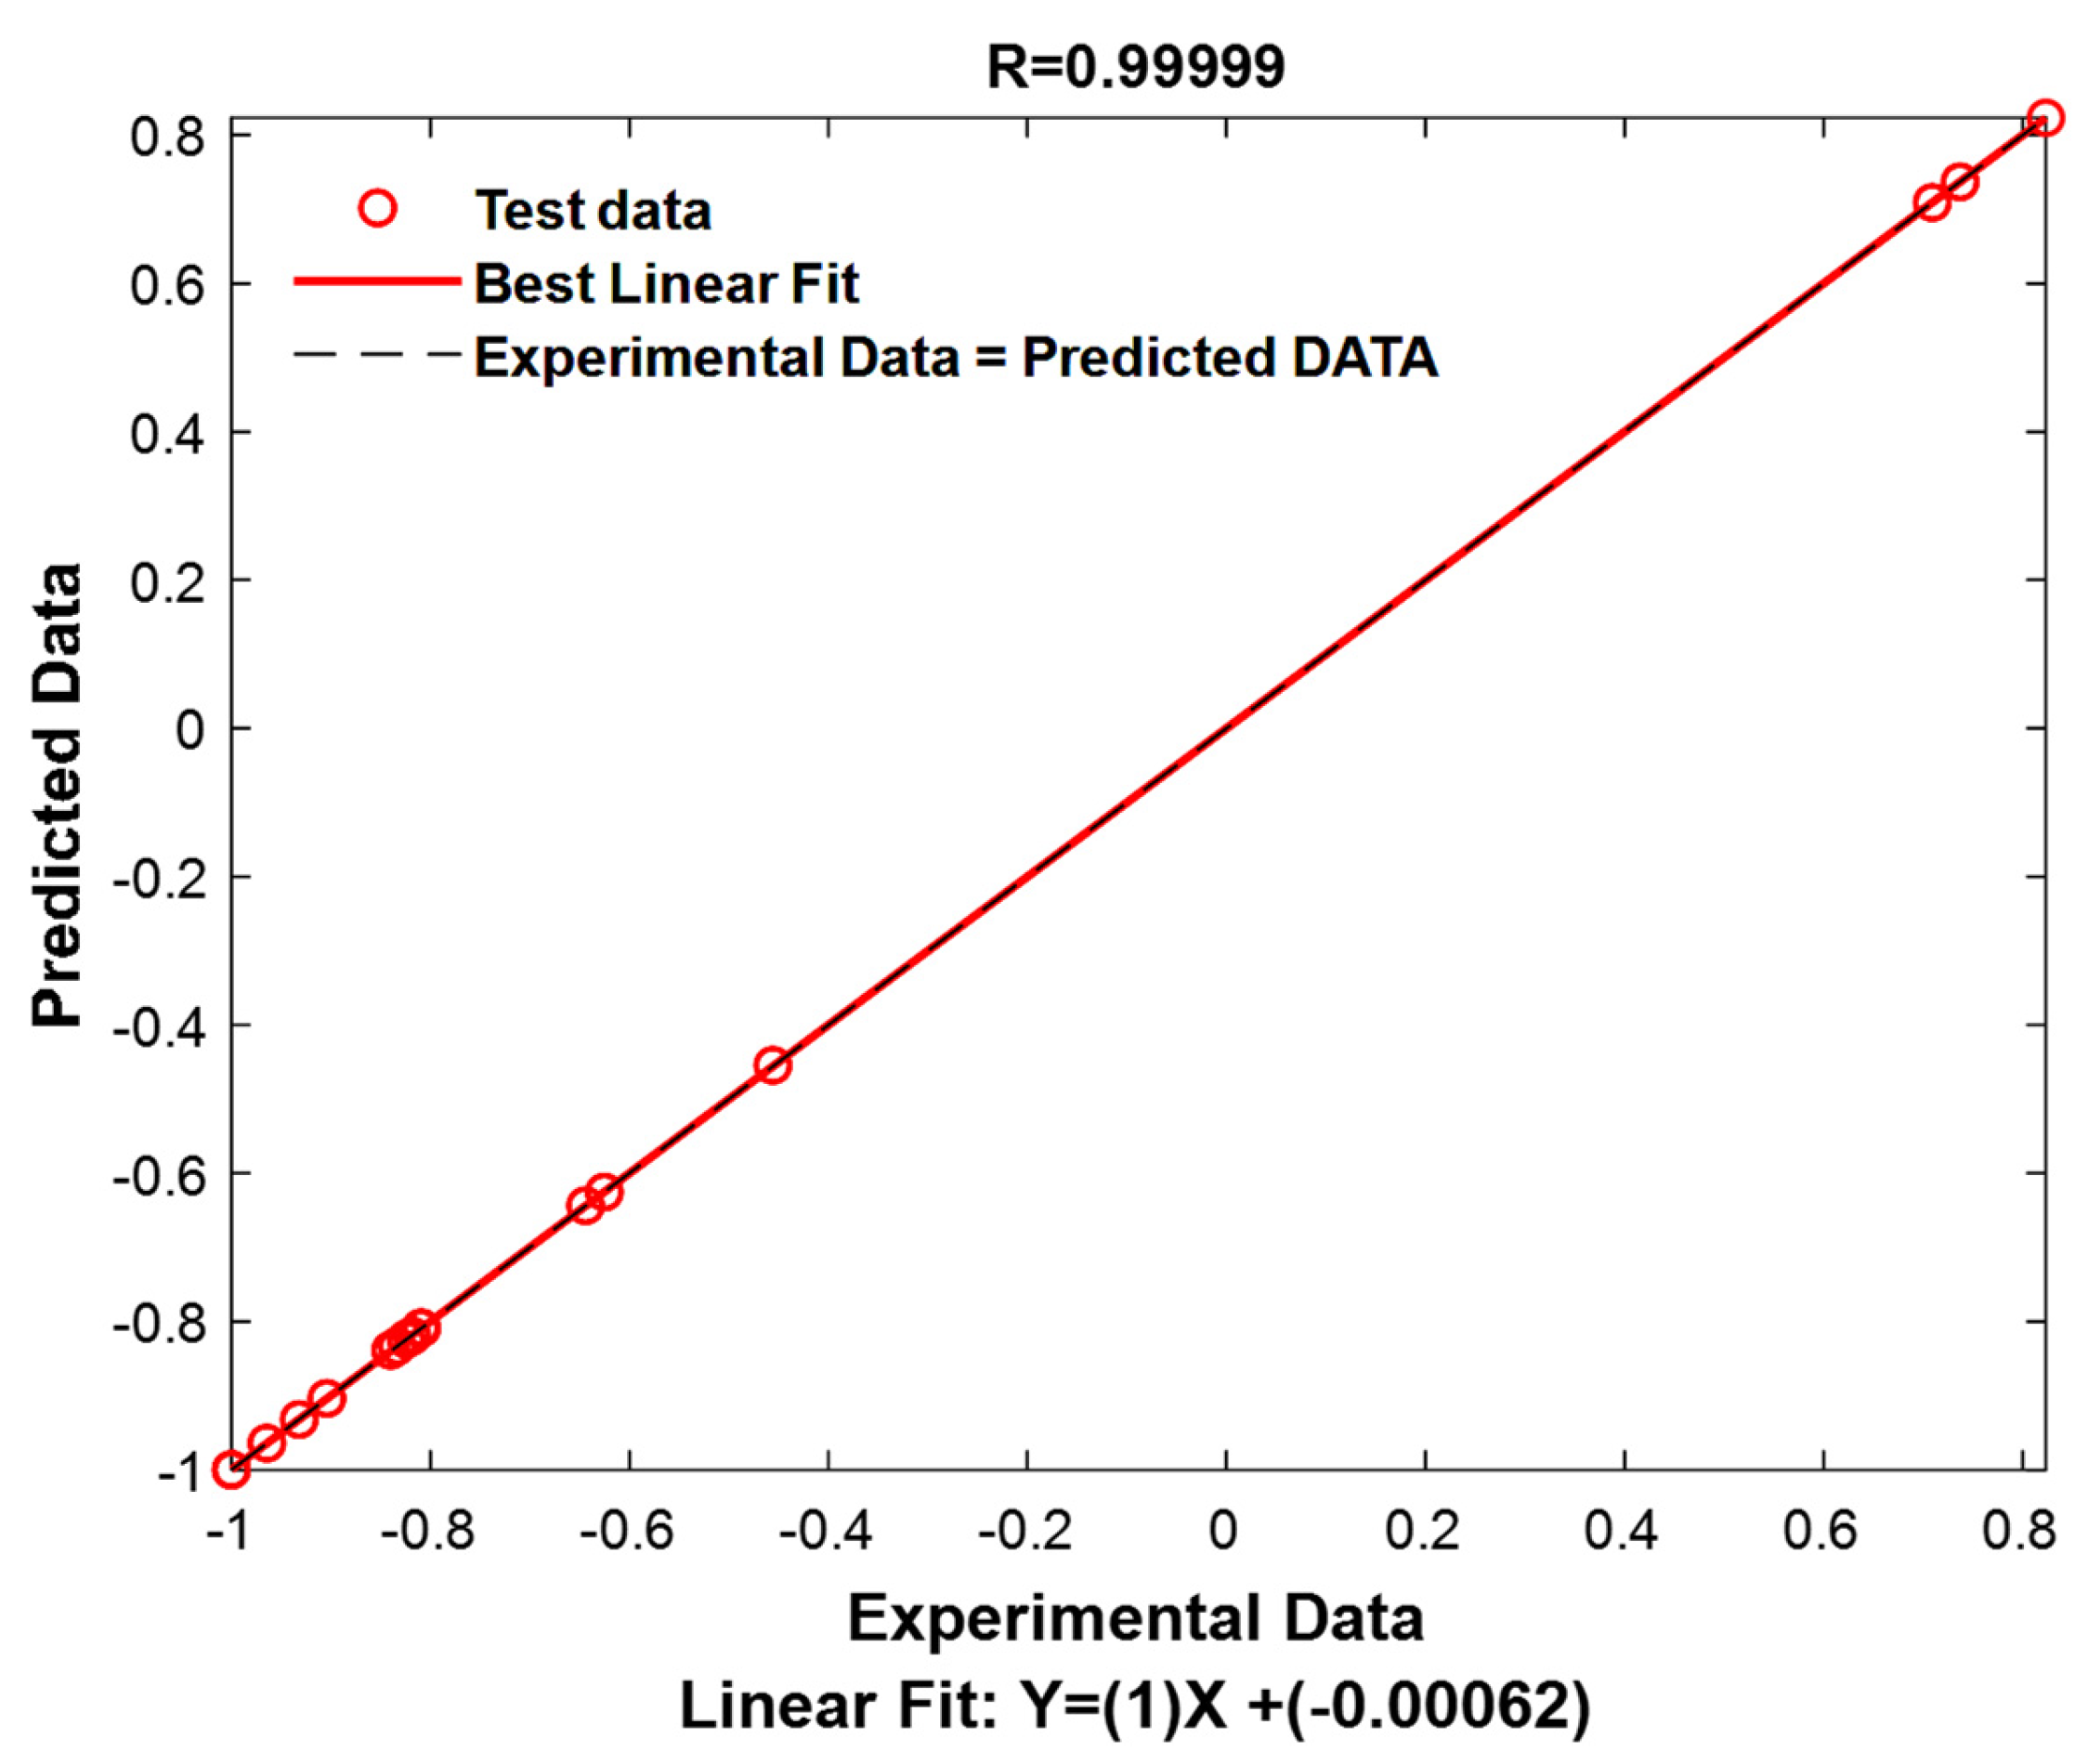
Figure 11 represents the results of the decision tree model graphically (the predicted values vs. the experimental values).
3.9.1. Performance of DT_LSBOOST Model on Unseen Testing Data
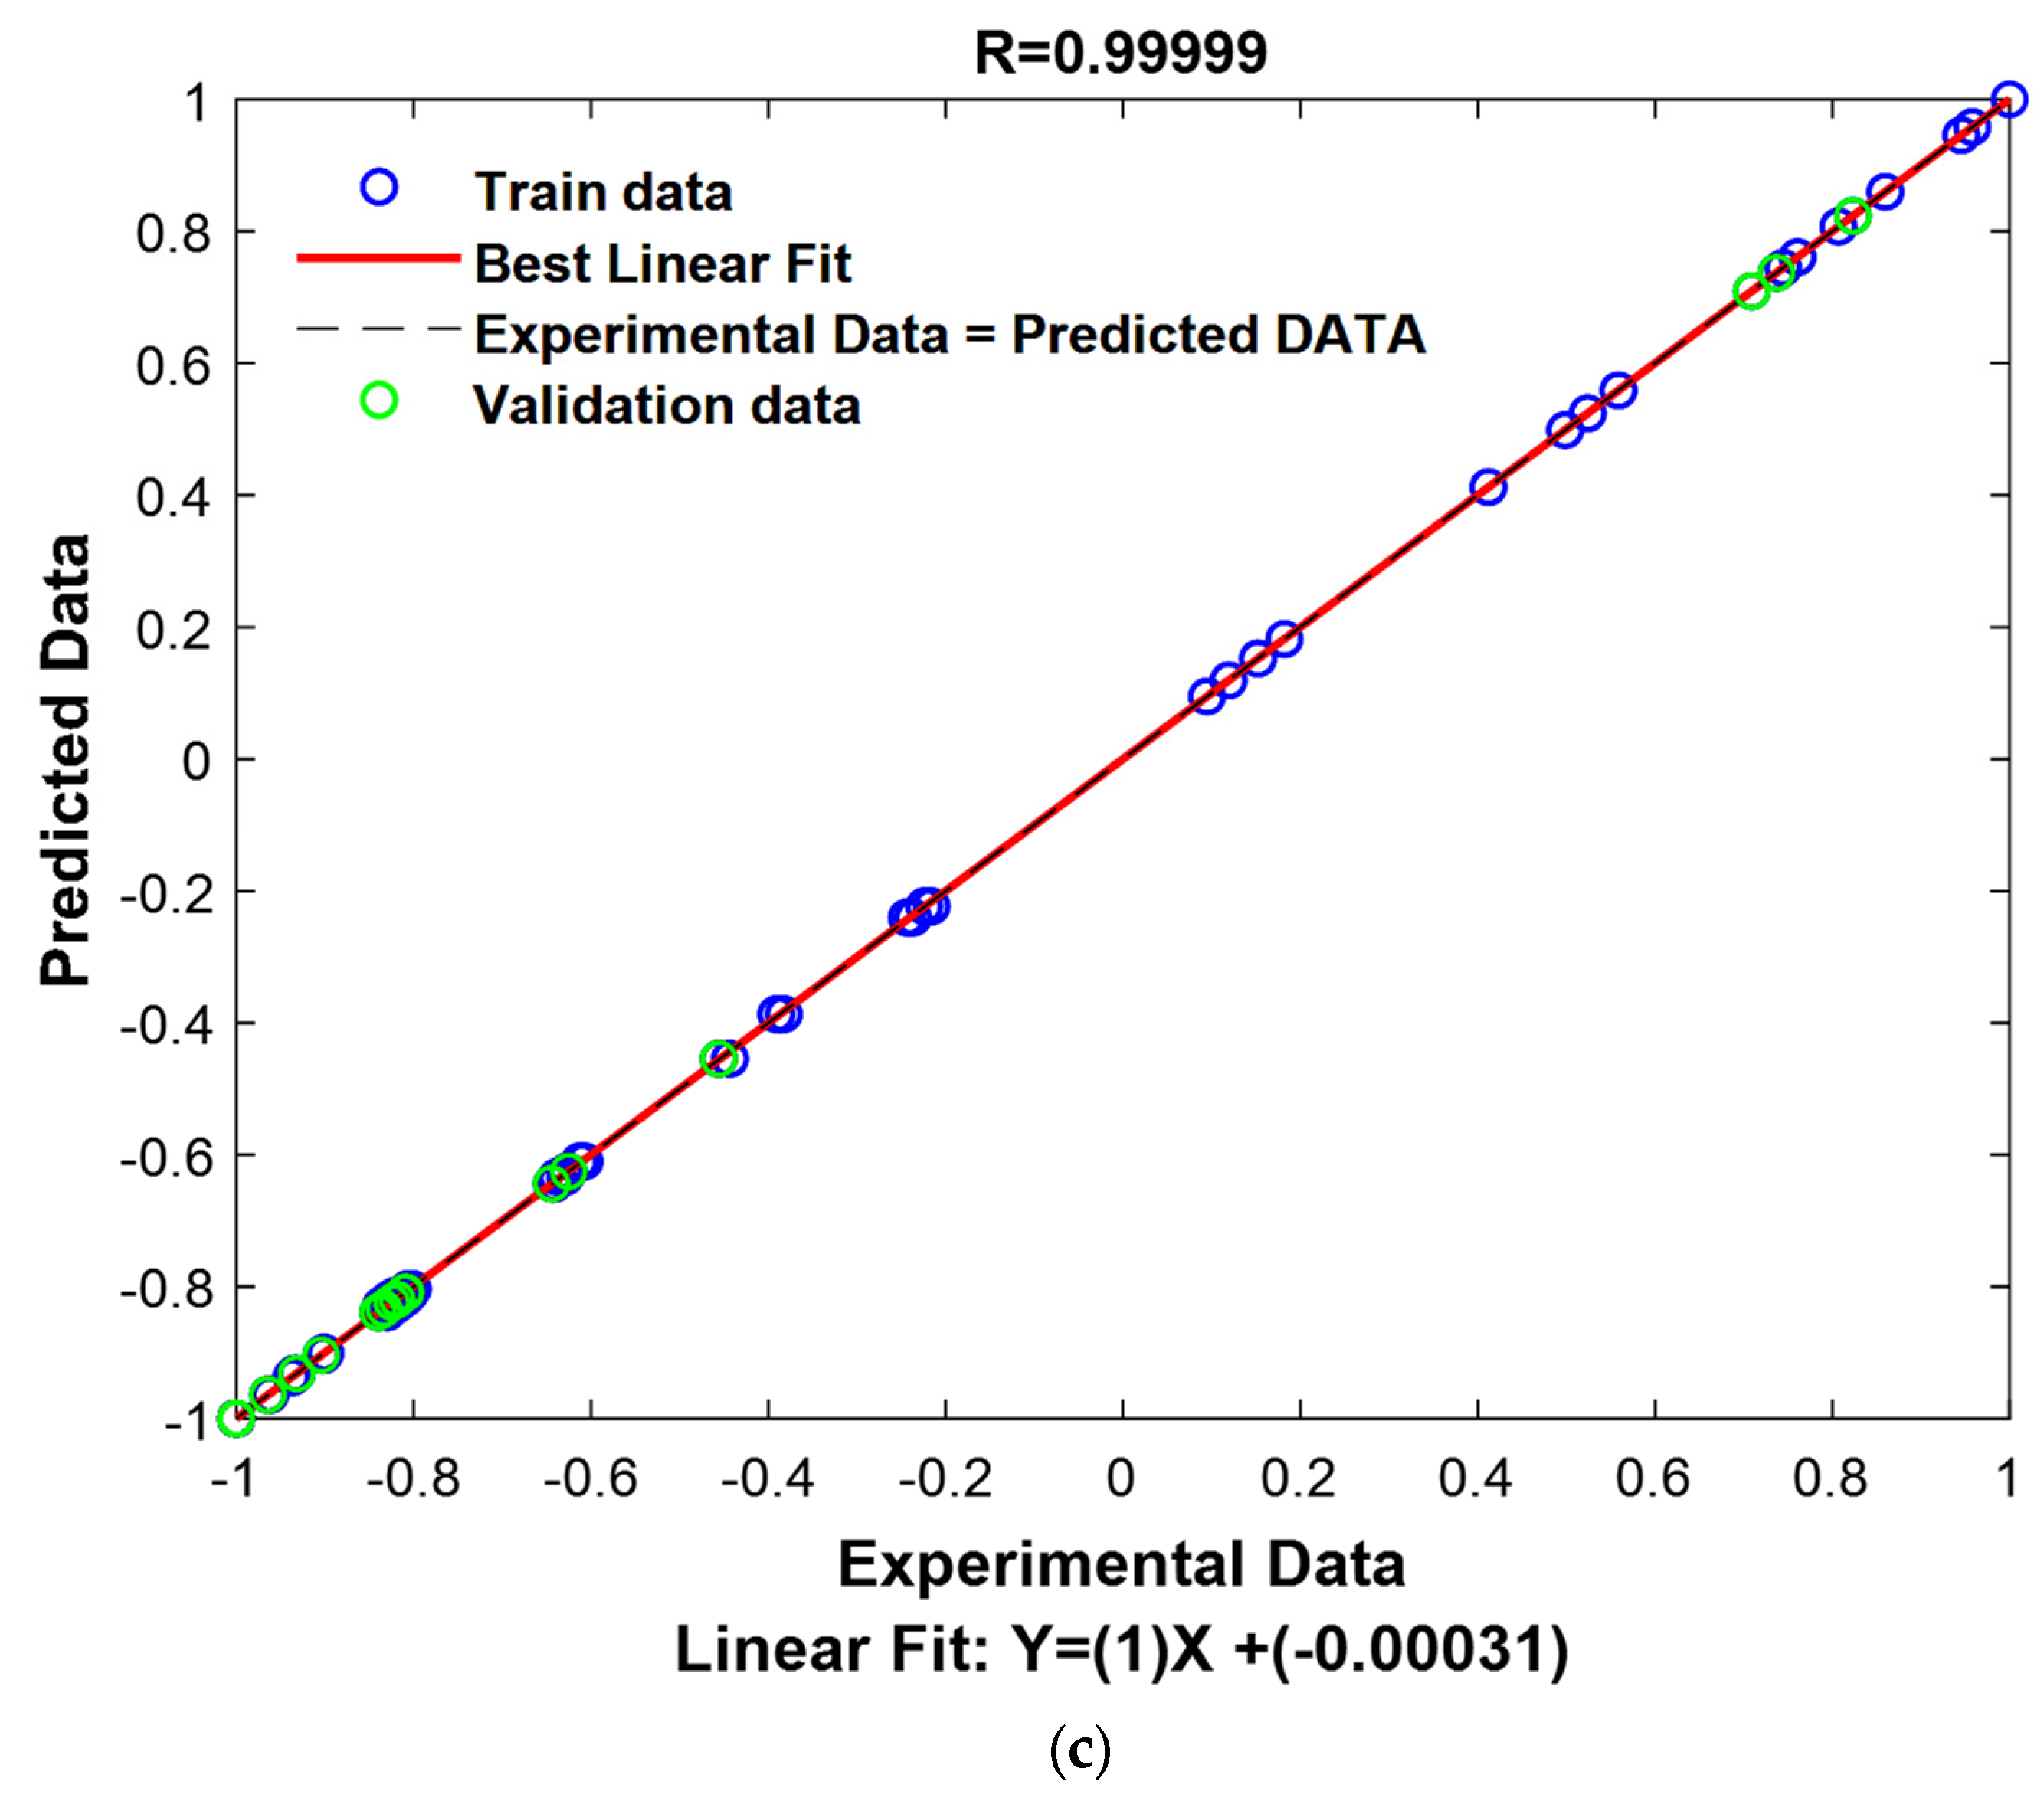
To assess the effectiveness of the obtained model, the 15% of the dataset that was previously withheld was used for testing. This approach ensures that the model is evaluated on data it has not seen during training, providing a more accurate measure of its predictive capabilities in real-world conditions. By using this unseen portion of the data, the model’s ability to generalize to new, unseen instances is tested, which is crucial for determining its practical applicability.
The results obtained from testing the model on the unseen testing data are summarized in
Table 8.
Table 8 presents key performance metrics such as R and RMSE that reflect the model’s accuracy and robustness in predicting the adsorption capacity for the removal of MB and BF dyes. These metrics allow for a direct comparison of the model’s performance on the test data against its performance on the training and validation sets.
The testing phase provides valuable insights into the model’s real-world performance. If the performance metrics on the testing dataset are consistent with those obtained during training and validation, they indicate that the model is not overfitting and is capable of making reliable predictions on unseen data. Conversely, large discrepancies between the test results and the training results may suggest that the model is overfitting and that further adjustments to the model’s parameters or data preprocessing may be necessary.
In the case of this study, the performance of the model on the unseen testing dataset, as shown in
Table 8, should demonstrate the model’s predictive accuracy and its ability to maintain low error rates across different datasets. The goal is to confirm that the model can consistently predict the adsorption quantities for both native and calcined chicken bioadsorbents, as well as for both MB and BF dyes, under varying experimental conditions. This validation of the model’s predictive power on unseen data strengthens its potential for practical applications in environmental or industrial settings where similar data characteristics may arise.
By testing the model in this way, this study ensures that the predictive model is not only accurate within the bounds of the training data but also robust enough to handle new, potentially more complex scenarios. This process of testing with previously unseen data is critical for determining the true effectiveness of any predictive model.
The results presented in
Table 8 show the DT_LSBOOST model’s performance on the unseen test data. The two key metrics, R and RMSE, provide important insights into the model’s predictive accuracy on the unseen testing dataset.
The R value of 0.9999 indicates an almost perfect fit between the model’s predictions and the actual test data. This coefficient of determination suggests that the model is able to explain 99.99% of the variance in the test dataset. Such a high value is indicative of a highly accurate model that can generalize well to new, unseen data. The close match between the predicted and actual values reflects the model’s exceptional predictive power, ensuring that it maintains consistency and reliability even when applied to previously unseen instances.
The RMSE value of 0.0029 is also very low, which is an indication of the model’s high accuracy. The RMSE measures the average magnitude of the errors between predicted and actual values, with lower values representing better model performance. In this case, an RMSE of 0.0029 indicates that the model’s predictions deviate only slightly from the actual values, suggesting minimal error and a high level of precision in the predictions. This further reinforces the model’s reliability and accuracy in predicting adsorption quantities for both native and calcined chicken bioadsorbents for the removal of methylene blue and basic fuchsin dyes.
The results from
Table 8 demonstrate that the DT_LSBOOST model has achieved exceptional performance in predicting the adsorption quantities in the test dataset. The near-perfect R value and the low RMSE confirm that the model is both highly accurate and capable of generalizing well to new data, indicating that it is well suited for practical applications in similar predictive tasks.
To provide a visual representation of these performances, experimental values and predicted values have been graphically represented in
Figure 12.
3.9.2. Residues Study
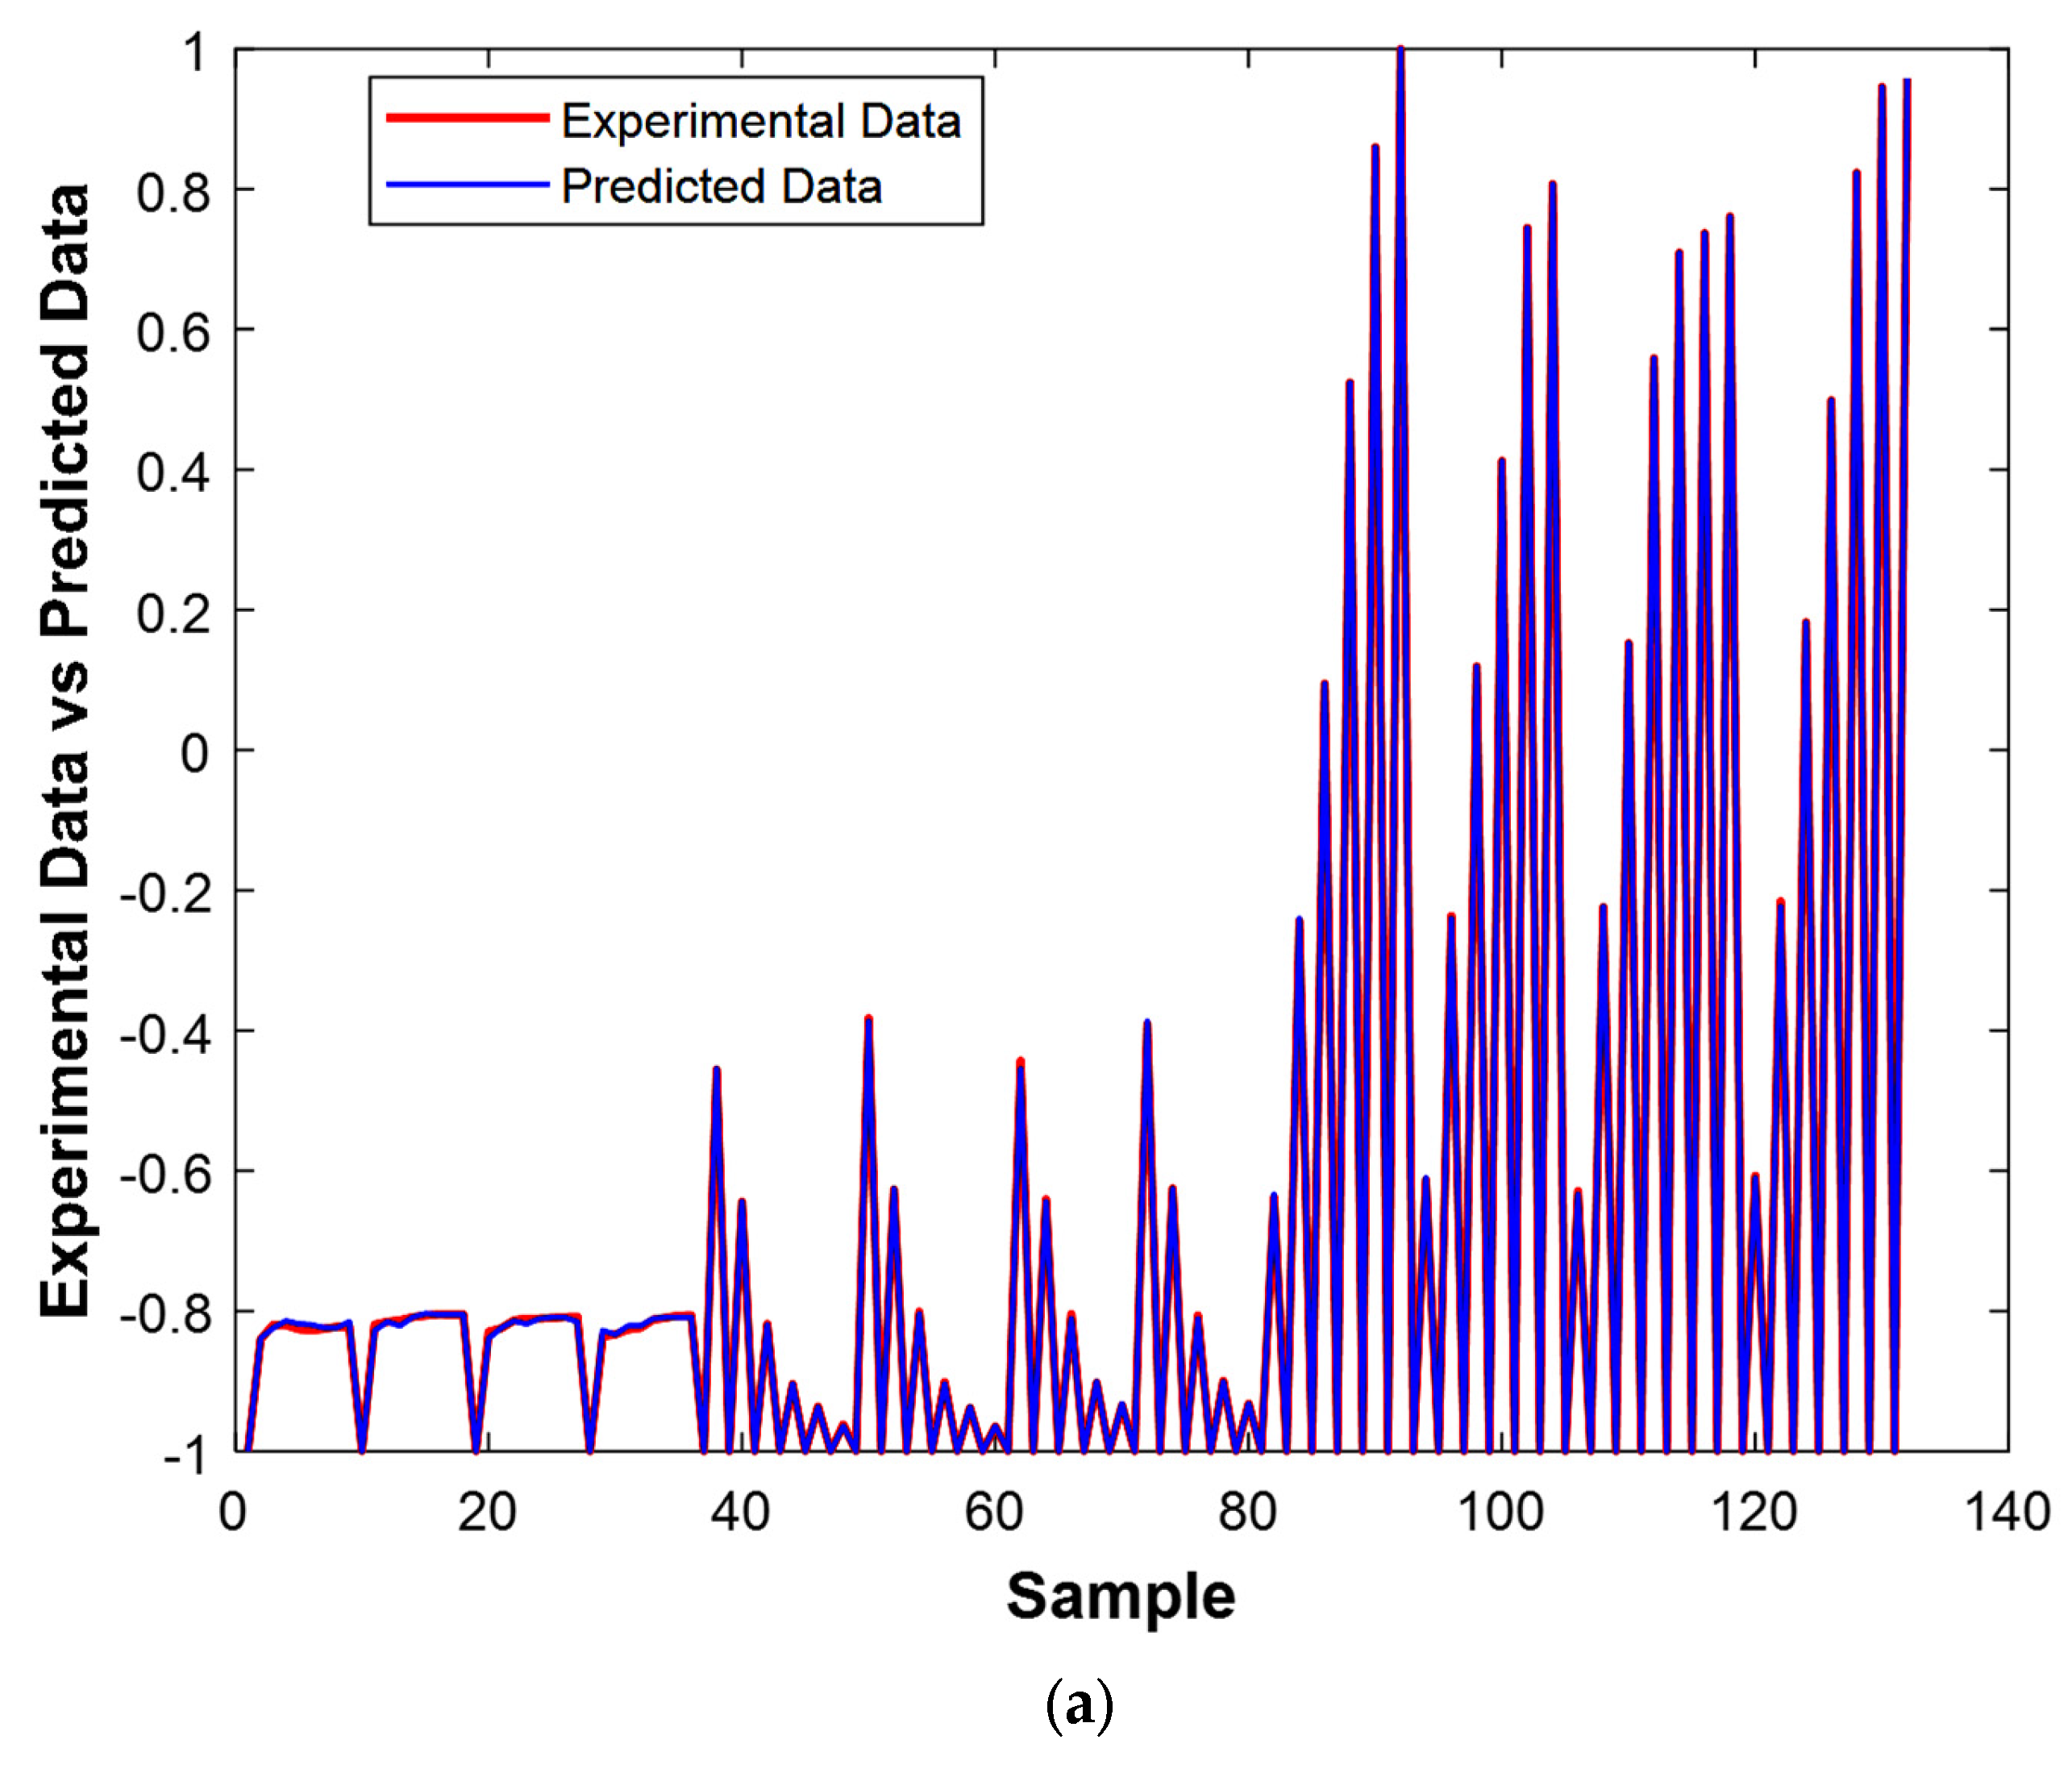
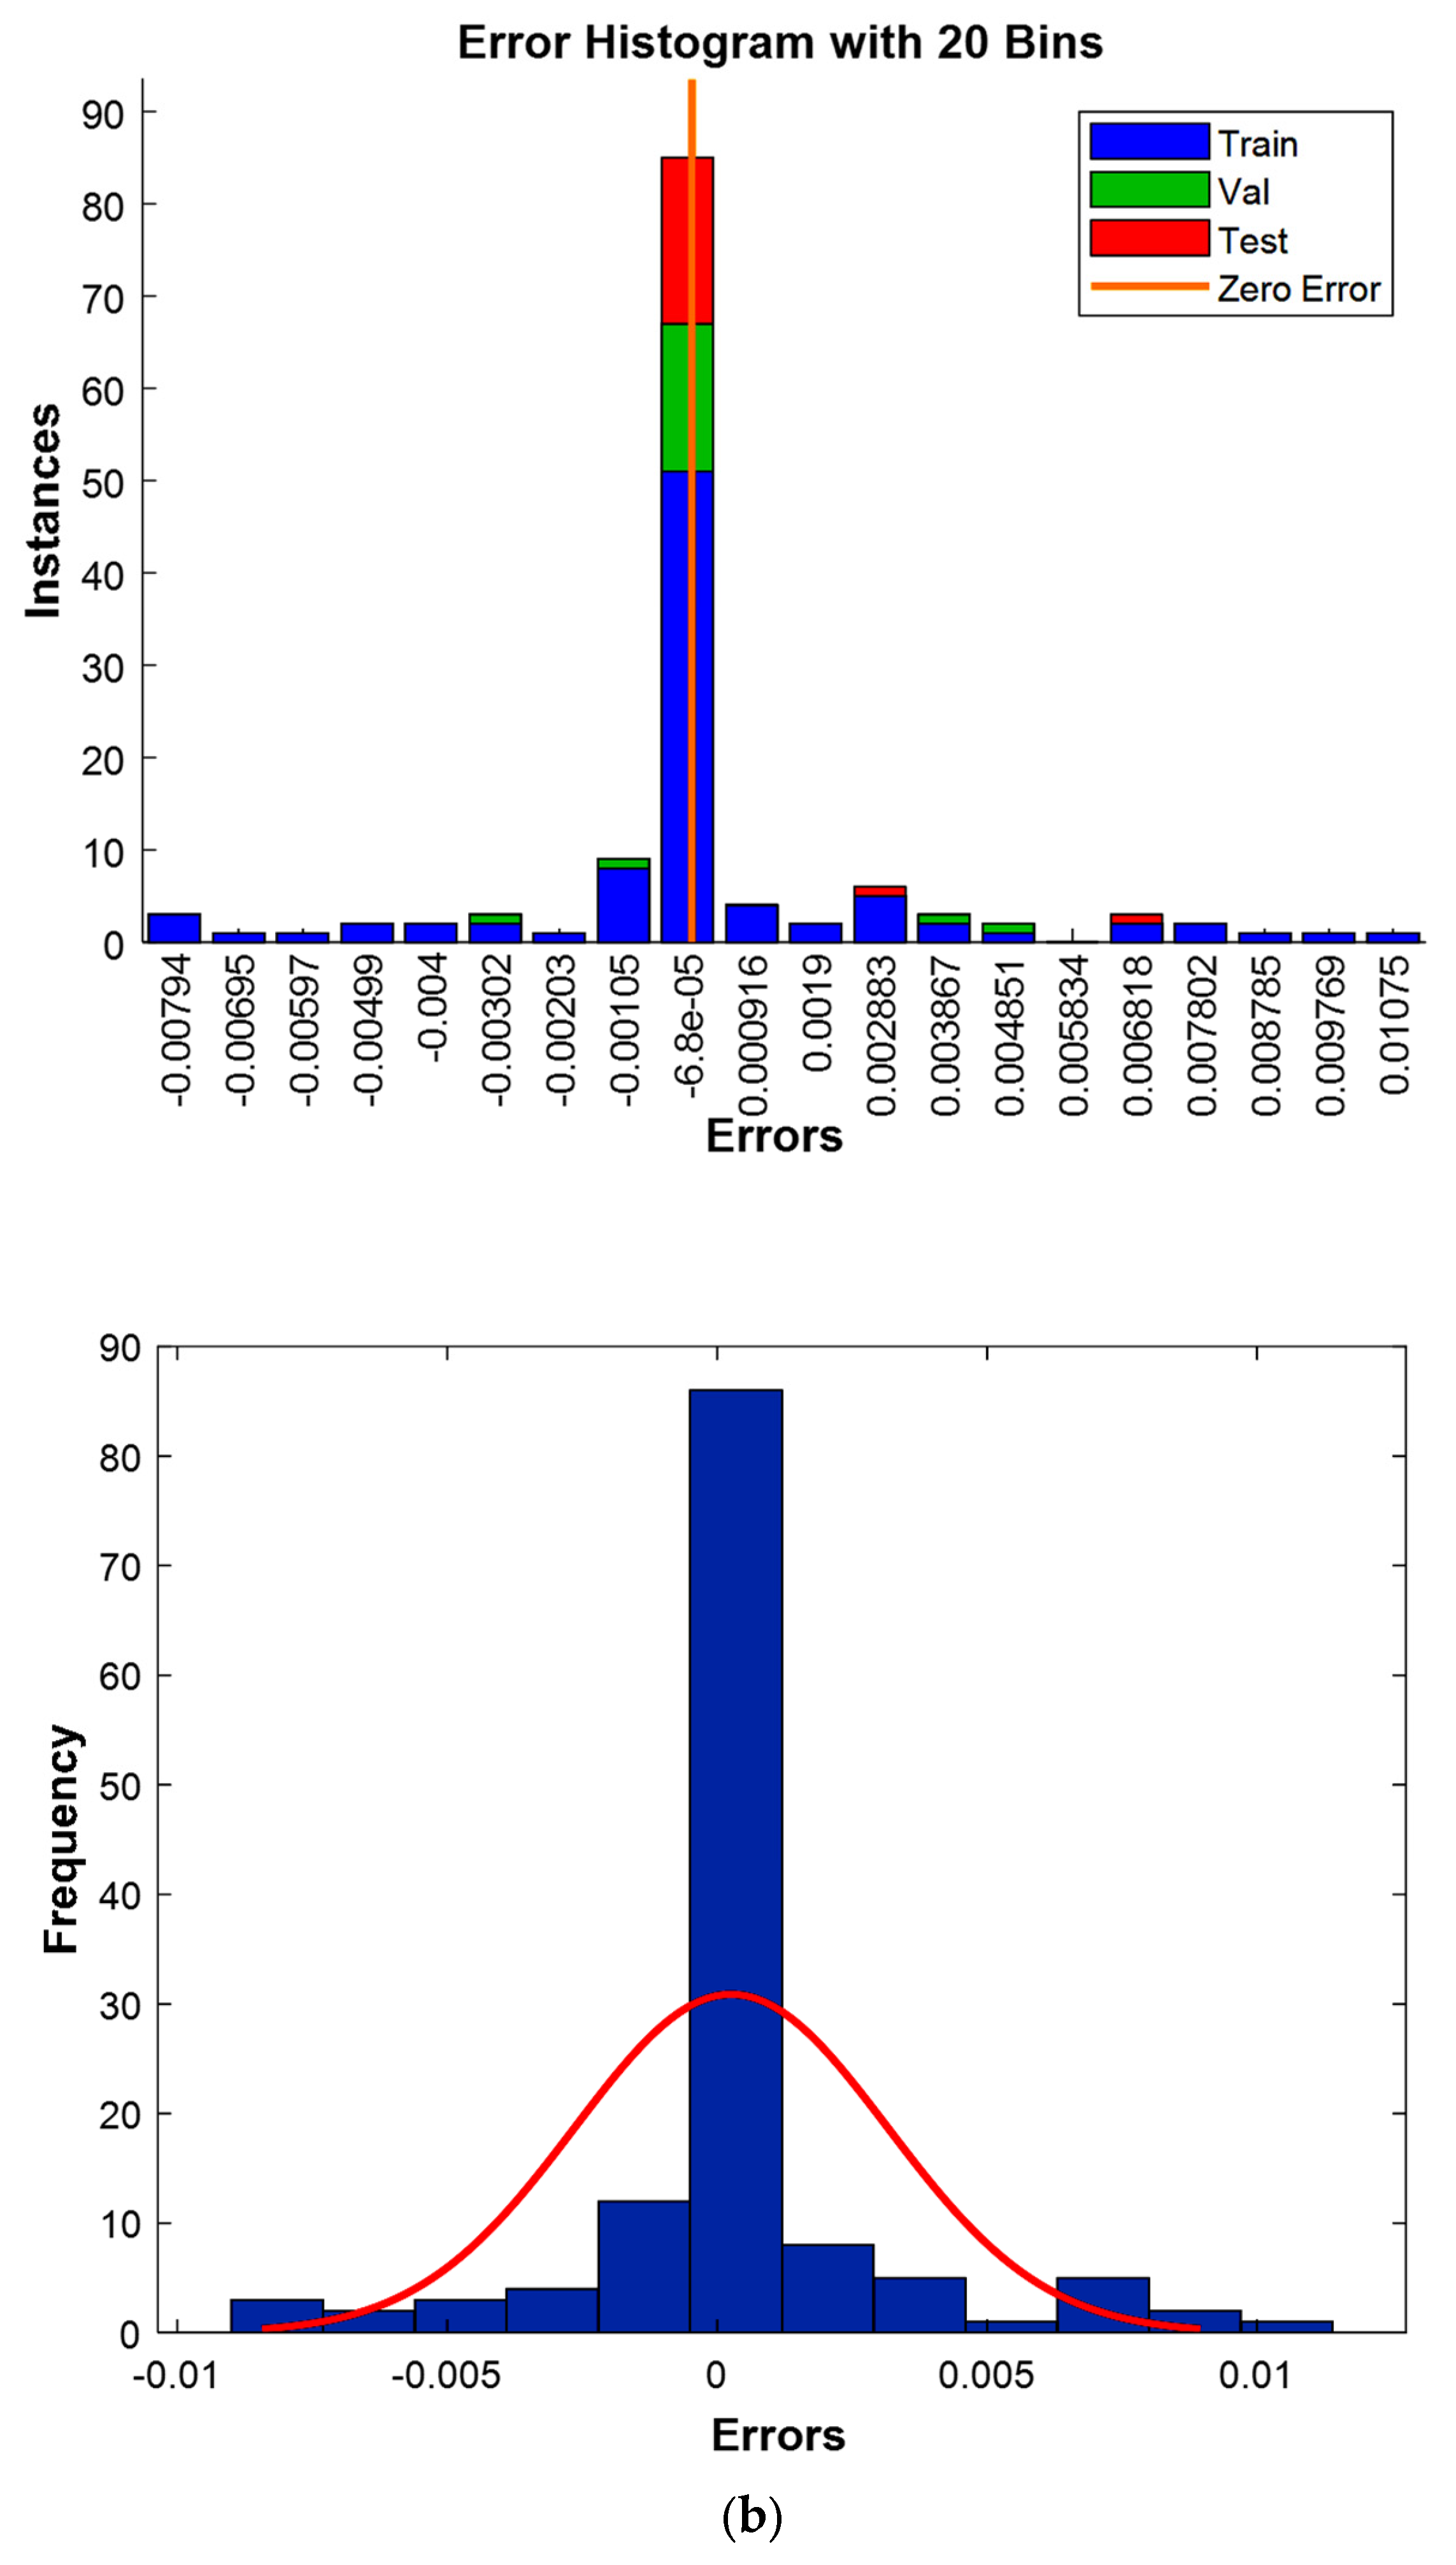
In this section, a thorough and comprehensive evaluation was performed to rigorously assess the performance and effectiveness of the chosen model. This process included the application of both the residual method and an error histogram, covering crucial stages such as training, validation, and testing. A detailed comparative analysis was then carried out by comparing experimental values with predicted ones, encompassing all data points from the training, validation, and testing datasets, as shown in
Figure 13a. Furthermore, a precise error quantification was performed by examining the discrepancies between experimental and predicted values across the entire dataset, including the training, validation, and testing sets, following established methodologies. The results of this in-depth error evaluation are clearly visualized in
Figure 13b, using advanced residual analysis techniques.
The results of the two figures provide valuable insights into the performance of the model. In
Figure 13a, the experimental values are superimposed with the predicted ones, and we observe a strong alignment between the two datasets. This close overlap suggests that the model’s predictions are highly accurate, with minimal deviation from the actual experimental values. The near-perfect alignment indicates that the model has successfully captured the underlying patterns in the data and is capable of making reliable predictions for unseen data points.
Figure 13b displays the error analysis with the discrepancies circled around zero. It can be interpreted that the majority of the errors are very small and centered around zero. This suggests that the model’s predictions are consistently close to the actual values, with only minor errors. The fact that the errors are centered around zero implies that the model does not show any significant bias, either overestimating or underestimating the predictions, which is a desirable characteristic for predictive models.
Together, these two figures demonstrate that the model is highly effective and accurate, as evidenced by the minimal errors and the close fit between the predicted and experimental values. The results indicate that the model has a strong generalization capability, making it well suited for predictive tasks in similar scenarios.
3.9.3. Interface for Optimization and Prediction
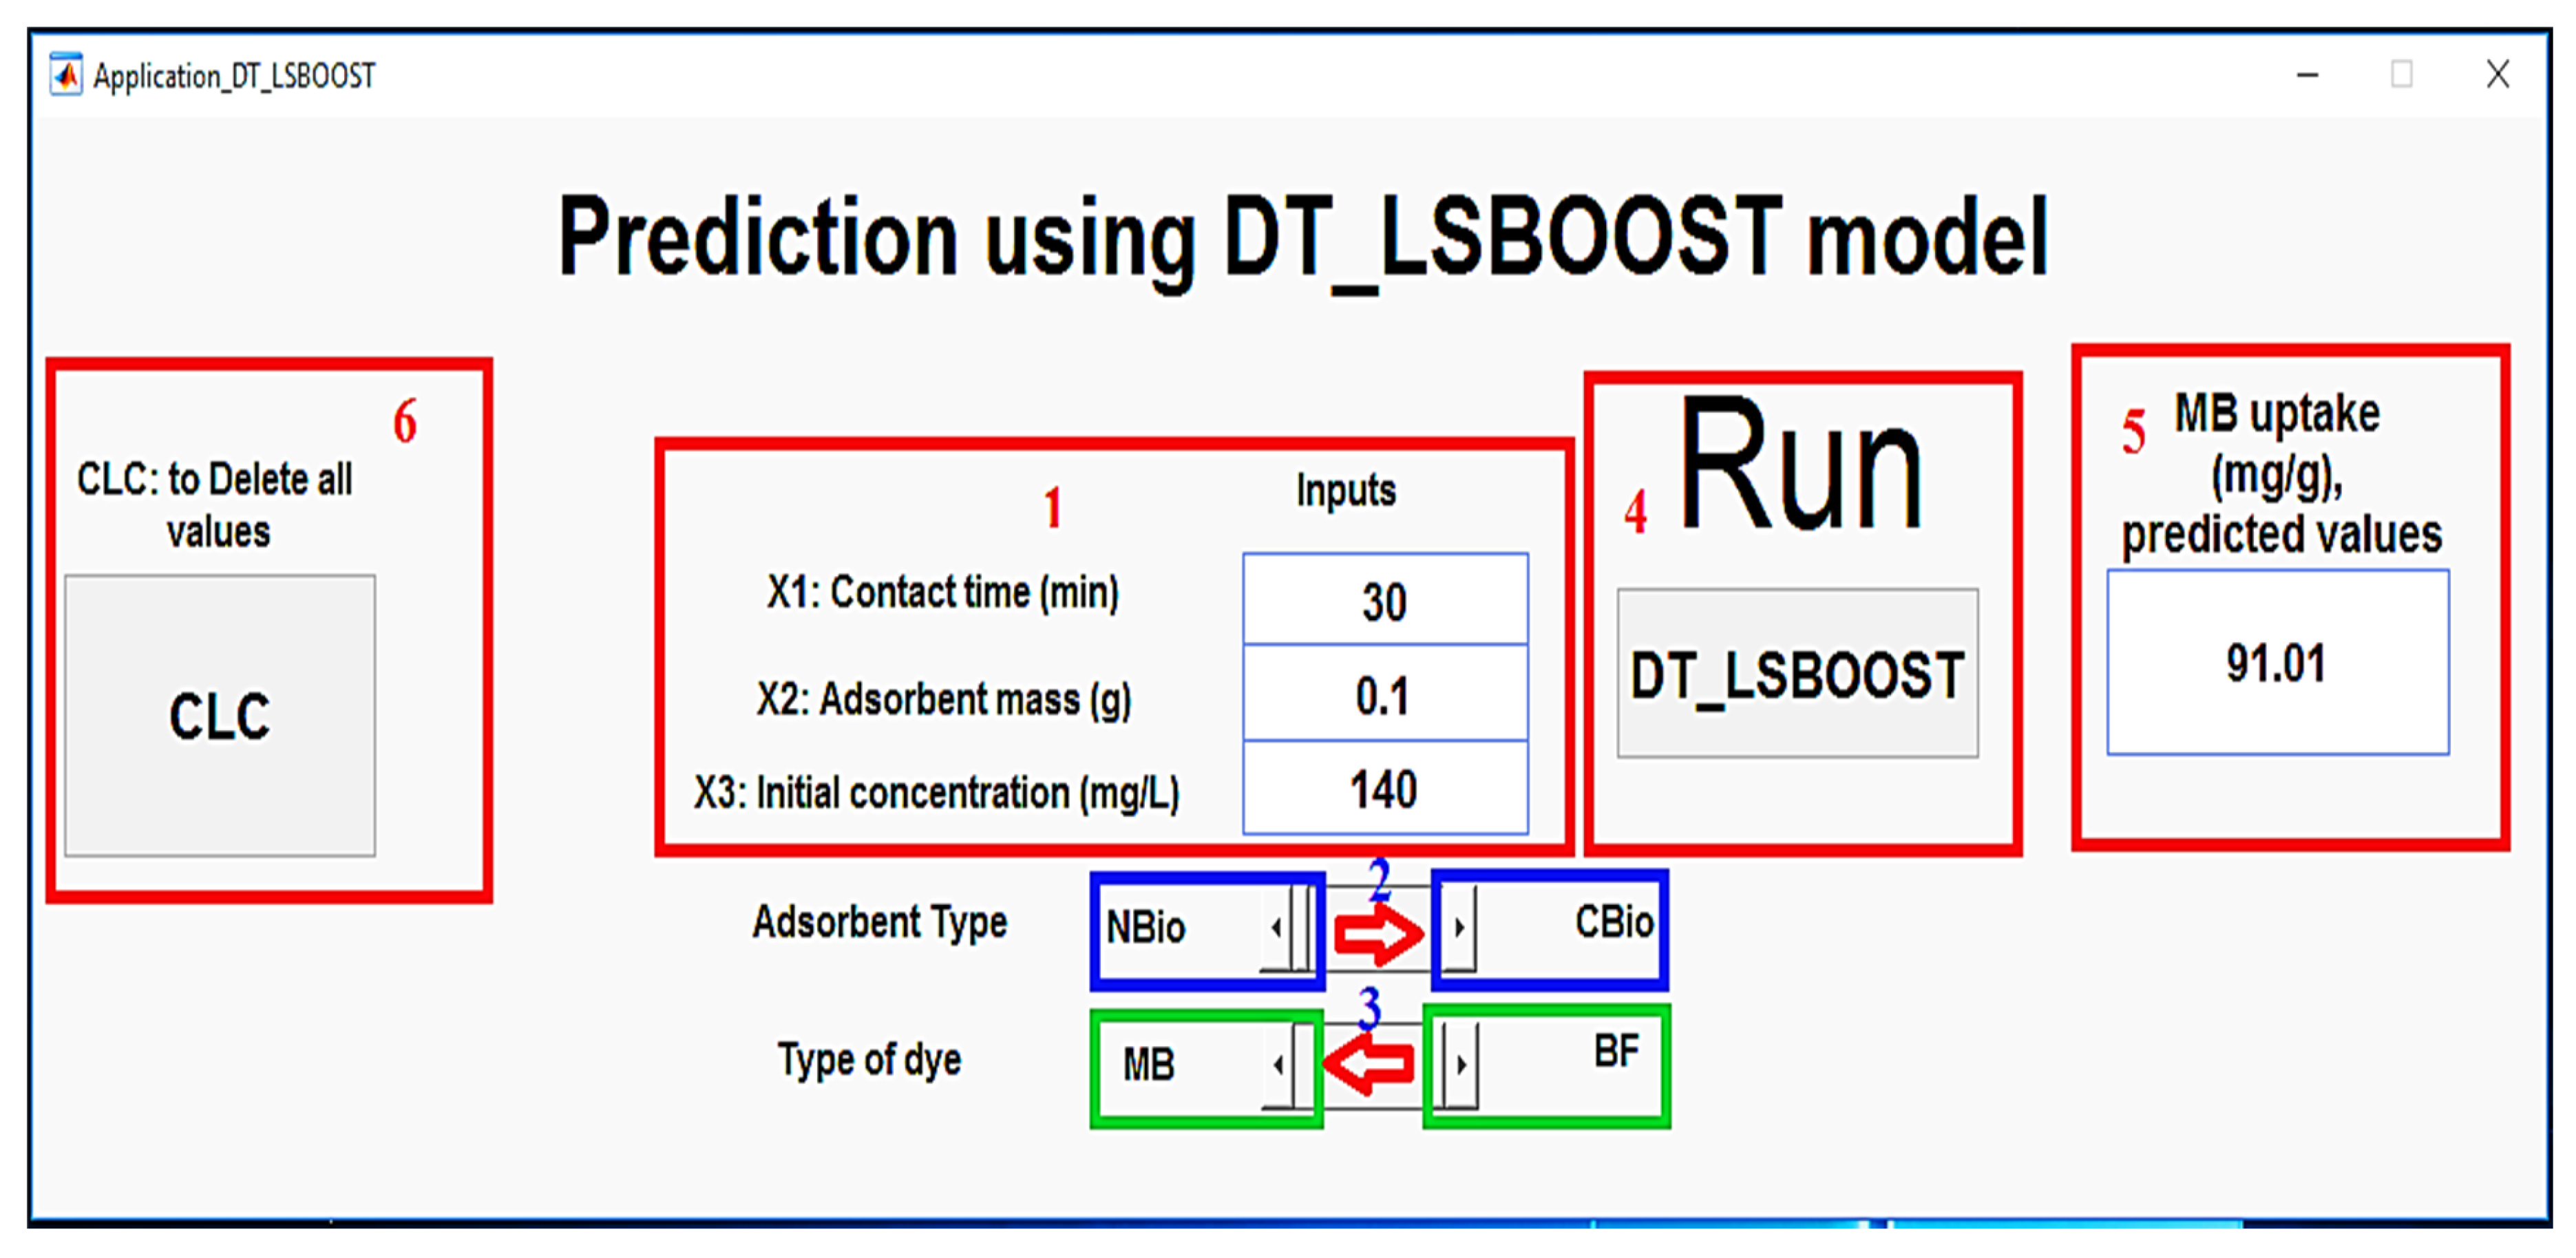
A MATLAB-based application has been developed to predict the adsorption quantity of CBio and NBio for the removal of MB and BF dyes, leveraging the DT_LSBOOST model (
Figure 14). The application is designed to be straightforward and user-friendly, requiring only the input of several key parameters for an accurate prediction. Specifically, users are prompted to enter the contact time, adsorbent mass, and dye concentration, which are the primary factors influencing the adsorption process. Additionally, the user must specify the type of adsorbent used, whether CBio or NBio, and the dye type, either MB or BF. With these input values, the application automatically processes the data through the trained DT_LSBOOST model, producing the predicted adsorption quantity for the specified conditions. This tool simplifies the prediction process, offering an accessible means for researchers and practitioners to estimate adsorption efficiency without needing to manually run complex calculations or experiments. The model’s high accuracy, as demonstrated through prior evaluations, ensures reliable predictions, making the application a valuable resource for optimizing the adsorption-based removal of dyes from aqueous solutions.
