Article

Improving Urban Flood Resilience: Urban Flood Risk Mitigation Assessment Using a Geospatial Model in the Urban Section of a River Corridor

by
Karla Vilca-Campana
1,
Lorenzo Carrasco-Valencia
1,
Carla Iruri-Ramos
1,
Berly Cárdenas-Pillco
1,
Adrián Escudero
2 and
Andrea Chanove-Manrique
1,*
1
Facultad de Arquitectura e Ingenierías Civil y del Ambiente, Universidad Católica de Santa María, Arequipa 040101, Peru
2
Instituto de Investigación en Cambio Global, Universidad Rey Juan Carlos, 28933 Madrid, Spain
*
Author to whom correspondence should be addressed.
Water 2025, 17(7), 1047; https://doi.org/10.3390/w17071047
Submission received: 8 February 2025 / Revised: 26 March 2025 / Accepted: 27 March 2025 / Published: 2 April 2025
(This article belongs to the Section Urban Water Management)

Abstract

:
Climate change and land use changes in urban landscapes exacerbate the runoff generation which produces economic losses and socio-environmental impacts. Urban rivers serve as blue–green infrastructure (BGI) offering ecosystem services (ESs), including runoff control and mitigation that helps in climate change adaptation, especially in arid regions where flash floods are devasting and climate models predict an increase in frequency and intensity. This study uses the InVEST urban flood risk mitigation (UFRM) model to estimate the runoff generated during precipitation events, applied to the urban section of the Chili River in Arequipa, an arid region south of Peru. The model requires information on land use/land cover, rainfall depth, and hydrological soil groups. Results from 1984 and 2022 demonstrate there is a significant reduction in runoff retention, specially in the northern section, where areas decreased their runoff retention capacity from 70–80% to 20–30%. The results highlight the river’s critical role in mitigating flash flood risks in a dessert region. The methodology used can help estimate run-off mitigation provided by urban rivers as BGI and supports the conservation and restoration of urban rivers as ecological corridors, enhancing urban resilience.

1. Introduction

Cities are recently becoming vulnerable to extreme meteorological phenomena, including flash floods produced by short-term precipitation episodes. Such events occur unexpectedly in urban areas that are not normally recognized as flood-prone, causing widespread damage to life and property [1], thus hampering society’s sustainable development [2]. Vulnerability to floods heightened globally because of climate change, land use alterations and the dramatic urban sprawl [3,4]. In addition, urban structure can redefine local precipitation patterns due to the appearance of heat islands, aerosol loading, and modifications in the green infrastructure which could induce higher rates of a maximum runoff flow and at the same time, limiting groundwater water recharge is limited and accelerating soil erosion [5,6,7].
Although, urban flooding has become more frequent worldwide, proper management of urban storms is still lacking [8,9]. High income countries have urban planning, enough funds and laws that allow establishing effective flood control measures while developing countries are currently facing dramatic problems due to the proliferation of informal settlements that rarely respond to planning guidelines, regulations, and construction requirements [10,11]. This is especially critical for urban areas in arid regions where flash floods are an increasing risk.
Two mechanisms for flood control are recognized: Hard Engineering and Soft Engineering Measures [12,13]. The first ones consist of the construction of reservoirs, detention basins, and others [12]. The second ones include flood prediction, land use management, restoration and acquisition, post flood recovery and relocation planning [3,12]. This sort of innovative measures which can be located under an umbrella called sustainable urban drainage (SuDS), include tools such as “Low Impact Development” (LID), “Natural Water Retention Measures” (NWRMs) and “Nature-Based Solutions” (NBSs), such as “blue green infrastructure” (BGI) [13,14]. Conventional and hard engineering is not usually the best option because of the cost and time it demands [15] especially in low-income countries, so soft engineering based on nature is becoming critical for optimizing urban stormwater management [16,17]. They provide socio-ecological–technological solutions based on nature, improving infiltration and reducing runoff [13].
Urban rivers are a critical BGI. They represent biophysical and ecological connections between cities and surrounding ecosystems [18]. They also protect biodiversity, provide multiple ecosystem services (ESs) [19,20,21] and constitute a basic tool for cities resilience [21,22,23]. The bioretention occurs through the adsorption of a part of the runoff which is infiltrated into the substrates helping ground water reload [24]. Accordingly urban rivers are probably the main Nature-Based Solution to achieve sustainable development goals (SDGs) and address climate challenges [20].
The development of studies and guidelines for proper flood risk management are necessary [25]. Studies on the design of hydraulic infrastructure and the optimization of its operations are widely developed [26,27,28,29]; as well as research on multi-scale hydrometeorological factors and monitoring are widely developed [7,30,31,32,33,34]; studies on the detection of atmospheric rivers and their direct relationship with precipitation incidence [35,36]; investigations on topography, geomorphology and land cover for flood control using GIS [1,6,11,34,37,38,39,40,41,42]. In Asia and the Mediterranean region, research on green infrastructure systems, bioretention, artificial wetlands, and green roofs is predominant [5,8,12,16,34,41,43].
Nevertheless, the spatial understanding of such sudden events, such as flash floods, through modelling scenarios at the urban level is still a rather unexplored and promising field [21]. In this sense, geospatial studies and multicriteria analyses of ecosystem services can be useful [38,44].
Remote sensing and geoprocessing lead to the proper use of huge information for the planning and management of watersheds and their flood dynamics [18,39,40,42,45]. Different simulation models are used to study hydrological ecosystem services such as SWAT (Soil and Water Assessment Tool), InVEST (Integrated Valuation of Ecosystem Services and Trade-offs) RIOS (Resource Investment Optimization System), the MUSKINGUM model and MIKE FLOOD model, and SWMM (Storm Water Management Model) [2,3,15]. It is recommendable to apply SWAT to evaluate different scenarios of land use on fine spatial resolution. This is appropriate when enough time and input data are available [46]. RIOS complies with a ranking approach selecting areas to implement activities for upgrade of ecosystem services. In contrast to SWAT, InVEST can be used to quantify and map different ecosystem services directly and relatively fast. Furthermore, InVEST or SWAT can be used to evaluate the results simulated with RIOS [46,47,48,49]. MUSKINGUM model is a popular method for flood routing, but the parameters of the model, such as the distance judgment factor and the step factor, have limited its application range [2]. MIKE FLOOD model works simultaneously MIKE 11 and MIKE 21 to simulate flooding. It has high data requirements; when simulating small-scale areas, it needs precise spatial resolution, while it cannot predict elevation differences in floodplain modelling which hinders the accuracy of results [15]. SWMM models urban floods by coupling with LISFLOOD-FP. While such coupled models have advantages in simulating floodplain flows, the computational cost is the main drawback of these models [3].
Therefore, the spatial integration of floods in urban-level modelling scenarios can be approached using InVEST, which is an open-source model developed by the Natural Capital Foundation [50]. Although few studies have reported applications for the InVEST model for urban flood mitigation [21]; its use is steadily increasing [21,22,41,43]. Hack et al. [18] used InVEST to show the spatial distribution and magnitude of the impact of urbanization on the habitat quality within a river corridor, agreeing with Shanableh et al. [6] by demonstrating that the effect of land cover change (urbanization) on runoff characteristics is the increase in flood extent in the residential land use zone. Quagliolo et al. [14] used the model to measure the amount of runoff produced by extreme rainfall events in coastal cities. The results helped define examples of Natural Water Retention Measures (NWRMs) by land cover type. Kadaverugu et al. [21] applied the model to measure the flood mitigation service of green spaces in a city, showing that 44–50% of precipitation was retained by this type of open space. With a 13% increase in rainfall intensity, the retained runoff only increased by 5%, indicating that this slight increase would generate more runoff, causing proportional economic damage. Li et al. [41] applied InVEST to quantify the runoff reduction capacity of green infrastructure in a city and assessed the demand for this ecosystem service by flood risk index. The study revealed the direct association between landscape patterns and the demand for this ecosystem service; a less fragmented landscape with a complex shape could reduce the demand for runoff mitigation. Bose et al. [51] applied the model to understand the flooding situation after heavy rainfall and find possible mitigation measures. The result shows that Kolkata has 75% impervious surface which causes more than 80% of rainwater to become runoff. Open green spaces have the highest potential to retain rainfall. The ease of use and accessibility of the InVEST model for any urban area is emphasized.
Peru is a country where flash floods are very frequent, especially in their drylands [30] due to “El Niño” phenomenon [31] which cause human casualties and over 3-million-dollar economic loss per year [52]. Unfortunately, this pattern is increasing due to the incidence of global warming which is posing all the country at higher risk with some regions at the verge of giant catastrophes [52]. Arequipa, located south of Peru, was selected as a case study because the risk is extreme and the incidence of dramatic floods constant. The city is in hydrographic basin of Chili River which crosses the city from north to south. It is considered an arid region, surrounded by active volcanoes. Precipitation tends to develop on the east side of the Misti volcano which generates a mud and water drainage through the main canal of Chili River and other canals annexed to it called “torrenteras” which cause sudden floods, thus, affecting the houses and infrastructure of the historic center [26,28,29,53]. Arequipa has 5 critical points in danger of flooding, one of them is the one close to the urban stretch of Chili River, which is why the National Center for Disaster Risk Estimation, Prevention and Reduction (CENEPRED in Spanish) recommends developing continuous risk assessments. The city has followed an unplanned and exponential urban sprawl invading riverbanks and canals [23,54]. This worsens the disasters and impacts of recurrent floods which become devastating [37,55]. Economic loss and many casualties are evidence of the challenge the city faces in stormwater management showing its vulnerability to climate change [56].
There is some previous information that compiled the geological, hydrographic and biological information for Integrated management of the eastern sub-basin of the Chili River, Mollebaya-Piaca, Arequipa. It was used for the Environmental Management Plan for the metropolitan basin of the Chili River-Prochili Project [43] which presented an urban planning to protect and promote the conservation of riverside hills. In addition, Ettinger et al. [37] studied the flash flood that occurred in Arequipa in 2013 by using the flooding height as a risk indicator and estimated the damage probability to buildings through high-resolution images. All the studies developed are focused on the hydrobiological analysis and conservation of the riverside hills of the Chili River in Arequipa [57]. Unfortunately, there are neither local studies about the river under the ecosystem service approach, nor the use of remote sensing and geoprocessing methods for this purpose. It is important to evaluate the impact of urban threats on the quality and conservation of river habitats as BGI and urban flooding control [18]. The research aims to analyze an urban river using geospatial methods The Urban Flood Risk Mitigation (UFRM) model through the employment of the open-source tool InVEST was considered to estimate the changes in the amount of runoff caused by average precipitation events for the urban watershed of the Chili River in Arequipa, a desert region of the Peruvian Andes.

2. Materials and Methods

2.1. Study Area

Arequipa is part of the Chili River basin in the Andes Mountains limiting in the southwest with the Atacama Desert. It is 2329 m high on average. It is considered an Andean semi-desert due to lack of precipitation and diurnal thermal oscillations. Temperature fluctuates yearly between 10 and 23 °C. It has rainy summers in January and March and an extreme drought the rest of the year, average annual precipitation in Arequipa is 9.6 mm [58,59]. The area of interest was defined following Carrasco-Valencia et al. [60] according to the distance and regulatory criteria [61,62]. It definitively included urban and peri-urban areas along the Chili River (Figure 1) with green areas along the riverine corridor. The Chili River has an extension of 90 km and a 2 m depth, the width varies between 35–45 m on the Intra-urban section and 150–180 m on the south section [63]. Three sections based on the urban structure were identified: a northern peri-urban sub-section, an intra-urban sub-section and a southern per-urban sub-section. The first is limited by the Santuario Virgen de Chapi–Charcani to the Chilina bridge. The middle section is delimited from the Chilina bridge to San Isidro bridge, it is defined as an intraurban subsection because on both riverbanks. The later section is limited by Congata Bridge, where there is urban use on at least one of the riverbanks sides.

2.2. Methodolody

The UFRM model is part of the ecosystem services modeled through the InVEST (Integrated Valuation of Ecosystem Services and Tradeoffs; Stanford, CA, USA) version 3.12.0., which is based on the SCS-Curve Number method, which has been validated previously [64]. It evaluates the ability of cities and measures based on green infrastructures to reduce runoff produced by extreme precipitation, thus limiting the impact of urban stormwater-related flood risk.
Natural infrastructures are basic in flood reduction. The model studies the value of green infrastructure to decrease runoff by slowing surface flows and generating spaces for water.
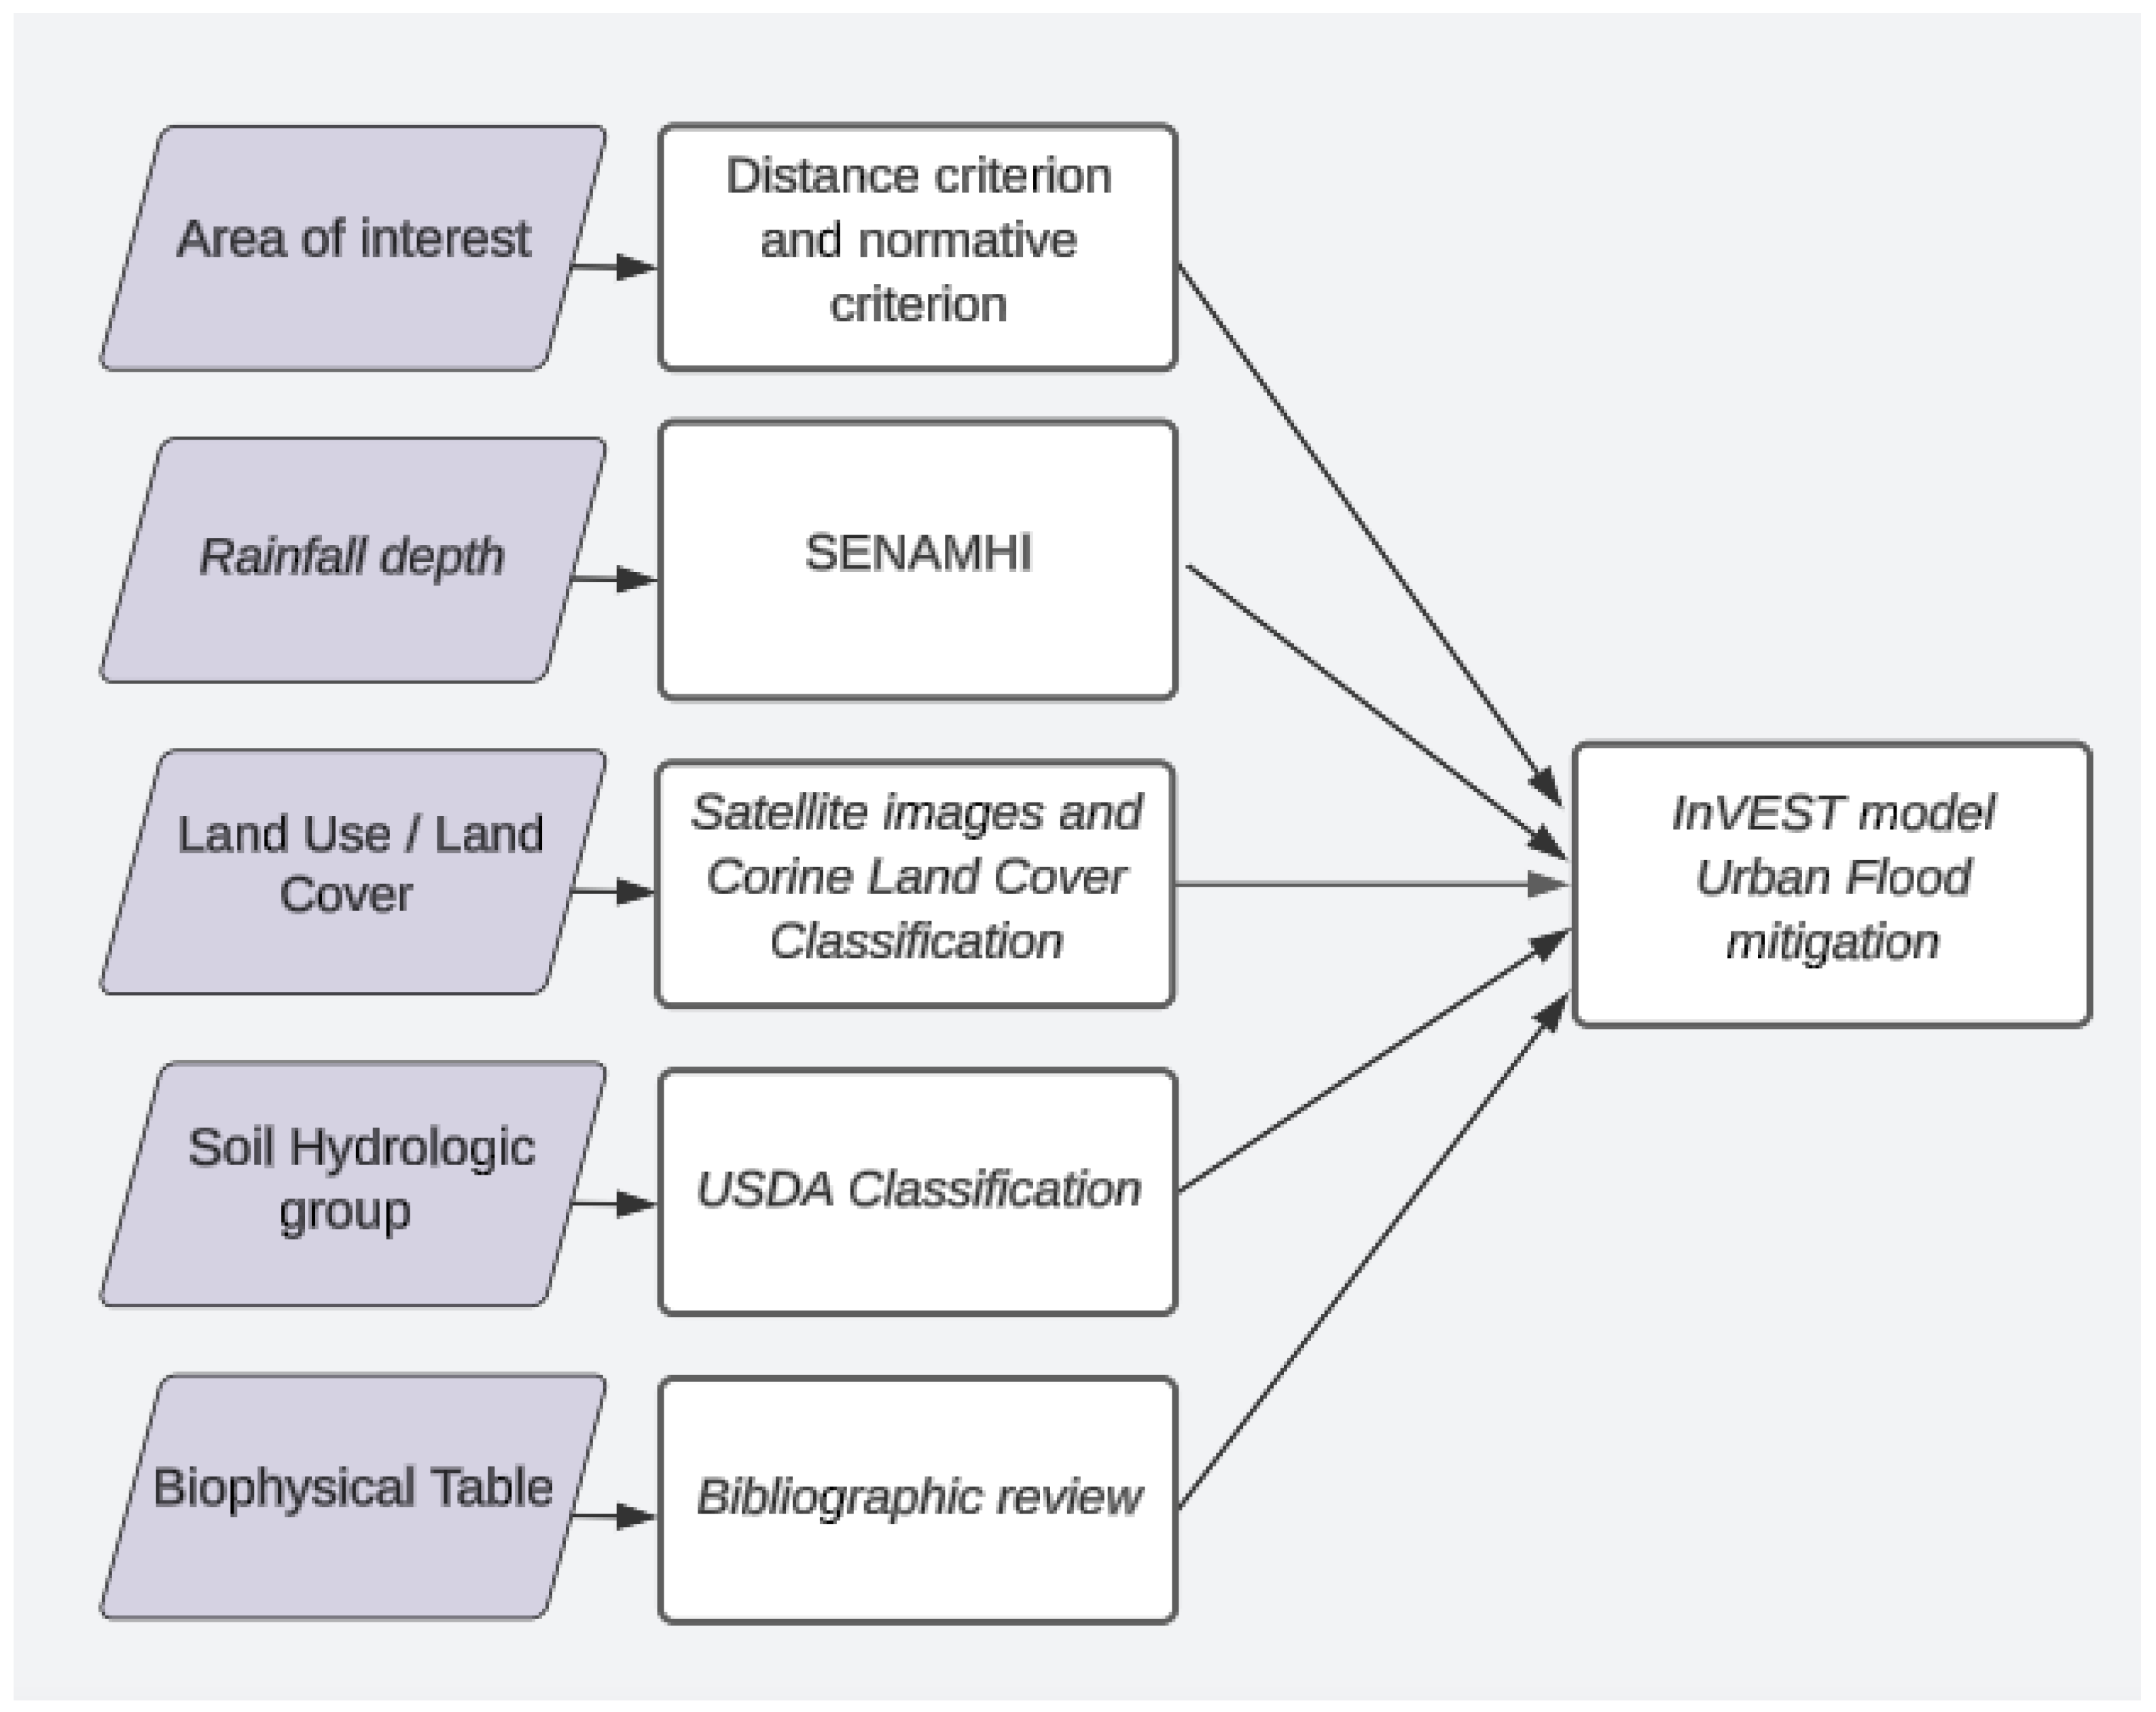
The model needs five variables: rainfall depth, land use/land cover, hydrological soil groups, and biophysical factors; limited by the area of interest. The UFRM generates a runoff water volume and percentage map, which highlights the area most vulnerable to flooding. Figure 2 shows the input data necessary and flow. Here, the available information for the period between 1984 to 2022, in periods of four years, was selected.

2.3. Rainfall Depth

Rainfall depth is a numeric value of rainfall in a rain event. This information was obtained from the Peruvian Interpolated data of SENAMHI’s Climatological and hydrological Observations (PISCO) database [65]. Where it was estimated based on the average of rainfall events registered for the 1984–2021 study period. This research considers a unique value of rainfall depth, since the study objective is to evaluate the land use changes due to modification of the study area and its flood resilience.

2.4. Land Use/Land Cover

To initiate the land use raster, satellite images with minimal cloud cover in each year to be compared were downloaded. Satellite images since 1984 were retrieved from the Earth Explorer platform and the Landsat 5 satellite, the most advanced at that time. Most recent satellite images were retrieved through the Copernicus program and the Sentinel-2 satellite.
Land use in the raster was identified following the level II of Corine Land Cover classification, where 5 main types of land use were identified. The LULC classes identified were urban fabric (UF), heterogenous agricultural areas (HAA), riparian forests (F), open spaces with little or no vegetation (OS) and inland waters in the Chili River (IW). In addition, following the Arequipa’s ecological and economical zonation [62], the OS was sub-divided into open spaces 1 (OS1) referring to Cardonal (dominated by cacti), and OS2 to Puyal (by puyas, Puyoidea genus), resulting in 6 types of land use (Table 1).
To obtain the classified LULC rasters, the SCP plugin tool was used to create ROI polygons with reference to satellite images. Since these are average values over the study years, which also only vary significantly with latitude changes, these have been applied as a constant variable.

2.5. Hydrological Group of Soils (HGS)

They are necessary to apply the USDA Soil Conservation Service’s stormwater runoff estimation method (USA’s Agriculture Department). The local soils were classified in four classes of hydrological soil groups—A, B, C and D—(Table A1), according to the USDA classification (Appendix A) which supports runoff modeling based on the curve number.

2.6. Biophysical Table

The Biophysical table contains information of the curve number data for each of the land use classes. Therefore, the curve number for each hydrological group was estimated, based on Table 1, recommendations from the InVEST user manual, and literature review [66], and example for 2004 is provided in Table 2.
Based on the above, Table 3 details the source and resolution of UFRM model inputs required:

2.7. Validation of Land Use Raster (Precision Analysis)

The precision analysis method was used to validate the land use raster, using polygons [11]. Polygons were created manually along the satellite image and classified depending on its LULC. Afterwards, a precision tool was applied in the post processing section of the QGis SCP plugin. The tool matches the generated and classified polygons for each LULC class with the LULC raster of that year. As a result, a table of accuracy analysis was obtained for 1984 and 2022. The table shows the values of SE (standard error), SE area, 95%CI (confidence interval) area, PA (producer’s accuracy), UA (user’s accuracy) and Kappa hat for each LULC class, as well as the total precision and kappa classification.
A validation was necessary since the satellite images had different resolutions, and since the LULC classes followed Arequipa’s 2017 ecological and economical zoning.

2.8. Urban Flood Risk Mitigation (UFRM) Model

The INVEST method for studying this ecosystem service focuses on natural infrastructure, which plays a role in reducing runoff and stormwater flooding. The InVEST model calculates the runoff reduction, i.e., the amount of runoff retained per pixel compared to the storm volume. The main assumption of the model is that areas are prone to flooding due to the interaction between the permeable-impermeable surface layers (i.e., the land use type) and soil drainage (depending on soil characteristics), which generates the surface runoff during the precipitation event.
Therefore, in the temporal analysis, a single average precipitation value from the years under study was used, and the LUCL raster was adjusted through the years. Similarly, Formulas (4) and (5) of the model are based on land use change as the variable that determines runoff retention.
To calculate runoff retention and retention volume per pixel, defined by its land use and soil characteristics, runoff Qp,i is estimated as follows [50]:
Q p , i = ( P λ S m a x i ) 2 P + ( 1 λ ) S m a x , i   i f   P > λ .   S m a x , i
where:
  • P is the precipitation in mm.
  • S m a x i is the retention potential in mm.
  • λ S m a x , i is the rainfall required to initiate runoff, and λ = 0.2.
  • S m a x is a function of CN, which is an empirical parameter dependent on l and use (LUCL) and soil characteristics.
S m a x , i = 254000 C N i 254
Then, runoff retention per pixel Ri is calculated.
R i = 1 Q p , i P
Then, the runoff retention volume per pixel R_m3i.
R_m3i = Ri.P.pixel.area.10−3
Then, runoff volume or flood volume per pixel Q_m3i.
Q_m3i = Qp,i.P.pixel.area.10−3
Based on the above, after running the model with the required inputs, the InVEST 3.12.1 software generated raster files for runoff retention (%) and runoff (mm).
An accuracy validation process was applied to the runoff raster (%) to validate the model. For this process, the results were compared with areas reported as flood zones, applying the kappa index validation, detailed in Appendix C, Figure A3.

3. Results

The model provides data about the runoff process by identifying the surface runoff volume and retention values. Table 4 shows the results of runoff retention (%; m3) and average runoff (m3) for the entire study and period 1984–2022. Values have been calculated based on the average precipitation during the study time. The average runoff values are 33.29%. According to the multi-temporal analysis carried out in the study (Table 4), the lowest and highest retention values are 31.88 and 34.12% corresponding to years 2017 and 2000, respectively.
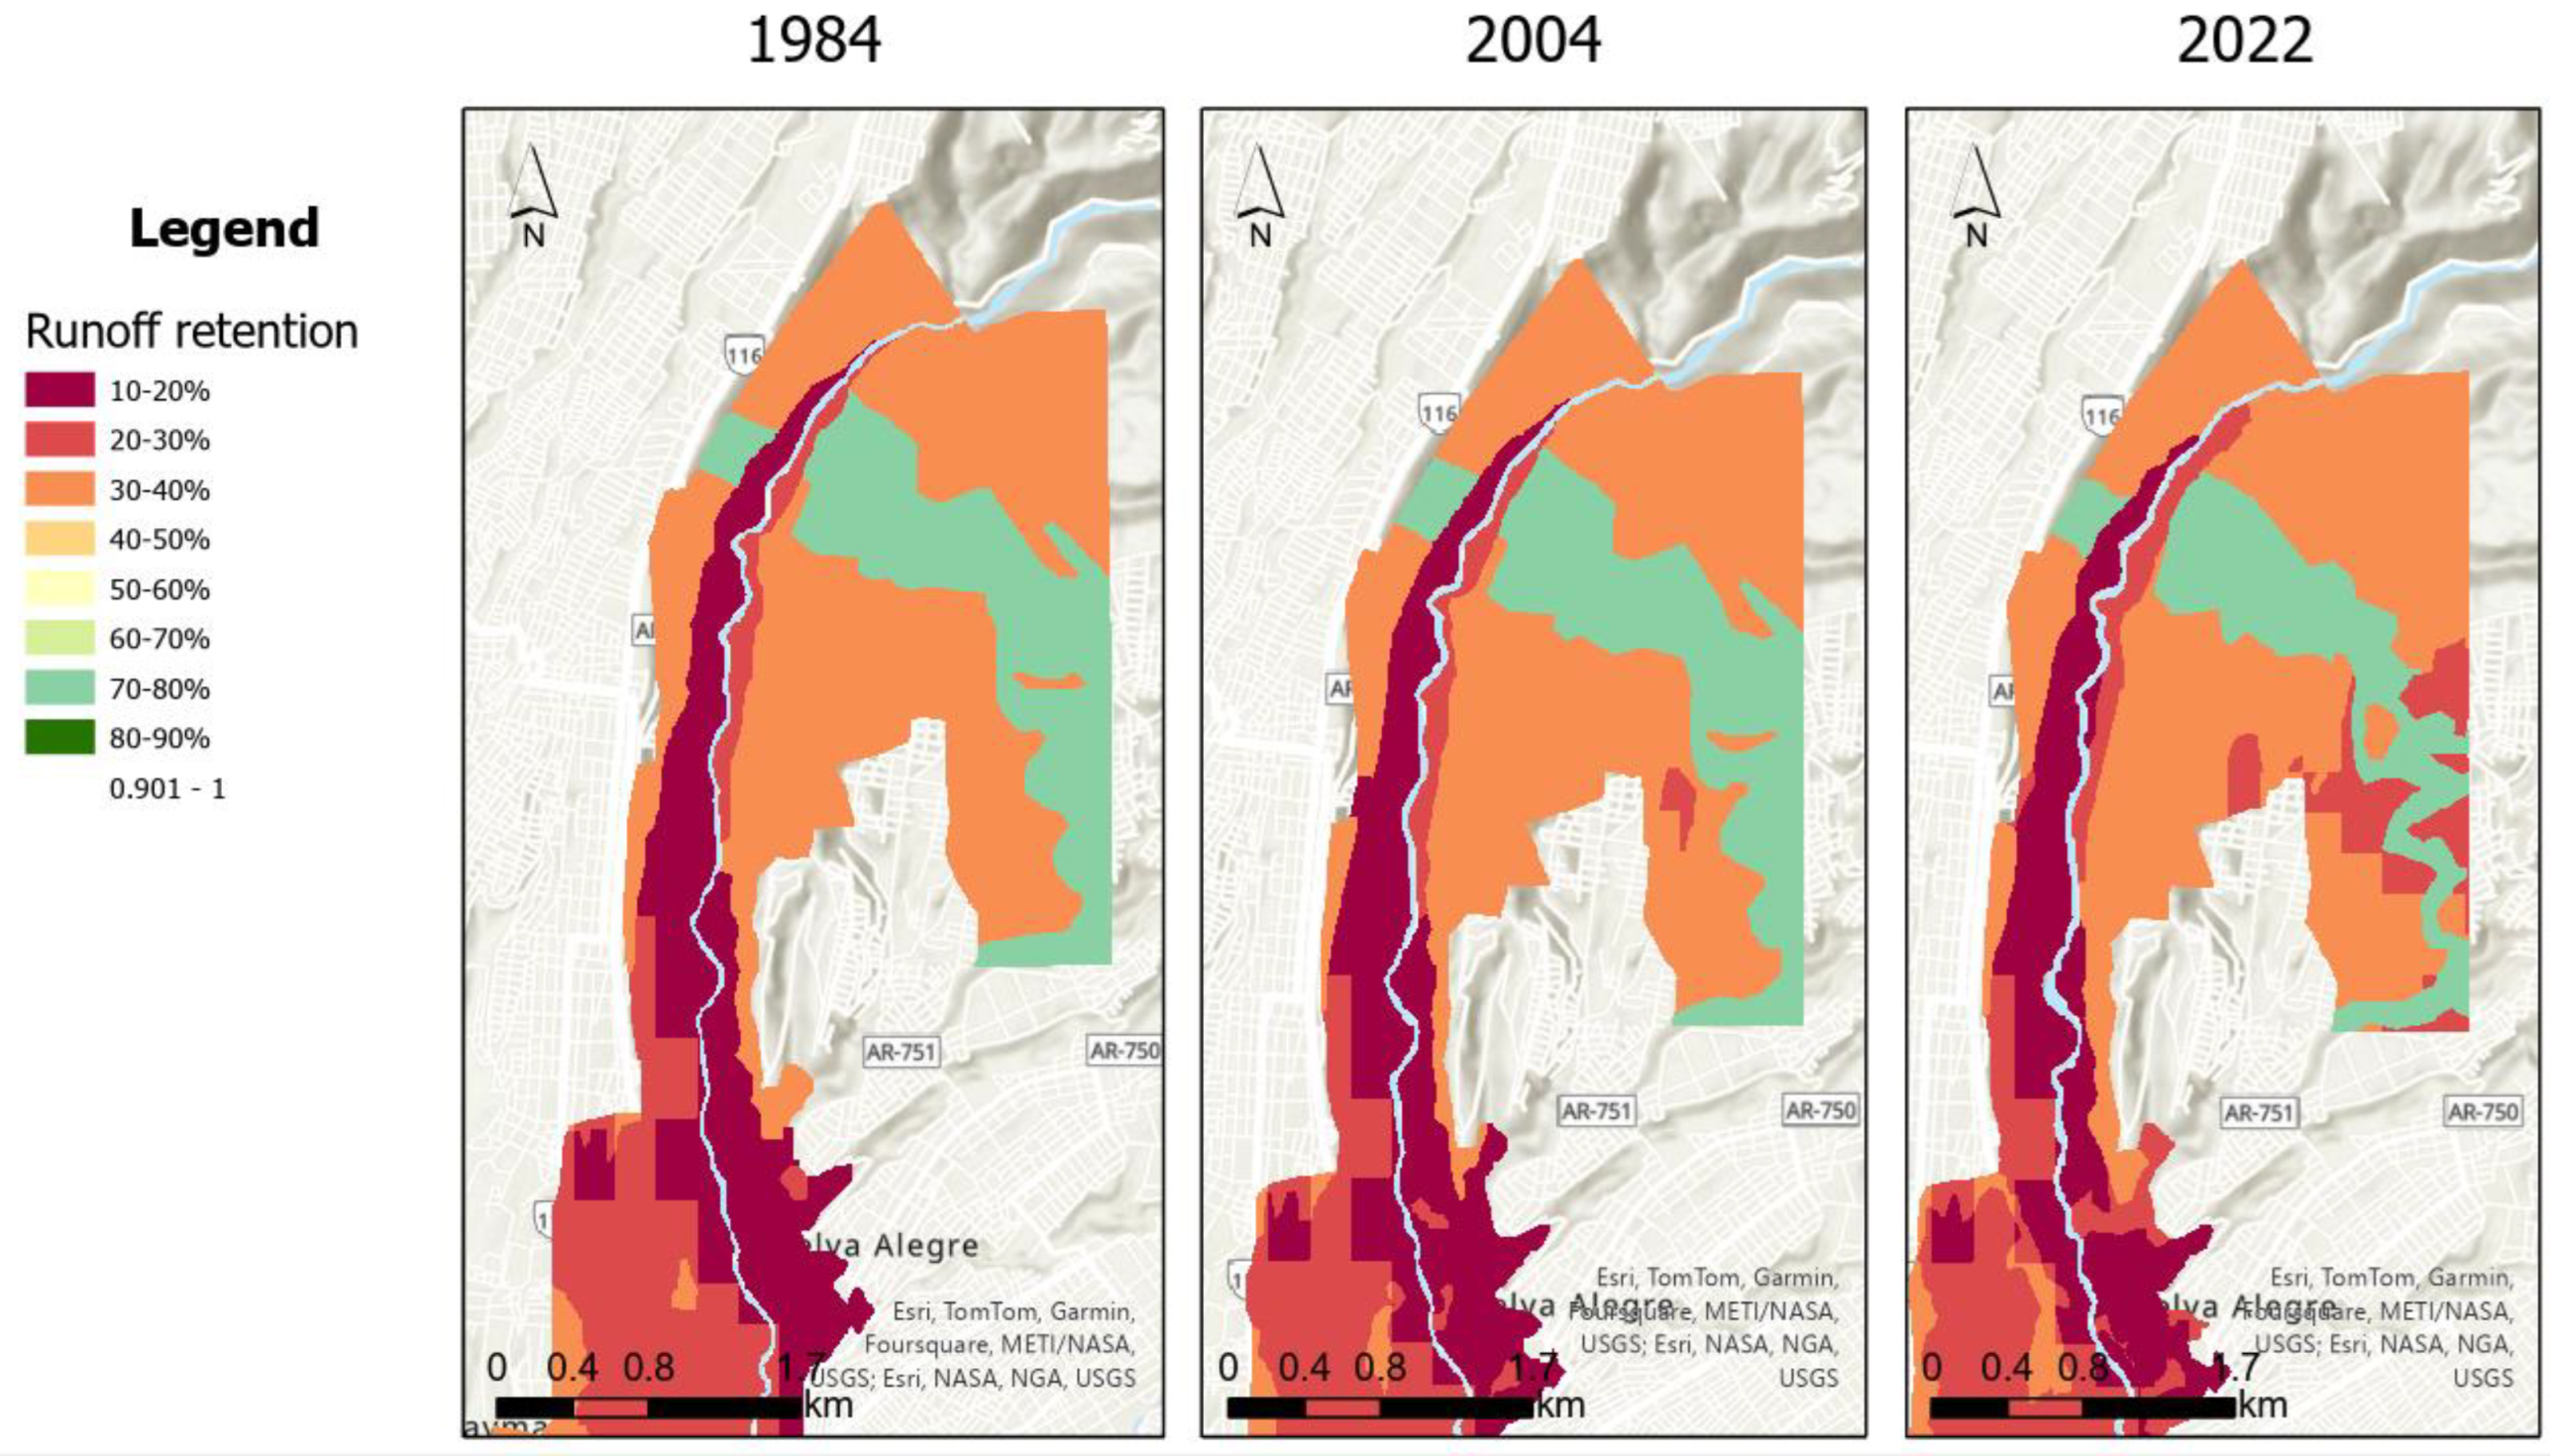
In terms of runoff retention index, the lowest retention capacity value is 27.31%, corresponding to the Intra-Urban Sub-section in the year 1984 (Figure 3). In comparison, the highest retention level is 40.23% from the Northern Peri-urban Sub-section this year, this becoming the section with the best performance. Likewise, it was also observed that the runoff retention in the northern section decreased by more than 8.2% over time (1984–2022) (Figure 3). Figure 4 shows the spatial distribution of runoff retention capacity (%) in the Northern Peri-urban Sub-section in three different years along the studied period. There is a significant reduction observed here, where areas decreased their runoff retention capacity from 70–80% to 30–20%.
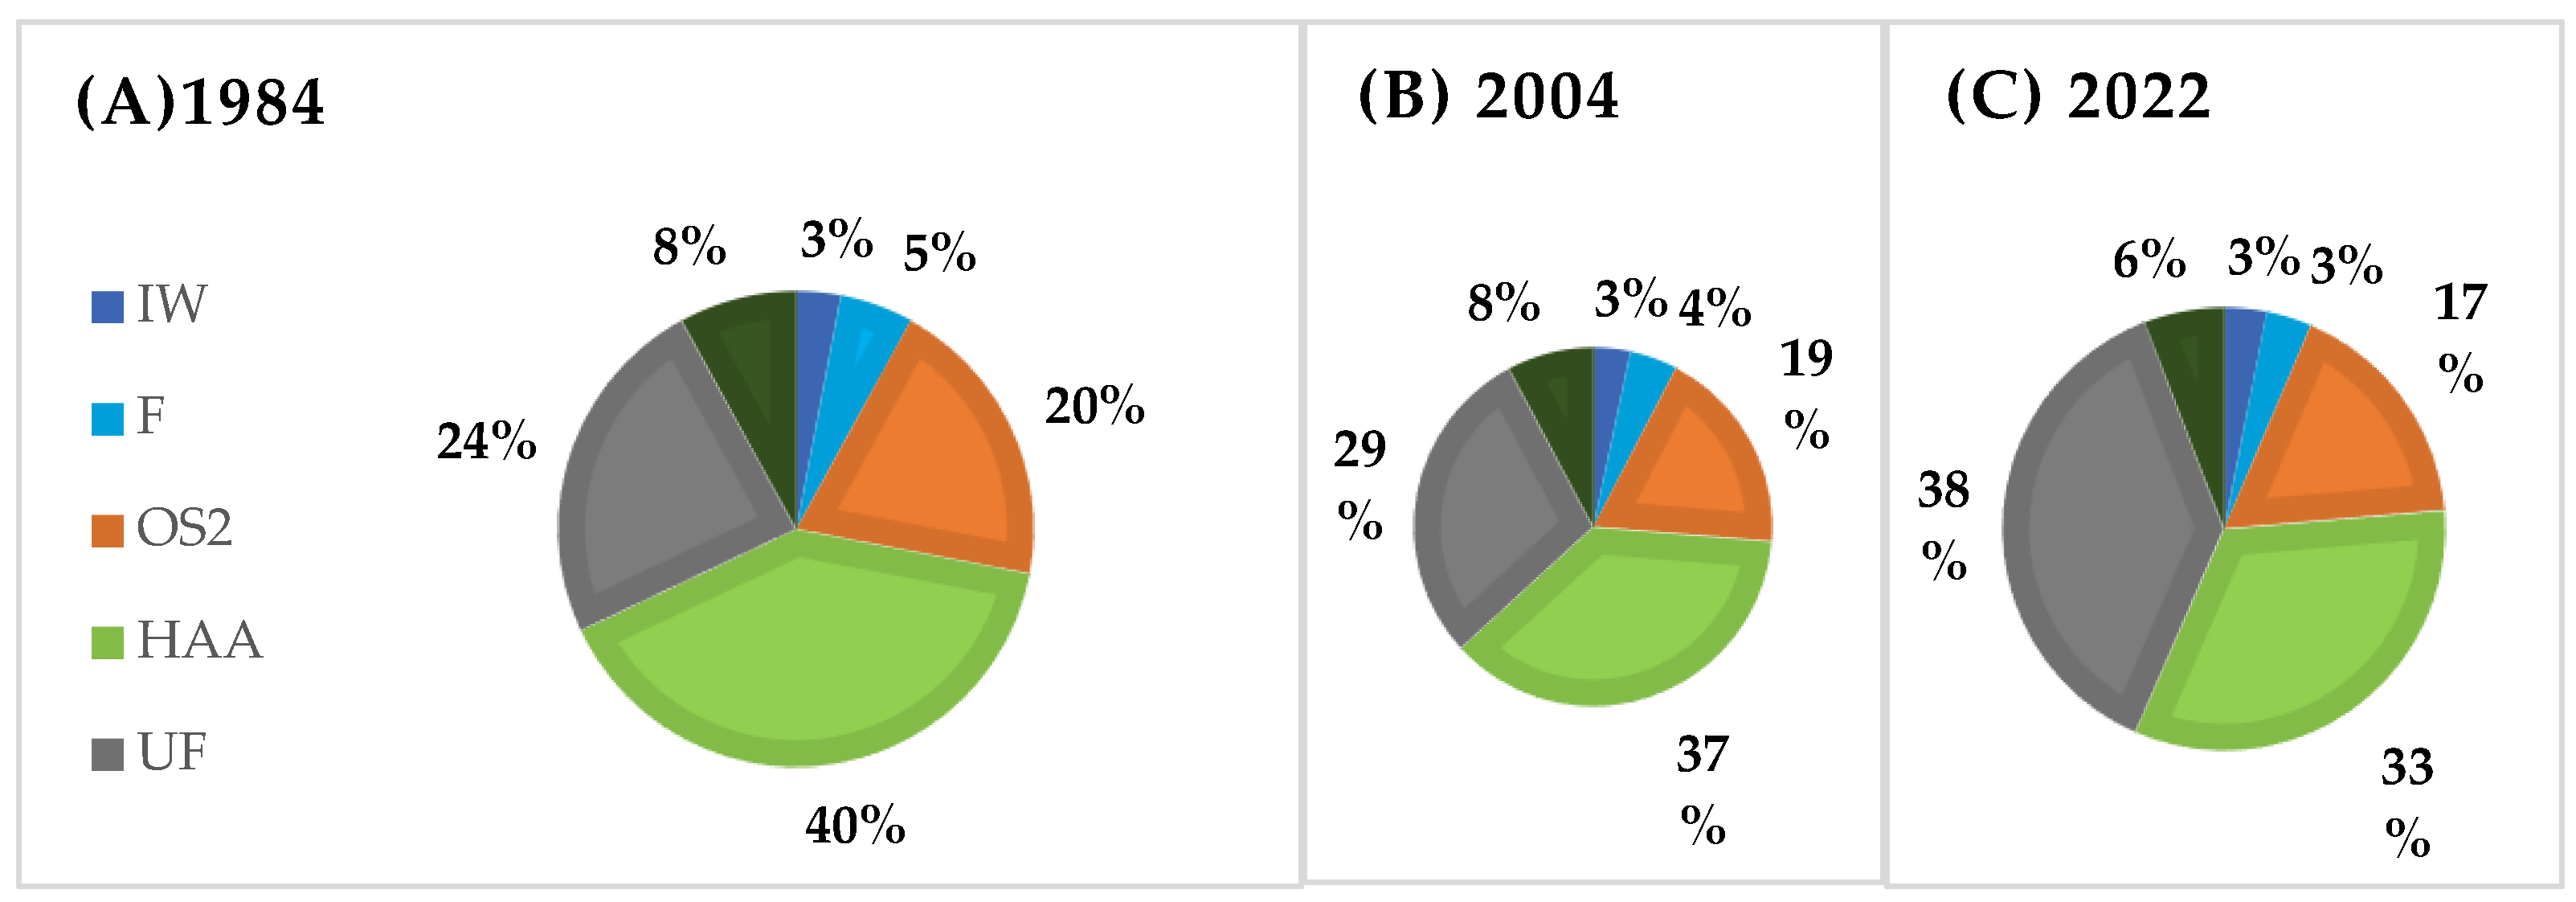
Figure 5 shows a 52% progressive increase in the urban area (UF) and a decrease in vegetation covers in SSSSthe study period. At the same time, it has been observed that the predominant land use in 1984 was the agricultural one, while in 2022, it is the urban area [28,53].
Regarding the results from LULC validation, they are presented in Table 5.
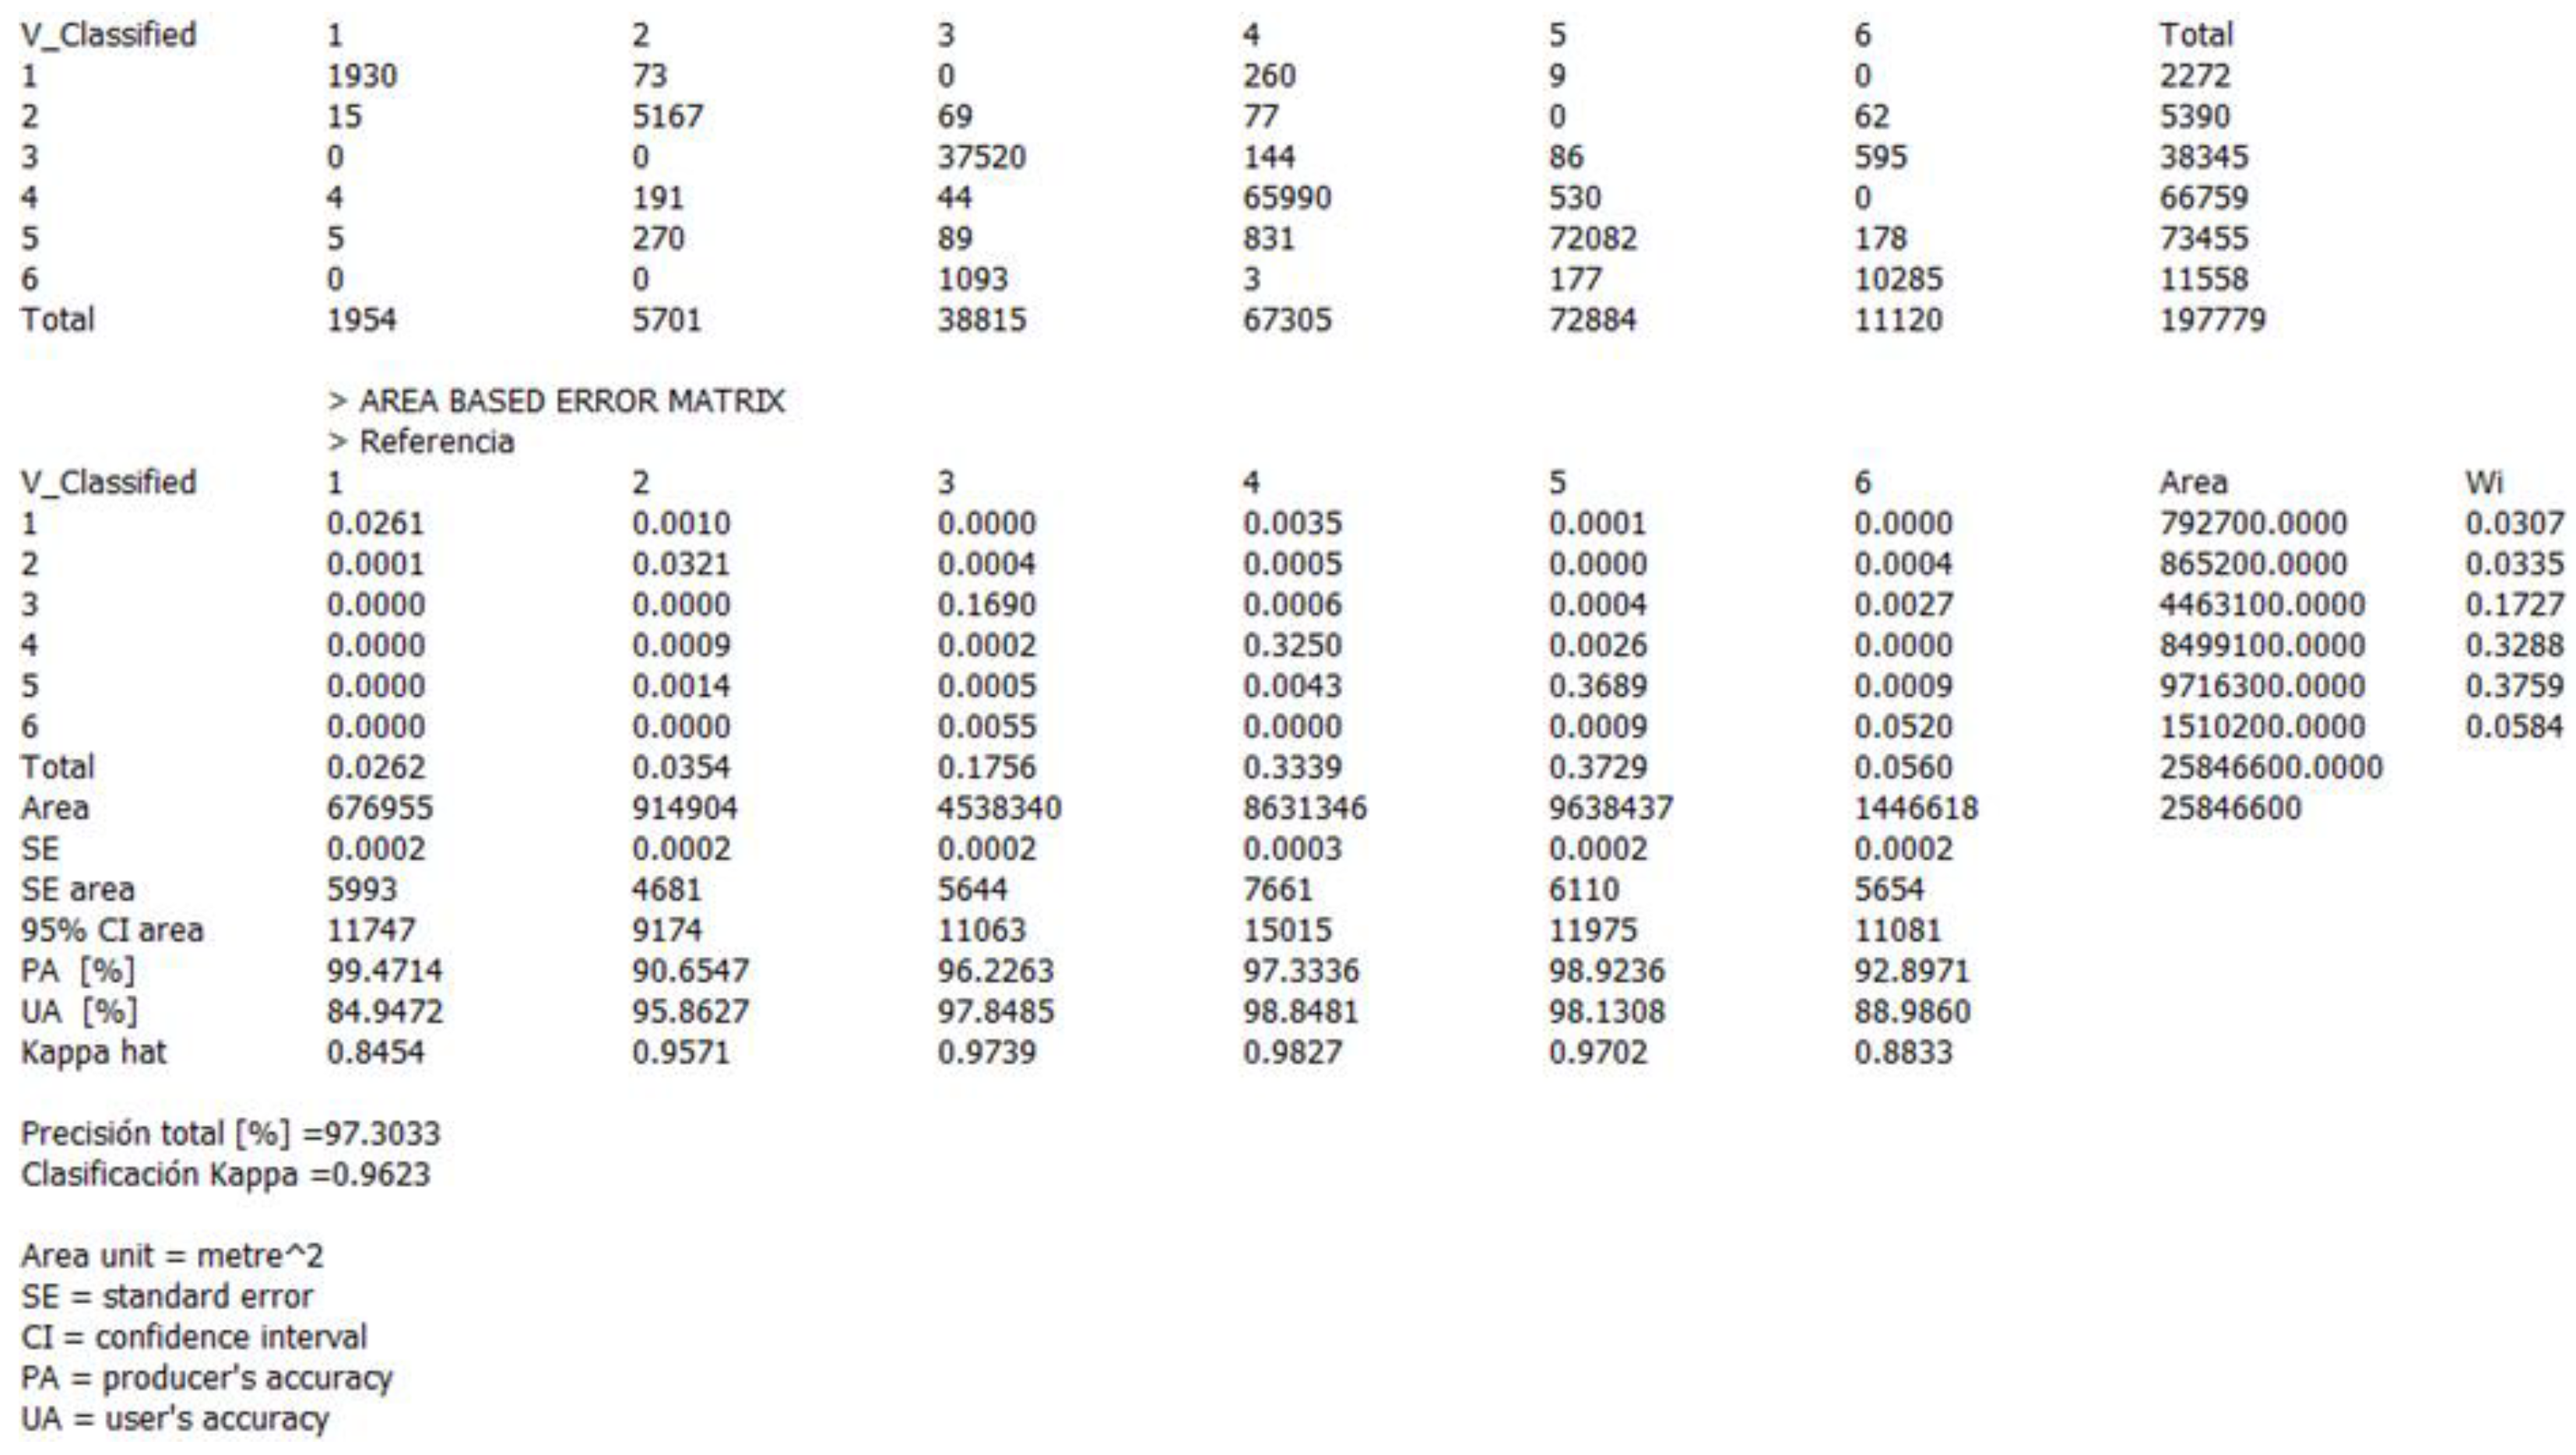
The 2022 validation test was more accurate for each and the average of the LULC compared to the validation test in 1984, obtaining 0.9623 (Figure A2) and 0.9091 (Figure A1) kappa coefficients, respectively. The complete accuracy assessment tables are detailed in Appendix B.
Regarding the validation process for the runoff raster (%) results from the UFRM model, the validation confirmed the reliability of the model. The accuracy assessment process and results are detailed in Appendix C.

4. Discussion

The low capacity in the ecosystem service of runoff retention in Arequipa is directly related to the pressure of urbanization sprawl in the area surrounding the river basin which is causing gradual loss in the ecological corridor. As noted by Pappalardo et al. [16], this situation has a negative impact on the river’s work which adequately regulates runoff in intense precipitation events.
Regarding Land Use/Land Cover the results confirm the intense urban growth that occurs in the northern peri-urban areas of Arequipa city predominantly, up to 14% (UF) which is why a decrease in vegetation cover such as agriculture is found [26,70]. However, local regulation (Water Resource Law) establishes that in the land surrounding the natural channels, an approximately 100-m marginal strip must be maintained where agricultural, industrial and/or urbanization activities are prohibited.
The evaluation of flooding risks and this ecosystem service serve as a basis for the management of urban floods, especially in disaster prevention risks [41]. The blue and green infrastructure are recognized as a nature-based solution which allows us to mitigate the risks caused by floods in urban areas [1]; especially in cities such as Arequipa areas where urbanization sprawl seems a never-ending process and the rivers have the capacity of withstanding floods [14,15,51]. Accordingly, the model suggests that the urban section of Chili River offers good conditions for retaining and slowing down runoff during temporary or flash floods if the marginal strips and riverside hills are respected.
Additionally, comparing the findings of this study with other hydrological models, such as SWAT and MIKE FLOOD, suggests that the InVEST model provides a more accessible and adaptable approach to urban flood mitigation. While SWAT is widely used for long-term hydrological assessments, it requires extensive input data and calibration [47]. In contrast, MIKE FLOOD demands high spatial resolution, making it less applicable in data-scarce regions [48]. The ability of InVEST to simulate various land-use scenarios with relative ease highlights its potential as a decision-support tool for urban planners in rapidly growing cities like Arequipa. Moreover, studies have shown that integrating Nature-Based Solutions with models like InVEST can enhance resilience by restoring ecological functions in highly urbanized environments [49]. This underscores the importance of preserving riparian corridors as key elements in mitigating urban flood risks.
As for the LULC validation, the difference in the accuracy assessments in 1984 and 2022 was likely because of the difference between base satellite image resolutions, where the 10 × 10 resolution from the 2022 image helped for identifying the differences in the LULC classes with smaller areas such as the river and the riparian forest, while the 30 × 30 resolution image from 1984 could not allow the classification to perform that task with that level of accuracy. However, in larger LULC classification areas, the difference in the accuracy was not that noticeable, resulting in better validation percentages overall.
The InVEST model presents some limitations when used in a simple approach [14] compared to other models, such as SWAT [46]. Thus, it is recommended for use in areas with limited data access, such as the case study, since there was a lack of meteorological information available [71]. Despite its benefits, simplification and limitation could affect the accuracy of the modeled values [60]. Nonetheless, the classification of land use is well reflected here, allowing natural infrastructures to be faithfully represented in the model results. In addition to this, the model is scalable and easy to use, since the use of GIS permits a more refined and dynamic study for urban zones which represents an advantage when dealing with disaster risk identification [41]. Hack [18] demonstrated the ability of the InVEST model to study different kinds of threats that impact on the quality of urban river corridors, such as the corridor invasion due to increasing urbanization. This is how the InVEST model allows spatializing the ecosystem services that are provided to the city by the natural and semi-natural areas [43], making it into a useful tool for urban planners when defining conservation strategies and decision making facing the risk of flash floods in a metropolitan area [14,41,51].
Finally, as urbanization trends continue, scenario-based analyses using InVEST, combined with socio-economic and climate change projections, will be essential for developing long-term flood mitigation strategies [46]. These analyses can help understand how urban expansion and land-use changes will impact future flood risks, allowing authorities to implement preventive measures before critical thresholds are reached. Additionally, global studies have demonstrated that integrating InVEST with climate resilience frameworks can optimize land-use planning, ensuring that cities in arid environments can adapt to increasing hydrological variability [46]. This underscores the necessity of policy-driven approaches that incorporate ecosystem service assessments into urban planning strategies to reduce flood vulnerability.
Furthermore, recent research highlights the need to couple hydrological models with socio-environmental data to enhance flood mitigation strategies [72]. Their findings suggest that integrating ecosystem service assessments with participatory governance approaches leads to more effective flood risk management in urban areas. This emphasizes the importance of interdisciplinary strategies that not only rely on hydrological modeling but also consider socio-economic factors in decision-making processes, ensuring that cities can build resilience against future extreme weather events.

5. Conclusions

The urban flood risk mitigation model in Arequipa shows that the average runoff retention values are relatively low (33.29% in average). There is significant reduction in this critical ecosystem service the Northern Peri-urban Sub-section where areas that decreased their runoff retention capacity from 70–80% to 30–20% over time (1984–2022).
The change in land use is an influential factor in runoff decrease, along with the increase in urban areas and the decrease in blue–green infrastructures. Therefore, as urbanization sprawl does not attend to water laws and established planning regulations increase, the ecological corridor of Chili River and the ecosystem services provided by them to the city are threatened.
The urban flood mitigation model using the InVEST software is appropriate for the Ecosystem Service study of runoff mitigation provided by blue–green infrastructures by allowing these ecosystem services to be spatialized which would be useful for urban planning. However, it could have some limitations, since the simplification of the model might affect the accuracy of modeled values.
The analysis represents a very important advance to induce the re-naturalization of urban rivers as ecological corridors and urban flood mitigators, allowing the resilience level of cities to be increased.
Future studies could explore the long-term benefits of maintaining and restoring blue–green infrastructures to strengthen urban resilience, while further research on adaptive management strategies could enhance decision-making processes for sustainable urban development and flood risk reduction. Additionally, integrating real-time hydrometeorological data and high-resolution land use projections could refine predictive models enhancing the accuracy of mitigation strategies while also considering the socio-economic implications of flood control measures. A holistic approach that includes inclusive planning processes and community participation will be essential for developing sustainable and effective urban water management policies. These efforts will provide valuable insights for policymakers, urban planners, and environmental managers, helping them balance urban growth with ecological conservation while fostering more resilient and sustainable cities.

Author Contributions

Conceptualization, K.V.-C. and A.C.-M.; methodology, K.V.-C., L.C.-V. and B.C.-P.; software, K.V.-C., L.C.-V. and B.C.-P.; validation, L.C.-V., B.C.-P. and A.E.; formal analysis, K.V.-C.; investigation: L.C.-V., K.V.-C., C.I.-R., B.C.-P. and A.C.-M.; resources, A.C.-M.; data curation, L.C.-V. and B.C.-P.; writing-review and editing, K.V.-C., L.C.-V., C.I.-R., B.C.-P., A.E. and A.C.-M.; visualization, K.V.-C., L.C.-V. and C.I.-R.; supervision, C.I.-R., B.C.-P. and A.C.-M.; project administration, C.I.-R. and A.C.-M.; funding acquisition, C.I.-R. and A.C.-M. All authors have read and agreed to the published version of the manuscript.

Funding

This research and the APC was funded by the Universidad Católica de Santa Maria (Arequipa, Peru) (No. 27574-R-2020).

Data Availability Statement

The data used to support the findings of this study are available on request.

Conflicts of Interest

The authors declare no conflicts of interest.

Appendix A. Hydrological Groups of Soils

Table A1. Classification of Hydrological Groups of Soils according to the USDA.
Classification of Hydrological Groups of Soils
Group ASoils with low runoff potential and high-water transmission rate (over 90% sand and <10% clay)
Group BSoils with moderately low runoff potential and a moderate water transmission rate (between 10 and 20% clay and 50 and 90% sand)
Group CSoils with moderately high runoff potential (between 20 and 40% clay and <50% sand)
Group D Soils with high runoff potential and low transmission rate (over 40% clay and <50% sand)

Appendix B. Accuracy Assessment of the LULC Rasters
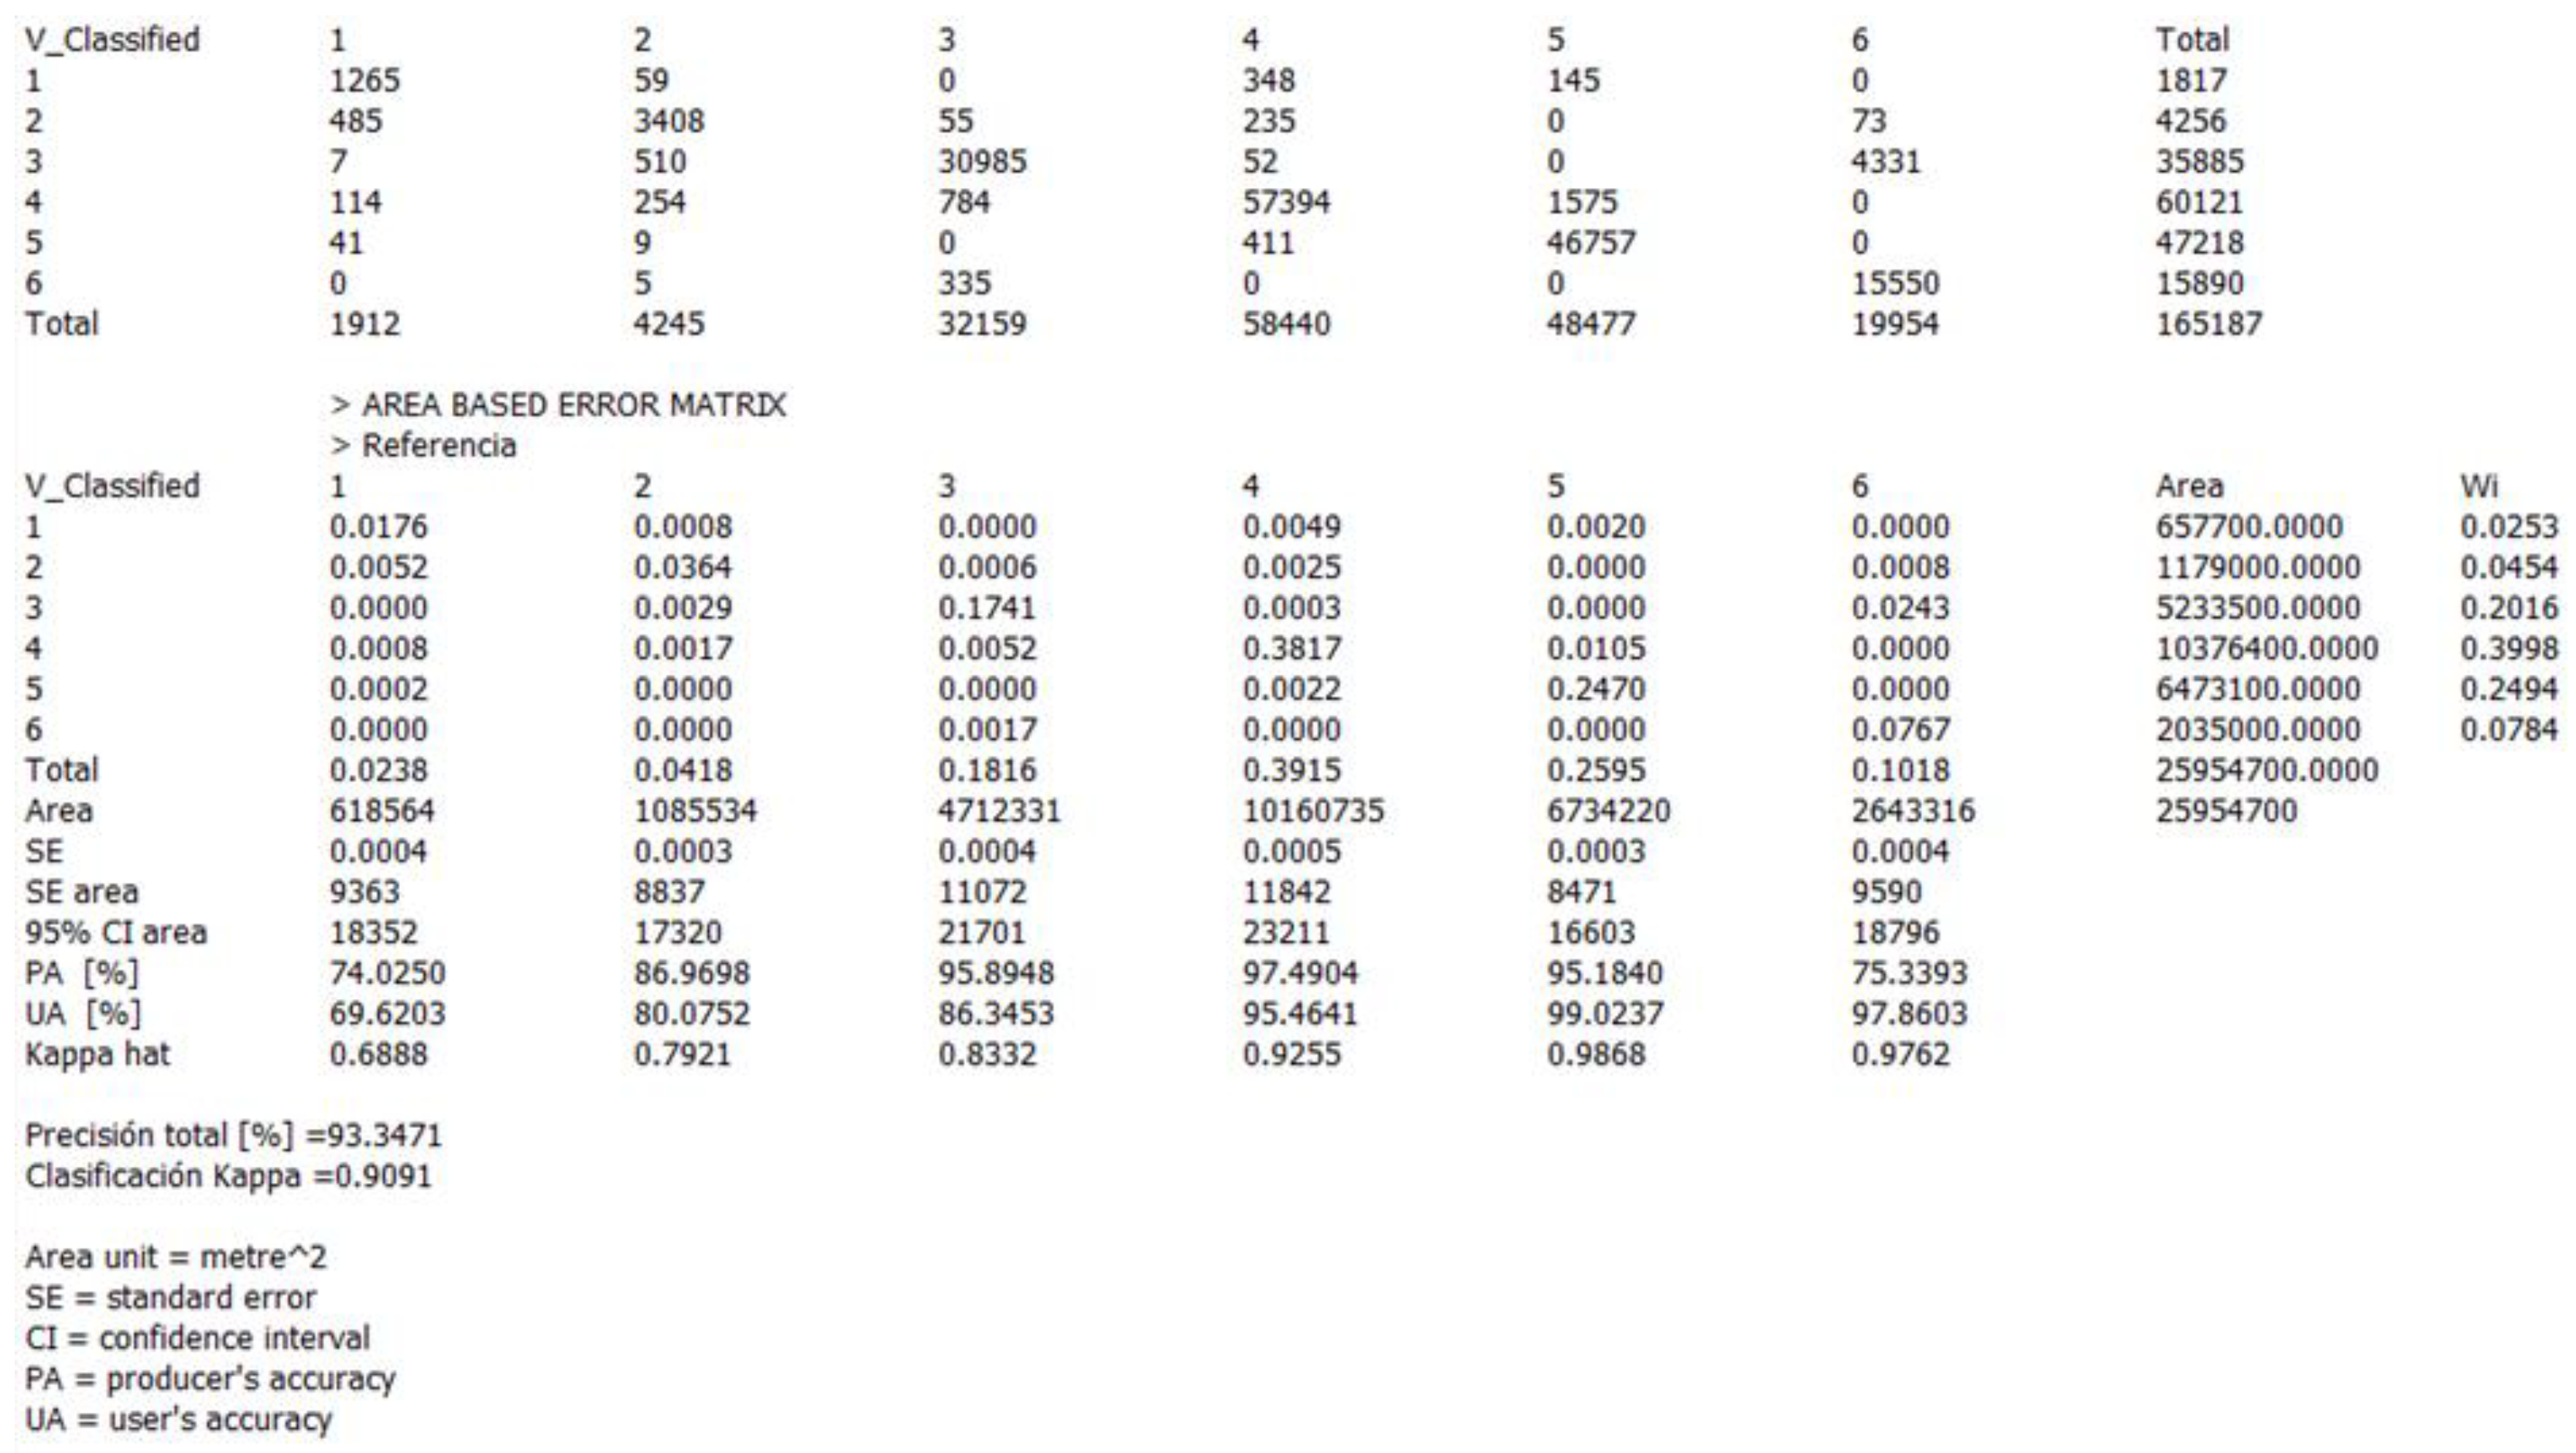
Figure A1. Accuracy assessment for LULC classes in 1984.
Water 17 01047 g0a1
Figure A2. Accuracy assessment for LULC classes in 2022.
Water 17 01047 g0a2

Appendix C. Accuracy Assessment of the Runoff (%) Raster Results
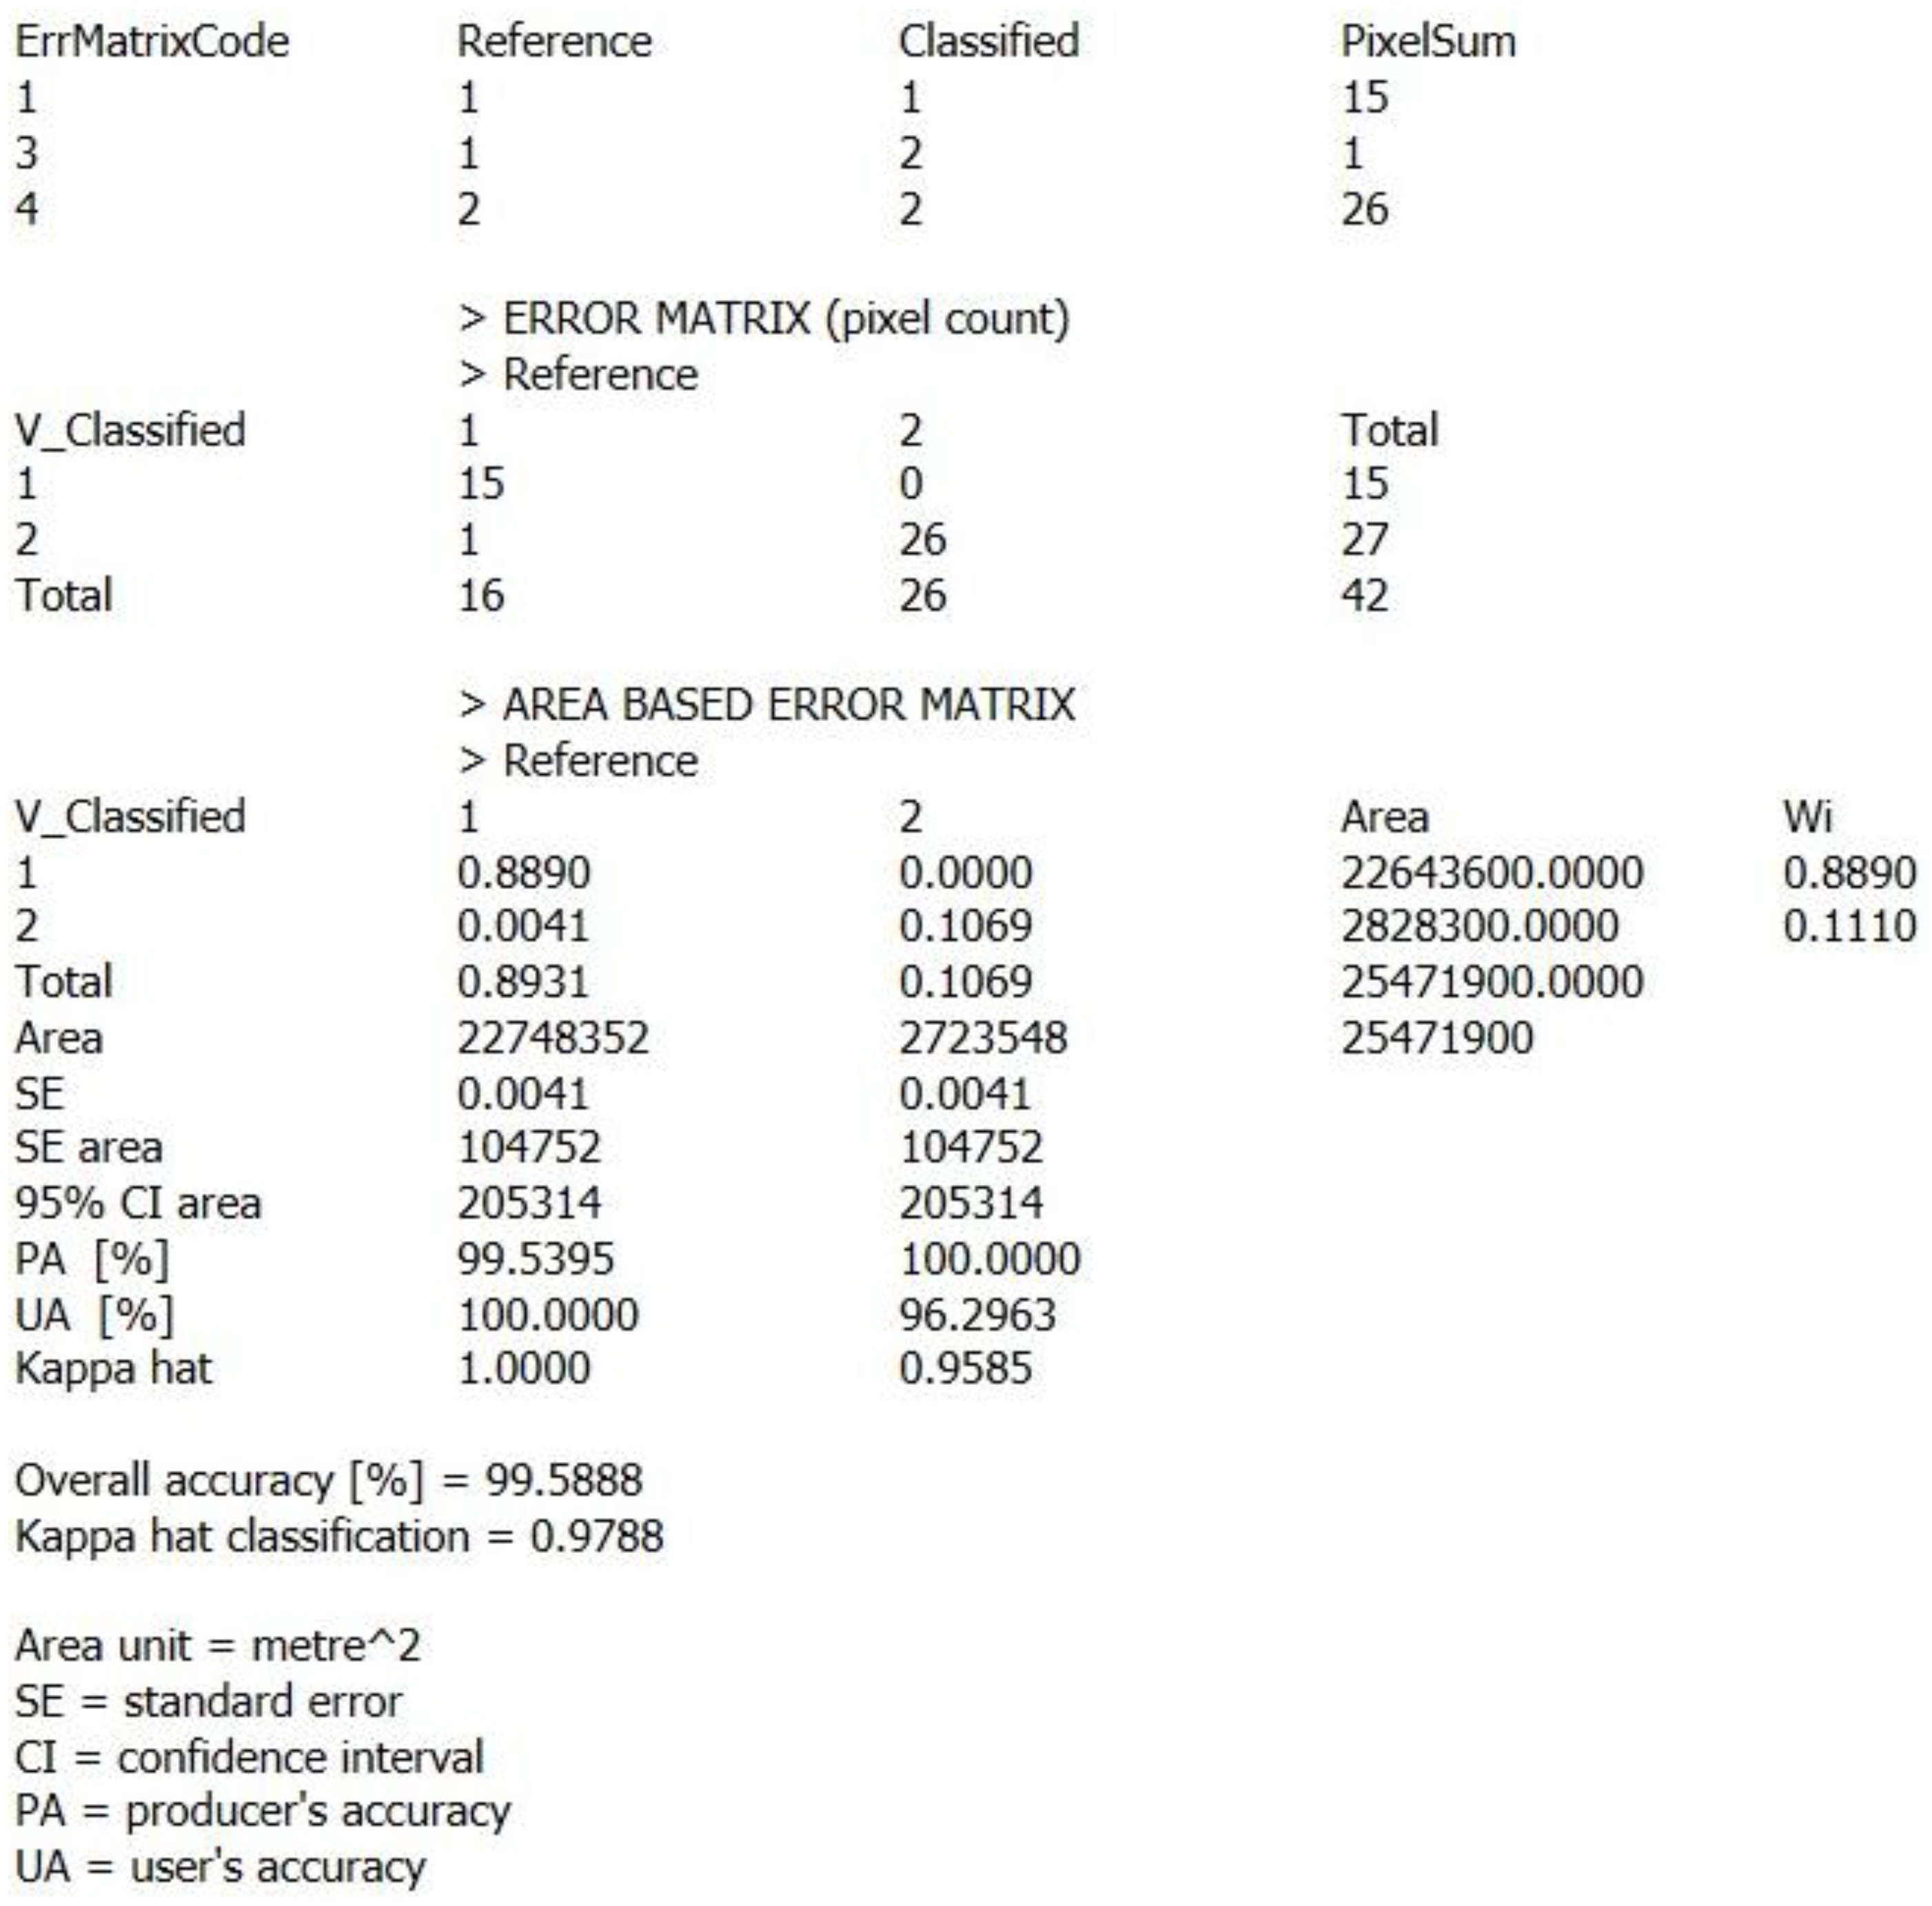
For the accuracy validation process the “polygon accuracy analysis” method was applied, where a high validation percentage confirms the reliability of the data generated by the model. First, flood incidence points were compiled from reports, scientific articles, and news from Peru (ref), with 2004 as a reference year. Then, these points were mapped and a 10 m buffer was generated to delimit the area affected. Finally, with this information, the validation process was carried out, in which the results obtained from the model were compared with the identified areas.
This validation confirmed the reliability of the model, the full accuracy assessment table is detailed in Figure A3:
Figure A3. Accuracy assessment for runoff raster (%).
Water 17 01047 g0a3

References

  1. Kumari, J.; Dessai, K.; Cardozo, Z.W.; Pereira, B.; Fernandes, R.; Sakhardande, A.; Mascarenhas, S. River Water Resource Management and Flood Control Using GIS. Lect. Notes Civ. Eng. 2021, 105, 373–379. [Google Scholar] [CrossRef]
  2. Bai, T.; Wei, J.; Yang, W.; Huang, Q. Multi-Objective Parameter Estimation of Improved Muskingum Model by Wolf Pack Algorithm and Its Application in Upper Hanjiang River, China. Water 2018, 10, 1415. [Google Scholar] [CrossRef]
  3. Wu, X.; Wang, Z.; Guo, S.; Lai, C.; Chen, X. A simplified approach for flood modeling in urban environments. Hydrol. Res. 2018, 49, 1804–1816. [Google Scholar] [CrossRef]
  4. Mileti, D.S.; Gailus, J.L. Sustainable development and hazards mitigation in the United States: Disasters by design revisited. Mitig Adapt. Strateg. Glob. Change 2005, 10, 491–504. [Google Scholar] [CrossRef]
  5. Hernández-Hernández, M.; Olcina, J.; Morote, Á.-F. Urban Stormwater Management, a Tool for Adapting to Climate Change: From Risk to Resource. Water 2020, 12, 2616. [Google Scholar] [CrossRef]
  6. Shanableh, A.; Al-Ruzouq, R.; Yilmaz, A.G.; Siddique, M.; Merabtene, T.; Alam Imteaz, M. Effects of Land Cover Change on Urban Floods and Rainwater Harvesting: A Case Study in Sharjah, UAE. Water 2018, 10, 631. [Google Scholar] [CrossRef]
  7. Richards, D.R.; Edwards, P.J. Using water management infrastructure to address both flood risk and the urban heat island. Int. J. Water Resour. Dev. 2017, 34, 490–498. [Google Scholar] [CrossRef]
  8. Qi, Y.; Chan, F.K.S.; Thorne, C.; O’donnell, E.; Quagliolo, C.; Comino, E.; Pezzoli, A.; Li, L.; Griffiths, J.; Sang, Y.; et al. Addressing Challenges of Urban Water Management in Chinese Sponge Cities via Nature-Based Solutions. Water 2020, 12, 2788. [Google Scholar] [CrossRef]
  9. Rosenzweig, B.; Ruddell, B.L.; McPhillips, L.; Hobbins, R.; McPhearson, T.; Cheng, Z.; Chang, H.; Kim, Y. Developing knowledge systems for urban resilience to cloudburst rain events. Environ. Sci. Policy 2019, 99, 150–159. [Google Scholar] [CrossRef]
  10. Li, J.; Wang, Z.; Lai, C. Severe drought events inducing large decrease of net primary productivity in mainland China during 1982–2015. Sci. Total Environ. 2020, 703, 135541. [Google Scholar] [CrossRef]
  11. Garg, V.; Aggarwal, S.P.; Gupta, P.K.; Nikam, B.R.; Thakur, P.K.; Srivastav, S.K.; Kumar, A.S. Assessment of land use land cover change impact on hydrological regime of a basin. Environ. Earth Sci. 2017, 76, 635. [Google Scholar] [CrossRef]
  12. Zeng, G.M.; Xie, Z.; Zhang, S.F.; Luo, X. Flood Disaster and Non-engineering Mitigation Measures in Dongting Lake in China. Water Int. 2001, 26, 185–190. [Google Scholar] [CrossRef]
  13. Debele, S.E.; Kumar, P.; Sahani, J.; Marti-Cardona, B.; Mickovski, S.B.; Leo, L.S.; Porcù, F.; Bertini, F.; Montesi, D.; Vojinovic, Z.; et al. Nature-based solutions for hydro-meteorological hazards: Revised concepts, classification schemes and databases. Environ. Res. 2019, 179, 108799. [Google Scholar] [CrossRef]
  14. Quagliolo, C.; Comino, E.; Pezzoli, A. Experimental Flash Floods Assessment Through Urban Flood Risk Mitigation (UFRM) Model: The Case Study of Ligurian Coastal Cities. Front. Water 2021, 3, 663378. [Google Scholar] [CrossRef]
  15. Liu, Z.; Cai, Y.; Wang, S.; Lan, F.; Wu, X. Small and Medium-Scale River Flood Controls in Highly Urbanized Areas: A Whole Region Perspective. Water 2020, 12, 182. [Google Scholar] [CrossRef]
  16. Pappalardo, V.; La Rosa, D.; Campisano, A.; La Greca, P. The potential of green infrastructure application in urban runoff control for land use planning: A preliminary evaluation from a southern Italy case study. Ecosyst. Serv. 2017, 26, 345–354. [Google Scholar] [CrossRef]
  17. Berndtsson, R.; Becker, P.; Persson, A.; Aspegren, H.; Haghighatafshar, S.; Jönsson, K.; Larsson, R.; Mobini, S.; Mottaghi, M.; Nilsson, J.; et al. Drivers of changing urban flood risk: A framework for action. J. Environ. Manag. 2019, 240, 47–56. [Google Scholar] [CrossRef]
  18. Hack, J.; Molewijk, D.; Beißler, M.R. A Conceptual Approach to Modeling the Geospatial Impact of Typical Urban Threats on the Habitat Quality of River Corridors. Remote Sens. 2020, 12, 1345. [Google Scholar] [CrossRef]
  19. Vásquez, A. Infraestructura verde, servicios ecosistémicos y sus aportes para enfrentar el cambio climático en ciudades: El caso del corredor ribereño del río Mapocho en Santiago de Chile. Rev. Geogr. Norte Gd. 2016, 63, 63–86. [Google Scholar] [CrossRef]
  20. Magdaleno, F.; Cortes, F.; Molina, B. Infraestructuras verdes y azules: Estrategias de adaptación y mitigación ante el cambio climático. Rev. Digit. Del Cedex 2018, 191, 105–112. [Google Scholar]
  21. Kadaverugu, A.; Rao, C.N.; Viswanadh, G.K. Quantification of flood mitigation services by urban green spaces using InVEST model: A case study of Hyderabad city, India. Model. Earth Syst. Environ. 2021, 7, 589–602. [Google Scholar] [CrossRef]
  22. Hunter, R.; Cleary, A.; Cleland, C.; Braubach, M. Urban Green Space Interventions and Health: A Review of Impacts and Effectiveness. Full Report; World Health Organization: Geneva, Switzerland, 2017; Available online: https://www.who.int/europe/publications/m/item/urban-green-space-interventions-and-health--a-review-of-impacts-and-effectiveness.-full-report (accessed on 9 March 2025).
  23. Soz, S.A.; Kryspin-Watson, J.; Stanton-Geddes, Z. The Role of Green Infrastructure Solutions in Urban Flood Risk Management; World Bank: Washington, DC, USA, 2016. [Google Scholar]
  24. Rao, V.G.; Surinaidu, L. Rain Gardens—A New Ecosystem in City Landscape for in situ Harvesting of Rain Water. Ecol. Environ. Group 2012, 80, 89–96. [Google Scholar]
  25. Jha, A.K.; Bloch, R.; Lamond, J. Cities and Flooding: A Guide to Integrated Urban Flood Risk Management for the 21st Century. In Cities and Flooding; World Bank: Washington, DC, USA, 2012. [Google Scholar] [CrossRef]
  26. Mazer, K.E.; Tomasek, A.A.; Daneshvar, F.; Bowling, L.C.; Frankenberger, J.R.; McMillan, S.K.; Novoa, H.M.; Zeballos-Velarde, C. Integrated Hydrologic and Hydraulic Analysis of Torrential Flood Hazard in Arequipa, Peru. J. Contemp. Water Res. Educ. 2020, 171, 93–110. [Google Scholar] [CrossRef]
  27. Wei, W.; Gong, J.; Deng, J.; Xu, W. Effects of Air Vent Size and Location Design on Air Supply Efficiency in Flood Discharge Tunnel Operations. J. Hydraul. Eng. 2023, 149, 04023050. [Google Scholar] [CrossRef]
  28. Hohermuth, B.; Boes, R.M.; Felder, S. High-Velocity Air–Water Flow Measurements in a Prototype Tunnel Chute: Scaling of Void Fraction and Interfacial Velocity. J. Hydraul. Eng. 2021, 147, 04021044. [Google Scholar] [CrossRef]
  29. Jiang, F.; Xu, W.; Deng, J.; Wei, W. Flow Structures of the Air-Water Layer in the Free Surface Region of High-Speed Open Channel Flows. Math. Probl. Eng. 2020, 2020, 5903763. [Google Scholar] [CrossRef]
  30. Garreaud, R.D. A plausible atmospheric trigger for the 2017 coastal El Niño. Int. J. Clim. 2018, 38, E1296–E1302. [Google Scholar] [CrossRef]
  31. Son, R.; Wang, S.-Y.S.; Tseng, W.-L.; Schuler, C.W.B.; Becker, E.; Yoon, J.-H. Climate diagnostics of the extreme floods in Peru during early 2017. Clim. Dyn. 2019, 54, 935–945. [Google Scholar] [CrossRef]
  32. Qi, X.; Qian, S.; Chen, K.; Li, J.; Wu, X.; Wang, Z.; Deng, Z.; Jiang, J. Dependence of daily precipitation and wind speed over coastal areas: Evidence from China’s coastline. Hydrol. Res. 2023, 54, 491–507. [Google Scholar] [CrossRef]
  33. Tian, Y.; Zhao, Y.; Li, J.; Xu, H.; Zhang, C.; Deng, L.; Wang, Y.; Peng, M. Improving CMIP6 Atmospheric River Precipitation Estimation by Cycle-Consistent Generative Adversarial Networks. J. Geophys. Res. Atmos. 2024, 129, e2023JD040698. [Google Scholar] [CrossRef]
  34. Zhang, K.; Li, Y.; Yu, Z.; Yang, T.; Xu, J.; Chao, L.; Ni, J.; Wang, L.; Gao, Y.; Hu, Y.; et al. Xin’anjiang Nested Experimental Watershed (XAJ-NEW) for Understanding Multiscale Water Cycle: Scientific Objectives and Experimental Design. Engineering 2022, 18, 207–217. [Google Scholar] [CrossRef]
  35. Zhao, Y.; Lu, M.; Zhang, L.; Cheng, T.F. Remote Influence of Southern Tibetan Plateau Heating on North Pacific Atmospheric Rivers. J. Clim. 2024, 38, 101–116. [Google Scholar] [CrossRef]
  36. Tian, Y.; Zhao, Y.; Son, S.; Luo, J.; Oh, S.; Wang, Y. A Deep-Learning Ensemble Method to Detect Atmospheric Rivers and Its Application to Projected Changes in Precipitation Regime. J. Geophys. Res. Atmos. 2023, 128, e2022JD037041. [Google Scholar] [CrossRef]
  37. Ettinger, S.; Mounaud, L.; Magill, C.; Yao-Lafourcade, A.-F.; Thouret, J.-C.; Manville, V.; Negulescu, C.; Zuccaro, G.; De Gregorio, D.; Nardone, S.; et al. Building vulnerability to hydro-geomorphic hazards: Estimating damage probability from qualitative vulnerability assessment using logistic regression. J. Hydrol. 2016, 541, 563–581. [Google Scholar] [CrossRef]
  38. Seenirajan, M.; Natarajan, M.; Thangaraj, R.; Bagyaraj, M. Study and Analysis of Chennai Flood 2015 Using GIS and Multicriteria Technique. J. Geogr. Inf. Syst. 2017, 09, 126–140. [Google Scholar] [CrossRef]
  39. Nikonorov, A.; Badenko, V.; Terleev, V.; Togo, I.; Volkova, Y.; Skvortsova, O.; Nikonova, O.; Pavlov, S.; Mirschel, W. Use of GIS-environment under the Analysis of the Managerial Solutions for Flood Events Protection Measures. Procedia Eng. 2016, 165, 1731–1740. [Google Scholar] [CrossRef]
  40. Isma’il, M.; Saanyol, I.O. Application of Remote Sensing (RS) and Geographic Information Systems (GIS) in flood vulnerability mapping: Case study of River Kaduna. Int. J. Geomat. Geosci. 2013, 3, 618–628. [Google Scholar]
  41. Li, Y.; Ji, C.; Wang, P.; Huang, L. Proactive intervention of green infrastructure on flood regulation and mitigation service based on landscape pattern. J. Clean. Prod. 2023, 419, 138152. [Google Scholar] [CrossRef]
  42. Gaňová, L.; Zeleňáková, M.; Purcz, P.; Diaconu, D.C.; Orfánus, T.; Kuzevičová, Ž. Identification of urban flood vul-nerability in eastern Slovakia by mapping the potential natural sources of flooding—Implications for territorial planning. Urban. Archit. Constr. 2017, 8, 365–376. [Google Scholar]
  43. Hamel, P.; Tan, L. Blue–Green Infrastructure for Flood and Water Quality Management in Southeast Asia: Evidence and Knowledge Gaps. Environ. Manag. 2021, 69, 699–718. [Google Scholar] [CrossRef]
  44. Esse, C.; Santander-Massa, R.; Encina-Montoya, F.; Ríos, P.D.L.; Fonseca, D.; Saavedra, P. Multicriteria spatial analysis applied to identifying ecosystem services in mixed-use river catchment areas in south central Chile. For. Ecosyst. 2019, 6, 25. [Google Scholar] [CrossRef]
  45. Kharytonov, M.M.; Pugach, A.M.; Stankevich, S.A.; Kozlova, A.O. Geospatial assessment of the Mokra Sura river ecological condition using remote sensing and in situ monitoring data. J. Geol. Geogr. Geoecol. 2019, 27, 422–430. [Google Scholar] [CrossRef] [PubMed]
  46. Lüke, A.; Hack, J. Comparing the Applicability of Commonly Used Hydrological Ecosystem Services Models for Integrated Decision-Support. Sustainability 2018, 10, 346. [Google Scholar] [CrossRef]
  47. Francesconi, W.; Srinivasan, R.; Pérez-Miñana, E.; Willcock, S.P.; Quintero, M. Using the Soil and Water Assessment Tool (SWAT) to model ecosystem services: A systematic review. J. Hydrol. 2016, 535, 625–636. [Google Scholar] [CrossRef]
  48. Schmalz, B.; Kruse, M.; Kiesel, J.; Müller, F.; Fohrer, N. Water-related ecosystem services in Western Siberian lowland basins—Analysing and mapping spatial and seasonal effects on regulating services based on ecohydrological modelling results. Ecol. Indic. 2016, 71, 55–65. [Google Scholar] [CrossRef]
  49. Bagstad, K.J.; Semmens, D.J.; Winthrop, R. Comparing approaches to spatially explicit ecosystem service modeling: A case study from the San Pedro River, Arizona. Ecosyst. Serv. 2013, 5, 40–50. [Google Scholar] [CrossRef]
  50. Natural Capital Project, 2025. InVEST 0.0. Stanford University, University of Minnesota, Chinese Academy of Sciences, The Nature Conservancy, World Wildlife Fund, Stockholm Resilience Centre and the Royal Swedish Academy of Sciences. Available online: https://naturalcapitalproject.stanford.edu/software/invest (accessed on 23 March 2025).
  51. Bose, S.; Mazumdar, A. Urban flood risk assessment and mitigation with InVEST-UFRM model: A case study on Kolkata city, West Bengal state (India). Arab. J. Geosci. 2023, 16, 320. [Google Scholar] [CrossRef]
  52. Collyns, D. How can Peru prepare to withstand more devastating floods and landslides? Working in development. The Guardian. 2017. Available online: https://www.theguardian.com/global-development-professionals-network/2017/apr/13/peru-prevent-floods-landslides-climate-change (accessed on 23 March 2025).
  53. Parida, Y. Economic impact of floods in the Indian states. Environ. Dev. Econ. 2019, 25, 267–290. [Google Scholar] [CrossRef]
  54. Sayers, P.; Penning-Rowsell, E.C.; Horritt, M. Flood vulnerability, risk, and social disadvantage: Current and future patterns in the UK. Reg. Environ. Chang. 2018, 18, 339–352. [Google Scholar] [CrossRef]
  55. Fernández-Dávila, J.; Benites, A. Inundaciones En La Localidad de Arequipa Ocasionadas Por El Ingreso de Las Torrenteras; Instituto Nacional de Defensa Civil. INDECI: Arequipa, Peru, 1999.
  56. Libélula, C. Vulnerabilidad y Adaptación al Cambio Climático en Arequipa Metropolitana; CAF: Lima, Peru, 2018; Available online: https://scioteca.caf.com/handle/123456789/1181 (accessed on 11 March 2025).
  57. Montesinos-Tubée, D.B.; del Prado, H.N.; Bustamante, B.J.T.; Tejada, E.M.Á.; Lozada, A.B.; Flores, J.Z.; Paco, G.G.; Maldonado, M.; Moscoso, M.d.P.R.; Arteaga, G.C.R.; et al. Diversidad florística, comunidades vegetales y propuestas de conservación del monte ribereño en el río Chili (Arequipa, Perú). Arnaldoa 2019, 26, 97–130. [Google Scholar] [CrossRef]
  58. Llanque, J. Planificación y Diseño Bioclimático. Estrategias Para la Recuperación del Espacio Público, Edición Dongo; Universidad Nacional de San Agustín de Arequipa: Arequipa, Peru, 2004. [Google Scholar]
  59. Marengo, J.; Obregón, G.; Ramírez, V. Cambio Climático En Arequipa: Impactos, Evaluaciones de Vulnerabilidad y Medidas de Adaptación; Cachoeira Paulista: São Paulo, Brasil, 2008. [Google Scholar]
  60. Carrasco-Valencia, L.; Vilca-Campana, K.; Iruri-Ramos, C.; Cárdenas-Pillco, B.; Ollero, A.; Chanove-Manrique, A. Effect of LULC Changes on Annual Water Yield in the Urban Section of the Chili River, Arequipa, Using the Invest Model. Water 2024, 16, 664. [Google Scholar] [CrossRef]
  61. Vian, F.D.; Izquierdo, J.J.P.; Martínez, M.S. ¿Qué es un río urbano? Propuesta metodológica para su delimitación en España. ACE Archit. City Environ. 2020, 15, 1–30. [Google Scholar] [CrossRef]
  62. Instituto Municipal de Planeamiento. Memoria del PDM Arequipa Plan de Desarrollo Metropolitano de Arequipa 2016–2025; Ordenanza Municipal: Arequipa, Peru, 2016. Available online: http://impla.gob.pe/publicaciones/pdm-2016-2025/ (accessed on 1 June 2021).
  63. Dirección de Calidad y Evaluación de Recursos Hídricos. Estudio Hidrogeológico del Acuífero del Río Chili; Autoridad Nacional del Agua: Arequipa, Peru, 2018.
  64. Mishra, S.K.; Singh, V.P. Validity and extension of the SCS-CN method for computing infiltration and rainfall-excess rates. Hydrol. Process. 2004, 18, 3323–3345. [Google Scholar] [CrossRef]
  65. Aybar Camacho, C.L.; Lavado-Casimiro, W.; Huerta, A.; Fernández Palomino, C.; Vega-Jácome, F.; Sabino Rojas, E.; Felipe-Obando, O. Uso del Producto Grillado PISCO de Precipitación en Estudios, Investigaciones y Sistemas Operacionales de Monitoreo y pro-Nóstico Hidrometeorológico; SENAMHI: Lima, Peru, 2017.
  66. HEC-HMS Technical Reference Manual/CN Tables. Available online: https://www.hec.usace.army.mil/confluence/hmsdocs/hmstrm/cn-tables (accessed on 11 March 2025).
  67. EarthExplorer. Available online: https://earthexplorer.usgs.gov (accessed on 10 June 2017).
  68. Copernicus Browser. Available online: https://browser.dataspace.copernicus.eu/?zoom=5&lat=50.16282&lng=20.78613&themeId=DEFAULT-THEME&visualizationUrl=U2FsdGVkX19r845AJpS7mU3bLzdH2zht3wp%2Fe%2FQHiRFA411pmjPUHDcuxvjm35DgJDrNDhjPyEA61jjHpK6LTmn%2Fc9UKPMEtDlYSOj07GVl3lyRQ7IWLH8yb1zXoR0Ak&datasetId=S2_L2A_CDAS&demSource3D=%22MAPZEN%22&cloudCoverage=30&dateMode=SINGLE (accessed on 11 March 2025).
  69. Ross, C.W.; Prihodko, L.; Anchang, J.; Kumar, S.; Ji, W.J.; Hanan, N.P. Global Hydrologic Soil Groups (HYSOGs250m) for Curve Number-Based Runoff Modeling. Sci. Data 2018, 5, 180091. [Google Scholar] [CrossRef] [PubMed]
  70. Thouret, J.-C.; Enjolras, G.; Martelli, K.; Santoni, O.; Luque, J.A.; Nagata, M.; Arguedas, A.; Macedo, L. Combining criteria for delineating lahar- and flash-flood-prone hazard and risk zones for the city of Arequipa, Peru. Nat. Hazards Earth Syst. Sci. 2013, 13, 339–360. [Google Scholar] [CrossRef]
  71. Daneshvar, F.; Frankenberger, J.R.; Bowling, L.C.; Cherkauer, K.A.; Moraes, A.G.d.L. Development of Strategy for SWAT Hydrologic Modeling in Data-Scarce Regions of Peru. J. Hydrol. Eng. 2021, 26, 05021016. [Google Scholar] [CrossRef]
  72. Ochoa-Tocachi, B.F.; Buytaert, W.; Antiporta, J.; Acosta, L.; Bardales, J.D.; Célleri, R.; Crespo, P.; Fuentes, P.; Gil-Ríos, J.; Guallpa, M.; et al. High-resolution hydrometeorological data from a network of headwater catchments in the tropical Andes. Sci. Data 2018, 5, 180080. [Google Scholar] [CrossRef]
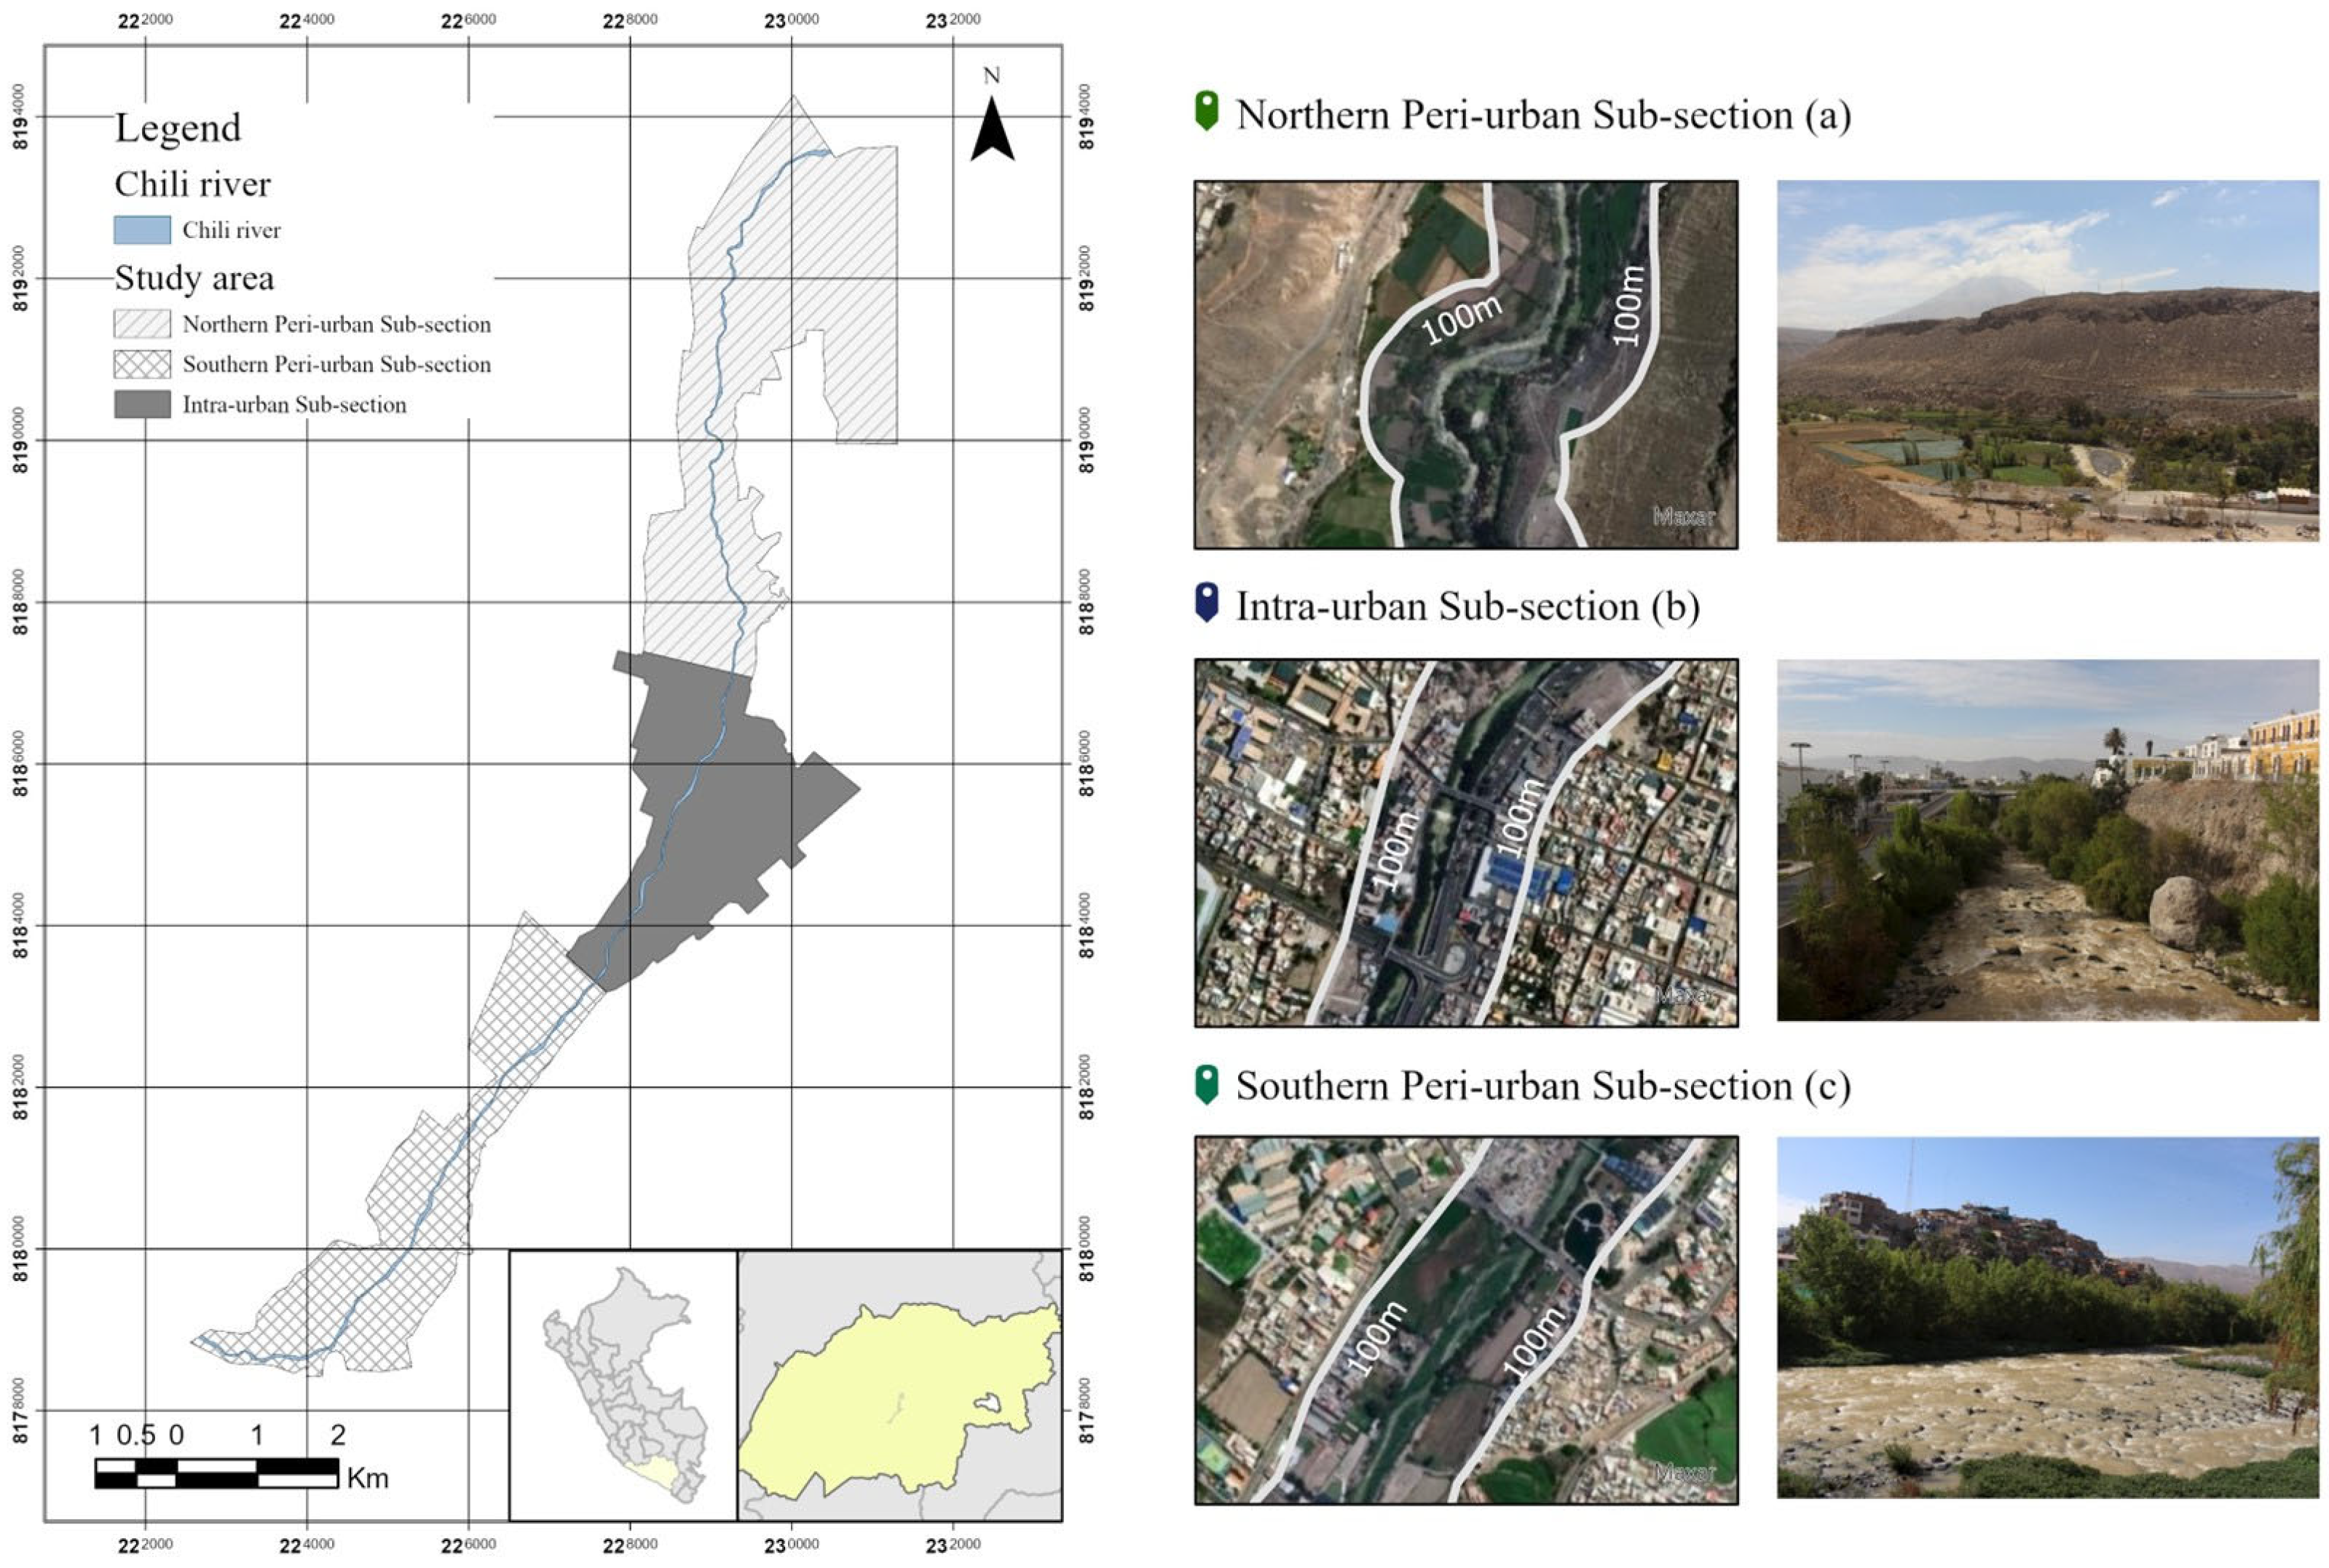
Figure 1. Map of the defined sub-sections of the urban basin of Chili River.
Water 17 01047 g001
Figure 2. Data and flow for the INVEST model.
Water 17 01047 g002
Figure 3. Change in runoff retention (%) from 1984 to 2022 in the Northern Peri-urban Sub-section, Intra-urban Sub-section, and Southern Peri-urban Sub-section.
Water 17 01047 g003
Figure 4. Runoff retention (%) in the Northern Peri–urban Sub–section for the period 1984–2022.
Water 17 01047 g004
Figure 5. Land use change from 1984 to 2022 per LULC type. (A) Land use in 1984, (B) land use in 2004, (C) land use in 2022. IW: inland waters (river), F: forest (riparian forest), OS2: open spaces 2 (Puyal), HAA: heterogeneous agricultural areas (agriculture), UF: urban fabric.
Water 17 01047 g005
Table 1. Land use classes in the study area.
LULC ClassesAbbreviation
Inland waters (river)IW
Forest (riparian forest)F
Open spaces 1 (Cardonal)OS1
Heterogeneous agricultural areas (agriculture)HAA
Urban fabric (urban)UF
Open spaces 2 (Puyal)OS2
Table 2. Biophysical table used for the study period.
LULC Class TypeLucodeCN_ACN_BCN_CCN_D
IW11111
F263748285
OS1371727374
HAA468798689
UF563778588
OS2649464847
Table 3. UFRM Model inputs and sources.
Model InputDetailSource
Rainfall depth10 × 10 mSENAMHI [65]
Land use/land cover30 × 30 m (Landsat 5)
10 × 10 m (Sentinel-2)
Earth Explorer Platform [67], Copernicus program [68]
Soil Hydrologic group10 × 10 mUSDA Classification [69]
Biophysical TableCSV fileInVEST user manual [50] and bibliographic review [66]
Table 4. Results of the Flood Risk Mitigation Model for each year (1984–2022), considering a rainfall depth of 225 mm.
YearRunoff Retention (%)Runoff Retention (m3)Runoff (m3)
198433.337.50149.99
198833.257.48150.18
199233.517.54149.59
199633.777.59149.01
200034.127.67148.22
200434.097.67148.29
200833.747.59149.08
201332.757.37151.29
201731.887.17153.26
202232.387.28152.13
Average33.287.48150.11
Table 5. Accuracy test for LULC in 1984 and 2022 in the Chili River urban section. Area unit = metre^2; SE = standard error; CI = confidence interval; PA: producer’s accuracy; UA: user’s accuracy; OA: overall accuracy.
YearAccuracyIWFOS1HAAUFOS2
1984SE0.00040.00030.00040.00050.00030.0004
SE area9363883711,07211,84284719590
95%CI area18,35217,32021,70123,21116,60318,796
PA (%)74.0386.9795.8997.4995.1875.34
UA (%)69.6280.0786.3595. 4699.0297.86
Kappa hat0.68880.79210.83320.92550.98680.9762
OA (%)93.35
Kappa Classification0.9091
2022SE0.00020.00020.00020.00030.00020.0002
SE area599346815644766161105654
95%CI area11,747917411,06315,01511,97511,081
PA (%)99.4790.6596.2397.3398.2992.90
UA (%)84.9595.8697.8598.8598.1388.99
Kappa hat0.84540.95710.97390.98270.97020.8833
OA (%)97.30
Kappa Classification0.9623
Disclaimer/Publisher’s Note: The statements, opinions and data contained in all publications are solely those of the individual author(s) and contributor(s) and not of MDPI and/or the editor(s). MDPI and/or the editor(s) disclaim responsibility for any injury to people or property resulting from any ideas, methods, instructions or products referred to in the content.