
The Effect of Autumn Irrigation on the Water, Heat, and Salt Transport in Seasonally Frozen Soils Under Varying Groundwater Levels


Abstract
1. Introduction
2. Materials and Methods
2.1. Study Area and In Situ Experimental Setup
2.2. Methodologies
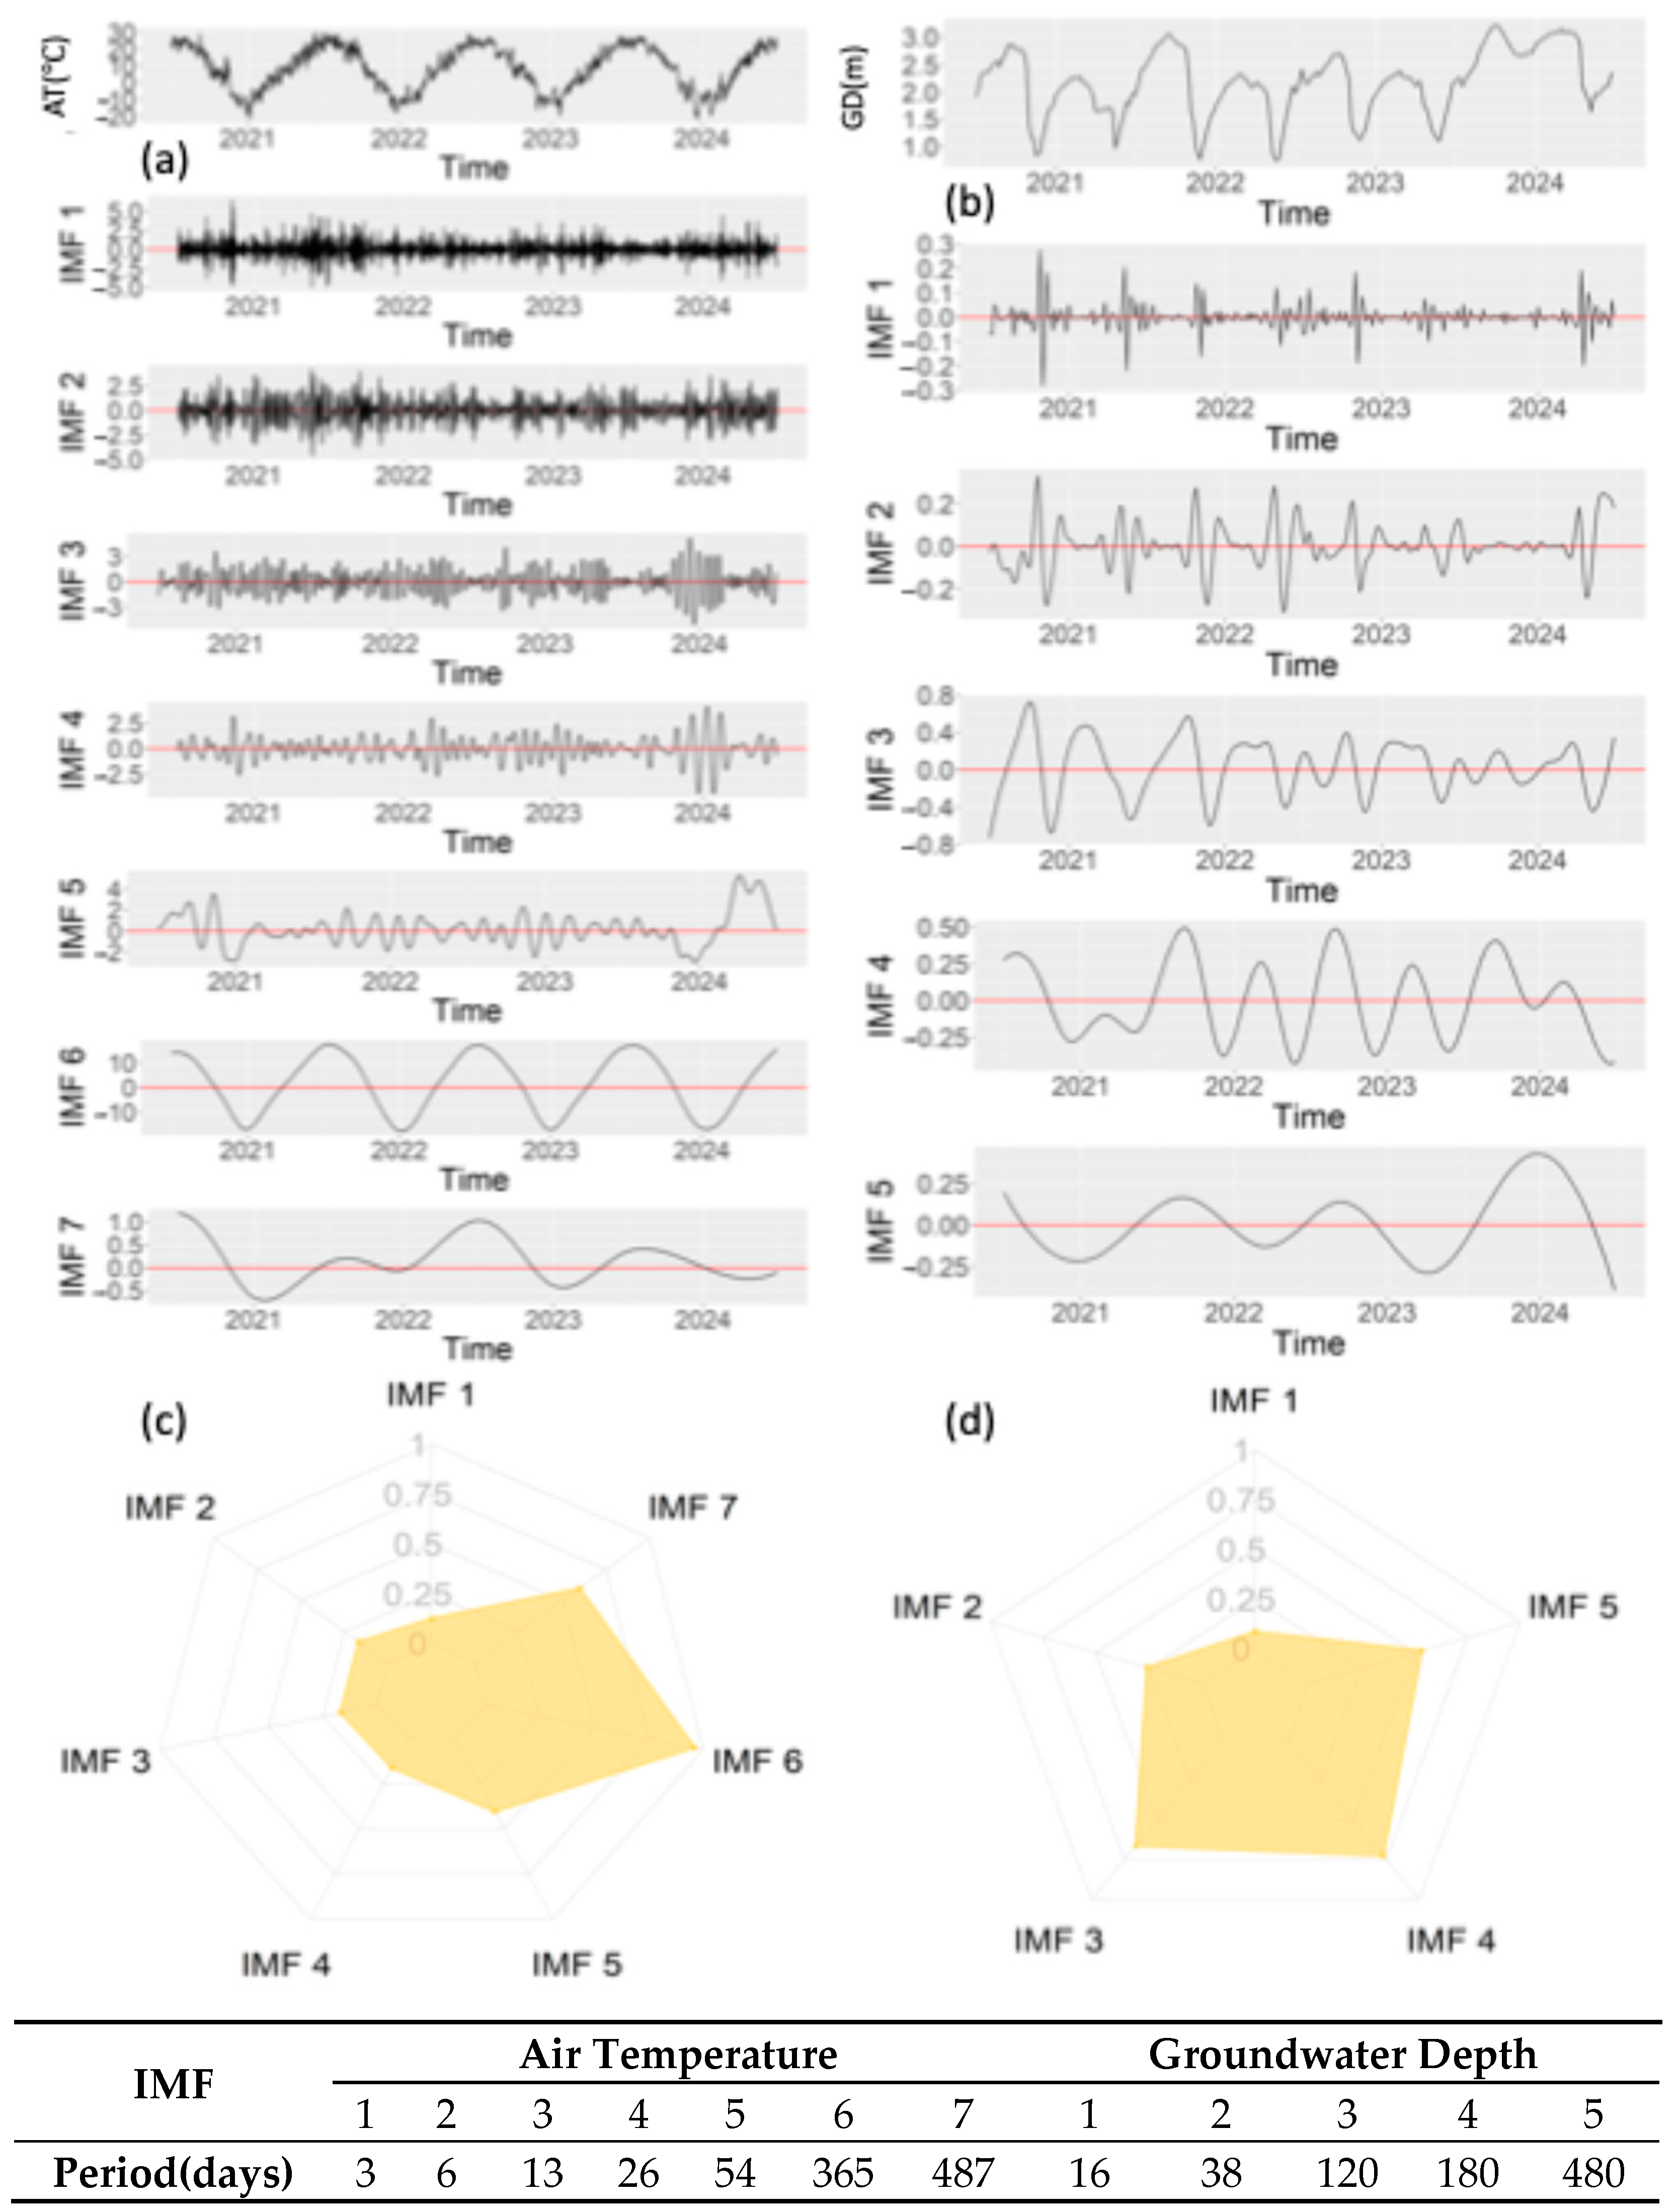
2.2.1. EEMD
2.2.2. Characteristics of Soil Water–Heat–Salt Dynamics
2.2.3. Statistical Analysis
3. Results and Discussion
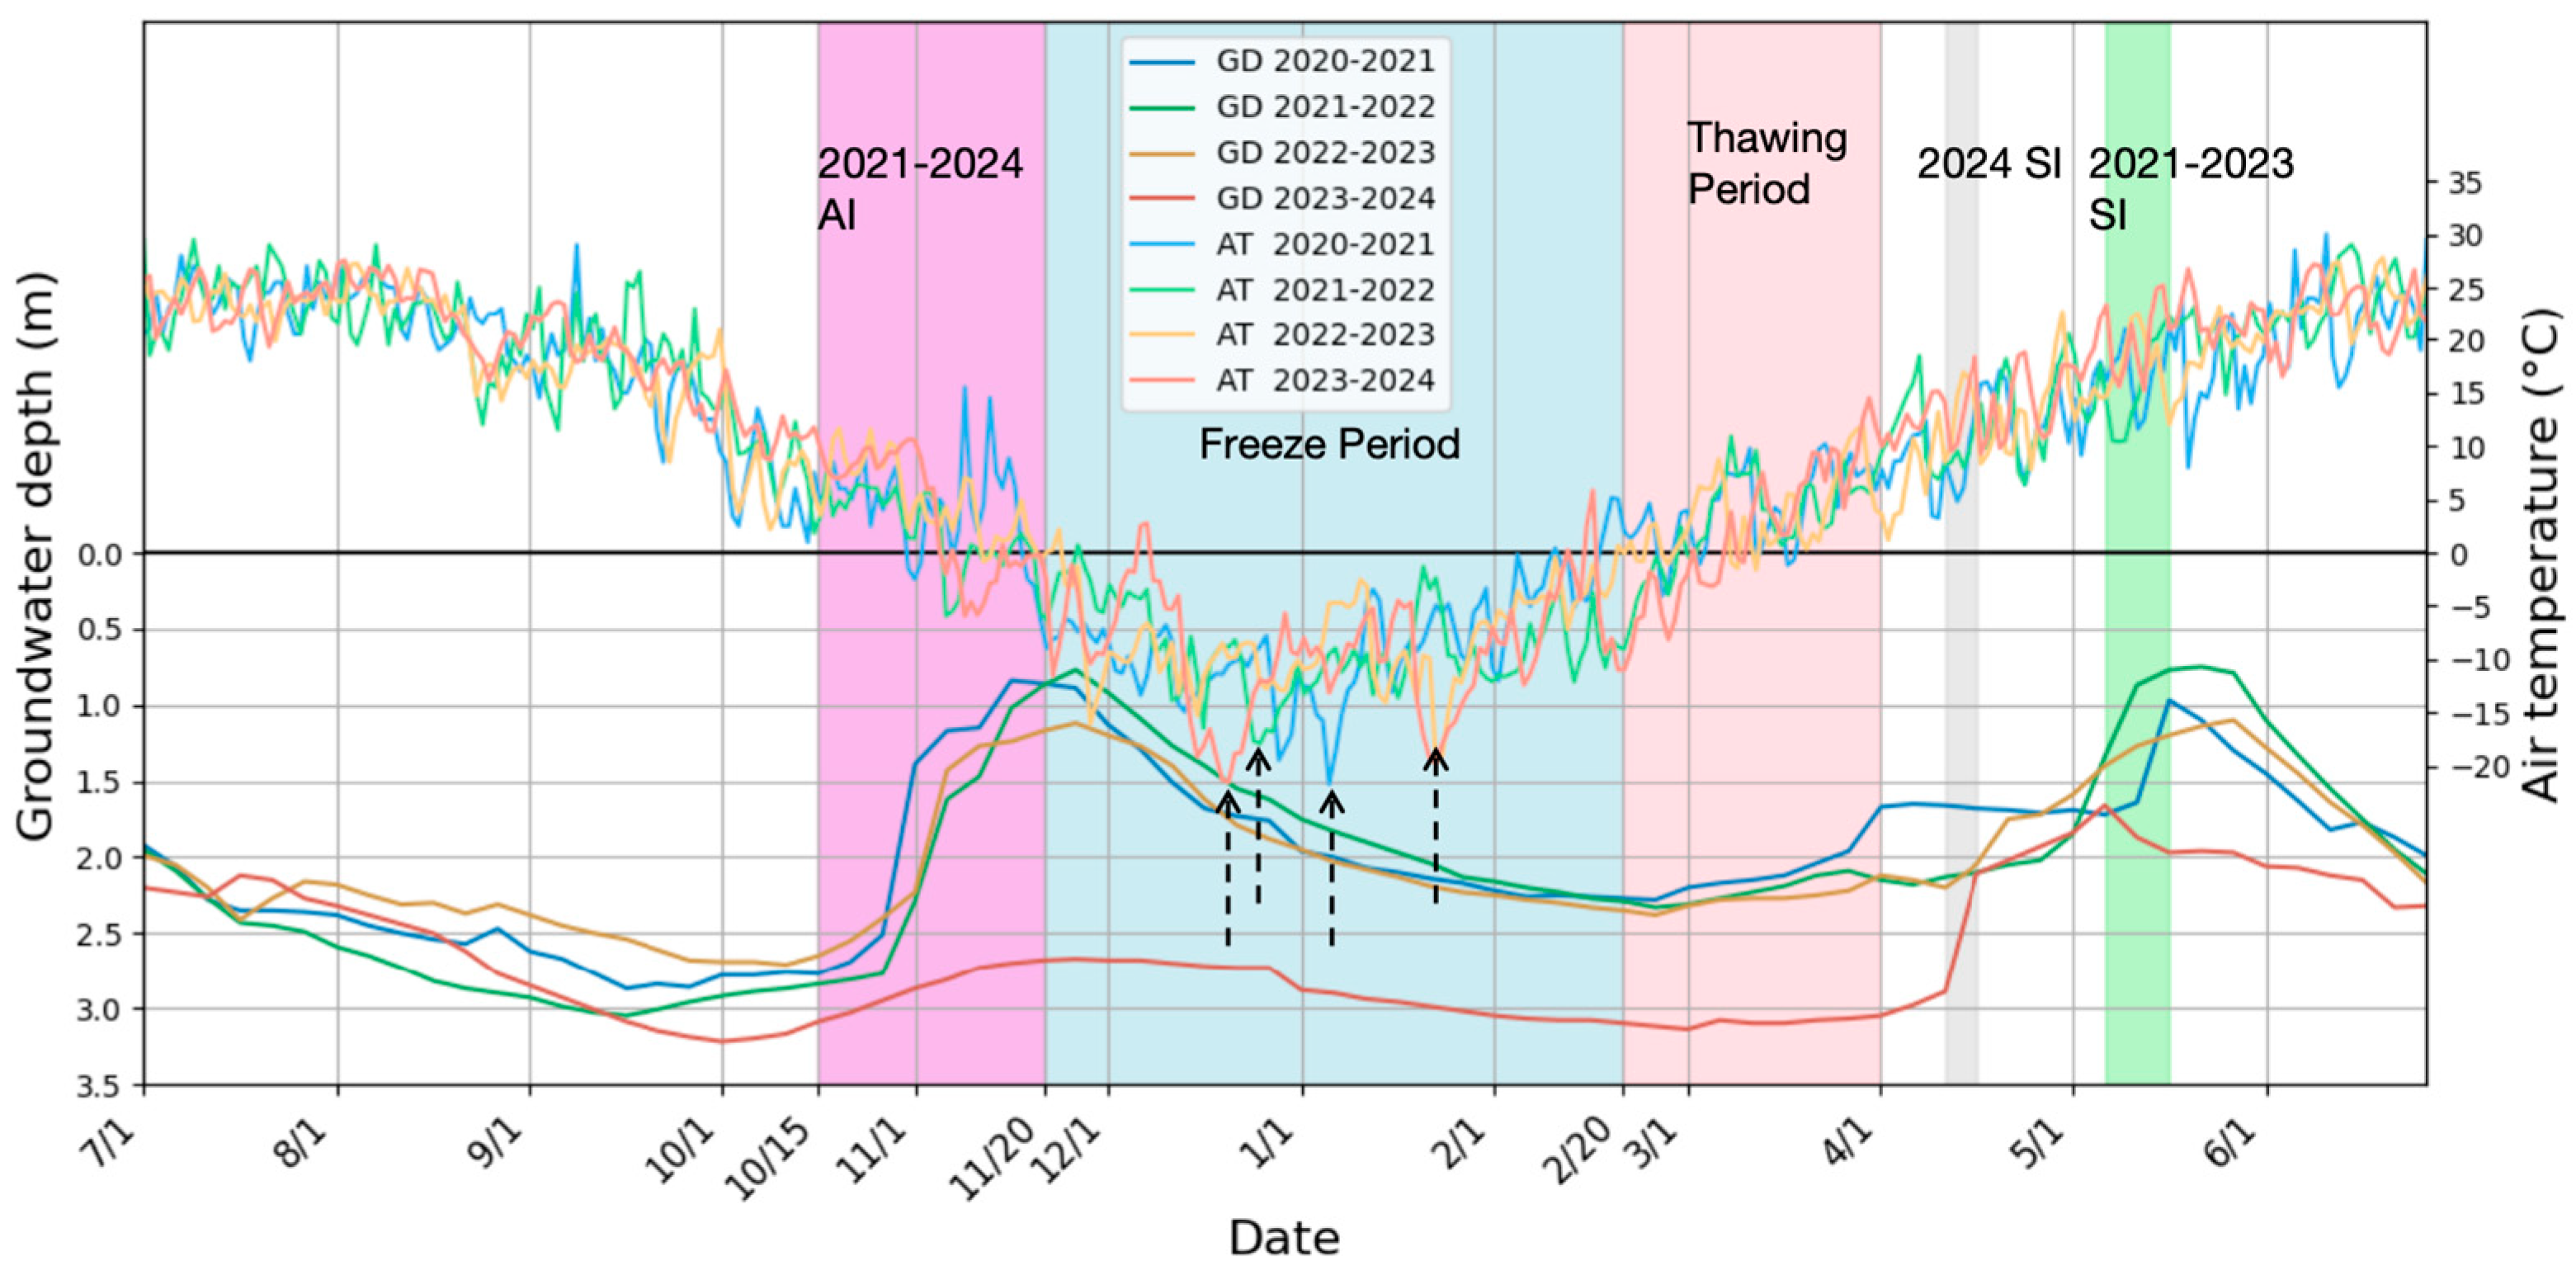
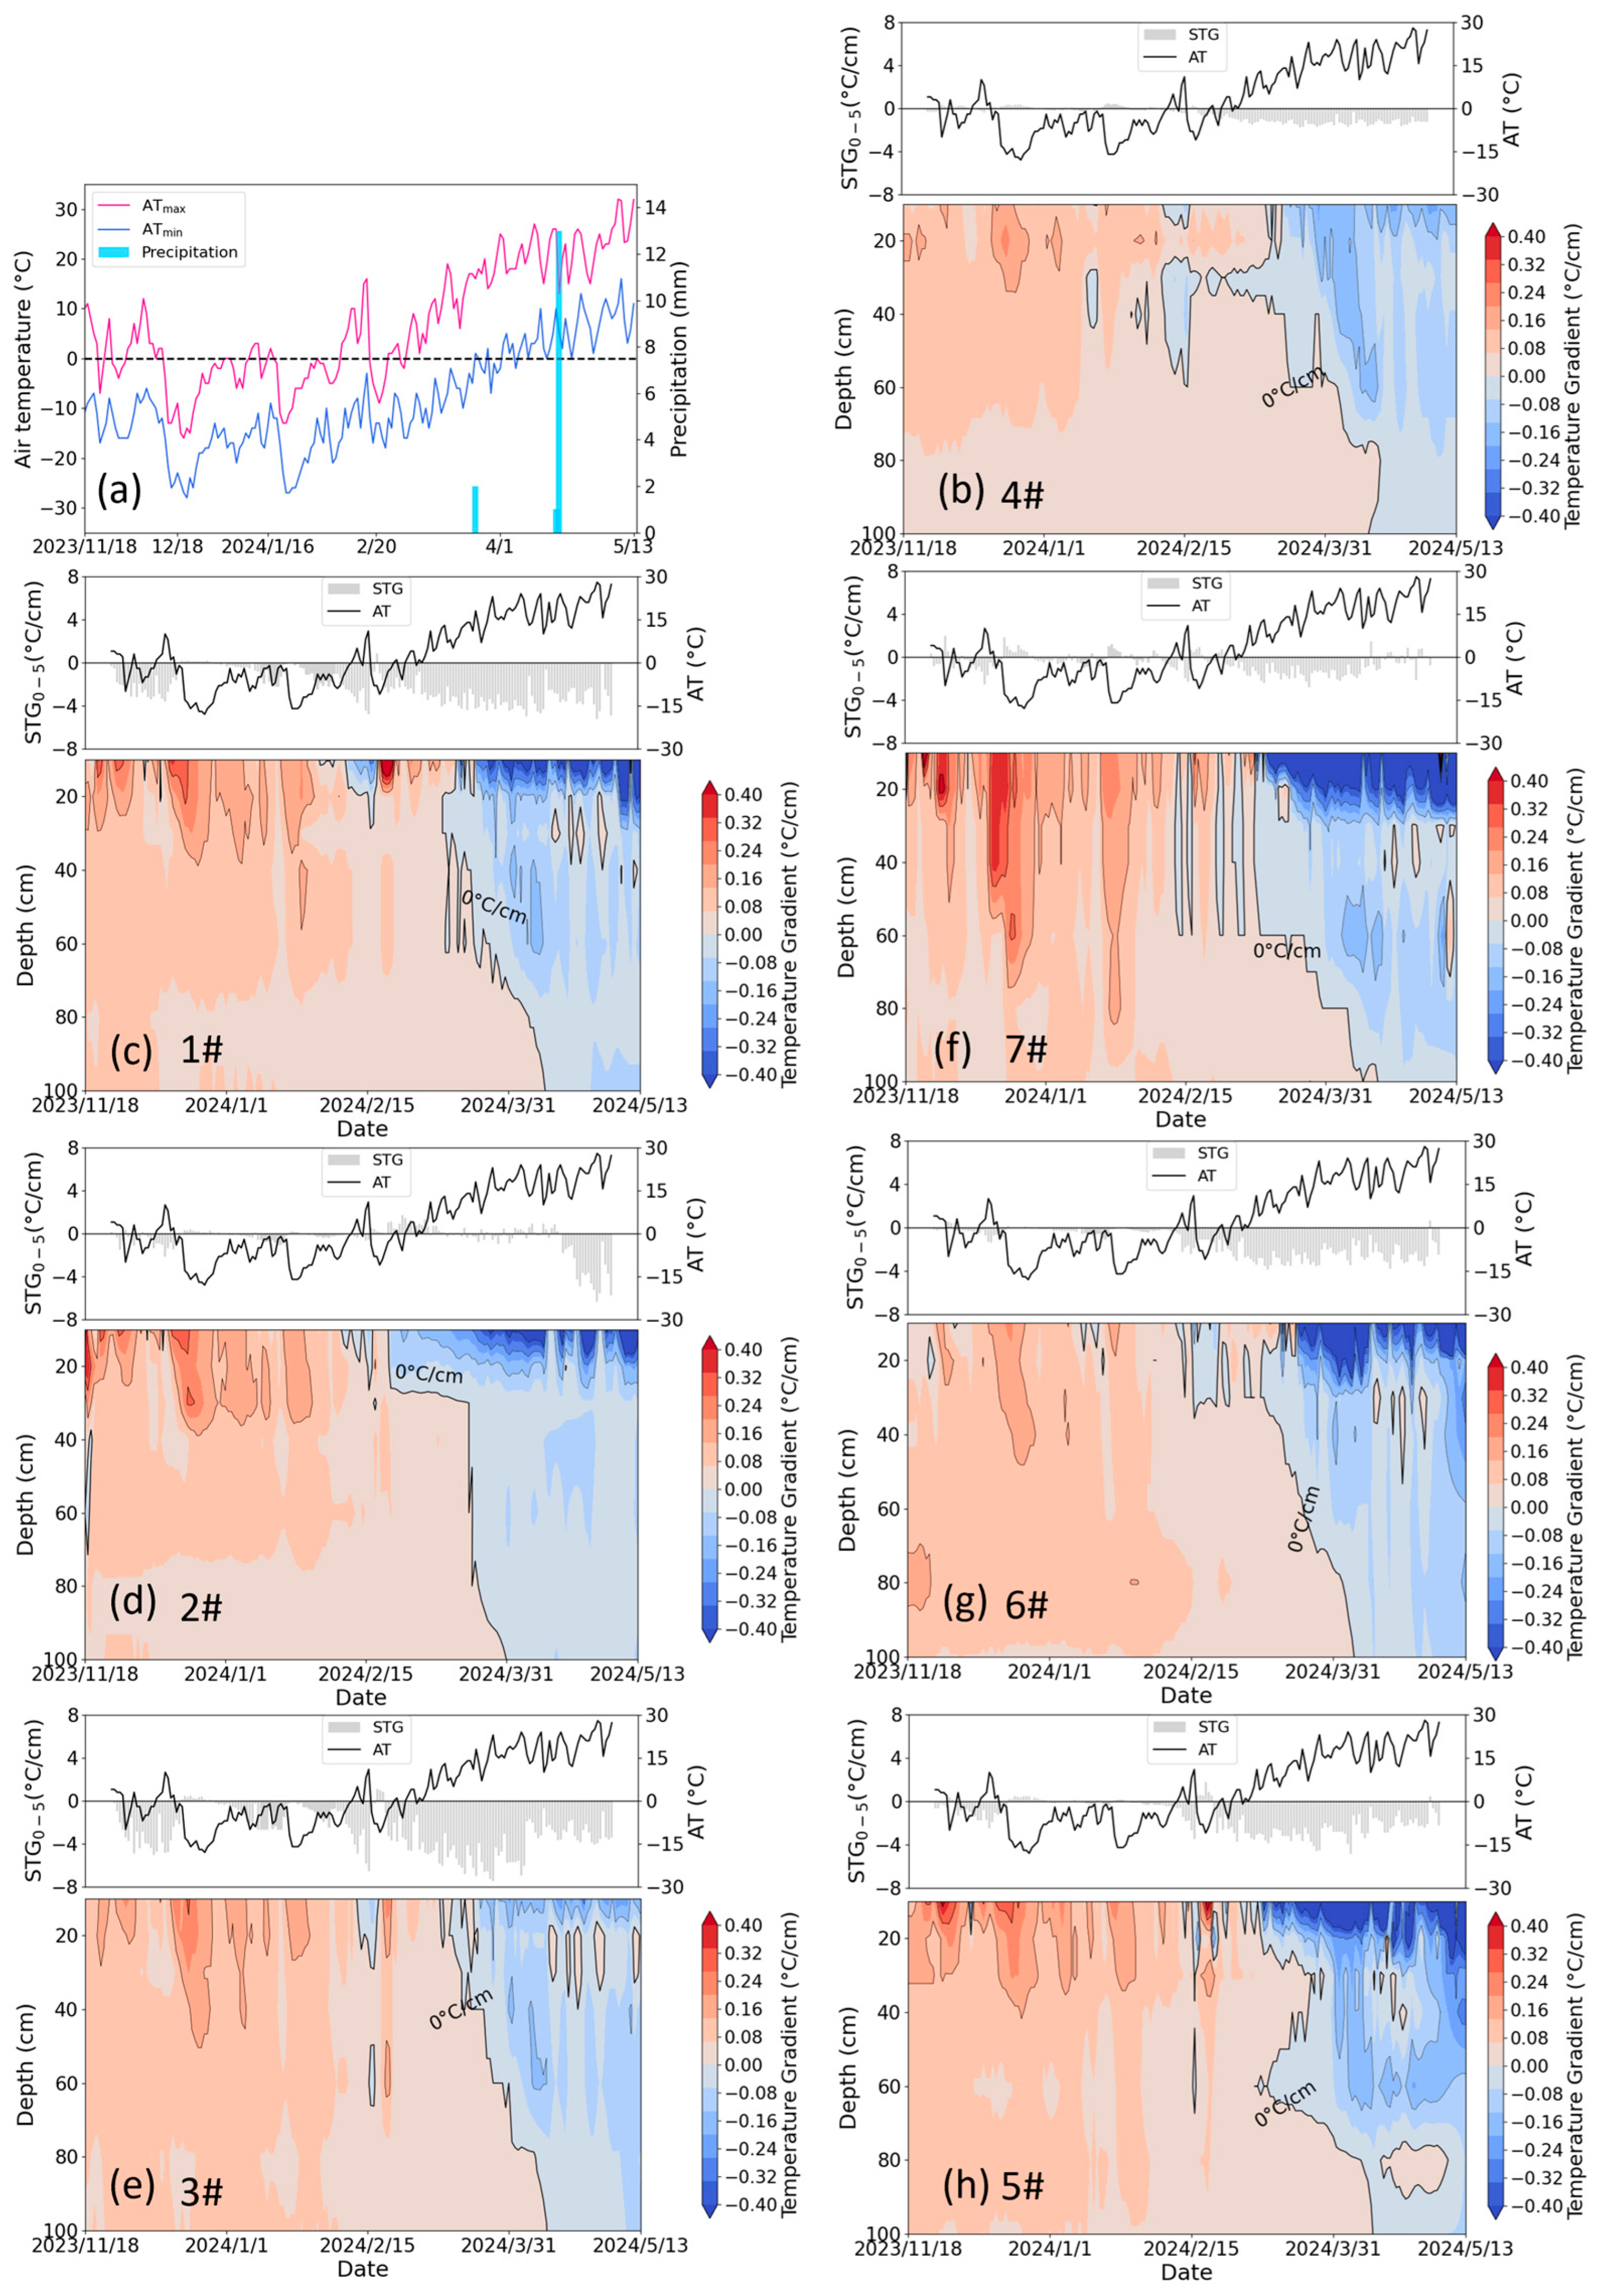
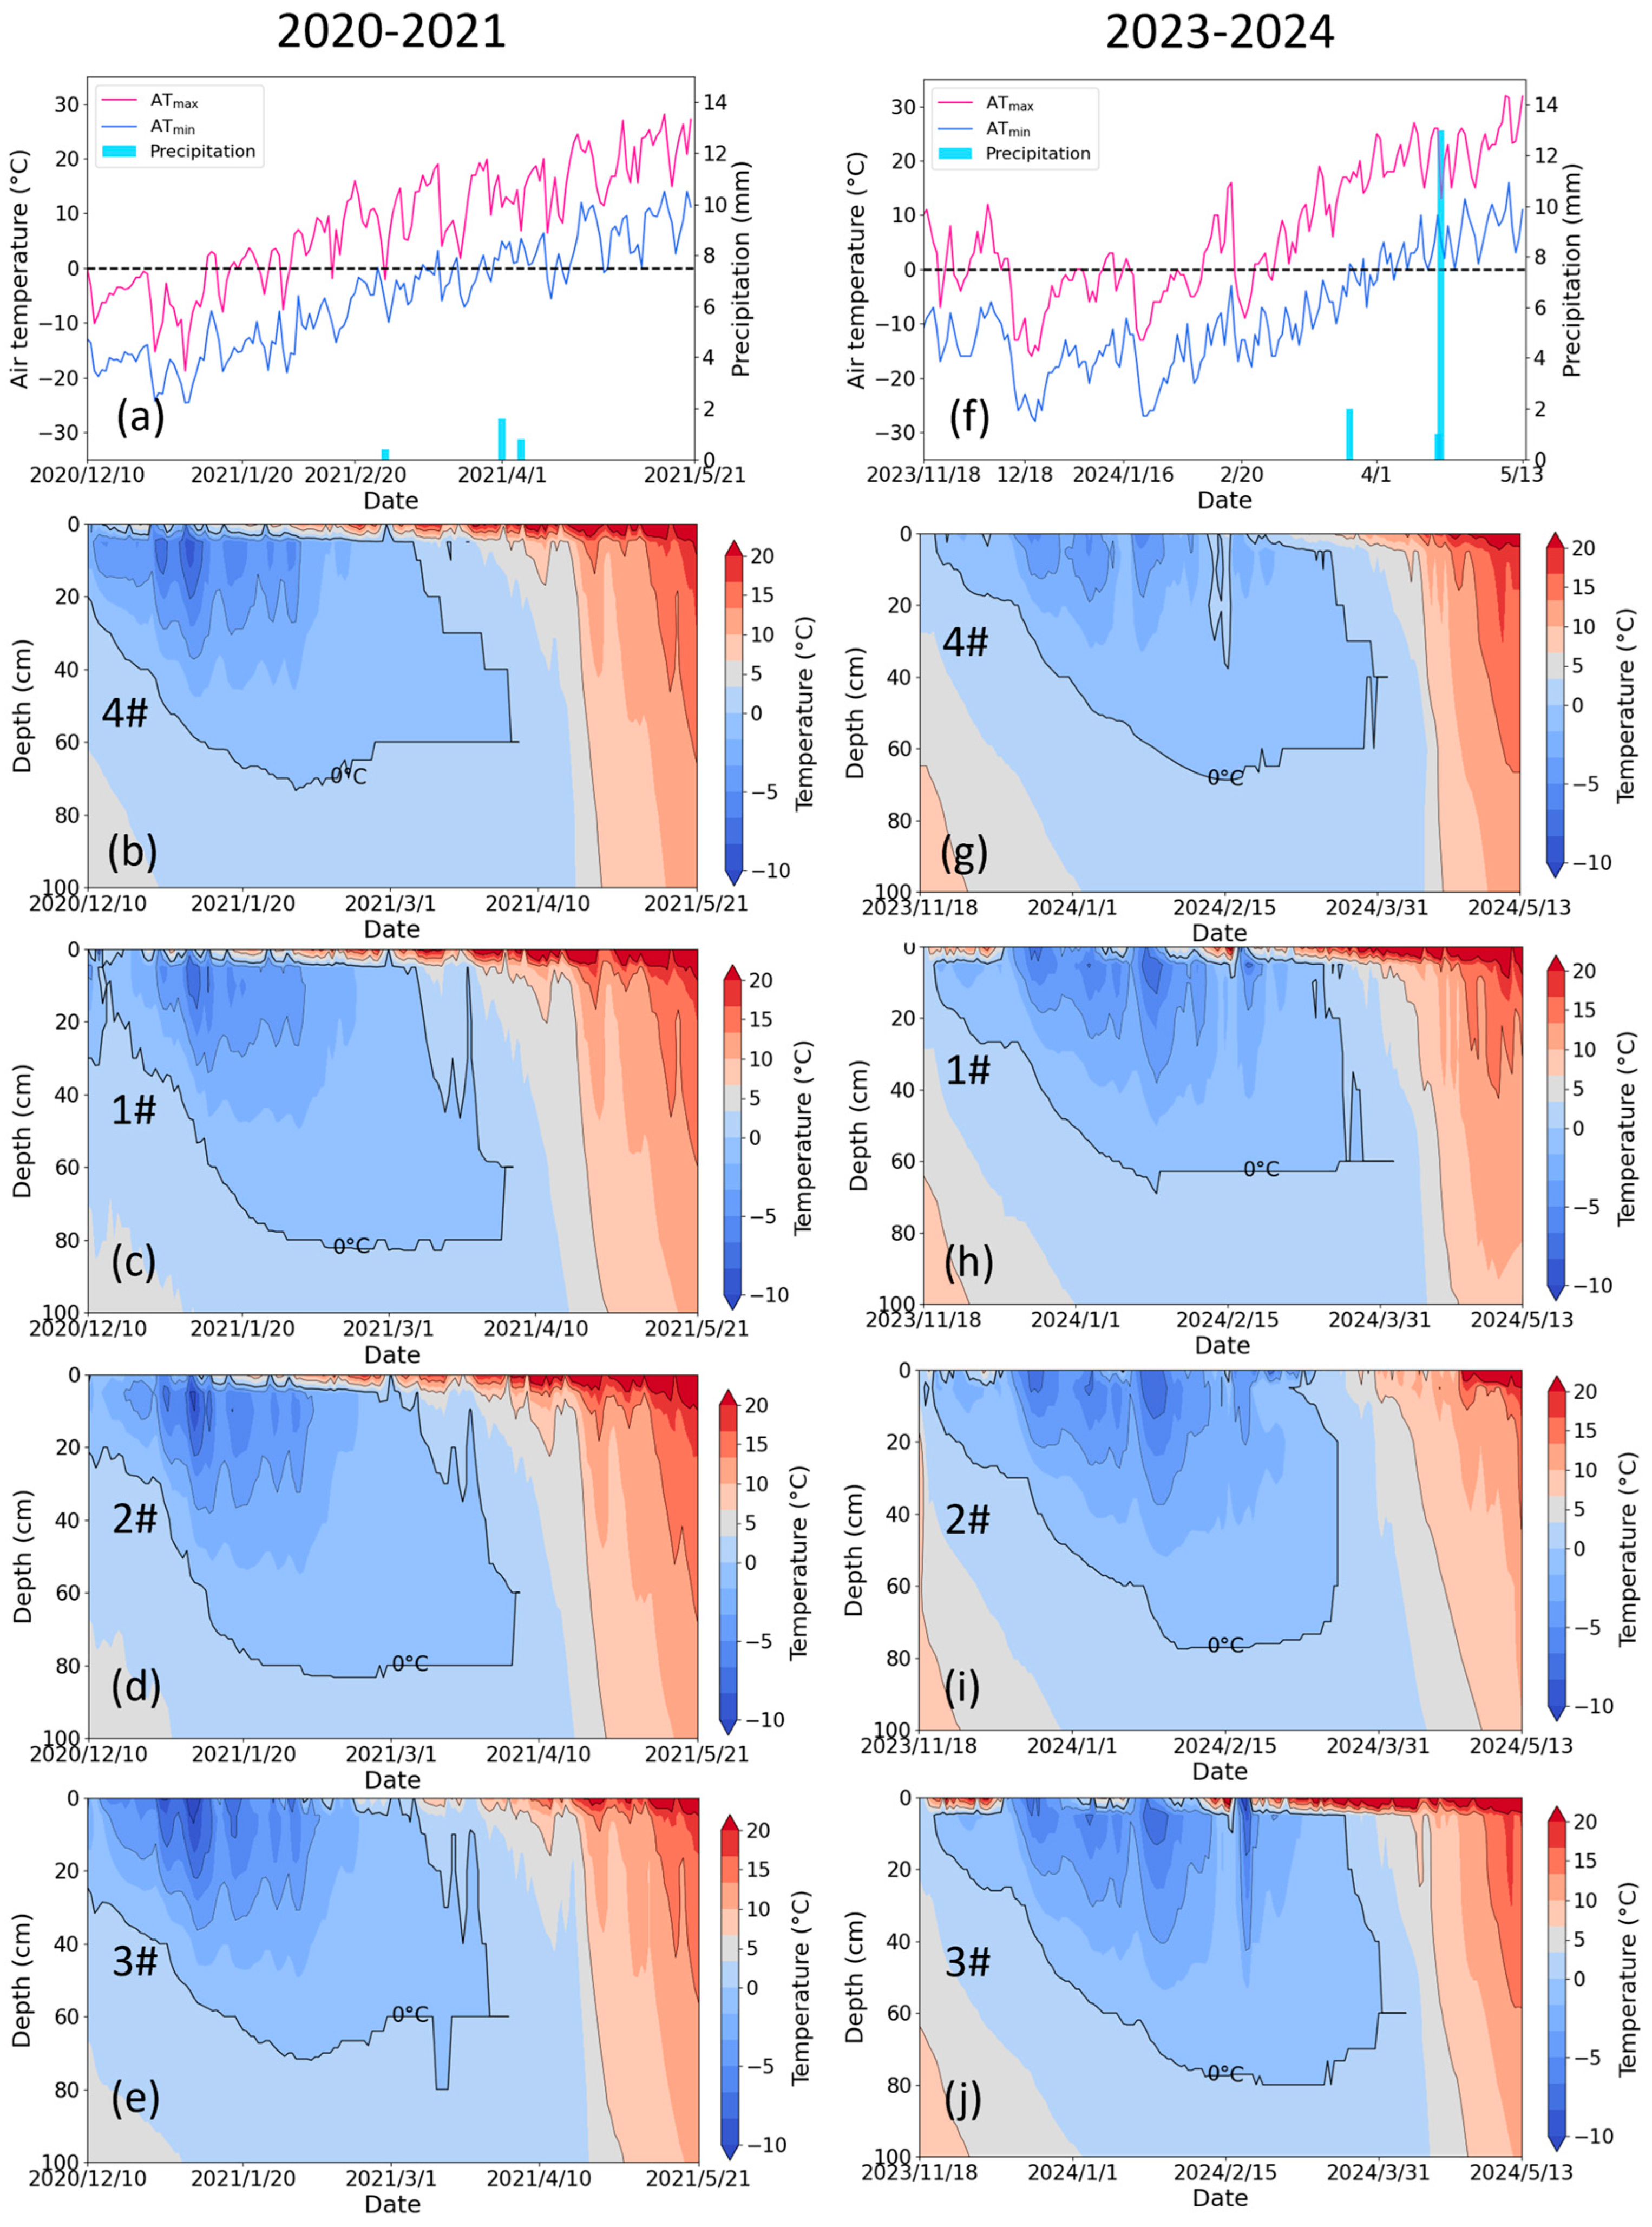
3.1. Air Temperature and Groundwater Dynamics During the Freezing–Thawing Period
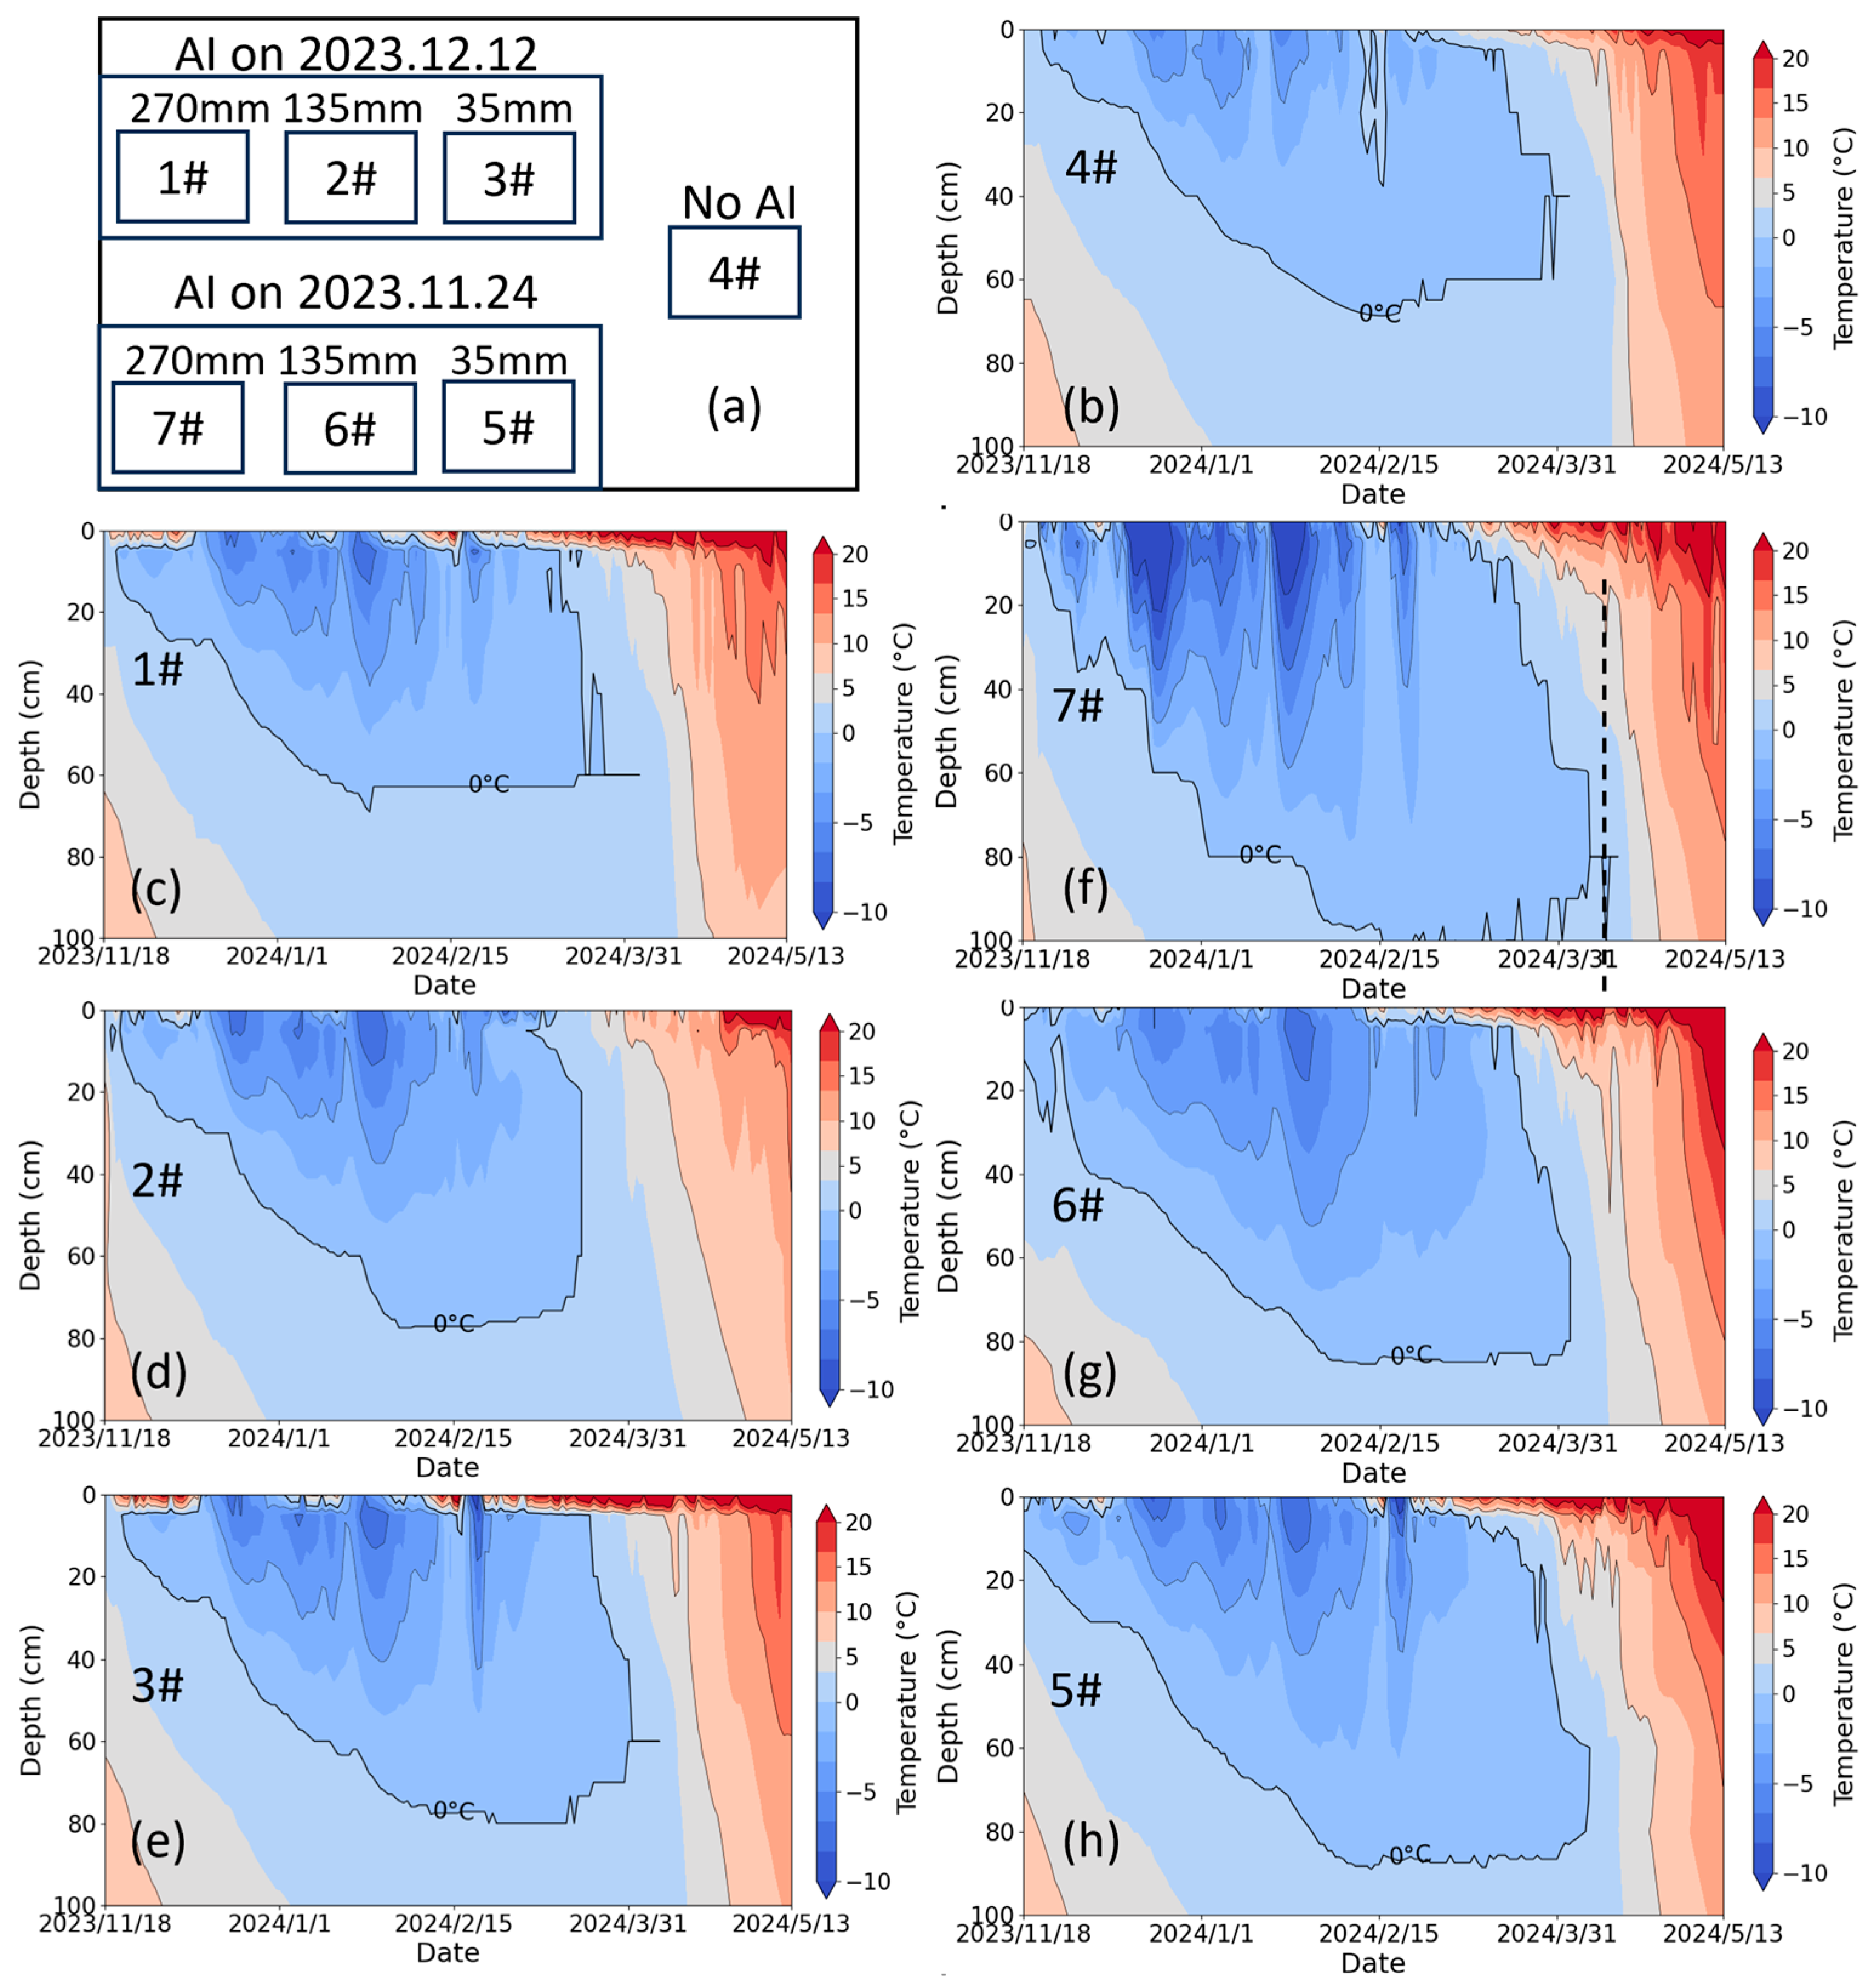
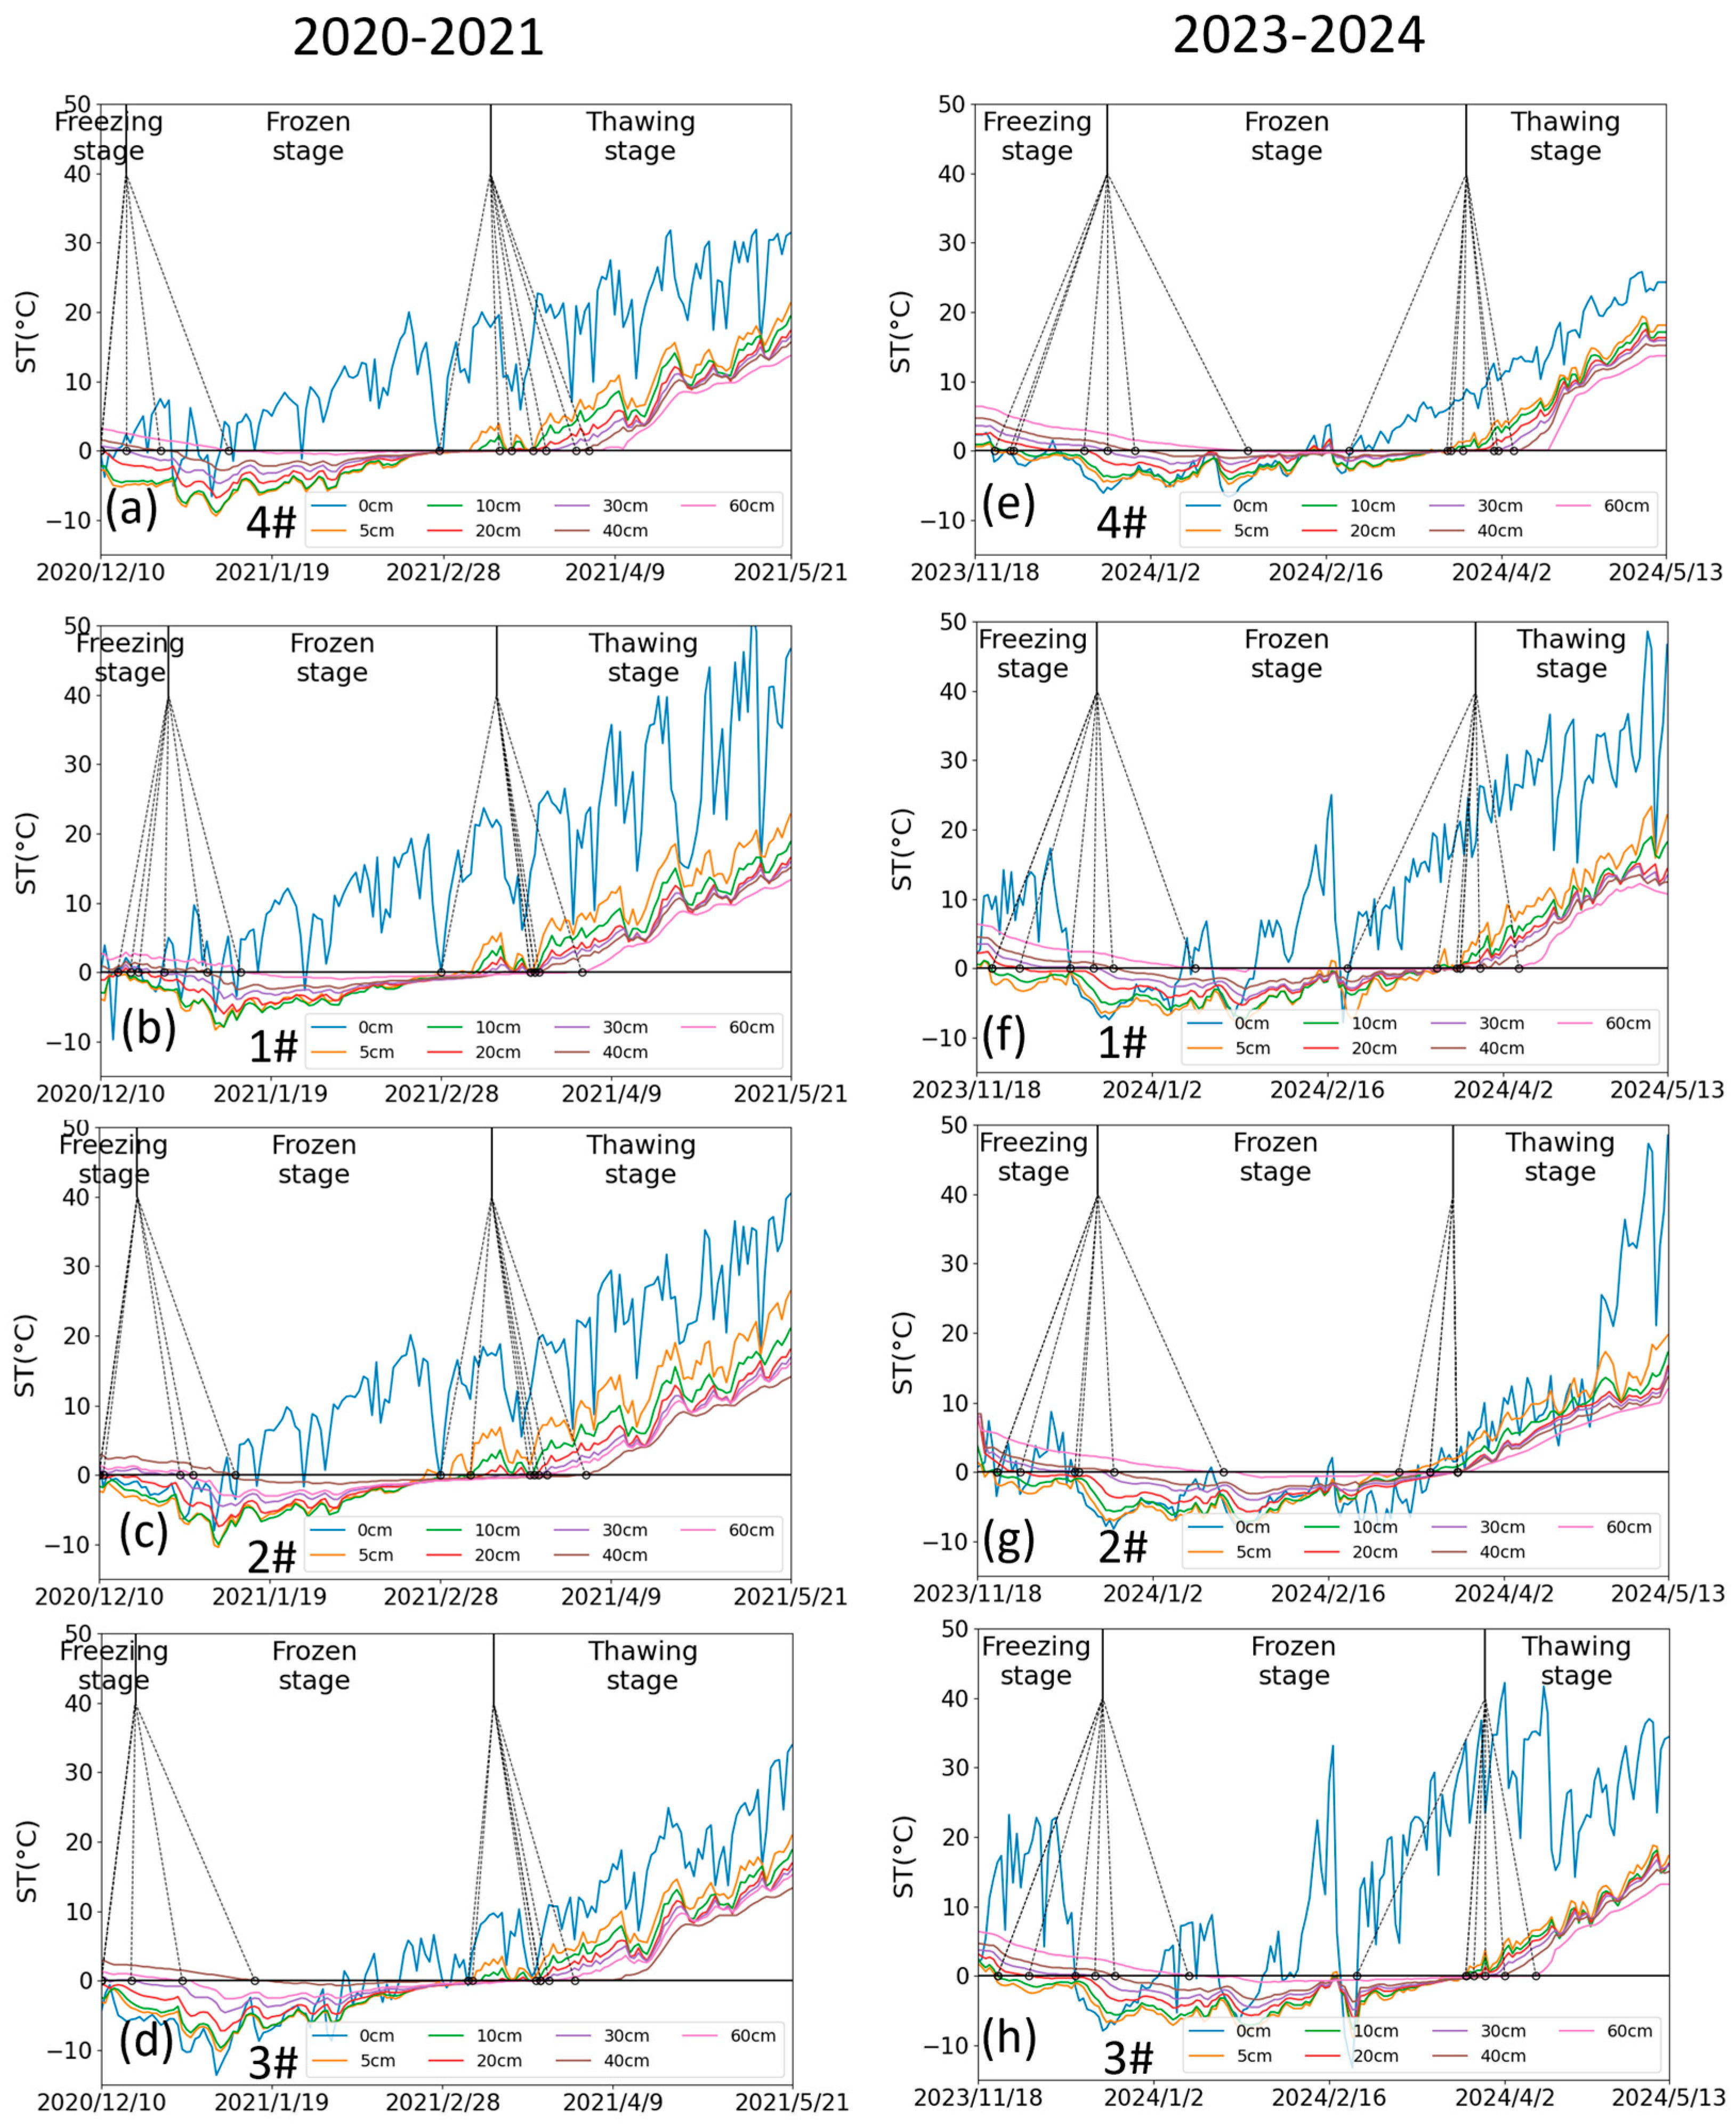
3.2. The Effects of AI on Soil Freezing–Thawing Dynamics
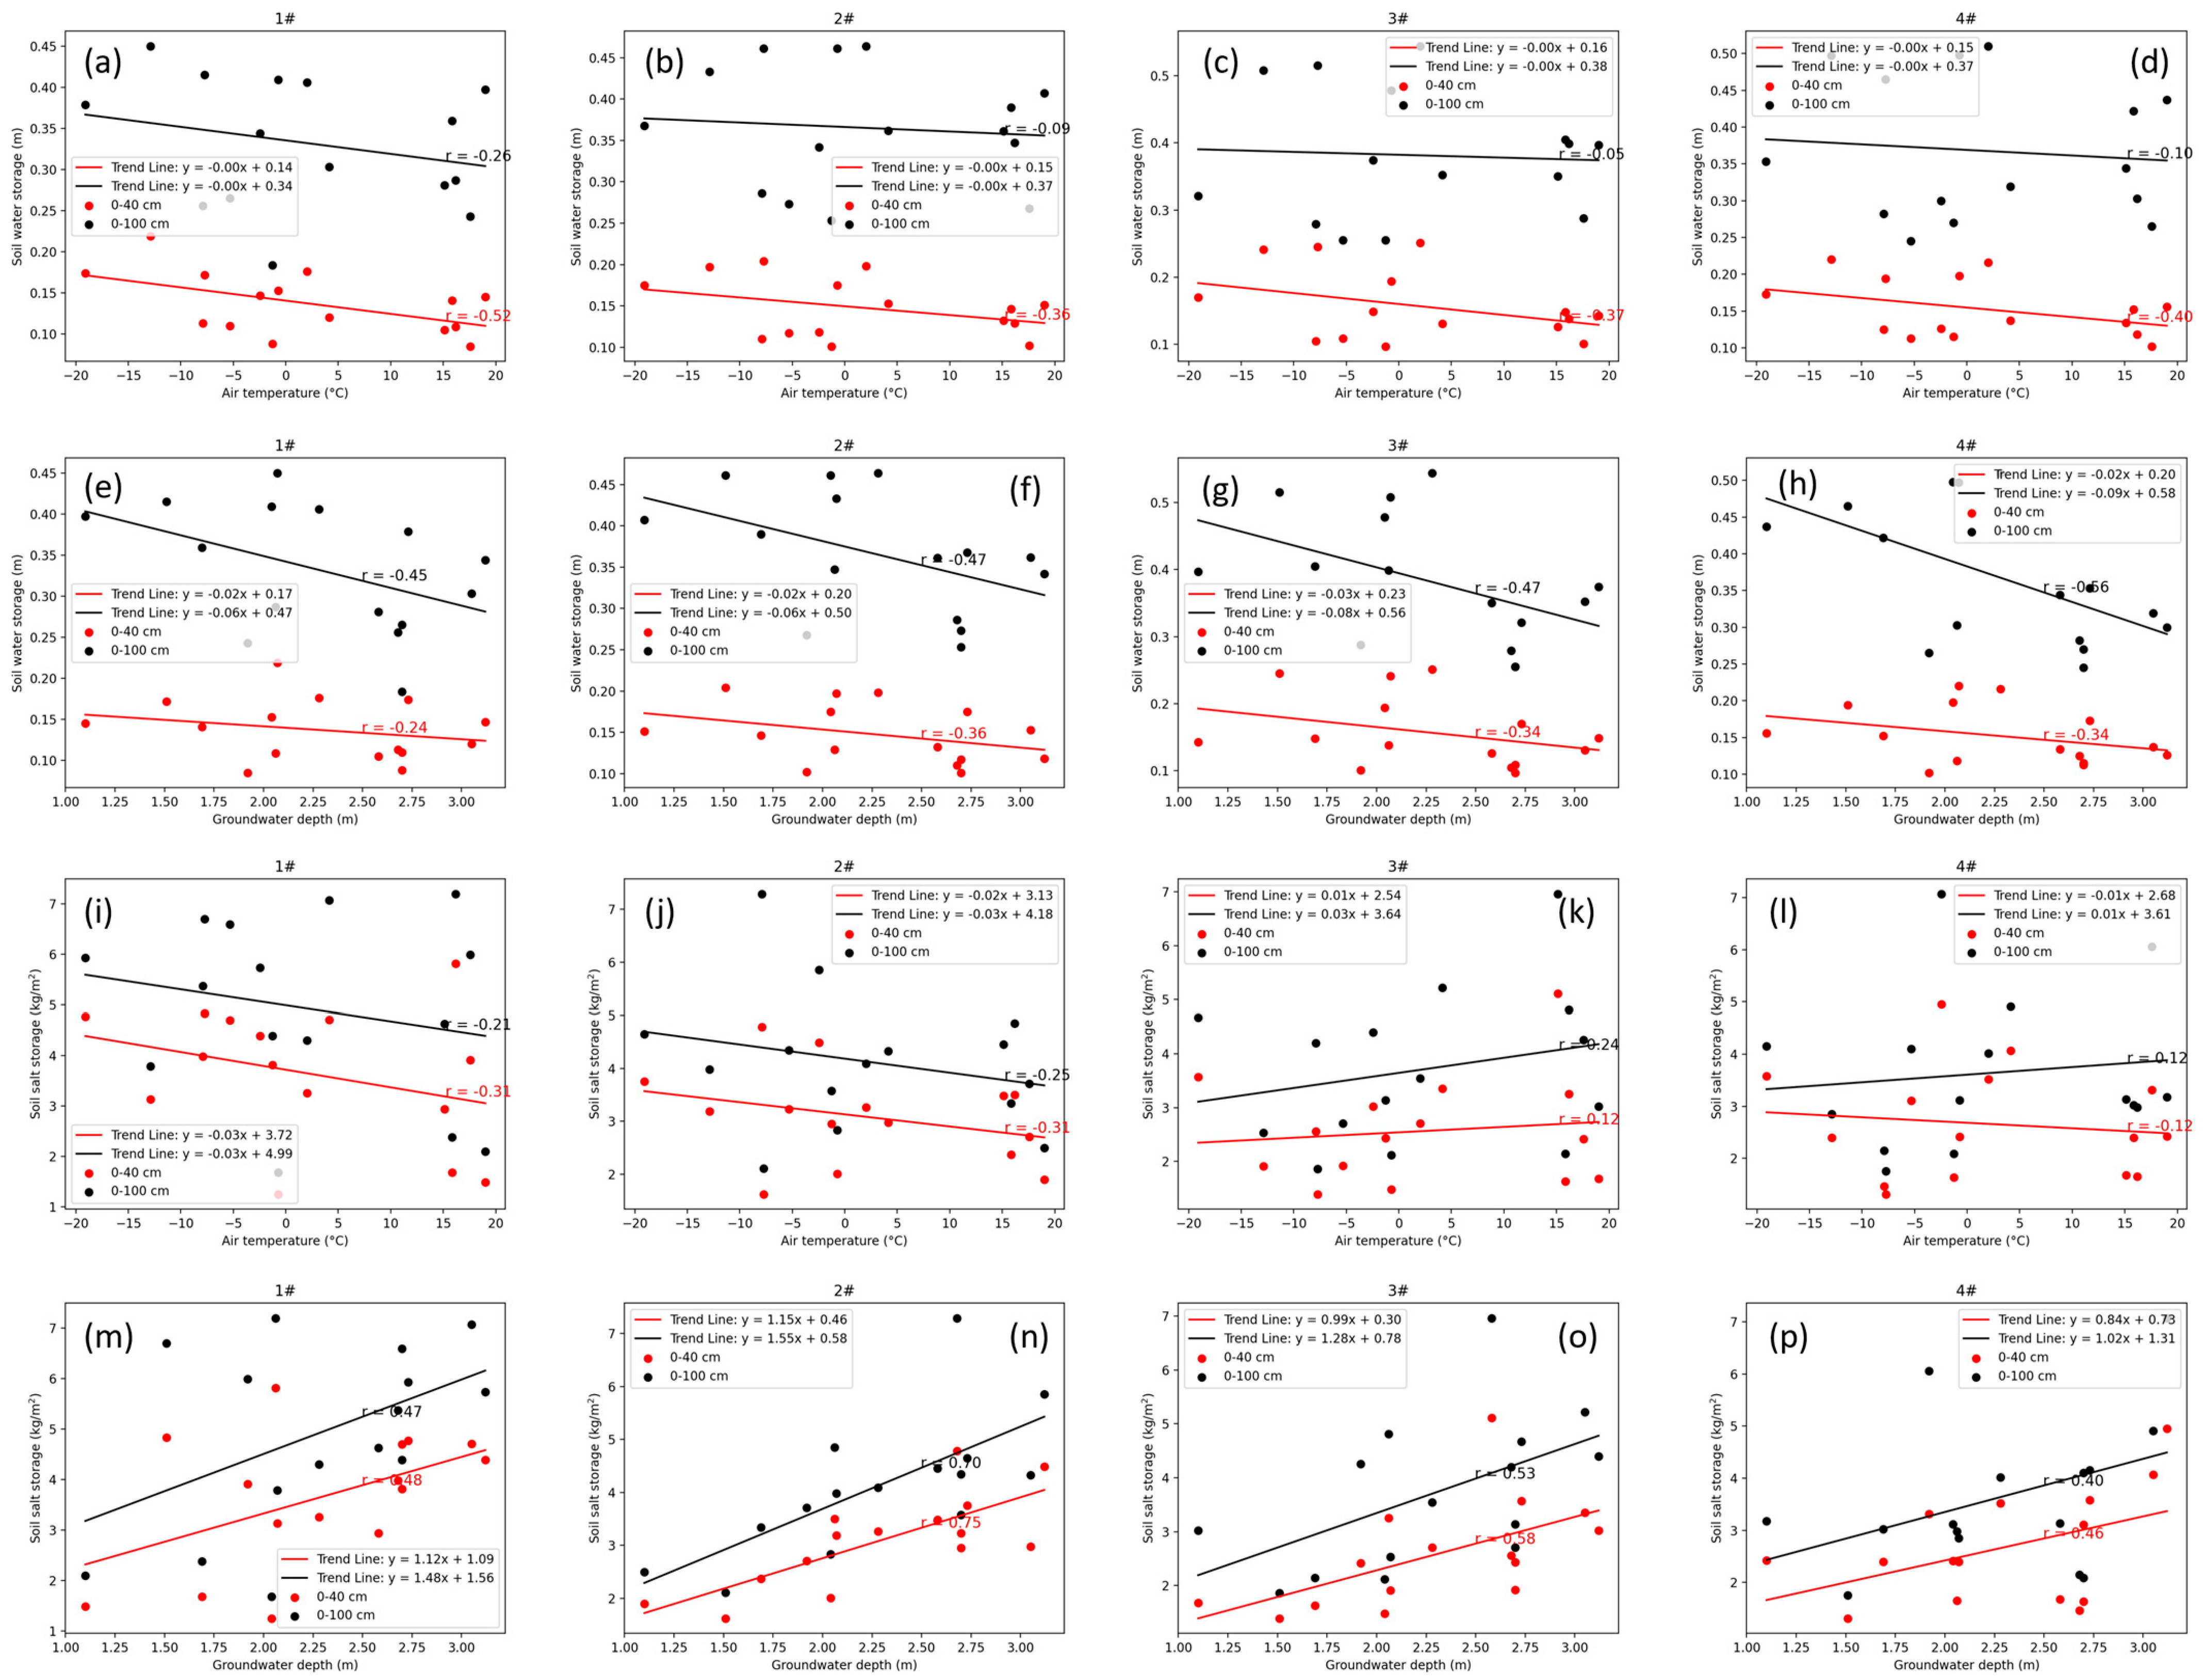
3.3. Contribution of Groundwater to the Soil Freezing–Thawing Dynamics Under AI
4. Conclusions
- (1)
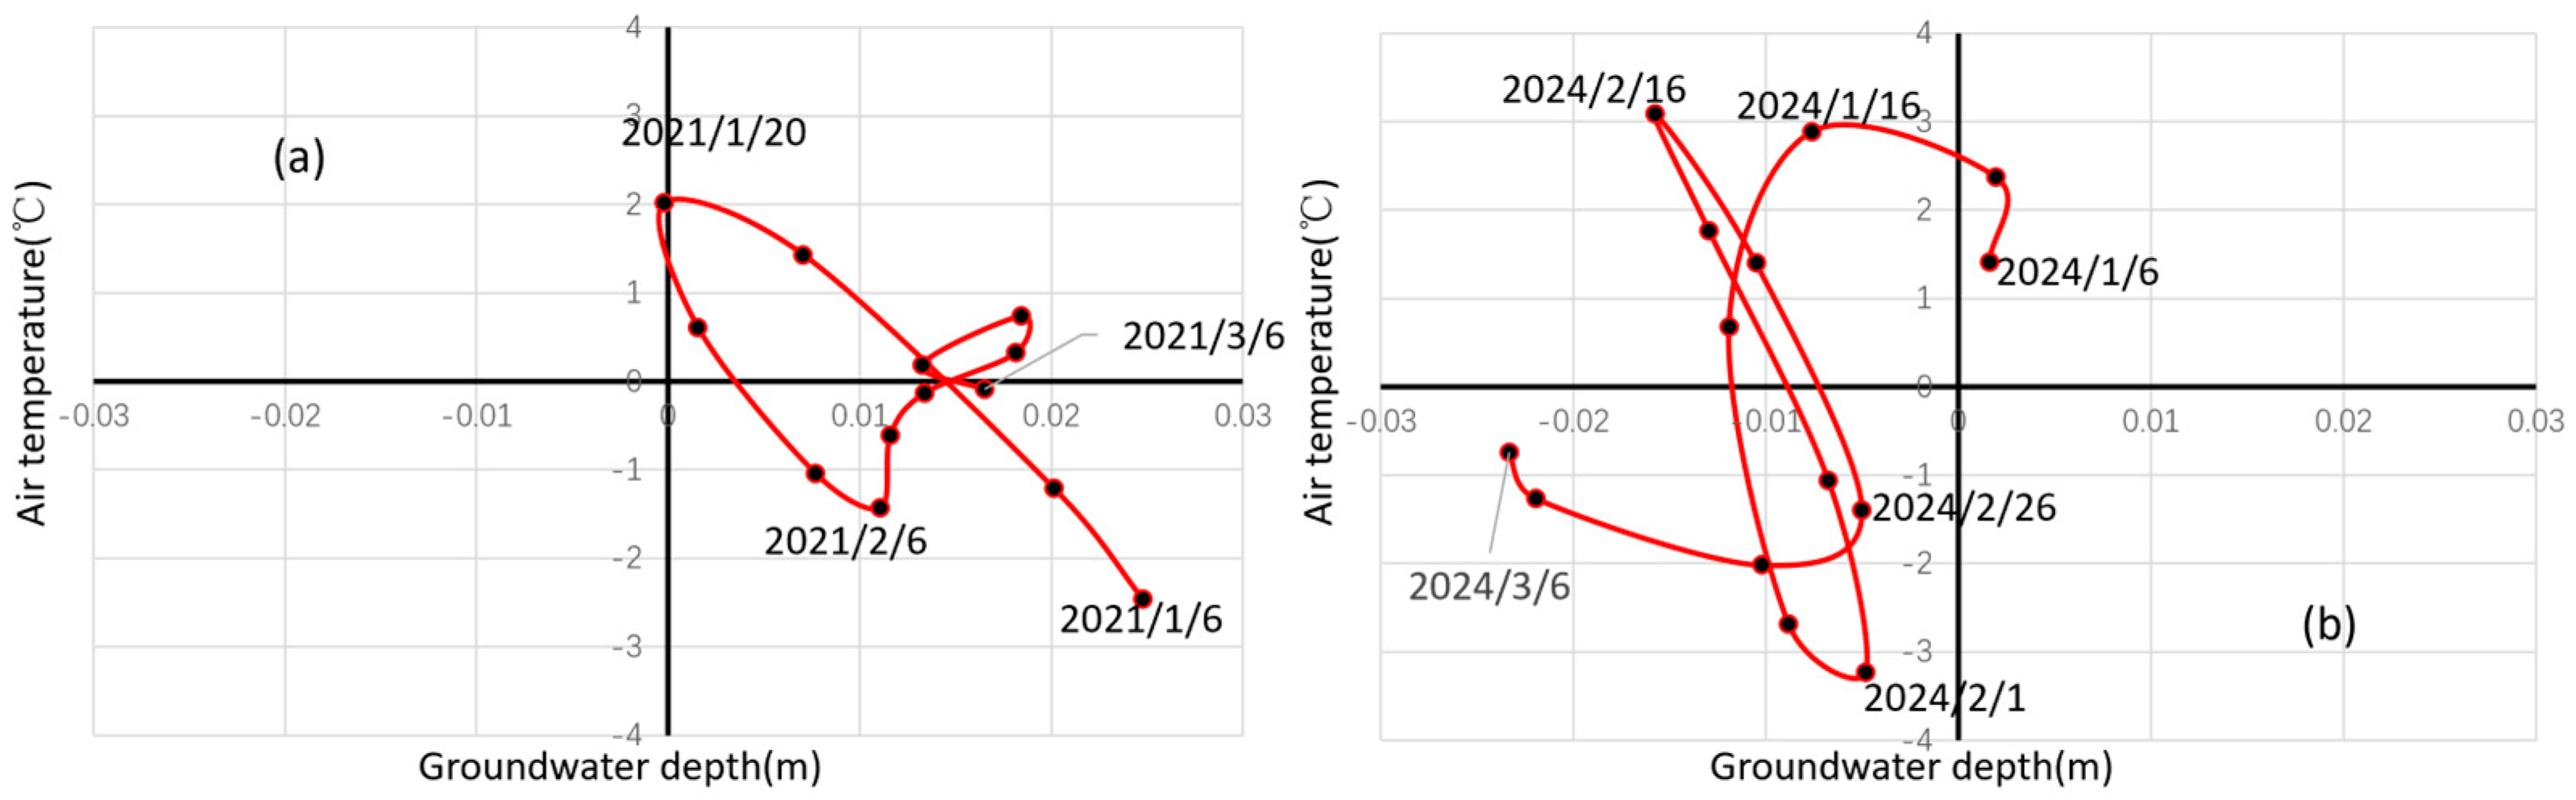
- The air temperature and groundwater dynamics are characterized by annual and seasonal variations, respectively. Air temperature and groundwater depth exhibit a strong negative correlation on a long-term scale, while the correlation is relatively weak on a short-term scale. Moreover, the correlation, whether long-term or short-term, weakens as the groundwater level decreases.
- (2)
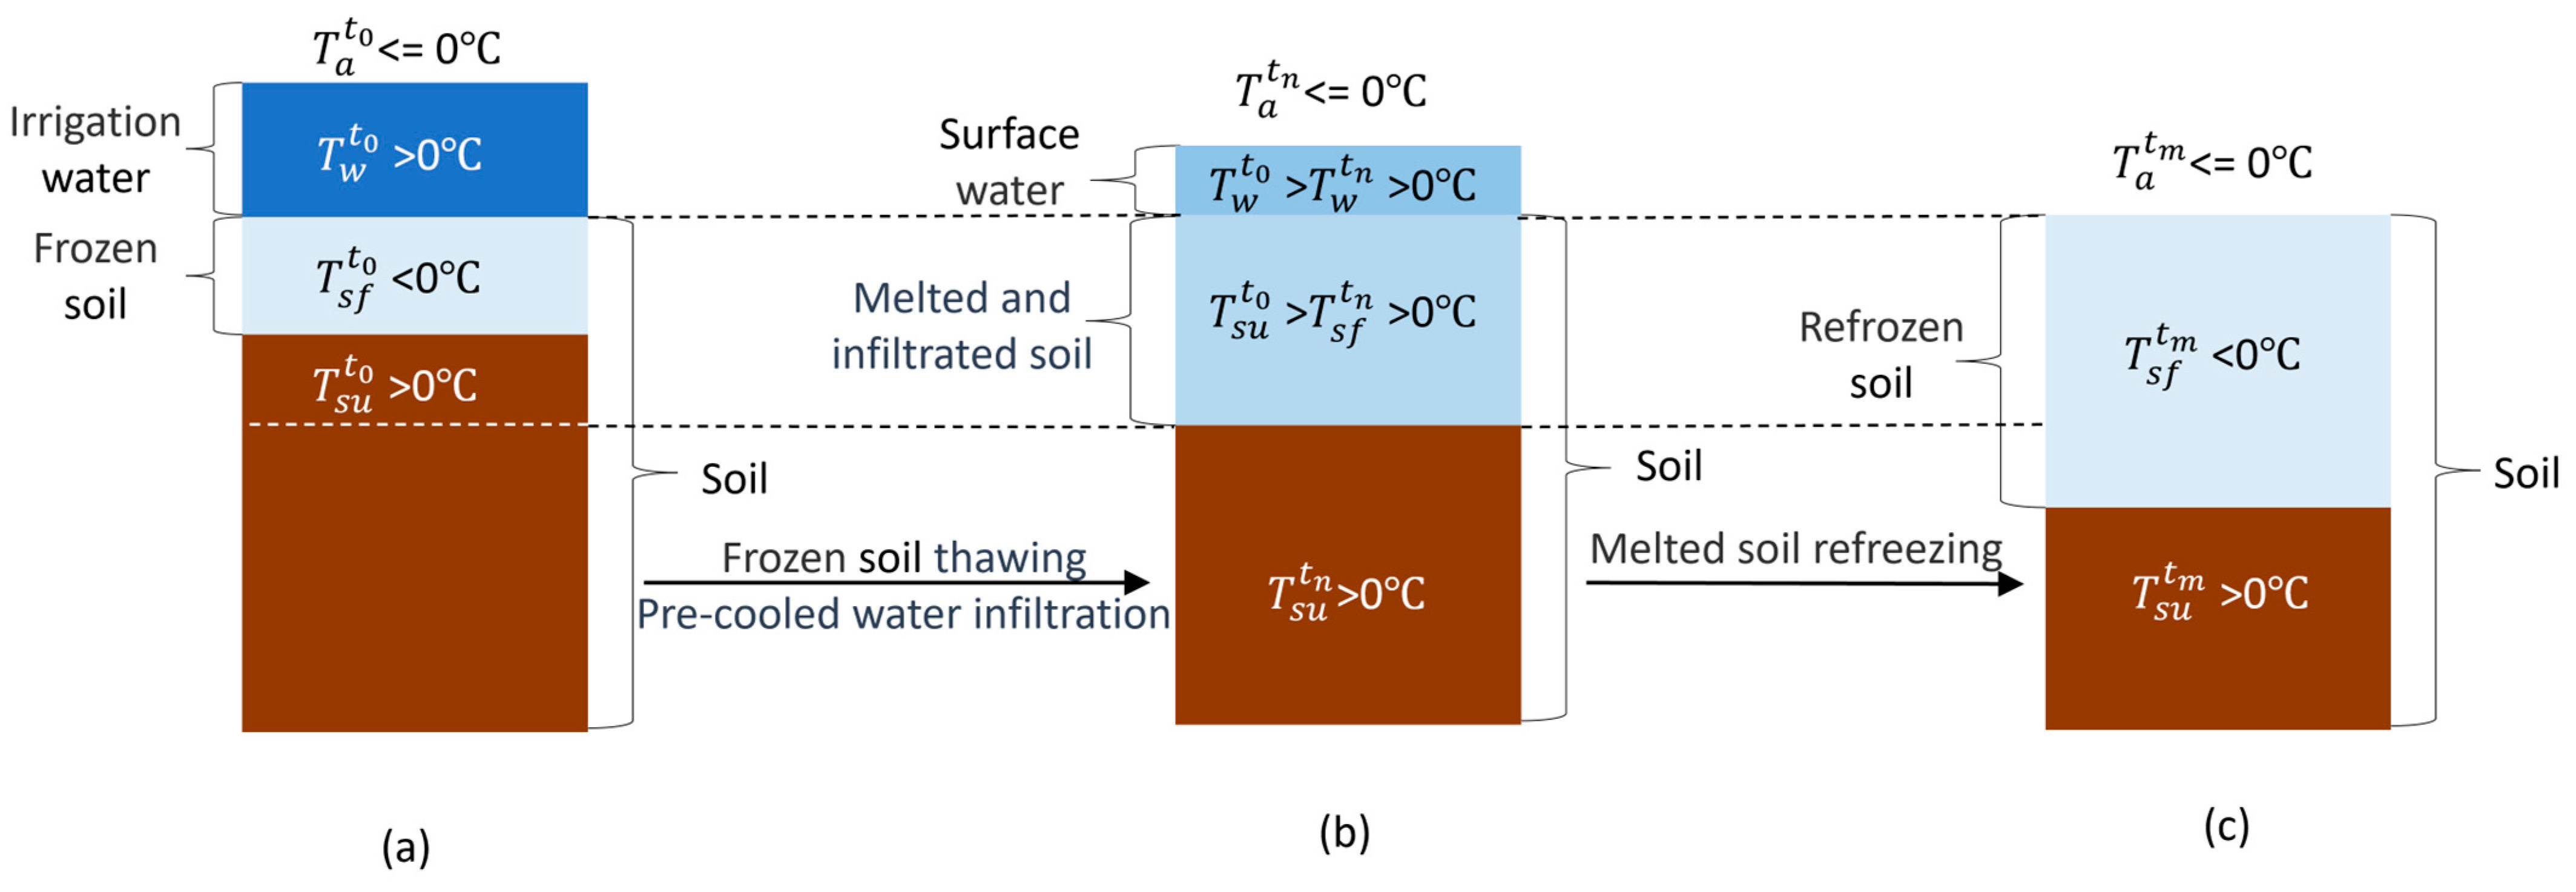
- The quota and air temperature during AI were the key factors in utilizing the “refrigerator effect”—where irrigation water pre-cooled by a frozen layer accelerates soil freezing—to regulate soil water and salt transport under freeze–thaw cycles.
- (3)
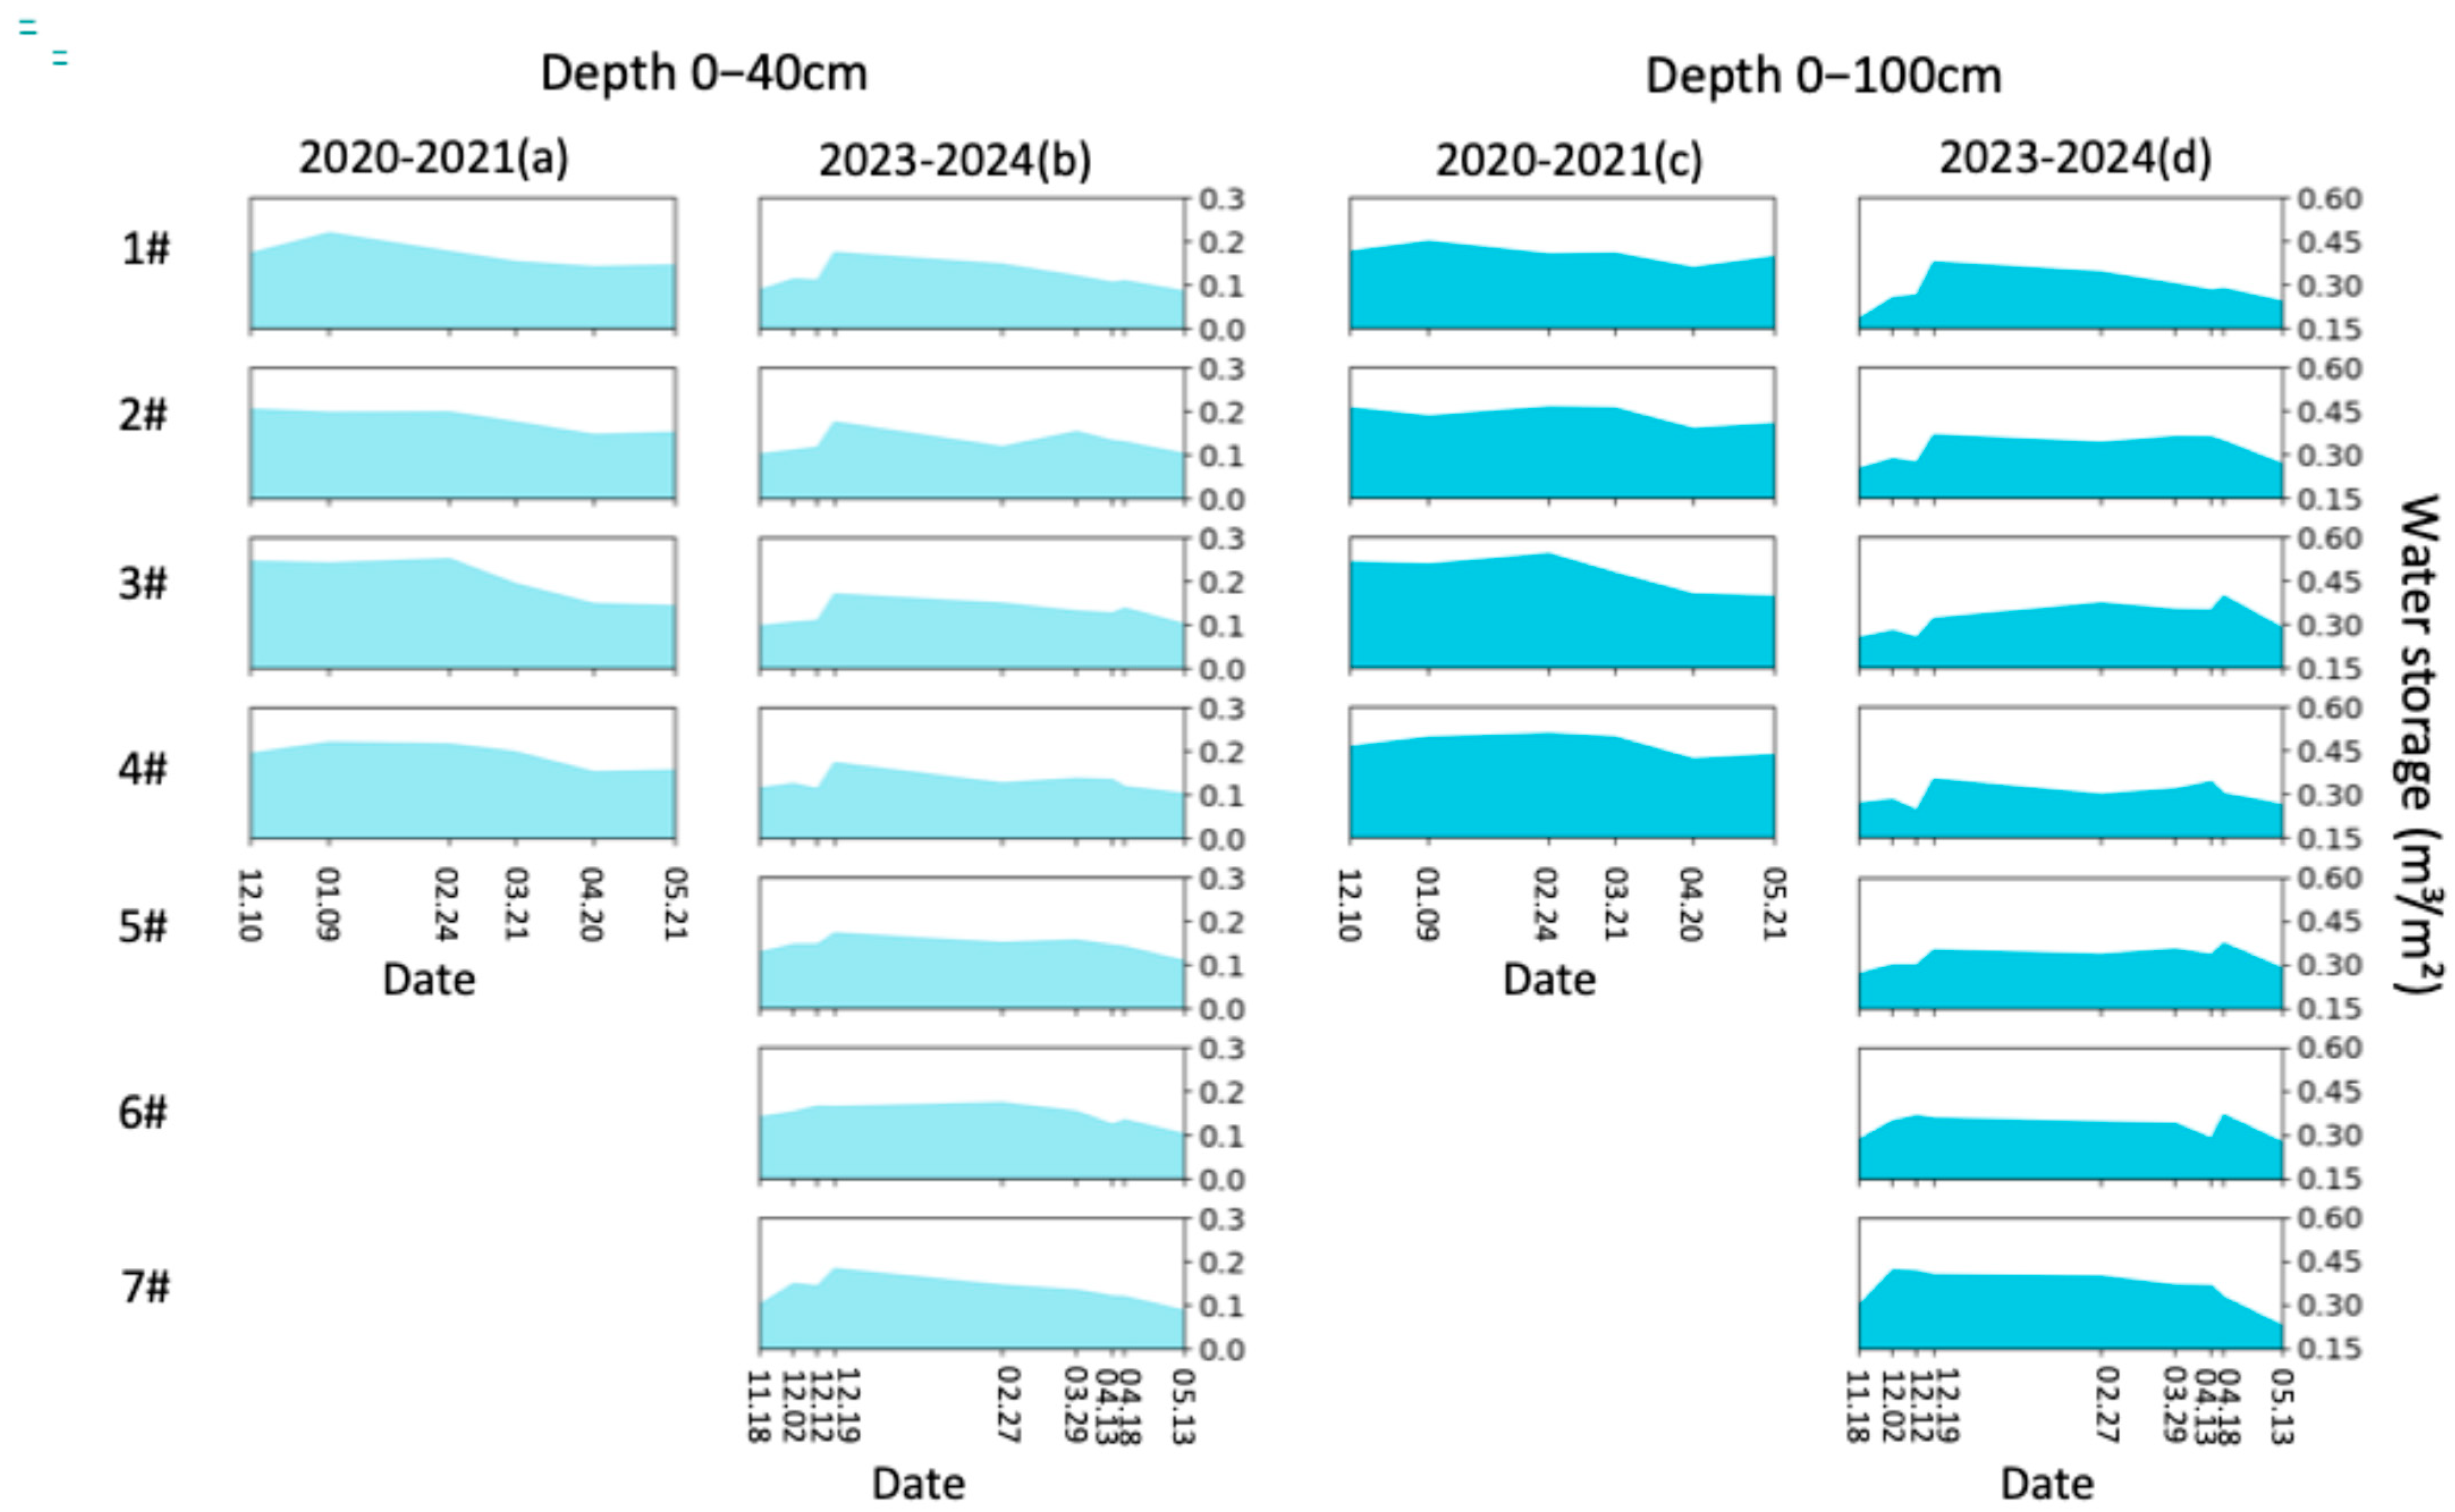
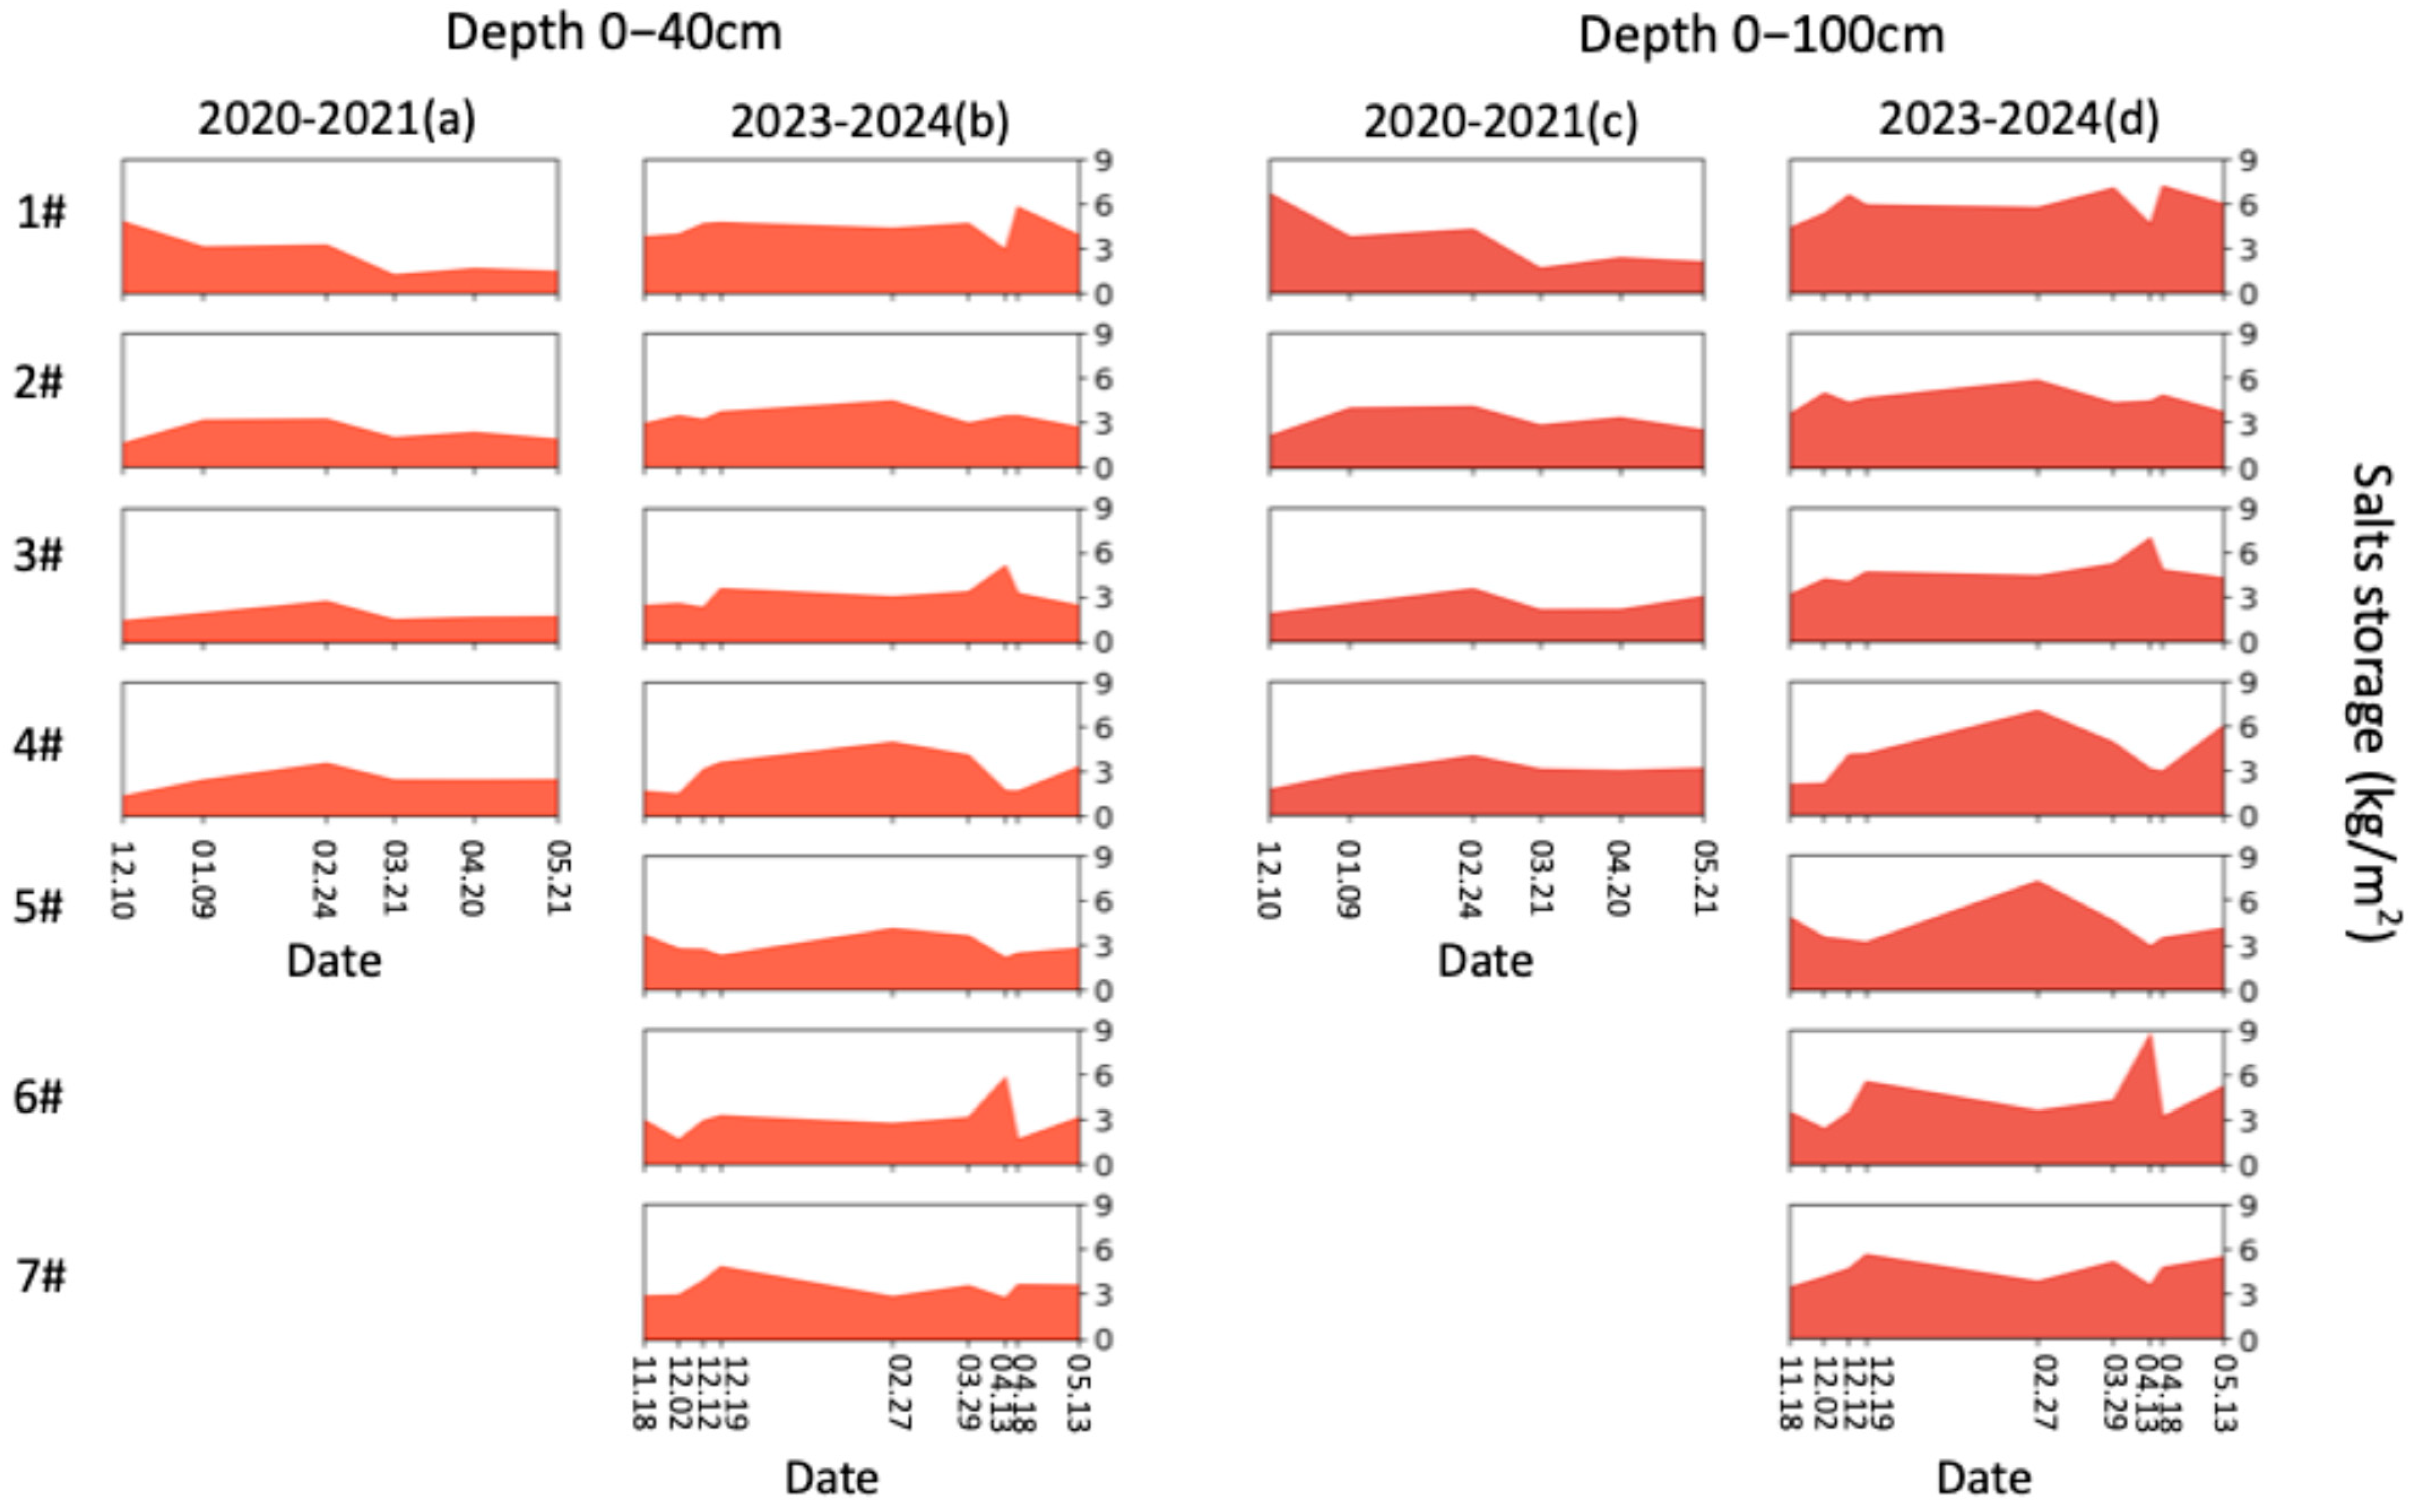
- Late AI with a quota of 35 mm achieved optimal water savings (significantly lower than the recommended quotas for early AI) while maintaining soil moisture (an increase of 17.4% in water storage) and reducing salinity (a decrease of 41.6% in salt storage) in the root zone (0–40 cm) through the “refrigerator effect”.
- (4)
- The lower the groundwater level and air temperature, the more pronounced the “refrigerator effect”, which enhances the water-saving, soil moisture retention, and salinity control benefits of icing AI.
Author Contributions
Funding
Data Availability Statement
Conflicts of Interest
Abbreviations
| AI | Autumn Multidisciplinary |
| AT | Air temperature |
| GD | Groundwater depth |
| MFD | Maximum frost depth |
| STG | Soil temperature gradient |
Appendix A

| Lysimeter | Soil Layer (cm) | Bulk Density (kg m−3) | Particle Size Distribution (%) | Texture | ||
|---|---|---|---|---|---|---|
| Sand | Silt | Clay | ||||
| 1# | 0–5 | 1368.3 | 28.43 | 65.50 | 6.07 | Silt loam |
| 5–10 | 1390.3 | 30.78 | 64.17 | 5.05 | Silt loam | |
| 10–20 | 1340.3 | 32.72 | 62.70 | 4.58 | Silt loam | |
| 20–30 | 1514.3 | 32.43 | 63.49 | 4.08 | Silt loam | |
| 30–40 | 1548.3 | 26.07 | 68.74 | 5.19 | Silt loam | |
| 40–60 | 1313.3 | 28.66 | 67.83 | 3.51 | Silt loam | |
| 60–80 | 1496.3 | 36.48 | 60.50 | 3.02 | Silt loam | |
| 80–100 | 1484.3 | 58.79 | 39.33 | 1.88 | Sandy loam | |
| 2# | 0–5 | 1518.3 | 23.33 | 70.22 | 6.45 | Silt loam |
| 5–10 | 1410.3 | 27.30 | 67.32 | 5.38 | Silt loam | |
| 10–20 | 1458.3 | 25.69 | 68.39 | 5.92 | Silt loam | |
| 20–30 | 1488.3 | 25.07 | 69.23 | 5.70 | Silt loam | |
| 30–40 | 1558.3 | 30.74 | 64.63 | 4.63 | Silt loam | |
| 40–60 | 1514.3 | 23.89 | 70.16 | 5.95 | Silt loam | |
| 60–80 | 1487.3 | 20.75 | 73.52 | 5.73 | Silt loam | |
| 80–100 | 1551.3 | 32.13 | 63.37 | 4.50 | Silt loam | |
| 3# | 0–5 | 1436.3 | 21.29 | 72.68 | 6.03 | Silt loam |
| 5–10 | 1436.3 | 21.14 | 72.36 | 6.50 | Silt loam | |
| 10–20 | 1406.3 | 20.16 | 73.48 | 6.36 | Silt loam | |
| 20–30 | 1523.3 | 19.27 | 74.18 | 6.55 | Silt loam | |
| 30–40 | 1599.3 | 21.02 | 72.56 | 6.42 | Silt loam | |
| 40–60 | 1592.6 | 21.15 | 73.06 | 5.79 | Silt loam | |
| 60–80 | 1619.3 | 19.29 | 75.06 | 5.65 | Silt loam | |
| 80–100 | 1467.3 | 35.54 | 60.80 | 3.66 | Sandy loam | |
| 4# | 0–5 | 1411.3 | 28.08 | 66.93 | 4.99 | Silt loam |
| 5–10 | 1449.3 | 28.47 | 66.82 | 4.71 | Silt loam | |
| 10–20 | 1446.3 | 31.10 | 64.69 | 4.16 | Silt loam | |
| 20–30 | 1499.3 | 23.24 | 71.47 | 5.29 | Silt loam | |
| 30–40 | 1469.3 | 16.80 | 76.68 | 6.46 | Silt loam | |
| 40–60 | 1419.3 | 13.67 | 81.71 | 4.62 | Silt loam | |
| 60–80 | 1502.3 | 26.80 | 69.65 | 3.45 | Silt loam | |
| 80–100 | 1455.3 | 57.40 | 40.83 | 1.83 | Sandy loam | |
| 5# | 0–5 | 1479.3 | 0.12 | 96.84 | 3.04 | Silt |
| 5–10 | 1471.3 | 0.14 | 97.15 | 2.71 | Silt | |
| 10–20 | 1497.3 | 0.00 | 95.89 | 4.11 | Silt | |
| 20–30 | 1327.3 | 0.00 | 97.03 | 2.97 | Silt | |
| 30–40 | 1482.3 | 0.00 | 95.62 | 4.38 | Silt | |
| 40–60 | 1456.3 | 0.00 | 96.41 | 3.59 | Silt | |
| 60–80 | 1434.3 | 0.20 | 97.93 | 1.87 | Silt | |
| 80–100 | 1441.3 | 0.23 | 98.14 | 1.63 | Silt | |
| 6# | 0–5 | 1453.3 | 0.12 | 96.97 | 2.91 | Silt |
| 5–10 | 1496.3 | 0.12 | 96.67 | 3.21 | Silt | |
| 10–20 | 1425.3 | 0.14 | 97.02 | 2.84 | Silt | |
| 20–30 | 1439.8 | 0.00 | 96.77 | 3.23 | Silt | |
| 30–40 | 1454.3 | 0.00 | 96.79 | 3.21 | Silt | |
| 40–60 | 1422.3 | 0.00 | 96.78 | 3.22 | Silt | |
| 60–80 | 1435.3 | 0.25 | 97.70 | 2.05 | Silt | |
| 80–100 | 1525.3 | 0.27 | 97.08 | 2.65 | Silt | |
| 7# | 0–5 | 1410.3 | 2.41 | 97.42 | 0.17 | Silt |
| 5–10 | 1380.3 | 3.08 | 96.92 | 0.00 | Silt | |
| 10–20 | 1434.3 | 3.13 | 96.87 | 0.00 | Silt | |
| 20–30 | 1494.3 | 2.82 | 97.18 | 0.00 | Silt | |
| 30–40 | 1411.3 | 2.18 | 97.70 | 0.12 | Silt | |
| 40–60 | 1406.3 | 1.68 | 98.20 | 0.12 | Silt | |
| 60–80 | 1403.3 | 1.71 | 98.29 | 0.00 | Silt | |
| 80–100 | 1473.3 | 2.22 | 97.78 | 0.00 | Silt | |
References
- Singh, P.K.; Chudasama, H. Pathways for Climate Change Adaptations in Arid and Semi-Arid Regions. J. Clean. Prod. 2021, 284, 124744. [Google Scholar] [CrossRef]
- Zong, R.; Wang, Z.; Li, W.; Ayantobo, O.O.; Li, H.; Song, L. Assessing the Impact of Seasonal Freezing and Thawing on the Soil Microbial Quality in Arid Northwest China. Sci. Total Environ. 2023, 863, 161029. [Google Scholar] [CrossRef] [PubMed]
- Daliakopoulos, I.N.; Tsanis, I.K.; Koutroulis, A.; Kourgialas, N.N.; Varouchakis, A.E.; Karatzas, G.P.; Ritsema, C.J. The Threat of Soil Salinity: A European Scale Review. Sci. Total Environ. 2016, 573, 727–739. [Google Scholar] [CrossRef] [PubMed]
- Wu, M.; Wu, J.; Tan, X.; Huang, J.; Jansson, P.-E.; Zhang, W. Simulation of Dynamical Interactions between Soil Freezing/Thawing and Salinization for Improving Water Management in Cold/Arid Agricultural Region. Geoderma 2019, 338, 325–342. [Google Scholar] [CrossRef]
- Zhang, D.; Wang, S. Mechanism of Freeze–Thaw Action in the Process of Soil Salinization in Northeast China. Environ. Geol. 2001, 41, 96–100. [Google Scholar] [CrossRef]
- Bai, R.; Lai, Y.; Zhang, M.; Jiang, H. Investigating the Thermo-Hydro-Mechanical Behavior of Loess Subjected to Freeze–Thaw Cycles. Acta Geotech. 2024, 19, 6305–6318. [Google Scholar] [CrossRef]
- Zhang, J.; Lai, Y.; Zhang, M.; You, Z.; Li, S.; Bai, R. Study on the Coupling Mechanism of Water-Heat-Vapor-Salt-Mechanics in Unsaturated Freezing Sulfate Saline Soil. Comput. Geotech. 2024, 169, 106232. [Google Scholar] [CrossRef]
- Li, R.; Shi, H.; Flerchinger, G.N.; Akae, T.; Wang, C. Simulation of Freezing and Thawing Soils in Inner Mongolia Hetao Irrigation District, China. Geoderma 2012, 173–174, 28–33. [Google Scholar] [CrossRef]
- Feng, Z.-Z.; Wang, X.-K.; Feng, Z.-W. Soil N and Salinity Leaching after the Autumn Irrigation and Its Impact on Groundwater in Hetao Irrigation District, China. Agric. Water Manag. 2005, 71, 131–143. [Google Scholar] [CrossRef]
- Xiong, L.; Xu, X.; Engel, B.; Xiong, Y.; Huang, Q.; Huang, G. Predicting Agroecosystem Responses to Identify Appropriate Water-Saving Management in Arid Irrigated Regions with Shallow Groundwater: Realization on a Regional Scale. Agric. Water Manag. 2021, 247, 106713. [Google Scholar] [CrossRef]
- Gao, X.; Huo, Z.; Bai, Y.; Feng, S.; Huang, G.; Shi, H.; Qu, Z. Soil Salt and Groundwater Change in Flood Irrigation Field and Uncultivated Land: A Case Study Based on 4-Year Field Observations. Environ. Earth Sci. 2015, 73, 2127–2139. [Google Scholar] [CrossRef]
- Lu, X.; Li, R.; Shi, H.; Liang, J.; Miao, Q.; Fan, L. Successive Simulations of Soil Water-Heat-Salt Transport in One Whole Year of Agriculture after Different Mulching Treatments and Autumn Irrigation. Geoderma 2019, 344, 99–107. [Google Scholar] [CrossRef]
- Wen, Y.; Shang, S.; Rahman, K.U.; Xia, Y.; Ren, D. A Semi-Distributed Drainage Model for Monthly Drainage Water and Salinity Simulation in a Large Irrigation District in Arid Region. Agric. Water Manag. 2020, 230, 105962. [Google Scholar] [CrossRef]
- Li, R.; Shi, H.; Flerchinger, G.N.; Zou, C.; Li, Z. Modeling the Effect of Antecedent Soil Water Storage on Water and Heat Status in Seasonally Freezing and Thawing Agricultural Soils. Geoderma 2013, 206, 70–74. [Google Scholar] [CrossRef]
- Li, R.; Shi, H.; Zhang, Y.; Zhang, X.; Flerchinger, G.N. Scheme of Water Saving Irrigation in Autumn Based on SHAW Model in Inner Mongolia Hetao Irrigation District. Trans. Chin. Soc. Agric. Eng. (Trans. CSAE) 2010, 26, 31–36. (In Chinese) [Google Scholar]
- Liu, J.; Huang, Q.; Li, Z.; Liu, N.; Li, J.; Huang, G. Effect of Autumn Irrigation on Salt Leaching under Subsurface Drainage in an Arid Irrigation District. Water 2023, 15, 2296. [Google Scholar] [CrossRef]
- Sun, G.; Zhu, Y.; Mao, W.; Li, Y.; Yang, J.; Gao, Z. Development and Application of a Monthly Water and Salt Balance Model for Seasonally Frozen Agricultural and Non-Agricultural Areas with Shallow Groundwater Table. CATENA 2024, 235, 107701. [Google Scholar] [CrossRef]
- Ramos, T.B.; Liu, M.; Paredes, P.; Shi, H.; Feng, Z.; Lei, H.; Pereira, L.S. Salts Dynamics in Maize Irrigation in the Hetao Plateau Using Static Water Table Lysimeters and HYDRUS-1D with Focus on the Autumn Leaching Irrigation. Agric. Water Manag. 2023, 283, 108306. [Google Scholar] [CrossRef]
- Xu, X.; Huang, G.; Qu, Z.; Pereira, L.S. Assessing the Groundwater Dynamics and Impacts of Water Saving in the Hetao Irrigation District, Yellow River Basin. Agric. Water Manag. 2010, 98, 301–313. [Google Scholar] [CrossRef]
- Wu, M.; Huang, J.; Wu, J.; Tan, X.; Jansson, P.-E. Experimental Study on Evaporation from Seasonally Frozen Soils under Various Water, Solute and Groundwater Conditions in Inner Mongolia, China. J. Hydrol. 2016, 535, 46–53. [Google Scholar] [CrossRef]
- Xiong, L.; Jiang, Y.; Li, X.; Ren, D.; Huang, G. Long-Term Regional Groundwater Responses and Their Ecological Impacts under Agricultural Water Saving in an Arid Irrigation District, Upper Yellow River Basin. Agric. Water Manag. 2023, 288, 108493. [Google Scholar] [CrossRef]
- Tan, X.; Wu, J.; Wu, M.; Huang, J.; Tan, B.; Li, L. Effects of Ice Cover on Soil Water, Heat, and Solute Movement: An Experimental Study. Geoderma 2021, 403, 115209. [Google Scholar] [CrossRef]
- Guo, G.; Tan, X.; He, Y.; Guo, J.; Yu, J.; Zhuang, W.; Liu, C. Transport of Heat, Water, and Salts in Freeze–Thaw Soils under Flood Irrigation: Experiment and Simulation. J. Hydrol. 2025, 652, 132688. [Google Scholar] [CrossRef]
- Scibek, J.; Allen, D.M. Modeled Impacts of Predicted Climate Change on Recharge and Groundwater Levels. Water Resour. Res. 2006, 42. [Google Scholar] [CrossRef]
- Wu, Z.; Huang, N.E. Ensemble Empirical Mode Decomposition: A Noise-Assisted Data Analysis Method. Adv. Adapt. Data Anal. 2009, 1, 1–41. [Google Scholar] [CrossRef]
- Seltman, H. Chapter 11: Two-Way ANOVA; Carnegie Mellon University: Pittsburgh, PA, USA, 2024. [Google Scholar]
- Fu, C.; Xue, J.; Chen, J.; Cui, L.; Wang, H. Evaluating Spatial and Temporal Variations of Soil Water, Heat, and Salt under Autumn Irrigation in the Hetao Irrigation District Based on Distributed SHAW Model. Agric. Water Manag. 2024, 293, 108707. [Google Scholar] [CrossRef]
- Watanabe, K.; Kito, T.; Dun, S.; Wu, J.Q.; Greer, R.C.; Flury, M. Water Infiltration into a Frozen Soil with Simultaneous Melting of the Frozen Layer. Vadose Zone J. 2013, 12, vzj2011.0188. [Google Scholar] [CrossRef]
- Dou, X.; Shi, H.; Li, R.; Miao, Q.; Tian, F.; Yu, D.; Zhou, L.; Wang, B. Effects of Controlled Drainage on the Content Change and Migration of Moisture, Nutrients, and Salts in Soil and the Yield of Oilseed Sunflower in the Hetao Irrigation District. Sustainability 2021, 13, 9835. [Google Scholar] [CrossRef]
- Ren, D.; Wei, B.; Xu, X.; Engel, B.; Li, G.; Huang, Q.; Xiong, Y.; Huang, G. Analyzing Spatiotemporal Characteristics of Soil Salinity in Arid Irrigated Agro-Ecosystems Using Integrated Approaches. Geoderma 2019, 356, 113935. [Google Scholar] [CrossRef]


| Term | Position | Duration | Frequency |
|---|---|---|---|
| Meteorological data (air temperature, wind speed, humidity, air pressure, precipitation, radiation) | Meteorological station (Figure 1) | July 2020–June 2024 | Hourly |
| Total soil water content (cm3 cm−3) and soil salt content (g 100 g−1) | Lysimeter 1–7# (Figure 1) | 10 December 2020, 9 January, 24 February, 21 March, 20 April, 21 May 2021 (1–4#) and 18 November, 2 December, 12 December, 19 December 2023, 27 February, 29 March, 13 April, 18 April, 13 May 2024 (1–7#) | Specific day |
| Soil temperature (°C) | December 2020–May 2021 November 2023–May 2024 | Hourly | |
| Groundwater depth (m) | Groundwater observation well (Figure 1) | July 2020–June 2024 | Once every 5 days |
| Lysimeter | Depth (cm) | Freezing Timing | Freezing Rate (cm/day) | Thawing Timing | Thawing Rate (cm/day) | Frozen Duration (Day) |
| 4# | 5 | 2020/12/10 (2023/11/23) | - | 2021/3/13 (2024/3/18) | - | 93(116) |
| 10 | 2020/12/10 (2023/11/28) | 15.00(1.00) | 2021/3/16 (2024/3/19) | 1.67(5.00) | 96(112) | |
| 20 | 2020/12/10 (2023/12/16) | 15.00(0.56) | 2021/3/21 (2024/3/22) | 2.00(3.33) | 101(97) | |
| 30 | 2020/12/16 (2023/12/22) | 1.67(1.67) | 2021/3/24 (2024/3/30) | 3.33(1.25) | 98(99) | |
| 40 | 2020/12/24 (2023/12/29) | 1.25(1.43) | 2021/3/31 (2024/4/4) | 1.43(2.00) | 97(97) | |
| 60 | 2021/1/9 (2024/1/27) | 1.25(0.69) | 2021/4/3 (2024/3/31) | 6.67(–5.00) | 84(64) | |
| 80 | - | - | - | - | - | |
| 100 | - | - | - | - | - | |
| 1# | 5 | 2020/12/14 (2023/11/22) | - | 2021/3/21 (2024/3/21) | - | 97(120) |
| 10 | 2020/12/17 (2023/11/22) | 1.67(5.00) | 2021/3/21 (2024/3/21) | 5.00(25.00) | 94(120) | |
| 20 | 2020/12/19 (2023/11/29) | 5.00(1.43) | 2021/3/22 (2024/3/21) | 10.00(25.00) | 93(113) | |
| 30 | 2020/12/25 (2023/12/18) | 1.67(0.53) | 2021/3/22 (2024/3/21) | 10.00(25.00) | 87(94) | |
| 40 | 2021/1/4 (2023/12/23) | 1.00(2.00) | 2021/3/23 (2024/3/26) | 10.00(2.00) | 78(94) | |
| 60 | 2021/1/12 (2024/1/13) | 2.50(0.95) | 2021/4/2 (2024/4/5) | 2.00(2.00) | 80(83) | |
| 80 | 2021/2/11 | 0.67 | 2021/4/3 | 20.00 | 51 | |
| 100 | - | - | - | - | - | |
| 2# | 5 | 2020/12/10 (2023/11/23) | - | 2021/3/7 (2024/3/5) | - | 87(103) |
| 10 | 2020/12/10 (2023/11/23) | 15.00(5.00) | 2021/3/21 (2024/3/13) | 0.36(0.63) | 101(111) | |
| 20 | 2020/12/10 (2023/11/29) | 15.00(1.67) | 2021/3/22 (2024/3/20) | 10.00(1.43) | 102(112) | |
| 30 | 2020/12/29 (2023/12/14) | 0.53(0.67) | 2021/3/23 (2024/3/20) | 10.00(40.00) | 84(97) | |
| 40 | 2021/1/1 (2023/12/23) | 3.33(1.11) | 2021/3/25 (2024/3/20) | 5.00(40.00) | 83(88) | |
| 60 | 2021/1/11 (2024/1/20) | 2.00(0.71) | 2021/4/3 (2024/3/20) | 2.22(40.00) | 82(60) | |
| 80 | 2021/1/20 (2024/2/2) | 2.22(1.54) | 2021/4/4 (2024/3/30) | 20.00(2.00) | 74(57) | |
| 100 | - | - | - | - | - | |
| 3# | 5 | 2020/12/10 (2023/11/23) | - | 2021/3/7 (2024/3/22) | - | 87(120) |
| 10 | 2020/12/10 (2023/11/23) | 15.00(5.00) | 2021/3/22 (2024/3/22) | 0.33(5.00) | 102(120) | |
| 20 | 2020/12/10 (2023/12/1) | 15.00(1.25) | 2021/3/23 (2024/3/24) | 10.00(5.00) | 103(114) | |
| 30 | 2020/12/17 (2023/12/18) | 1.43(0.59) | 2021/3/23 (2024/3/27) | 10.00(3.33) | 96(100) | |
| 40 | 2020/12/29 (2023/12/23) | 0.83(2.00) | 2021/3/25 (2024/4/1) | 5.00(2.00) | 86(100) | |
| 60 | 2021/1/15 (2024/1/11) | 1.18(1.05) | 2021/3/31 (2024/4/9) | 3.33(2.50) | 75(89) | |
| 80 | (2024/2/10) | (0.67) | (2024/4/10) | (20.00) | (60) | |
| 100 | - | - | - | - | - | |
| 7# | 5 | 2023/11/23 | - | 2024/3/12 | - | 110 |
| 10 | 2023/11/24 | 5.00 | 2024/3/20 | 0.63 | 117 | |
| 20 | 2023/11/26 | 5.00 | 2024/3/22 | 5.00 | 117 | |
| 30 | 2023/12/10 | 0.71 | 2024/3/22 | 5.00 | 103 | |
| 40 | 2023/12/14 | 2.50 | 2024/3/29 | 1.43 | 106 | |
| 60 | 2023/12/21 | 2.86 | 2024/4/8 | 2.00 | 109 | |
| 80 | 2024/1/26 | 0.56 | 2024/4/17 | 2.22 | 82 | |
| 100 | - | - | - | - | - | |
| 6# | 5 | 2023/11/18 | - | 2024/3/20 | - | 123 |
| 10 | 2023/11/28 | 0.50 | 2024/3/20 | 5.00 | 113 | |
| 20 | 2023/11/29 | 10.00 | 2024/3/22 | 5.00 | 114 | |
| 30 | 2023/12/1 | 5.00 | 2024/3/24 | 5.00 | 114 | |
| 40 | 2023/12/5 | 2.50 | 2024/3/29 | 2.00 | 115 | |
| 60 | 2024/1/4 | 0.67 | 2024/4/4 | 3.33 | 91 | |
| 80 | 2024/1/31 | 0.74 | 2024/4/5 | 20.00 | 65 | |
| 100 | - | - | - | - | - | |
| 5# | 5 | 2023/11/18 | - | 2024/3/12 | - | 115 |
| 10 | 2023/11/18 | 5.00 | 2024/3/22 | 0.50 | 125 | |
| 20 | 2023/11/25 | 1.43 | 2024/3/29 | 1.43 | 125 | |
| 30 | 2023/12/5 | 1.00 | 2024/3/29 | 10.00 | 115 | |
| 40 | 2023/12/22 | 0.59 | 2024/3/30 | 10.00 | 99 | |
| 60 | 2024/1/5 | 1.43 | 2024/4/9 | 2.00 | 95 | |
| 80 | 2024/1/31 | 0.77 | 2024/4/10 | 20.00 | 70 | |
| 100 | - | - | - | - | - |
| Lysimeter | Soil Layer | 2020–2021 QS (g 100 g−1 Month−1) | 2023–2024 QS (g 100 g−1 Month−1) | ||
|---|---|---|---|---|---|
| Freezing Period December 2020–March 2021 | Thawing Period March 2021–April 2021 | Freezing Period December 2023–March 2024 | Thawing Period March 2024–April 2024 | ||
| 1# | 0–40 cm | 1.07 | −0.43 | 0.12 | 0.95 |
| 0–100 cm | 1.49 | −0.70 | 0.34 | 0.72 | |
| 2# | 0–40 cm | −0.12 | −0.35 | −0.49 | 0.66 |
| 0–100 cm | −0.21 | −0.51 | −0.59 | 0.91 | |
| 3# | 0–40 cm | −0.03 | −0.15 | −0.43 | −1.36 |
| 0–100 cm | −0.08 | −0.02 | −0.66 | −1.67 | |
| 4# | 0–40 cm | −0.33 | 0.01 | −0.72 | 2.14 |
| 0–100 cm | −0.41 | 0.10 | −1.16 | 2.57 | |
| 5# | 0–40 cm | / | / | −0.54 | 1.28 |
| 0–100 cm | / | / | −1.55 | 2.85 | |
| 6# | 0–40 cm | / | / | 0.08 | −2.00 |
| 0–100 cm | / | / | −0.03 | −3.34 | |
| 7# | 0–40 cm | / | / | 0.42 | 0.06 |
| 0–100 cm | / | / | 0.34 | 0.17 | |
| Lysimeter | Soil Layer | Dependent Variable | Water Storage | Salt Storage | ||||
|---|---|---|---|---|---|---|---|---|
| Main Effect | GD | AT | GD × AT | GD | AT | GD × AT | ||
| 1# | 0–40 cm | F value | 0.79 | 5.36 | 0.43 | 1.51 | 8.12 | 0.81 |
| Significance | ns | * | ns | ns | ns | |||
| 0–100 cm | F value | 1.81 | 10.34 | 0.86 | 1.62 | 5.62 | 0.92 | |
| Significance | ns | ** | ns | ns | * | ns | ||
| 2# | 0–40 cm | F value | 0.41 | 6.29 | 0.27 | 1.93 | 10.31 | 0.99 |
| Significance | ns | * | ns | ns | ** | ns | ||
| 0–100 cm | F value | 0.78 | 7.04 | 0.36 | 1.35 | 5.69 | 0.91 | |
| Significance | ns | * | ns | ns | * | ns | ||
| 3# | 0–40 cm | F value | 0.51 | 7.29 | 0.37 | 1.78 | 9.07 | 0.89 |
| Significance | ns | ** | ns | ns | ** | ns | ||
| 0–100 cm | F value | 0.99 | 9.38 | 0.53 | 1.56 | 6.21 | 1.06 | |
| Significance | ns | ** | ns | ns | * | ns | ||
| 4# | 0–40 cm | F value | 0.45 | 6.72 | 0.29 | 1.75 | 9.04 | 0.95 |
| Significance | ns | * | ns | ns | ** | ns | ||
| 0–100 cm | F value | 0.87 | 8.04 | 0.44 | 1.61 | 6.71 | 1.15 | |
| Significance | ns | ** | ns | ns | * | ns | ||
Disclaimer/Publisher’s Note: The statements, opinions and data contained in all publications are solely those of the individual author(s) and contributor(s) and not of MDPI and/or the editor(s). MDPI and/or the editor(s) disclaim responsibility for any injury to people or property resulting from any ideas, methods, instructions or products referred to in the content. |
© 2025 by the authors. Licensee MDPI, Basel, Switzerland. This article is an open access article distributed under the terms and conditions of the Creative Commons Attribution (CC BY) license (https://creativecommons.org/licenses/by/4.0/).
Share and Cite
Yang, Z.; Tan, X.; Chen, A.; Xu, Y.; Zhang, Y.; Zhuang, W. The Effect of Autumn Irrigation on the Water, Heat, and Salt Transport in Seasonally Frozen Soils Under Varying Groundwater Levels. Water 2025, 17, 1049. https://doi.org/10.3390/w17071049
Yang Z, Tan X, Chen A, Xu Y, Zhang Y, Zhuang W. The Effect of Autumn Irrigation on the Water, Heat, and Salt Transport in Seasonally Frozen Soils Under Varying Groundwater Levels. Water. 2025; 17(7):1049. https://doi.org/10.3390/w17071049
Chicago/Turabian StyleYang, Zhiyu, Xiao Tan, Aiping Chen, Yang Xu, Yang Zhang, and Wenhua Zhuang. 2025. "The Effect of Autumn Irrigation on the Water, Heat, and Salt Transport in Seasonally Frozen Soils Under Varying Groundwater Levels" Water 17, no. 7: 1049. https://doi.org/10.3390/w17071049
APA StyleYang, Z., Tan, X., Chen, A., Xu, Y., Zhang, Y., & Zhuang, W. (2025). The Effect of Autumn Irrigation on the Water, Heat, and Salt Transport in Seasonally Frozen Soils Under Varying Groundwater Levels. Water, 17(7), 1049. https://doi.org/10.3390/w17071049