
Economic Operation Scheme of Cascade Pump Station Group Under the Power Market Situation—Taking the Yellow River to Qingdao Project as an Example

Abstract
1. Introduction
2. Study Area and Data
2.1. Study Area
- (1)
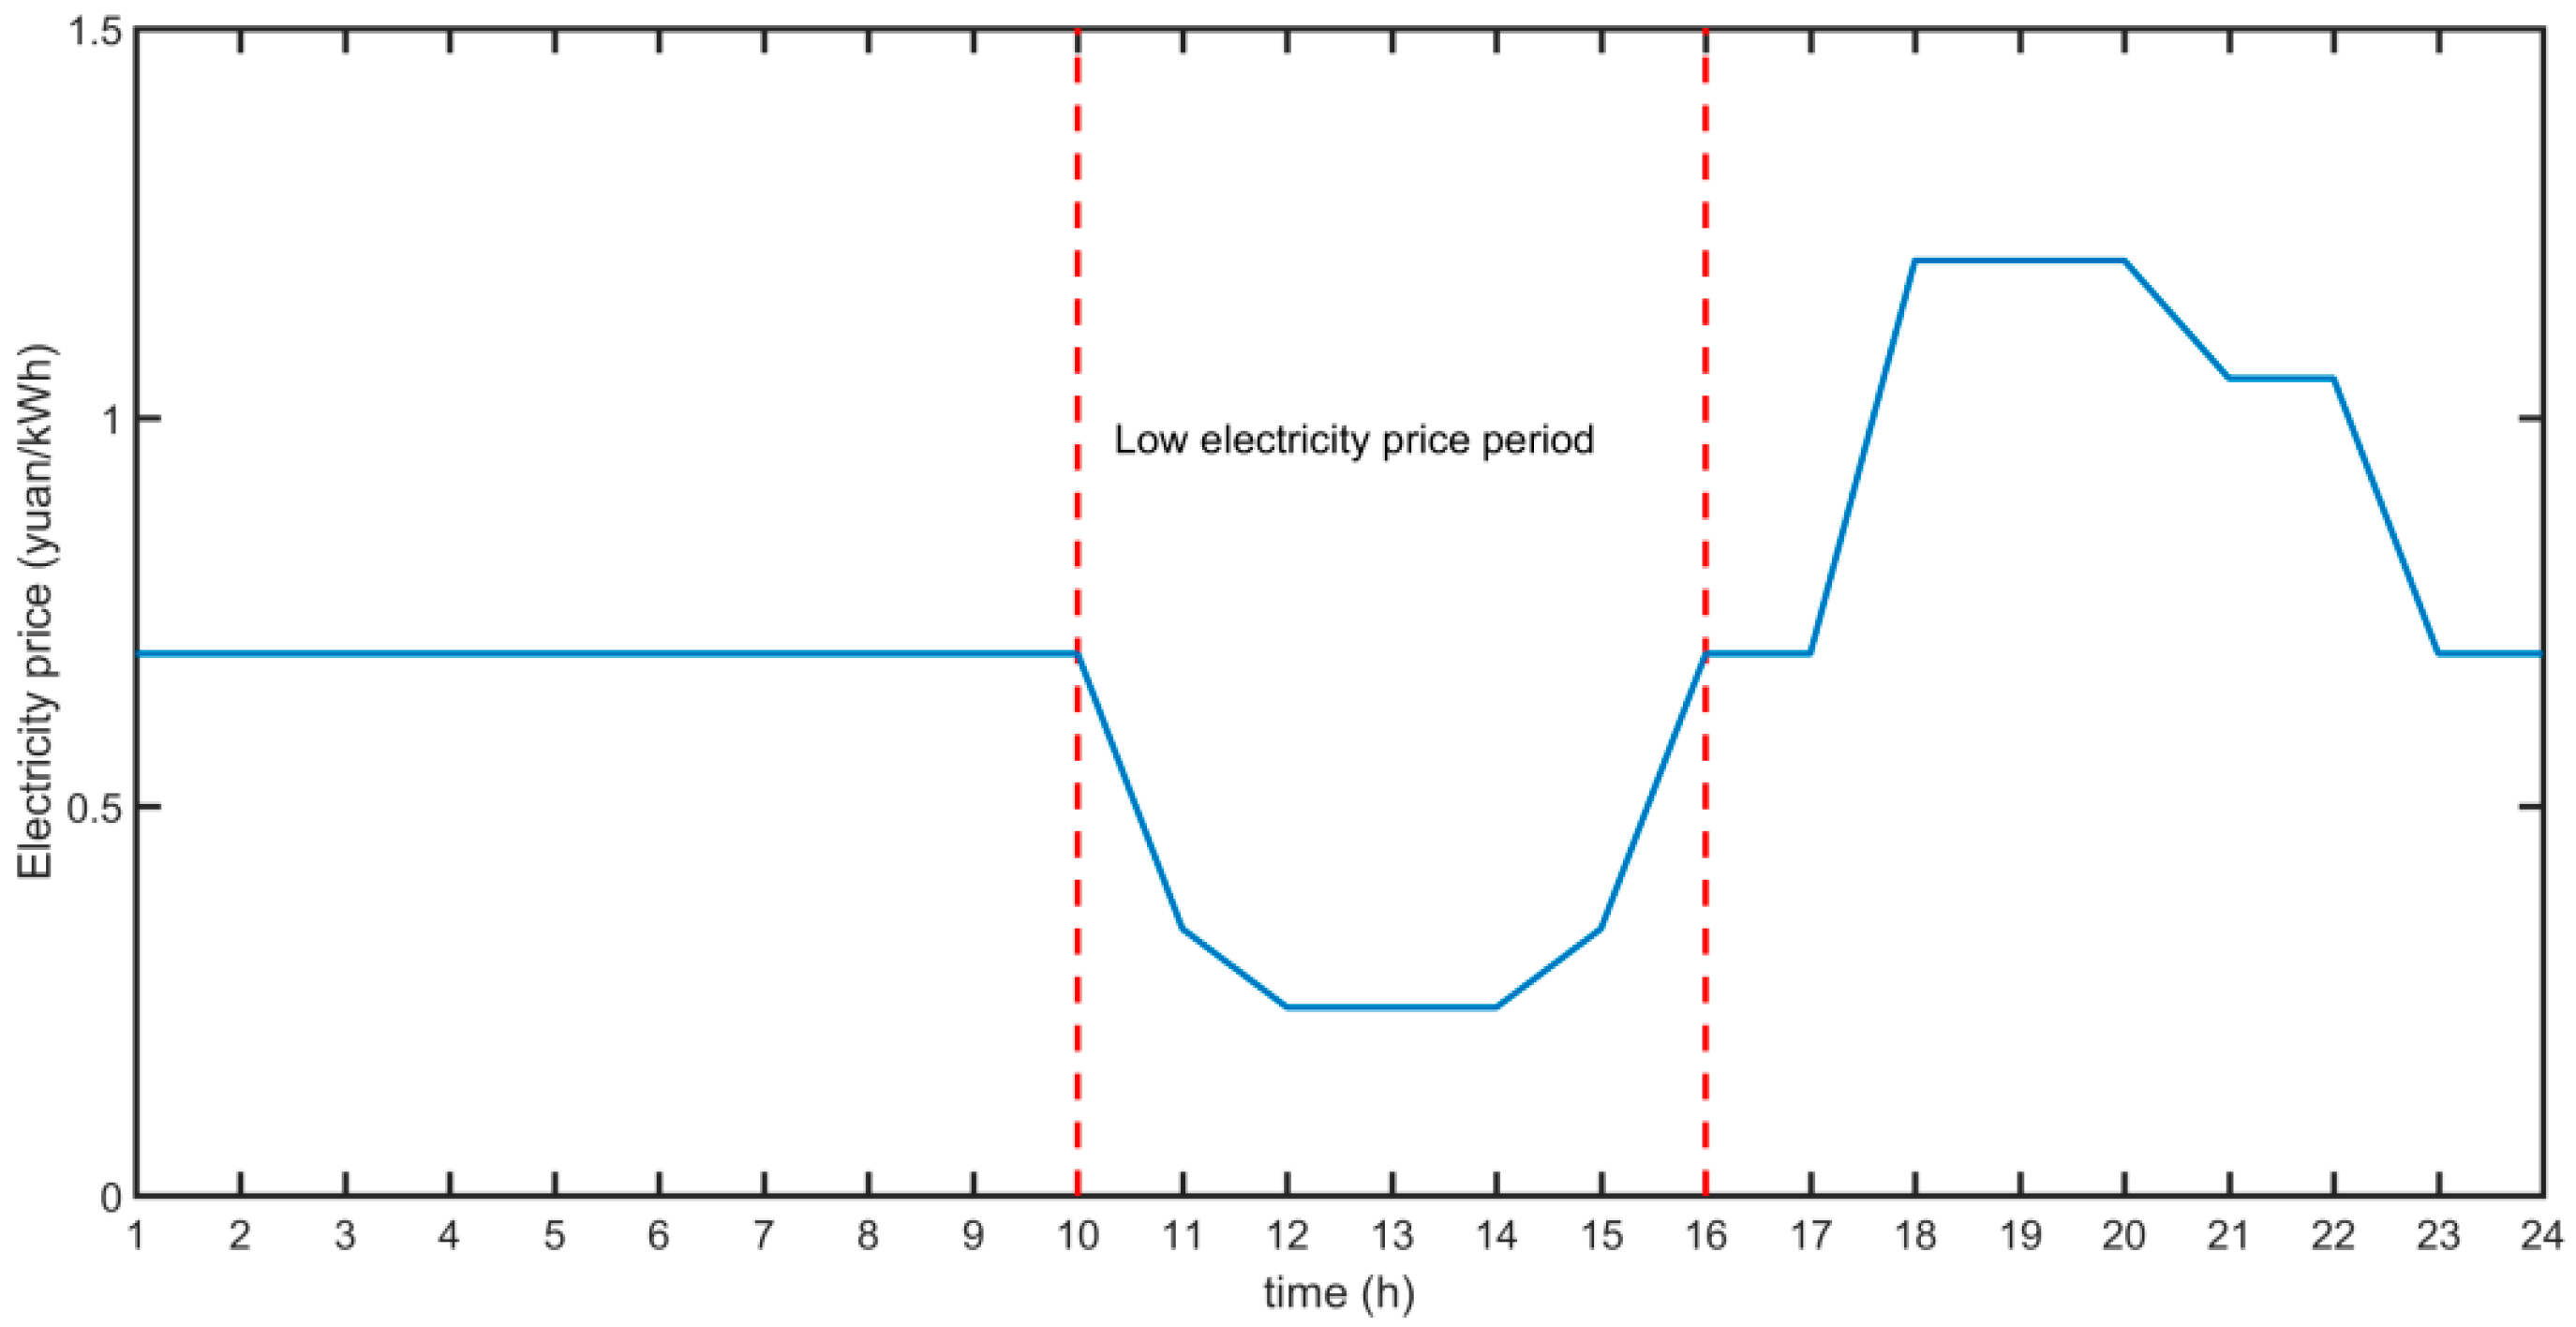
- Huge energy consumption: The pumping stations and gates along YQWRP are currently controlled on-site based on the subjective experience of the management personnel, resulting in high operational costs. By optimizing the intraday operational strategies of each pump station and enhancing the coordination of the pumping station group, the time-of-use electricity pricing strategy that delineates peak and off-peak intervals can be optimally utilized, ultimately resulting in a decrease in total pumping costs. Furthermore, the participation of the gates between canal sections in hydraulic control facilitates the pumping head management. This strategy would facilitate the operation of all pump stations along the channel predominantly during periods of low electricity prices, thereby further decreasing the operational energy consumption.
- (2)
- Multiple objectives: To reduce the energy consumption of actual operation, the regulation objectives include minimizing electricity consumption, minimizing power consumption, and minimizing the number of regulation times.
- (3)
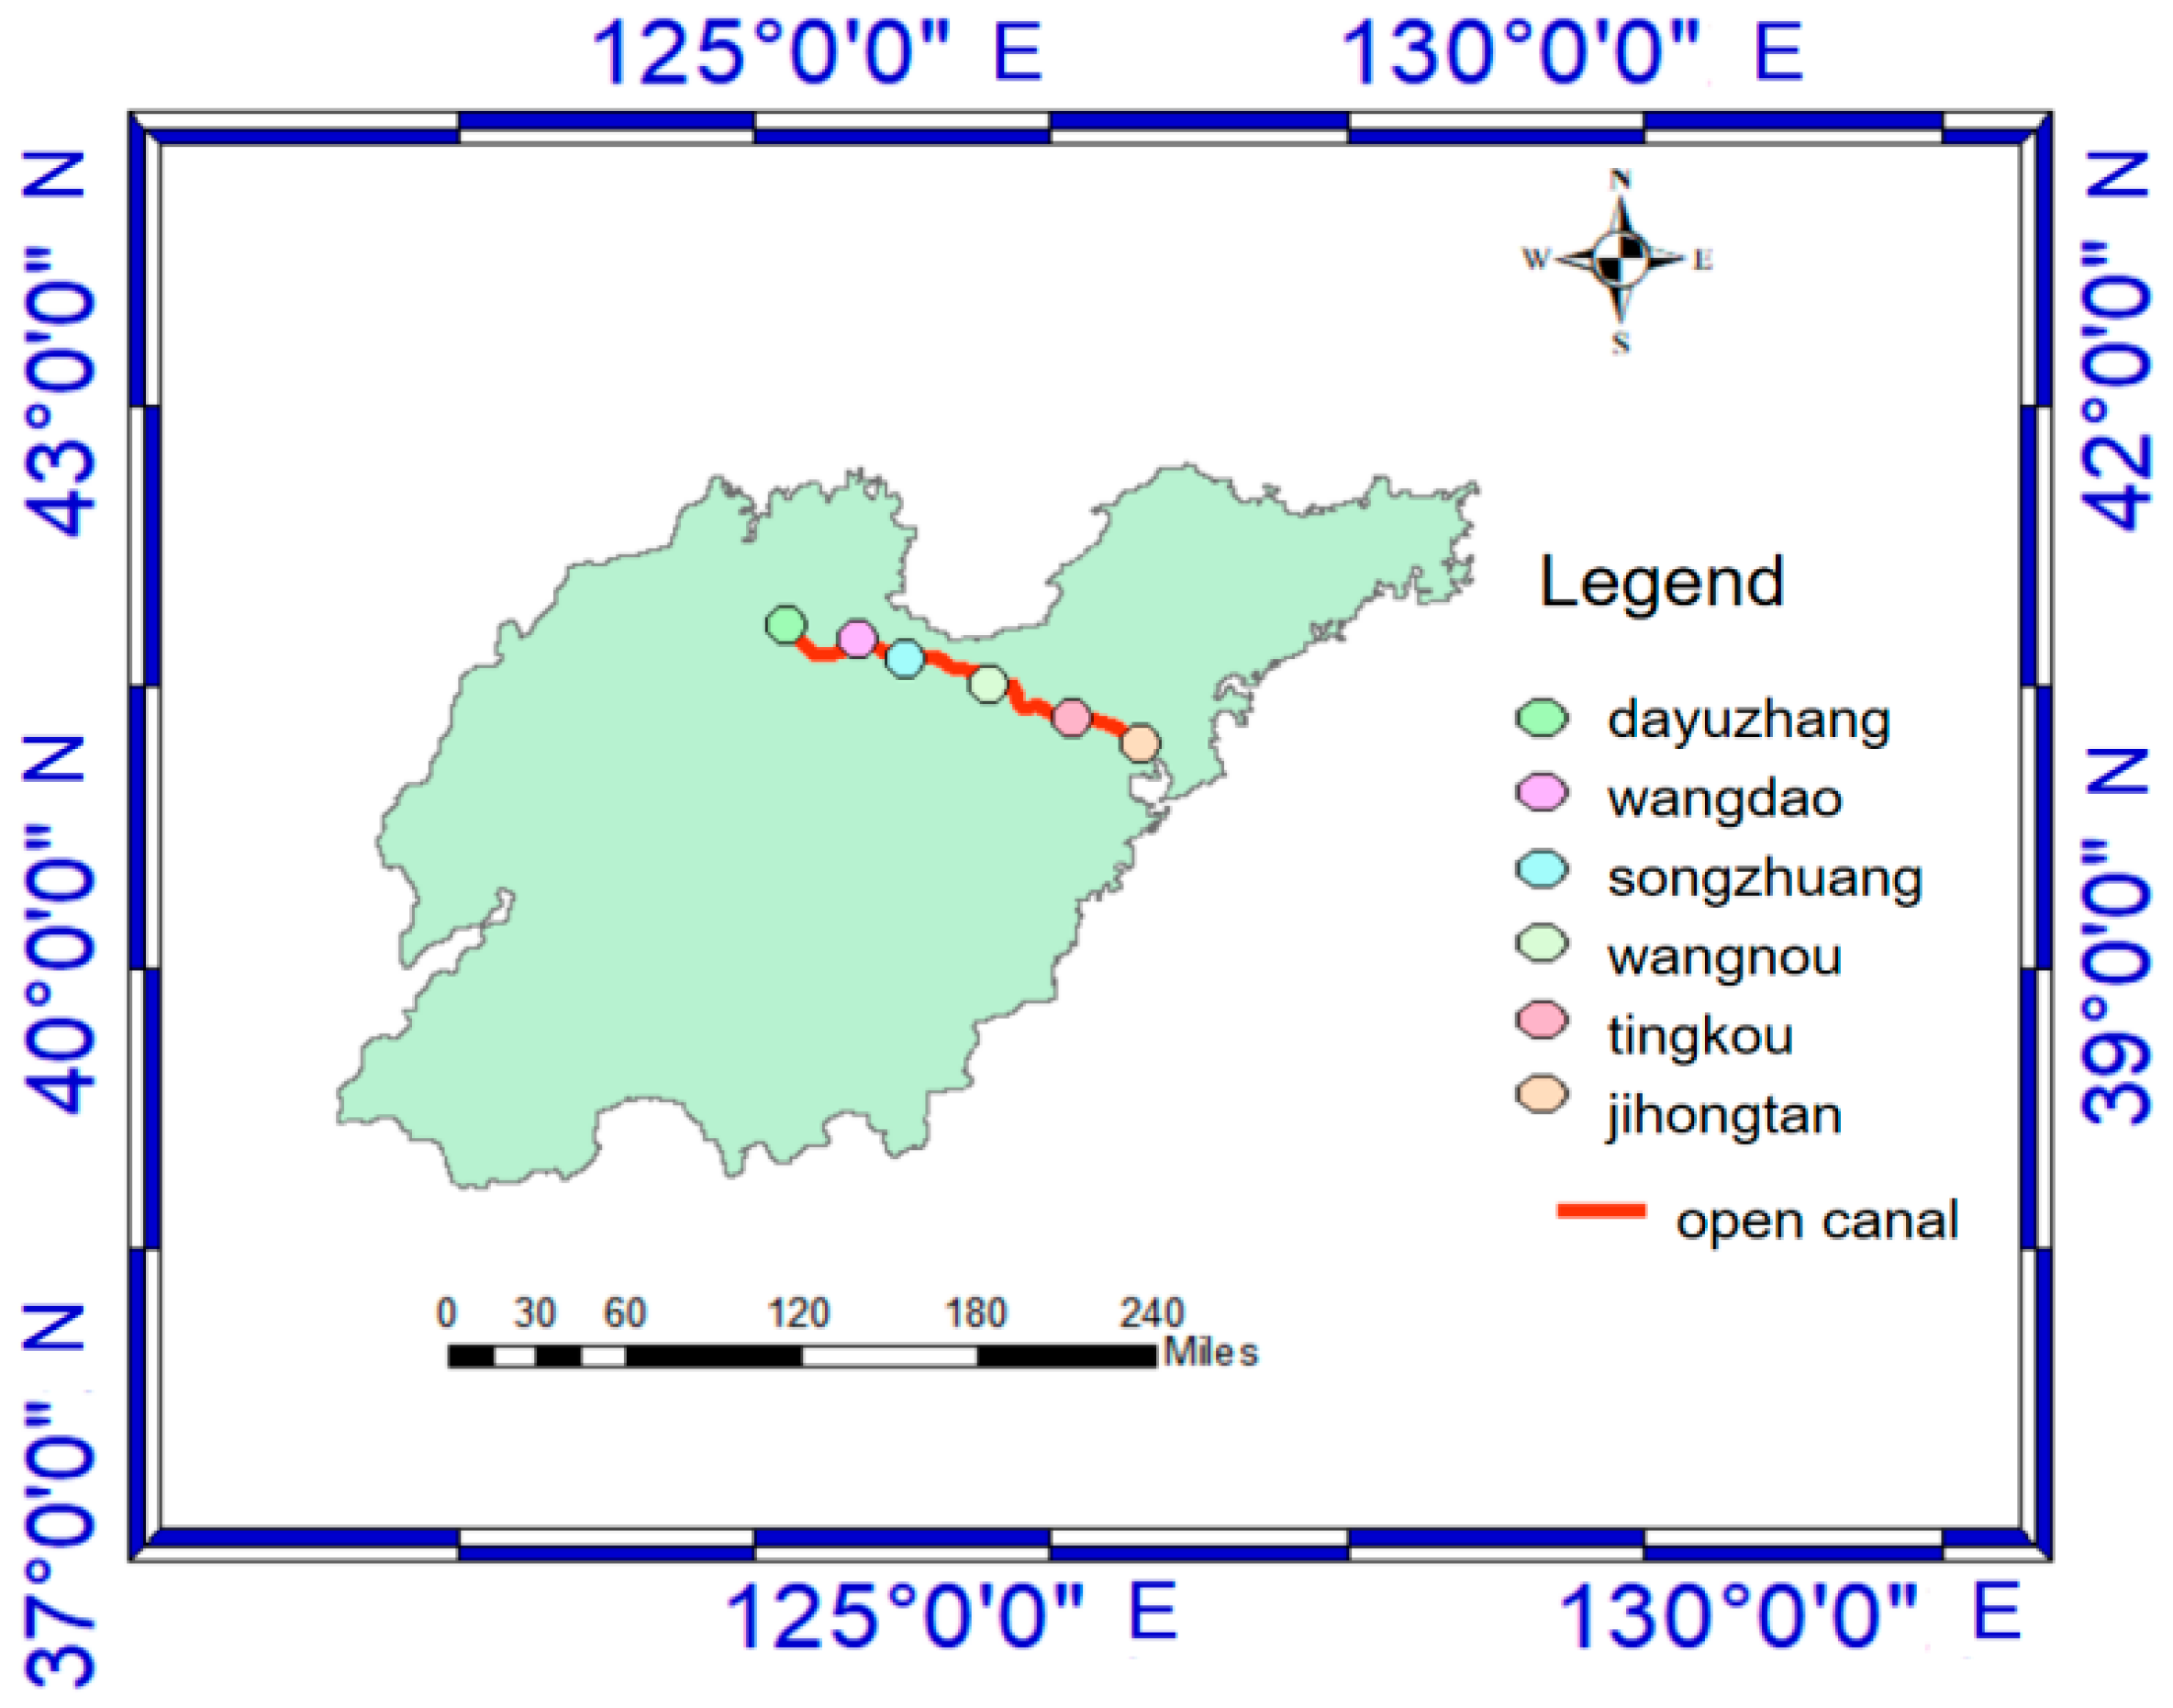
- Multiple water conservancy facilities: This project has 5 formal pump stations and 1 temporary pump station, starting from Dayuzhang pump station, passing through Wangdao pump station, Songzhuang pump station, Wangnou pump station, Tingkou pump station, Jihongtan pump station, and reaching Baisha Water Plant, with a total length of 291 km [24].
2.2. Analysis of Historical Regulation Scenarios
2.3. Data Sources
3. Construction of Optimization Regulation Model for Cascade Pump Stations
- (1)
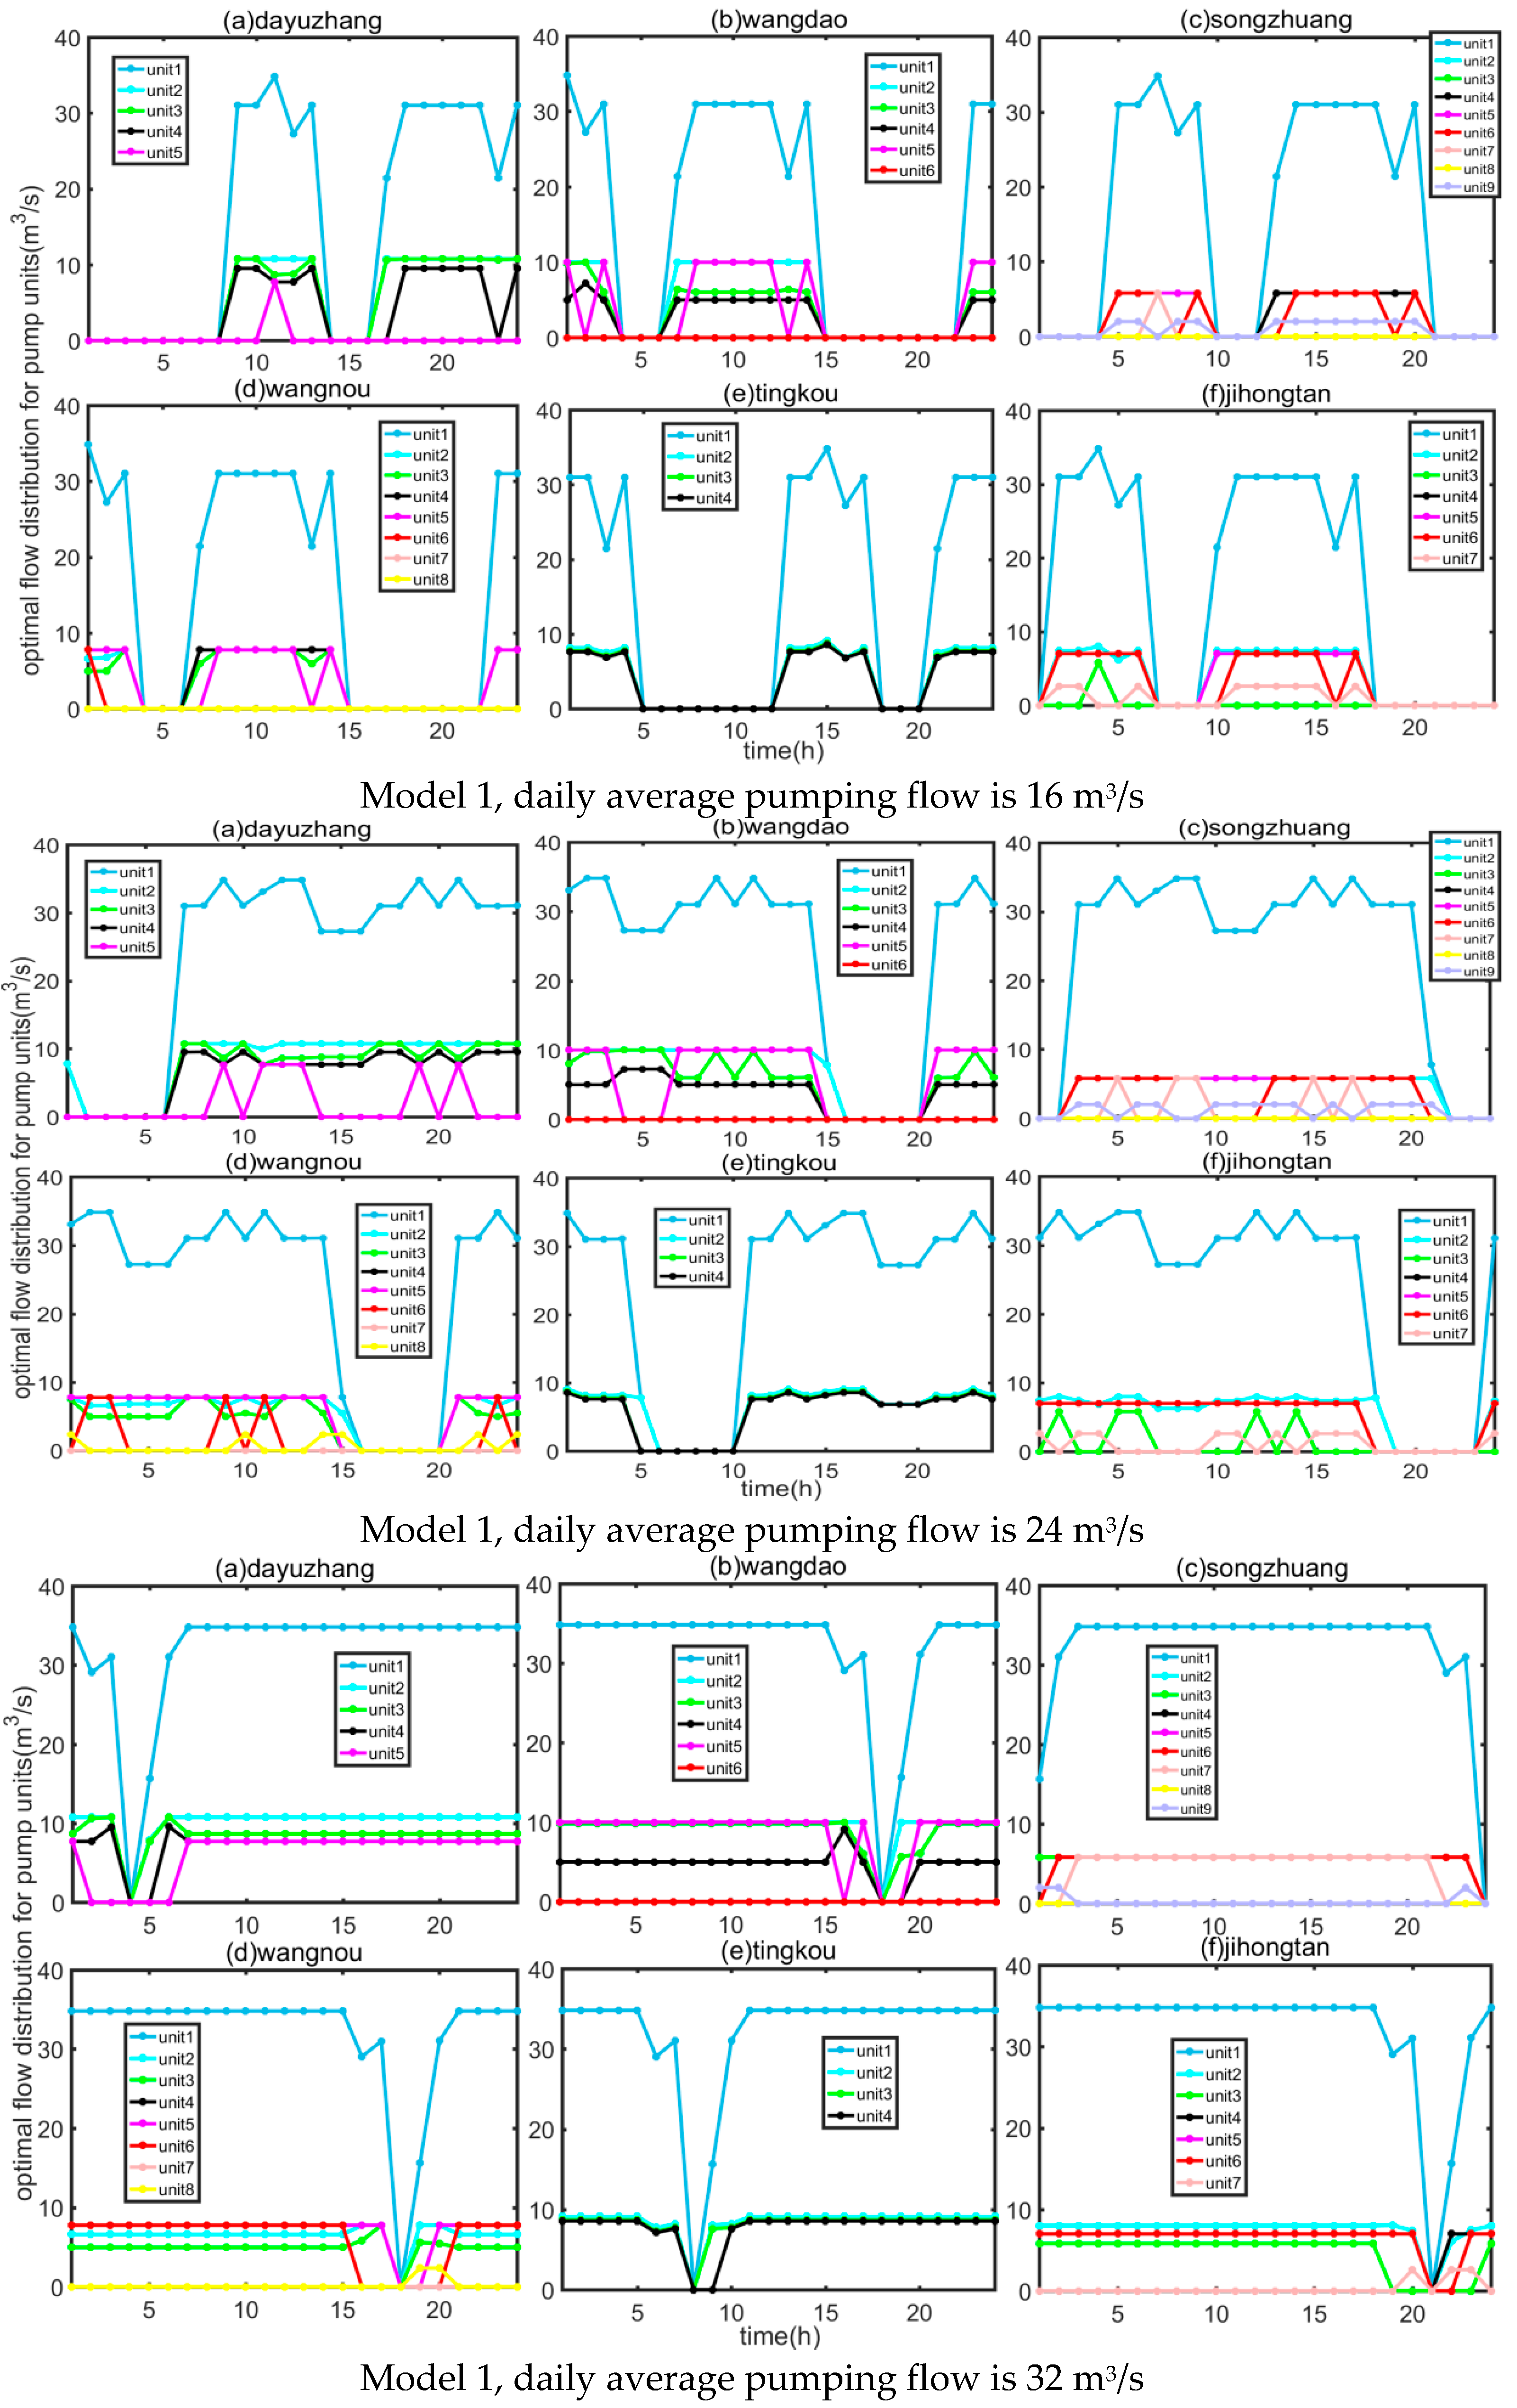
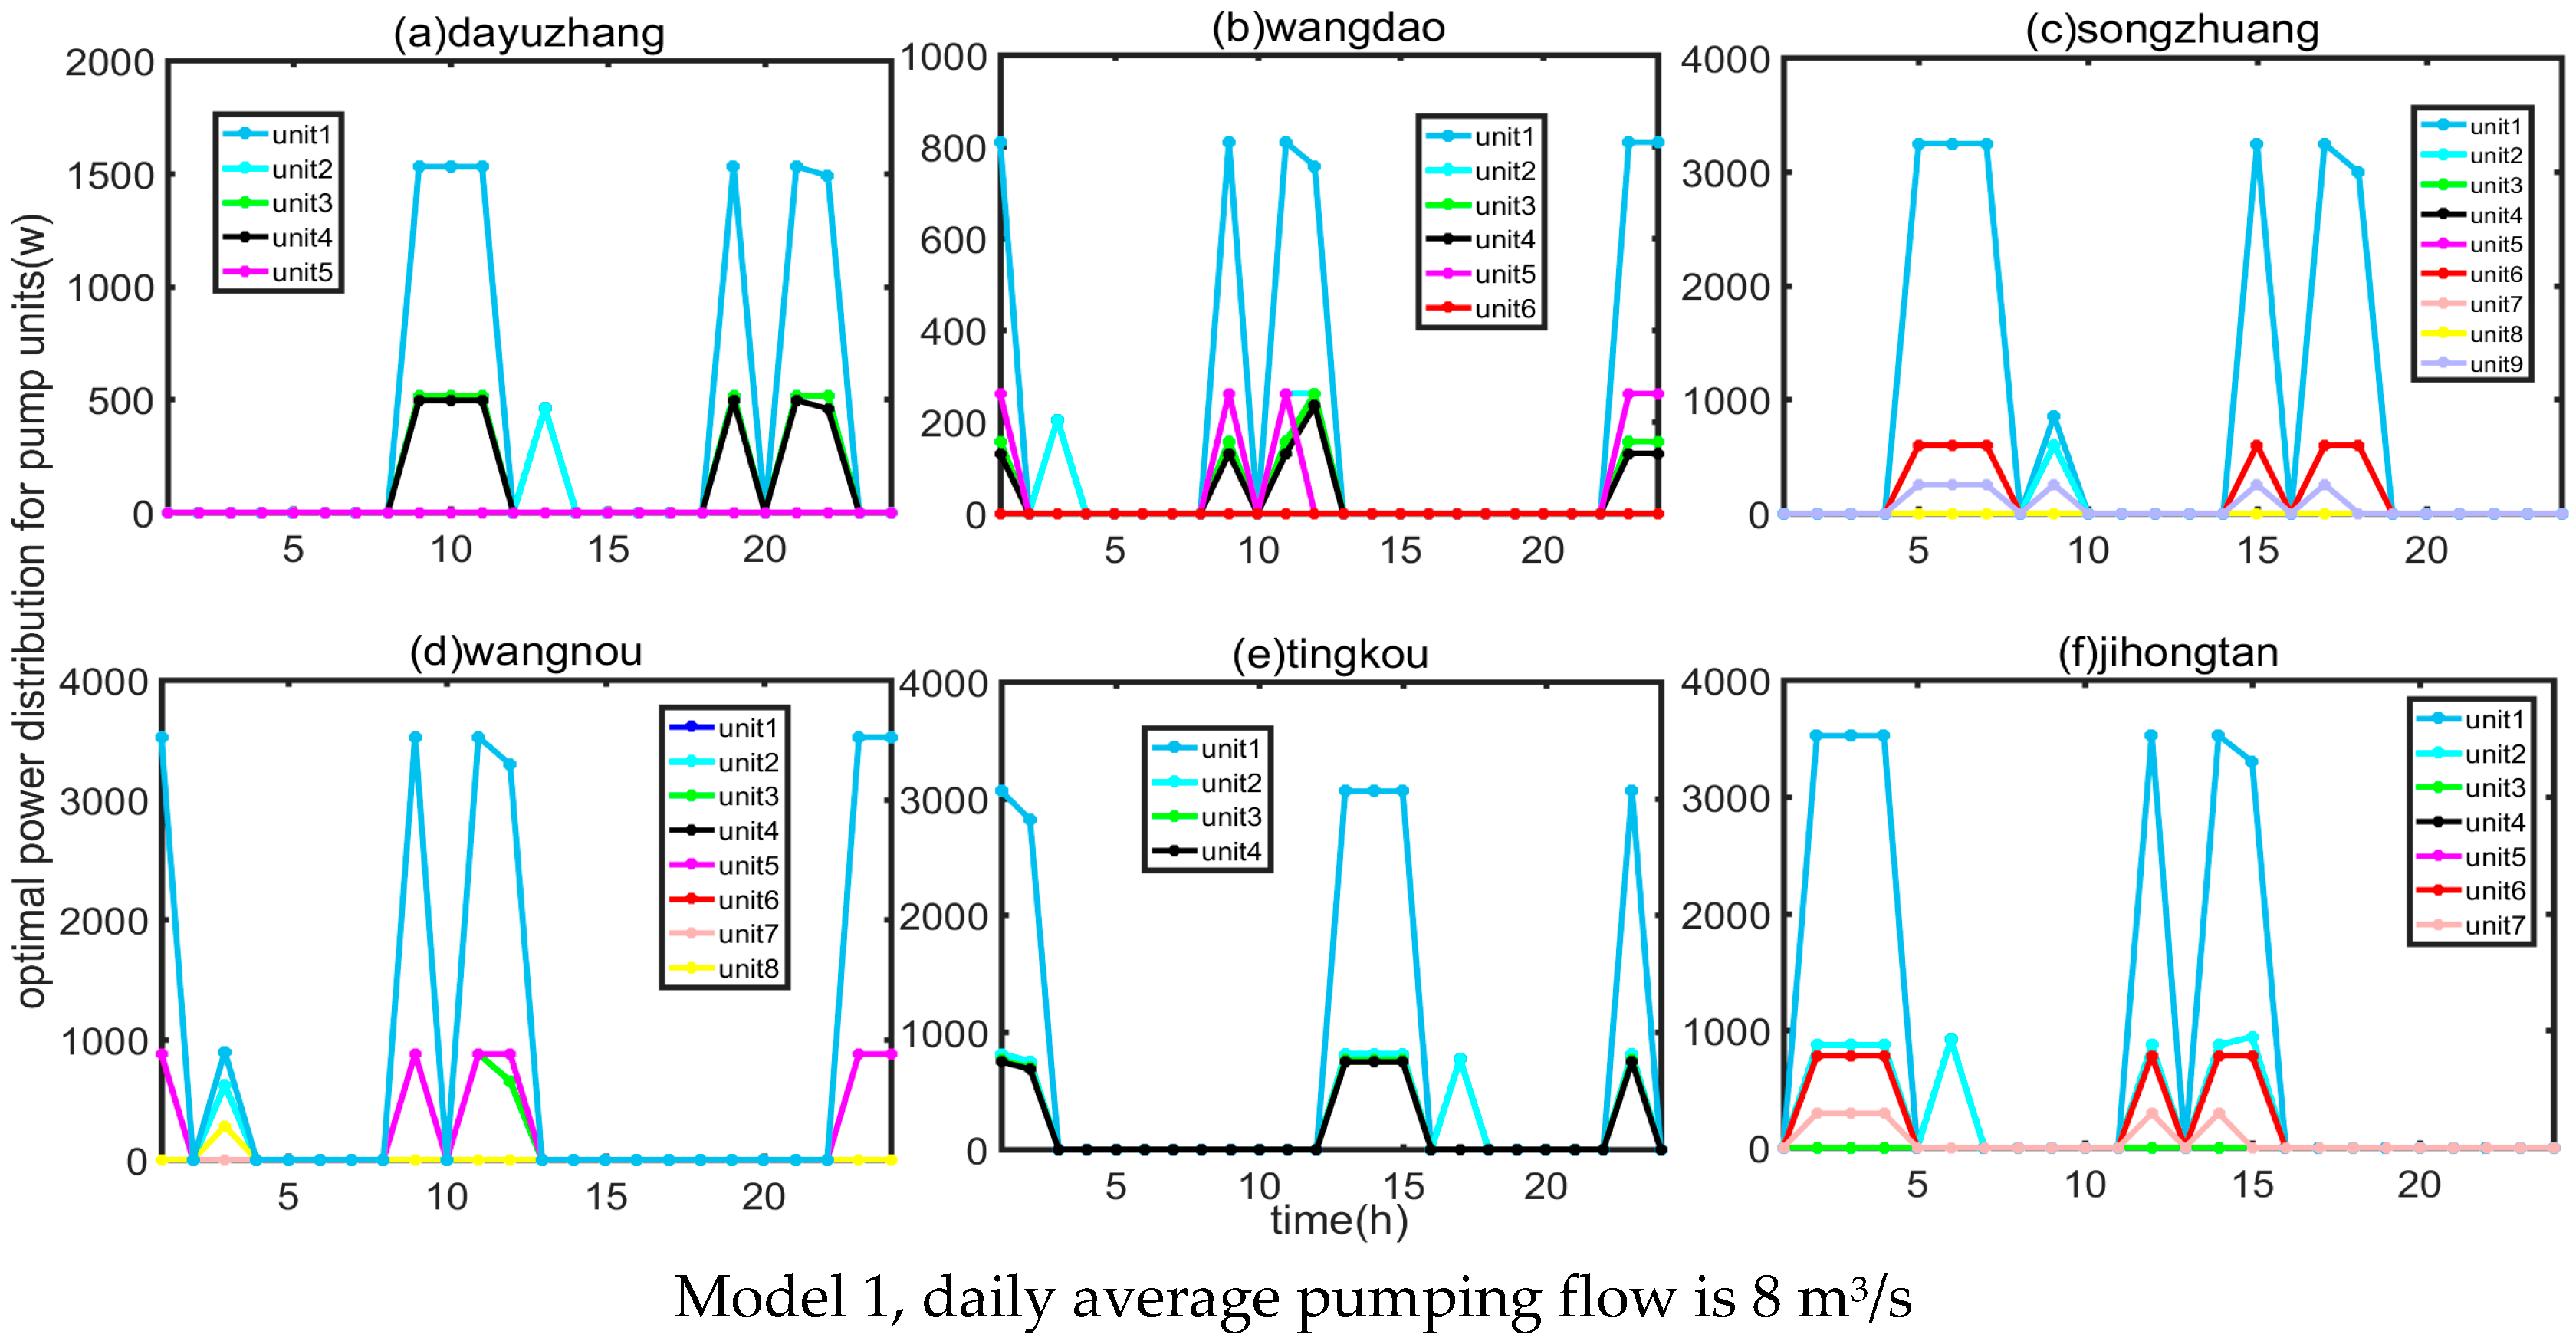
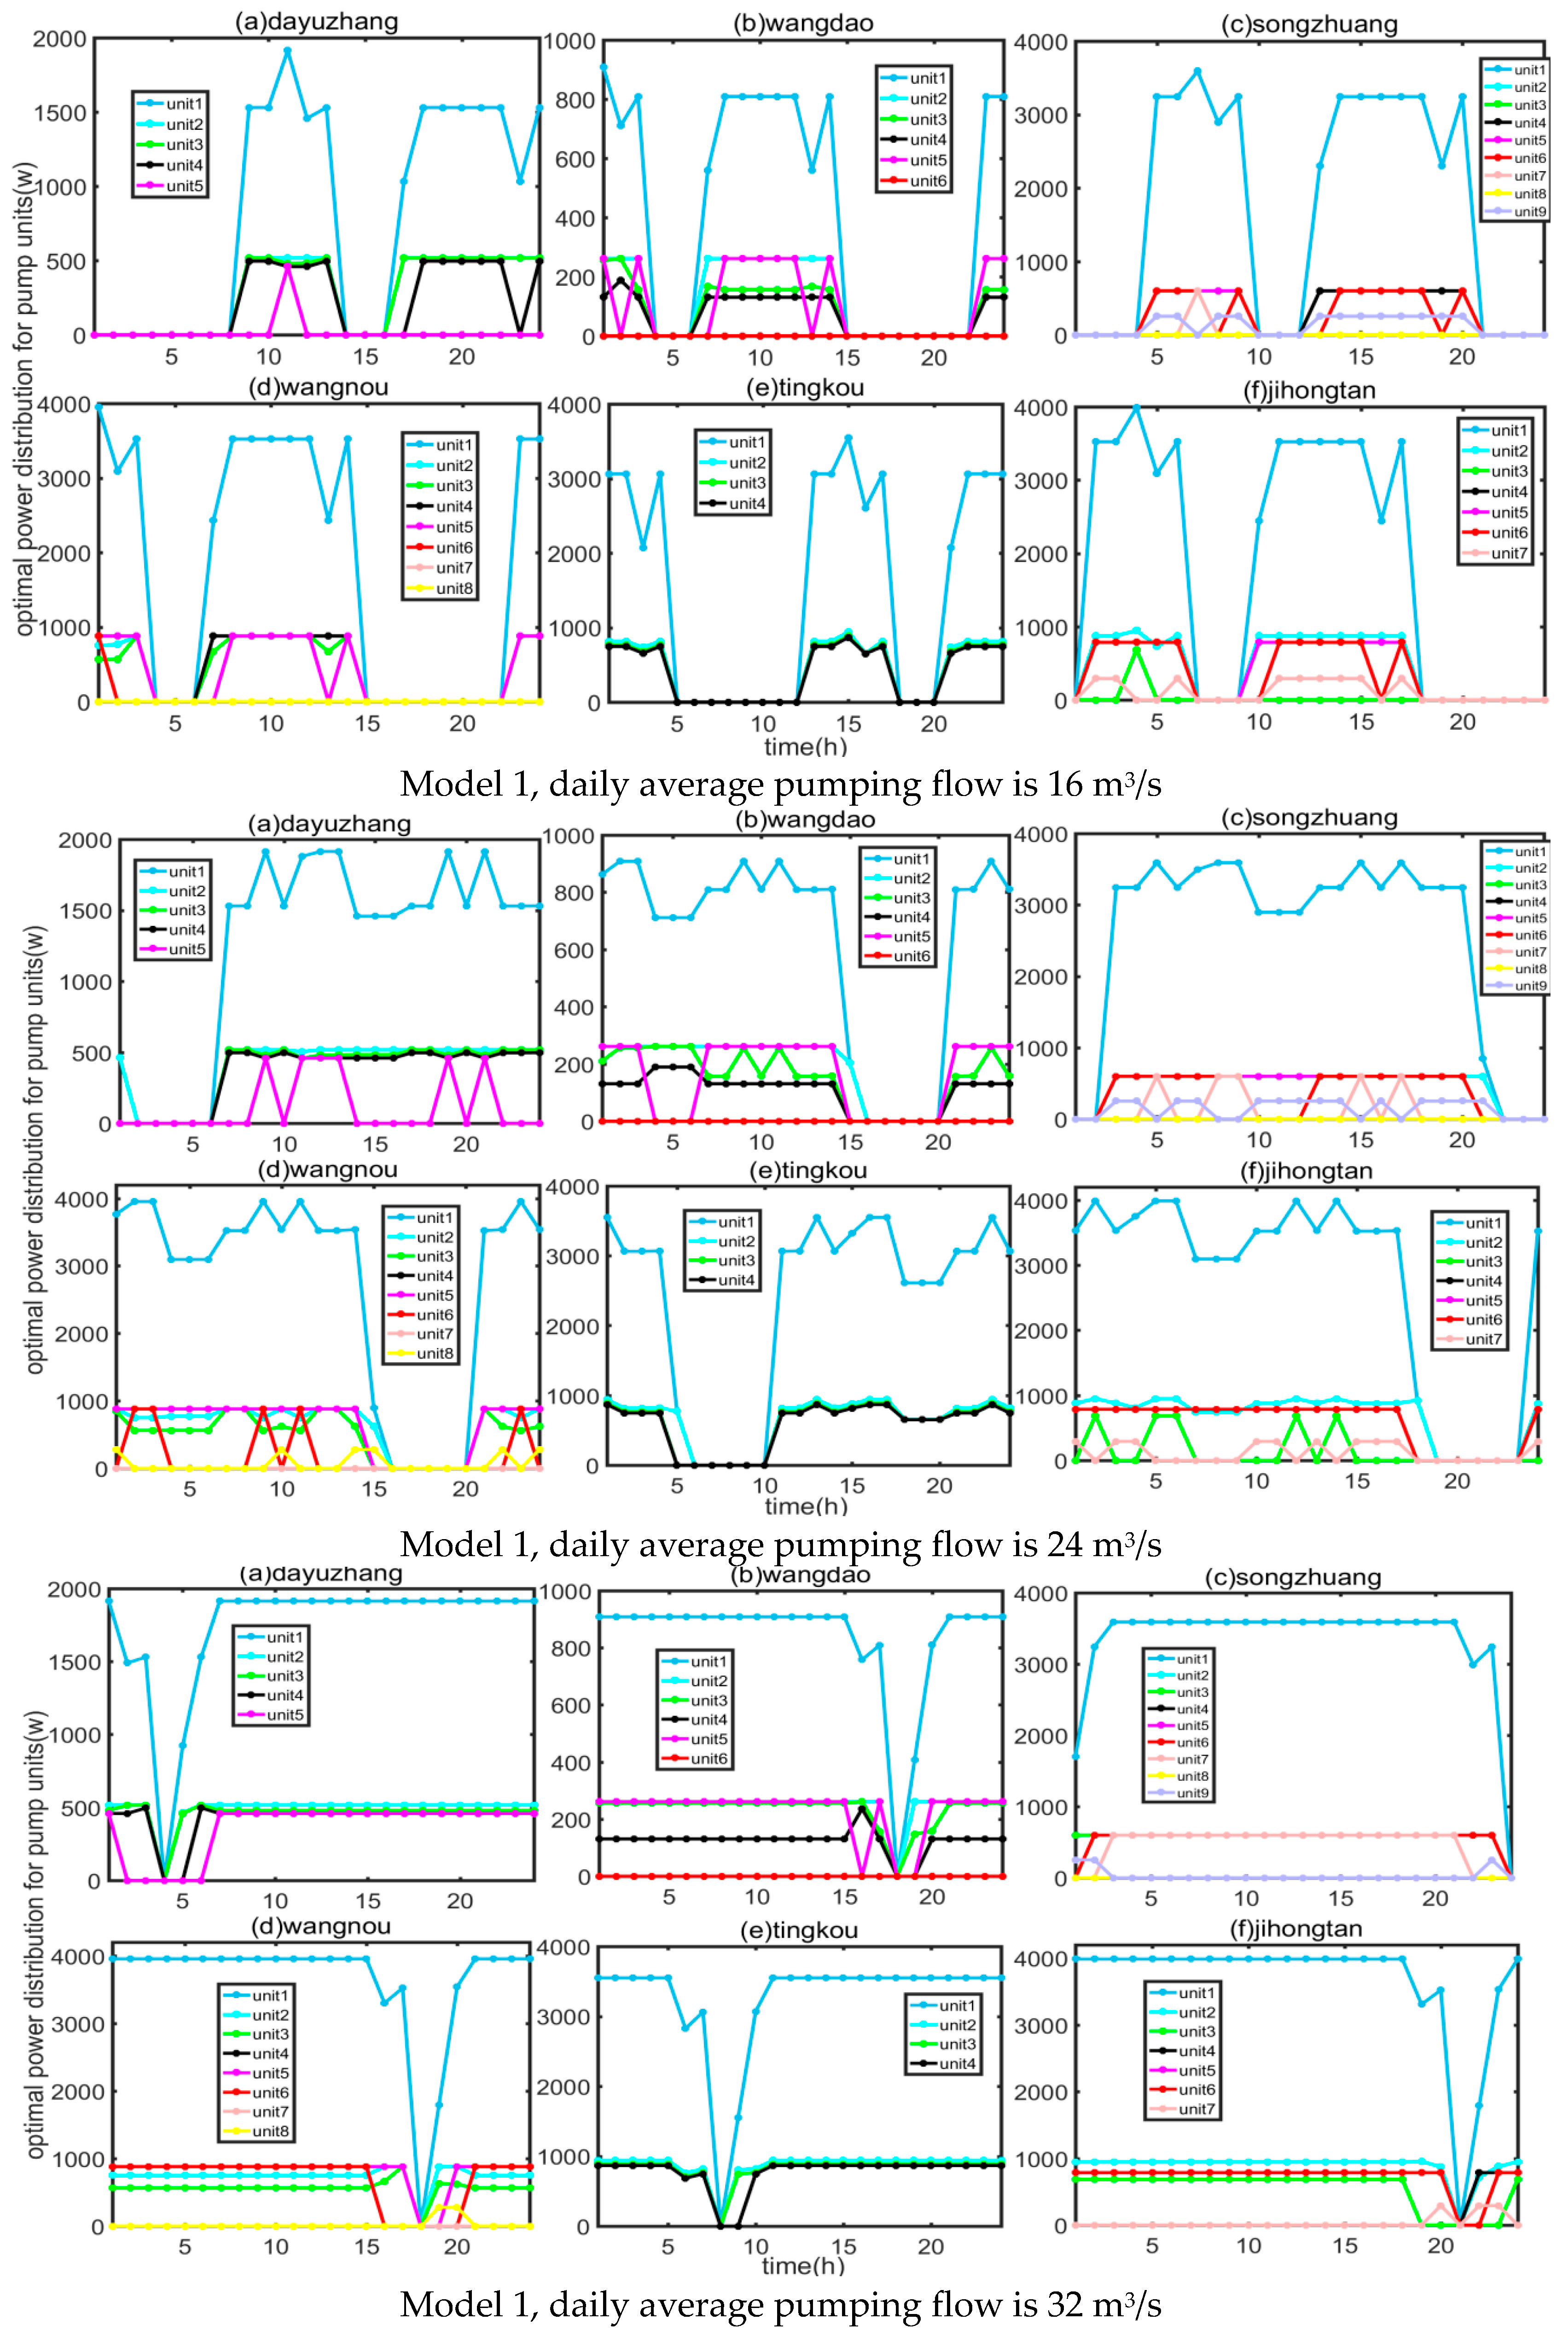
- Model 1: The main objective of Model 1 is to minimize the total daily electricity cost and the number of pumping station adjustments. The model assumes that gates between channels are not involved in the regulation and storage of water resources.
- (2)
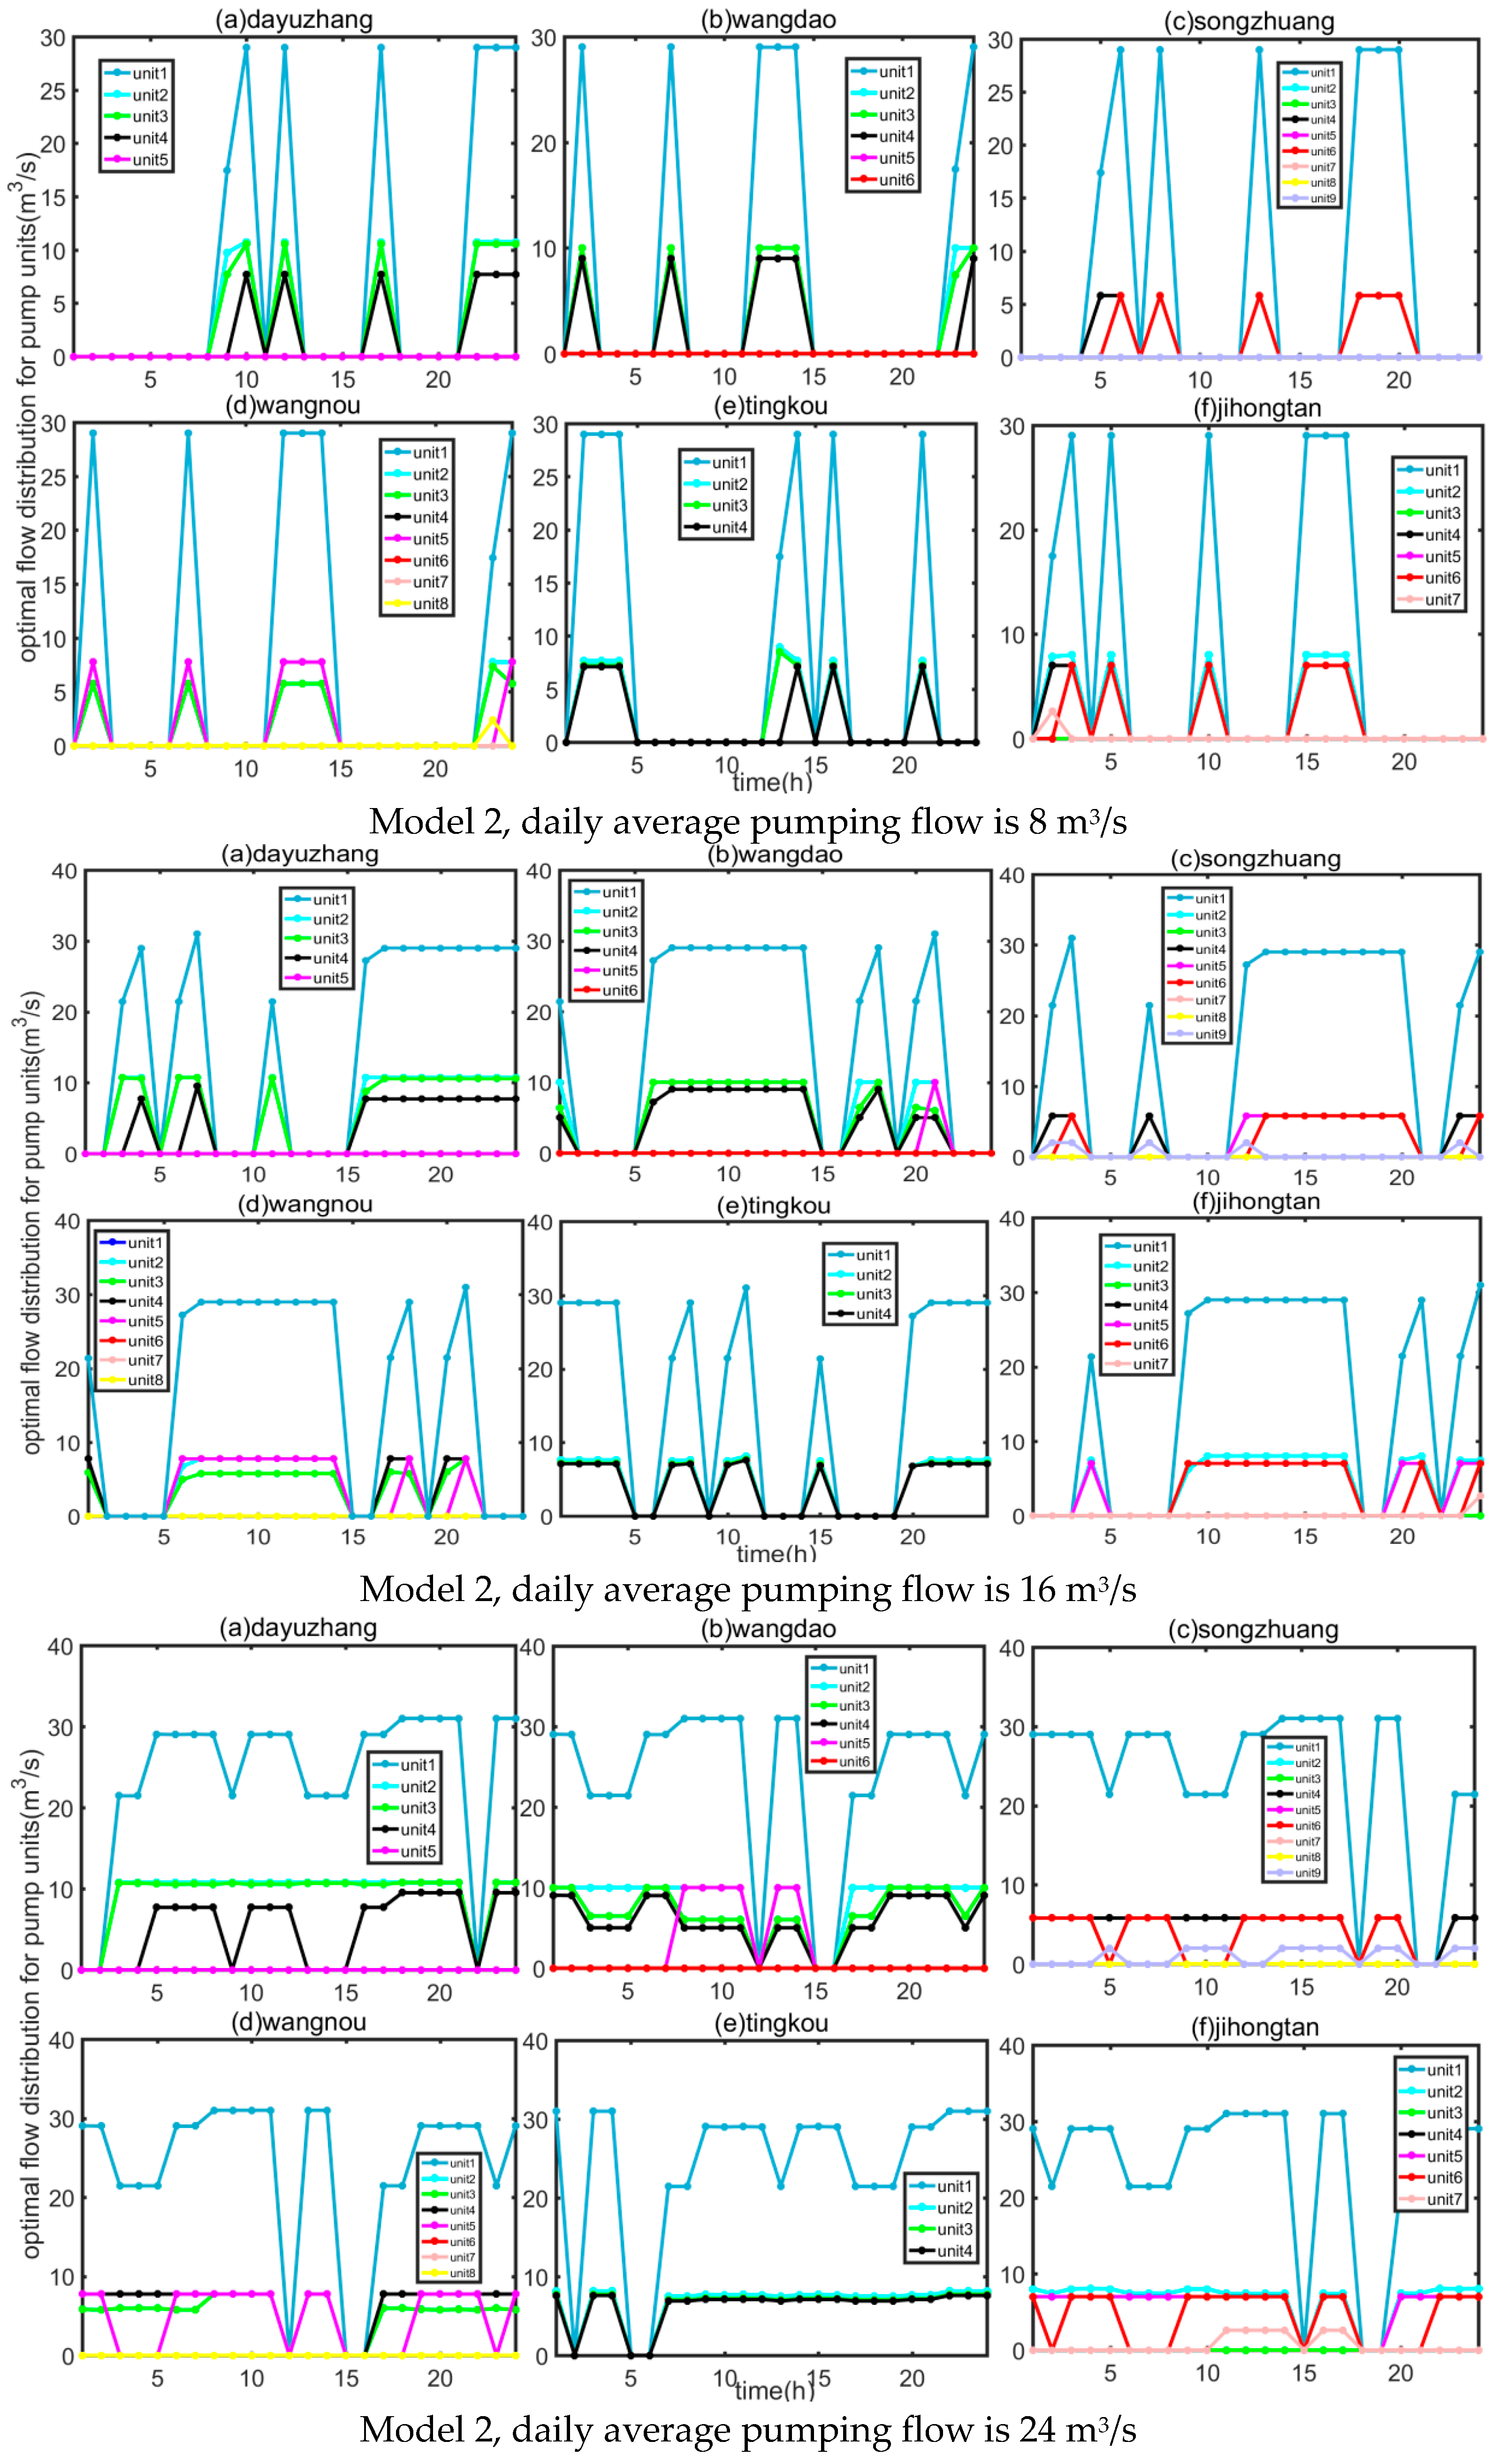
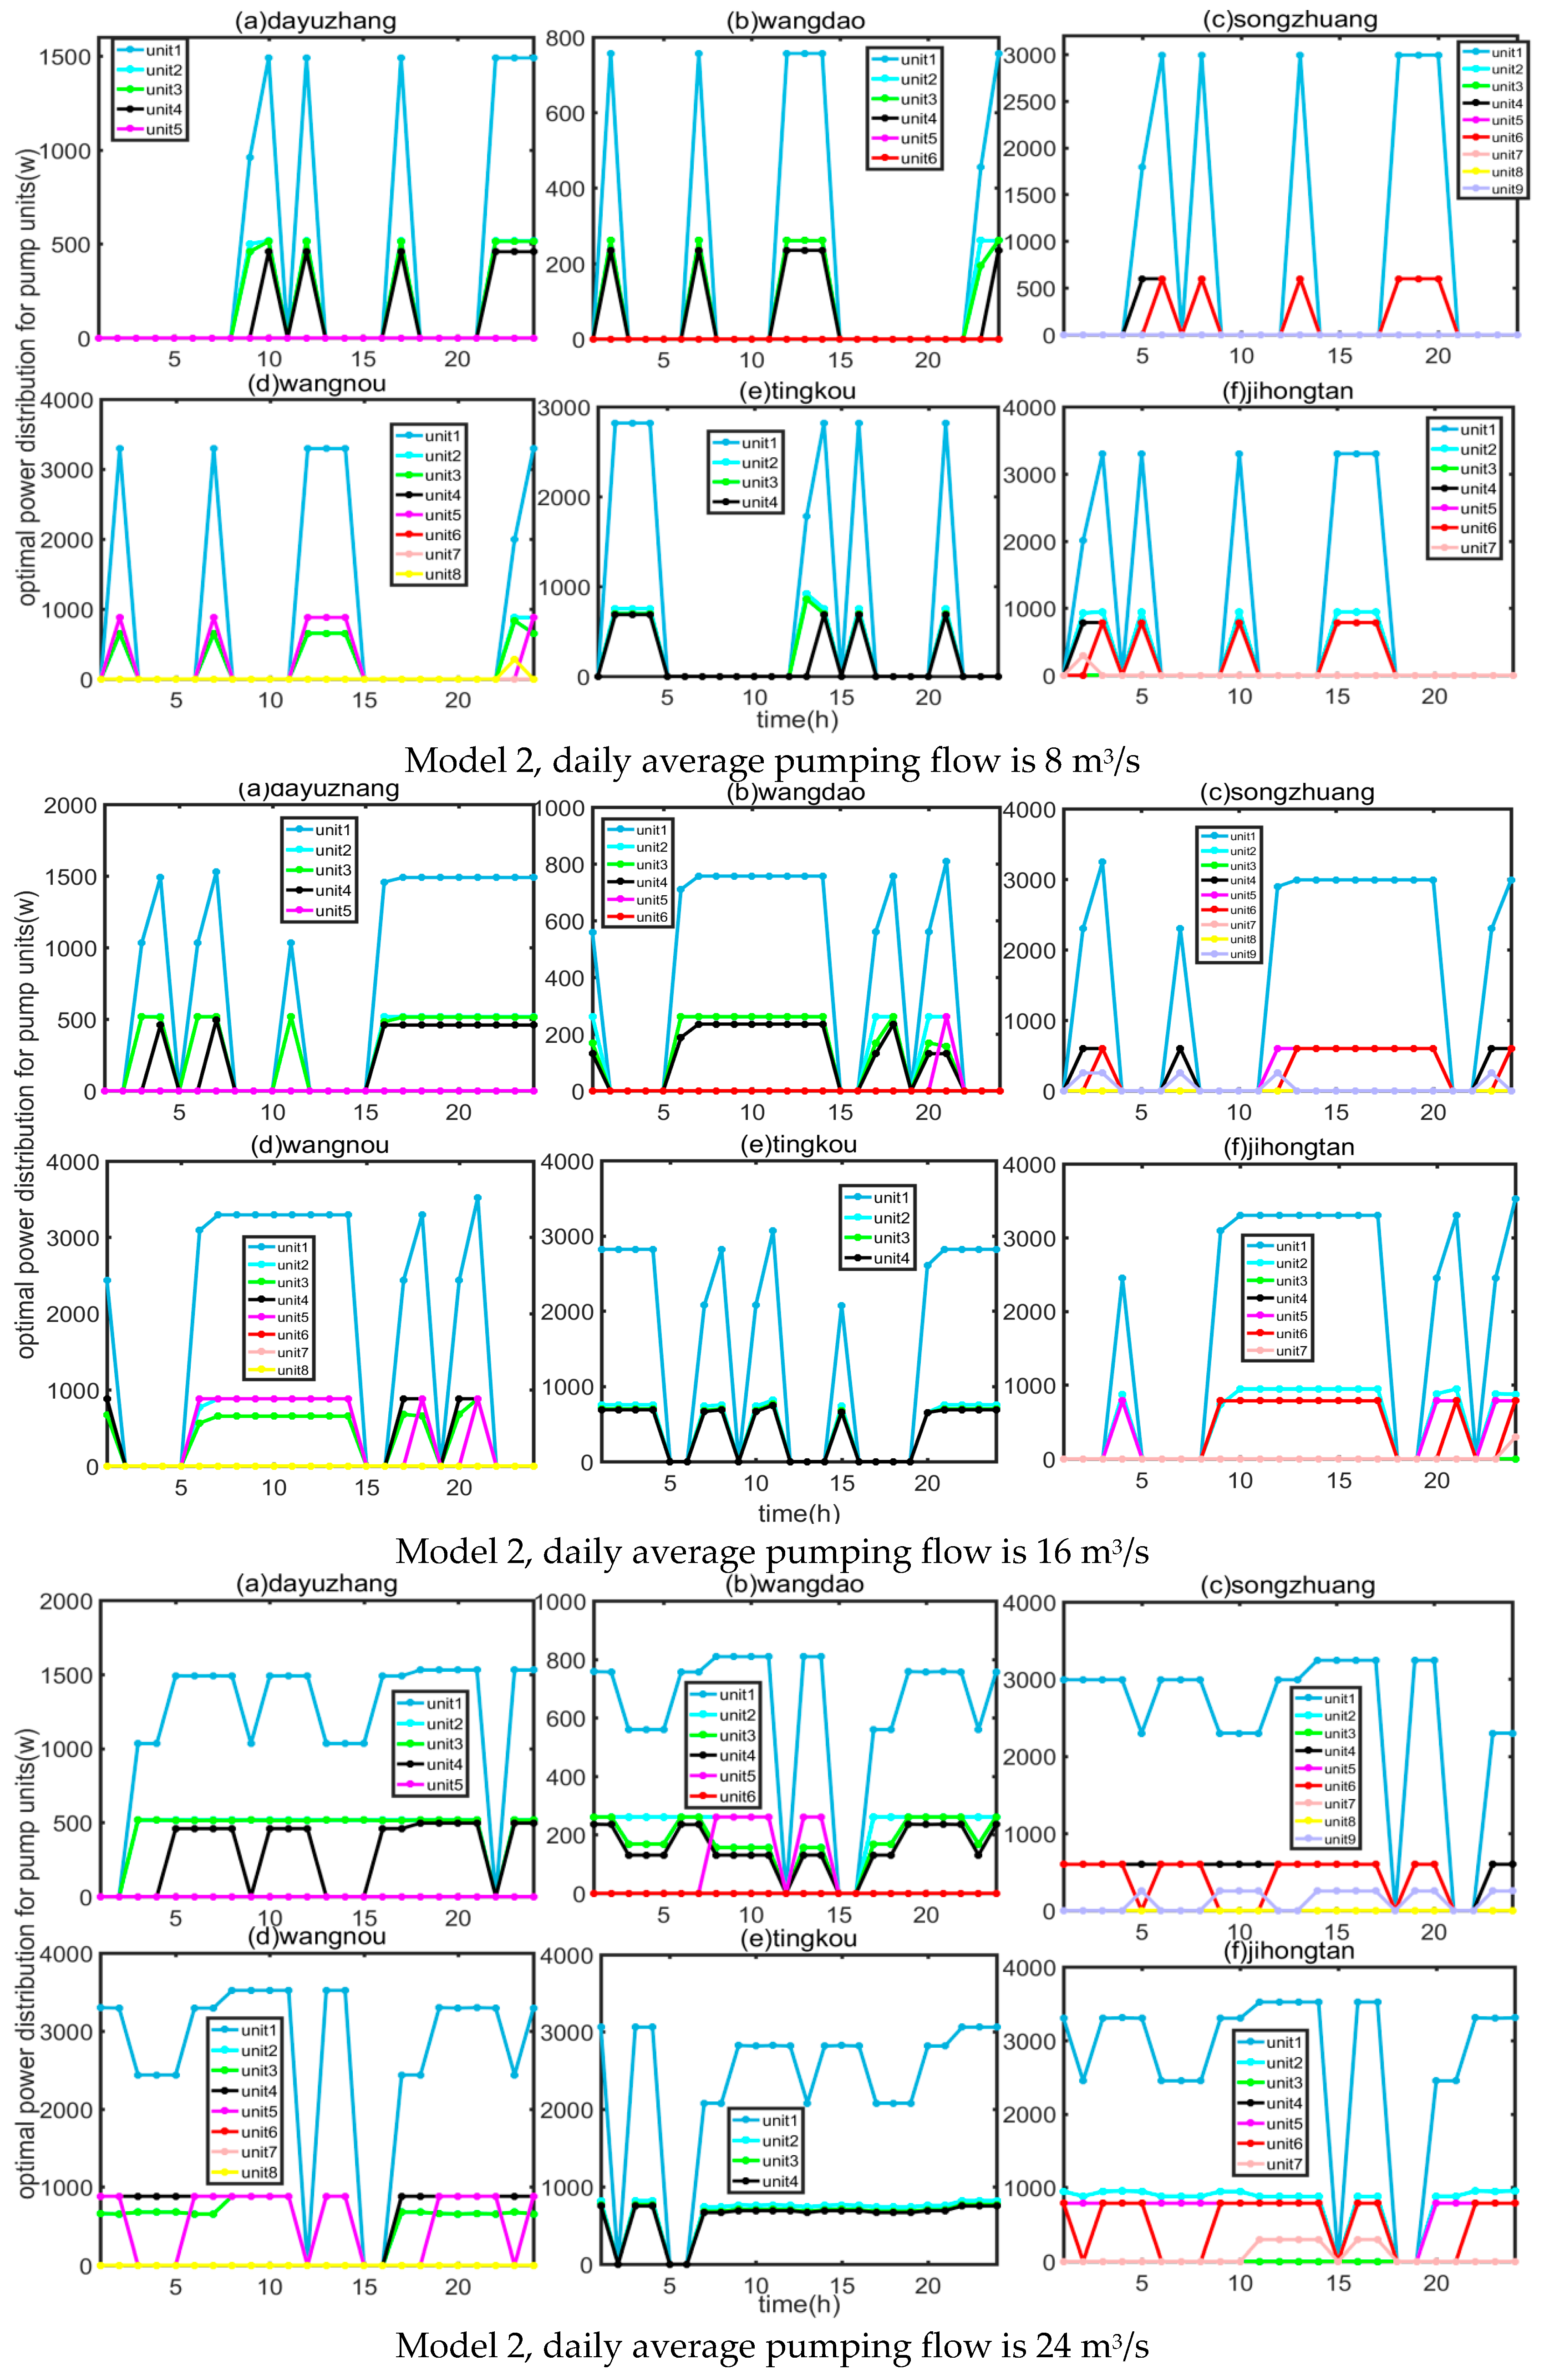
- Model 2: The main objective of Model 2 is to minimize electricity consumption and the number of pump station adjustments. The model assumes that gates between channels are not involved in the regulation and storage of water resources.
- (3)
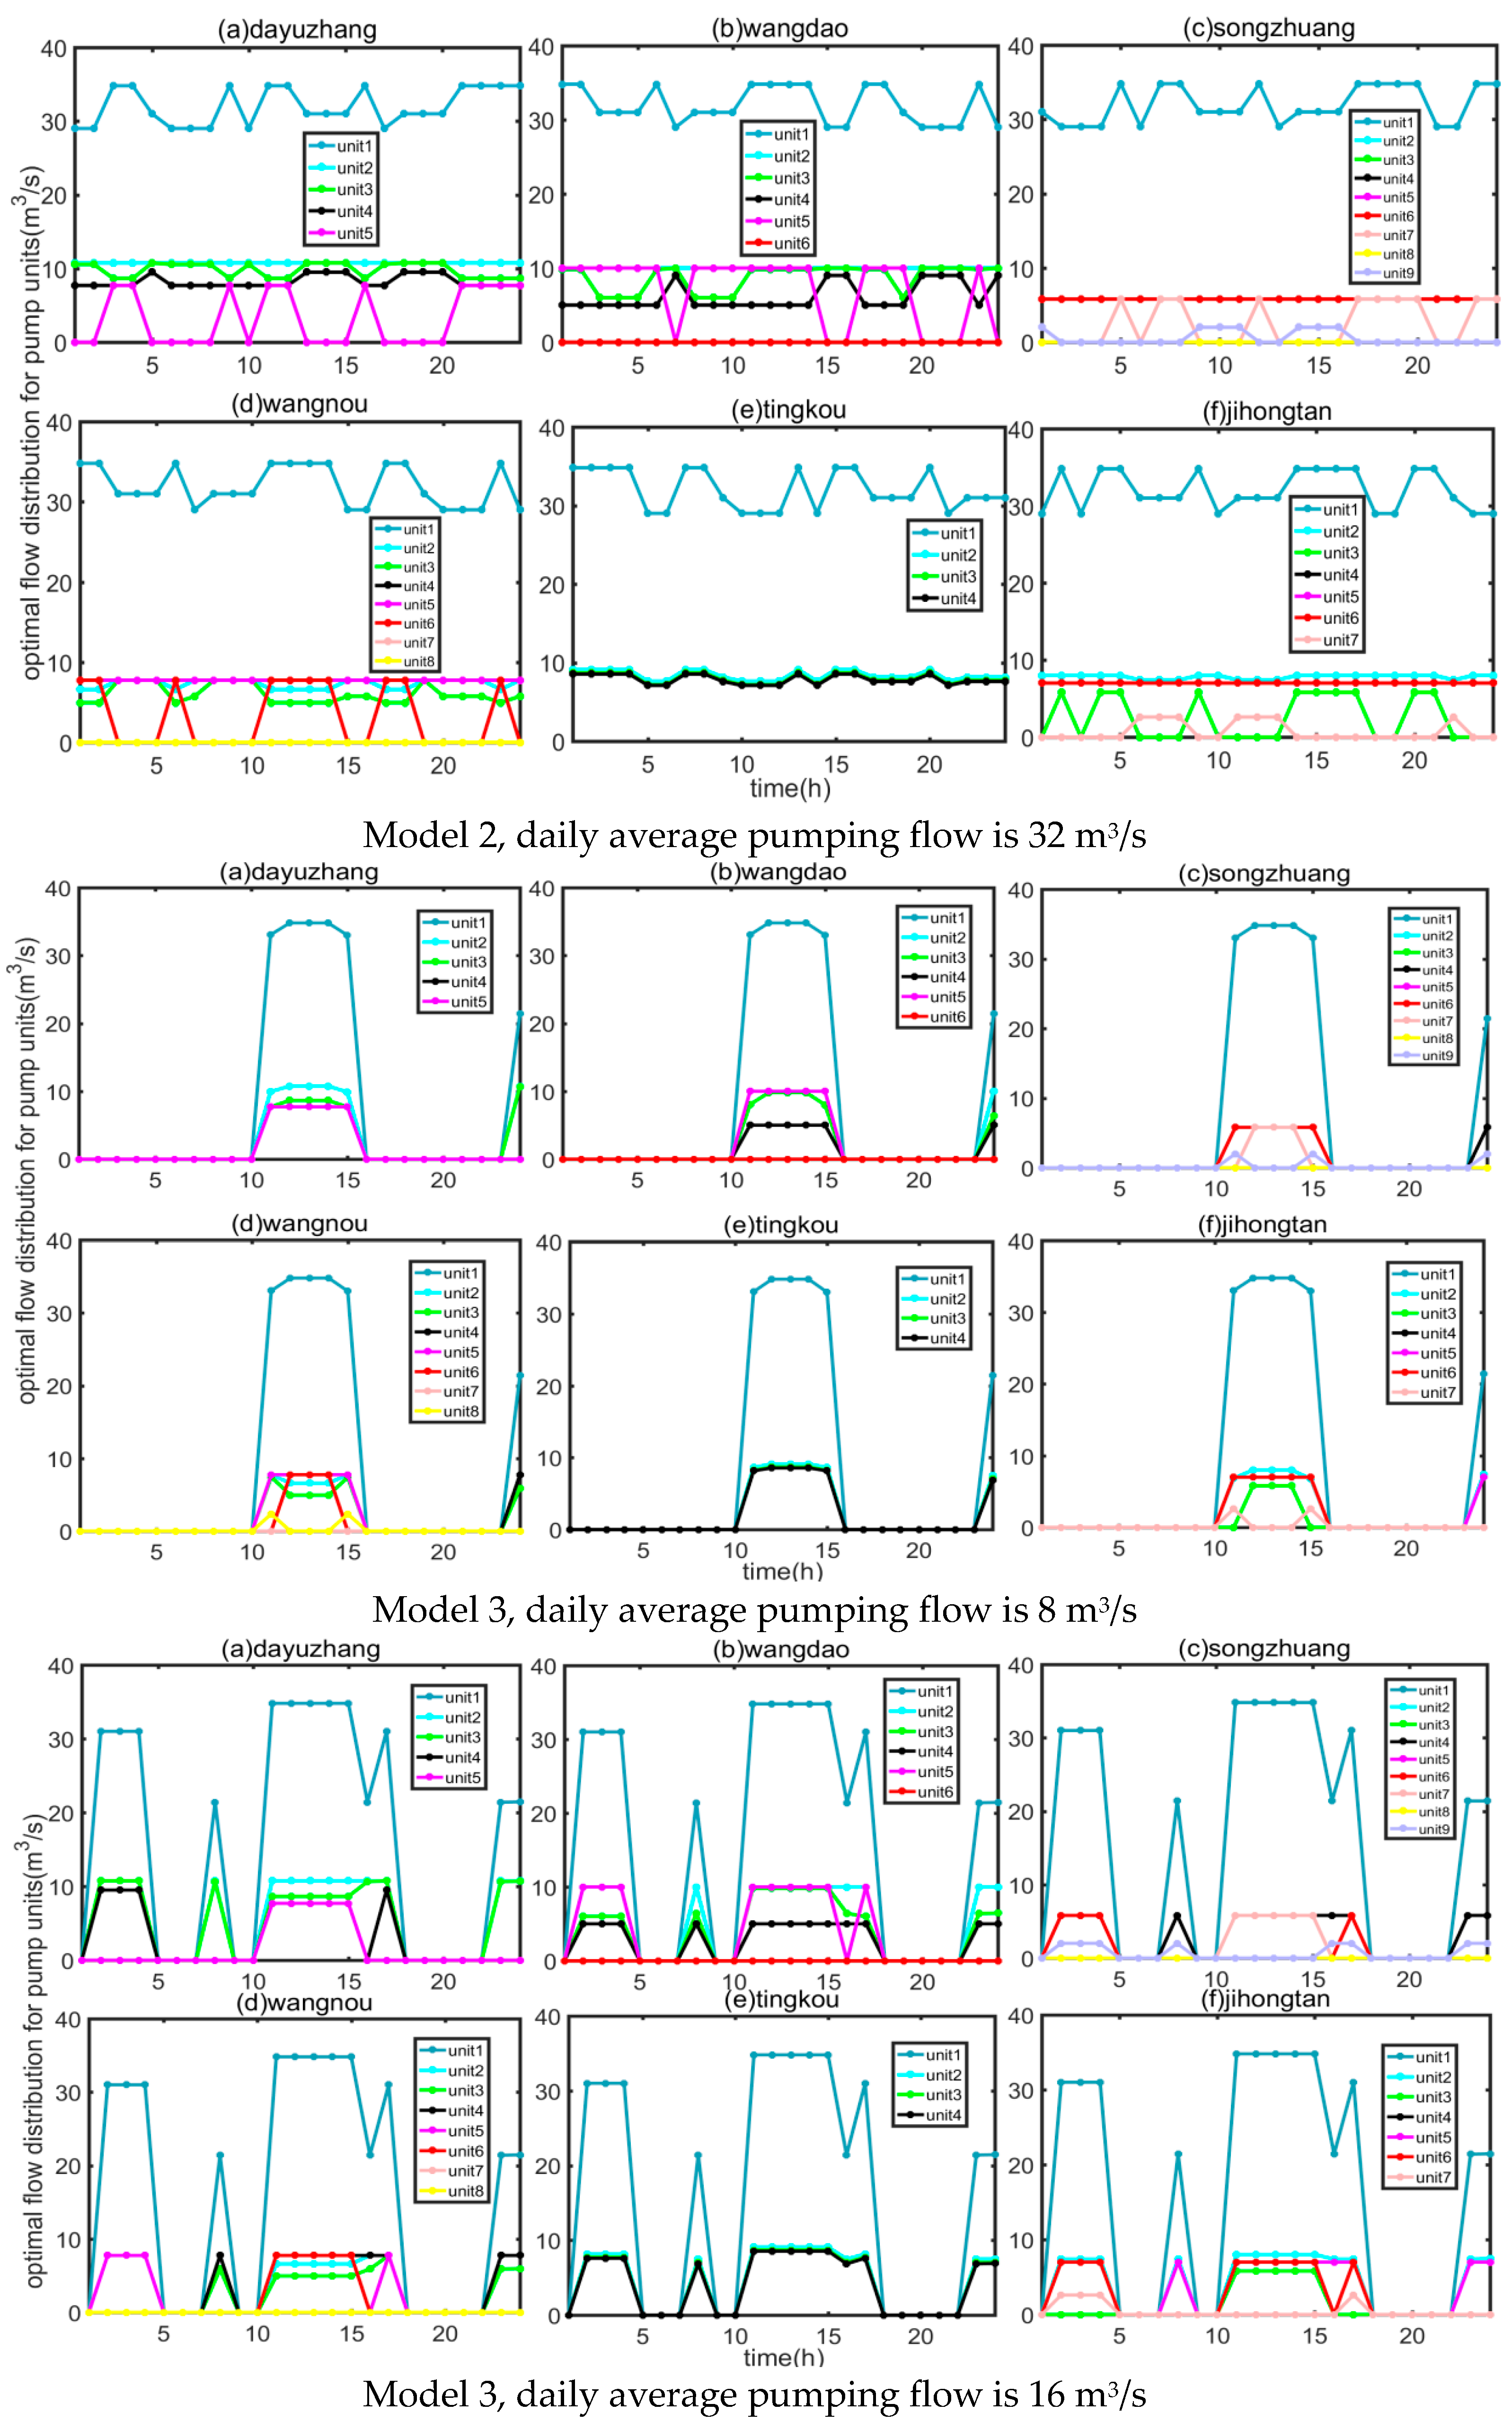
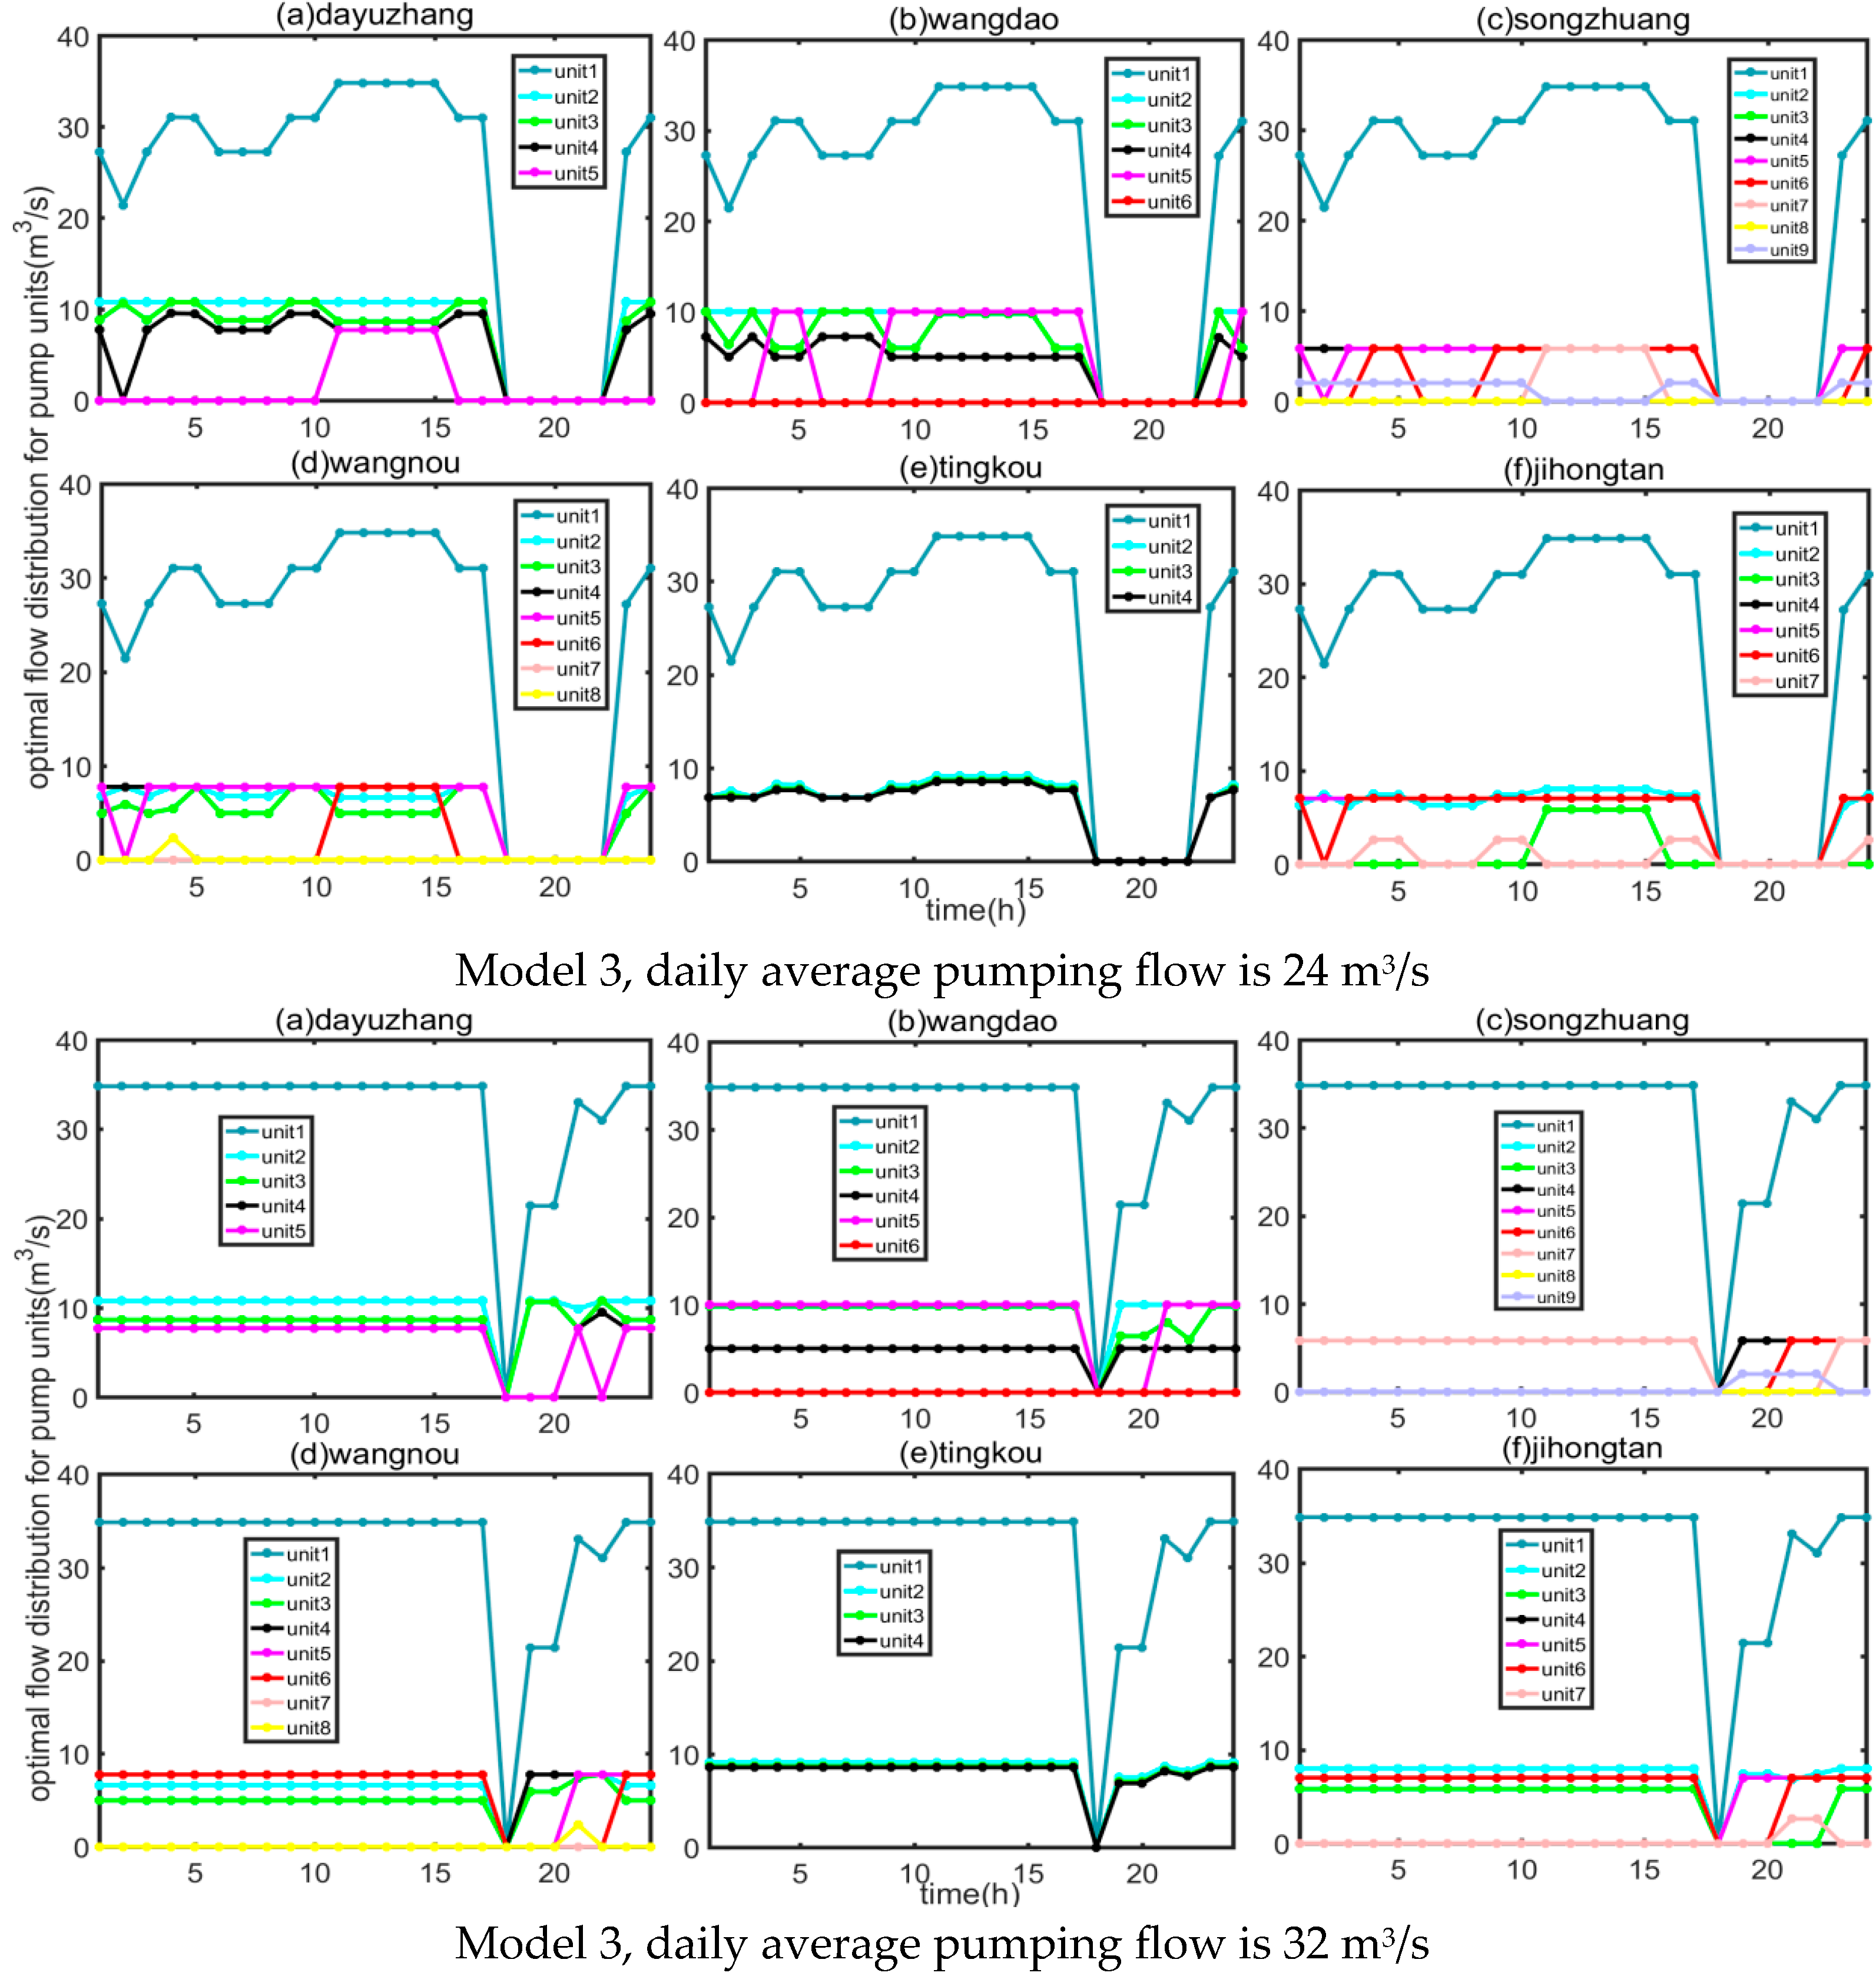
- Model 3: Model 3 aims to minimize the total daily electricity cost and the number of pumping station adjustments. Regulators should implement regulations to make sure the hydraulic transmission times between consecutive pump stations align with integer multiples of 24-h cycles. This strategy would facilitate the operation of all pump stations along the channel, predominantly during periods of low electricity prices.
3.1. Model 1
- (1)
- Objective function: The regulation objective is to minimize the total daily electricity cost of the cascade pumping station group and minimize the number of pump station adjustments, given a specific daily average flow.where cj is the electricity price for pumping during the j-th time period; Nij is the pumping power of the i-th pump station in the j-th time period; Δt is the interval between time periods; Qij is the pumping flow of the i-th pump station during the j-th time period; H is operation head; ρ is water density; g is gravitational acceleration; n is operation efficiency of the pumping station; T is the number of regulation time periods; N is the total number of unit adjustments; ni,k is the adjustment number of the i-th pump station of k-th pump unit.
- (2)
- Constraints:
- (1)
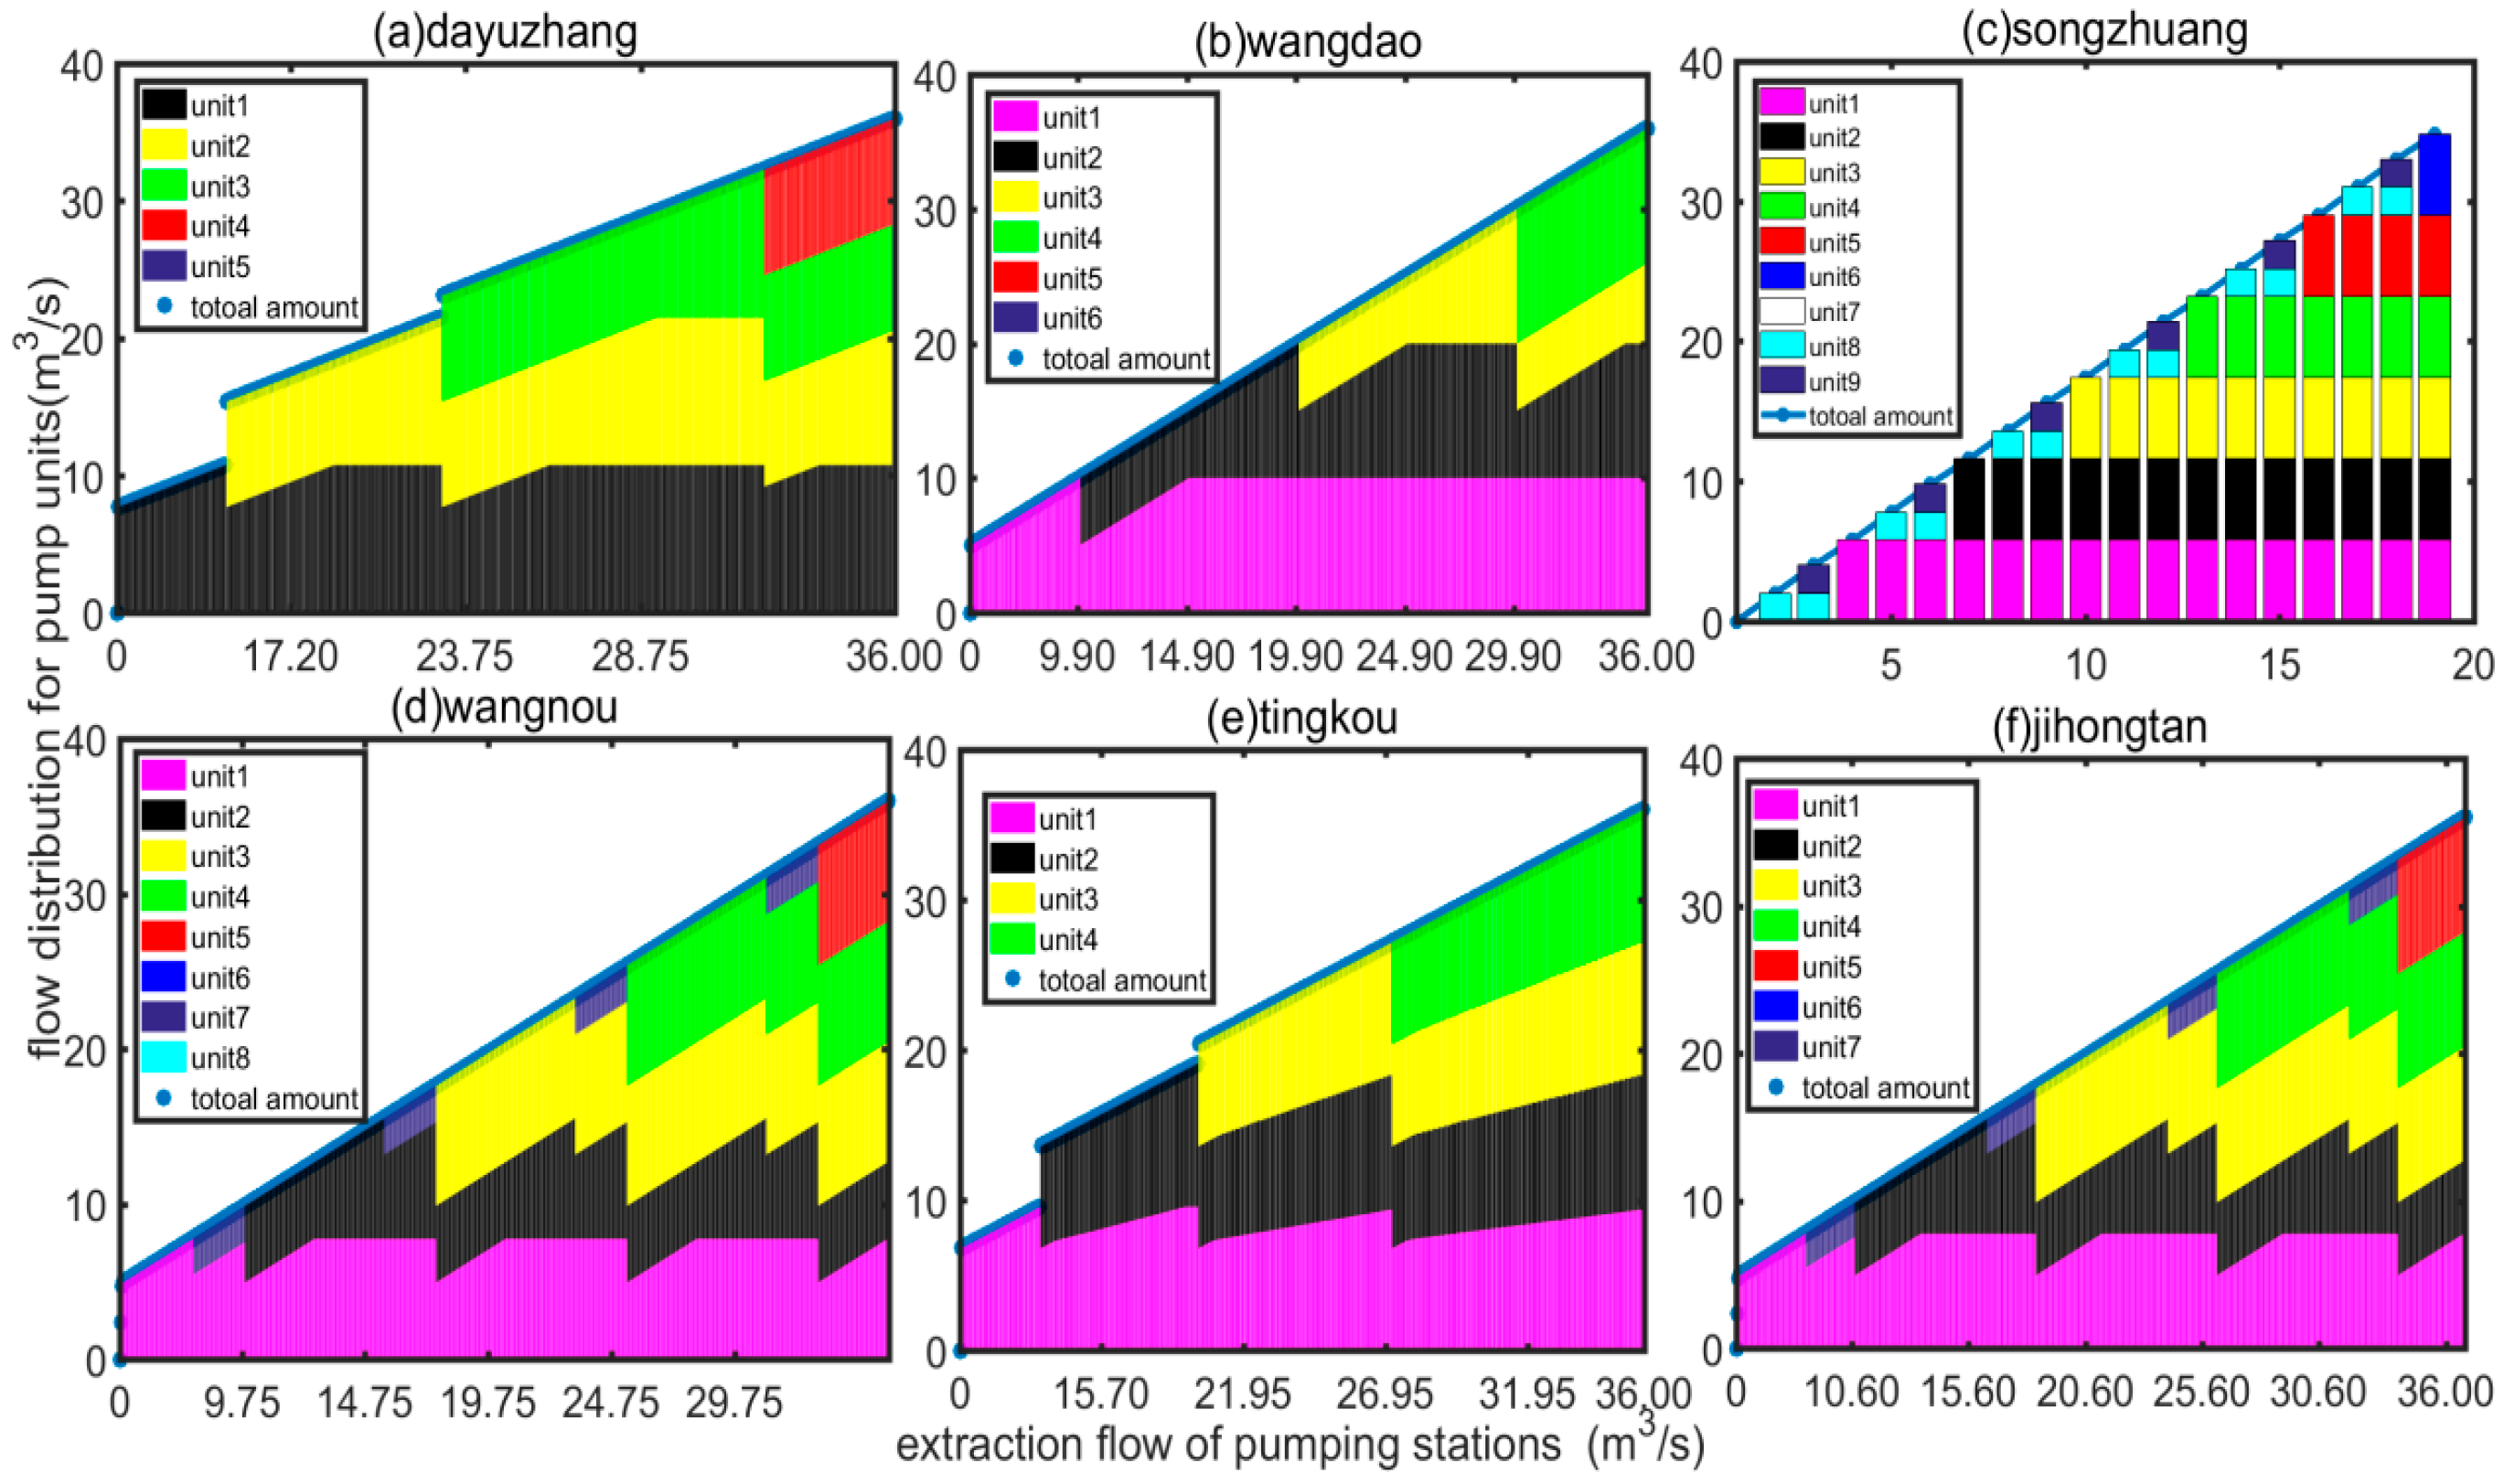
- Pumping flow constraint: The pumping flow of each pump unit does not exceed its maximum operation flow and does not fall below the minimum operation flow:where Qi,k is the pumping flow of the k-th pump unit of the i-th pump station; Qi,k,min is the minimum value of operation flow of the k-th pump unit of the i-th pump station; Qi,k,max is the maximum value of operation flow of the k-th pump unit of the i-th pump station.Qi,k,min ≤ Qi,k ≤ Qi,k,max
- (2)
- Pumping power constraint: The pumping power of each pump unit does not exceed its maximum operation power and does not fall below the minimum operation power:where Pi,k is the pumping power of the k-th pump unit of the i-th pump station, Pi,k,min is the minimum value of the operation power of the k-th pump unit of the i-th pump station; Pi,k,max is the maximum value of the operation power of the k-th pump unit of the i-th pump station.Pi,k,min ≤ Pi,k ≤ Pi,k,max
- (3)
- Constraint of total water regulation volume: The total pumping flow of the pump station group is less than the total water regulation volume:where Q is the total water regulation volume.
3.2. Model 2
- (1)
- Objective function: The objective of the regulation is to minimize the electricity consumption and minimize the number of pump station adjustments (same as Formula (2)):where H is total power consumption of cascade pumping station group.
- (2)
- Constraints: Constraints are the same as (3)–(5).
3.3. Model 3
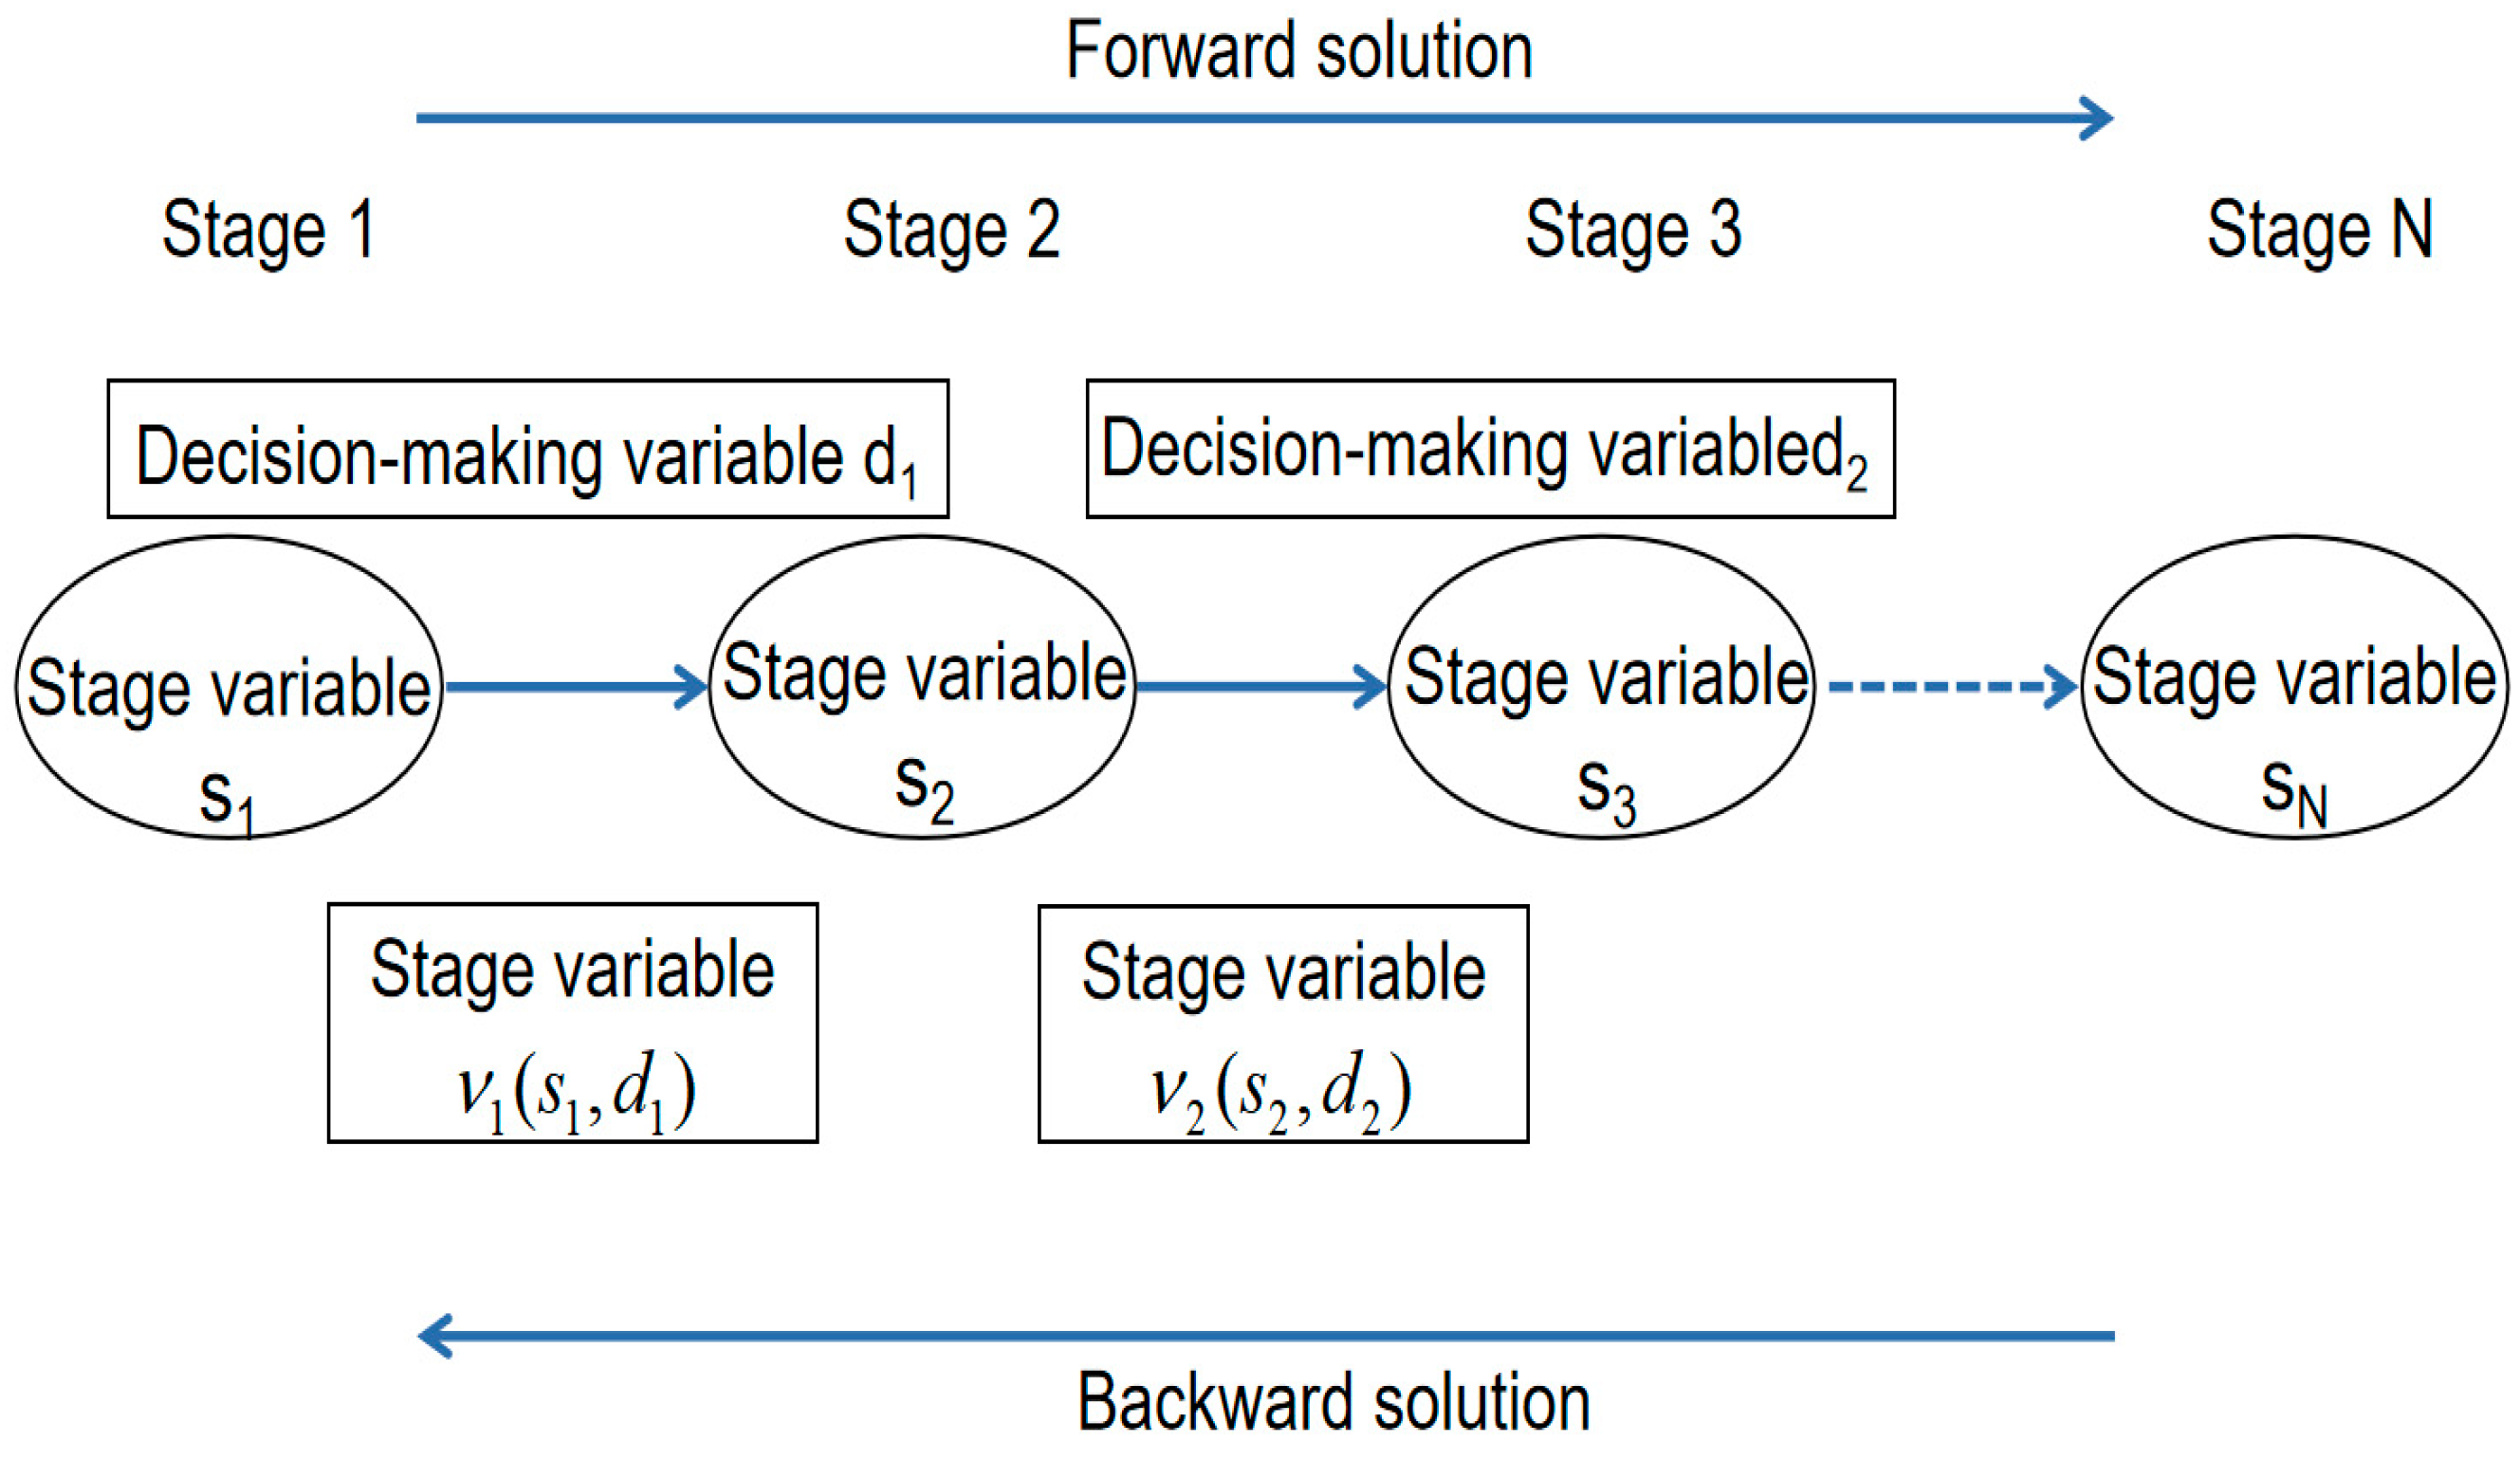
3.4. Model Solution
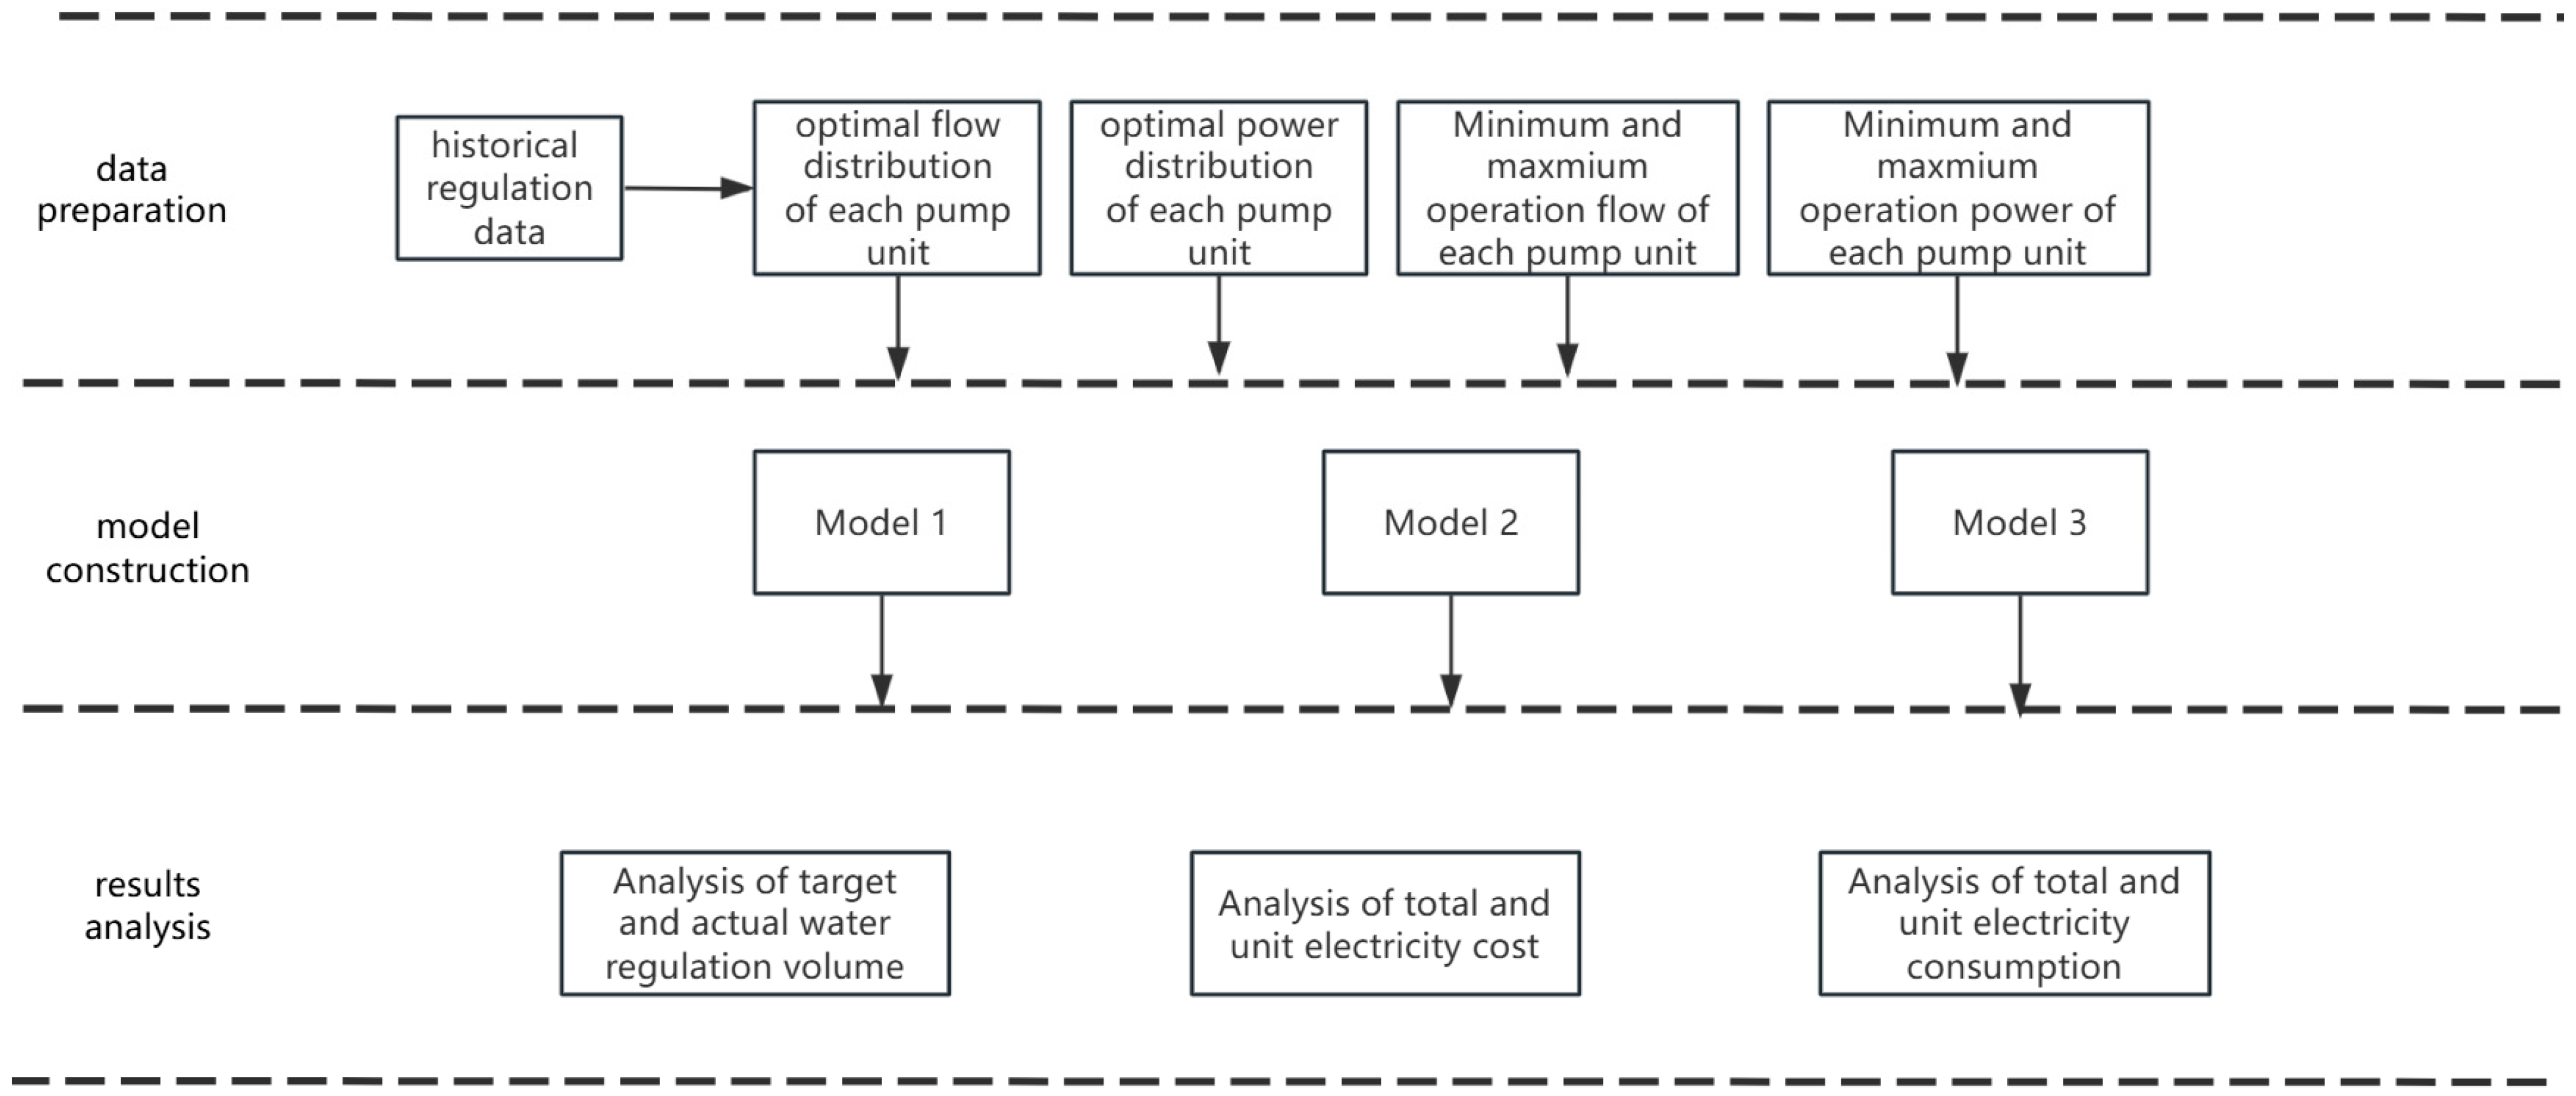
3.5. Research Process
- (1)
- Data preparation: This phase involves the collection and analysis of historical operational data, design parameters, and real-time flow conditions to provide a solid foundation for model development.
- (2)
- Model construction: This phase involves three optimization regulation models for the cascade pumping station to alleviate its operating costs and excessive electricity consumption.
- (3)
- Result analysis: This phase involves comparing the optimized operational schemes with traditional fixed-flow methods to highlight the benefits of the proposed models in terms of cost savings, energy efficiency, and overall system performance.
4. Result and Analysis
4.1. Results of Optimization Regulation Model
4.2. Result Analysis
- (1)
- Analysis of target and actual water regulation volume
- (2)
- Analysis of total and unit electricity cost
- (3)
- Analysis of total and unit electricity consumption
- (4)
- Innovation analysis
4.3. Discussion
- (1)
- Limitations of the Study
- (2)
- Application prospects
5. Conclusions
- (1)
- Analysis of Historical Data: The YQWRP has been constructed for more than 30 years. There are deviations between the actual operational conditions of the project and its design values. The constraint design of this study is determined based on the measured historical operation data of the pump station group, which is more in line with the actual regulation process. This study proposes an innovative optimization method for pump station operation that covers both intra-station and inter-station regulation levels. At the intra-station level, the method breaks the traditional all-open or all-stop operation mode of pumping stations through a systematic optimization scheme, and achieves effective synergy between pumping stations. At the inter-station level, the study optimizes the operation strategy of the pumping station in different tariff periods by considering the time-sharing tariff factor, allowing the pumping station to operate during the lowest-cost periods, thus ensuring the safety of water supply while significantly improving the economic rationality. This optimization method, which integrates intra- and inter-station regulation, provides a new theoretical framework and practical guidance for the economic operation of step pumping stations.
- (2)
- Advantages and suggestions of joint regulation of pump stations and gates: The optimization regulation scheme of Model 3, which considers both time-of-use electricity pricing and regulation and storage of water resources, is the most economical operation scheme. Under various average daily pumping flow conditions, the reduction in operational costs for Model 3 is significantly higher than that of Model 1 and Model 2. However, due to the requirement of Model 3 for the collaborative involvement of gates in hydraulic control, it is recommended for application in research areas where hydraulic installations are well-developed.
- (3)
- Application effect: All models can fully utilize the intraday peak-valley time-of-use electricity pricing policy, effectively reducing the operational costs of the pump station group in the water regulation project. Results indicated that Model 3 scheme performs the best. The application was conducted under conditions of average daily pumping flows of 8 m3/s, 16 m3/s, 24 m3/s, and 32 m3/s, respectively. The operating costs of Model 3 were reduced by 37,100, 38,100, 34,300, and 4400 CNY RMB, respectively, compared to the fixed flow condition.
Author Contributions
Funding
Data Availability Statement
Acknowledgments
Conflicts of Interest
References
- Du, M.; Zhang, Z.; Li, G.; Lei, X. Short-term optimal scheduling scheme of cascade pumping stations in large-seale hydraulic engineering. J. Drain. Irrig. Mach. Eng. 2024, 42, 194–200. [Google Scholar]
- Gao, Z.; Zhang, Z.; Si, Q.; Xue, P.; Lei, X.; Li, Y.; Du, M. Optimization of economic operation mode of pumping staion-reservoir raw wateltransfer system. J. Drain. Irrig. Mach. Eng. 2024, 42, 201–208. [Google Scholar]
- Souza, R.G.; Meirelles, G.; Brentan, B.; Izquierdo, J. Rehabilitation in intermittent water distribution networks for optimal operation. Water 2022, 14, 88. [Google Scholar] [CrossRef]
- Zhang, L.; Hou, X.; Liu, X.; Tian, Y. Optimal scheduling of cascade pumping stations based on improved Harris hawks optimization algorithm. J. Zhejiang Univ. Eng. Ed. 2023, 57, 2501–2512. [Google Scholar]
- Gou, Y.; Zhang, H.; Zhu, X. Daily Economic Operation Optimization Model of Single-stage Pumping Station Based on the Dynamic Programming Method. China Rural. Water Hydropower 2020, 1, 192–196. [Google Scholar]
- Xu, S.; Zhang, Z.; Lei, X.; Du, M.; Jing, X.; Fan, H. Sensitivity Analysis of Optimal Flow Distribution Scheme for A Water Diversion Pump Station. Available online: http://ckyyb.crsri.cn/EN/10.11988/ckyyb.20240514 (accessed on 23 January 2025).
- Napierała, M. A Study on Improving Economy Efficiency of Pumping Stations Based on Tariff Changes. Energies 2022, 15, 799. [Google Scholar] [CrossRef]
- Chen, W.-P.; Tao, T.; Zhou, A.-J.; Zhang, L.; Liao, L.; Wu, X.-M.; Yang, K.; Li, C.-X.; Zhang, T.C.; Li, Z. Genetic optimization toward operation of water intake-supply pump stations system. J. Clean. Prod. 2021, 279, 123573. [Google Scholar]
- Chen, J.; Liu, J.; Huang, B.; David, Z.; Jin, C.; Zhang, H. Optimization of the effective volume of urban sewage pumping station based on the fuzzy optimization method. Water Infrastruct. Ecosyst. Soc. 2024, 73, 2031. [Google Scholar]
- Li, Z.; Zhang, L.; Liu, X. A New Remote Intelligent Monitoring System for Strong Earthquakes in Dams. Water Resour. Power 2024, 42, 164–167+141. [Google Scholar]
- Ma, X.; Zhang, L.; Liu, X.; Tian, Y.; Wang, X.; Deng, X. Optimal scheduling of cascade pumping stations based on sparrow search algorithm. J. Hydroelectr. Eng. 2024, 43, 43–53. [Google Scholar]
- Wang, T.; Liu, J.; Wei, B.; Ye, G.; Liu, H.; Li, J.; Zhu, D. Optimal Operation and Dispatch of Water Supply Pump Station in T City. Water Resour. Power 2021, 39, 120–132. [Google Scholar]
- Zhu, B.; Gong, Y.; Chen, Z.; Wang, S.; Chen, Y. Multi-objective Optimization of Cross-basin Water Pump Station Solved by the Pareto Method. J. Irrig. Drain. 2022, 41, 131–139. [Google Scholar]
- Sun, T.; Wang, Z.; Zhu, B. Research on optimization of ShaanGanNing Yanhuanding Yellow River pumping cascade pump station. Eng. J. Wuhan Univ. 2022. [Google Scholar] [CrossRef]
- Sun, T.; Wang, Z.; Zhu, B. Optimization study on the operation of No. Five Pumping Station in theYanhuan Dingyang Yellow River irrigation district. J. China Inst. Water Resour. Hydropower Res. 2024, 22, 97–107. [Google Scholar]
- Zhang, K.; Cui, G. Research on the Group Level Scheduling Model of Water Intake Pump Stations Based on Decomposition Coordination. Water Wastewater Eng. 2019, 45, 126–130. [Google Scholar]
- Qu, X.; Zhang, Z.; Bai, C.; Du, M.; Tu, Y. Daily optimization scheduling study of parallel pumping stations considering time-of-use electricity pricing. Hydro-Sci. Eng. 2024, 2024, 157–168. [Google Scholar]
- Lu, L.; Chen, Y.; Li, M.; Lei, X.; Ni, Q.; Liu, Z. Spatiotemporal characteristics and potential pollution factors of water quality in the eastern route of the South-to-North Water Diversion Project in China. J. Hydrol. 2024, 638, 131523. [Google Scholar] [CrossRef]
- Zhao, R.; Gan, T.; Wang, X.; Wang, H. Research on Parameters Optimization of optimal schedule model of water resources for Jiaodong Water Transfer Project Based on ICCP model. Water 2023, 15, 2731. [Google Scholar] [CrossRef]
- Gan, T.; Jiang, Y.; Zhao, H.; He, J.; Duan, H. Research on Low Energy Consumption Automatic Regulation of Cascade Gates and Pump in Open-Canal Based on Reinforcement Learning. J. Hydroinformatics 2024, 26, 1673–1691. [Google Scholar]
- Sun, A.; Hu, D.; Shan, C.; Wang, J. Automatic scheduling and control technology of pump gate clusters of regional water conservancy project. Desalination Water Treat. 2023, 293, 82–88. [Google Scholar]
- Lin, W.; Feng, Q.I.; Yi-Ke, S.; Li, X. Screening Water Quality Safety Risks in Catchment from Yellow River to Qingdao by KCFs Recognition Method. China Water Wastewater 2019, 35, 72–77. [Google Scholar]
- Ding, N.; Yang, Y.-Y.; Wan, N.-X.; Xu, A.-L.; Ge, J.-H.; Song, Z.-W. Seasonal Variation and Influencing Factors of Bacterial Communities in Storage Reservoirs. Environ. Sci. 2023, 44, 1484–1496. [Google Scholar]
- Li, Z.-Q.; Yang, X.-L.; Wang, Y. Optimization of operation and decision of Songzhuang pumping station of Jiaodong Water Diversion Project. Water Sci. Eng. Technol. 2017. [Google Scholar] [CrossRef]
- Ghilardi, L.; Naik, S.; Martelli, E.; Casella, F.; Biegler, L.T. Nonlinear dynamic optimization for gas pipelines operation. Comput. Aided Chem. Eng. 2024, 53, 1657–1662. [Google Scholar]
- Jiang, Y.; Jiang, Z.-P. Global Adaptive Dynamic Programming for Nonlinear Polynomial Systems; John Wiley & Sons, Inc.: Hoboken, NJ, USA, 2017; pp. 54–56. [Google Scholar]
- Suo, M.; Xia, F.; Fan, Y. A Fuzzy-Interval Dynamic Optimization Model for Regional Water Resources Allocation under Uncertainty. Sustainability 2022, 14, 1096. [Google Scholar] [CrossRef]
- Wu, X.; Xu, D.; Guo, R.; Wang, M.; Ying, Q. Long-Term Optimal Dispatching of Hydropower Station Based onControlling the Frequency of Reservoir Level Fluctuation. Math. Probl. Eng. 2022, 1–9. [Google Scholar] [CrossRef]
- Mohanavelu, A.; Soundharajan, B.-S.; Kisi, O. Modeling Multi-objective Pareto-optimal Reservoir Operation Policies Using State-of-the-art Modeling Techniques. Water Resour. Manag. 2022, 36, 3107–3128. [Google Scholar]
- Nozari, H.; Liaghat, A.M.; Azadi, S. Management of agricultural saline drainage using system dynamics approach. Water Environ. J. 2022, 36, 299–307. [Google Scholar]


| Pump Station | Name | Design Flow | Design Water Level | Design Net Head |
|---|---|---|---|---|
| pump station 1 | Dayuzhang | 36.0 m3/s | 11.24/16.6 m | 3.02 m |
| pump station 2 | Wangdao | 36.0 m3/s | 1.90/4.45 m | 2.55 m |
| pump station 3 | Songzhuang | 34.5 m3/s | 1.80/10.51 m | 8.71 m |
| pump station 4 | Wangnou | 31.1 m3/s | 2.0/12.05 m | 10.05 m |
| pump station 5 | Tingkou | 29.2 m3/s | 6.26/13.04 m | 6.78 m |
| pump station 6 | Jihongtan | 28.0 m3/s | 4.02/12.0 m | 7.98 m |
| Pump Station | Unit | 1 | 2 | 3 | 4 | 5 | 6 | 7 | 8 | 9 |
|---|---|---|---|---|---|---|---|---|---|---|
| Dayuzhang | Head (m) | 2.20 | 2.20 | 2.20 | 2.20 | 2.20 | / | / | / | / |
| Min flow (m3/s) | 7.70 | 7.70 | 7.70 | 7.70 | 7.70 | / | / | / | / | |
| Max flow (m3/s) | 10.75 | 10.75 | 10.75 | 10.75 | 10.75 | / | / | / | / | |
| Min efficiency | 0.3623 | 0.3623 | 0.3623 | 0.3623 | 0.3623 | / | / | / | / | |
| Max efficiency | 0.4488 | 0.4488 | 0.4488 | 0.4488 | 0.4488 | / | / | / | / | |
| Wangdao | Head (m) | 1.60 | 1.60 | 1.60 | 1.60 | 1.60 | 1.60 | / | / | / |
| Min flow (m3/s) | 5.00 | 5.00 | 5.00 | 10.00 | 10.00 | 10.00 | / | / | / | |
| Max flow (m3/s) | 10.00 | 10.00 | 10.00 | 10.00 | 10.00 | 10.00 | / | / | / | |
| Min efficiency | 0.6014 | 0.6014 | 0.6014 | 0.6014 | 0.6014 | 0.6014 | / | / | / | |
| Max efficiency | 0.6014 | 0.6014 | 0.6014 | 0.6014 | 0.6014 | 0.6014 | / | / | / | |
| Songzhuang | Head (m) | 7.50 | 7.50 | 7.50 | 7.50 | 7.50 | 7.50 | 7.50 | 7.50 | 7.50 |
| Min flow (m3/s) | 5.80 | 5.80 | 5.80 | 5.80 | 5.80 | 5.80 | 5.80 | 2.00 | 2.00 | |
| Max flow (m3/s) | 5.80 | 5.80 | 5.80 | 5.80 | 5.80 | 5.80 | 5.80 | 2.00 | 2.00 | |
| Min efficiency | 0.7133 | 0.7133 | 0.7133 | 0.7133 | 0.7133 | 0.7133 | 0.7133 | 0.5850 | 0.5850 | |
| Max efficiency | 0.7133 | 0.7133 | 0.7133 | 0.7133 | 0.7133 | 0.7133 | 0.7133 | 0.5850 | 0.5850 | |
| Wangnou | Head (m) | 8.80 | 8.80 | 8.80 | 8.80 | 8.80 | 8.80 | 8.80 | 8.80 | / |
| Min flow (m3/s) | 4.95 | 4.95 | 7.75 | 7.75 | 7.75 | 7.75 | 2.35 | 2.35 | / | |
| Max flow (m3/s) | 7.75 | 7.75 | 7.75 | 7.75 | 7.75 | 7.75 | 2.35 | 2.35 | / | |
| Min efficiency | 0.7600 | 0.7600 | 0.7600 | 0.7600 | 0.7600 | 0.7600 | 0.7275 | 0.7275 | / | |
| Max efficiency | 0.7600 | 0.7600 | 0.7600 | 0.7600 | 0.7600 | 0.7600 | 0.7275 | 0.7275 | / | |
| Tingkou | Head (m) | 6.78 | 6.78 | 6.78 | 6.78 | / | / | / | / | / |
| Min flow (m3/s) | 6.80 | 6.80 | 6.80 | 6.80 | / | / | / | / | / | |
| Max flow (m3/s) | 9.55 | 9.55 | 9.55 | 9.55 | / | / | / | / | / | |
| Min efficiency | 0.6945 | 0.6945 | 0.6945 | 0.6945 | / | / | / | / | / | |
| Max efficiency | 0.6334 | 0.6334 | 0.6334 | 0.6334 | / | / | / | / | / | |
| Jihongtan | Head (m) | 7.50 | 7.50 | 7.50 | 7.50 | 7.50 | 7.50 | 7.50 | / | / |
| Min flow (m3/s) | 5.80 | 5.80 | 7.00 | 7.00 | 7.00 | 2.60 | 2.60 | / | / | |
| Max flow (m3/s) | 8.55 | 8.55 | 7.00 | 7.00 | 7.00 | 2.60 | 2.60 | / | / | |
| Min efficiency | 0.6225 | 0.6225 | 0.6559 | 0.6559 | 0.6559 | 0.6559 | 0.6559 | / | / | |
| Max efficiency | 0.6225 | 0.6225 | 0.6559 | 0.6559 | 0.6559 | 0.6559 | 0.6559 | / | / |
| Flow Condition | Target Water Volume (104 m3) | Actual Water Regulation Volume (104 m3) | Water Regulation Completion Rate (%) | ||||||
|---|---|---|---|---|---|---|---|---|---|
| Fix Flow | Model2 | Model1 | Model3 | Fix Flow | Model2 | Model1 | Model3 | ||
| 8 m3/s | 69.12 | 67.39 | 68.92 | 69.05 | 69.06 | 97.50 | 99.71 | 99.90 | 99.92 |
| 16 m3/s | 138.24 | 134.78 | 138.05 | 138.17 | 138.11 | 97.50 | 99.87 | 99.95 | 99.91 |
| 24 m3/s | 207.36 | 200.45 | 207.28 | 207.26 | 207.31 | 96.67 | 99.96 | 99.95 | 99.97 |
| 32 m3/s | 276.48 | 267.84 | 276.48 | 276.45 | 276.48 | 96.88 | 100.00 | 99.99 | 100.00 |
| Flow Condition | Electricity Cost (104 CNY RMB) | Unit Electricity Cost (CNY RMB/m3) | ||||||
|---|---|---|---|---|---|---|---|---|
| Fix Flow | Model1 | Model2 | Model3 | Fix Flow | Model1 | Model2 | Model3 | |
| 8 m3/s | 6.93 | 5.75 | 6.27 | 3.22 | 0.1028 | 0.0833 | 0.0910 | 0.0467 |
| 16 m3/s | 13.73 | 12.13 | 13.27 | 9.92 | 0.1019 | 0.0878 | 0.0961 | 0.0718 |
| 24 m3/s | 20.15 | 19.05 | 20.06 | 16.72 | 0.1005 | 0.0919 | 0.0968 | 0.0807 |
| 32 m3/s | 26.46 | 27.03 | 27.42 | 26.02 | 0.0988 | 0.0978 | 0.0992 | 0.0941 |
| Flow Condition | Electricity Consumption (104 kWh) | Unit Electricity Consumption (kWh/m3) | ||||||
|---|---|---|---|---|---|---|---|---|
| Fix Flow | Model1 | Model2 | Model3 | Fix Flow | Model1 | Model2 | Model3 | |
| 8 m3/s | 9.85 | 9.72 | 9.69 | 9.87 | 0.1462 | 0.1408 | 0.1406 | 0.1429 |
| 16 m3/s | 19.54 | 19.46 | 19.39 | 19.56 | 0.1450 | 0.1409 | 0.1405 | 0.1416 |
| 24 m3/s | 28.67 | 29.36 | 29.12 | 29.34 | 0.1430 | 0.1417 | 0.1405 | 0.1415 |
| 32 m3/s | 37.65 | 39.44 | 39.14 | 39.45 | 0.1406 | 0.1426 | 0.1416 | 0.1427 |
Disclaimer/Publisher’s Note: The statements, opinions and data contained in all publications are solely those of the individual author(s) and contributor(s) and not of MDPI and/or the editor(s). MDPI and/or the editor(s) disclaim responsibility for any injury to people or property resulting from any ideas, methods, instructions or products referred to in the content. |
© 2025 by the authors. Licensee MDPI, Basel, Switzerland. This article is an open access article distributed under the terms and conditions of the Creative Commons Attribution (CC BY) license (https://creativecommons.org/licenses/by/4.0/).
Share and Cite
Zheng, Y.; Gu, Y.; Wang, C.; Wang, H.; Gan, T. Economic Operation Scheme of Cascade Pump Station Group Under the Power Market Situation—Taking the Yellow River to Qingdao Project as an Example. Water 2025, 17, 1004. https://doi.org/10.3390/w17071004
Zheng Y, Gu Y, Wang C, Wang H, Gan T. Economic Operation Scheme of Cascade Pump Station Group Under the Power Market Situation—Taking the Yellow River to Qingdao Project as an Example. Water. 2025; 17(7):1004. https://doi.org/10.3390/w17071004
Chicago/Turabian StyleZheng, Ying, Yu Gu, Chao Wang, Hailong Wang, and Tian Gan. 2025. "Economic Operation Scheme of Cascade Pump Station Group Under the Power Market Situation—Taking the Yellow River to Qingdao Project as an Example" Water 17, no. 7: 1004. https://doi.org/10.3390/w17071004
APA StyleZheng, Y., Gu, Y., Wang, C., Wang, H., & Gan, T. (2025). Economic Operation Scheme of Cascade Pump Station Group Under the Power Market Situation—Taking the Yellow River to Qingdao Project as an Example. Water, 17(7), 1004. https://doi.org/10.3390/w17071004