1. Introduction
Flood disasters are one of the most frequently occurring, severely damaging, and highly impactful natural calamities worldwide [
1,
2,
3]. Affected by global change and urbanization, extreme global hydrometeorological events occur frequently [
4,
5,
6,
7]. According to global estimates, floods affected over 2.3 billion people and caused 157,000 deaths between 1995 and 2015 [
8]. Since the end of the 20th century, it has been estimated that floods have caused USD 386 billion in global economic losses [
9]. Influenced by the monsoon climate, typhoons, and complex terrain, China experiences concentrated heavy rainfall and flooding [
10,
11,
12], becoming one of the countries with the most frequent flood disasters in the world [
13]. China’s coastal areas are the main areas affected by typhoons [
14]. However, more than half (56%) of typhoons move northward to the middle latitudes of China every year [
15], becoming the main rainfall system in northern China and other places [
16]. Approximately half of China’s territory can experience precipitation due to the influence of landfalling typhoons [
17]. About two-thirds of our nation’s land area, 80% of its arable land, and over 70% of its industrial and agricultural output value are threatened by flood disasters to varying degrees [
18]. Particularly in the windward regions of the Taihang–Yanshan Mountains, the abrupt changes in terrain cause warm and moist air currents to be lifted by the terrain, enhancing moisture convergence and making this area a concentrated zone for heavy rainstorms [
19,
20]. From 2001 to 2020, the annual average population affected by flood disasters in China exceeded 100 million, with direct economic losses amounting to 167.86 billion yuan [
21,
22]. In the past decade, the trend of typhoons landing in China has increased [
23], and the average annual economic losses caused by flood disasters in China have risen to approximately 223.93 billion yuan. Taking 2014 as an example, 28 provinces (autonomous regions and municipalities directly under the central government) across the nation suffered from varying degrees of flood disasters, resulting in 485 deaths, with 73.82 million people affected, and direct economic losses exceeding 150 billion yuan [
24]. Flood disasters have become an important reason for restricting obstacles in cities in China [
25].
As the capital of China, Beijing is one of the typical representatives of megacities around the world, with a resident population of more than 20 million [
26]. Beijing falls within the range of typhoon-induced wind and rain impacts [
17]. The interaction between typhoons and troughs (vortexes) constitutes one of the primary synoptic systems influencing rainfall events in Beijing [
27]. Coupled with orographic lifting, blocking effects, and trumpet-shaped topographic convergence in the region, these systems not only significantly intensify heavy rainfall but also alter localized precipitation patterns [
28,
29,
30]. The extreme rainstorm process in Beijing on 21 July 2012 (called “7·21”) was the result of the cooperation of high- and low-altitude, mid-latitude systems, surface convergence lines, and terrain. The maximum rainfall in 24 h was in Fangshan District [
31,
32]. On 16 July 2018, an extreme rainstorm in Beijing (called “7·16”) was caused by the combination of the northward movement of the residual typhoon circulation and the surface convergence line. The rainfall center lasted for nearly 4 h at the trumpet-shaped terrain in the northern part of Miyun [
33]. Although mechanistic understanding of flood-inducing factors in Beijing has advanced substantially, prevailing research practices remain constrained by oversimplified attribution to single dominant factors, largely neglecting the complex interplay between topographic dynamics and atmospheric precipitation processes.
Beijing has been affected by floods for a long time [
24]. Under the influence of typhoons, extreme precipitation events have occurred many times, causing heavy casualties and economic losses [
34]. For instance, from 31 July to 2 August 2023, due to the impact of Typhoon “Duksuri”, the city suffered heavy rains and floods (called “7·31”), resulting in 33 deaths, 18 disappearances, and nearly 1.29 million people affected, and economic losses reached 10 billion CNY (approximately 1.4 billion USD, based on the 2023 average exchange rate). On 21 July 2012, influenced by Typhoon “Vicente”, the rainstorm event caused at least 79 deaths in Beijing, 1.602 million people were affected, and the economic loss reached 11.64 billion yuan. In July 1972, due to rainfall influenced by Typhoon Rita, Beijing experienced 55 deaths and disappearances, and 1406 houses collapsed. In August 1956, Beijing was affected by rains involving Typhoon “Wanda”, resulting in at least 10 deaths and disappearances and the collapse of 64,618 houses. Typhoon rainstorm flood disasters occur frequently in Beijing, and the historical lessons are profound. Therefore, this study investigates the characteristics and disaster-causing mechanism of typhoon rainstorm flood disasters in Beijing by analyzing long-term flood disaster records and the extreme “7·31” rainstorm event, aiming to provide scientific references for future regional flood prevention and control.
2. Overview of the Study Area
2.1. Terrain Features
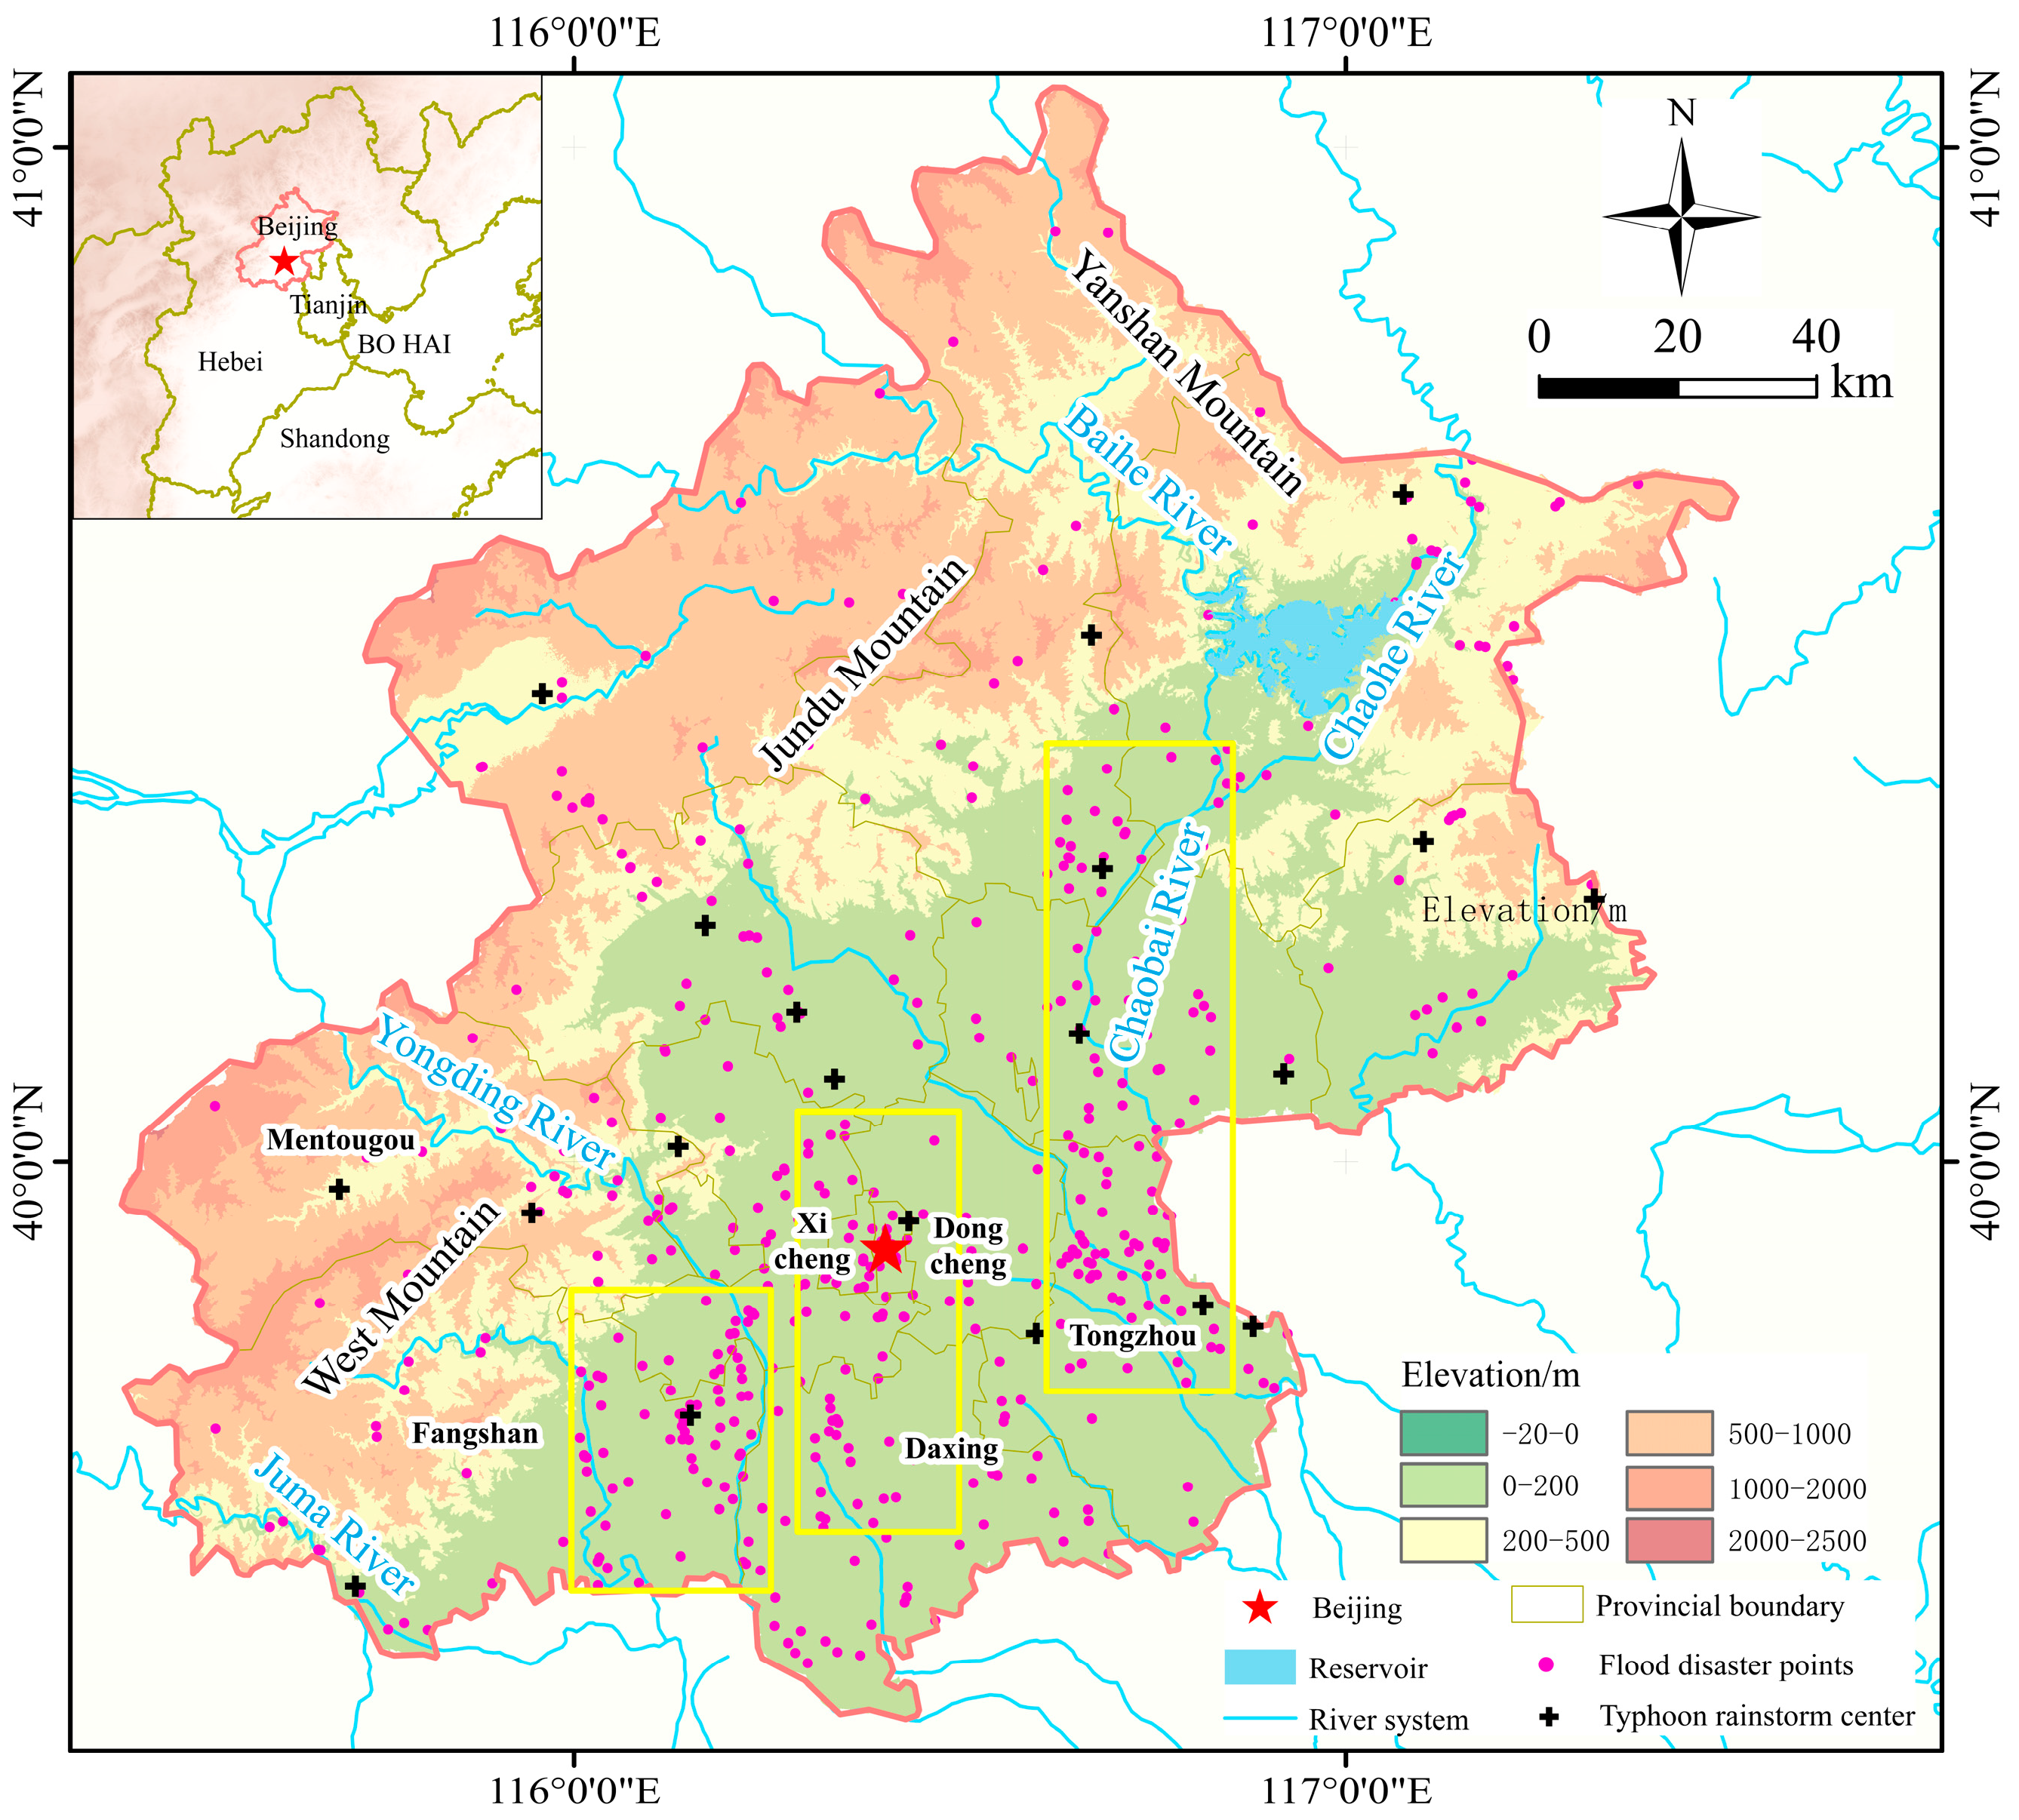
Beijing (115°25′–117°30′ E, 39°28′–41°05′ N) is situated at the northeastern extremity of the North China Plain, occupying the central sector of the Haihe River Basin. It is located in the transition zone between the mountains and plains of China. The total area of Beijing is about 16,400 km
2, of which the mountainous area is about 1040 km
2, accounting for 61% of the total area of Beijing [
26]. The terrain of Beijing gradually rises from southeast to northwest. The western part is the Xishan Mountains (an extension of the Taihang Mountains), while the northern part is the Jundu Mountains (part of the Yanshan Mountains). These two mountain ranges converge at the Nankou Pass, enclosing the Beijing Plain within their embrace. It presents a geomorphological pattern of ‘two mountains sandwiching one basin’ and backing mountains and facing the sea. The highest point in the region is Dongling Mountain in Mentougou, with an altitude of 2303 m. The lowest point is Chaichangtun in Tongzhou District, with an altitude of only 8.2 m, resulting in a significant relative elevation difference (
Figure 1).
2.2. Meteorological and Hydrological Characteristics
Beijing is situated in a warm temperate semi-humid zone and features a typical temperate continental monsoon climate characterized by four distinct seasons and recurrent drought–flood events. The summer precipitation accounts for about 72.3% of the annual precipitation [
26]. The rainfall is concentrated, with heavy rainfall episodes. Winter is cold and dry, and the frost-free period is 6~7 months. Winters persist under cold, arid conditions (6–7-month frost-free period), while annual meteorological parameters show a mean temperature range of 10–12 °C and precipitation averaging 600 mm [
35]. The maximum annual rainfall recorded is 1406.0 mm (1869), while the minimum annual rainfall is 242.0 mm (1869), resulting in a difference of 1160.0 mm [
26].
3. Data and Research Methods
The data in this study are derived from historical documents on flood disasters in Beijing [
36] and records of flood events over the past 1000 years from sources such as the National Bureau of Statistics (
stats.gov.cn, accessed on 20 December 2024). Records of flood disasters have spanned a long period, with the documentation gradually becoming more detailed, comprehensive, and reliable. Limiting the scope to the period from 1000 to 2023, we divided the data into six time segments to statistically analyze flood disaster events, including direct economic losses, deaths (including missing persons), affected crop areas, and affected populations; data sources include the 2023 NCEP/NCAR daily reanalysis data, rainfall data from the Zhangfang Hydrological Station in Beijing, typhoon track data for “Doksuri” and “Khanun” from the China Meteorological Administration in 2023, and cross-sectional data of the Juma River Basin obtained through field measurements by the authors in November 2023.
(1) The comprehensive disaster index (
) is a quantitative disaster assessment index obtained through normalizing and weighted summation of a series of disaster evaluation factors, which can comprehensively reflect disaster information [
37]. The calculation formula is as follows:
In the formula, represents the normalized indicator, is the original value of the indicator, and are the maximum and minimum values of the indicator in the disaster event, respectively, denotes the weight of the -th indicator, and stands for the comprehensive disaster index. The comprehensive disaster index is utilized to quantitatively assess the losses caused by typhoon rainstorm flood disasters and non-typhoon rainstorm flood disasters in the Beijing region from 1949 to 2023, comparing the severity of typhoon rainstorm flood disasters with that of non-typhoon rainstorm flood disasters.
(2) According to the measured flood mark water level of the Juma River, the flood discharge at the measured flood mark position was calculated by using the calculation method of the constant flow surface line of the natural river channel [
38]. The calculation formula is as follows:
In the formula, represent The water level elevation (m) corresponding to the upstream and downstream cross-sections; are the velocity head (m) of the lower section and the upper section, respectively; and and are the head loss along the upstream and downstream sections and the local head loss (m), respectively. According to the measured flood marks in the Juma River Basin, the flood discharge was calculated, and the frequency of return period was analyzed.
(3) To analyze the spatial and temporal distribution and regularity of water vapor transport, Grid Analysis and Display System (GRADS) software (2.0.a9) was used to enable us to use the NCEP/NCAR reanalysis data. We calculated the zonal moisture flux (
) and meridional moisture flux (
) of the entire atmosphere from the surface (
) to a specific atmospheric level in the region during the influence of Typhoon “Doksuri” [
39]:
Among them, is the ground pressure; q is the specific humidity; is the zonal wind; is the radial wind; and g is the acceleration of gravity. Water vapor transport flux unit: . In GRADS software (2.0.a9), script files were written according to Formula (4) and Formula (5) to calculate the daily average water vapor transport flux over Beijing from 29 July to 2 August 2023 and draw the water vapor flux map to explore its water vapor transport path and change.
4. High-Frequency Typhoon Driving Characteristics of Regional Historical Flood Disasters
Based on regional historical flood disaster data, this chapter reveals the characteristics of high-frequency typhoon-driven flood disasters from the perspectives of spatial distribution and disaster attributes. The intrinsic relationship between terrain and disasters is explored by examining the spatial distribution of disasters. From a temporal dimension, the high-frequency outbreak characteristics of flood disasters under the influence of typhoons are analyzed, and their proportion in historical flood disaster events, as well as the resulting economic losses, are quantified.
4.1. Flood Disasters Concentration in the Plain Area and the High-Frequency Outbreak
Flood disasters are widely distributed in Beijing and occur in every district and county, but they are more concentrated and more frequent in low-altitude areas. Daxing District is situated within the alluvial-pluvial plain of the Yongding River, whereas Tongzhou District is located in the alluvial-pluvial plains of the Yongding and Chaobai Rivers. Both regions feature an extensive river network, rendering them the most flood-prone areas in Beijing, with a high frequency of flood disasters. A total of 520 flood disaster events occurred at the district and county level, with Daxing and Tongzhou districts accounting for a high proportion. This has resulted in a high-frequency flood disaster zone characterized by waterlogging in the urban districts (Dongcheng and Xicheng), dense point patterns in the lower reaches of the Yongding River, and a belt-like distribution along the banks of the Chaobai River (including the Juma River) (
Figure 1). To ensure the veracity and dependability of flood disaster documentation, a comprehensive database was established by meticulously cross-referencing and integrating multiple archival sources about historical flood events in Beijing, complemented by authoritative records from the National Bureau of Statistics (
stats.gov.cn, accessed on 20 December 2024).
The analysis revealed significant discontinuities and biases in the flood disaster records of Beijing between 1000 and 1200 AD, which could potentially lead to distortions in the frequency statistics of such events. To ensure the reliability of the research, the effective observation period was determined to span from 1200 to 2023 AD, encompassing a total of 823 years of historical records. This period was subsequently divided into five consecutive intervals for comparative analysis (
Table 1).
Over the 600 years from 1200 to 1800, the average recurrence interval of flood disasters in Beijing ranged between 2.41 and 2.7 years. During the period of 1800–2000, the frequency of flood events increased to 118 occurrences, with the recurrence interval shortening to 1.69 years, representing a 61.6% increase in frequency compared to the previous period. From 2000 to 2023, flood disasters were recorded in 12 distinct years, corresponding to a recurrence interval of 1.92 years. Although this indicates a slight decrease in frequency relative to the preceding period, it remains significantly higher than the 1200–1800 average. Notably, from 1800 to 2023, the average recurrence interval of flood disasters in Beijing consistently remained below the 3-year return period, indicating a persistently high frequency of flood occurrences.
From 1800 to 2000, Beijing underwent a phase of rapid development in the modern era, with urbanization progressing swiftly. Relevant research indicates that the advancement of urbanization can influence the occurrence of urban floods [
40,
41,
42,
43,
44]. In the nascent period of the establishment of the People’s Republic of China, Beijing’s built-up area measured merely 109 km
2. Over the next 50 years, its urban built-up area increased approximately tenfold [
24]. From the 1960s to the 1970s, the annual increase in land use area was approximately 6 km
2. Starting in the 1980s, the average yearly increase reached about 35 km
2. After entering the 21st century, the urban land area expanded by over 60 km
2 per year [
45]. Based on the analysis of land use data (1980, 1990, 2000, 2005, 2010, and 2015) in Beijing, Beijing’s urban and rural construction land expanded significantly, increasing from 33.14% in 1980 to 66.32% in 2015. Meanwhile, the area of cultivated land has sharply decreased from 56.86% to 24.98%, while other land types have remained relatively stable [
24]. The sharp increase in the construction of land increases regional impervious areas and the risk of urban flood disasters [
46]. Since 2000, more than half of the years in Beijing have experienced flood disasters, with flood disaster years accounting for 52.2% (
Table 1), indicating that flood disasters remain high frequency.
4.2. Typhoon Rainstorm Flood Disasters Account for a High Proportion and Result in Significant Losses
From 1949 to 2023, Beijing was affected by flood disasters in 45 years, of which 26 years were affected by typhoons landing (
Figure 2). The proportion of flood disaster years to the total statistical period is 60.8%, and the proportion of typhoon rainstorm flood disaster years to total flood disaster years is 57.8% (2.8-year return period). During the same period, the ratios of flood disaster years to flood disaster years under the influence of typhoons in Henan Province, Hubei Province, Tianjin City, and Hebei Province were 35.59%, 35%, 29%, and 28%, respectively. In contrast, Beijing has a higher proportion of years with typhoon-induced flood disaster events. The high-frequency period for flood disasters in Beijing occurs from June to August each year (
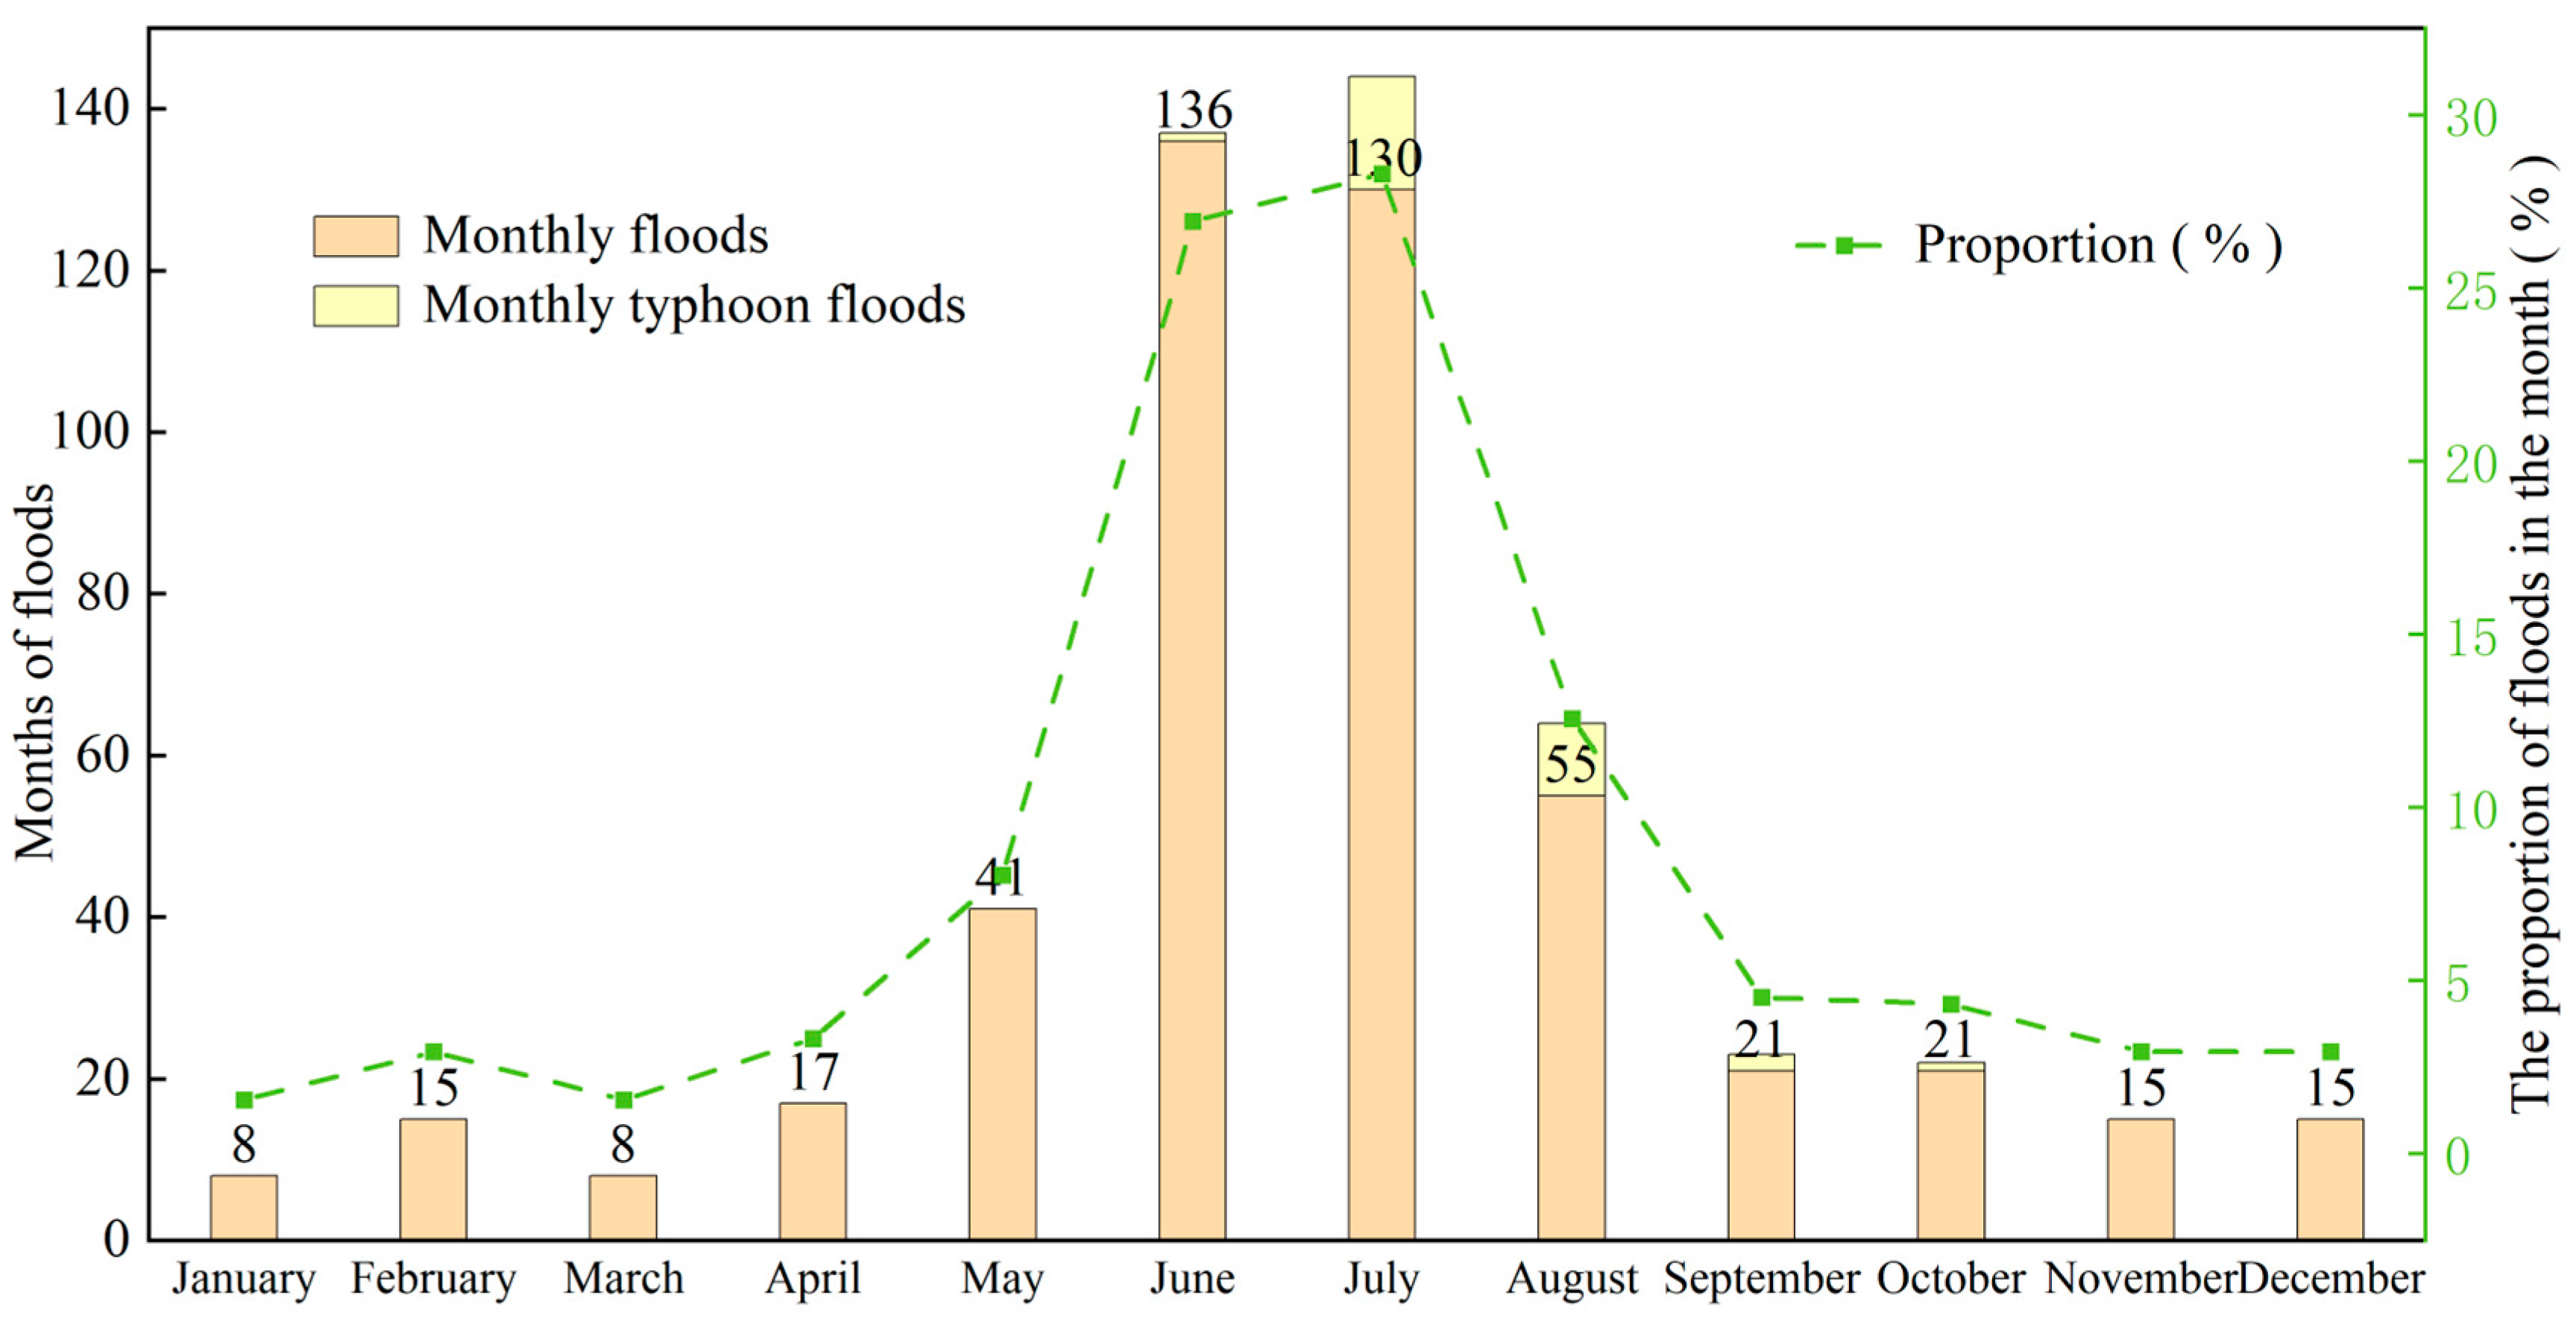
Figure 3), with flood disasters during the summer and autumn seasons (May to October) accounting for 84.68% of the annual total.
The losses caused by typhoon-induced rainstorm floods and non-typhoon-induced rainstorm floods in the Beijing region from 1949 to 2023 were quantitatively evaluated using the comprehensive disaster index (
). In this study, three indicators were selected: the total number of deaths and missing persons, the number of collapsed houses/rooms, and the affected area of crops/million mu. After excluding disaster events with more than two missing indicators, a total of 18 typhoon-induced rainstorm flood events and 19 non-typhoon-induced rainstorm flood events were statistically analyzed. In the disaster indicator data, all zero values were replaced with 0.01. The weights assigned to the indicators were 0.5, 0.3, and 0.2 [
37], respectively. The comprehensive disaster index (
), mean, and variance for both typhoon-induced rainstorm flood events and non-typhoon-induced rainstorm flood events were calculated. A time series model was subsequently established, as illustrated in
Figure 4.
From the calculation results, it is evident that the maximum comprehensive disaster index (
) for typhoon-induced rainstorm flood events is 0.56, the minimum is 0.003, and the mean is 0.31 (
Figure 4a). For non-typhoon-induced rainstorm flood events, the maximum
is 0.71, the minimum is 0.0017, and the mean is 0.138 (
Figure 4b). The mean value of the comprehensive disaster index (
) indicates that the overall losses caused by typhoon-induced rainstorm flood events are higher than those caused by non-typhoon-induced rainstorm flood events.
The statistics of the top 10 rainstorm and flood disasters in Beijing from 1949 to 2023 are shown in
Table 2.
By analyzing the top 10 flood disaster events ranked using the comprehensive disaster index (CDI), it was found that typhoon-induced rainstorm flood events account for 60% of the cases and are predominantly positioned at the higher end of the ranking. This distribution pattern further demonstrates that, compared to non-typhoon-induced rainstorm flood events, typhoon-induced rainstorm flood events typically result in more severe losses. In 2012, Beijing suffered direct economic losses of 16.22 billion yuan due to flood disasters. Among them, the “7·21” typhoon rainstorm flood disaster alone caused economic losses as high as 11.64 billion yuan, accounting for 71.8% of the total flood-related economic losses that year. In 2023, the direct economic losses caused by natural disasters in China amounted to 345.45 billion yuan. Among them, Typhoon “Doksuri” alone caused direct economic losses of 156.79 billion yuan in the Beijing–Tianjin–Hebei region, accounting for 45.4% of the total economic losses from natural disasters. However, on 21 July 2012, Beijing experienced an extreme rainstorm flood event [
47] (Called “7·20”), the most severe rainfall event in Beijing without the influence of a typhoon. The direct economic losses caused by floods throughout the year amounted to 1.16 billion yuan.
5. Analysis of the Coupling Effects of Typhoons and Terrain on Regional High-Frequency Flood Disasters
Based on the regional-scale analysis in Chapter 4, which revealed the correlation between historical flood disaster events and typhoon activity, this chapter delves into the impact mechanisms of the coupling effect of typhoons and terrain on disasters, using the extreme rainstorm flood event of “7·31” in Beijing as a case study. It uncovers how the coupling effect of typhoons and terrain amplifies rainfall intensity, leading to massive river flood discharge and ultimately triggering the disaster.
5.1. Extreme Rainfall Causes Huge Flood Discharge
From 28 July to 2 August 2023, a regional heavy rainstorm to extraordinarily heavy rainstorm occurred in North China. The extreme rainfall was primarily concentrated on the windward slope of the Taihang Mountains and the adjacent piedmont plain areas in Hebei Province [
30]. Starting from 29 July 2023, heavy-to-torrential rainfall occurred in most areas of Beijing, with some regions experiencing extremely heavy rainfall. The average rainfall across the city over 41 h was 176.9 mm (
Figure 5), with the maximum rainfall reaching 580.9 mm. By 6:00 on 1 August, the average rainfall in Beijing had increased to 257.9 mm, while the cumulative rainfall in Fangshan District reached 627.1 mm. During this event, the cumulative rainfall in Beijing reached 331 mm, equivalent to 60% of the region’s average annual precipitation.
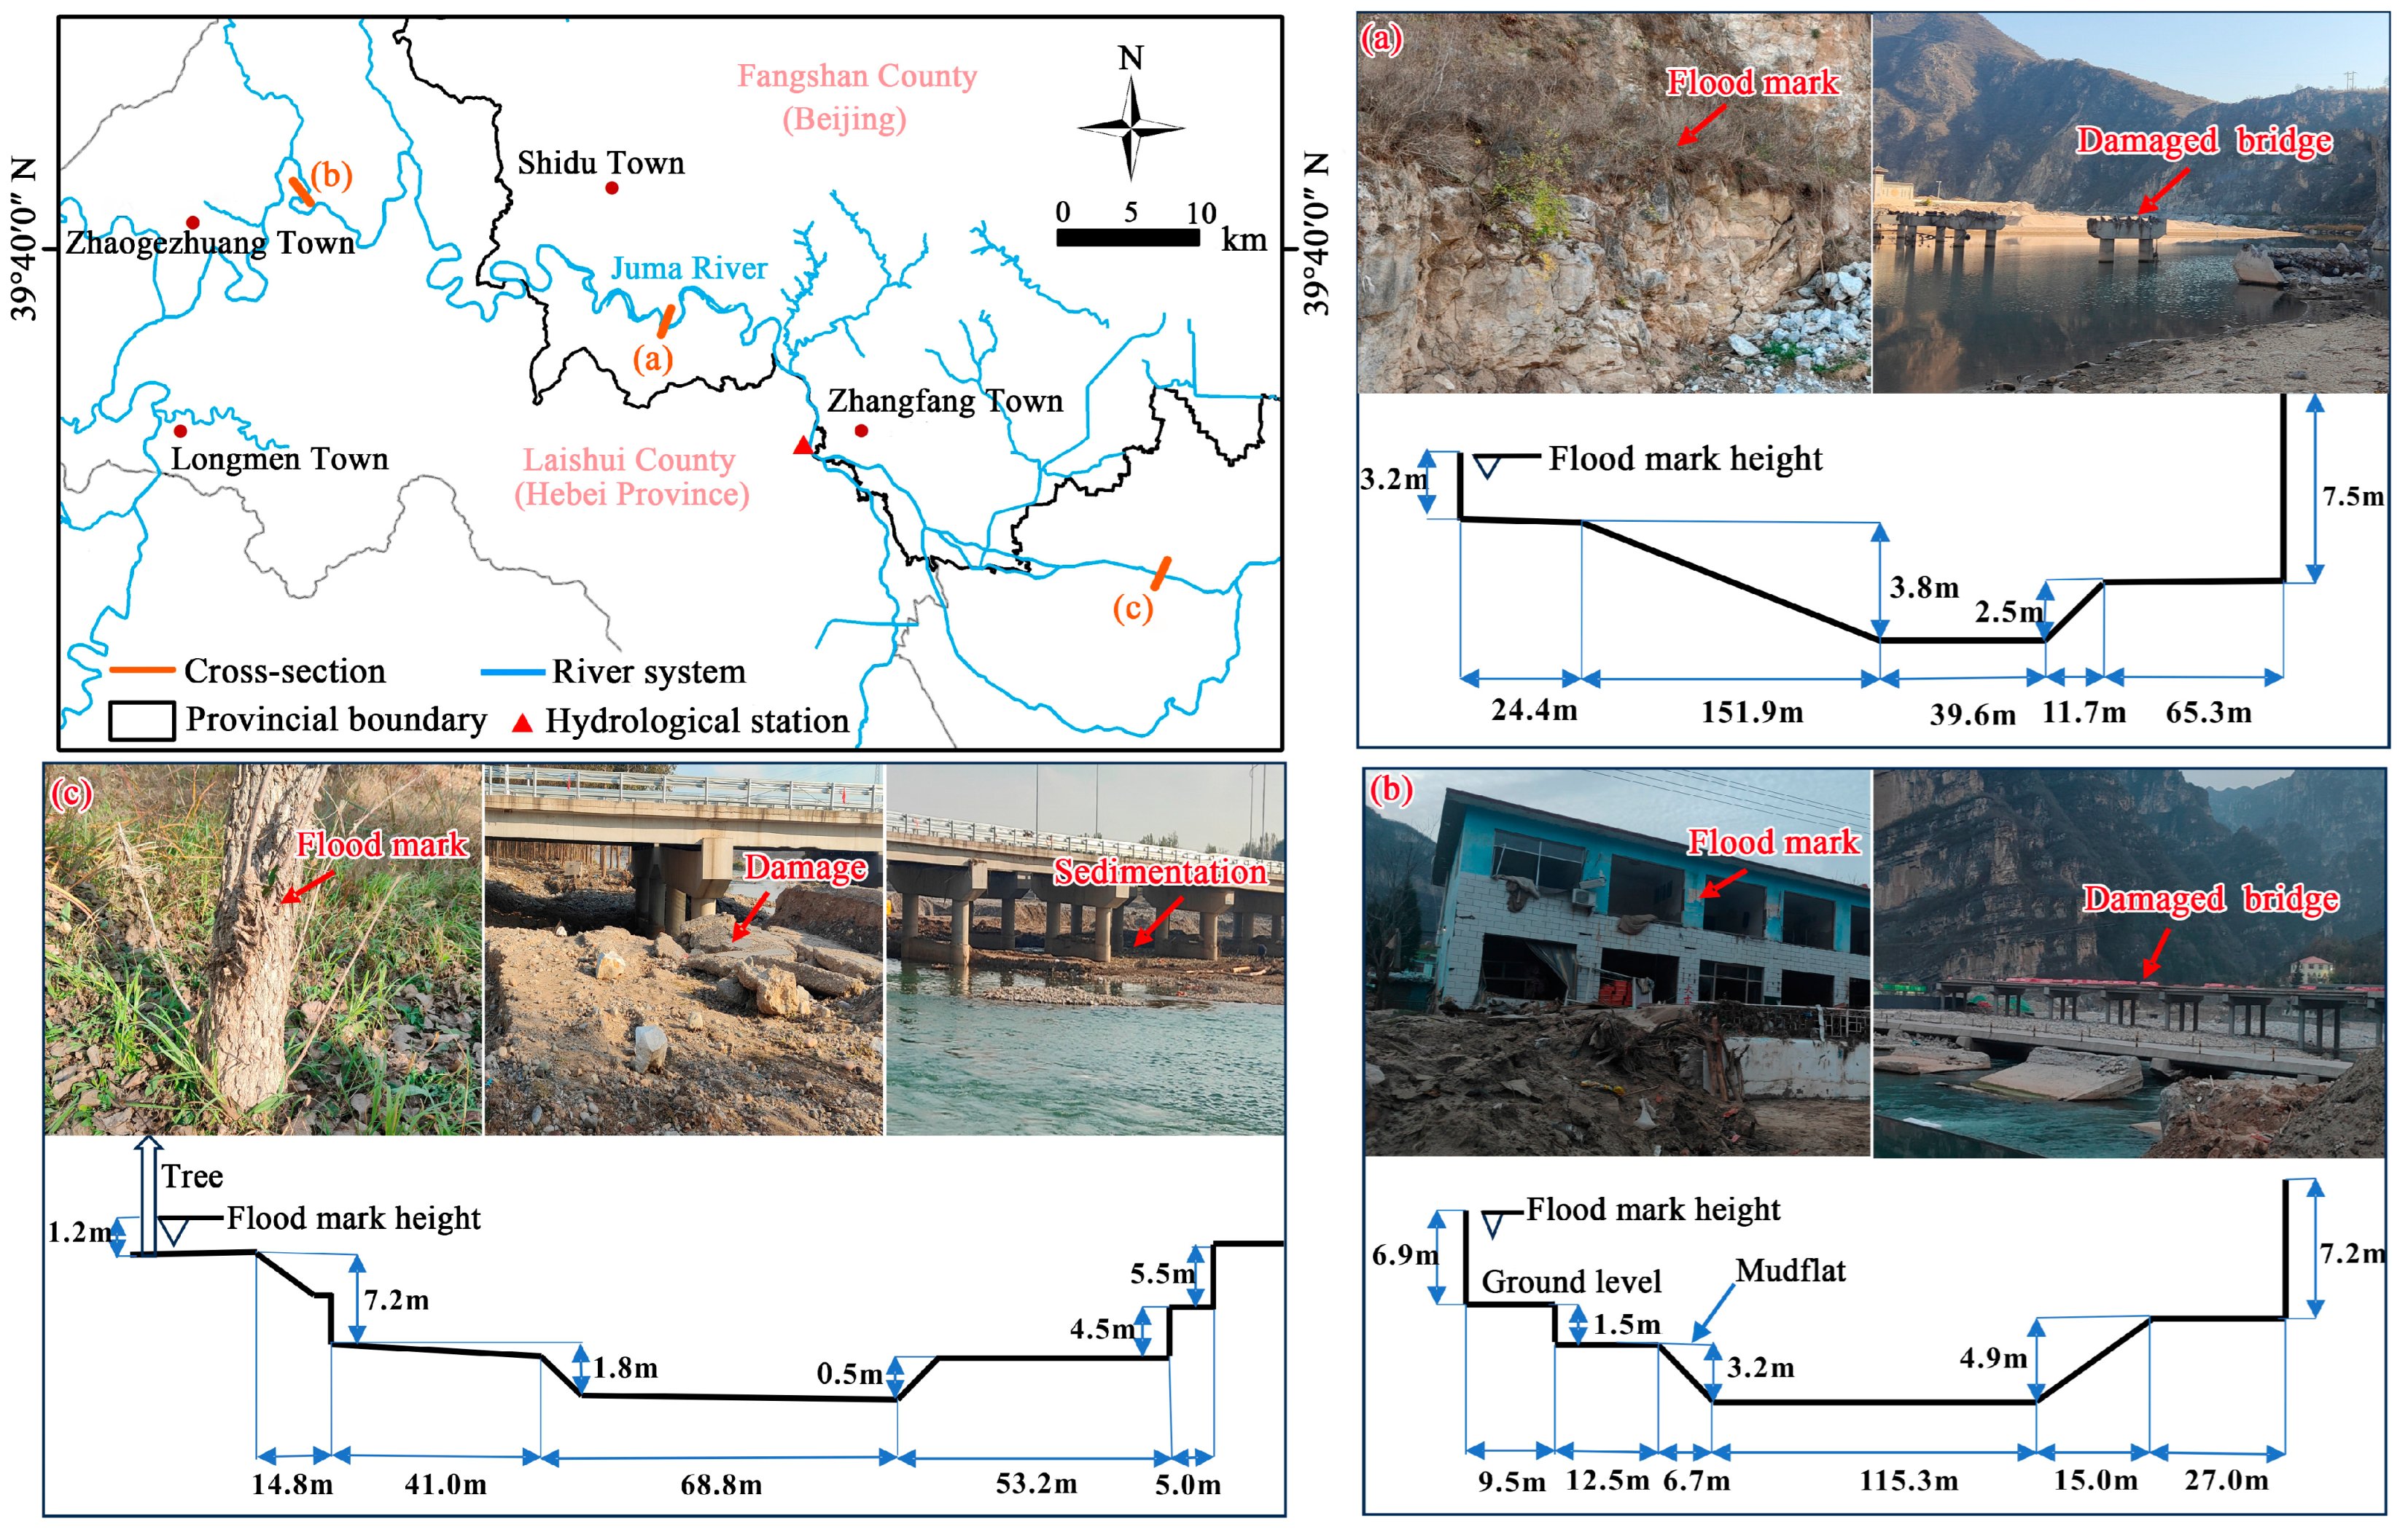
The Juma River (
Figure 6) originates in the Taihang Mountains in Laiyuan County, Hebei Province, with an elevation of more than 2000 m. It has a longitudinal gradient of more than 10% in the Taihang Mountains [
48], resulting in high water flow and rapid currents. During the extreme rainfall of “7·31” in Beijing, according to records from the Zhangfang Hydrological Station (115.68° E, 39.57° N), the water level of the Juma River rose by more than 7 m, with a total water volume of 700 million cubic meters over three days. The peak flood discharge occurred between 22:20 and 23:00 on 31 July, reaching 7330 cubic meters per second at the surveyed cross-section, which is four times the peak discharge recorded during the “7·21” heavy rainfall event in 2012. Three months after the “7·31” disaster in Beijing, the field investigation found that the traces of urban flood disasters in the Juma River Basin were still clear (
Figure 6a–c). The elevations of the Juma River Jiudu Town Bridge (
Figure 6a), Xinggezhuang Bridge (
Figure 6b), and Long’a Bridge (
Figure 6c) are 168 m, 319 m, and 109 m, respectively. The terrain in these areas is relatively flat, and the water flow is slow. The measured river section is wide, the height difference between the river surface and the ground plane is small, and the river water easily overflows. According to Formula (3), the flood discharge of the section is calculated to be 6500 m
3/s, 6100 m
3/s, and 6900 m
3/s, respectively (considering the convergence of the main and tributaries, there is a certain discrepancy with the hydrological station record), and the flood discharge in the basin is large. According to the ‘Juma River (Beijing Section) Mainstream Ecological Restoration Comprehensive Management Plan’, the 20-year flood discharge of the Juma River mountain channel is 6100–6300 m
3/s, and the corresponding flood level is 108.68–216.87 m [
38]. Based on historical records under current climatic conditions, a comparative analysis of the “7·31” flash flood trace survey in Beijing was carried out, the recurrence period of this flood event was estimated to be 100 years (i.e., 1% annual exceedance probability). It is worth noting that this estimate may vary with the impact of climate change.
5.2. The Coupling Effect of Typhoons and Terrain Increases the Scale of Regional Rainfall
On 21 July 2023, Typhoon “Doksuri” formed over the Pacific Ocean and made landfall along the coast of Jinjiang City, Fujian Province, at 9:55 a.m. on 28 July. By 29 July, it had weakened to a tropical depression while moving over Anhui Province. The residual circulation entered Henan during the night of the same day, which had an impact on Huang–Huai and North China. Henan, Shandong, Beijing–Tianjin–Hebei, and Liaoning experienced extreme rainfall for several days [
49].
The “7·31” rainstorm and flood disaster in Beijing was a large-scale regional rainfall caused by the coupling of typhoon, subtropical high, and terrain. The specific performance is as follows: “Doksuri” and “Khanuu” carried a large amount of water vapor and transported it to North China. The interaction between the residual circulation of “Doksuri” and the subtropical high resulted in the persistent retention of the system over Beijing and adjacent regions. The moisture-laden airflow, obstructed by the Yanshan–Taihang Mountains, underwent orographic uplift and convergence, ultimately establishing an intense precipitation center along the Piedmont zone.
A large amount of water vapor is transported to the region, which provides a sufficient water vapor source for the occurrence of rainstorms. Before “Doksuri” landed in China, another typhoon, “Khanuu”, generated favorable outflow conditions, which h “Doksuri” to a strong typhoon level when it landed in China. After the landfall of “Doksuri”, the residual circulation interacted with the subtropical high, forming an increased pressure gradient, and a northwest–southeast water vapor channel was formed on the west side of the subtropical high. The water vapor transport map (
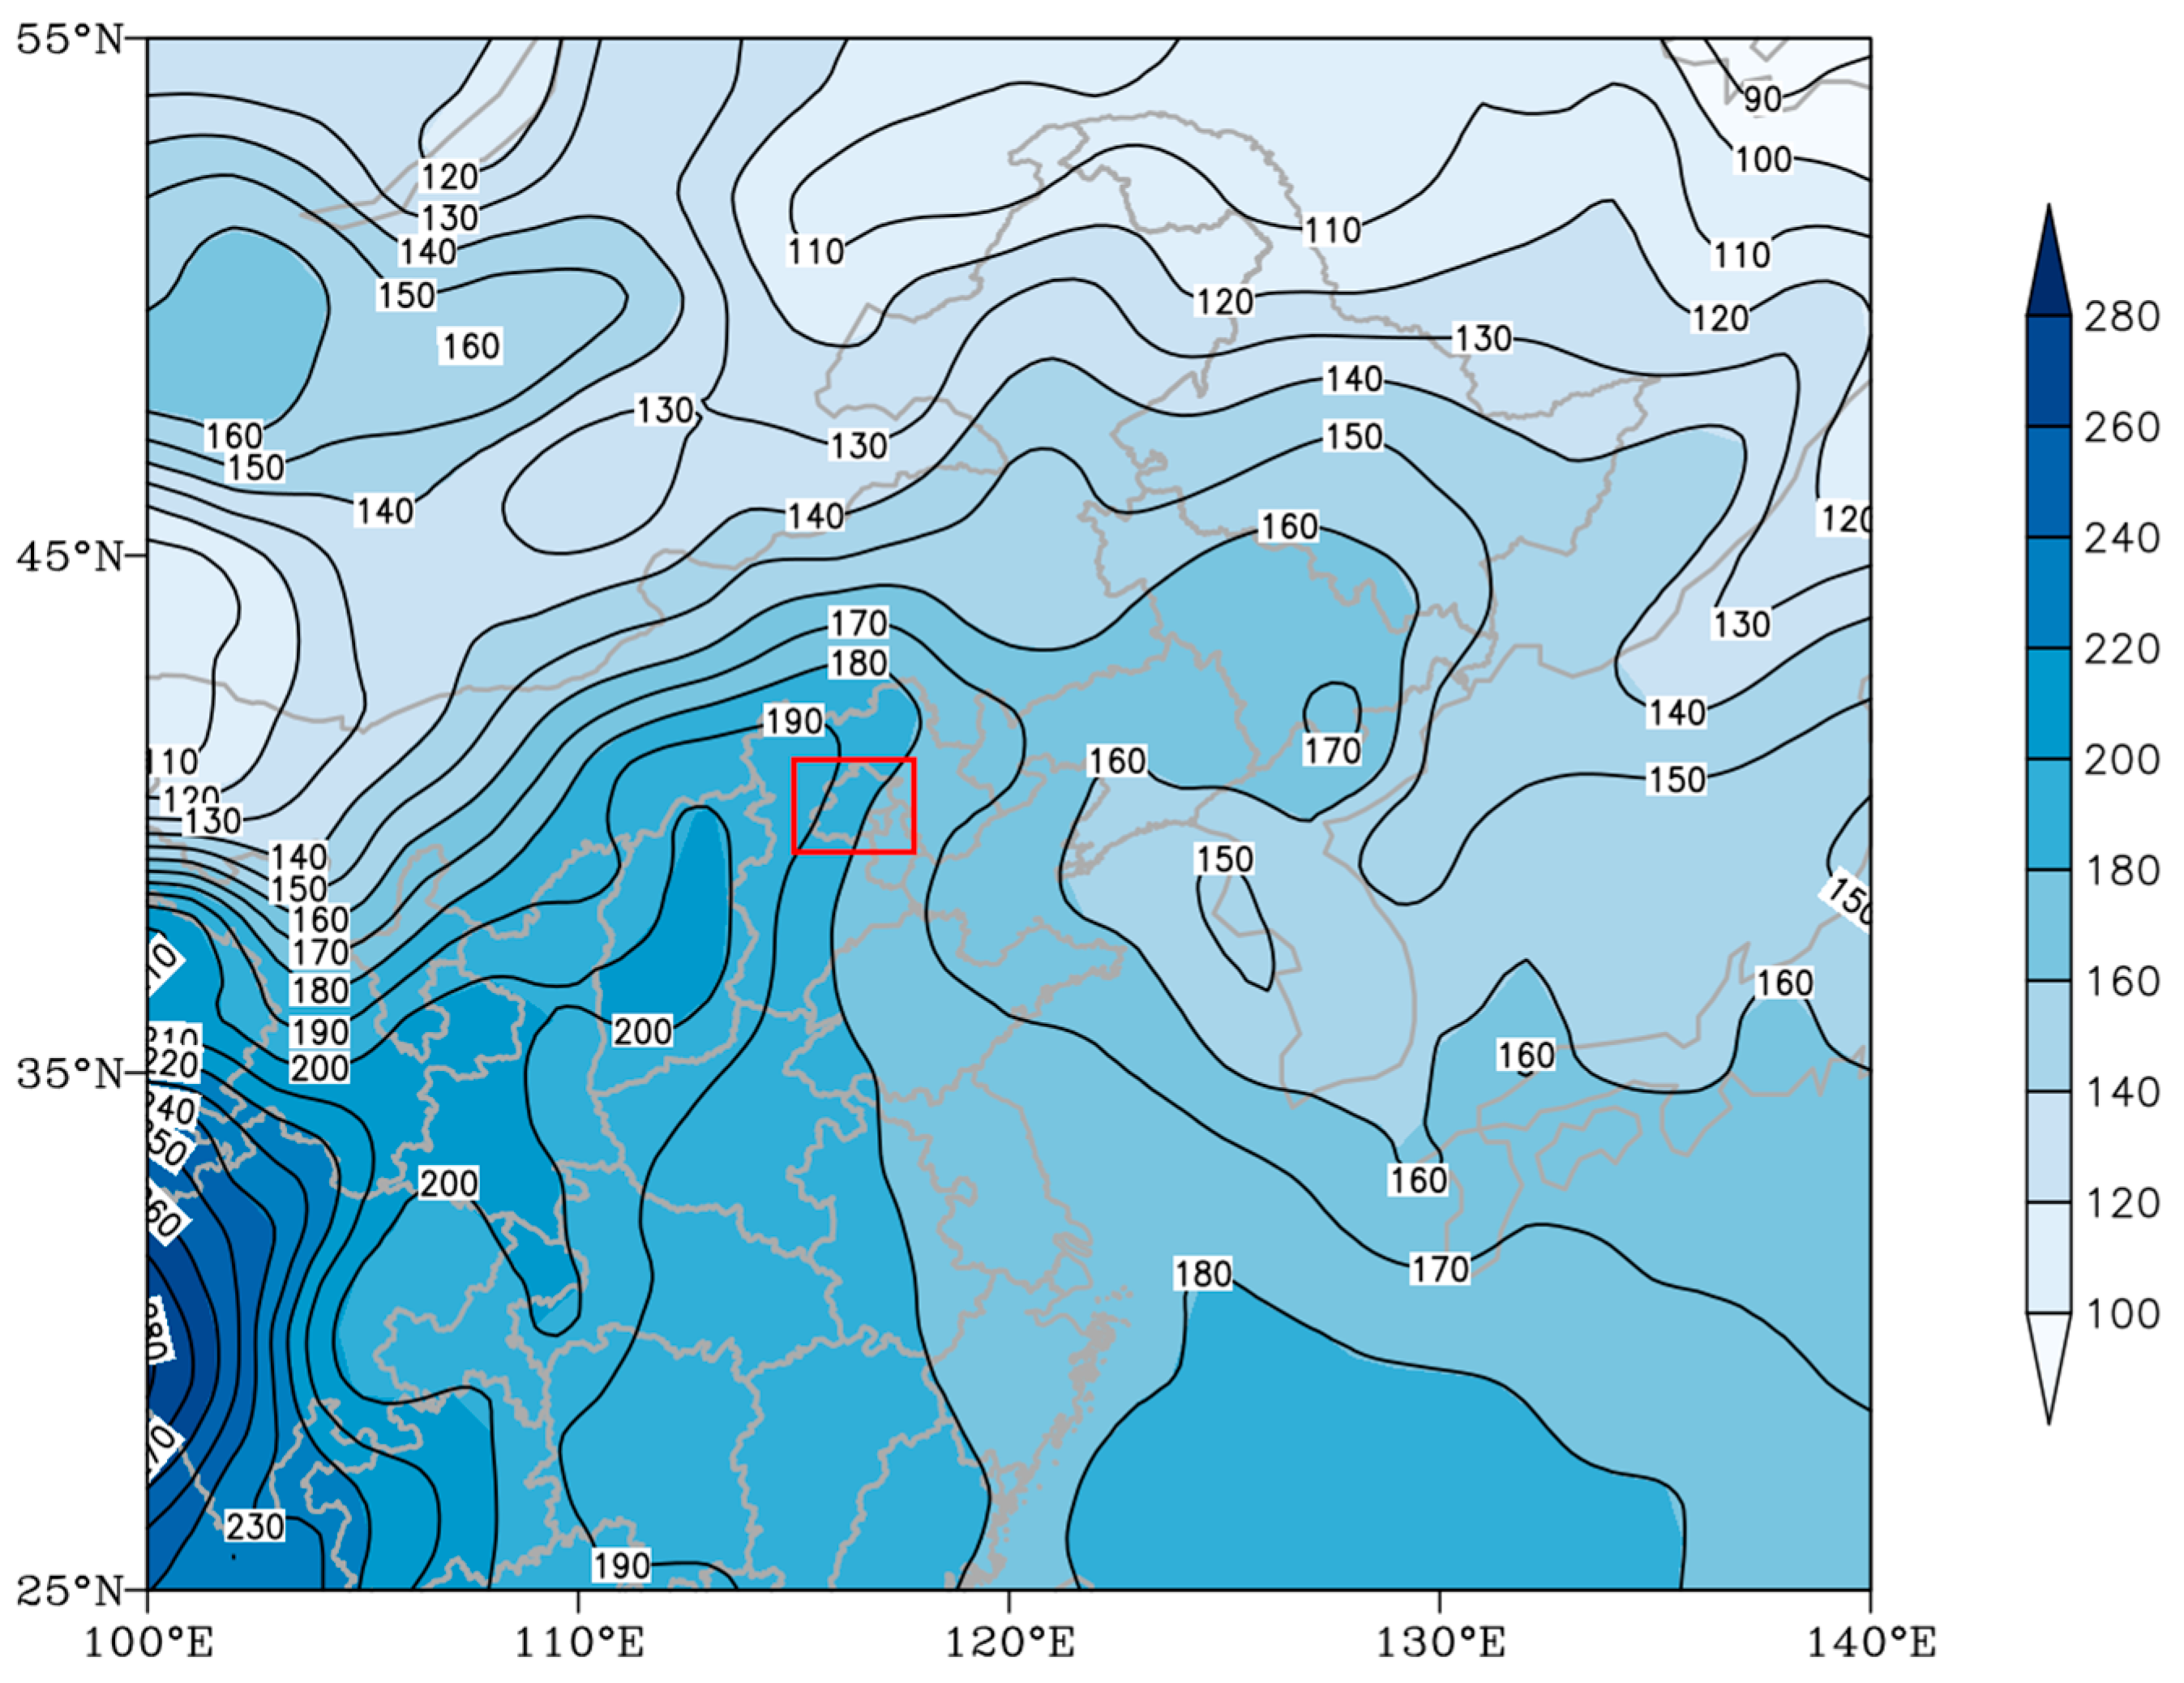
Figure 7a–c) from 29 July to 31 July 2023 shows that the typhoon and the subtropical high form a water vapor transport channel, and a large amount of water vapor continues to enter Beijing. There is an obvious gradient of the water vapor flux vector over Beijing. The water vapor enters from the eastern boundary and exits from the southwest boundary. On 29 July 2023, the water vapor transport was primarily concentrated near the 300 hPa level within the study region (
Figure 7a). The following day (30 July), this atmospheric moisture transport shifted to an altitude of approximately 400 hPa, accompanied by a significant intensification of the water vapor flux vector gradient. The maximum water vapor flux in the region was 240
(
Figure 7b). On 31 July, the regional water vapor transport was mainly located at about 500 hPa (
Figure 7c), and the water vapor transport intensity was weakened. The water vapor flux was 100~150
; until 2 August, the water vapor transport channel dissipated, and there was no obvious water vapor entering the region (
Figure 7d,e).
The interaction between the residual circulation of “Doksuri” and the subtropical high led to the prolonged stagnation of Doksuri’s residual circulation. The subtropical high is formed by the flow and accumulation of high-altitude divergent airflow in the tropical convergence zone to the high latitude. “Doksuri” landed in Fujian, China, on 28 July 2023 and dissipated on August 1 (
Figure 7d). Its circulation lasted for nearly 70 h, while the average residence time of typhoons landing in China is 20 h [
49]. “Khanun” transports water vapor to the western Pacific subtropical high through the high-altitude circulation, and the western Pacific subtropical high maintains a high intensity for a long time. The western Pacific subtropical high extends westward and, following its convergence with the continental high pressure, establishes a stable “high-pressure dam” (comprising both the continental high and offshore subtropical high) over northern North China. The residual circulation of Typhoon “Doksuri” intercepted by the “high-pressure dam” moved northward, moving northwestward along the guiding airflow in the southwest periphery and deepened inland. The effect of typhoon residual circulation and subtropical high creates conditions for the long-term persistence of the rainstorm weather system. Therefore, the residence time of the residual circulation over Beijing increased, and the rainfall time of Beijing “7·31” was long. The phenomenon of enhanced precipitation after the weakening of the typhoon circulation is called the recovery of the typhoon remnant vortex [
50]. The resulting heavy rainfall is often closely related to water vapor transport, terrain, etc. [
51].
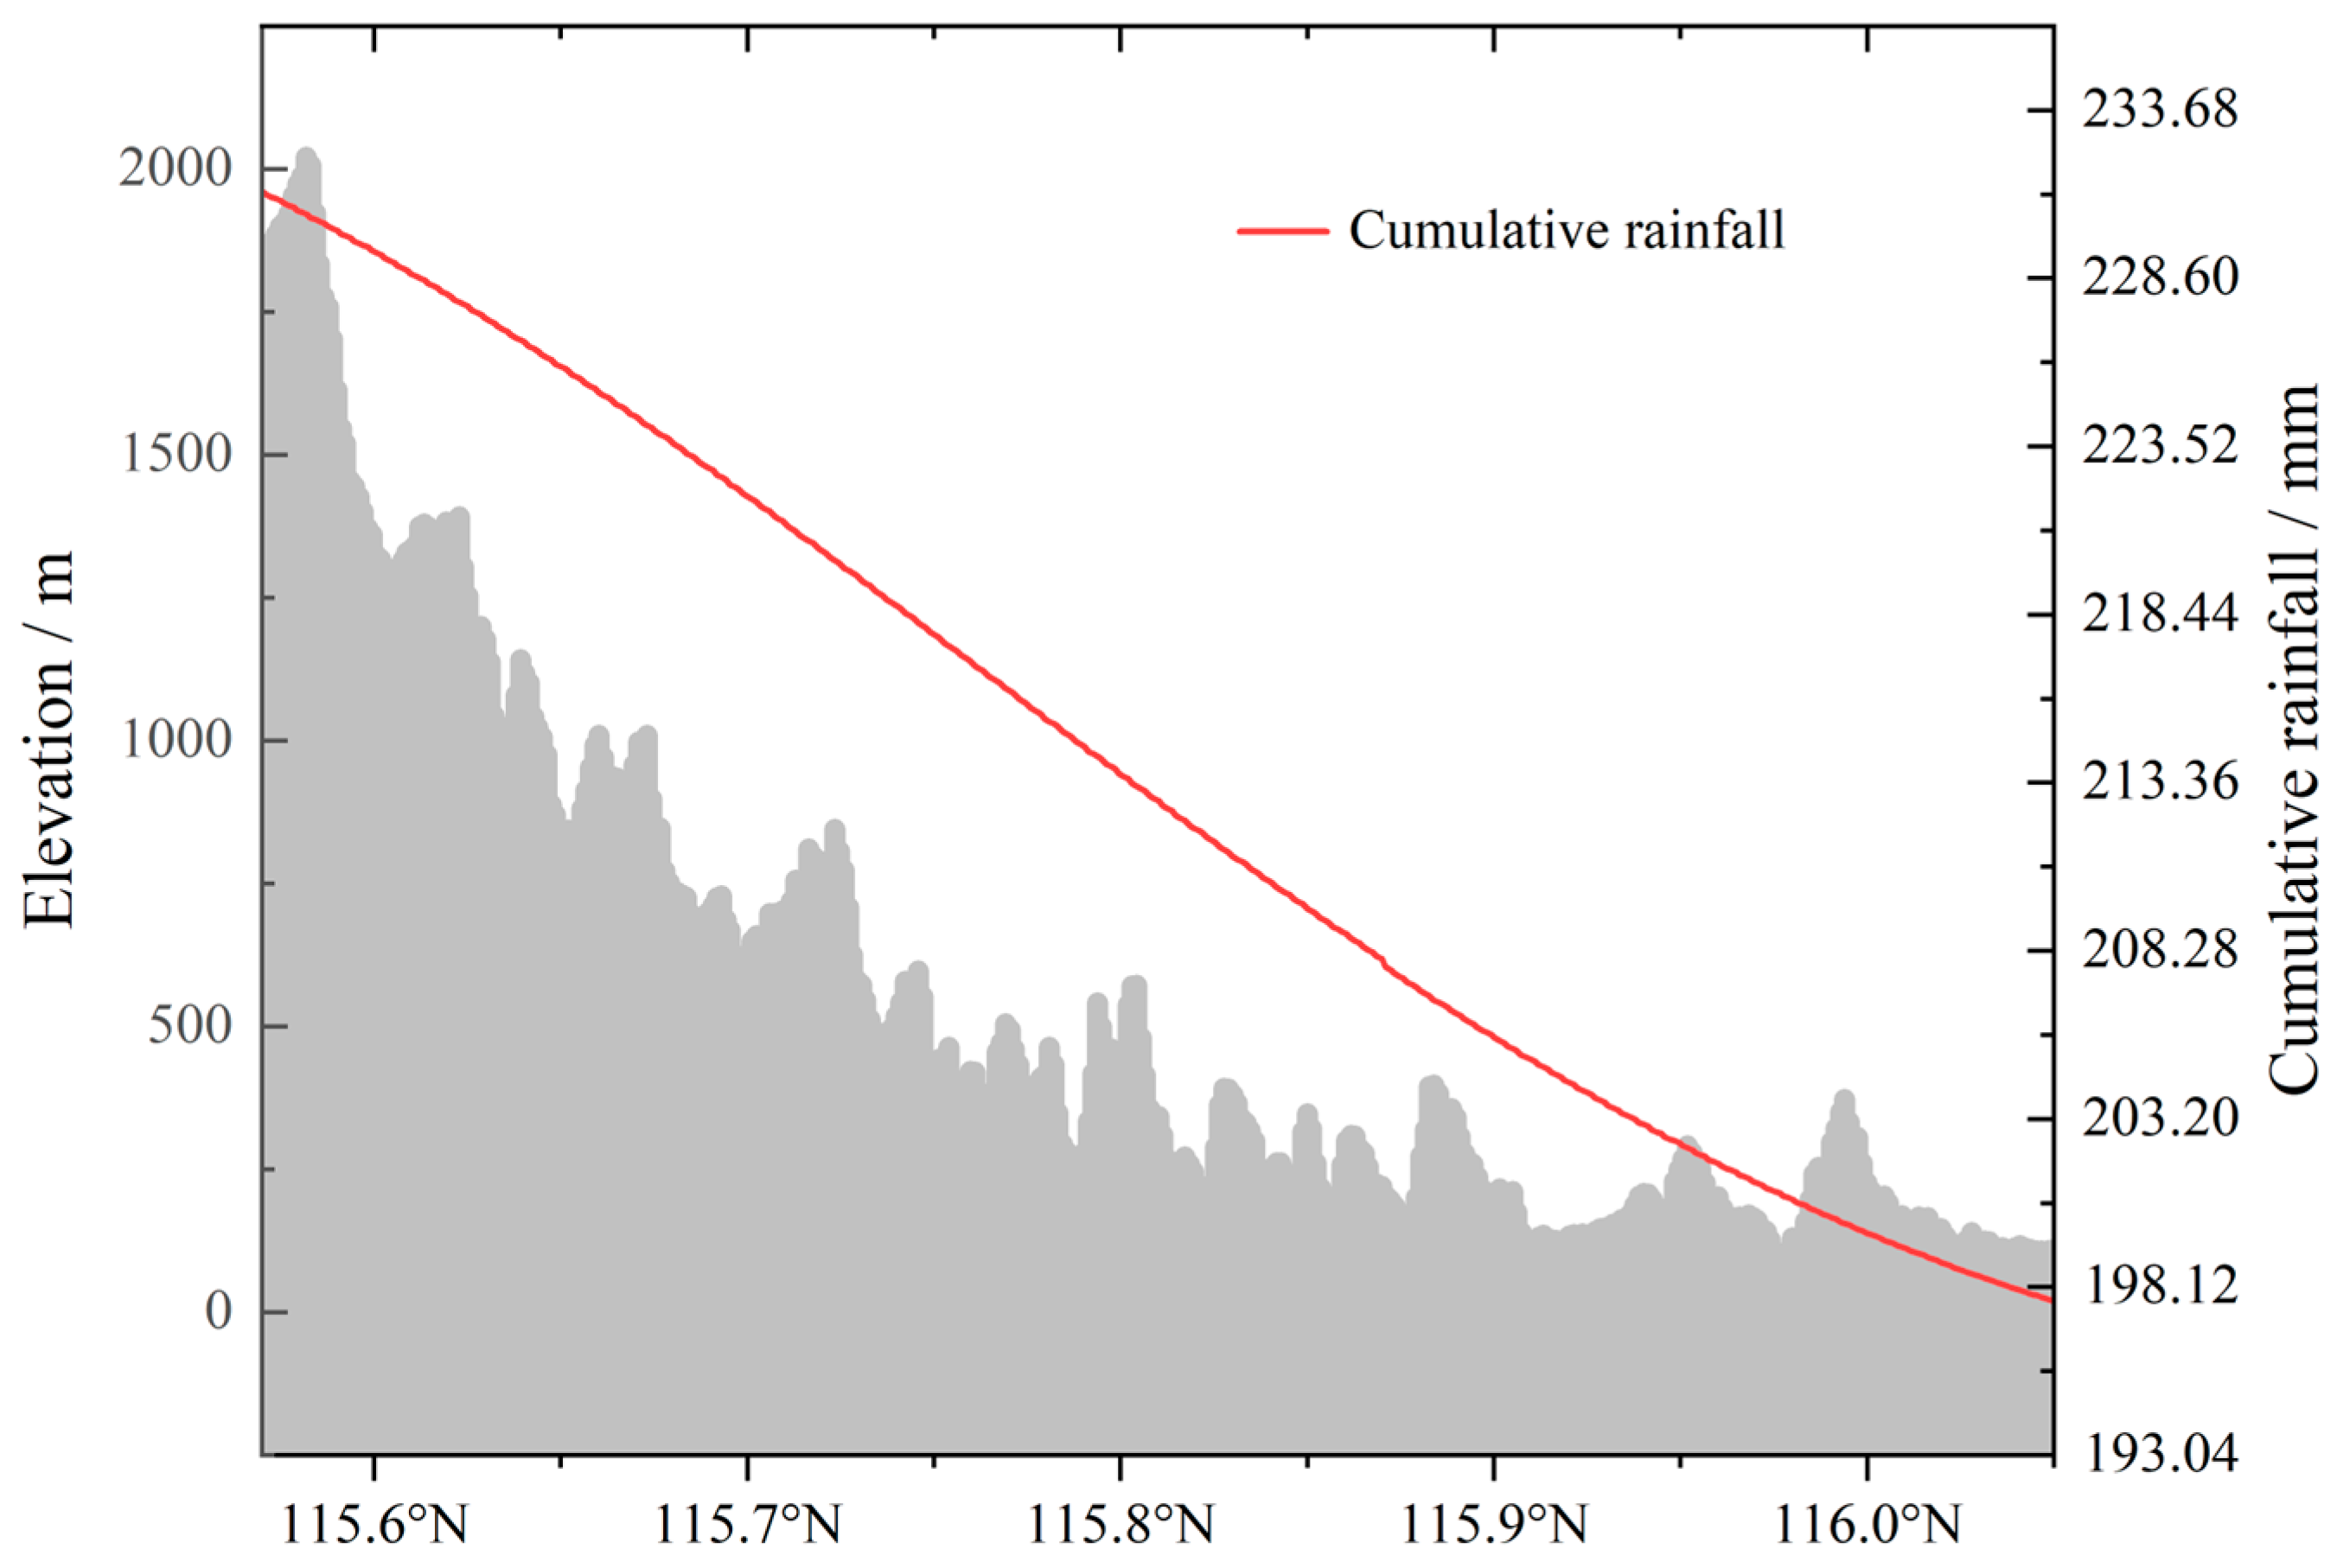
The Yanshan–Taihang Mountains gradient area blocks the water vapor, and the convergence uplifts, forming a strong precipitation center in the front of the mountain. The Yanshan–Taihang Mountains enclose the North China Plain, opening toward the southeast and forming a massive trumpet-shaped terrain. Beijing is located at the innermost end of this trumpet-shaped terrain, allowing southeast airflow to penetrate deep inland. From 29 July to 2 August 2023, the typhoon transported a large amount of water vapor to the North China Plain (
Figure 7). Comparing the terrain and rainfall distribution along the same latitude near meteorological stations from Mentougou–Fangshan District in Beijing from 29 July to 2 August 2023 (
Figure 8), it is evident that the cumulative rainfall on the eastern foothills of the Taihang Mountains significantly exceeded that of the lower-elevation eastern plains. Areas with cumulative rainfall exceeding 220 mm were primarily located in mountainous regions above 1500 m in elevation. In addition, the daily mean value of atmospheric water vapor flux at 300 hPa in Beijing reached 100~150
, and the level of water vapor flux was high. The average daily rainfall is shown in
Figure 9. After the water vapor reaches the area, due to the blocking of Yanshan–Taihang Mountains, it turns into a strong upward movement and moves along the front of the mountain (
Figure 7f). The interaction between water vapor flux and Yanshan–Taihang Mountains promotes the rapid uplift and increase in water vapor, which is an important reason for the formation of extreme heavy rainfall in Yanshan–Taihang Mountains. Up to 2 August 2023, after the regional wind direction changed, the rainfall gradually stopped, and the terrain increased the rainfall significantly.
6. Early Warning and Mitigation Measures
At present, China has established a relatively comprehensive early warning system for typhoons and mountain floods [
52]. With the advancement of technologies such as satellite remote sensing, GIS, radar monitoring, and numerical simulation, dynamic early warning systems utilizing multi-source data have been successfully implemented. These systems are capable of issuing timely forecasts regarding typhoon trajectories, intensity, and precipitation levels, thereby providing critical early warnings for disaster prevention and mitigation efforts [
53,
54,
55]. The key technology of typhoon monitoring and forecasting systems has significantly improved, with the 24-h typhoon path prediction error reduced from 190 km in 2003 to less than 100 km. During the “7·31” flood disaster in Beijing, Fangshan District successfully evacuated 12,000 residents 12 h ahead of schedule through an early warning system [
56]. As of 2020, Beijing has constructed nearly 800 km of flood control embankments. Dredging and embankment reinforcement have been implemented for rivers such as the Yongding River and the Chaobai River, with the improved infrastructure now designed to withstand flood events estimated to have a return period of 50 to 100 years based on current hydrological conditions [
57]. As of 2024, Beijing has advanced the installation of buried water level gauges in 352 mountain torrent gullies, identified 442 waterlogging points, and increased the proportion of area in the sponge city construction to 36% (Beijing News). However, Beijing still faces several challenges in flood disaster early warning and prevention, such as delays in the dissemination of early warning information, limited coverage, and insufficient flood control infrastructure in certain areas. Particularly in remote mountainous areas. These issues contribute to the relatively low efficiency of warning response mechanisms [
58]. Therefore, through field investigations, analysis of disaster characteristics and causative mechanisms, and integration with the nation’s first intelligent drone patrol system for mountain torrent early warning and prevention, a multi-level early warning and response “sea-land-air” integrated early warning system (
Figure 10) has been proposed, along with corresponding disaster prevention and mitigation engineering measures.
(1) The accuracy of typhoon data collection has improved, and early warnings are issued by using the visualization method based on numerical simulation to predict typhoon track and transport water vapor flux.
(2) An intelligent drone aerial monitoring network has been established to achieve 24 h uninterrupted surveillance of key areas, constructing high-precision terrain models to eliminate monitoring blind spots in mountainous regions. UAVs set up thermal imaging technology to search for and rescue trapped people to improve rescue efficiency.
(3) It is necessary to establish a community-based monitoring and prevention system to enhance public participation, engagement, and disaster preparedness and evacuation capabilities, thereby addressing situations such as communication or transportation disruptions where timely rescue efforts may be hindered.
(4) Risk-prone mountain torrent gullies have been identified, with measures such as river dredging and the construction of flood control embankments implemented to enhance the flood prevention design standards of river channels, thereby reducing peak flood discharge, as exemplified by the upper reaches of the Juma River. Efforts to advance sponge city renovations continue, aiming to improve ground permeability.
7. Conclusions
This study investigates the historical characteristics of flood disasters in the Beijing area and the disaster-causing mechanisms of typhoon-induced rainstorm floods and proposes early warning and prevention measures through the analysis of nearly a millennium of historical flood disaster data and numerical simulation methods. The main conclusions are as follows:
(1) Historical flood disasters in Beijing have been predominantly concentrated in the plain areas, with Daxing District and Tongzhou District exhibiting the highest frequency of occurrence, accounting for 14.42% and 14.04% of total events, respectively. Statistical analysis reveals that 57.8% of flood disasters are associated with typhoon activities. The comprehensive disaster index demonstrates that Typhoon rainstorm flood disasters (mean value: 0.31) result in significantly more severe damage compared to non-typhoon rainstorm flood disasters (mean value: 0.138), highlighting typhoons as a critical factor influencing extreme rainfall-induced flood events in the region.
(2) During the “7·31” typhoon rainstorm flood disasters in Beijing, the residual circulation of the typhoon remained stationary for over 70 h. The orographic lifting effect by the Yanshan–Taihang Mountains terrain significantly amplified the precipitation intensity during the disaster. Numerical simulations indicated that the daily mean atmospheric water vapor flux at 300 hPa was 100~150 . The extreme rainfall event precipitated a catastrophic flood in the Juma River basin, exceeding the 20-year return period and surpassing the channel’s discharge capacity. This hydrological overload resulted in widespread overtopping incidents along multiple river sections, causing extensive flood damage.
(3) Building upon existing early warning technologies and integrating the deployment of an intelligent drone monitoring network, a comprehensive sea-land-air disaster early warning system has been proposed. In conjunction with current river channel management practices, engineering measures such as river dredging and the construction of flood control embankments have been implemented. Additionally, by assessing the risk of urban waterlogging, they can continue to promote the construction of sponge cities.
Due to the incompleteness of historical flood disaster records and the limitations of numerical simulations, future research could integrate higher-resolution historical flood disaster data and meteorological data for dynamic simulation. This would further elucidate the micro-scale mechanisms of the coupling effects between typhoons and terrain and explore the connections between typhoon frequency, intensity, and global climate change. The aims of future work are as follows:
(1) Collect and organize higher-resolution historical flood disaster data, meteorological data, hydrological data, land use change data, and socio-economic data for Beijing and its surrounding areas to construct a more comprehensive database, thereby providing reliable data support for subsequent research.
(2) Introduce more advanced meteorological models and hydrological models, integrate field observation data, and optimize the accuracy of numerical simulations. Focus on analyzing the micro-scale mechanisms of the coupling effects between typhoons and terrain and validate the reliability of the models through historical case studies.
(3) Against the backdrop of global climate change, investigate the changing trends in typhoon frequency, intensity, and trajectories, and analyze their potential impacts on flood disasters in the Beijing area, thereby providing a scientific basis for the formulation of regional disaster prevention and mitigation strategies.


