1. Introduction
In the context of drought management, achieving an equilibrium between water supply and demand is imperative for ensuring the stable socio-economic development of a region. The concept of socio-economic drought encompasses not only the scarcity of water resulting from diminished precipitation but also the question of whether the water supply can adequately meet the demands of various sectors and the economic ramifications thereof [
1,
2] (Wilhite and Glantz, 1985; Zseleczky and Yosef, 2014). Statistical data from the Yellow River Conservancy Commission reveal that the frequency of basin-wide drought events has increased by 35% since 2000 compared to the 20th century, with the downstream region experiencing 12 extreme drought episodes between 2001 and 2020. In the DYRB, prolonged drought conditions have caused agricultural production reductions exceeding 20% in drought years (2014–2016), directly affecting over 50 million residents’ water supply. The accelerated development of industrialization and urbanization has resulted in numerous regions encountering substantial challenges in meeting water demands during drought periods, thereby underscoring the critical nature of socio-economic drought as a global concern [
3,
4]. For instance, Al-Faraj et al [
5]. studied the development of upstream watersheds and their impact on downstream flow, highlighting inter-basin drought management issues, and demonstrated that water resource scheduling and watershed management are crucial for alleviating drought impacts. Against the backdrop of global climate change and the increasing frequency of extreme weather events, socio-economic drought has gradually become an emerging area of research. Qu et al. [
6] addressed the issue of underestimating the extent of socioeconomic drought due to the impact of virtual water on water resources. By considering the comprehensive demand for water resources and evaluating the role of water transfer in mitigating socioeconomic drought from the perspective of production and consumption, the study found that the water stress index in exporting regions significantly increases compared to the water pressure index in importing regions, due to the contribution of virtual water. The external pressure on the exporting regions was overlooked, leading to a severe underestimation of drought risk in the importing regions. Meng et al. [
7] developed a new index, the Distributed Standardized Socioeconomic Drought Index (DSSEDI), to address the gap in existing socioeconomic drought indices that lack spatial distribution and standardization. The index was applied to the Pearl River Basin, and the study found that the population and economy in the Pearl River Delta are significantly vulnerable to drought. During severe droughts, the economic risk near Shenzhen can reach up to USD 4.66 billion. Tela et al. [
8] evaluated the spatiotemporal trends of meteorological drought and its impact on socioeconomic drought in the Tekeze Basin using questionnaires, field observations, and CHIRPS data through a random forest model. The study recommended the effective implementation of the mitigation measures initially carried out by government and non-governmental organizations, emphasizing the active participation of local communities. Current studies on socio-economic drought focus on several aspects, including the construction of an indicator system [
4,
9,
10,
11,
12], risk assessments [
13,
14,
15], and the propagation effects between drought and socio-economic drought [
16,
17]. Additionally, some scholars have focused on the evolution characteristics and driving factors of socio-economic drought [
17,
18]. However, there is relatively little research on how to evaluate the drought resistance capacity of socio-economic droughts.
Reservoirs, as large-scale artificial water infrastructure, play a pivotal role in drought resistance by regulating water volumes to effectively manage downstream water demands [
19]. Reservoirs are not only essential for regulating extreme events such as floods and droughts, but their storage and release operations directly influence the balance between water supply and demand downstream. In the context of drought, the operational strategies employed by reservoirs, such as the modulation of release volumes, assume particular significance concerning the supply capacity defined within the framework of socio-economic drought [
20]. Consequently, the evaluation of a reservoir’s drought resistance, particularly concerning its performance during socio-economic droughts, emerges as a pivotal approach to address this issue. Tu et al. [
21] report a significant decrease in socioeconomic drought attributes under reservoir regulation, highlighting the potential of reservoir operations to mitigate socioeconomic drought.
The evaluation of drought resistance capacity in reservoirs can be categorized into qualitative and quantitative assessments. Qualitative assessments are typically based on the static attributes of the reservoir, constructing composite indices for evaluation. For instance, Lu et al. [
22] utilized a fuzzy comprehensive evaluation model comprising nine indicators to assess the drought resistance of hydraulic engineering projects, thereby identifying that nearly half of the third-level hydraulic districts exhibited inadequate drought resistance, thereby emphasizing the necessity for enhancing drought resistance in water infrastructure. Pourmoghim et al. [
23] developed a four-tier evaluation framework incorporating long-term resilience, reliability, implementation costs, and ecological status in lake drought resistance assessments. In a related study, Wang et al. [
24] proposed an adaptive evaluation system based on reservoir scale, layout, and engineering management, which was applied to reservoirs in the lower Yellow River.
In quantitative assessment, Shah et al. [
25] evaluated the drought risk of 38 global reservoirs using the Reservoir-Based Drought (RBD) metric, integrating evapotranspiration and storage alterations. Their findings indicated that 71% of reservoirs are influenced by climate change and 29% by human activities. The drought resistance of reservoirs is typically evaluated based on supply and demand, as reflected by the ratio of water supply to water demand of a reservoir under a specified drought recurrence period [
26]. However, the comprehensive evaluation method is often found to fail to reflect the actual level of drought resistance.
In the context of drought management, the optimal scheduling of reservoir operations is recognized as a pivotal strategy for enhancing drought resistance. A prominent measure employed is water supply restriction, which has been shown to effectively mitigate downstream water scarcity during drought periods by regulating the water supply from reservoirs [
27,
28,
29]. Numerous studies have demonstrated that restricting water supply not only reduces wastage through precise allocation of water resources but also optimizes water supply by prioritizing emergency demand [
30,
31]. In addition, the development of hedging rules for future droughts has attracted significant attention, with the potential to enhance the resistance and water supply capacity of reservoirs during drought periods [
32,
33,
34,
35,
36]. Drought-limit level setting is another significant strategy that can be used to regulate water supply by determining a minimum water level, thus ensuring that reservoirs do not overdraw water resources during droughts [
37,
38,
39,
40]. These strategies collectively contribute to the maintenance of the reservoir’s stable operational capacity during periods of drought.
Existing studies have three main limitations. First, most drought resilience assessments rely on static reservoir characteristics rather than operational dynamics during actual drought events. Second, few link socio-economic drought assessments to reservoirs. Third, few studies have systematically quantified the drought resistance capacity of different reservoir operation strategies under different return periods. In this study, the capability of reservoirs to respond to socio-economic drought is defined as the ability of reservoirs to meet the demands of various downstream water users under different recurrence intervals. This study characterizes socio-economic droughts of varying severity through the joint recurrence intervals calculated using copula functions, thereby providing a more comprehensive reflection of the multidimensional characteristics of drought (e.g., duration, peak, and severity) [
20]. Meanwhile, accurately constructing socio-economic drought indicators is crucial for identifying drought characteristics. Based on the methods of existing studies [
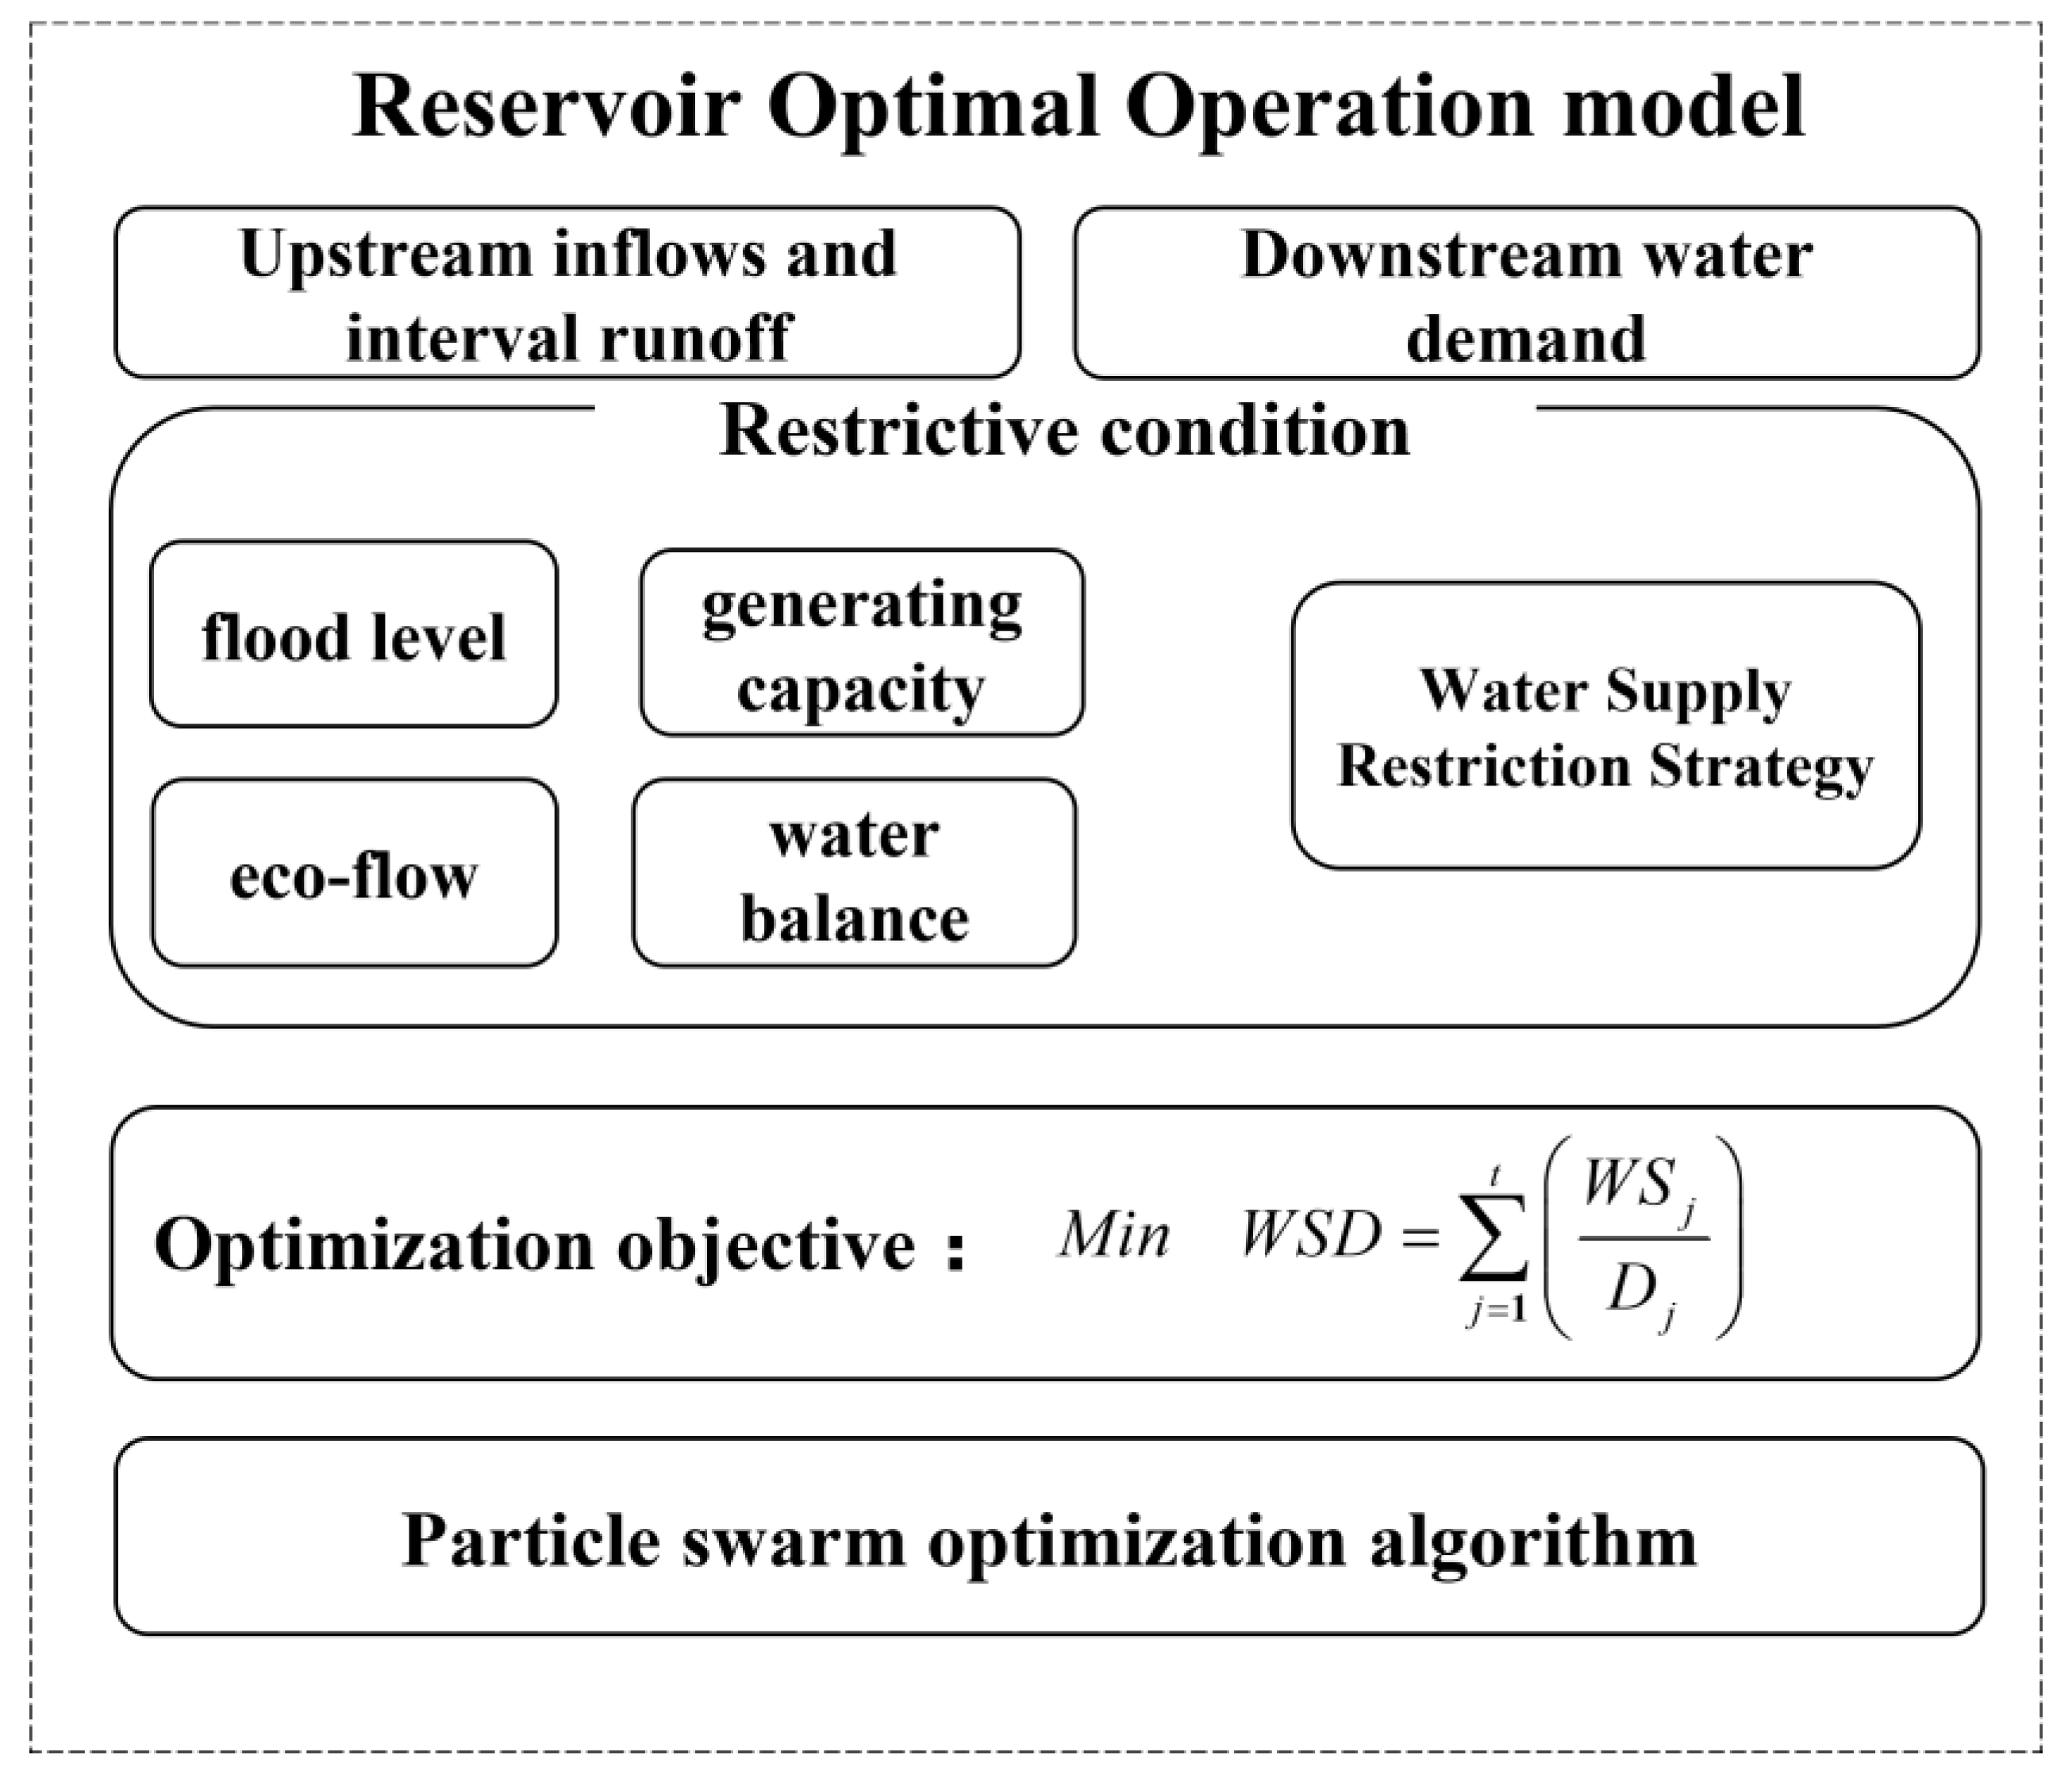
13], this study constructs a simple and direct socio-economic drought indicator that effectively reflects the relationships among upstream inflow, inter-basin inflow, and downstream water demands. Additionally, this study addresses gaps in the quantification of drought resilience capacity through three key innovations: (1) developing a multiscale socio-economic drought assessment framework that integrates copula-based joint recurrence intervals to describe the complexity of socio-economic drought comprehensively, (2) establishing a Resistance Drought Index (RDI) to quantitatively link reservoir operational performance with drought severity and inflow frequency, and (3) using a PSO-optimized reservoir model to compare conventional and restricted water supply strategies, providing actionable insights for adaptive drought management. Our approach advances the methods for assessing drought resilience and offers a practical tool for optimizing water resource allocation in the Yellow River during extreme events.
The main objectives of this study are as follows: (1) to quantitatively assess the drought resistance capacity of reservoirs in response to socio-economic drought at different scales, advancing the development of drought resistance capacity evaluation; (2) to reveal the relationship between reservoir drought resistance and socio-economic drought recurrence periods/water inflow frequency during drought periods; and (3) to explore the changes in a reservoir’s drought resistance capacity under water supply restriction strategies. The technical lines for this study are shown in
Figure 1.
2. Study Area and Data
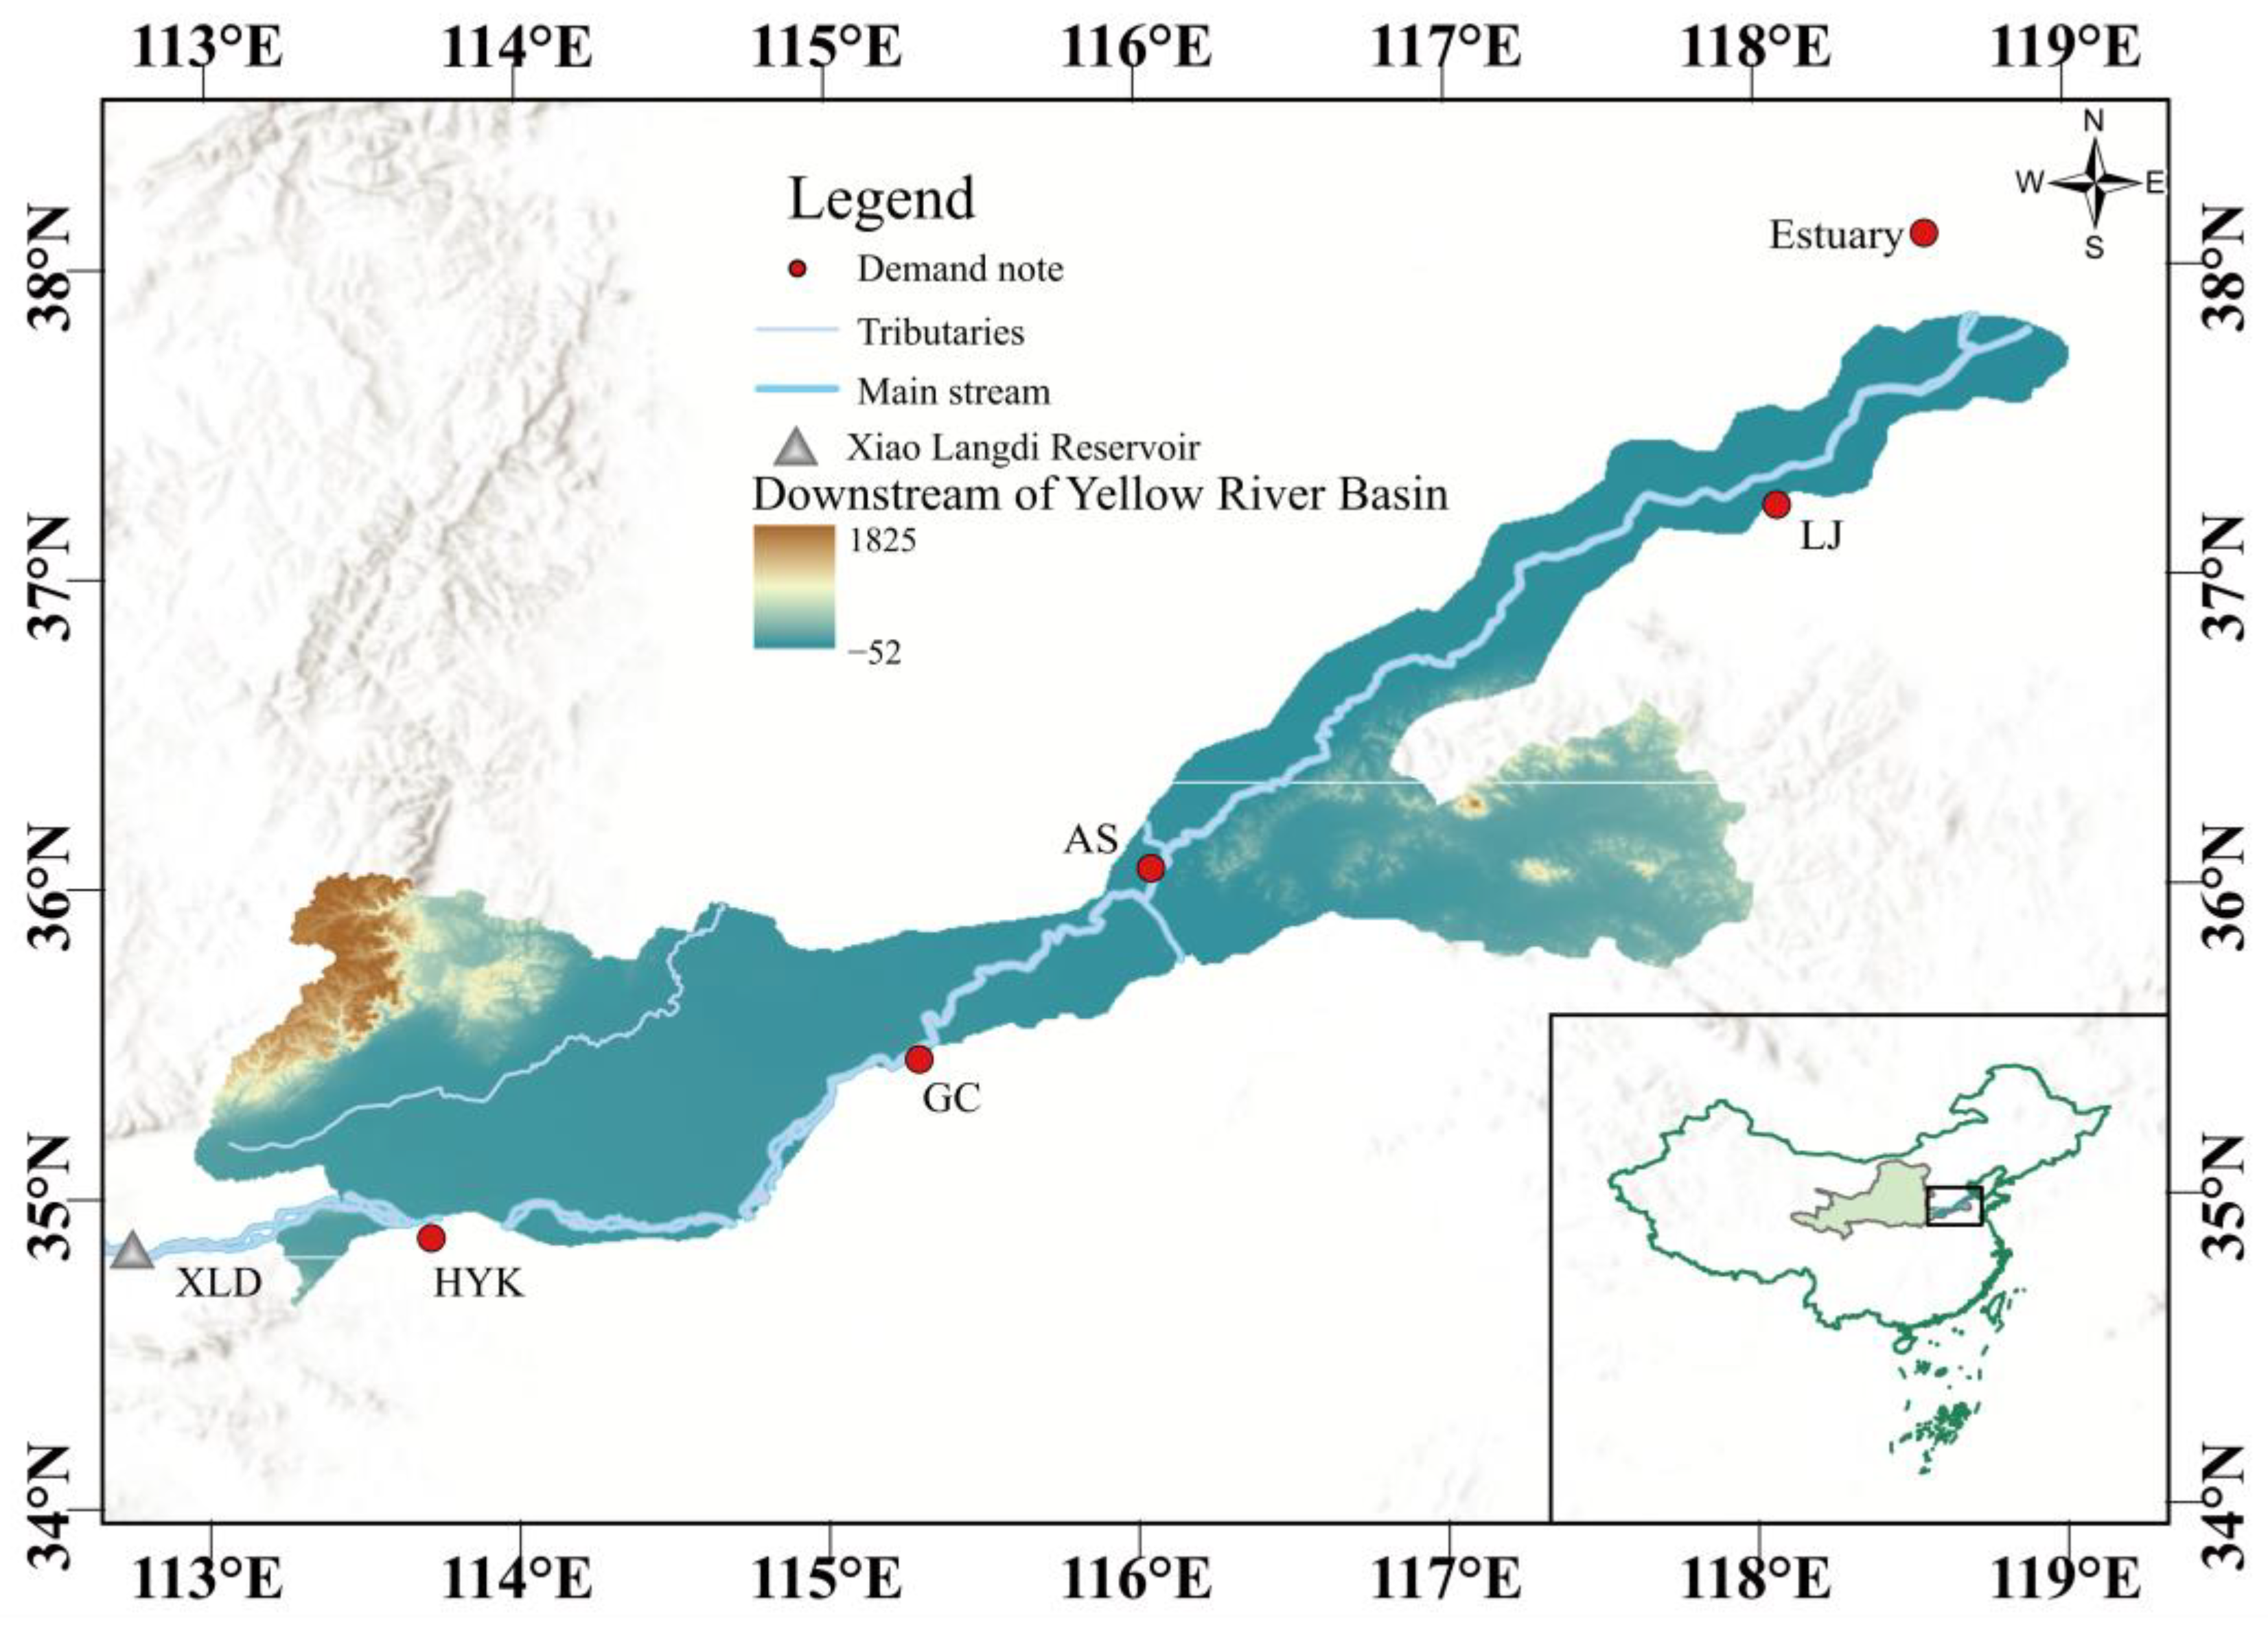
The Yellow River is located in the northern part of China, extending from 95°53′ to 119°05′ in longitude and 32°10′ to 42°50′ in latitude, as shown in
Figure 2. It traverses a total of nine provinces, namely Qinghai, Sichuan, Gansu, Ningxia, Inner Mongolia, Shaanxi, Shanxi, Henan, and Shandong [
41]. The river ultimately flows into the Bohai Sea. Historically, the Yellow River Basin has experienced several large-scale droughts, with the DYRB experiencing almost continuous flow cut-offs in the 1980s [
42]. In the 21st century, the annual runoff of the Yellow River has been decreasing, and various types of drought events are occurring frequently. The severity of the drought is having a detrimental effect on the sustainable development of the Yellow River Basin [
43]. Xiaolangdi Reservoir (XLD) is the only annually regulated reservoir in the downstream region of the main stem of the Yellow River, responsible for flood control, water supply, and power generation. The DYRB was selected as the study area and XLD as the study object. The analysis of the socio-economic drought in the densely populated area of the DYRB and the evaluation of the drought resistance capacity of the mainstem reservoirs to cope with socio-economic drought are of great significance in solving the problem of human–water conflicts in the Yellow River Basin, as well as guiding the assessment of the drought resistance capacity of the reservoirs of other mainstems and tributaries.
The datasets used in this study include the natural monthly runoff data (1956–2016) and monthly surface water demand data (2030 level) for each node. The monthly runoff data are the results of the Third National Survey and Evaluation of Water Resources provided by the Yellow River Water Resources Commission (YRWRC). The collected water demand data are shown in
Table 1, where we conceptualize the monthly downstream users’ water demand by attributing it to major nodes, such as the HuaYuankou (HYK) node, so that it is easy for the reservoir operation model to perform calculations.


