Article

Relationships Between Land Use and Stream Macroinvertebrate Biotic Integrity in Central Ohio, USA

McPhail Center for Sustainability and Environmental Studies, Denison University, Granville, OH 43023, USA
*
Author to whom correspondence should be addressed.
Water 2025, 17(6), 895; https://doi.org/10.3390/w17060895
Submission received: 13 January 2025 / Revised: 12 March 2025 / Accepted: 14 March 2025 / Published: 20 March 2025
(This article belongs to the Special Issue Aquatic Ecosystems: Biodiversity and Conservation)

Abstract

:
Land use is known to be an important factor in the composition and function of adjacent freshwater lotic ecosystems. However, the relative effects of land use type, extent, intensity, and proximity on aquatic ecosystem quality are not fully understood. We evaluate these questions in low-order streams within 30 watersheds in developed, agricultural, and less developed landscapes of central Ohio, USA. We assess the relationships of land use cover percentage and spatial scale with stream macroinvertebrate community diversity and biotic integrity. We also investigate the importance of impervious cover and subsurface tile drainage within each watershed and Active River Area (ARA). We find that the percentage of coverage of developed land at the watershed scale is the strongest predictor of stream macroinvertebrate community diversity and integrity. High-intensity development is a stronger negative correlate than low-intensity development or agriculture. There is a significant decline in stream macroinvertebrate diversity and biotic integrity at the watershed and ARA scales when undeveloped land coverage falls below 20–30%. We do not find a significant relationship between stream macroinvertebrate metrics and land use at the 1 km2 scale or in comparison with any instream habitat attributes except sinuosity. Impervious cover has a significant negative relationship with both macroinvertebrate taxon richness and biotic integrity at the watershed and ARA scales. However, subsurface tile-drained land does not have a significant relationship with the stream macroinvertebrate community at any scale. We conclude that impervious land cover at the watershed and ARA scales is a critical factor for the biotic integrity of small streams in this region. Collectively, our conclusions provide evidence to support practices of ecologically sensitive land use planning.

1. Introduction

Aquatic ecosystem structure and function are influenced by adjacent terrestrial conditions in human-dominated landscapes, meaning that aquatic systems can be neither protected nor restored in isolation [1]. Aquatic–terrestrial linkages are both essential components for ecological conservation and challenging aspects of land use planning [2]. Many scholars have attempted to elucidate the relative effects of land use type, extent, proximity, intensity, and duration on various indicators of aquatic ecosystem biotic integrity, e.g., [3,4,5]. While much has been learned, these linkages are still not fully understood in terms of the aquatic community response to land use change. Continued research has important implications for regional land management, as we attempt to maintain ecosystem services amidst a growing human environmental footprint. For example, understanding the spatial thresholds of watershed land use may help prevent deleterious functional shifts in adjacent aquatic ecosystems [6].
Within this framework, a great deal of attention has been paid to land use change and the biotic integrity of lotic ecosystems. Biotic integrity is understood here to be “the capacity of a land to support characteristic functional and structural communities in the context of normal variability, to resist loss of this function and structure due to a disturbance, and to recover from such disturbance” [7]. In lotic systems, biotic integrity is typically assessed with the resident fish and aquatic macroinvertebrate communities; we focus on macroinvertebrates here. Macroinvertebrates are critical components of the faunal biomass, abundance, and diversity in freshwater ecosystems [8,9]. As such they play key roles in ecological processes such as nutrient cycling [10], decomposition [11], and bioturbation [12], as well as many provisional and cultural ecosystem services [13]. At the same time, the wide sensitivity range and relatively rapid response to changing biological and physicochemical conditions make macroinvertebrate communities useful indicators of biotic integrity [14].
Several recent studies of large data sets show that land use intensification can have deleterious effects on the biotic integrity of riverine systems. In a meta-analysis of 37 global studies, Petsch et al. [15] find that while any type of land use alteration from pristine native vegetation can reduce freshwater stream diversity, urbanization is associated with the strongest negative effect. Hughes et al. [16] use the National Rivers and Streams Assessment (NRSA) to analyze macroinvertebrate taxon richness (i.e., the abundance of different macroinvertebrate types as identified to the lowest practicable taxon) of 3475 streams across the conterminous Unites States. According to this study, the percentages of forested land (positive correlation) and agricultural land (negative correlation) within the watershed are the best predictors of macroinvertebrate taxon diversity. This is consistent with other studies, e.g., [17,18], which find greater taxon richness in forested streams compared with agricultural watersheds, though Sandefur et al. [19] report no significant correlation between macroinvertebrate indices and agricultural land use in a similar national-scale data set. In a meta-analysis of 62 studies from around the world, Camana et al. [20] find that a macroinvertebrate community response is most discernable in landscapes with a greater percentage of watershed land use change. The type of land use change, land use history, physical geography, and climate are comparatively unimportant. In temperate landscapes, 50% land use change from natural cover is an approximate threshold for a stream macroinvertebrate community response, while this threshold varies widely in tropical and subtropical regions [20].
The conditions of the watershed, riparian corridor, and reach-scale instream habitat are hierarchically nested and interconnected. Many regional studies have attempted to discern the importance of the different scales on stream biotic integrity. In a single-stream ecosystem in Greece, Karaouzas et al. [21] find land development at both the floodplain and watershed scales to be negatively correlated with stream macroinvertebrate diversity and quality (i.e., the relative abundance of sensitive taxa). Robinson et al. [22] study the spatial land use effects of two watersheds in Switzerland and report different primary drivers of the stream macroinvertebrate community in the two regions: a linear relationship with the percentage of land development in one, and a more complex amalgamation of watershed and small-scale water quality effects in the other. In a study of 1017 streams in Germany, Palt et al. [23] find watershed-level land use factors to be more strongly related to macroinvertebrate biotic integrity than small-scale metrics of the riparian corridor. Both Sulikowski [24] and Hoover and Wood [25] find watershed land use to be a strong predictor of stream macroinvertebrate biotic integrity, along with significant local correlation of riparian forest cover [24] and instream water quality [25].
Fewer studies have considered the importance of instream habitat relative to watershed-scale land use factors, and those that have are contradictory. For example, Hrodey et al. [26] find instream features like channel width, bank stability, and the percentage of fine substrates to be better predictors of macroinvertebrate community biotic integrity than watershed-scale factors. Karaouzas et al. [21] also report instream microhabitat, such as woody debris, artificial substrate, water chemistry, and stream morphology, to be more important than watershed-scale factors. However, Henderson and Christian [27] consider reach-scale stream habitat but find no significant correlation with the instream macroinvertebrate community, similar to the findings of Stepenuck et al. [28]. There is a need for additional studies on this question.
A second issue in need of further exploration is the nuanced character of developed land. Urbanized land is not monolithic, and we need a better understanding of the types of urban development and their relative effects on stream structure and function. Wang et al. [29] classify urban development as the percentage of impervious land in the watershed and find a significant decline in stream macroinvertebrate biotic integrity at a mere 3.5–5.5% impervious cover. Stepenuck et al. [28] report steep declines in stream quality metrics at 8–12% watershed impervious cover, while Huang and Gergel [30] find the best macroinvertebrate biotic integrity in streams with 16% or less watershed impervious cover, and the lowest integrity in streams with greater than 60% watershed impervious cover. Agricultural land may similarly be classified and analyzed based on agricultural practices, such as artificial drainage. Some watersheds are more than 80% drained by surface ditches and subsurface tiles, causing profound changes in the hydrologic and chemical load of receiving streams [31]. Our analysis of the relative relationship of impervious cover and tile-drained land provides an assessment of specific land development attributes and stream biotic integrity.
In this study, we explore three hypotheses. First, we hypothesize that the type and degree of watershed land use, broadly considered to be developed land, agricultural land, and less developed land, influences stream macroinvertebrate community diversity and biotic integrity. Second, we hypothesize that physical land features at various scales—watershed, river corridor, small catchment, and instream attributes—have differential effects on stream macroinvertebrate communities. Third, we hypothesize that watershed impervious cover and subsurface tile drainage affect in-stream macroinvertebrate communities in similar ways.

2. Materials and Methods

2.1. Study Area

We analyzed watersheds and low-order streams of Central Ohio, USA, in Delaware, Franklin, Hocking, Knox, and Licking Counties (Figure 1). Central Ohio features a variety of land uses, including urban and suburban sectors of Columbus and the surrounding cities, intensive row-crop agriculture, pasture, rural residential areas, forest, and surface water. Within this region, we selected Hydrologic Unit Code (HUC) level 12-scale watersheds based on their land use characteristics according to the United States Geological Survey National Land Cover Database (USGS NLCD) [32,33]. The HUC system delineates nested watersheds of the United States, with the HUC12 level denoting “subwatersheds”, which averaged approximately 80 km2 in our data set (Table 1) [32,33]. We used data from the 2019 USGS NLCD [34] to estimate impervious cover and data from Valayamkunnath et al. [35] to estimate the area of subsurface tile drainage within each HUC12 watershed. From a population of over 70 HUC12 watersheds, we selected 30 for analysis (Table 1): 10 with a high percentage of impervious cover (developed); 10 with a high percentage of subsurface tile drainage (agriculture); and 10 with comparatively low impervious cover and tile drainage (less developed). Within each watershed, we selected a low-order stream, and at least one reach within that stream, for spatial and field analyses. Stream reaches and access points were chosen by consultation with and with permission from local landowners. In three watersheds, we sampled multiple stream reaches; thus, for 30 watersheds, we had 33 field sampling sites.

2.2. Spatial Analysis

For each of the 30 watersheds, we used USGS NLCD 2019 data to quantify the HUC12 area and the Active River Area (ARA) [36]. The ARA consists of the main river channel plus the base zone (parafluvial and riparian corridors), the 100-year floodplain, and material contribution areas [36]. We used Model My Watershed [37] to determine the NLCD 2019 developed area, agricultural area, and undeveloped area of each HUC12 watershed, its ARA, and a 1 km2 square centered on each field sampling site (Figure 2). Developed land, by our definition, includes low-density residential as well as medium-density commercial and high-intensity industrial land uses. Agricultural land includes cultivated cropland and pastures, while undeveloped land includes forests, wetlands, grasslands, shrublands, and open water. We also used Model My Watershed to obtain the simulated hydrologic load, nitrogen load, phosphorus load, and sediment load for each HUC12 and its ARA. These simulations were based on a hypothetical 24 h storm in each land use context, as generated by a hybrid of the Source Loading and Management Model (SLAMM), the TR-55 model, and the Spreadsheet Tool for the Estimation of Pollutant Load [38,39,40]. Since these are simulated values, they serve as indicators of watershed runoff load rather than actual hydrologic conditions. We estimated impervious cover and subsurface tile drainage for each HUC12, ARA, and 1 km2 by extracting USGS NLCD data and the most-likely tile-drained area based on soil drainage class and topographic slope [35] using ArcPro 3.3.

2.3. Field Analysis

We visited 33 second- or third-order streams within the 30 HUC12 watersheds in June and July 2024. At each location, we demarcated a 100 m reach along the thalweg, with perpendicular cross sectional transects at 10 m intervals. Within every reach, we measured the sinuosity, dissolved oxygen, water and air temperature, electrical conductivity, and total suspended solids. We also rated every reach according to the Ohio Environmental Protection Agency Qualitative Headwater Habitat Evaluation Index (QHEI) and the United States Environmental Protection Agency (USEPA) HabitatAssessment for Low-Gradient Streams [41,42]. Along each transect, we established 2 to 5 sampling locations, depending on stream width, where we measured the depth, flow rate, substrate size, instream vegetation cover, canopy cover, bank stability, riparian vegetation cover, character of woody debris, and instream habitat type (riffle, run, glide, pool). We collected and tallied aquatic macroinvertebrates from the Phyla Annelida, Arthropoda, and Mollusca within every 100 m reach by hand-picking rocks and woody debris and with fine-mesh seines. At each location, we collected macroinvertebrates for 120 person-minutes (typically 6 individuals for 20 min). Voucher specimens were preserved in alcohol for later identification to the lowest taxon practicable. For each macroinvertebrate community, we determined the total number of individuals collected; the total number of taxa; the total number of Ephemeroptera, Plecoptera, and Trichoptera (EPT) taxa; the Shannon diversity index [43]; and the Headwater Macroinvertebrate Field Evaluation Index (HMFEI) [44]. The HMFEI is a biotic integrity index in which benthic macroinvertebrates, identified to the order or family level, are assigned points based on their tolerance and fidelity to habitat conditions [44].

2.4. Statistical Analysis

We used ANOVA to compare mean macroinvertebrate community statistics between locations according to the following land use characteristics: percentage of developed land; percentage of agricultural land; percentage of undeveloped land; and simulated hydrologic, nitrogen, phosphorus, and sediment loads. These comparisons were conducted at the HUC12, ARA, and 1-km2 scales. Similarly, we used ANOVA to compare macroinvertebrate community characteristics at the lowest, middle, and highest terciles of instream habitat attributes according to the QHEI and the USEPA Habitat Assessment for Low-Gradient Streams. To evaluate the relative effects of the impervious area and estimated tile-drained area, we performed a linear regression of the land use quintile means and macroinvertebrate community scores. Finally, we used a correlation matrix (Pearson’s r) and multiple linear regression to identify the best predictors of stream macroinvertebrate biotic integrity. All statistical analyses were conducted with JMP 17, with significance evaluated at α = 0.05 and α = 0.1.

3. Results

3.1. Descriptive Statistics

The HUC12 watersheds in our analysis are representative of the watersheds in the greater central Ohio region (Table 1). Those that we classify as developed have impervious areal coverage greater than 60%, while agricultural regions are estimated to have more than 30% subsurface tile drainage. Watersheds that we classify as less developed have less than 25% combined coverage of impervious and tile-drained lands. The ARA zones generally have statistically similar or marginally less developed and agricultural land compared to the corresponding HUC12 watersheds (Table 1). The intensity of HUC12 land use ranges from highly developed (85% residential, commercial, and industrial land use; 95% impervious cover) to highly agricultural (75% crop and pastureland; 40% subsurface tile drainage) to predominantly forested (70% forest; 6% impervious cover; 3% tile-drained). HUC12 land use is strongly correlated with simulation model-generated hydrologic load (Pearson’s r = 0.94), but not significantly correlated with nitrogen, phosphorus, or sediment load.
Instream habitat features vary throughout the 33 stream reaches of this study. The QHEI ranges from 70 to 32 and correlates with the USEPA Stream Habitat Assessment Score (r = 0.72). The habitat variables with the greatest range include sinuosity; canopy cover; instream vegetation and periphyton; substrate material; and the relative percentage of riffles, runs, and pools. Within these streams we cataloged 3957 individual macroinvertebrate organisms of 96 taxa (Table 2). The Shannon diversity ranges from 2.7 to 1.4, EPT taxa from 11 to 2, and HMFEI from 48 to 12. The total taxa, EPT taxa, Shannon Diversity, and HMFEI are all positively correlated with each other; thus, we use total taxa as our primary measure of diversity and the HMFEI as our primary measure of biotic integrity.

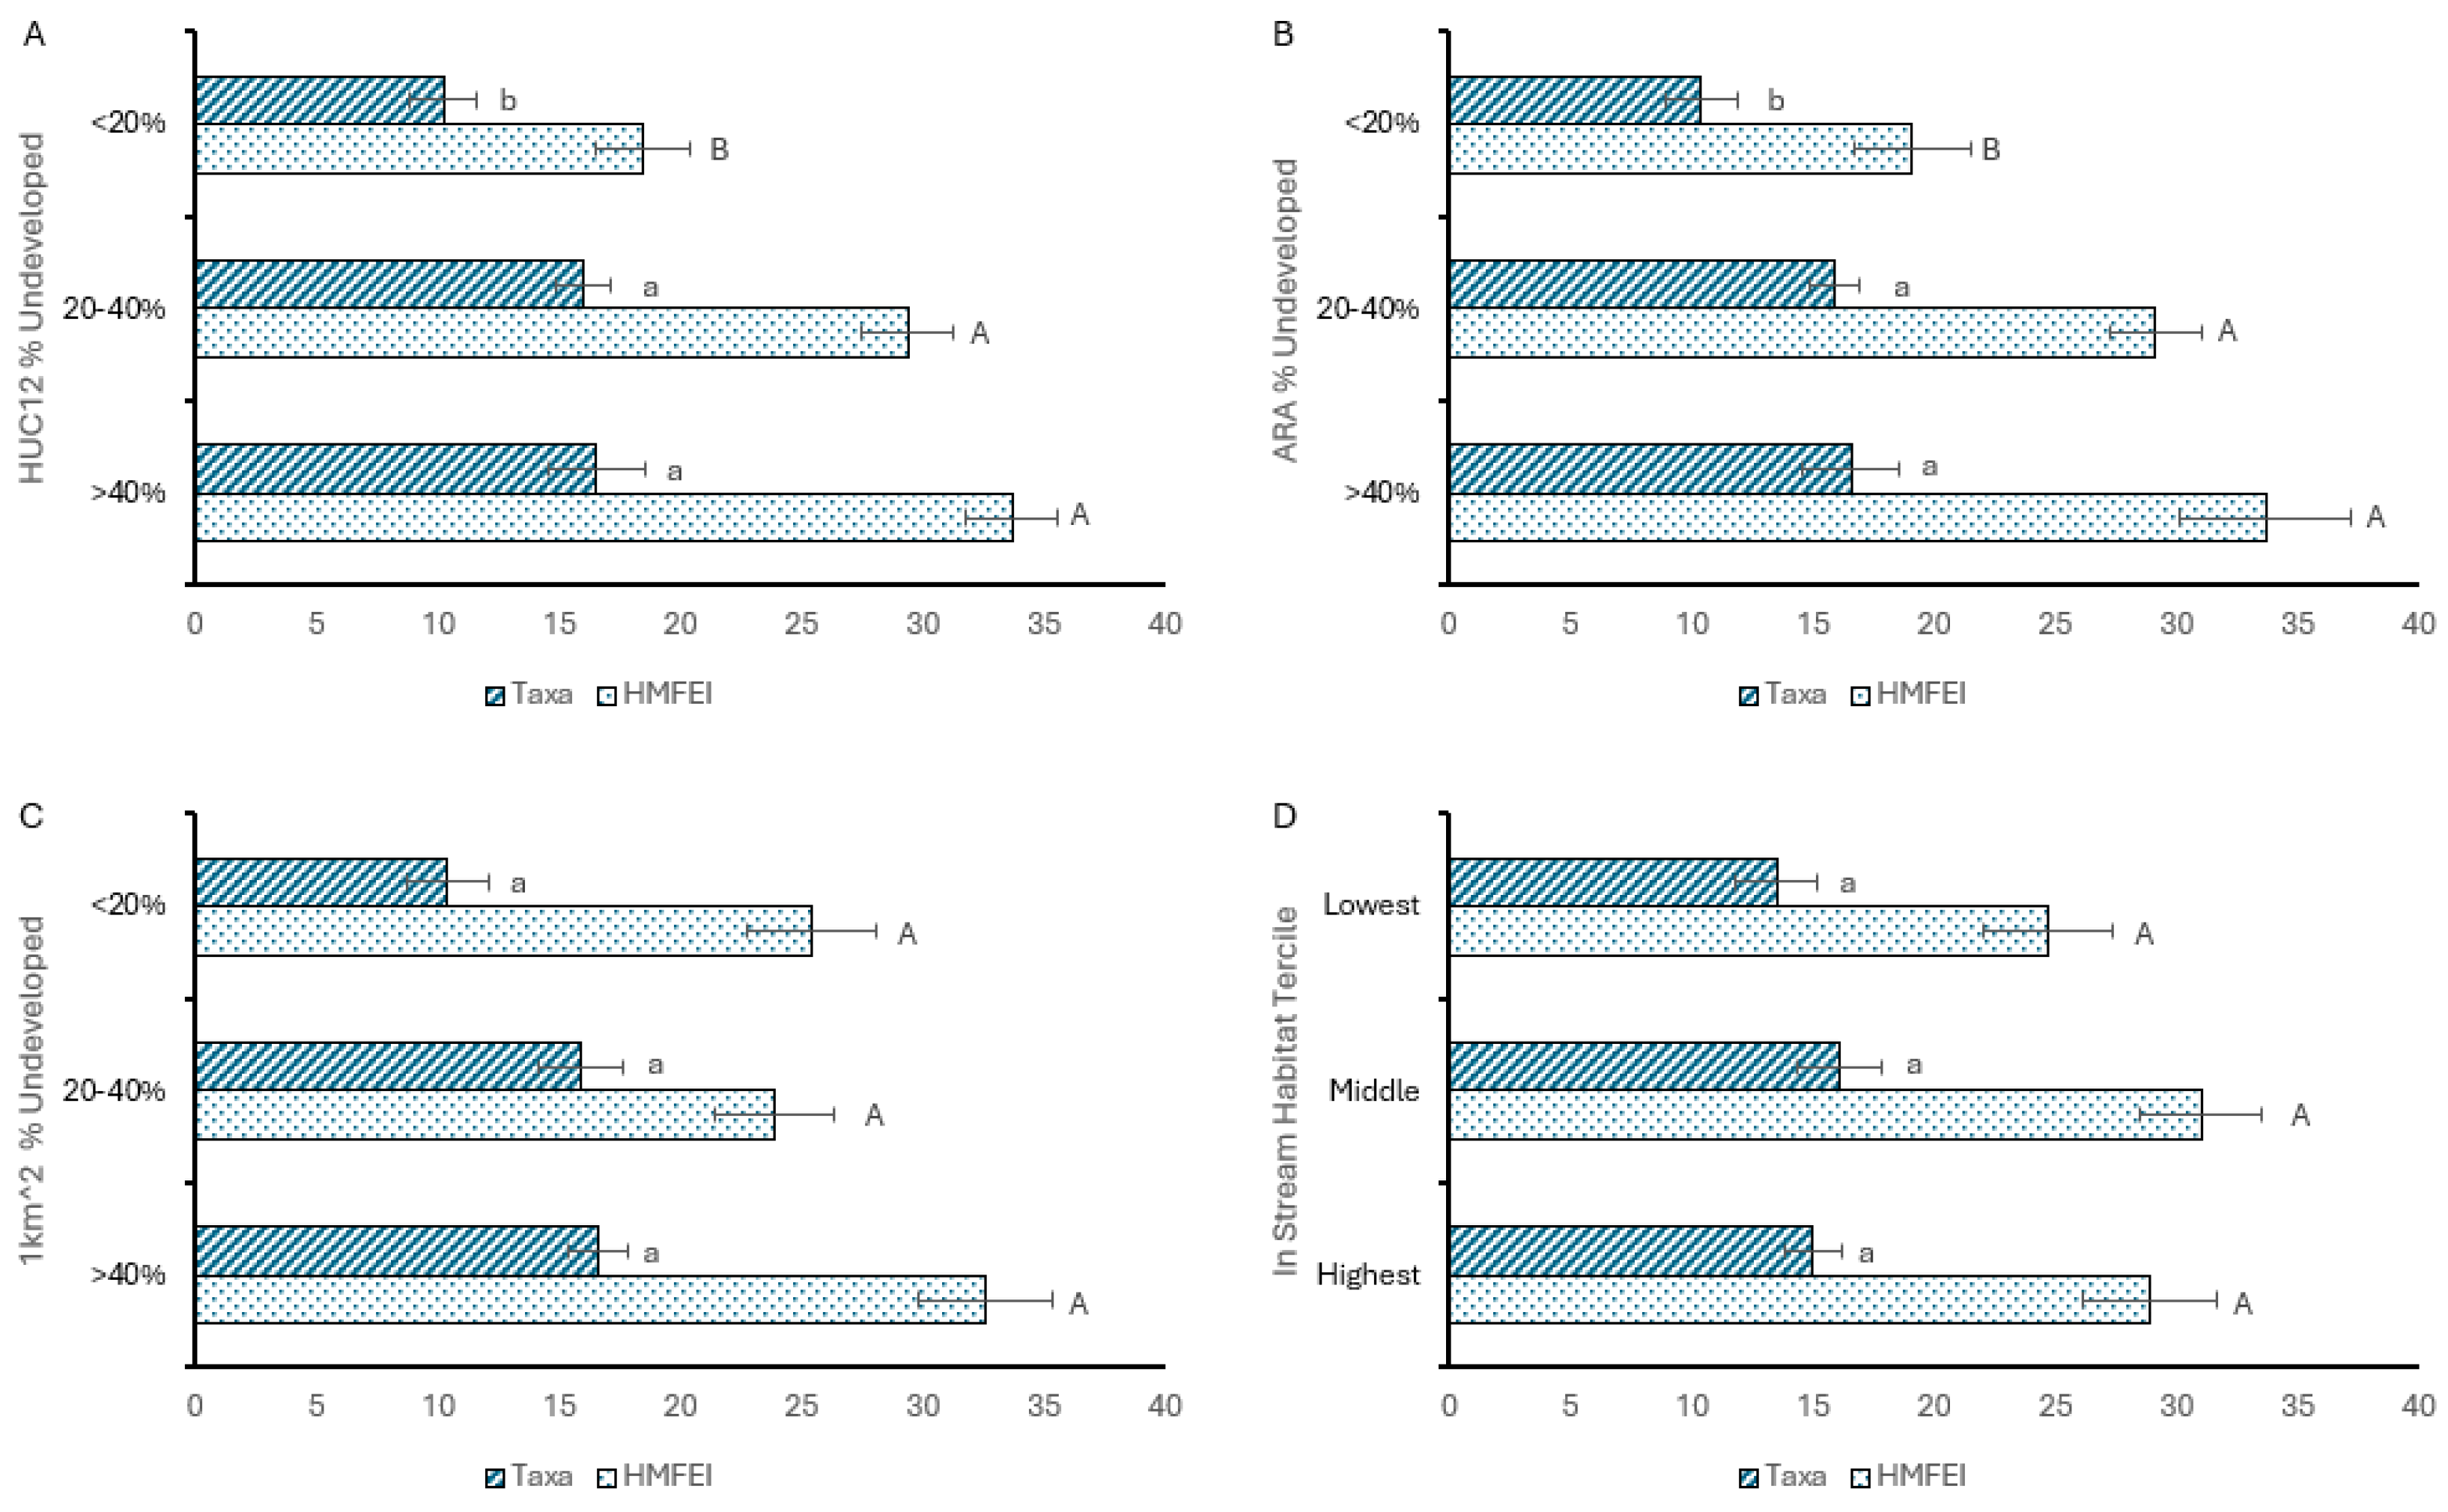
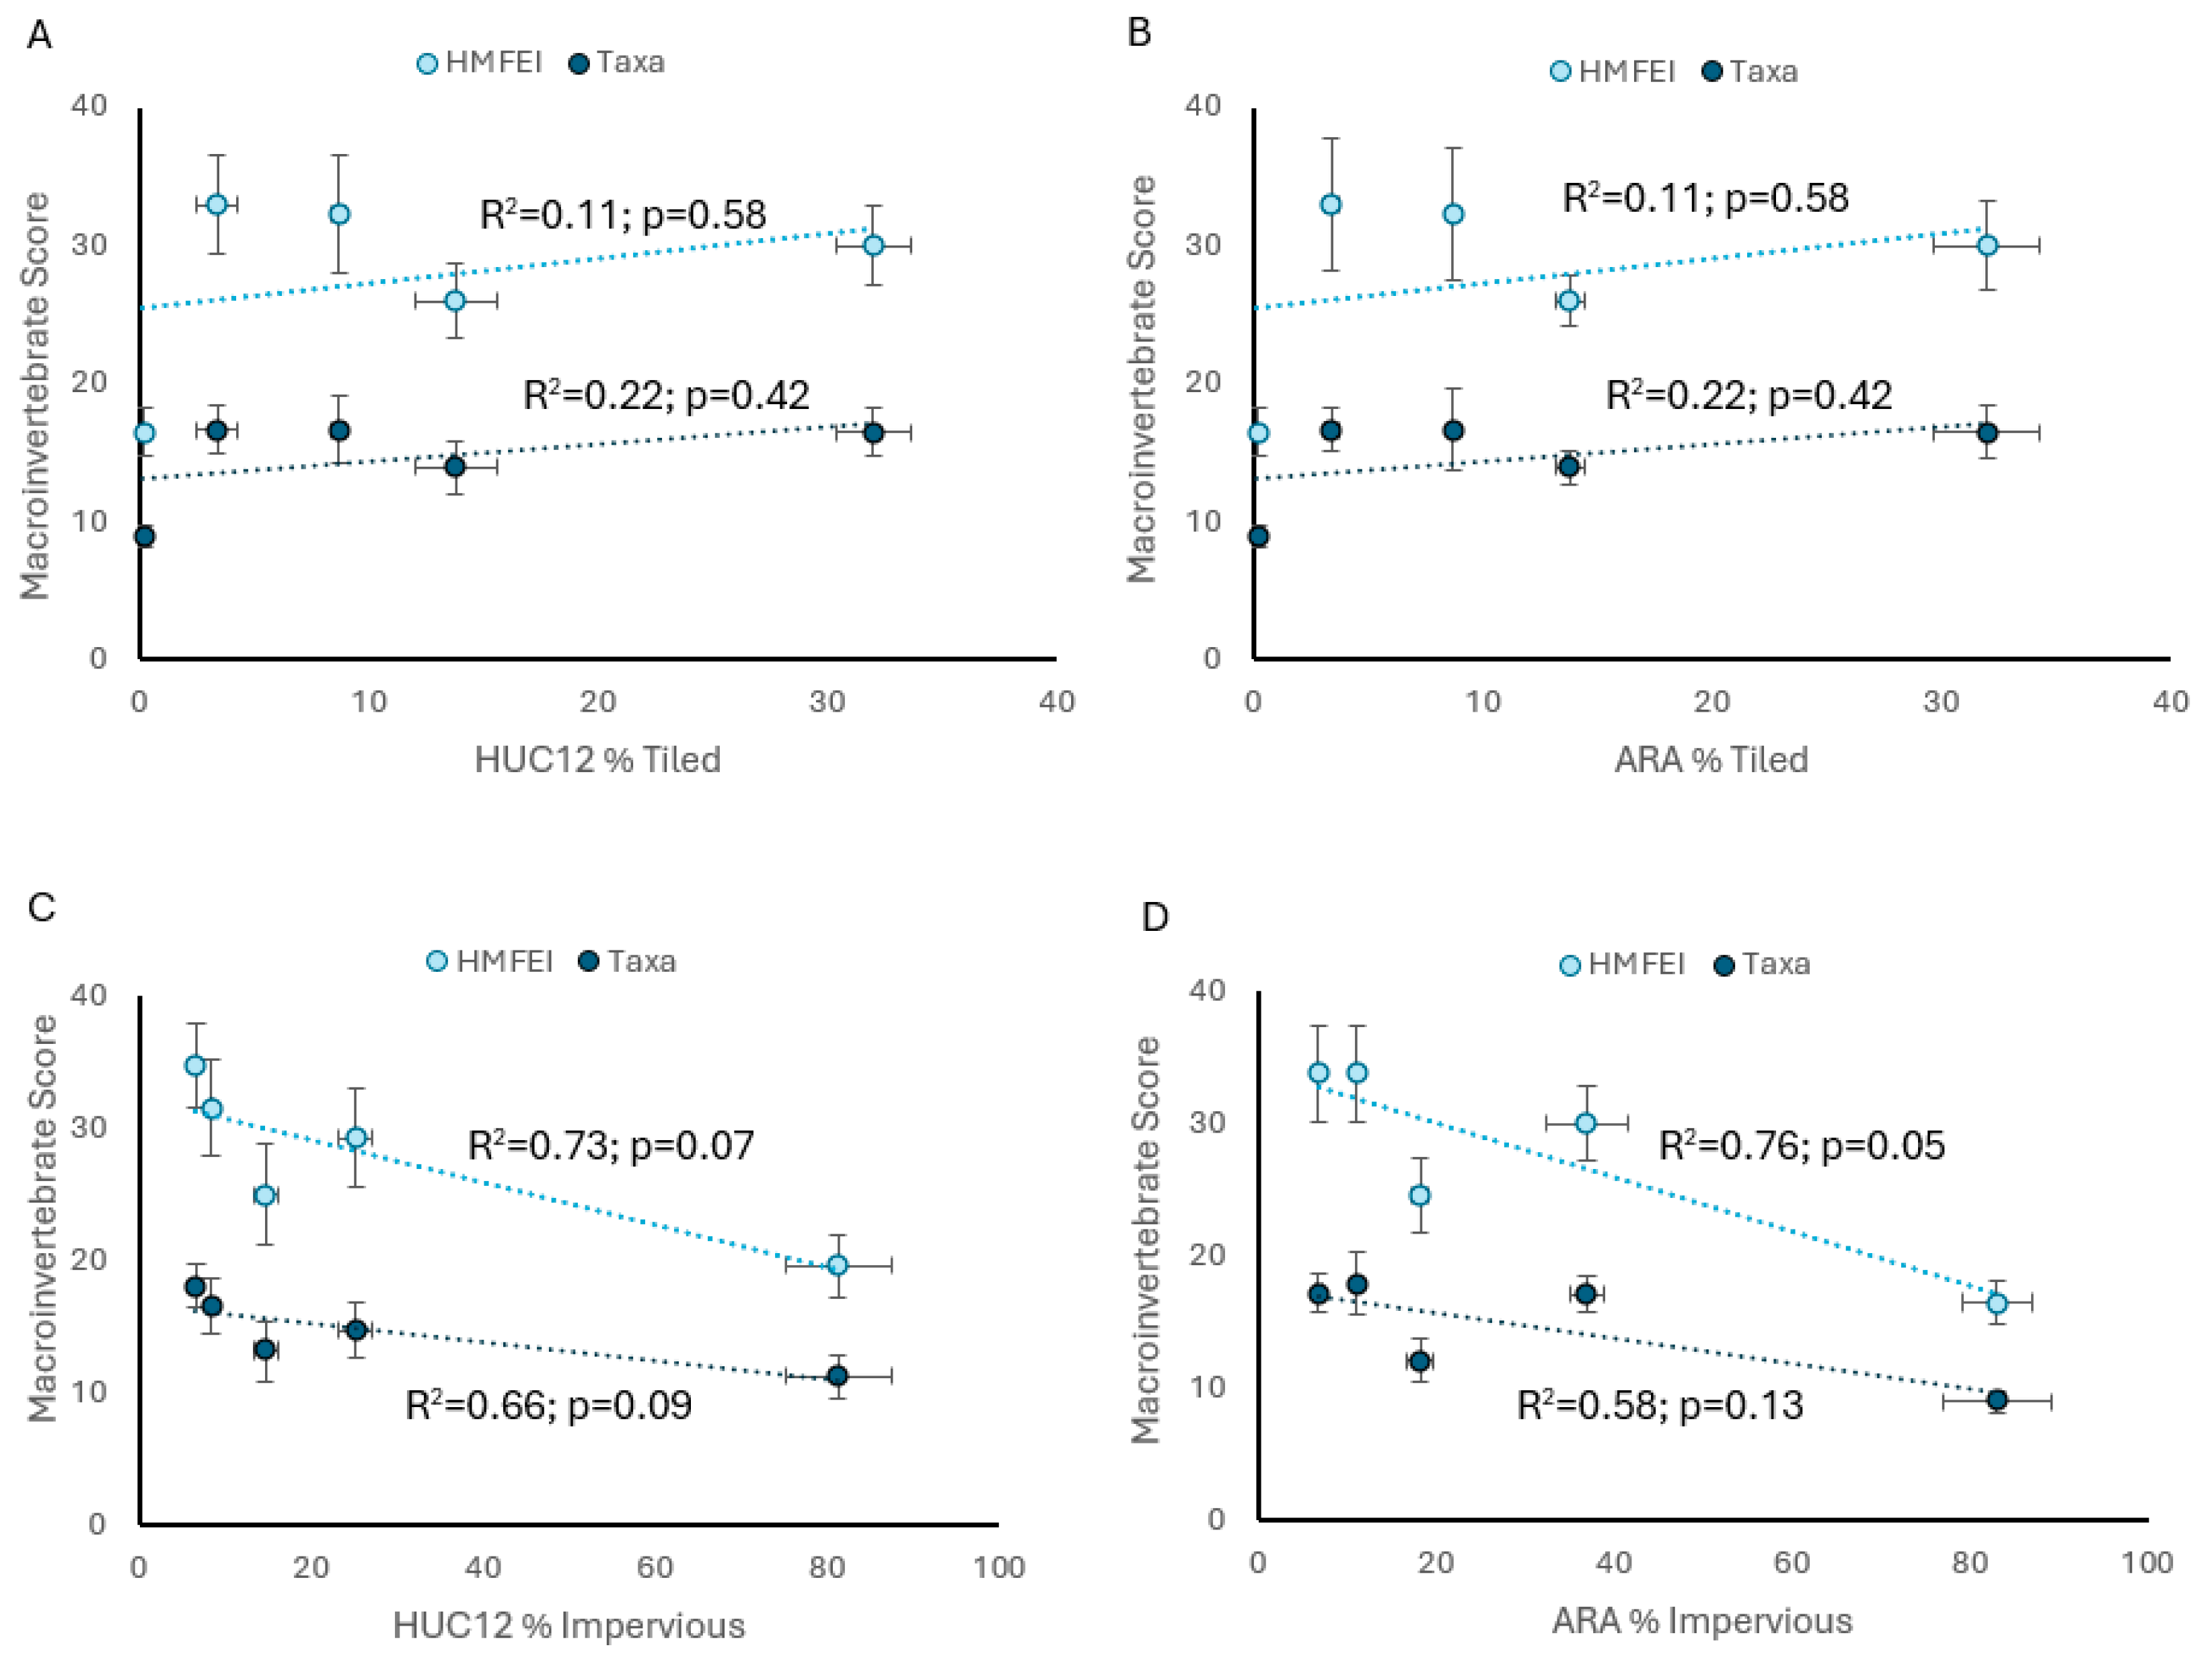
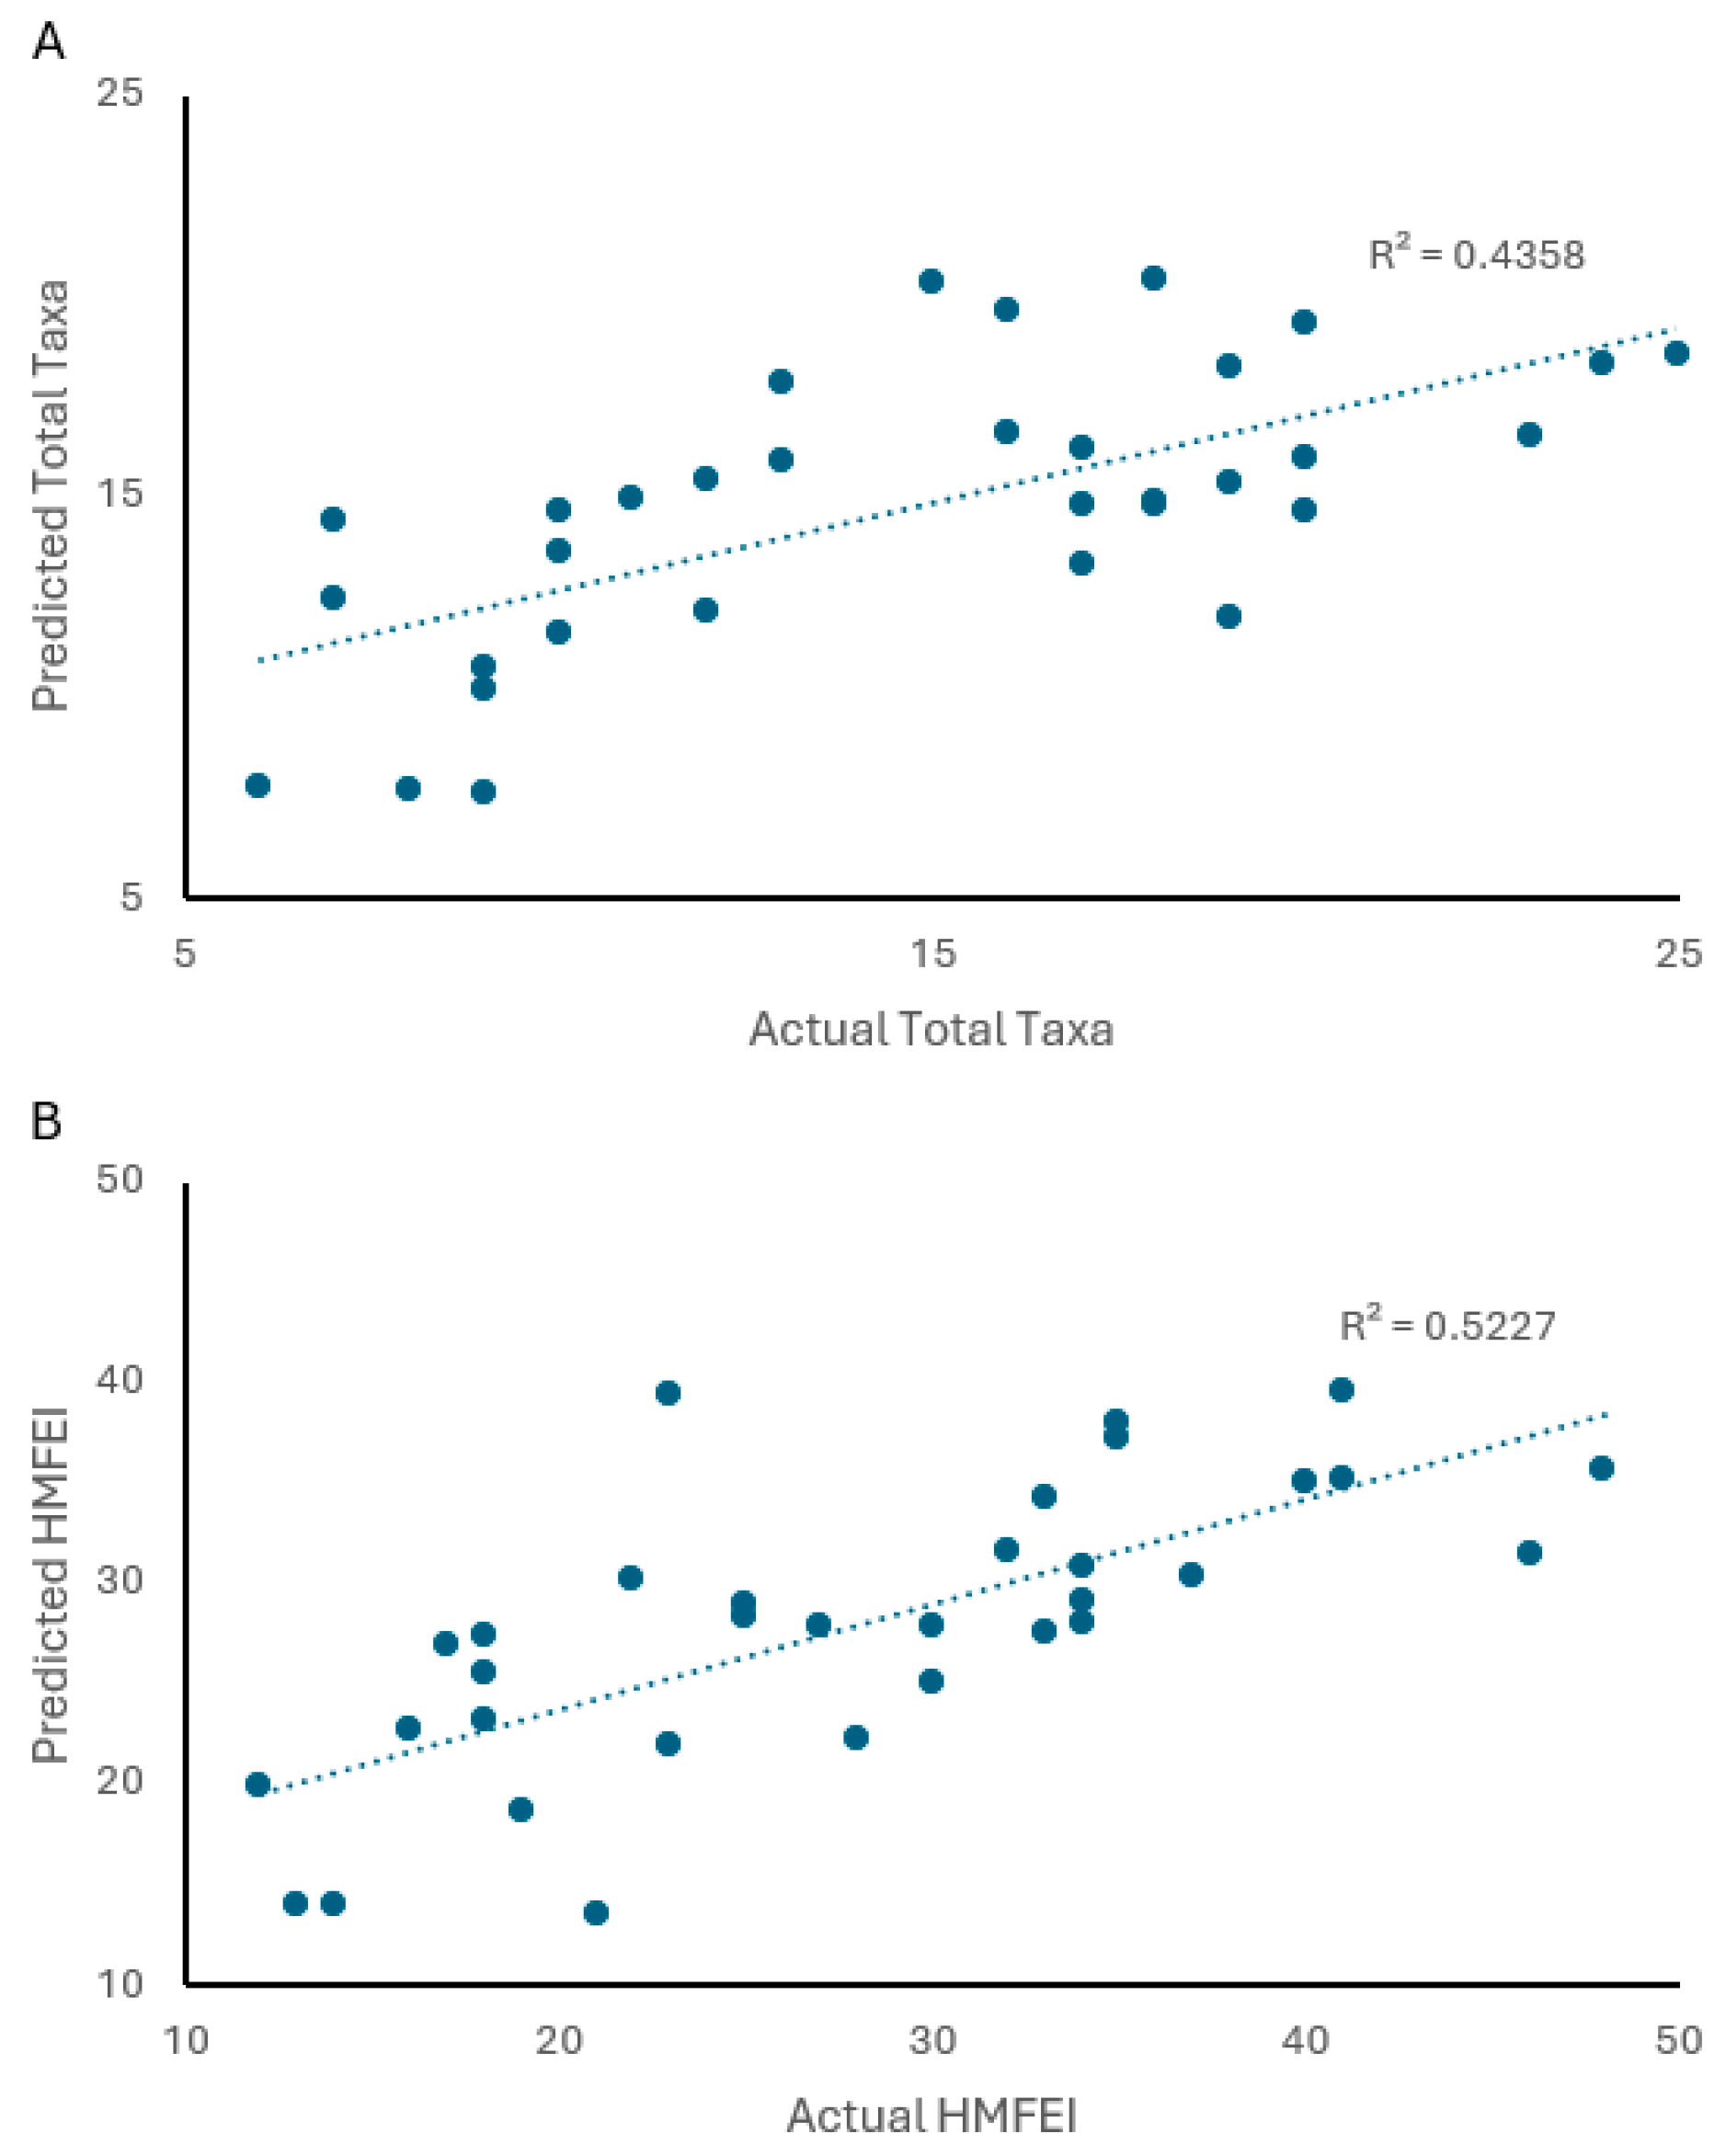
3.2. Analysis of Hypotheses

Our first hypothesis suggests that land use type and extent within the HUC12 watershed is associated with macroinvertebrate community diversity and biotic integrity. To test this, we calculated the correlation coefficients of the HUC12 land use variables with the macroinvertebrate community variables (Table 3). The percentage of developed land within the watershed and the associated hydrologic load has a significant negative correlation with every measure of macroinvertebrate diversity and biotic integrity. Conversely, the percentage of undeveloped land has a positive correlation with every variable except total individuals. We therefore accept this hypothesis. The relative amount of developed and undeveloped land at the HUC12 scale is the strongest predictor of stream macroinvertebrate community diversity and biotic integrity in our study (Table 3; Figure 3).
To evaluate our second hypothesis, we compared the mean number of macroinvertebrate taxa and the HMFEI by category of land use at the HUC12, ARA, 1 km2, and instream scales (Figure 3). Using the percentage of undeveloped land (i.e., forest, shrubland, grassland, and surface water) as the indicator of land use, we find a significant decline in both total taxa and the HMFEI at the HUC12 and ARA scales (Figure 3A,B). At both scales, macroinvertebrate communities are significantly less diverse and of lower integrity when undeveloped land drops below 20–30%. We do not find a significant decline in total taxa or the HMFEI at the 1 km2 scale (Figure 3C). Similarly, the tercile comparison of stream habitat scores (Figure 3D) indicates no significant change in macroinvertebrate community metrics. Based on this evidence, we accept the hypothesis and conclude that land use at the watershed and river corridor scales has a greater influence on macroinvertebrates than smaller-scale land use or instream attributes in this data set.
In our third hypothesis, we propose that impervious cover and subsurface tile drainage will have similar effects on the stream macroinvertebrate community. To test this hypothesis, we compare macroinvertebrate taxa and the HMFEI to the quantile means of percentage of impervious cover and percentage of tiled land at the HUC12 and ARA scales (Figure 4). At both scales, impervious cover has a significant negative relationship with both taxa and the HMFEI. However, the percentage of tile-drained land does not have a significant relationship with the stream macroinvertebrate community at either scale. Thus, we reject the hypothesis and conclude that impervious cover has a greater association with the stream macroinvertebrate community than the percentage of tile-drained land. Multiple linear regression models (Figure 5) using the HUC12 percentage of development and stream sinuosity as predictors can explain about 43% of the variation in macroinvertebrate taxa (y = 23.2 − 0.2*%HucDev + 0.9*sinuosity) and about 52% of the variation in the HMFEI (y = 12.6 − 0.1*%HucDev + 0.4*sinuosity).

4. Discussion

Other studies illustrate the importance of land use variation for the detection of lotic macroinvertebrate community effects. In our sample, developed HUC12 watersheds range from 60 to 84% combined residential, commercial, and industrial land use, spanning 31 to 95 percentage of impervious cover. By comparison, the global data set of Petsch et al. [15] considers developed sites that range from 20 to 96% urbanized land, with impervious cover over 40%. Agriculture-dominated watersheds in our study range from 58 to 76 percentage of row-crop or pasture lands, while Petsch et al. [15] sample studies ranging from 53 to 100% agriculture. The percentage of tile-drained land in HUC12 watersheds is not well represented in the literature, but our selection of 25–35% tile-drained land falls in the medium range of 3.5–60% for central Ohio HUC12 watersheds estimated by Valayamkunnath et al. [35]. Our less developed watersheds range from 40 to 68% forest cover, while undeveloped reference sites in Petsch et al. [15] average 77% ± 12% (mean ± SD) of forest cover. Other large data sets [16,20] analyze a similar range of land use coverage. Thus, while a study of this nature in a comparatively small region can restrict the variety of land use coverage [22], our data set appears to represent an adequate degree of land use heterogeneity.
Regarding the relationship of land use type and extent with the stream macroinvertebrate community, our study is largely in agreement with the literature. We accept our first hypothesis and find the HUC12 percentage of developed area and percentage of undeveloped area (primarily forest, with small areas of shrublands, grasslands, and surface water) to be the strongest predictors of macroinvertebrate community metrics. The percentage of agricultural land in the HUC12 watershed is the best positive predictor only for the total number of individual organisms collected at sampling locations; it is not a significant correlate with any other macroinvertebrate community metrics. Comparable studies [15,28,45,46] similarly find the percentage of urbanization to be the strongest predictor of low macroinvertebrate biotic integrity, while others report a strong positive correlation with the percentage of watershed forested land [4,16,36]. Interestingly, our analysis of NLCD developed land subcategories suggests that high-intensity development (i.e., industrial) has the strongest negative correlation with total macroinvertebrate taxa, while low-density residential development has the smallest negative correlation with HMFEI scores. Within agricultural subcategories, the amount of pasture- and hay-production land has a much higher positive correlation with macroinvertebrate indices than the amount of row-crop agriculture land. These subtleties make it difficult to identify a threshold for deleterious land use change as Camana et al. have [20]. In our study, low-intensity development and low-density pastoral agriculture may allow for a high-integrity-stream macroinvertebrate community with only 20–30% forested cover in the watershed, while high-intensity development and row-crop agriculture have a disproportionately greater negative effect.
Our second hypothesis, proposing differential spatial scale effects of physical land features on the stream macroinvertebrate community, is confirmed by our analysis. We find significant and indistinguishable correlations of land use with stream biotic integrity at the HUC12 and ARA scales, and we find no significant correlation at the 1 km2 or reach-level scales; this agrees with similar studies [27,28]. In our study the only significant reach-level factor is sinuosity. Our results are not necessarily in conflict with those that find greater predictive power at smaller spatial scales [21,26]. In our data set, the variance of landscape-level factors is greater than that of instream factors; regions with the inverse relative variance may well show the opposite spatial importance. In any case, the significance of ARA land use and sinuosity in our study, along with numerous studies in the literature, make it clear that suitable land cover at all spatial scales is necessary to maintain stream biotic integrity.
The analysis of our third hypothesis provides evidence that impervious cover in both the watershed and river corridor has a strong negative relationship with stream biotic integrity. Some studies suggest that a small percentage of impervious cover can have a strong negative effect on stream quality [28,29]. Wang and Kanehl [47] similarly report a significant decline in stream macroinvertebrate biotic integrity with watershed impervious cover of more than 7 percent. In the region of our study, stream macroinvertebrate biotic integrity declines when impervious cover in the watershed or river corridor reaches 30–60% (Figure 4), which is more in line with Huang and Gergel [30]. According to our data, the percentage of tile-drained land in the watershed or river corridor does not have the same negative effect. In fact, we find no direct relationship of the percentage of tile-drained land with stream biotic indices. Indirectly, we do find negative correlations of runoff volume and nutrient load—both enhanced by impervious cover and tile drainage—with the stream macroinvertebrate community. Our finding of a greater importance of imperviousness than tile drainage may be an artifact of site selection: some watersheds exceeded 95% impervious cover, but our greatest percentage of tile-drained coverage was only 38%. While our study provides a partial analysis of the effects of tile drainage on stream macroinvertebrates, we can find no other published studies for comparison. This question deserves more attention.

5. Conclusions

We preface our conclusions with three caveats. First, analyses of this type are context-specific. While our methods are transferable to other regions, local factors may yield nuanced results. Second, the assessment of ecosystem biotic integrity depends upon the metrics selected to quantify integrity. We select the total macroinvertebrate taxa, EPT taxa, Shannon diversity, and HMFEI as metrics for their general comparability with other studies. But these are certainly not the only, and maybe not the best, metrics for all situations. Different metrics may yield different conclusions. Indeed, our own analyses of individual Ephemeroptera, Coleoptera, Trichoptera, Mollusca, and Decapoda data did not show the same land use relationships as aggregate community indices. Finally, biotic indices of any collection of indicator organisms may not necessarily equate with ecosystem function, nor do they always indicate the status of desired ecosystem services.
With these qualifications, we offer three clear conclusions. First, watershed-scale and ARA land use are critical factors for the biotic integrity of small streams in our study region. Given suitable land use in the watershed and river corridor, a high-integrity macroinvertebrate community may exist in a variety of instream habitat conditions. Second, a greater degree of undeveloped land, or, conversely, a lesser degree of high-intensity development and row-crop agriculture, is associated with greater stream macroinvertebrate biotic diversity and integrity. Third, in both the river corridor and the watershed, impervious cover has a greater negative association with the stream macroinvertebrate community than the percentage of tile-drained land. These conclusions provide evidence to support practices of ecologically sensitive land use planning. Specifically, the protection of undeveloped land and minimization of impervious cover in the watershed and in the river corridor are associated with greater macroinvertebrate diversity and biotic integrity.

Author Contributions

All authors contributed to conceptualization, methodology, investigation, data curation, formal analysis, funding acquisition, and review and editing. The original draft preparation, supervision, and project administration were conducted by D.S. All authors have read and agreed to the published version of the manuscript.

Funding

This research was funded by the Denison University Anderson Endowment and the Denison University Research Foundation.

Data Availability Statement

The raw data supporting the conclusions of this article will be made available by the authors on request.

Acknowledgments

We thank the Licking County Park District, the Franklin County Soil and Water Conservation District, the Knox County Park District, Kenyon College, and Columbus Metroparks for granting us site access. The assistance of Sarah Lim and Alex Sket is gratefully acknowledged.

Conflicts of Interest

The authors declare no conflicts of interest.

References

  1. Cheng, C.; Zhang, F.; Shi, J.; Kung, H.T. What is the relationship between land use and surface water quality? A review and prospects from remote sensing perspective. Environ. Sci. Pollut. Res. 2022, 29, 56887–56907. [Google Scholar] [CrossRef] [PubMed]
  2. Hansen, A.J.; DeFries, R. Ecological mechanisms linking protected areas to surrounding lands. Ecol. Appl. 2007, 17, 974–988. [Google Scholar] [CrossRef]
  3. Lin, J.; Huang, J.; Prell, C.; Bryan, B.A. Changes in supply and demand mediate the effects of land-use change on freshwater ecosystem services flows. Sci. Total Environ. 2021, 763, 143012. [Google Scholar] [CrossRef]
  4. Fierro, P.; Bertrán, C.; Tapia, J.; Hauenstein, E.; Peña-Cortés, F.; Vergara, C.; Cerna, C.; Vargas-Chacoff, L. Effects of local land-use on riparian vegetation, water quality, and the functional organization of macroinvertebrate assemblages. Sci. Total Environ. 2017, 609, 724–734. [Google Scholar] [CrossRef] [PubMed]
  5. Carpenter, S.R.; Stanley, E.H.; Vander Zanden, M.J. State of the world’s freshwater ecosystems: Physical, chemical, and biological changes. Ann. Rev. Environ. Res. 2011, 36, 75–99. [Google Scholar] [CrossRef]
  6. Scheffer, M.; Carpenter, S.; Foley, J.A.; Folke, C.; Walker, B. Catastrophic shifts in ecosystems. Nature 2001, 413, 591–596. [Google Scholar] [CrossRef]
  7. Deng, X.; Du, J. Land Quality: Environmental and Human Health Effects. In Encyclopedia of Environmental Health; Nriagu, J.O., Ed.; Elsevier: Amsterdam, The Netherlands, 2011; pp. 362–365. [Google Scholar] [CrossRef]
  8. Lin, X.W.; Zhang, X.G.; Tan, L.; Tian, Z.; Li, J.T.; Luo, Q.Y. Temporal ecological processes have different seasonal influences on multiple dimensions of riverine insect diversity in China. Insect Conserv. Div. 2024, 18, 246–259. [Google Scholar] [CrossRef]
  9. Clarke, A.; Mac Nally, R.; Bond, N.; Lake, P.S. Macroinvertebrate diversity in headwater streams: A review. Freshw. Biol. 2008, 53, 1707–1721. [Google Scholar] [CrossRef]
  10. Atkinson, C.L.; Capps, K.A.; Rugenski, A.T.; Vanni, M.J. Consumer-driven nutrient dynamics in freshwater ecosystems: From individuals to ecosystems. Biol. Rev. 2017, 92, 2003–2023. [Google Scholar] [CrossRef]
  11. Graça, M.A. The role of invertebrates on leaf litter decomposition in streams–a review. Int. Rev. Hydrobiol. 2001, 86, 383–393. [Google Scholar] [CrossRef]
  12. Chakraborty, A.; Saha, G.K.; Aditya, G. Macroinvertebrates as engineers for bioturbation in freshwater ecosystem. Environ. Sci. Pollut. Res. 2022, 29, 64447–64468. [Google Scholar] [CrossRef] [PubMed]
  13. Macadam, C.R.; Stockan, J.A. More than just fish food: Ecosystem services provided by freshwater insects. Ecol. Entomol. 2015, 40, 113–123. [Google Scholar] [CrossRef]
  14. Carter, J.L.; Resh, V.H.; Hannaford, M.J. Macroinvertebrates as biotic indicators of environmental quality. In Methods in Stream Ecology, 3rd ed.; Lamberti, G.A., Hauer, F.R., Eds.; Academic Press: Cambridge, MA, USA, 2017; pp. 293–318. [Google Scholar] [CrossRef]
  15. Petsch, D.K.; Blowes, S.A.; Melo, A.S.; Chase, J.M. A synthesis of land use impacts on stream biodiversity across metrics and scales. Ecology 2021, 102, e03498. [Google Scholar] [CrossRef] [PubMed]
  16. Hughes, R.M.; Herlihy, A.T.; Comeleo, R.; Peck, D.; Mitchell, R.M.; Paulsen, S.G. Patterns in and predictors of stream and river macroinvertebrate genera and fish species richness across the conterminous USA. Knowl. Manag. Aquat. Ecosyst. 2023, 424, 19. [Google Scholar] [CrossRef]
  17. Rumschlag, S.L.; Mahon, M.B.; Jones, D.K.; Battaglin, W.; Behrens, J.; Bernhardt, E.S.; Bradley, P.; Brown, E.; de Laender, F.; Hill, R.; et al. Density declines, richness increases, and composition shifts in stream macroinvertebrates. Sci. Adv. 2023, 9, 18. [Google Scholar] [CrossRef]
  18. Vinson, M.R.; Hawkins, C.P. Broad-scale geographical patterns in local stream insect genera richness. Ecography 2003, 26, 751–767. [Google Scholar] [CrossRef]
  19. Sandefur, H.; Cummings, E.; Johnston, R.; Matlock, M.; Gustafson, D. Analyzing correlations between stream benthic macroinvertebrate community structure, water quality, and watershed land use in the continental United States. Biol. Eng. Trans. 2014, 7, 169–182. [Google Scholar] [CrossRef]
  20. Camana, M.; Ortega, J.C.; Brejão, G.L.; Melo, A.S.; Dias, M.S.; Becker, F.G. A global meta-analysis of the effects of land use on the diversity of stream fish and macroinvertebrates. Aqua. Sci. 2024, 86, 86. [Google Scholar] [CrossRef]
  21. Karaouzas, I.; Gritzalis, K.C.; Skoulikidis, N. Land use effects on macroinvertebrate assemblages and stream quality along an agricultural river basin. Fres. Environ. Bull. 2007, 16, 645–653. [Google Scholar]
  22. Robinson, C.T.; Schuwirth, N.; Baumgartner, S.; Stamm, C. Spatial relationships between land-use, habitat, water quality and lotic macroinvertebrates in two Swiss catchments. Aqua. Sci. 2014, 76, 375–392. [Google Scholar] [CrossRef]
  23. Palt, M.; Le Gall, M.; Piffady, J.; Hering, D.; Kail, J. A metric-based analysis on the effects of riparian and catchment land use on macroinvertebrates. Sci. Total Environ. 2022, 816, 151590. [Google Scholar] [CrossRef]
  24. Sulikowski, T. An Examination of the Effects of Land Use and land Cover on Macroinvertebrate Communities at Two Landscape Scales. Master’s Thesis, The Faculty of Montclair State University, Montclair, NJ, USA, August 2013. [Google Scholar]
  25. Hoover, G.W.; Wood, J. Analysis of localized water chemistry and land use drivers of macroinvertebrate community structure in the Upper Ohio Watershed using multivariate modelling and ordination techniques. Proc. West Va. Acad. Sci. 2021, 93, 1. [Google Scholar] [CrossRef]
  26. Hrodey, P.J.; Sutton, T.M.; Frimpong, E.A.; Simon, T.P. Land-use impacts on watershed health and integrity in Indiana warmwater streams. Am. Mid. Nat. 2009, 161, 76–95. [Google Scholar] [CrossRef]
  27. Henderson, N.D.; Christian, A.D. Freshwater invertebrate assemblage composition and water quality assessment of an urban coastal watershed in the context of land-use land-cover and reach-scale physical habitat. Ecologies 2022, 3, 376–394. [Google Scholar] [CrossRef]
  28. Stepenuck, K.F.; Crunkilton, R.L.; Wang, L. Impacts of urban landuse on macroinvertebrate communities in southeastern Wisconsin streams. J. Am. Water Res. Assoc. 2007, 38, 1041–1051. [Google Scholar] [CrossRef]
  29. Wang, B.; Liu, D.; Liu, S.; Zhang, Y.; Lu, D.; Wang, L. Impacts of urbanization on stream habitats and macroinvertebrate communities in the tributaries of Qiangtang River, China. Hydrobiologia 2012, 680, 39–51. [Google Scholar] [CrossRef]
  30. Huang, J.; Gergel, S.E. Effectiveness of landscape indicators for explaining the variability of benthic macro-invertebrates in urban streams. J. Environ. Manag. 2023, 342, 118130. [Google Scholar] [CrossRef]
  31. Blann, K.L.; Anderson, J.L.; Sands, G.R.; Vondracek, B. Effects of agricultural drainage on aquatic ecosystems: A review. Crit. Rev. Environ. Sci. Technol. 2009, 39, 909–1001. [Google Scholar] [CrossRef]
  32. Seaber, P.R.; Kapinos, F.P.; Knapp, G.L. Hydrologic Unit Maps; Water Supply Paper 2294; U.S. Department of the Interior, U.S. Geological Survey US Government Printing Office: Washington, DC, USA, 1987. [Google Scholar] [CrossRef]
  33. Dewitz, J. United States National Land Cover Database (NLCD) 2019 Products, v. 3.0.; U.S. Department of the Interior, U.S. Geological Survey: Washington, DC, USA, 2024. [Google Scholar] [CrossRef]
  34. Wickham, J.; Stehman, S.V.; Sorenson, D.G.; Gass, L.; Dewitz, J.A. Thematic accuracy assessment of the NLCD 2019 land cover for the conterminous United States. GISci. Remote Sens. 2023, 60, 2181143. [Google Scholar] [CrossRef]
  35. Valayamkunnath, P.; Barlage, M.; Chen, F.; Gochis, D.J.; Franz, K.J. Mapping of 30-meter resolution tile-drained croplands using a geospatial modeling approach. Sci. Data 2020, 7, 257. [Google Scholar] [CrossRef]
  36. Smith, M.P.; Schiff, R.; Olivero, A.; MacBroom, J. The Active River Area. In A Conservation Framework for Protecting Rivers and Streams; The Nature Conservancy: Boston, MA, USA, 2008; Eastern U.S. Freshwater Program 11 Avenue De Lafayette, 5th Floor; Available online: https://www.conservationgateway.org/Files/Pages/active-river-area-conserv.aspx (accessed on 1 June 2024).
  37. Stroud Water Research Center. Model My Watershed [Software], v.1.35.0. 2024. Available online: https://wikiwatershed.org/ (accessed on 1 June 2024).
  38. Pitt, R.; Voorhees, J. SLAMM, the source loading and management model. In Wet-Weather Flow in the Urban Watershed; CRC Press: Boca Raton, FL, USA, 2002; pp. 103–139. [Google Scholar] [CrossRef]
  39. United States Soil Conservation Service. Urban Hydrology for Small Watersheds; Tech. Rep. No. 55 (TR-55); United States Soil Conservation Service: Washington, DC, USA, 1986. Available online: https://www.nrc.gov/docs/ML1421/ML14219A437.pdf (accessed on 1 June 2024).
  40. United States Environmental Protection Agency. Spreadsheet Tool for the Estimation of Pollutant Load (STEPL); Tetra Tech, Inc.: Fairfax, VA, USA, 2001. Available online: https://19january2021snapshot.epa.gov/nps/spreadsheet-tool-estimating-pollutant-loads-stepl (accessed on 1 June 2024).
  41. Ohio Environmental Protection Agency. Methods for Assessing Habitat in Flowing Waters: Using the Qualitative Habitat Evaluation Index (QHEI); Division of Surface Water, Ecological Assessment Section: Columbus, OH, USA, 2006. Available online: https://dam.assets.ohio.gov/image/upload/epa.ohio.gov/Portals/35/documents/QHEIManualJune2006.pdf (accessed on 1 June 2024).
  42. Barbour, M.T. Rapid Bioassessment Protocols for Use in Wadable Streams and Rivers. In Periphyton, Benthic Macroinvertebrates and Fish; US Environmental Protection Agency, Office of Water: Washington, DC, USA, 1999. Available online: https://www3.epa.gov/region1/npdes/merrimackstation/pdfs/ar/AR-1164.pdf (accessed on 1 June 2024).
  43. Shannon, C.E. A mathematical theory of communication. Bell Syst. Tech. J. 1948, 27, 379–423. [Google Scholar] [CrossRef]
  44. Ohio Environmental Protection Agency. Field Methods for Evaluating Primary Headwater Streams in Ohio, Version 4.1; Ohio EPA Division of Surface Water: Columbus, OH, USA, 2020. Available online: https://dam.assets.ohio.gov/image/upload/epa.ohio.gov/Portals/35/wqs/headwaters/PHWHManual_2020_Ver_4_1_May_2020_Final.pdf (accessed on 1 June 2024).
  45. Sterling, J.L.; Rosemond, A.D.; Wenger, S.J. Watershed urbanization affects macroinvertebrate community structure and reduces biomass through similar pathways in Piedmont streams, Georgia, USA. Freshw. Sci. 2016, 35, 676–688. [Google Scholar] [CrossRef]
  46. Weigel, B.M.; Lyons, J.; Paine, L.K.; Dodson, S.I.; Undersander, D.J. Using stream macroinvertebrates to compare riparian land use practices on cattle farms in southwestern Wisconsin. J. Freshw. Ecol. 2000, 15, 93–106. [Google Scholar] [CrossRef]
  47. Wang, L.; Kanehl, P. Influences of watershed urbanization and instream habitat on macroinvertebrates in cold water streams. J. Am. Water Res. Assoc. 2003, 39, 1181–1196. [Google Scholar] [CrossRef]
Figure 1. Stream sampling locations, impervious cover, and estimated subsurface tile drainage in central Ohio, USA. Impervious cover was estimated from the 2019 USGS National Land Cover Database [34], and data from Valayamkunnath et al. were used to estimate the area of subsurface tile drainage [35].
Water 17 00895 g001
Figure 2. Sampling scheme for spatial and field data in each HUC12 watershed and its Active River Area (ARA; [36]), and 1 km2 zone centered on stream sampling location.
Water 17 00895 g002
Figure 3. Stream macroinvertebrate taxa and HMFEI (mean ± SE) compared with respect to percentage of undeveloped land at (A) HUC12 watershed scale, (B) Active River Area (ARA) scale, and (C) 1 km2 scale, and (D) with respect to tercile index of instream habitat metrics. Lowercase letters indicate significant differences among taxa in each group, and capital letters indicate significant differences among HMFEIs; α = 0.05.
Water 17 00895 g003
Figure 4. Linear regression of stream macroinvertebrate taxa and HMFEI (mean ± SE) with (A) mean ± SE HUC12 watershed percentage of subsurface tile-drained land; (B) Active River Area (ARA) percentage of subsurface tile-drained land; (C) HUC12 watershed percentage of impervious cover; and (D) ARA percentage of impervious cover. Impervious cover is estimated from 2019 USGS National Land Cover Database [34], and data from Valayamkunnath et al. [35] are used to estimate area of subsurface tile drainage.
Water 17 00895 g004
Figure 5. Multiple linear regression of actual vs. model-predicted macroinvertebrate taxa (A) and HMFEI (B) using HUC12 percentage of development and stream sinuosity as predictors.
Water 17 00895 g005
Table 1. Descriptive statistics (mean ± SE) of 71 HUC12 watersheds in central Ohio and their Active River Area (ARA), compared with the 30 watersheds and associated ARA sampled for this study. Impervious cover was estimated from the 2019 USGS National Land Cover Database [34], and data from Valayamkunnath et al. [35] were used to estimate the area of subsurface tile drainage.
HUC12 WatershedActive River Area (ARA)
Area (km2)Imperv%Tiled%Area (km2)Imperv%Tiled%
Developed
Total (27)79 ± 5.761 ± 4.611 ± 2.521 ± 2.69.1 ± 1.01.8 ± 0.5
Sampled (10)82 ± 9.164 ± 9.05.7 ± 3.037 ± 4.757 ± 9.13.2 ± 1.2
Agriculture
Total (20)86 ± 8.48.6 ± 1.455 ± 1.523 ± 4.13.2 ± 1.212 ± 1.4
Sampled (10)76 ± 9.615 ± 6.330 ± 1.837 ± 5.117 ± 5.718 ± 3.1
Less Developed
Total (24)79 ± 5.28.3 ± 0.56.6 ± 1.019 ± 1.81.8 ± 0.21.4 ± 0.2
Sampled (10)71 ± 6.912 ± 1.811 ± 2.626 ± 4.017 ± 3.57.1 ± 1.2
Table 2. Taxonomic classification of aquatic macroinvertebrates collected in low-order streams of central Ohio, USA, in June and July 2024 by the authors of this study. Abundance indicates the total number of each taxon collected, and Locations indicates the number of sites in which each taxon was collected out of a possible 33 stream reaches.
PhylumClassOrderFamilyAbundanceLocations
AnnelidaClitellataRhynchobdellidaGlossiphoniidae18722
ClitellataOther 43
ArthropodaArachnidaAraneaePisauridae21
InsectaColeopteraDryopidae106
Dytiscidae44
Elmidae7424
Gyrinidae284
Haliplidae43
Hydrophilidae11
Psephenidae24117
Ptilodactylidae11
DipteraAthericidae11
Ceratopogonidae11
Chironomidae5920
Ephydridae11
Limoniidae22
Simuliidae25721
Tipulidae2411
EphemeropteraAmeletidae113
Baetidae21326
Caenidae11
Ephemerellidae176
Heptageniidae27926
Leptophlebiidae106
Potamanthidae11
Siphlonuridae33
HemipteraGerridae178
Veliidae126
MegalopteraCorydalidae22
OdonataAeshnidae66
Calopterygidae32
Coenagrionidae106
PlecopteraCapniidae11
Chloroperlidae337
Leuctridae31
Nemouridae105
Peltoperlidae11
Perlidae277
Perlodidae155
Taeniopterygidae22
TrichopteraApataniidae11
Brachycentridae328
Dipseudopsidae196
Glossosomatidae272
Helicopsychidae22612
Hydropsychidae81432
Hydroptilidae135
Lepidostoma41
Leptoceridae32
Limnephilidae334
Philopotamidae27527
Polycentropodidae184
Psychomyiidae94
Rhyacophilidae235
Thremmatidae21
other9723
MalacostracaAmphipodaGammaridae75
DecapodaCambaridae9343
MolluscaBivalviaUnionidaUnionidae4313
GastropodaArchitaenioglossaViviparidae32
BasommatophoraAncylidae164
Lymnaeidae154
Physidae17925
Planorbidae3214
CaenogastropodaPleuroceridae151
GyraulusPlanorbidae21
HeterostrophaValvatidae11
LittorinimorphaAmnicolidae21
Hydrobiidae22
NeotaenioglossaPleuroceridae33415
334Pleurocera21
SorbeoconchaArionidae43
Stylommatophora 71
Other 264
Table 3. Correlation (Pearson’s r) of stream macroinvertebrate community metrics with HUC12 watershed characteristics and reach-level instream habitat characteristics. Bold values indicate significance at the 0.05 ** and 0.1 * levels.
Macroinvertebrate Community Metrics
Total IndividualsTotal TaxaShannon DiversityHMFEI ScoreEPT Taxa
HUC12 Level
% Developed−0.40 **−0.54 **−0.37 **−0.57 **−0.50 **
% Agriculture0.56 **0.41 **0.200.380.25
% Undeveloped−0.060.45 **0.42 **0.57 **0.63 **
Hydrologic Load−0.13−0.51 **−0.39 **−0.60 **−0.60 **
Nitrogen Load0.25−0.28−0.26−0.40 **−0.47 **
Phosphorus Load0.36 **−0.20−0.22−0.34 **−0.42 **
Sediment Load−0.20−0.29 *−0.21−0.28 *−0.26
Reach Level
QHEI Score−0.050.150.35 **0.230.22
Habitat Score0.090.280.35 **0.30 *0.28
Sinuosity0.020.37 **0.32 *0.42 **0.43 **
Canopy Cover−0.010.190.230.230.26
Substrate Score−0.02−0.09−0.10−0.08−0.13
% Riffle−0.24−0.12−0.01−0.050.05
Periphyton Cover0.43 **0.150.080.150.04
Disclaimer/Publisher’s Note: The statements, opinions and data contained in all publications are solely those of the individual author(s) and contributor(s) and not of MDPI and/or the editor(s). MDPI and/or the editor(s) disclaim responsibility for any injury to people or property resulting from any ideas, methods, instructions or products referred to in the content.

