Article

A Comparison of the AHP and BWM Models for the Flash Flood Susceptibility Assessment: A Case Study of the Ibar River Basin in Montenegro

by
Filip Vujović
1,
Aleksandar Valjarević
2,
Uroš Durlević
2,
Cezar Morar
3,
Vasile Grama
3,*,
Velibor Spalević
4,
Miško Milanović
2,
Dejan Filipović
2,
Golub Ćulafić
5,
Milan Gazdić
2,
Natalija Batoćanin
2,
Goran Barović
6,
Jelena Golijanin
7,
Dragan Radovanović
8,
Nikola Bačević
8 and
Ante Šiljeg
9
1
Environmental Protection Agency of Montenegro, IV Proleterske 19, 81000 Podgorica, Montenegro
2
Faculty of Geography, University of Belgrade, Studentski Trg 3/III, 11000 Belgrade, Serbia
3
Department of Geography, Tourism and Territorial Planning, University of Oradea, 410087 Oradea, Romania
4
Biotechnical Faculty, University of Montenegro, 81000 Podgorica, Montenegro
5
Institute of Hydrometeorology and Seismology, 81000 Podgorica, Montenegro
6
Department of Geography, Faculty of Philosophy, University of Montenegro, Danila Bojovića bb, 81400 Nikšić, Montenegro
7
Department of Geography, Faculty of Philosophy, University of East Sarajevo, Vuka Karadzica 30, 71126 Istočno Sarajevo, Bosnia and Herzegovina
8
Faculty of Sciences, University in Priština-Kosovska Mitrovica, Lole Ribara 29, 38220 Kosovska Mitrovica, Serbia
9
Department of Geography, University of Zadar, Trg kneza Višeslava 9, 23000 Zadar, Croatia
*
Author to whom correspondence should be addressed.
Water 2025, 17(6), 844; https://doi.org/10.3390/w17060844
Submission received: 17 January 2025 / Revised: 11 March 2025 / Accepted: 12 March 2025 / Published: 14 March 2025

Abstract

:
Assessing flash flood susceptibility is crucial for disaster management, yet Montenegro lacks research using geoinformation technologies. In northeastern Montenegro, the Ibar River Basin, mainly in Rožaje, has a well-developed hydrological network with torrential streams prone to flash flooding. This study compares two multi-criteria GIS decision analysis (GIS–MCDA) methodologies, the Analytic Hierarchy Process (AHP) and the Best-Worst Method (BWM), for assessing flood susceptibility. The analysis uses the Flash Flood Susceptibility Index (FFSI), integrating geoenvironmental and climatic factors. The geoenvironmental criteria considered include terrain slope, distance from the drainage network, geology, land cover, drainage density, bare soil index, and the BIO16 variable, which represents the mean monthly precipitation of the wettest quarter to enhance precipitation pattern assessment. The AHP model classifies 2.78% of the area as high to very high susceptibility, while the BWM model identifies 3.21% in these categories. Both models perform excellently based on AUC values, with minor, non-significant differences. Sensitivity analysis shows AHP provides a more stable weight distribution, whereas BWM is more sensitive to weight changes, emphasizing dominant criteria more strongly. This study introduces BWM for the first time in flash flood modeling, demonstrating its suitability for susceptibility assessment. The key novelty lies in its comparative analysis with AHP, highlighting differences in weight distribution and model stability.

1. Introduction

According to van Loenhout et al. [1] the international disasters database (EM-DAT) documented 7348 disaster occurrences globally between 2000 and 2019. Out of these events, floods accounted for 3254 cases, which corresponds to 44%. Additionally, the authors highlight that the economic losses during this period were estimated at 651 billion, and approximately 1.65 billion people were affected by floods.
Generally, there are two main types of floods: river floods and flash floods [2]. The occurrence of a flash flood arises from intricate interactions within the geoenvironment, particularly involving hydrological and atmospheric systems. By definition, a flash flood is characterized as rapid and sudden flooding caused by intense rainfall occurring within a very short period [3]. Due to climate change and other geoenvironmental factors such as topography, geology, land cover, and human activities, flash floods have become one of the most prevalent natural disaster occurrences worldwide [4].
In Montenegro, flash floods occur due to brief but highly intense precipitation events, compounded by other geoenvironmental factors, leading to localized rainfall amounts of up to 100 mm over a short period. This heavy precipitation generates rapid water flows and urban flooding, creating serious challenges for local communities and infrastructure. Additionally, cyclonic activities, especially those associated with the Genoa Cyclone or cyclones in the Adriatic and Tyrrhenian Seas, can bring heavy rain lasting several days, significantly straining the hydrological system. Such situations can result in extreme floods that further threaten areas in the southeastern sector of the cyclonic depression, including Montenegro [5].
As reported by Landau [6] in Montenegro’s Third National Communication on Climate Change, the regional NMMB48 model under the GHG RCP 8.5 scenario projects an increase in the frequency of days with daily rainfall exceeding 20 mm in the far northern and northeastern parts of Montenegro over the periods 2011–2040, 2041–2070, and 2071–2100. Conversely, other regions are expected to experience a decline in extreme precipitation events. This report underscores the role of climate change in altering hydrological patterns across Montenegro and provides a basis for future climate adaptation policies [6]. In the northeastern municipality of Rožaje, the hydrographic network of the Ibar River is quite developed. All tributaries are torrential streams, characterized by rapid concentration and short duration of flood waves. In this context, assessing the risk of flash floods can help reduce the economic and socio-economic damage caused by floods. Therefore, it is crucial to adopt strategies to mitigate flood risk, including defining high-risk areas [5].
When analyzing flash flood risk, it can be viewed through the components of the risk equation: hazard, vulnerability, susceptibility, and capacity [7]. However, compared to other types of risks, flood risk assessment faces a significant disparity in maturity across its elements. While susceptibility and hazard modeling are well-developed, characterization of exposure and vulnerability analysis remain relatively underdeveloped. In numerous cases documented in the scientific and professional literature, when dealing with extensive geospatial coverage at medium and low resolution, implementing comprehensive risk assessment procedures at macro- and mesoscales becomes challenging. Instead, satisfactory results are often achieved by assessing flood susceptibility. This susceptibility refers to the likelihood of flash flooding in a particular area, based on key geoenvironmental terrain characteristics [8]. The probability of flash floods depends on meteorological parameters and can be assessed using a combination of hydrological models, flood time series, and statistical methods. Modern approaches, integrate empirical data and computational simulations to more accurately predict flood risk. These models aid in infrastructure planning, early warning systems, and risk reduction, enabling better adaptation to climate change [9].
In this context, geoinformation technologies, which enable modeling, are employed. A crucial aspect of susceptibility modeling involves identifying historical flash flood locations, which allow for testing and validating models, and creating a geospatial database for these purposes [10]. A frequently used approach for hazard and susceptibility modeling worldwide is Geographic Information System–Multi-Criteria Decision Analysis (GIS–MCDA), which utilizes various methods such as Analytic Hierarchy Process (AHP) [11,12,13,14,15,16,17,18], Fuzzy Analytic Hierarchy Process (F-AHP) [19,20], and Decision-making Trial and Evaluation Laboratory (DEMATEL) [21]. In addition, methods such as Frequency Ratio (FR), Logistic Regression (LR), and Weight of Evidence (FL) are used in the studies [22,23]. Recent studies also utilize machine learning methods for susceptibility modeling [24,25,26,27,28,29,30].
According to Đurlević et al. [31], the Best-Worst Method (BWM) is a modern GIS–MCDA approach that has gained widespread recognition in fields such as natural hazard assessment, geotourism, and environmental management. This method involves identifying the most and least significant criteria within a given set and performing pairwise comparisons to establish their relative importance. By reducing cognitive effort and enhancing consistency, BWM provides a structured framework for complex decision-making processes. Its efficiency and robustness have been demonstrated in various applications, including the prioritization of risk mitigation strategies, the evaluation of sustainable tourism sites, and the development of environmental conservation plans.
Currently, Montenegro lacks research focusing on the examination of flash floods using geoinformation technologies. Previous studies primarily aimed to estimate erosion intensity using the Soil Erosion Potential Method, which was integrated into the IntErO software 1.0 version and subsequently into the web-based version of WIntEro [32,33]. This underscores the limited use of modern geoinformation tools for comprehensive investigation and mitigation of the impacts of flash floods within the state. However, it highlights the importance of integrating hydrological modeling, statistical approaches, and meteorological parameters for improved flood risk prediction, particularly in the context of river floods. The incorporation of such advanced methodologies in Montenegro could significantly enhance flood forecasting and risk mitigation efforts, addressing the current gap in the application of modern geoinformation tools for flood hazard assessment [34].
The study aims to pioneer a model for assessing the susceptibility to flash floods in the Ibar River basin in Montenegro, with the intent to establish conditions for its application across the entire northern and northeastern region, as well as in similar geographic areas. The process of building the model involves integrating the causal criteria of the geoenvironment through Geographic Information System–Multi-Criteria Decision Analysis (GIS–MCDA) methods, alongside the Analytical Hierarchy Process (AHP) and the Best-Worst Method (BWM) within the framework of geoinformatics.
An important advancement in this study compared to previous research is the application of the Best-Worst Method (BWM) for assessing susceptibility to flash floods, which has not been employed in this context before. While BWM has been previously used for flood susceptibility mapping, such as in the study by Özay and Orhan [35] focused on riverine floods in Mersin, Turkey, its utilization for flash flood scenarios represents a novel approach. In this study, BWM is tested alongside the widely used GIS–MCDA method, AHP, to evaluate its effectiveness. The integration of these methodologies within geoinformatics aims to enhance the accuracy and reliability of susceptibility modeling, contributing to more robust risk management strategies.

2. Materials and Methods

2.1. Study Area

In Montenegro, several major watercourses are formed, flowing in two directions: towards the Danube River basin and the Adriatic Sea basin. The Danube River basin covers approximately 7260 km2, accounting for 52.5% of Montenegrin territory. The Ibar River originates in this area, flowing along the path of the Western Morava, while the Tara, Piva, Lim, and Ćehotina rivers flow into the Drina. The Ibar River begins in northeastern Montenegro at Mount Hajla and then travels through southwestern Serbia and the northern part of Kosovo, before finally joining the West Morava River near Kraljevo in central Serbia. The Ibar drainage basin covers 8059 km2, with 413 km2 situated within Montenegro’s territory (Figure 1). Nearly the entire basin in Montenegro is found within the municipality of Rožaje, home to 23,161 inhabitants [36]. The majority of the population is concentrated in the lower reaches and valley areas of the watershed, where settlements and infrastructure are more vulnerable to flash flooding. In the study area, there are no man-made or natural drainage basins, lakes, or reservoirs, which would otherwise help regulate water flow and reduce flash flood intensity.
The altitude ranges from 784 m a.s.l. in the area of Draga up to 2382 m a.s.l. at the summit of Mount Rusolija. The terrain is marked by numerous karst landforms, both on the surface and underground. This area lies within the Inner Dinarides and is part of the “Durmitor” tectonic zone [37]. The geological map of Montenegro (scale 1:200,000) indicates that the area is predominantly composed of Mesozoic limestones and dolomites (T, K). Other geological features include diabase-hornblende formations (J2 + 3), Neogene deposits of clay, marl, sand, and coal, as well as glacial and glacial-fluvial deposits [38].
According to the Köppen climate classification, the region experiences a cold temperate D climate [39]. This climate is characterized by cold winters and mild summers, with an average annual air temperature of 6.3 °C and annual precipitation of 920 mm.
The hydrological station in Rožaje monitors a drainage area of approximately 98 km2 along the Ibar River. The minimum flow rate on the Ibar at Rožaje is 0.100 m3/s, while the maximum reaches 72.0 m3/s. The ratio of maximum to minimum flow during the year on the Ibar is 441, with a peak flow ratio of 720, indicating its highly torrential nature [5,36].
The hydrographic network of the Ibar River is quite extensive. All its tributaries are torrential streams, characterized by rapid concentration and short-duration flood waves that they generate. Due to frequent channel changes, the Ibar River poses flood risks to the city center and certain parts of the municipality of Rožaje. Besides the Ibar itself, significant damage is caused by torrential tributaries such as Županica, Ibarac, Lovnička River, and Crnja. The most pronounced impacts are observed in industrial facilities, on road networks, and agricultural land. According to data from the National Protection and Rescue Service of Montenegro, major flash floods in the municipality of Rožaje were recorded in 1979 and 2010. Before 2010, there are little to no data available, or it is only at the level of information about the events themselves. Based on media reports, floods on the Ibar River have been documented after 2010 in the years 2013, 2016, 2018, and 2019 [5].
The Ibar River Basin is heavily covered by forests, with 70% of the area consisting of dense woodland and diverse vegetation, making it the dominant land cover in the region. These forests play a crucial role in biodiversity conservation, carbon sequestration, and providing habitats for various species. Additionally, they help mitigate flash floods and erosion by absorbing excess water and maintaining the hydrological balance of the basin [40].

2.2. GIS–MCDA Methodology Approach

Combining Geographic Information Systems with Multi-Criteria Decision Analysis (GIS–MCDA) is a pivotal method for synthesizing and leveraging geospatial data to generate valuable insights for decision-making. This approach involves systematically comparing and evaluating the impact of various criteria to assess the appropriateness or susceptibility of specific areas to certain phenomena or processes [41].
The GIS–MCDA procedure implemented in this study consists of seven steps (Figure 2): setting the goal of the multi-criteria analysis or problem; determination of causal criteria; standardizing the values of these causal criteria; assigning weights to the causal criteria; combining the standardized values and weighted causal criteria to analyze the results (Flash Flood Susceptibility Index); and sensitivity analysis and validating the outcomes [42,43].

2.2.1. Setting the Goal of the Multi-Criteria Analysis or Problem

In GIS–MCDA, the foundation lies in establishing a goal that adheres to the SMART principle. This principle emphasizes that the goal must be specific, measurable, achievable, relevant, and time-bound (SMART) [43]. Flash floods pose the highest susceptibility among various flood types, as they merge the devastating force of a flood with remarkable velocity, leading to intense erosion, high sediment transport, and strong hydraulic forces that shape the flood impact. The water velocities play a crucial role in determining the destructive potential, influencing both infrastructure damage and landscape alteration. In this context, it is crucial to develop models that contribute to better preventive protection. Accordingly, this GIS–MCDA analysis aims to create a flash flood susceptibility model.

2.2.2. Determination of Causal Criteria

In order to apply the GIS–MCDA method, it was crucial to identify causal criteria that were pertinent and essential to the analysis. Causal criteria were determined through a blend of the area’s features, a thorough examination of the pertinent literature [11,12,13,14,15,16,17,18,19,20], and insights provided by experts. The following causal criteria were used for analysis: (C1) terrain slope, (C2) distance from drainage network, (C3) geology, (C4) land cover, (C5) drainage density, (C6) bare soil index, and (BIO16) annual precipitation of the wettest quarter. The criteria were established using open geospatial data and then transformed into a grid with a resolution of 25 m. This grid was subsequently projected onto the Mercator Universal Transverse Projection (UTM 34N) coordinate system, based on the WGS 84 rotating ellipsoid (EPSG: 32634). For a comprehensive list of causal criteria, data sources, resolutions, and formats employed, refer to Table 1.
The Slope tool was used to derive terrain slope from the EU-DEM v1.1 model, which features a moderate resolution with a geospatial resolution of 25 m. The revised edition (EU-DEM v1.1) has an estimated root mean square error (RMSE) for standard vertical precision of approximately 7 m.
The river network was derived from EU-DEM (25 m) using hydrological analysis tools in QGIS 3.28.3 and the Terrain Analysis—Channels module within the SAGA GIS package. Subsequently, a buffer analysis was performed to calculate the distance from the drainage network, involving the creation of buffer zones around the river network at specific intervals and analyzing the proximity of various points to these zones.
The geology criterion was obtained by digitizing the basic geological map of the former SFRY at a scale of 1:100,000. Following digitization, the geological units were converted into a raster layer for further analysis.
For the purposes of this study, the ESRI Land Use–Land Cover dataset was used. This global dataset has a 10 m resolution and was developed by ESRI based on Sentinel-2 surface reflection data in six bands. The dataset is constructed using a deep learning model and has an overall accuracy of 85%.
Similar to the distance from drainage network criterion, the EU-DEM (25 m) river network model was used to determine river network density. This was calculated using the Line Density tool, which measures the concentration of river segments within a given area. The process involved analyzing the total stream length per unit area, providing insights into the drainage characteristics of the study region and its potential influence on flash flood susceptibility.
The bare soil index (BSI) was calculated using Sentinel-2 satellite imagery acquired on 4 August 2023. The index was derived by processing spectral reflectance values from the blue, red, near-infrared (NIR), and short-wave infrared (SWIR) bands. The SWIR and red bands were used to assess soil mineral content and dryness, while the blue and NIR bands helped identify vegetation presence. The processing was conducted in QGIS and SAGA GIS, where the spectral bands were normalized and combined to generate the final BSI values. Higher values indicate bare soil exposure, while lower values correspond to vegetation or water-covered surfaces.
The BIO16 variable, derived from the CHELSA model, represents the annual precipitation of the wettest quarter and serves as an important indicator of seasonal rainfall distribution. Spline interpolation was applied to adjust the spatial resolution of the data to 25 m.
To assess potential multicollinearity among the selected criteria, a Variance Inflation Factor (VIF) analysis was conducted, ensuring that the included variables are not highly correlated and can independently contribute to the analysis.

2.2.3. Standardization of Values for Causal Criteria

The standardization of criteria values was performed using an evaluation framework that assigned a numerical scale ranging from 1 (very low susceptibility) to 5 (very high susceptibility). The classification ranges for each criterion were determined through an integrative approach that considered the specific characteristics of the study area, expert evaluations, and a systematic review of the relevant literature [11,12,13,14,15,16,17,18,19,20].

2.2.4. Assigning Weights to Causal Criteria

Weighting coefficients for the criteria concerning the significance of flash flood susceptibility are determined through the application of the Analytic Hierarchy Process (AHP) and Best-Worst Method (BWM). Similarly, akin to the process of defining criteria and standardizing values, a comparative matrix was established based on the characteristics of the study area, expert opinions, and a review of the relevant literature [11,12,13,14,15,16,17,18,19,20].

AHP

Different techniques are employed to ascertain the weighting coefficients, with Saaty’s Analytical Hierarchy Process (AHP) being the most prevalent. AHP breaks down the intricate facets of GIS–MCDA into smaller elements and organizes them in a hierarchical structure. These elements represent key flood susceptibility criteria, evaluated through a pairwise comparison matrix to determine their relative importance in flash flood modeling. By systematically assessing these factors, the method generates a hierarchical ranking of priority criteria, ensuring that the most influential parameters—such as terrain slope, drainage density, and land use—are appropriately weighted in the flash flood susceptibility assessment. A numerical range of 1–9 is selected for comparing the criteria, indicating the frequency with which one criterion is more significant or dominant compared to another criterion [44,45] (Table 2).
The consistency of the steam matrix was checked according to the formulas [44]:
CI = λ max n n 1
CR = CI RI
where CR represents the Consistency Ratio, while CI stands for Consistency Index. The Random Index (RI) is determined based on the number of criteria, as shown in Table 3. λmax is the largest value obtained from the average division of the sum of weights, and ’n’ represents the number of criteria. The Random Consistency Index varies according to the number of criteria in the matrix. If the consistency coefficient is equal to or less than 0.1, the inconsistency is deemed acceptable. However, if it exceeds 0.1, it indicates poor consistency, requiring a revision for improvement [44,45].

BWM

Although the AHP method is commonly used to evaluate the most suitable locations, BWM offers several advantages. It provides more reliable results due to a higher consistency percentage, requires fewer pairwise comparisons (2n − 3 comparisons compared to n (n − 1)/2 in AHP), and, unlike other multi-criteria analysis models that use fractional numbers, BWM exclusively uses integers, making it a more efficient and consistent approach [46].
BWM represents one of the more efficient methods that offers the possibility of checking the consistency of given pairwise comparisons. A linear BWM model was used in this study. The procedure for obtaining weight coefficients using BWM can be explained in the following steps [47,48]:
Step 1. Based on existing studies and the literature, decision makers determine a set of relevant criteria {c_1,c_2,c_3,...,c_n}. The criteria are selected from the best to the worst.
Step 2. According to the opinion of experts and their preferences, the best (most significant) criterion and the worst (least significant) criterion are identified.
Step 3. Decision makers compare the best criterion with all other criteria using a scale between 1 and 9 (number 1 represents equal importance, whereas number 9 means that the best criterion is rated ‘extremely more important’ than other criteria). This results in the following Best-to-Others vector:
  A B = ( a B 1 , a B 2 , . . . a B n )
where aBj stands for to what extent the best criterion B is more preferred to criterion j. Therefore, it is evident that aBB = 1.
Step 4. Experts assign values between 1 and 9 to compare all other criteria with the worst criterion (1: j is equally important to worst; 9: j is extremely more important than worst). The resulting Others-to-Worst vector would be:
A W = ( a 1 W , a 2 W , . . . a n W ) T
where the preference of criterion j over the worst criterion is expressed as ajW, while aWW = 1.
Step 5. The calculation of optimal weights of various criteria is approached. By minimizing the maximum value of the set of {|w_B − a_Bj w_j|,|w_j − a_jW w_W|} for all j, the problem can be translated into the following as highlighted by [47]:
min w max j w B a Bj w j , w j a jw w w
subject   to   j = 1 n w j = 1 ,   w j 0 ,   for all j
This problem can be written as a linear programming model, as it is showed below: min ξ, such that
w B a B j w j ξ ,   for all j
w j a j W w W ξ ,   for all j
j = 1 n w j = 1
w j 0 ,   for all j .
The consistency ratio (CR) and associated threshold are calculated by making use of the following formulas for input-based BWM [47,48]:
CR = max   C R j
where
C R j = a B j × a j W a B W a B W × a B W a B W , a B W > 1 , 0 , a B W = 1 .

2.2.5. Flash Flood Susceptibility Index (FFSI)

To enhance the model’s ability to account for precipitation patterns, the BIO16 variable, derived from the CHELSA model [49], which represents the mean monthly precipitation amount of the wettest quarter, was incorporated into the analysis. The modeling outcomes were generated using the AHP and BWM methods through a weighted linear combination approach at a resolution of 25 m. Using the equation below, standardized values and weighting coefficients were integrated, and the analysis was conducted in a raster calculator to obtain the Flash Flood Susceptibility Index (FFSI) as follows:
FFSI = 0.7 ( w i × x i ) + 0.3 × B I O 16
The equation integrates multiple components to comprehensively assess flood susceptibility. It consists of a weighted sum of standardized criteria, incorporating the previously mentioned causal geoecological criteria, along with the BIO16 variable. The weight coefficients (Wi), determined using AHP and BWM methods, ensure a systematic and balanced evaluation of criteria importance, distributing the total weight between the standardized criteria and precipitation data. Each criterion is represented by its standardized value (Xi), ensuring comparability across different units and scales, with its corresponding weight (Wi) reflecting its relative influence on flood susceptibility. The BIO16 is assigned a weighting factor of 0.3, while the remaining 0.7 is allocated to the other causal geoecological criteria. The final five susceptibility categories—very low, low, moderate, high, and very high—were classified using the Natural Breaks (Jenks) method based on the FFSI.

2.2.6. Sensitivity

Sensitivity analysis was applied to assess the impact of changes in the weighting of decision-making criteria on the ranking of alternatives. In the first step, the most critical alternative was identified, i.e., the alternative for which the smallest change in value d M I N resulted in a change in ranking. This value was calculated using the following equations [50]:
Δ M I N = P i m i n [ P i P i + 1 , P i P i 1 ] d M I N = Δ M I N 100 P i
where Δ M I N represents the smallest difference between the priority of an alternative and the priority of the closest-ranked alternative, while P i denotes the priority of the alternative at rank i . Subsequently, the priority of the most critical alternative was modified by a factor β (with values of 10%, 20%, 30%, and 40 and 50%), while the priorities of the remaining alternatives were adjusted to ensure that the total sum of priorities remained equal to one. The new priorities were determined using the following formulas [50]:
For non-critical alternatives:
P i = P i 1 α
For the critical alternative:
P i = P i α 1 α P C R
where α represents the change in the current priority of the critical alternative PCR (i.e., β ·PCR), while ensuring that the condition ΣP’(i) = 1 remains valid.

2.2.7. Validation

According to data from the study by Ivanović et al. [5], historical flash flood records, documenting the flooded areas and the buildings, impacted. This information serves as a basis for validating the overall GIS–MCDA model used in this research. For validation purposes, the receiver operating characteristic (ROC) curve in LibreOffice Calc was employed as a validation technique. This curve is widely used in geospatial modeling to assess model performance. The ROC curve graphically represents the false positive rate against the true positive rate for all threshold values that generate the modeling results. It displays specificity on the x-axis and sensitivity on the y-axis. Moreover, the area under the curve (AUC) is automatically calculated within the ROC framework. The AUC values provide a measure of the model’s predictive success and accuracy in comparison to reference data. The classification ranges are as follows: excellent (AUC = 0.9–1), good (AUC = 0.8–0.9), fair (AUC = 0.7–0.8), poor (AUC = 0.6–0.7), and failed models (AUC = 0.5–0.6) [51].

3. Results

The analysis of the criteria based on tolerance and VIF values indicates (Table 4) the absence of significant multicollinearity among the variables, as evidenced by high tolerance values (all above 0.85) and low VIF coefficients (all below 1.2). The lowest tolerance values are observed for terrain slope and annual precipitation of the wettest quarter, at 0.86 and 0.87, respectively, while the highest is recorded for the bare soil index at 0.98. VIF values remain below 1.2, with the bare soil index exhibiting the lowest risk of multicollinearity at 1.02, whereas terrain slope and annual precipitation of the wettest quarter have slightly higher but still acceptable values of 1.17 and 1.15. These results suggest that the included variables are not highly correlated and can be utilized in further analysis without significant concerns regarding distortion in regression estimates.
Standardization of the geoenvironmental causal criteria is presented in Table 5, where all criteria were uniformly scaled on a numerical range from 1 (indicating very low) to 5 (indicating very high) (Figure 3).
The weighting coefficients derived from the AHP approach are displayed in Table 6, while those obtained through the BWM approach are presented in Table 7. The consistency indices for both matrices in the AHP and BWM approaches were found to be acceptable.
According to the obtained results and the developed matrices, terrain slope was identified as the most critical geoenvironmental factor, exhibiting the highest weighting coefficient in the assessment of flash flood susceptibility. In contrast, the bare soil index was determined to be the least significant criterion, carrying the lowest weighting coefficient. The results indicate variations in the weighting coefficients derived from different methods, demonstrating a high degree of consistency in ranking causal factors. This consistency reinforces the robustness and reliability of the assigned weighting coefficients, enhancing confidence in their validity when evaluating the relative importance of each criterion within the study. According to both methodologies, the slope of the terrain holds the greatest significance. BWM places slightly more emphasis on terrain slope compared to AHP. After receiving heavy rainfall, mountain terrain contributes to surface runoff. This water accumulates in mountain streams and subsequently floods relatively flat areas (less than 5° gradient), comprising 8% of the total area. These low-lying areas are home to local communities and are crucial hubs for infrastructure such as roads and industries.
Distance from drainage network is one of the key factors influencing flash flood susceptibility, just after terrain slope in terms of weight coefficient. Areas located within 50 m of river courses, which make up 6% of the total area, are the most prone to flooding during flash flood events. Moving away from riverbeds reduces the susceptibility of flooding. Areas close to riverbeds face heightened susceptibility to flooding, especially during intense rainfall or rapid snowmelt. Although flood susceptibility diminishes with increasing distance from river channels, it remains noteworthy and varies based on the terrain and hydrological features of the area.
The geological compositions found in the Ibar Basin, such as sandstones, conglomerates, and fluvio-glacial sediments, directly influence flood dynamics. Sandstones and conglomerates, due to their permeability and coarse texture, swiftly transmit water, enhancing surface runoff during heavy rainfall and increasing water flow downstream. Fluvio-glacial sediments, composed of sands, gravels, and finer materials from glacier meltwater streams, are easily mobilized during intense rain, adding to sediment load and river channel flow. These formations exacerbate flood dynamics in the Ibar Basin by facilitating rapid water movement and sediment transport, consistent with previous research findings
When analyzing land cover, special attention is given to artificial surfaces, particularly in areas where flash floods cause significant human and material damage. Urban regions with impermeable surfaces hinder water from seeping into the ground. It is important to note that the entire basin is heavily forested, with 70% of the area covered by woods.
Based on the weight coefficients obtained from both matrices, the fifth causal criterion in importance is the density of the river network. Areas with a higher concentration of watercourses, and thus a greater total length of rivers and streams, are more prone to flash flooding. This increased density means that during intense rainfall, the watercourses are more likely to overflow quickly, leading to rapid and severe flooding of the surrounding surfaces. Therefore, regions with a dense river network are at a heightened susceptibility for flash floods.
Among all the criteria utilized, the bare soil index possesses the smallest weight coefficient. As previously mentioned, the current terrain features minimal bare soil, with forests predominantly covering the area.
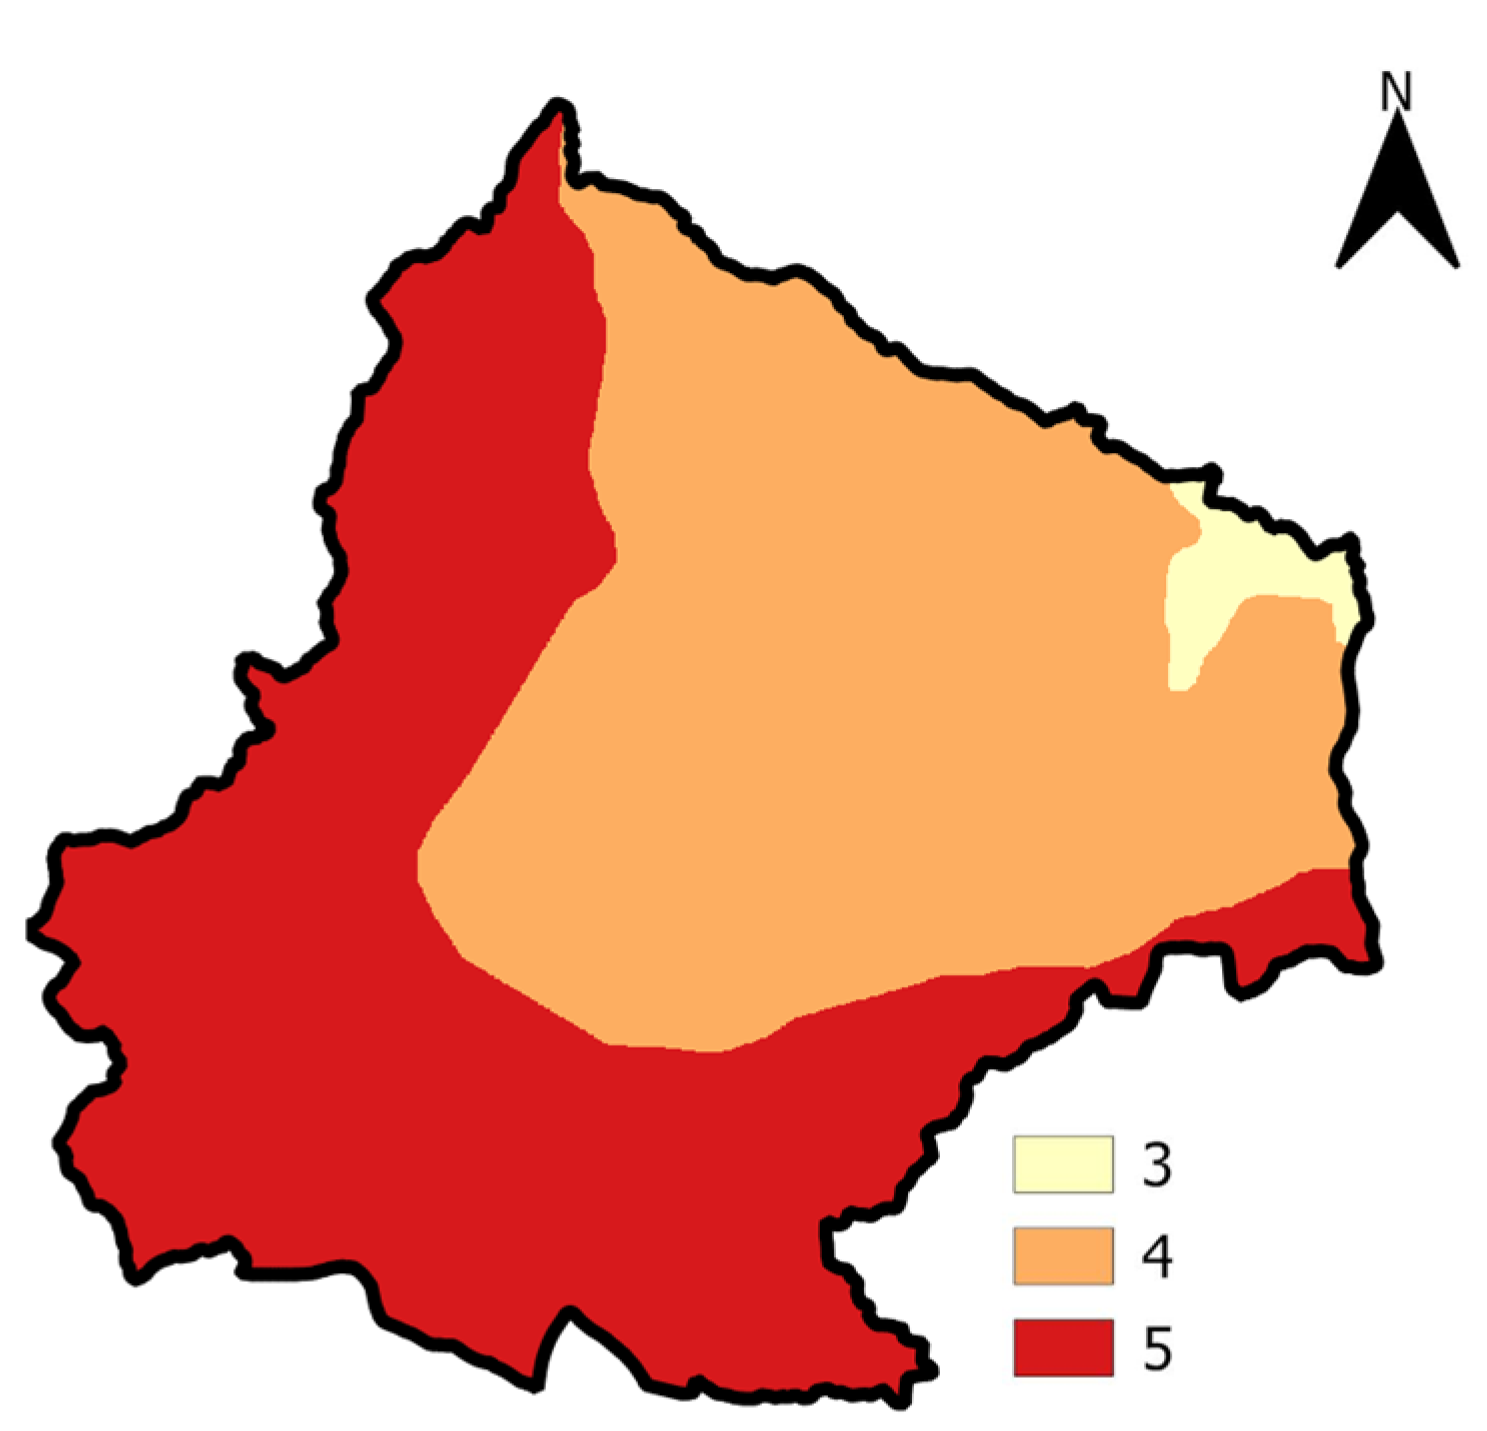
The BIO16 variable has been reclassified into numerical intervals ranging from three to five, as presented in Table 8. Additionally, the spatial distribution of the data is depicted in Figure 4.
The results from the AHP and BWM modeling procedures, used to calculate the FFSI, are presented in Table 9. Additionally, Figure 5 offers a complementary view of the geospatial distribution displayed on the overview maps. As per the AHP model’s findings, a substantial 2.78% of the total area demonstrates high to very high susceptibility. The distribution across other susceptibility categories is as follows: moderate (23.81%), low (67.94%), and very low (5.46%). According to the BWM model, 3.21% of the total area falls into the high and very high categories. The distribution for the other categories is as follows: moderate (27.45%), low (66.10%), and very low (3.25).
Periodic flash flood waves in the municipality of Rožaje are predominantly caused by the overflowing waters of the Ibar River. This flooding is most pronounced during the spring and autumn months—due to the combined effects of melting snow from the surrounding mountain ranges and heavy rainfall. The urban areas of Rožaje are particularly susceptable to severe flash flooding, especially in regions where the riverbed is not adequately managed or is constricted by various structures. These unmanaged or obstructed sections of the river exacerbate the overflow, leading to more significant flood events. In addition to the Ibar, several torrential watercourses within the municipality contribute to the flooding. Notable among these are the rivers Crnja, Županica, Ibarac, Lovnička Rijeka, and Grahovska Rijeka. These rivers flow through populated areas and are characterized by their steep, mountainous terrain. This topography makes them highly susceptible to rapid flooding, as heavy rainfall can quickly transform these rivers into torrents. The convergence of these watercourses with the Ibar River in urban areas further amplifies the susceptable of flash flooding, leading to significant damage to infrastructure, homes, and businesses.
The lack of detailed historical data on flash floods makes it difficult to thoroughly analyze the patterns and impacts. Model validation is critical for verifying the reliability and accuracy of any developed model. The key step in validation involves obtaining accurate data on historical flash floods from protection and rescue services, as well as satellite data on flash floods [52,53]. However, Montenegro does not possess a reliable and well-developed flash flood cadastre, which presents challenges for effective water management and planning. The data utilized in this study are derived from the study conducted by Ivanović et al. [5], which focuses on the preliminary assessment of flood risk for the Danube River Basin in Montenegro. This comprehensive study provides historical data on flash flood events that occurred in the Ibar River Basin. While this is a relatively small number, the locations are diverse, offering insight into various flood-prone areas. The ROC curve validation results for the AHP and BWM methodologies are illustrated in Figure 6. The AUC values obtained from the ROC curve reflect each model’s predictive accuracy, with higher AUC values indicating better performance. Based on the obtained AUC values, both models show excellent performance. Overall, the validation outcomes suggest that the AHP and BWM models are comparable in performance according to standardized criteria, with only minor non-significant differences in their AUC values.
The most critical criterion (Table 10) in the AHP method is drainage density (dMIN = 47.06%), followed by distance from drainage network (dMIN = 45.13%) and geology (dMIN = 42.14%). This suggests that these criteria are the most sensitive to weight variations and have the highest impact on model performance. In contrast, the BWM method identifies distance from drainage network as the most critical criterion (dMIN = 71.40%), followed by geology (dMIN = 50.03%). This indicates that the BWM model places greater emphasis on a smaller number of dominant criteria, which may lead to larger variations in ranking when weight coefficients change.
The weight coefficient adjustments in Table 11 for different beta values (10%, 20%, 30%, 40%, and 50%) further illustrate the differences between AHP and BWM. In the AHP model, terrain slope remains the dominant factor across all beta values, showing gradual changes from 33.10% (beta 10%) to 34.32% (beta 50%), while distance from drainage network and geology remain relatively stable. Drainage density, despite being the most critical criterion in terms of sensitivity, decreases from 7.66% to 4.27%, indicating that the AHP model maintains a more balanced redistribution of weights. In contrast, the BWM model exhibits more pronounced changes, with terrain slope increasing significantly from 38.93% (beta 10%) to 43.13% (beta 50%), while distance from drainage network decreases from 20.09% to 11.47%, highlighting a more aggressive redistribution of weight toward the most dominant criterion.
The ROC curve analysis in Figure 7 further supports these observations. The AHP model demonstrates higher stability, with AUC values decreasing only slightly from 0.941 (beta 10%) to 0.931 (beta 50%), indicating that variations in weight coefficients have minimal impact on overall model accuracy. The BWM model, however, exhibits a more pronounced decline in AUC values, from 0.938 (beta 10%) to 0.903 (beta 50%), suggesting greater sensitivity to weight changes and a potential reduction in model reliability as beta increases.

4. Discussion

To determine the relative importance of different factors in assessing flash flood susceptibility, six geoenvironmental causal criteria—terrain slope, distance from the drainage network, geology, land cover, drainage density, and bare soil index—were analyzed using both the AHP and BWM methods. Additionally, to enhance the model’s ability to account for precipitation patterns, the BIO16 variable, which represents the mean monthly precipitation amount of the wettest quarter, was incorporated into the analysis and included in the calculation of the Flash Flood Susceptibility Index (FFSI). The results indicate that terrain slope emerged as the most critical criteria, while the bare soil index was identified as the least significant. Despite some variations in the weighting coefficients between the two methods, a high level of consistency was observed in the ranking of causal criteria.
The prioritization of causal criteria for flash flood susceptibility analysis is not uniformly standardized, leading to considerable variation in methodological preferences and the assigned importance of specific factors across different case studies. Kazakis et al. [11] applied an index-based approach combined with the Analytical Hierarchy Process (AHP) to assess flood hazard areas in the Rhodope–Evros region, analyzing terrain slope, flow accumulation, elevation, land use, geology, proximity to water bodies, and rainfall intensity. The most influential criteria, based on their weight coefficients, were flow accumulation and proximity to water bodies, as areas with higher flow accumulation and closer to rivers had the highest flood risk. Terrain slope was a significant factor but not the most heavily weighted—lower slopes contribute to prolonged water retention and increased flood risk, while steeper slopes allow rapid runoff. Elevation and land use also played important roles, with lower elevations and urbanized areas showing greater susceptibility. The study integrated these weighted factors into GIS to create flood hazard maps, providing crucial data for flood management and mitigation strategies.
For instance, El-Magd et al. [14] applied a multi-criteria decision-making approach for flash flood analysis in the Awlad Toq-Sherq area, giving substantial importance to terrain slopes as a primary causal factor. This highlights the centrality of terrain characteristics in their assessment framework. Koem and Tantanee [15] conducted flash flood hazard mapping in Kampong Speu Province, Cambodia, using the AHP method integrated with GIS and satellite data. Their study prioritized a combination of factors, with slope and land use emerging as significant contributors to flash flood susceptibility. The use of AHP underscores the subjectivity involved in weighting criteria, which can vary based on regional characteristics and data availability. Lazarević et al. [16] employed the Flash Flood Potential Index (FFPI) methodology to identify flash flood hazard areas in the Likodra Watershed. In their study, the greatest importance was given to land use, particularly NDVI (Normalized Difference Vegetation Index), which reflects vegetation cover’s critical role in modulating surface runoff. Additionally, Lazarević et al. incorporated Maximum Daily Rainfall (MDR) as a crucial hydrological parameter, highlighting its role as a trigger for flash floods. This multi-faceted approach integrates meteorological, hydrological, and topographical factors, reinforcing the necessity of comprehensive data for accurate hazard assessments. Darwish [17] conducted GIS-based multi-criteria decision analysis to assess flash flood hazards and risks in the Eastern Minya Watershed, Egypt. The study integrated various criteria, with particular emphasis on natural conditions such as terrain slope and hydrological factors, including MDR. This balance between topographical and hydrological parameters underscores their interplay in shaping flash flood susceptibility.
The divergence in the weighting and selection of criteria in these studies emphasizes the influence of regional geophysical and climatic contexts, as well as the methodologies employed. While some studies like Lazarević et al. [16] prioritize land use and MDR, others, such as El-Magd et al. [14], emphasize terrain slope, illustrating the variability in how causal factors are perceived and operationalized across different case studies.
In this study, a detailed assessment of flash flood susceptibility was conducted using the AHP and BWM models, allowing for the identification of areas with different susceptibility levels. The results indicate that the majority of the territory falls into the low and very low susceptibility categories, while areas with high and very high susceptibility are significantly smaller but crucial for preventive protection. This analysis provides valuable information for spatial planning and risk management, enabling the implementation of protective measures in the most vulnerable areas.
To avoid significant consequences for the environment caused by flash floods, numerous protection measures are implemented in many countries, which can be structural or non-structural. Structural measures include hydrological and hydraulic processes: catchment-wide interventions (agriculture and forestry actions and water control works), river training interventions, and other flood control interventions (passive control, water retention basins and river corridor enhancement, and rehabilitation and restoration) [54,55]. Such measures contribute to the reduction and protection from flash floods. On the other hand, non-structural measures offer numerous possibilities, ranging from land use planning and construction and structure management codes, through soil management and acquisition policies, insurance, and perception and awareness, to public information actions, emergency systems, and post-catastrophe recovery, all of which contribute towards the mitigation of flood-related problems [7,56]. Non-structural measures have advantages due to price (cheaper than structural) and sustainability. The combination of these measures proved to be the best in adequately managing the risk of flash floods.
In this study, the AUC values obtained from the ROC curve confirm the high predictive accuracy of both models, with AHP showing slightly better performance than BWM. Although the differences in AUC values are minor and statistically insignificant, they indicate that the AHP model may provide slightly more reliable susceptibility predictions. However, the overall validation results suggest that both methodologies are robust and comparable, making them effective tools for flash flood susceptibility assessment. Regarding AUC values, previous studies indicate that the GIS–MCDA approach based on AHP has proven reliable for flood modeling. In the study by Debnath et al. [20], this method outperformed other approaches, such as the Frequency Ratio (FR) and Fuzzy Logic (FL) models, even surpassing the performance of Fuzzy AHP. It is important to note that this approach does not significantly lag behind machine learning methods, which are currently trending in modeling various natural disasters. This is supported by studies by Khosravi et al. [24] and Nachappa et al. [25], which found that machine learning approaches yielded only marginally better AUC values after validation compared to GIS–MCDA methods.
The results of the sensitivity analysis indicate clear differences between the AHP and BWM methods in terms of weight redistribution, model stability, and the impact of varying beta values on model accuracy. The AHP method demonstrates a more balanced and stable prioritization of criteria, making it well-suited for applications where consistency and minimal fluctuations in ranking are essential. The small variations in AUC values across different beta levels confirm its robustness in weight adjustments, ensuring that minor changes in criteria weights do not significantly alter the final model outcomes. This stability is particularly important in decision-making scenarios where maintaining a structured prioritization is required.
Conversely, the BWM method exhibits higher sensitivity to weight variations, as evidenced by the sharp decline in the influence of distance from drainage network and the increasing dominance of terrain slope. While this method is effective in identifying key influencing factors, the sensitivity analysis shows that it also introduces a greater risk of instability, particularly as beta values increase. The pronounced decline in AUC values in the BWM model suggests that it is more susceptible to variations in weight coefficients, which can lead to larger fluctuations in the ranking of criteria. This behavior indicates that BWM is most suitable when the objective is to emphasize the most dominant criterion, but it requires careful interpretation to avoid inconsistencies in decision-making.
GIS–MCDA differs from statistical and machine learning approaches in its decision-based framework, which relies on expert judgment and weighted spatial criteria rather than purely data-driven probability or pattern recognition methods. Frequency Ratio (FR) and Weights of Evidence (WoE) are statistical techniques that establish relationships between past flood occurrences and environmental factors, while Logistic Regression (LR) and Machine Learning (ML) models (e.g., Random Forest and SVM) use large datasets to predict flood susceptibility based on training algorithms. Unlike GIS–MCDA, these methods require a sufficient number of historical flood records for model training and validation. However, in cases where historical flood records are limited or unavailable, statistical and machine learning models may lack reliability. In such situations, GIS–MCDA serves as a suitable alternative by integrating expert knowledge and geospatial analysis to estimate susceptibility based on well-established environmental criteria. This approach allows for effective susceptibility assessment even in data-scarce regions, making it a practical tool for flood risk management when comprehensive reference datasets are not available.
One of the main sources of uncertainty in GIS–MCDA arises from the choice of criteria and how they are standardized and specified. This uncertainty is linked to several interrelated factors, including model selection, which determines the framework used for analysis, and the assignment of weighting factors, which reflect the relative importance of each criterion. Additionally, the understanding of the system being analyzed plays a crucial role, as incomplete or biased knowledge can lead to misinterpretation of results. Human judgment is another significant factor, as subjective decisions during the criteria selection and weighting process can introduce variability. Furthermore, the quality and resolution of the data utilized to establish causal criteria can significantly influence modeling outcomes, as high-quality data are essential for accurate analysis, while low-resolution data can lead to oversimplified or misleading results. Additionally, this study utilizes a bioclimatic index; however, its resolution was quite coarse due to the limited availability of climatic data and the presence of only one climatological station in the entire region. This study utilizes a geological layer at a 1:100,000 scale, which is suitable for regional analysis, but higher-resolution data could further enhance modeling accuracy. While this level of detail does not pose a significant limitation, finer data could contribute to a better understanding of local variations. Another notable limitation is that the ROC validation was conducted using data from one study, which, while diverse, may not fully capture the spatial variability of flash flood events across the region. This interplay of factors emphasizes the need for careful consideration and transparency in the GIS–MCDA process to mitigate uncertainty and improve decision-making.
For future research, it is recommended to use high-resolution data and apply machine learning methods to this research area to determine their performance. Additionally, incorporating climatic criteria with better resolution and quality into the model would be beneficial for evaluating its performance under extreme climatic conditions. Furthermore, it is recommended to explore hybrid approaches that integrate the strengths of both AHP and BWM methods, optimizing decision-making processes while maintaining stability and clarity in priority setting.

5. Conclusions

Both the AHP and BWM models were applied using the Flash Flood Susceptibility Index (FFSI), which integrates multiple environmental and topographic factors, including precipitation. This addition contributed to a more comprehensive assessment of flash flood susceptibility. The results confirm that most of the study area falls into low to very low flash flood susceptibility categories, while only a small portion exhibits high and very high susceptibility. The close agreement between the AHP and BWM models, with only minor variations in susceptibility distribution, reinforces their reliability for flood risk assessment. Validation outcomes suggest that both models perform similarly according to standardized criteria, with only minor, non-significant differences in their AUC values. Therefore, it can be concluded that the BWM model, applied for the first time in flash flood modeling, is suitable for the susceptibility assessment. The sensitivity analysis highlights key differences between the AHP and BWM methods in terms of weight redistribution, model stability, and responsiveness to changes in beta values. The AHP method demonstrates a more balanced and stable prioritization of criteria, making it well-suited for applications where consistency is essential. Its robustness ensures that small changes in criteria weights do not significantly affect the final outcomes. On the other hand, the BWM method exhibits higher sensitivity to weight variations, with a noticeable decline in the influence of distance from the drainage network and a stronger emphasis on terrain slope. This method effectively identifies dominant factors but requires careful interpretation to avoid inconsistencies in decision-making. Managing flash flood risks requires a comprehensive approach that combines structural and non-structural measures to mitigate environmental impacts.
However, several limitations must be acknowledged, including the uncertainty associated with the selection and standardization of criteria, the subjectivity in weighting assignments, the use of a coarse-resolution bioclimatic index due to limited climatic data, the reliance on a geological layer at a 1:100,000 scale, and the ROC validation based on a single study area, which may not fully capture the spatial variability of flash flood events. These factors introduce a degree of uncertainty that could be mitigated by incorporating higher-resolution data, additional climatic parameters, and more extensive validation approaches. Enhancing GIS–MCDA processes with improved data quality and incorporating additional climatic factors could lead to more precise risk assessments and better-informed decision-making. Given the increasing impacts of climate change, Montenegro must prioritize these challenges. While previous studies have primarily focused on riverine flooding, this research represents a pioneering effort in flash flood modeling. Future research should focus on integrating advanced geospatial technologies and comprehensive modeling techniques to improve flood management strategies and enhance resilience. Additionally, incorporating detailed topographic analyses, extreme climate events, and climate change factors would provide a more holistic understanding of flash flood susceptibility and its long-term implications.

Author Contributions

Conceptualization, F.V., A.V., U.D., C.M., V.S., M.M., and A.Š.; methodology, F.V., A.V., U.D., M.M., D.F., G.B., and A.Š.; software, U.D., N.B. (Natalija Batoćanin), N.B. (Nikola Bačević), and C.M.; validation, F.V., A.V., V.S., C.M., G.B., and J.G.; formal analysis, F.V., A.V., M.G., D.F., V.G., and A.Š.; investigation, F.V., U.D., C.M., G.Ć., N.B. (Natalija Batoćanin), and N.B. (Nikola Bačević); resources, M.M., G.Ć., D.R., J.G., and A.Š.; data curation, G.Ć., N.B. (Natalija Batoćanin), N.B. (Nikola Bačević), J.G., and C.M.; writing—original draft preparation, F.V., A.V., M.G., V.G., N.B. (Natalija Batoćanin), and N.B. (Nikola Bačević); writing—review and editing, N.B. (Natalija Batoćanin), N.B. (Nikola Bačević), D.F., J.G., and G.B.; visualization, F.V., G.B., V.S., and C.M.; supervision, A.V., F.V., and D.F.; project administration, D.R., A.V., F.V., and N.B. (Natalija Batoćanin), and N.B. (Nikola Bačević). All authors have read and agreed to the published version of the manuscript.

Funding

This study was funded by the Ministry of Science, Technological Development and Innovation of the Republic of Serbia (Contract number 451/03/65/2024-03/200091).

Data Availability Statement

To obtain the data for this study, please contact the authors via email.

Conflicts of Interest

The authors declare no conflicts of interest.

References

  1. Van Loenhout, J.; Below, R.; McClean, D. Human Cost of Disasters, Overview of the Last 20 Years (2000–2019), Report; UN Office for Disaster Risk Reduction & Center for Research on the Epidemiology of Disasters: Geneva, Switzerland; Brussels, Belgium, 2020; pp. 1–29. [Google Scholar]
  2. Sene, K. Flash Floods. In Hydrometeorology; Springer: Berlin/Heidelberg, Germany, 2016; pp. 273–312. [Google Scholar] [CrossRef]
  3. Haque, M.; Hong, Y.; Adhikari, P.; Gourley, J.J. Flash Flood. In Encyclopedia of Earth Sciences Series; Springer: Berlin/Heidelberg, Germany, 2013; pp. 324–325. [Google Scholar]
  4. Sene, K. Flash Floods—Forecasting and Warning; Springer: Dordrecht, The Netherlands, 2013. [Google Scholar]
  5. Ivanović, Z.; Medenica, B.; Novaković, D.; Reynolds, P. Preliminary Flood Risk Assessment for the Danube River Basin. Support to Implementation and Monitoring of Water Management, Montenegro. EuropeAid/139429/IH/SER/ME, Public Works Administration of Montenegro. 2021. Available online: https://wapi.gov.me/download-preview/a1b6de41-2ad7-4a50-b4ca-ac3a982ffd07?version=1.0 (accessed on 10 March 2025).
  6. Landau, S. Montenegro Third National Communication on Climate Change. Ministry of Sustainable Development and Tourism (MSDT) and United Nations Development Programme (UNDP) in Montenegro. 2020. Available online: https://www4.unfccc.int/sites/SubmissionsStaging/NationalReports/Documents/8596012_Montenegro-NC3-1-TNC%20-%20MNE.pdf (accessed on 10 March 2025).
  7. Foudi, S.; Osés-Eraso, N. Flood Risk Management: Assessment for Prevention with Hydro-Economic Approaches. In Routledge Handbook of the Economics of Climate Change Adaptation; Markandya, A., Galarraga, I., de Murieta, E.S., Eds.; Routledge: London, UK, 2014; pp. 317–334. [Google Scholar]
  8. Šiljeg, S.; Milošević, R.; Mamut, M. Pluvial Flood Susceptibility in the Local Community of the City of Gospić (Croatia). Sustainability 2024, 16, 1701. [Google Scholar] [CrossRef]
  9. Hydro Solutions UK. Flood Estimation Handbook. Available online: https://www.hydrosolutions.co.uk/software/flood_estimation_handbook/ (accessed on 15 February 2025).
  10. Mahmood, S.; Rahman, A. Flash flood susceptibility modeling using geo-morphometric and hydrological approaches in Panjkora Basin, Eastern Hindu Kush, Pakistan. Environ. Earth Sci. 2019, 78, 43. [Google Scholar] [CrossRef]
  11. Kazakis, N.; Kougias, I.; Patsialis, T. Assessment of Flood Hazard Areas at a Regional Scale Using an Index-Based Approach and Analytical Hierarchy Process: Application in Rhodope–Evros Region, Greece. Sci. Total Environ. 2015, 538, 555–563. [Google Scholar] [CrossRef]
  12. Radwan, F.; Alazba, A.A.; Mossad, A. Flood risk assessment and mapping using AHP in arid and semiarid regions. Acta Geophys. 2019, 67, 215–229. [Google Scholar] [CrossRef]
  13. Rincón, D.; Khan, U.T.; Armenakis, C. Flood Risk Mapping Using GIS and Multi-Criteria Analysis: A Greater Toronto Area Case Study. Geosciences 2018, 8, 275. [Google Scholar] [CrossRef]
  14. El-Magd, S.A.A.; Amer, R.A.; Embaby, A. Multi-criteria decision-making for the analysis of flash floods: A case study of Awlad Toq-Sherq, Southeast Sohag, Egypt. J. Afr. Earth Sci. 2020, 162, 103709. [Google Scholar] [CrossRef]
  15. Koem, C.; Tantanee, S. Flash flood hazard mapping based on AHP with GIS and satellite information in Kampong Speu Province, Cambodia. Int. J. Disaster Resil. Built Environ. 2021, 12, 457–470. [Google Scholar] [CrossRef]
  16. Lazarević, K.; Todosijević, M.; Vulević, T.; Polovina, S.; Momirović, N.; Čaković, M. Determination of Flash Flood Hazard Areas in the Likodra Watershed. Water 2023, 15, 2698. [Google Scholar] [CrossRef]
  17. Darwish, K. GIS-Based Multi-Criteria Decision Analysis for Flash Flood Hazard and Risk Assessment: A Case Study of the Eastern Minya Watershed, Egypt. Environ. Sci. Proc. 2023, 25, 87. [Google Scholar] [CrossRef]
  18. Agustina, R.D.; Putra, R.P.; Susanti, S. Mapping Greater Bandung flood susceptibility based on multi-criteria decision analysis (MCDA) using AHP method. Environ. Earth Sci. 2023, 82, 370. [Google Scholar] [CrossRef]
  19. Baalousha, H.M.; Younes, A.; Yassin, M.A.; Fahs, M. Comparison of the fuzzy analytic hierarchy process (F-AHP) and fuzzy logic for flood exposure risk assessment in arid regions. Hydrology 2023, 10, 136. [Google Scholar] [CrossRef]
  20. Debnath, J.; Sahariah, D.; Nath, N.; Saikia, A.; Lahon, D.; Islam, N.; Hashimoto, S.; Meraj, G.; Kumar, P.; Singh, S.K.; et al. Modelling on assessment of flood risk susceptibility at the Jia Bharali River basin in Eastern Himalayas by integrating multicollinearity tests and geospatial techniques. Model. Earth Syst. Environ. 2024, 10, 2393–2419. [Google Scholar] [CrossRef]
  21. Taherizadeh, M.; Niknam, A.; Nguyen-Huy, T.; Mezősi, G.; Sarli, R. Flash flood-risk areas zoning using integration of decision-making trial and evaluation laboratory, GIS-based analytic network process and satellite-derived information. Nat. Hazards 2023, 118, 2309–2335. [Google Scholar] [CrossRef]
  22. Tehrany, M.S.; Shabani, F.; Jebur, M.N.; Hong, H.; Chen, W.; Xie, X. GIS-based spatial prediction of flood-prone areas using standalone frequency ratio, logistic regression, weight of evidence and their ensemble techniques. Geomat. Nat. Hazards Risk 2017, 8, 1538–1561. [Google Scholar] [CrossRef]
  23. Mansour, A.; Mrad, D.; Djebbar, Y. Advanced modeling for flash flood susceptibility mapping using remote sensing and GIS techniques: A case study in Northeast Algeria. Environ. Earth Sci. 2024, 83, 60. [Google Scholar] [CrossRef]
  24. Khosravi, K.; Shahabi, H.; Pham, B.T.; Adamowski, J.; Shirzadi, A.; Pradhan, B.; Dou, J.; Ly, H.-B.; Gróf, G.; Ho, H.L.; et al. A comparative assessment of flood susceptibility modeling using multi-criteria decision-making analysis and machine learning methods. J. Hydrol. 2019, 573, 311–323. [Google Scholar] [CrossRef]
  25. Nachappa, T.G.; Piralilou, S.T.; Gholamnia, K.; Ghorbanzadeh, O.; Rahmati, O.; Blaschke, T. Flood susceptibility mapping with machine learning, multi-criteria decision analysis and ensemble using Dempster Shafer Theory. J. Hydrol. 2020, 590, 125275. [Google Scholar] [CrossRef]
  26. Costache, R.; Bui, D.T. Identification of areas prone to flash-flood phenomena using multiple-criteria decision-making, bivariate statistics, machine learning and their ensembles. Sci. Total Environ. 2020, 712, 136492. [Google Scholar] [CrossRef]
  27. Ruidas, D.; Chakrabortty, R.; Islam, A.R.M.T.; Saha, A.; Pal, S.C. A novel hybrid of meta-optimization approach for flash flood-susceptibility assessment in a monsoon-dominated watershed, eastern India. Environ. Earth Sci. 2022, 81, 269. [Google Scholar] [CrossRef]
  28. Saikh, N.I.; Mondal, P. GIS-based machine learning algorithm for flood susceptibility analysis in the Pagla river basin, Eastern India. Nat. Hazards Res. 2023, 3, 420–436. [Google Scholar] [CrossRef]
  29. Wahba, M.; Sharaan, M.; Elsadek, W.M.; Kanae, S.; Hassan, H.S. Examination of the efficacy of machine learning approaches in the generation of flood susceptibility maps. Environ. Earth Sci. 2024, 83, 429. [Google Scholar] [CrossRef]
  30. Islam, R.; Chowdhury, P. Local-scale flash flood susceptibility assessment in northeastern Bangladesh using machine learning algorithms. Environ. Chall. 2024, 14, 100833. [Google Scholar] [CrossRef]
  31. Durlević, U.; Čegar, N.; Dobrić, M.; Vukašinović, S.; Lukić, T.; Stevanović, V.; Radovanović, D.; Valjarević, A. The Heritage Climate Index (HERCI): Development, Assessment and Application for Tourism Purposes in Geoheritage and Cultural Heritage Sites. Atmosphere 2023, 14, 1265. [Google Scholar] [CrossRef]
  32. Spalević, V.; Barović, G.; Vujačić, D.; Čurović, M.; Behzadfar, M.; Đurović, N.; Đudić, B.; Billi, P. The Impact of Land Use Changes on Soil Erosion in the River Basin of Miocki Potok, Montenegro. Water 2020, 12, 2973. [Google Scholar] [CrossRef]
  33. Vujačić, D.; Milevski, I.; Mijanović, D.; Vujović, F.; Lukić, T. Initial Results of Comparative Assessment of Soil Erosion Intensity Using the Wintero Model: A Case Study of Polimlje and Shirindareh Drainage Basins. Carpath. J. Earth Environ. Sci. 2023, 18, 385–404. [Google Scholar] [CrossRef]
  34. Ćipranić, I.; Ostojić, M.; Ćalasan, O.; Jevrić, M. Flood Risk Assessment in Montenegro—The Current State. In Interdisciplinary Advances in Sustainable Development III; Ademović, N., Tufek-Memišević, T., Arslanagić-Kalajdžić, M., Eds.; BHAAAS 2024; Lecture Notes in Networks and Systems; Springer: Cham, Switzerland, 2024; Volume 851. [Google Scholar] [CrossRef]
  35. Özay, B.; Orhan, O. Flood susceptibility mapping by best–worst and logistic regression methods in Mersin, Turkey. Environ. Sci. Pollut. Res. 2023, 30, 45151–45170. [Google Scholar] [CrossRef]
  36. Reynolds, P. Water Management Plan in the Water Area of the Danube Basin. Public Works Administration of Montenegro: Podgorica, Montenegro. 2021. Available online: https://www.gov.me/dokumenta/a1b6de41-2ad7-4a50-b4ca-ac3a982ffd07 (accessed on 10 March 2025).
  37. Bešić, Z. Geologija Crne Gore: Geotektonika i Paleografija Crne Gore; Društvo za Nauku i Umjetnost Crne Gore: Titograd, Soscijalistička Država Jugoslavija, 1983. [Google Scholar]
  38. Mirković, M.; Živaljević, M.; Đukić, V.; Petrović, Z.; Kalezić, M.; Pajović, M. Tumač Geološke Karte SR Crne Gore 1:200,000; Zavod za Geološka Istraživanja: Podgorica, Montenegro, 1985. [Google Scholar]
  39. Burić, M.; Micev, B.; Mitrović, L. Climate Atlas of Montenegro; Montenegrin Academy of Sciences and Arts: Podgorica, Montenegro, 2012. [Google Scholar]
  40. Vujović, F. Comparative Geomorphometric Analysis of Drainage Basin Using AW3D30 Model in ArcGIS and QGIS Environment: Case Study of the Ibar River Drainage Basin, Montenegro. Agric. For. 2024, 70, 217–230. [Google Scholar] [CrossRef]
  41. Malczewski, J.; Rinner, C. Multicriteria Decision Analysis in Geographic Information Science; Springer: Berlin/Heidelberg, Germany, 2015. [Google Scholar] [CrossRef]
  42. Eastman, J.R. Multi-criteria evaluation and GIS. Geogr. Inf. Syst. 1999, 1, 493–502. [Google Scholar]
  43. Domazetović, F.; Šiljeg, A.; Lončar, N.; Marić, I. GIS automated multicriteria analysis (GAMA) method for susceptibility modelling. MethodsX 2019, 6, 2553–2561. [Google Scholar] [CrossRef]
  44. Saaty, T.L. How to make a decision: The analytic hierarchy process. Eur. J. Oper. Res. 1990, 48, 9–26. [Google Scholar] [CrossRef]
  45. Saaty, T.L. Decision making with the analytic hierarchy process. Int. J. Serv. Sci. 2008, 1, 83–98. [Google Scholar] [CrossRef]
  46. Rahimi, S.; Hafezalkotob, A.; Monavari, S.M.; Hafezalkotob, A.; Rahimi, R. Sustainable landfill site selection for municipal solid waste based on a hybrid decision-making approach: Fuzzy group BWM-MULTIMOORA-GIS. J. Clean. Prod. 2020, 248, 119186. [Google Scholar] [CrossRef]
  47. Rezaei, J. Best-worst multi-criteria decision-making method. Omega 2015, 53, 49–57. [Google Scholar] [CrossRef]
  48. Rezaei, J. Best-worst multi-criteria decision-making method: Some properties and a linear model. Omega 2016, 64, 126–130. [Google Scholar] [CrossRef]
  49. Karger, D.N.; Conrad, O.; Böhner, J.; Kawohl, T.; Kreft, H.; Soria-Auza, R.W.; Zimmermann, N.E.; Linder, H.P.; Kessler, M. Climatologies at high resolution for the Earth land surface areas. Sci. Data 2017, 4, 170122. [Google Scholar] [CrossRef]
  50. Triantaphyllou, E.; Sánchez, A. A Sensitivity Analysis Approach for Some Deterministic Multi-Criteria Decision-Making Methods. Decis. Sci. 1997, 28, 151–194. [Google Scholar] [CrossRef]
  51. Li, F.; He, H. Assessing the accuracy of diagnostic tests. Shanghai Arch. Psychiatry 2018, 30, 207–212. [Google Scholar] [CrossRef]
  52. Krvavica, N.; Šiljeg, A.; Horvat, B.; Panđa, L. Pluvial Flash Flood Hazard and Risk Mapping in Croatia: Case Study in the Gospić Catchment. Sustainability 2023, 15, 1197. [Google Scholar] [CrossRef]
  53. Šiljeg, A.; Panđa, L.; Marinović, R.; Krvavica, N.; Domazetović, F.; Jurišić, M.; Radočaj, D. Infiltration Efficiency Index for GIS Analysis Using Very-High-Spatial-Resolution Data. Sustainability 2023, 15, 15563. [Google Scholar] [CrossRef]
  54. Shrestha, A.B.; Shah, S.H.; Karim, R. Resource Manual on Flash Flood Risk Management; ICIMOD: Kathmandu, Nepal, 2008; Available online: https://lib.icimod.org/record/7892/files/attachment_522.pdf (accessed on 10 March 2025).
  55. Valjarević, A.; Marković, S.; Radovanović, D.; Pavlović, N.; Milošević, Z. Cloudiness and Water from Cloud Seeding in Connection with Plants Distribution in the Republic of Moldova. Appl. Water Sci. 2022, 12, 262. [Google Scholar] [CrossRef]
  56. Durlević, U.; Valjarević, A.; Pavlović, N.; Lukić, T.; Radosavljević, Z.; Gajić, M. Multihazard Susceptibility Assessment: A Case Study—Municipality of Štrpce, Southern Serbia. Open Geosci. 2020, 12, 1463–1480. [Google Scholar] [CrossRef]
Figure 1. The Ibar River Basin in Montenegro shown on the map.
Water 17 00844 g001
Figure 2. Flow chart of methodology and approaches of the GIS–MCDA.
Water 17 00844 g002
Figure 3. Environmental causal criteria. (a) Terrain slope; (b) distance from drainage network; (c) geology; (d) land cover; (e) drainage density, (f) bare soil index.
Water 17 00844 g003
Figure 4. Distribution map of BIO16 variable.
Water 17 00844 g004
Figure 5. GIS–MCDA models. (a) AHP; (b) BWM.
Water 17 00844 g005
Figure 6. Results of the ROC curve analysis with AUC values for AHP and BWM models.
Water 17 00844 g006
Figure 7. ROC curve analysis results comparing the sensitivity of AHP and BWM models.
Water 17 00844 g007
Table 1. List of causal criteria, data sources, resolutions, and formats.
CodeCriteriaData TypesSource
C1Terrain SlopeEU-DEM (25 m)https://land.copernicus.eu/ (accessed on 10 March 2025)
C2Distance from Drainage NetworkDerived from EU-DEM (25 m) Analysishttps://land.copernicus.eu/ (accessed on 10 March 2025)
C3GeologyBasic geological map of Yugoslavia (scale 1:100,000)https://geozavod.co.me/ (accessed on 10 March 2025)
C4Land CoverESRI Land Cover (10 m)https://livingatlas.arcgis.com/landcover/ (accessed on 10 March 2025)
C5Drainage densityEU-Hydro (25 m)https://land.copernicus.eu/ (accessed on 10 March 2025)
C6Bare Soil IndexSentinel 2 (10 m)https://www.sentinel-hub.com/ (accessed on 10 March 2025)
BIO16Annual Precipitation of The Wettest QuarterCHELSA (1 km)https://chelsa-climate.org/bioclim/ accessed on 10 March 2025)
Table 2. Fundamental scale [44].
Intensity of ImportanceDefinition
1Equal importance
3Moderate importance of one over another
5Essential or strong importance
7Very strong importance
9Extreme importance
2, 4, 6, 8Intermediate values
Table 3. Values for RI [44,45].
Size of Matrix12345678910
RI000.580.901.121.241.321.411.451.49
Table 4. VIF analysis.
CriteriaToleranceVIF
C10.861.17
C20.921.09
C30.961.04
C40.901.11
C50.891.13
C60.981.02
BIO160.871.15
Table 5. Standardization of values for causal criteria.
Intensity of Importance
Criteria CodeVery Low (1)Low (2)Moderate (3)High (4)Very High (5)
C1>32°12–32°5–12°2–5°<2°
C2>100 m75–100 m50–75 m25–50 m<25 m
C3Quartz keratophyreDijabase-chert formationLimestones and breccias; Limestones and dolomiteSandstones, Conglomerates and sandstones; Fluvio-glacial sediments; Conglomerates and sandstonesSand and gravel; Deluvium
C4/TreesRangelandBuilt Area/
C5<0.80 km/km20.80–1.80
km/km2
1.80–2.95 km/km22.95–4.43
km/km2
>4.43
km/km2
C6<0.250.25–0.360.36–0.420.42–0.49>0.49
Table 6. Weight coefficients according to AHP.
Criteria CodeC1C2C3C4C5C6Weight %
C11.002.003.003.003.003.0032.80
C20.501.002.003.003.002.0022.60
C30.330.501.002.003.002.0015.90
C40.330.330.501.003.002.0012.50
C50.330.330.330.331.002.008.50
C60.330.500.500.500.501.007.70
Count = 6.00; lambda max = 6.39; CI = 0.079; CR = 0.06; constant = 1.24.
Table 7. Weight coefficients according to BWM.
Best to OthersC1C2C3C4C5C6
C11.002.003.004.005.006.00
Others to the worstC1C2C3C4C5C6
C66.005.004.003.002.001.00
Weight %C1C2C3C4C5C6
37.9422.1314.7511.068.855.27
CR = 0.20
Table 8. Standardization of values for BIO16.
ValueImportance
<3003
300–4004
>4005
Table 9. Percentage of total area according to the AHP and BWM models.
Susceptibility ClassesAHP Model (%)BWM Model (%)
Very low5.463.25
Low67.9566.10
Moderate23.8127.45
High2.012.37
Very high0.770.83
Total100.00100.00
% of total area.
Table 10. dMIN of the AHP and BWM models.
CriteriaAHP dMIN (%)BWM dMIN (%)
C131.1041.66
C245.1371.40
C342.1450.03
C427.2033.36
C547.0624.97
Table 11. Sensitivity analysis of AHP and BWM models.
AHPBWM
βC1C2C3C4C5C6βC1C2C3C4C5C6
10.0033.1022.8116.0512.617.667.7710.0038.9320.0915.1411.359.085.41
20.0033.4023.0216.1912.736.827.8420.0039.9518.0015.5311.659.325.55
30.0033.7123.2216.3412.855.977.9130.0040.9915.8715.9411.959.565.69
40.0034.0223.4316.4912.965.127.9840.0042.0613.6816.3512.269.815.84
50.0034.3223.6416.6313.084.278.0650.0043.1311.4716.7712.5810.065.99
Disclaimer/Publisher’s Note: The statements, opinions and data contained in all publications are solely those of the individual author(s) and contributor(s) and not of MDPI and/or the editor(s). MDPI and/or the editor(s) disclaim responsibility for any injury to people or property resulting from any ideas, methods, instructions or products referred to in the content.

