1. Introduction
The Ilaló volcano is undergoing aggressive anthropogenic intervention processes. Human activities such as expanding the urban frontier, aggressive tourism, inadequate agricultural practices, deforestation, and climate change effects are degrading this ecosystem and accelerating soil erosion. Water zones are deteriorated, and water storage capacity is low. Soil erosion is considered one of the most severe environmental crises worldwide today [
1] due to increased human activities [
2].
Soil erosion is a complex process caused by several factors, such as rainfall, soil type, topography, vegetation, and land use practices [
3]. The predominant soil type on the Ilaló volcano is “cangahua”. Cangahuas are rocks of pyroclastic materials typically covered by recent volcanic ash [
4]. This soil is highly prone to rainfall-induced erosion. Rain-induced erosion is one of Ecuador’s leading causes of soil degradation and has significant implications for the conservation and management of water and soil resources [
3].
The main effect of soil erosion is the reduction in agricultural productivity. Eroded soil has a low water infiltration rate, which affects its water retention capacity. The water deficit also reduces the amount of nutrients, organic matter, and soil biota. Soil unproductivity threatens food security and causes significant economic losses to families who are generally vulnerable [
5]. Additionally, the water deficit affects river and riparian ecosystems, thus reducing ecosystem services. The effects directly impact water resources, leading to increasingly arid landscapes.
The water resource recovery and restoration strategies to combat soil erosion can vary. In recent years, nature-based solutions (NbS), such as green infrastructure, have been applied to simulate natural processes [
6]. NbS is an exciting approach because it aims to implement measures that are not harmful to the functioning of nature. NbS emulate the functioning of nature and accelerates the natural restoration process. Examples of NbS include bio-intensive afforestation, water harvesting, terrace construction, retention channels, and check dams. These measures aim to prevent and control erosion, promote soil conservation, and protect natural resources [
7].
In this work, check dams were tested in small-flow and high-mountain rivers. However, the check dams’ applicability extends beyond riverine environments, making them viable NbS for other ecosystems facing erosion and sedimentation challenges. Small-scale NbS experiences promote the scaling up of intervention. In coastal and estuarine settings, NbS, like building blocks [
8] or seagrass meadow replantation [
9], can aid in sediment stabilisation, mitigating coastal erosion. In coastal lagoons, NbS is essential in mitigating the consequences of coastal flooding [
10]. Studies have shown that NbS can complement traditional engineering solutions in landscape restoration efforts by providing cost-effective, ecologically sustainable alternatives [
9].
Check dams are small structures built across channels to control water flow and sediment transport. They serve multiple purposes: flood mitigation, sediment retention, and water resource enhancement. Check dams are versatile tools for managing water resources, controlling floods, and reducing sediment transport. Their design and effectiveness depend on local environmental conditions and ongoing maintenance efforts to adapt to changing landscapes.
Since 2021, several check dams have been installed in the Urku Huayku ravine on the Ilaló volcano as an alternative for hydrological recovery. Dams are effective structures for soil and water conservation because they reduce the erosive power of water, store and retain sediments (a source of nutrients), and become biodiversity hotspots [
11]. Check dams are green infrastructures that effectively reduce soil and water loss, and they are promoted and constructed in various locations [
12]. Green infrastructure is a measure promoted by Ecuadorian public policy as an adaptation to climate change [
13].
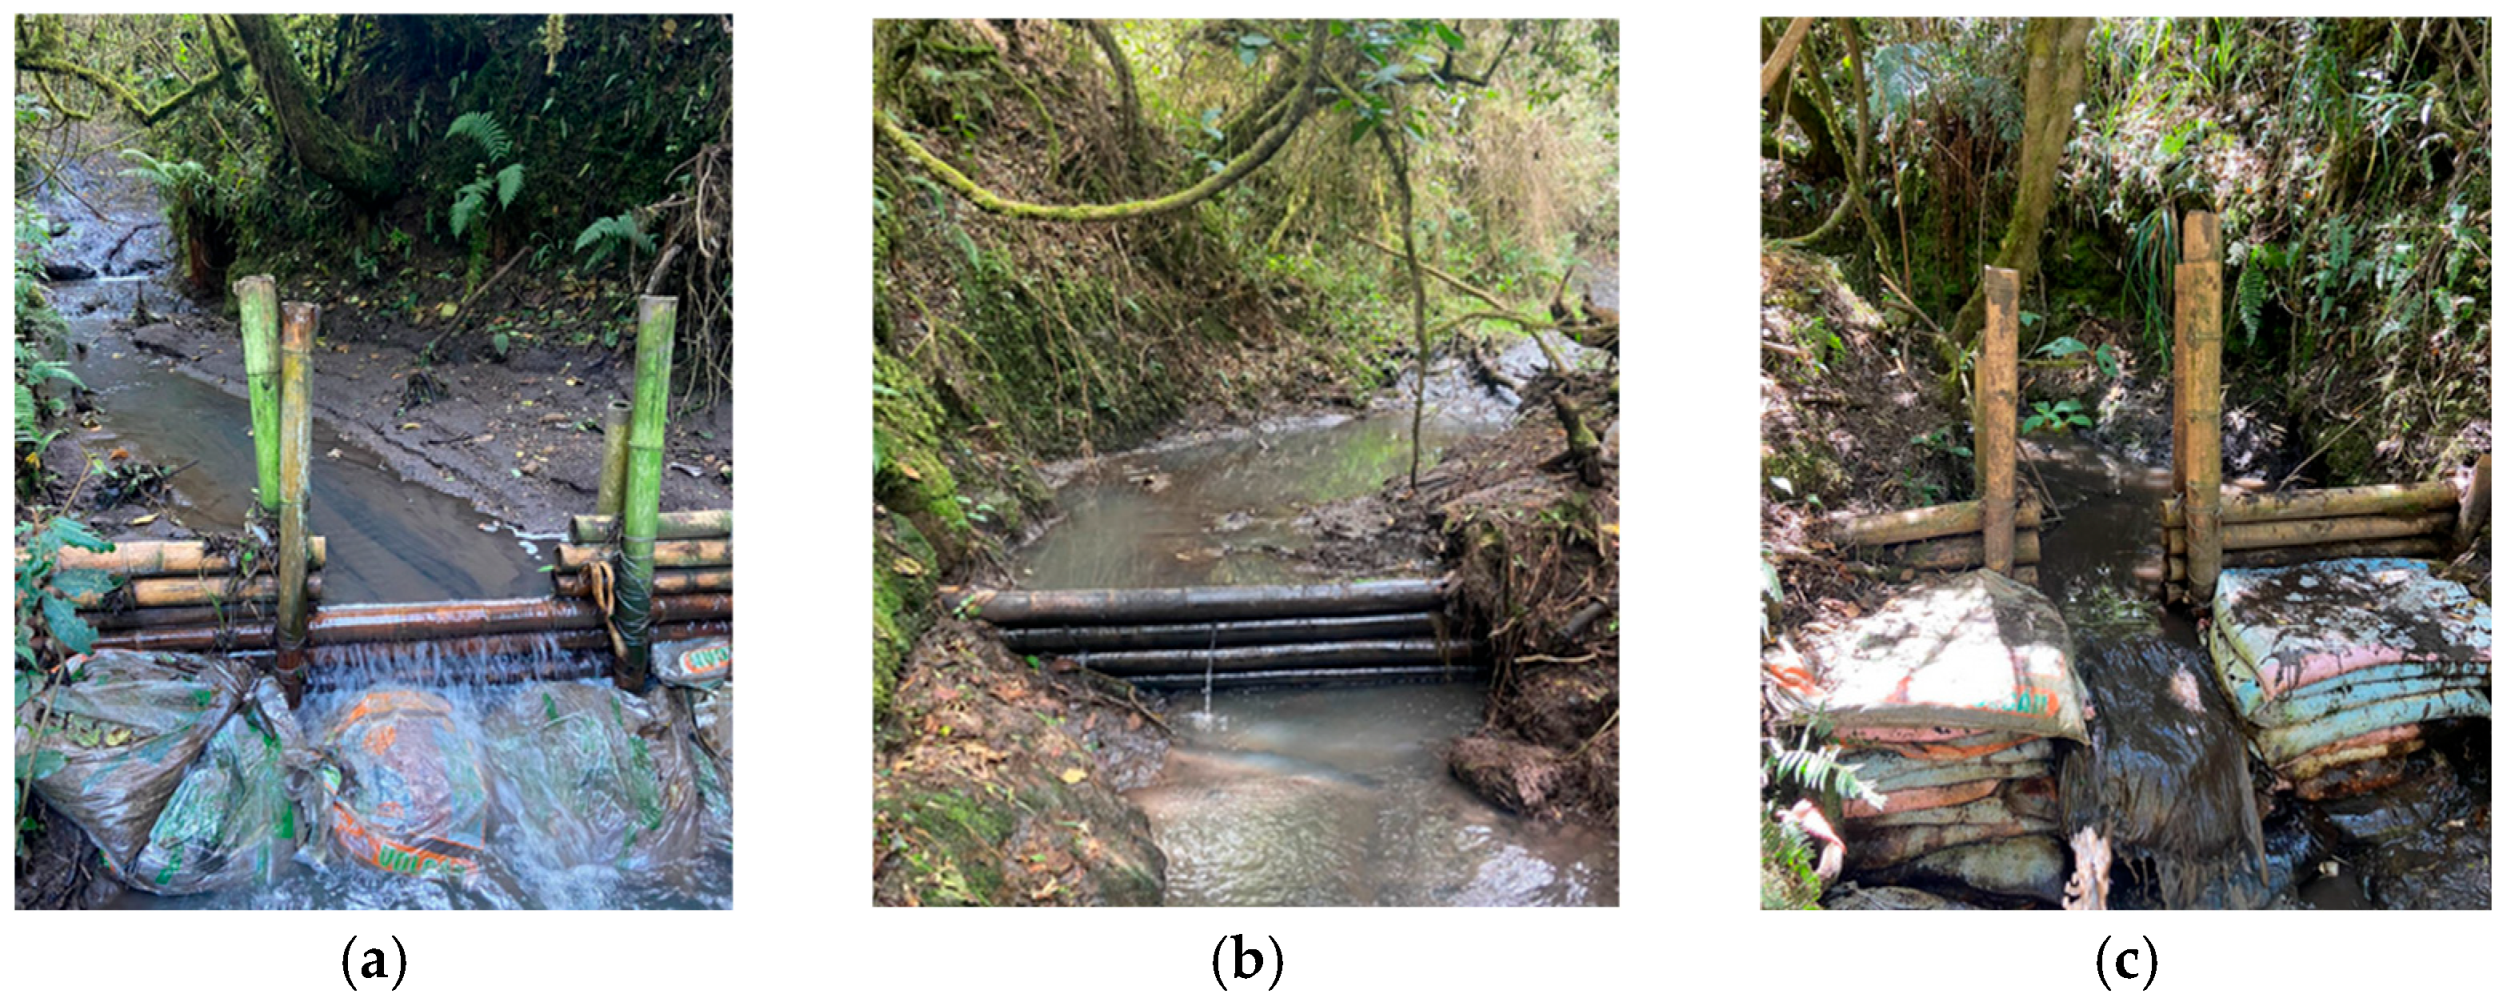
Figure 1 shows the three check dams installed in the Urku Huayku ravine:
This work aimed to generate a time series of water and sediment quality and quantity data, measured at the three check dams built in the Urku Huayku ravine from 2021 to 2023, to evaluate the functionality of these green infrastructures. Evaluation criteria will be the ability to increase the amount of water and improve the ecosystems’ favourable conditions. Water and sediment samples were collected, and several parameters were measured. Samples of macroinvertebrates were collected to evaluate the fluvial biodiversity. A temporal statistical comparison was then performed using the free software RStudio version 2023.09.0. The variation in each parameter over time allowed us to assess the effectiveness of the check dams. Additionally, the free software QGIS version 3.28 Firenze was used to identify other feasible points in the ravine where more dams could be placed to prevent soil erosion in those areas of the Ilaló volcano.
2. Materials and Methods
The research paradigm of this project is quantitative since statistics were used to analyse the data. This quantitative data involved measuring physical, chemical, and biological parameters at the site, and the data were analysed using concepts and measurable variables.
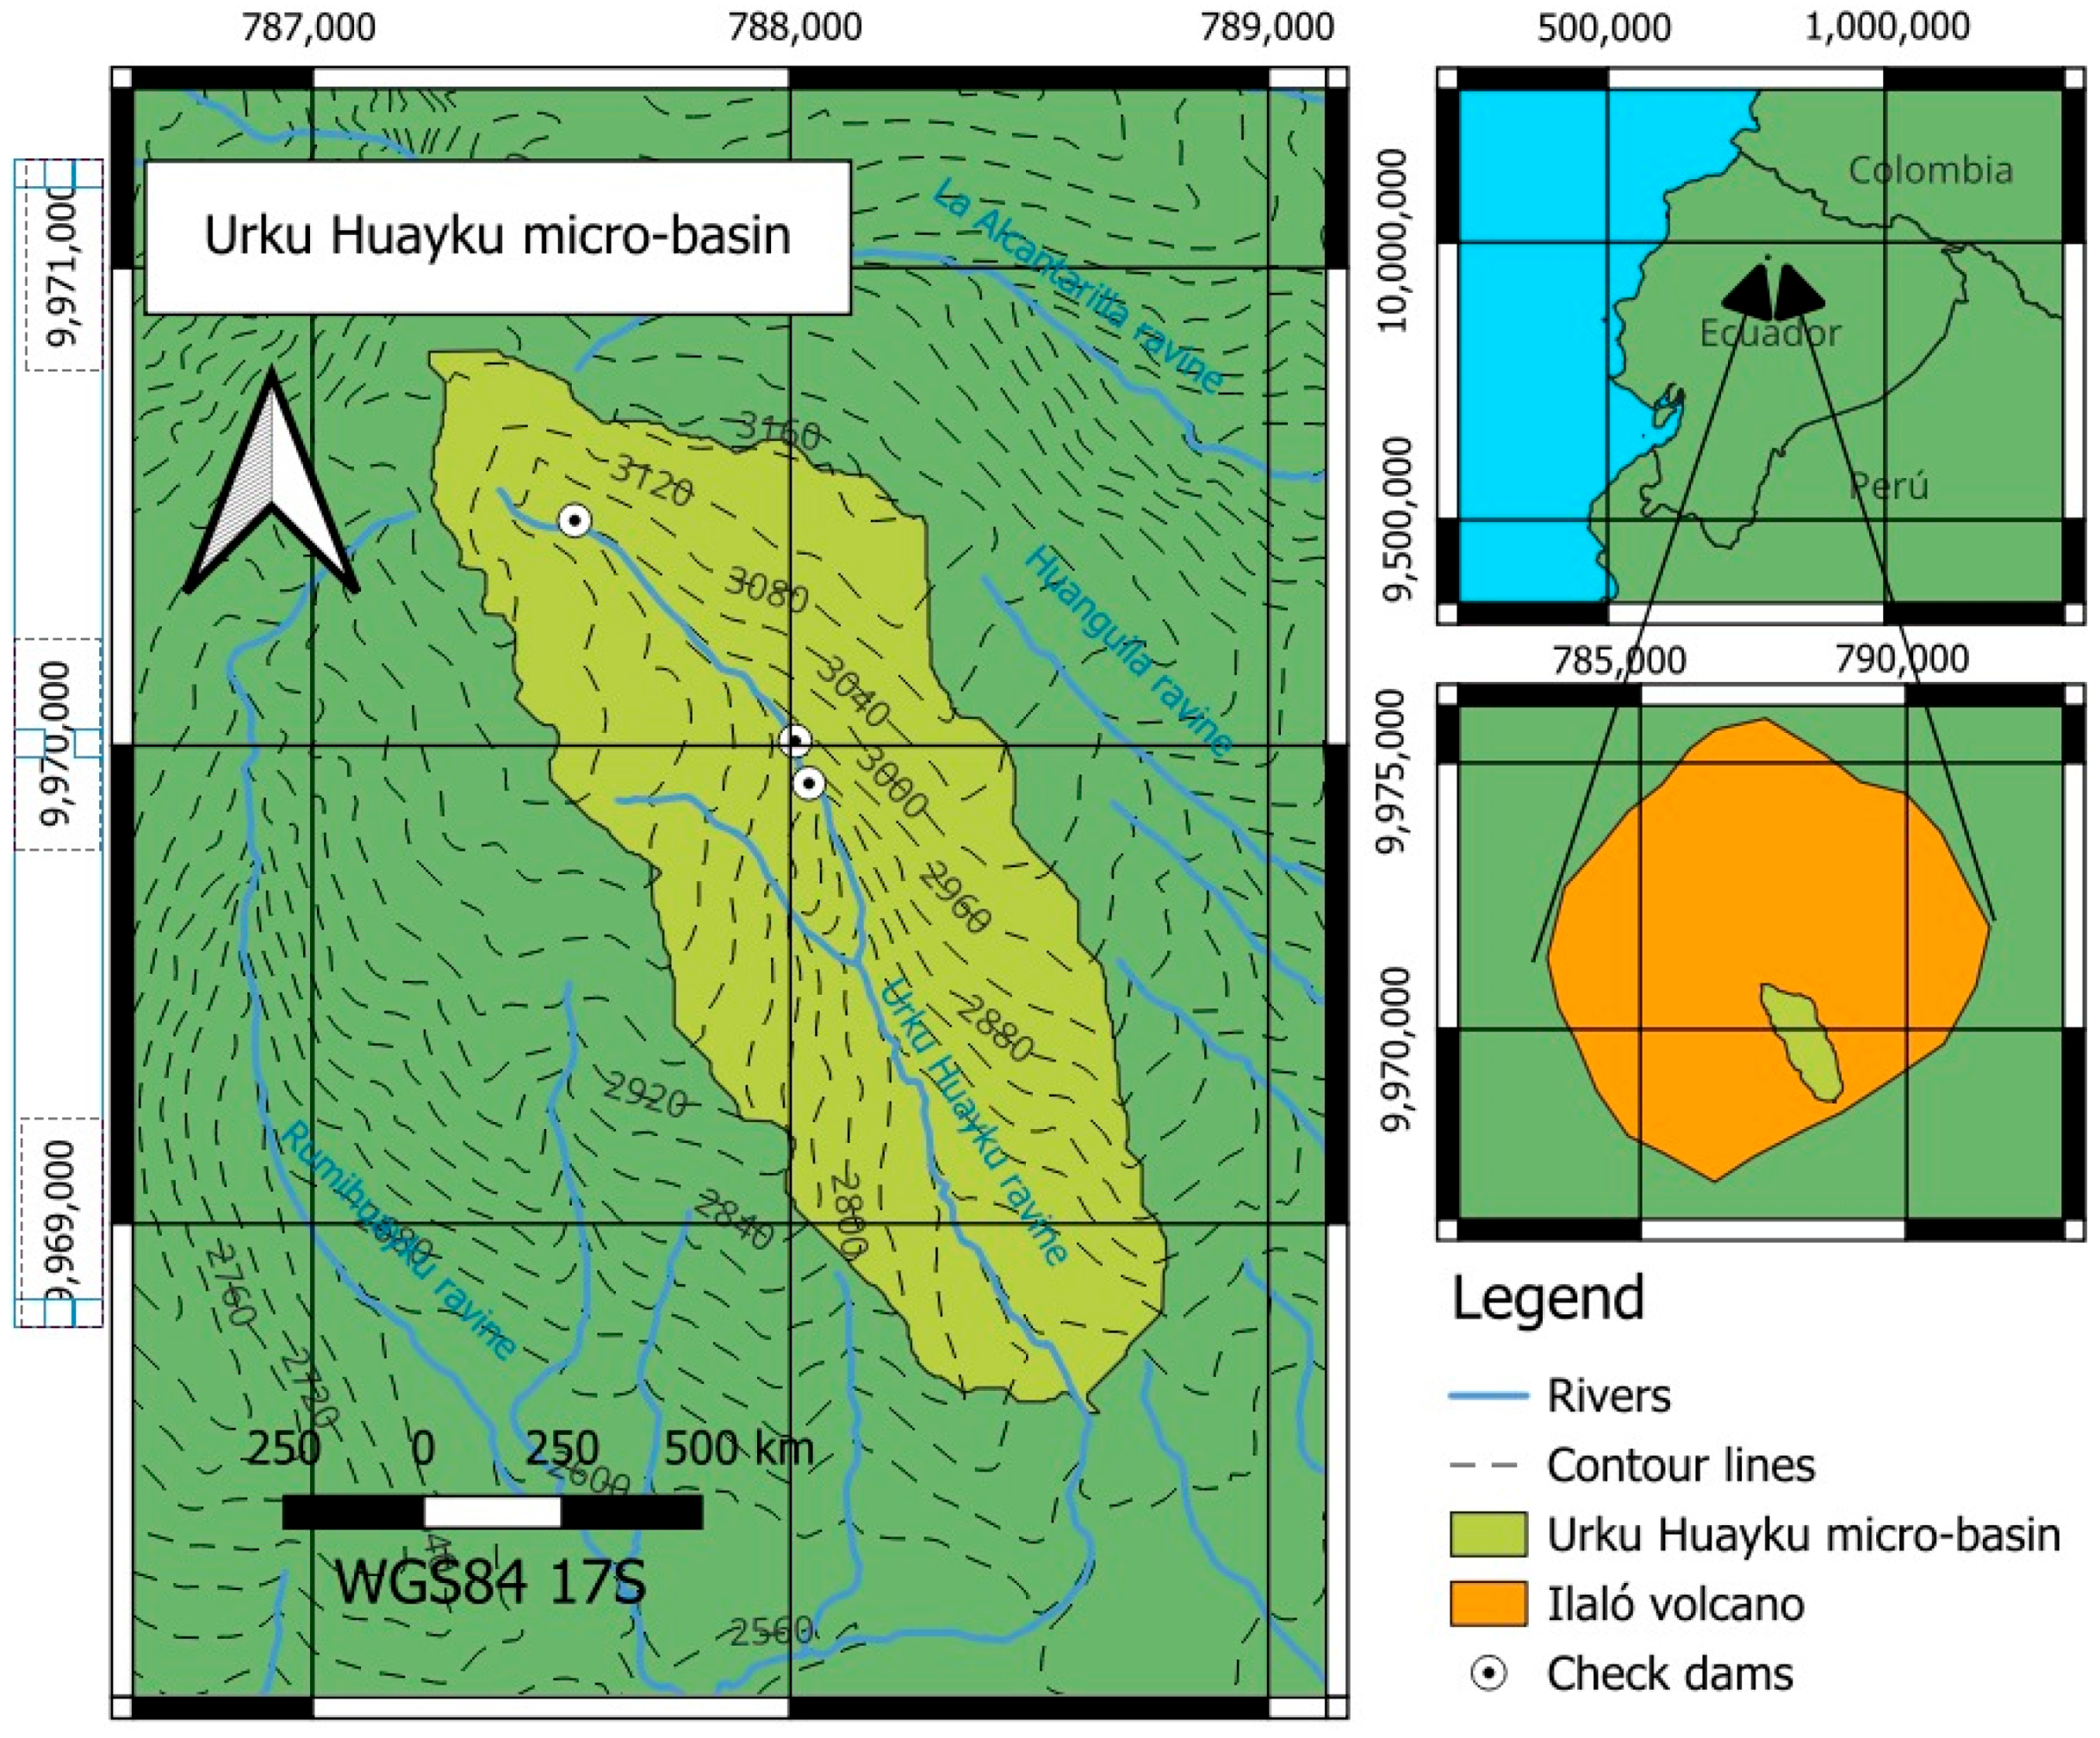
The study area is in the Urku Huayku ravine, situated south of the Ilaló volcano in the Valley of Los Chillos, and belongs to the San Francisco de Baños community. The check dams were placed between the coordinates 787,789.744–9,967,995.403 and 787,292.841–9,970,760.506 (UTM WGS84 17S), as indicated in
Figure 2. The Urku Huayku is an indigenous Andean language. In English, it can be translated as "mountain" (urku) and “river” or “ravine” (huayku). In general terms, it is related to the geographical formations of the Andean region. This Micro-basin ravine has a central channel length of 4.085 km and an area of 2.497 km
2, with a maximum elevation of 3186.867 m above sea level and a minimum elevation of 2522.478 m above sea level. The three check dams are installed in the upper part of the ravine.
In
Figure 2, the delimitation of the Urku Huayku micro-basin is shown:
Figure 2.
Urku Huayku micro-basin.
Figure 2.
Urku Huayku micro-basin.
Water and sediment samples were taken weekly from the Urku Huayku ravine. Water samples were collected in plastic containers of 500–700 mL. In contrast, sediment samples were taken at various depths (surface, medium, and deep), with approximately 0.5 kg of sediment collected at each check dam. Physical measurements such as flow and depth were taken in each zone where the dams are installed. Water and soil sampling followed [
14,
15] recommendations.
2.1. Installation of the Check Dams
The materials for check dams include stone-on-stone (dry masonry), stone with cement (hydraulic masonry), wooden dams, and dams with sandbags [
16]. Applying the same concept as traditional dams, the check dams in this study use biodegradable and nature-assimilable materials. These materials include bamboo (
Guadua angustifolia), soil, and small stones (rocky materials) as a timber resource. The design and implementation of check dams follow a prior hydrological analysis, where pre-feasibility and feasibility studies were conducted [
17]. The installation of check dams is both economically and environmentally viable.
2.2. Methodology for Water Analysis
Water samples from each check dam were analysed weekly between May and June 2023 at the environmental laboratory (Universidad de las Fuerzas Armadas ESPE). The parameters analysed in each sample to determine water quality were sulphates, phosphates, nitrates, suspended solids (SS), total dissolved solids (TDS), pH, and electrical conductivity (EC). The flow was measured at the site. The results were compared with the water quality criteria of Ministerial Agreement No. 097A [
18] (environmental norm of Ecuador).
Sampling was conducted at three check dams installed in the Urku Huayku ravine, selected based on their hydrological and sediment retention characteristics. The selected monitoring period of three years (2021–2023) was chosen to capture both short-term and medium-term ecological and hydrological changes resulting from the implementation of check dams. This timeframe allowed for assessing seasonal variations in water quality, sediment deposition, and biodiversity dynamics. Although longer-term monitoring would offer additional insights into the stability and evolution of these systems, the selected period provides a robust initial evaluation while balancing logistical and resource constraints. This systematic approach ensured robust temporal and spatial coverage, allowing for a comprehensive assessment of the effectiveness of check dams as NbS. Future studies may expand the sampling network to include additional upstream and downstream sites to evaluate broader watershed-scale impacts further.
Table 1 details the methods used to obtain each parameter.
2.3. Methodology for Sediment Analysis
Sediment samples were analysed in the soil mechanics laboratory (Universidad de las Fuerzas Armadas ESPE). For the analysis, sediment samples were taken from three depths (surface, medium, and deep) at the location of each dam, allowing for a more detailed analysis and a more accurate understanding of the sediment composition at different levels.
Table 2 details the methods used to obtain each parameter.
2.4. Methodology for Bioindicators
The analysis of macroinvertebrates in the Urku Huayku ravine was conducted with researchers from the Regional Amazonian University Ikiam. A Surber net with a 250 μm mesh opening was used. A combined sample of nine subsamples was collected at each check dam, covering a total area of 1 m2. The collection procedure involves placing a net against the current in the waterbed. The net remains static, while objects that contribute to diversity (such as logs, stones, and leaf litter) are cleaned, and the top layer of the substrate is stirred up to a depth of 5 cm. In the laboratory, the macroinvertebrates are identified and counted using a stereoscope. Biodiversity is determined using biological indices that provide a numerical value representing the characteristics of all species present in an area based on their resistance or sensitivity to pollution. The index used was the following:
Biological Monitoring Working Party (BMWP): The BMWP index was initially developed for European rivers but applied in multiple countries worldwide, including England, Colombia, Chile, and the Iberian Peninsula [
19]. To use this index, macroinvertebrates are classified at the family level, and each organism is assigned a corresponding value based on its tolerance to pollution. Highly susceptible families receive a score of 10, while more resistant families are given a score of 1. Therefore, the more excellent the resistance to pollution, the lower the BMWP score. At the end of the process, the values of all identified families are summed, and their presence is weighted. The BMWP was used as a complementary index to assess overall ecosystem conditions by assigning sensitivity scores to identified taxa [
20].
Andean Biological Party (ABI): The ABI is an adaptation of the BMWP-R [
21,
22], designed explicitly for rivers located at altitudes above 2000 m in the high Andean regions of Ecuador and Peru. Its application process remains the same: various scores are assigned to macroinvertebrate families in a given location to calculate a definitive value that reflects the ecosystem’s overall health. The ABI was applied explicitly due to its adaptation to high-altitude Andean rivers, where it effectively differentiates pollution levels based on macroinvertebrate tolerance scores.
Shannon Diversity Index: Diversity analyses of the interaction between the number of species present and their abundance within a community. Diversity indices are calculated using statistical software. The Shannon Index was selected to measure species richness and evenness, providing insights into community structure.
2.5. Methodology for Statistical Data Processing
The RStudio software was used to perform statistical processing of the data obtained in the laboratory for water (flow rate) and sediment analysis (percentage of organic matter), creating a time series that provided insights into how the check dams would function in the future. The percentage of organic matter is the variable that allows us to verify the quality of the sediment to maintain aquatic life. If we assume that the variances of the two groups (flow rate before and after the installation of the check dams) are equal, we will apply Student’s
t-test (also known as a two-sample
t-test with equal variances). This test compares the means of two independent samples when the assumption of equal variances holds. In hydrology, it is expected to assume that the variance of streamflow remains stable (i.e., homogeneous) across different periods, especially in statistical analyses that seek to maintain a stationary framework for hydrological data [
23]. Flow measurements were carried out before installing the check dams in 2021 [
17], and measurements were carried out after installing the dams in 2023 [
24].
To assess the statistical significance of the observed changes in water and sediment quality, we applied a two-sample Student’s t-test for paired data, comparing pre- and post-installation measurements of key parameters, including pH, electrical conductivity, organic matter content, and flow rate. This test was chosen due to its robustness in detecting mean differences between two related datasets while accounting for natural variability. Normality and variance homogeneity assumptions were verified using the Shapiro–Wilk and Levene’s tests. In addition, an estimation of sediment carbon storage was performed based on organic matter accumulation.
2.6. Methodology for Determining the Location of New Check Dams
The terrain of the Urku Huayku ravine was simulated using the QGIS software, highlighting strategic points where new dams could be placed to perform the same function as the existing ones and better counteract erosion in this sector. QGIS provided general parameters of the Urku Huayku ravine. The watershed was generated from contour lines taken at the site, and the hypsometric curve was created to characterise the channel along with the altimetric frequency histogram to show the steep slopes. QGIS software can analyse spatial data using spatial databases and other OGR-compatible formats. Currently, QGIS offers tools for vector analysis, raster analysis, sampling, geoprocessing, geometry, and database management.
3. Results
Before installing the check dams, measurements in the water were made and are presented in the following table (
Table 3) [
25]:
3.1. Water Analysis Results
The measurements in the water were compared with the quality criteria for preserving aquatic and wildlife life established in Ecuadorian regulations [
18]. Of the 16 pH results obtained, check dam 1 averaged 7.05, check dam 2 had an average of 7.08, and check dam 3 showed an average pH of 6.86. The range of Ecuadorian water quality criteria for preserving aquatic and wildlife is 6.5–9 of pH (
Table 2 of Ministerial Agreement No. 097A). The water in the three check dams was characterised as neutral, with values close to 7 on the pH scale. The results are within the acceptable quality criteria.
The average EC result was 128.17 µS/cm for check dam 1, 126.66 µS/cm for check dam 2, and 123.81 µS/cm for check dam 3. These values fall within a normal range for natural waters. There are no criteria for CE in the Ecuadorian environmental norm. Studies indicate that a conductivity range of 150 to 500 µS/cm for streams and rivers supporting good mixed fisheries is often optimal [
26]. Values outside this range can suggest that water quality may not be suitable for certain fish and macroinvertebrate species.
The nitrate concentration is low (averaging 2.5 mg L
−1). This parameter is below the quality criterion (15 mg L
−1). A maximum concentration of 50 mg/L is a critical threshold for protecting aquatic ecosystems. Concentrations above this level can negatively impact biodiversity and ecosystem health due to increased nutrient loading, which can cause eutrophication [
27].
There are no criteria for sulphates in the Ecuadorian environmental norm. The results after laboratory analysis were meagre, averaging 3 mg L
−1. The British Columbia Ministry of Environment has established guidelines suggesting that sulphate concentrations should ideally be kept below 100 mg/L to protect freshwater aquatic life. However, higher levels may be tolerated depending on water hardness [
28].
There are no criteria for phosphate in the Ecuadorian environmental norm. The U.S. Environmental Protection Agency (EPA) recommends that total phosphorus concentrations in freshwater should not exceed 0.1 mg/L for streams that do not discharge into reservoirs [
29]. In this research, these values exceeded the recommended level, averaging 3.5 mg L
−1. However, no eutrophication processes have been observed in the check dams since the water is not kept in a reservoir.
The laboratory results for SS and TDS are within an acceptable range compared to historical TDS values, which averaged 96 mg/L. High-suspended solids can impair aquatic organisms by reducing light penetration, affecting photosynthesis in aquatic plants and phytoplankton. This can decrease oxygen levels as organic matter decomposes, negatively impacting fish and invertebrate populations. Maintaining low levels of suspended solids (generally below 30–35 mg/L) and TDS (ideally below 1000 mg/L) is crucial for preserving aquatic life and preventing negative ecological impacts [
30,
31].
In comparison with historical data, an average flow rate of 4.43 L/s was recorded in 2021, and during the sampling period in 2023, the average flow rate measured in situ over the 16 weeks was 5.79 L/s. The results of the two-sample t-test comparing the mean streamflow before and after the installation of the check dams suggest a statistically significant increase in the mean streamflow. The t-statistic is −1.8431 with 18 degrees of freedom, and the p-value is 0.04092, less than the commonly used significance level of 0.05. This indicates that we can reject the null hypothesis in favour of the alternative hypothesis, which posits that the mean streamflow after the check dam installation is more significant than before. The increase in the flow rate in the micro-basin was substantial, demonstrating the effective functioning of the check dam in increasing the water volume.
3.2. Sediments Analysis Results
If we consider sediments’ newly retained soils, Ecuadorian regulations establish that soil pH in good condition should be between 6 and 8. The results obtained from the check dams are in the range of 5.1 to 6.5. Most plants thrive in soil with a pH between 6.0 and 7.5. A pH of 6.5 is often considered ideal as it allows optimal nutrient availability and microbial activity, which are essential for plant growth [
32].
Water passing through the sediment carries away essential nutrients like calcium and magnesium. In return, acidic elements like aluminium and iron are incorporated. The use of fertilisers containing ammonium or urea compounds accelerates soil acidification. Additionally, the decomposition of organic matter also contributes to increased acidity [
33]. Another reason for the moderate acidity is the presence of iron sulphate in the micro-basin. The pH of this compound has values below 7, and when mixed with the soil, it acidifies it.
Electrical conductivity is affected by various soil factors, such as moisture, porosity level, texture, and organic matter content [
34]. All the results obtained are below 200 µS cm
−1, interpreted as sediments with negligible salinity effects.
The organic matter results obtained through the calcination method range from 1% to 5%. In 2021, a soil sample was taken from the Urku Huayku micro-basin, and, upon analysis, the average percentage of organic matter was 0.2% [
17], indicating the low amount found in volcanic soils.
The two-sample t-test results show a statistically significant increase in the percentage of organic matter in the sediments of the ecological dams after their installation. The test was applied assuming equal variances, as verified by Levene’s test for homogeneity of variances, which confirmed that the data met the assumption required for parametric analysis. The t-statistic is −4.7389 with a p-value of 0.0003967, indicating that the difference in means is highly significant at the 0.05 significance level. A 95% confidence interval further supports the substantial increase in organic matter. Before the installation, the mean organic matter concentration was 0.1925%, increasing to 3.2000% after installation. The Shapiro–Wilk test was used to check the data distribution’s normality, ensuring the t-test’s appropriateness. This significant rise suggests that installing check dams positively impacted organic matter accumulation in the sediments, improving soil quality.
Given that organic matter content increased from 0.2% to 3.2% over the study period and assuming that approximately 58% of organic matter corresponds to organic carbon (based on conversion factors from the previous literature), the estimated carbon storage in the retained sediments is approximately X kg C/m3. I have added an estimation of sediment carbon storage.
3.3. Biological Analysis Results
In the samples taken before the check dams were installed, a total of 81 individuals were found, belonging to 2 classes (Malacostraca and Insecta), distributed across six families (Hyallelidae, Elmidae, Philosciidae, Tipulidae, Hydropsychidae, and Chyronomidae). The Shannon index was used to identify the biodiversity present in the area based on the macroinvertebrate families. The upper area had a higher presence of macroinvertebrate families, with a Shannon index of 0.8759, compared to the lower area, which had a score of 0.7354, indicating greater diversity. The ABI and BMWP indices found that water quality was critical in the samples from both regions, as they fell within the range of polluted waters. Therefore, it can be said that the ecosystem in the study area was deteriorated and altered.
In the samples taken after the installation of the check dams, 369 individuals were found, belonging to five classes (Insecta, Malacostraca, Gastropoda, Oligochaeta, and Crustacea) and distributed across nine families (Hyallelidae, Elmidae, Philosciidae, Planorbidae, Tubificidae, Tipulidae, Hydropsychidae, Libellulidae, and Chyronomidae).
Check dam 3, located in the lower area, had the highest score for macroinvertebrate families, with a Shannon index of 1.3, surpassing check dam 2 with 1.24 and check dam 1 with 0.48. This means that check dam 3 presented greater diversity. This is due to the stream’s flow and climatic factors that altered the flow on the sampling day. The ABI and BMWP indices found that the water quality remained critical in the samples from the three check dams, although biodiversity had increased significantly.
After the check dams were installed, the number of identified individuals grew from 81 to 369, representing a 355.6% increase. New families of macroinvertebrates with higher scores are expected to continue to appear. Consequently, the water quality index will improve, proving the ecosystem is recovering.
The analysis of macroinvertebrate indices revealed a notable increase in biodiversity following the installation of check dams, suggesting an improvement in habitat quality and ecosystem recovery. The Shannon Diversity Index (H’) showed a significant rise, particularly at check dam 3, which exhibited the highest species richness and evenness. This indicates that check dams contributed to more significant habitat heterogeneity and resource availability. Similarly, the Andean Biotic Index (ABI) and Biological Monitoring Working Party (BMWP) scores reflected an ecological shift towards improved water quality, as evidenced by the increase in pollution-sensitive taxa.
3.4. Results of New Areas for Check Dam Installation
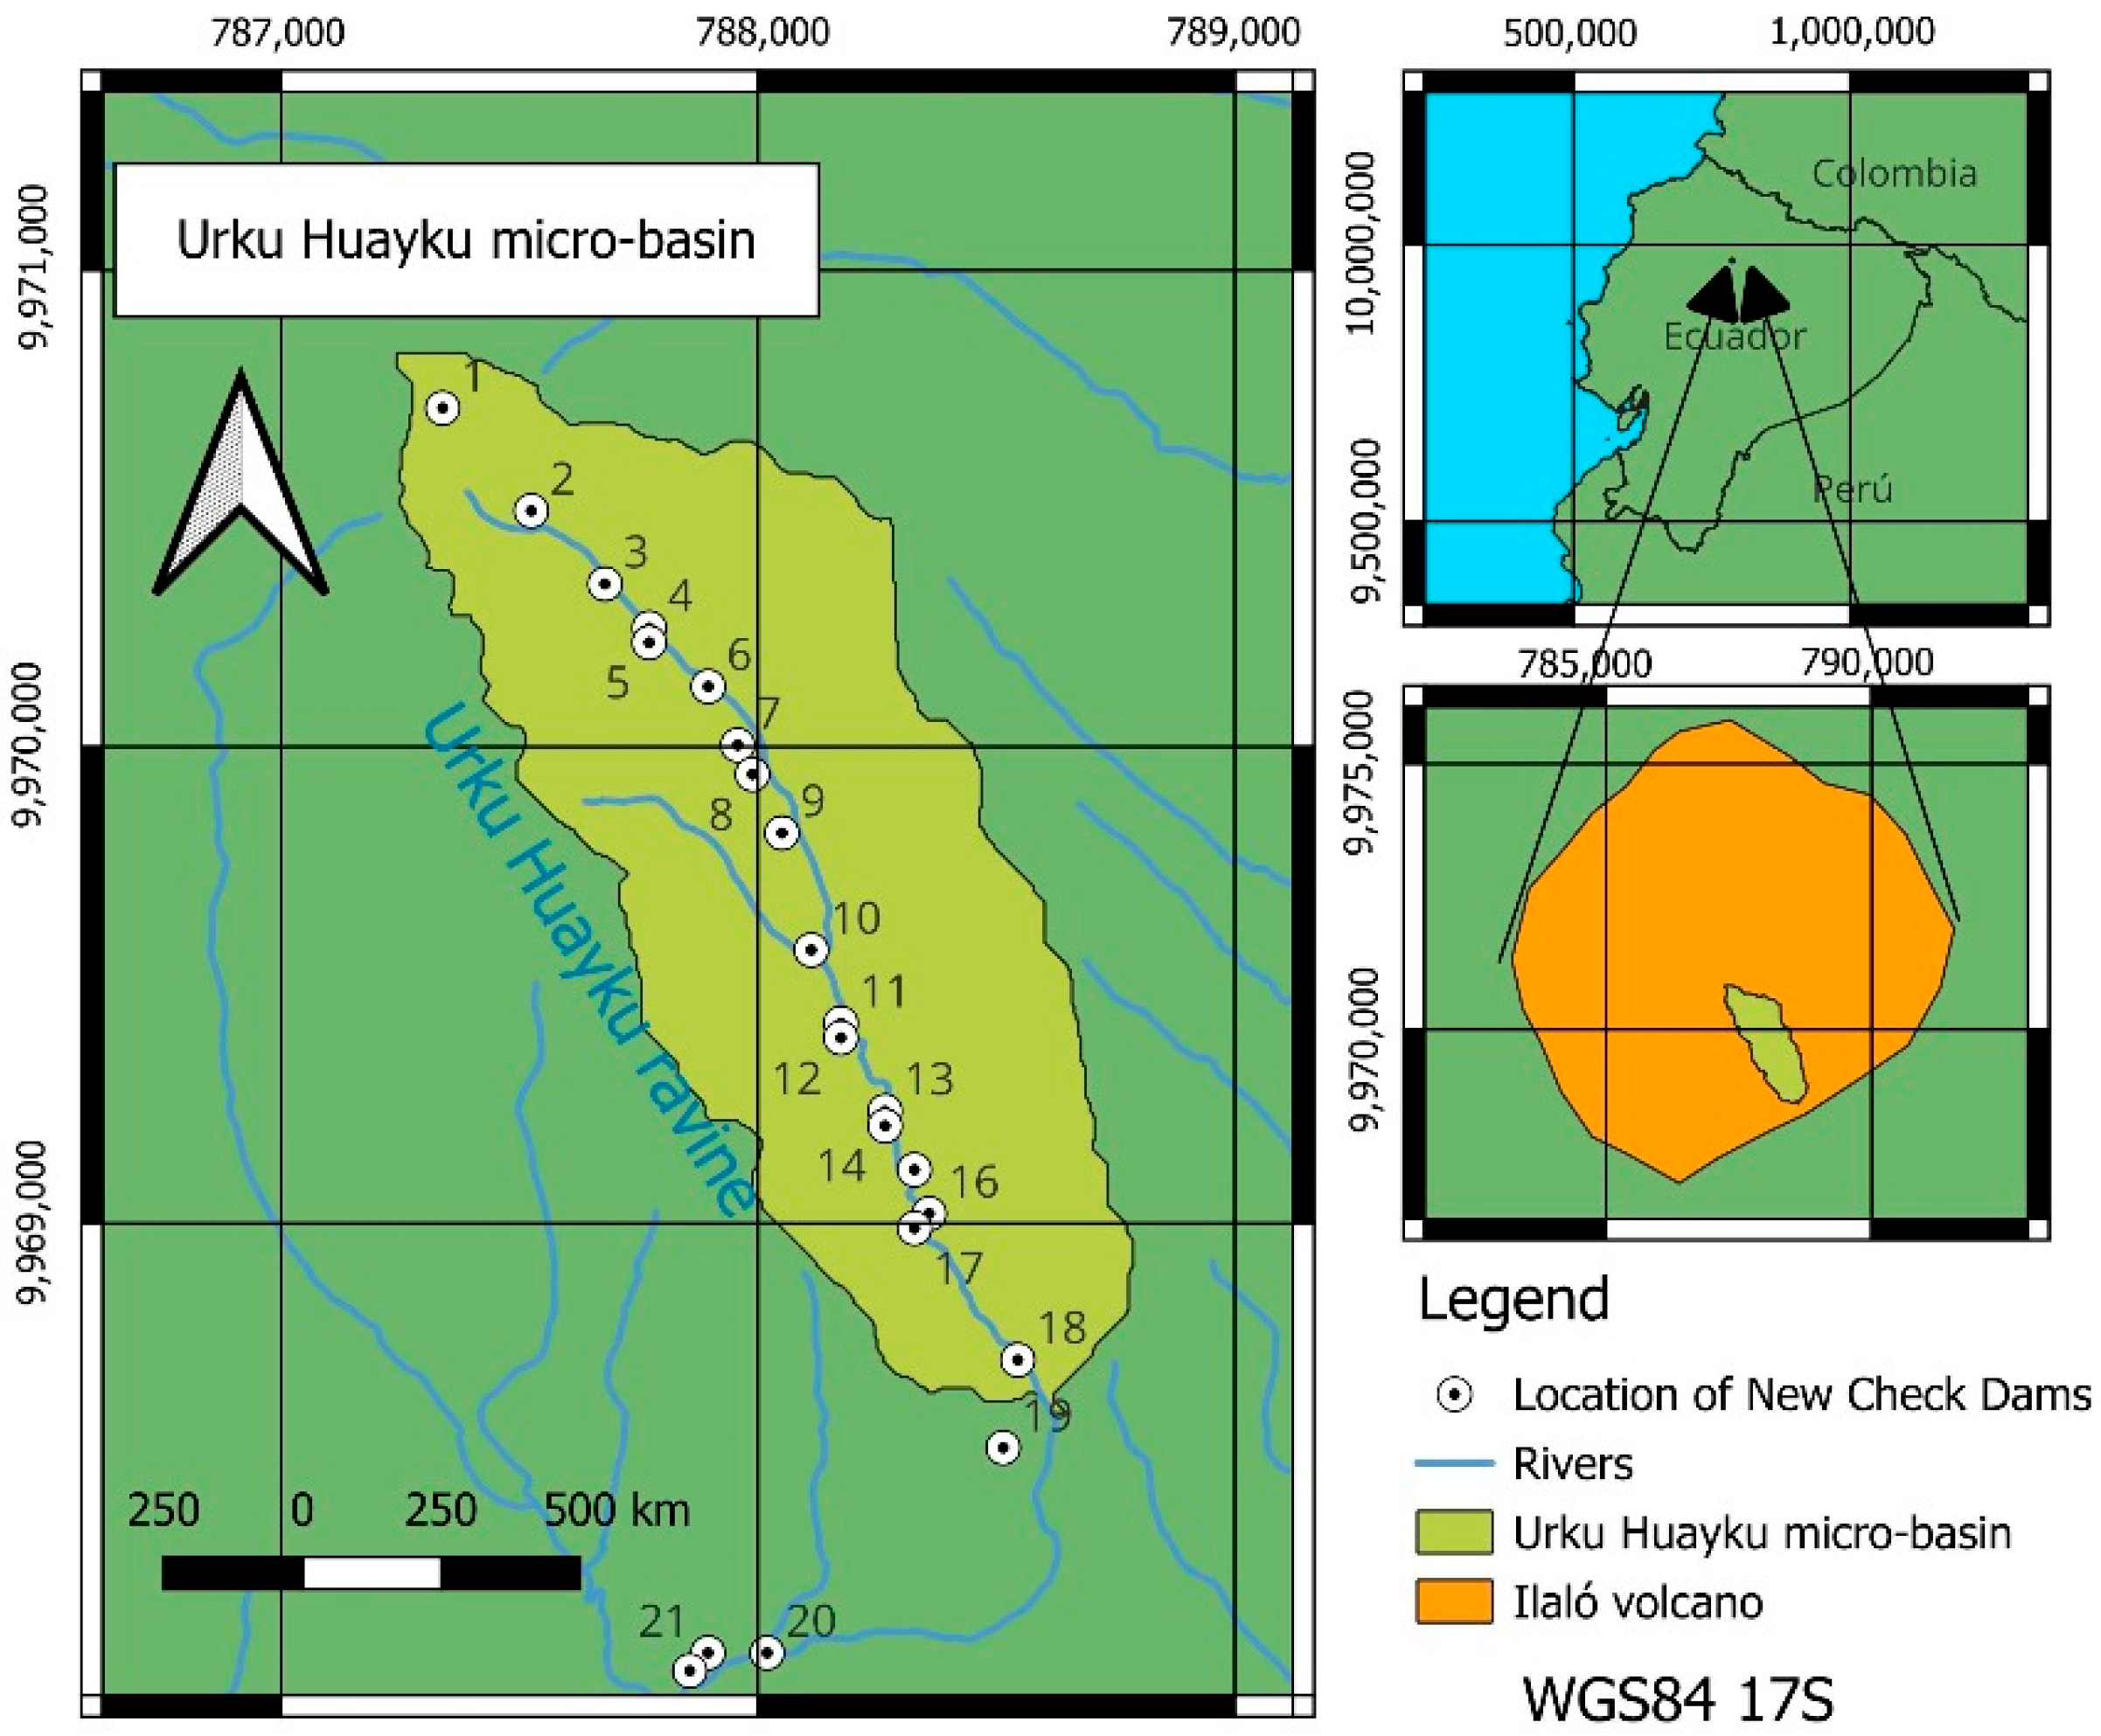
After modelling the Urku Huayku micro-basin using the free QGIS software, it was segmented into sections, as shown in
Figure 3. The elevations and horizontal distances of the sections of the Urku Huayku micro-basin were identified to calculate the slope percentage.
The segments 7, 8, 9, and 13 present the steepest slopes, with values of 28%, 31%, 29%, and 26%, respectively, as shown in
Table 4.
4. Discussion
Check dams help reduce a flood’s peak flow and total volume in the basin and increase the flood duration [
32]; however, with this work, we analyse another parameter contributing to the soil, water, and biodiversity quality. The implementation of check dams proved to be an effective method for recovering soil and water in a degraded watershed, as they control the erosive process and intercept sediments that stabilise eroded slopes. Additionally, this intervention results in a reduction in the slope and regulation of water flow.
While this study demonstrates the effectiveness of check dams in improving water and sediment quality, several limitations must be acknowledged. First, the monitoring period, although spanning three years, may not fully capture long-term hydrological and ecological changes, particularly in response to extreme weather events or seasonal variations. Second, the study focused primarily on macroinvertebrates as bioindicators of ecosystem health. Still, additional biological and physicochemical parameters, such as microbial communities or vegetation recovery, could provide a more comprehensive assessment. The understanding of the relationships between the ecosystem and NbS must be improved [
35]. Third, the research was conducted in a high-altitude Andean watershed, and while the findings suggest broader applicability, further studies are needed to validate the effectiveness of check dams in other climatic and geomorphological settings, such as coastal or arid regions. Finally, sediment accumulation behind check dams requires continuous monitoring to assess potential long-term impacts on water flow and habitat connectivity. Addressing these limitations in future studies will help refine the role of check dams as a scalable and sustainable nature-based solutions (NbS). Future research should explore their adaptability under different climatic and geomorphological conditions to optimise their design for broader environmental applications.
Check dams have been shown to effectively trap sediment, especially in areas with low vegetation coverage. In one study, the construction of check dams reduced sediment load by 12%, while vegetation restoration reduced 20.7% in runoff and 53.2% in sediment load [
36]. The accumulated sediments behind the dam serve as carbon storage, contributing to climate change mitigation. Furthermore, they create areas with higher nutrient richness, improving water quality, and generate flat surfaces due to sediment compaction, which are more resistant to erosion since the particles are more cohesive and less prone to being carried away by wind or water.
The accumulation of organic matter in sediments behind check dams plays a crucial role in carbon sequestration, contributing to climate change mitigation. In this study, the organic matter content in retained sediments increased from 0.2% to 3.2%, suggesting that check dams facilitate the deposition and stabilisation of organic carbon. Based on established conversion factors, where approximately 58% of organic matter corresponds to organic carbon, the estimated carbon storage potential in the study area highlights the capacity of these structures to act as localised carbon sinks. Similar findings have been reported in other NbS interventions, such as wetland restoration and riparian buffer zones, where sediment retention enhances long-term carbon storage. However, the permanence of this stored carbon depends on multiple factors, including sediment stability, microbial decomposition rates, and potential resuspension during extreme weather events. Future research should incorporate direct carbon flux measurements and long-term monitoring to assess the resilience of these carbon deposits over time. Additionally, integrating check dams into broader watershed management strategies could amplify their role in climate adaptation by reducing carbon loss from degraded landscapes and enhancing soil health at a regional scale. Expanded discussion on sediment carbon storage and climate implications. Discussed the broader impact of sediment retention in carbon sequestration.
Check dams are versatile tools for managing water resources, controlling floods, and reducing sediment transport. Their design and effectiveness depend on local environmental conditions and ongoing maintenance efforts to adapt to changing landscapes. They help manage torrents in mountainous regions, reducing erosion. By capturing runoff, they contribute to groundwater recharge and improve water availability for agricultural use. In areas prone to soil erosion, check dams play a crucial role in stabilising slopes and maintaining soil health [
37].
In this work, we chose macroinvertebrates like bioindicators. Check dams can significantly affect macroinvertebrate communities in river ecosystems, influencing their diversity, abundance, and overall ecological dynamics. Check dams significantly reduce sediment loads in rivers, which can alter habitats for aquatic organisms. Trapping sediments creates new habitats for various species but may also lead to the loss of natural sediment transport processes that many aquatic species rely on for spawning and feeding [
38,
39]. Check dams increase water retention in surrounding areas, enhancing moisture levels. This can promote the growth of vegetation, which supports terrestrial biodiversity by providing habitat and food sources for various organisms [
40,
41]. While check dams can create localised wetlands that support diverse plant and animal life, they may also disrupt the migration patterns of fish and other aquatic organisms. The alteration of flow regimes can affect breeding cycles and habitat availability for these species [
39,
42].
While check dams provide immediate benefits regarding sediment control and water retention, their long-term impacts on biodiversity require careful monitoring. Over time, sediment accumulation behind dams may alter local ecosystems in ways detrimental to certain species [
34]. The next step is to select another bioindicator of biodiversity, like spiders, that can provide information on the food chain and biodiversity. Spiders are dominant predators in terrestrial food webs and excellent bioindicators of habitat quality. Previous studies have estimated that, globally, spiders consume between 400 and 800 million metric tons of insects per year [
43], more significantly than insectivorous birds [
44]. Preliminary samples have already been taken at the check dams.
While check dams can enhance certain aspects of fluvial biodiversity through habitat creation and improved ecosystem services, they may also pose challenges by disrupting natural processes essential for sustaining diverse aquatic communities. Ongoing research is necessary to understand these dynamics fully and inform sustainable management practices.
Nature-based solutions (NbS), such as check dams, offer a sustainable alternative to traditional complex engineering approaches for erosion control and water management. Unlike concrete barriers or large-scale drainage systems, which often disrupt natural hydrological processes and require extensive maintenance, NbS work with ecosystem dynamics to enhance resilience and biodiversity. Studies such as Marino et al. (2025) [
9] and Chen et al. (2024) [
45] have demonstrated that NbS, including vegetated barriers and sediment traps, can be equally or more effective than conventional methods in mitigating erosion and improving water retention in coastal and riverine environments. Additionally, NbS provide co-benefits such as carbon sequestration, habitat restoration, and climate adaptation, making them a more holistic approach to environmental management. However, while NbS are cost-effective and environmentally friendly, their long-term success depends on site-specific conditions and continuous ecological monitoring. Future studies should further assess the comparative performance of NbS and traditional infrastructure under different climatic and geomorphological contexts to optimise their implementation at a larger scale. The NbS should not focus on recovering a single ecosystem; it should take a more comprehensive approach.
5. Conclusions
Due to soil erosion and human activities, the Ilaló volcano exhibits apparent deterioration of its slopes and water zones. This phenomenon promotes the exposure of cangahua, a type of volcanic soil characterised by low fertility.
The analysed water samples had an average pH of 7.06, indicating that the water flowing through the micro-basin is neutral. The average electrical conductivity was 126.23 μS cm−1, meaning it is water with low salinity. The average flow rate obtained from the 16-week analysis from April to July 2023 was 5.79 L/s, higher than the value recorded in 2021 at the time of dam installation. Phosphates were the only parameter above the limits allowed by Ecuadorian regulations.
From the installation of the dams in 2021 until 2023, it has been estimated that check dam 1 has accumulated approximately 6.19 m3 of sediment, check dam 2 around 5.8 m3, and check dam three about 4.88 m3.
The analysed sediment samples had an average pH of 5.9, indicating that these sediments are moderately acidic. The average electrical conductivity value is 91 μS cm−1, which has negligible salinity effects. The apparent density determined that the sediment is loamy mainly, as it is primarily composed of sand, silt, and a smaller amount of clay. The average absolute density was 2.26 g/cm3, close to most soils’ typical density. The deeper samples present higher density values due to sediment compaction. Regarding the organic matter, the average was 3.2%, which, although low, reflects the positive impact of the dams, as, before their installation in 2021, the organic matter percentage was 0.2%.
The biological quality analysis indicated that 81 individuals were identified in 2021; in 2023, this number increased to 369, representing a 355.6% increase.
It has been verified that both the quantity and quality of water and sediments, as well as biological quality, have improved after the implementation of the dams. Although the quality cannot yet be classified as optimal, it is observed that over time, the properties influencing quality are experiencing significant increases.
The optimal area for installing new dams is between elevations 2959 to 2807 and 2737 to 2729, as these areas have steeper slopes and a higher concentration of tributary streams.
Guadua cane containment dams have been demonstrated to be effective, economical, and ecological structures that control soil erosion and preserve water resources.
Future research should focus on evaluating the long-term performance of check dams in sediment retention, biodiversity enhancement, and carbon sequestration under different climatic and geomorphological conditions. Expanding the study to include additional bioindicators, such as riparian vegetation recovery and microbial community dynamics, would provide a more comprehensive understanding of ecosystem restoration processes. Furthermore, integrating remote sensing techniques and hydrological modelling could improve predictions of check dam efficiency across larger spatial scales. From a policy perspective, the findings of this study highlight the need to incorporate NbS into national and regional watershed management plans. Ecuador’s need to integrate this green infrastructure was included in response to climate change. Governments and environmental agencies should consider check dams as cost-effective, sustainable alternatives to traditional infrastructure, particularly in erosion-prone areas. Strengthening interdisciplinary collaboration between policymakers, researchers, and local communities will be essential to ensuring the long-term success and scalability of NbS interventions.


 ,
, 
