Abstract
The sustainable utilization of water resources plays a crucial strategic role in regional economic development. The water resources carrying capacity (WRCC) is a multifaceted system influenced by diverse factors, where the interplay among water resources, societal factors, economic conditions, and ecological elements collectively determines the overall WRCC. Combining relevant research results, this paper utilized an improved TOPSIS (Technique for Order Preference by Similarity to an Ideal Solution) and GRA (grey relational analysis)-based WRCC evaluation model, introduced the panel vector autoregressive (PVAR) model to analyze the effects of interactions among subsystems, and applied the geographically and temporally weighted regression (GTWR) model for the driving analysis of WRCC. Using Ningxia Hui Autonomous Region as a case study, this paper discusses the internal dynamic relationships and driving mechanisms of the WRCC system. It also provides a new perspective for discussing WRCC in water-scarce areas and provides novel approaches for optimizing water resource management and enhancing ecological protection. The results indicate that the water resources subsystem is central to the WRCC in Ningxia, with significant interconnections among the four subsystems. However, significant spatial and temporal heterogeneity is evident across different regions. The water resources system contributes significantly, with ecological development having a positive impact on water resources. However, social and economic development has a restrictive impact on water resources.
1. Introduction
Water resources are among the most vital natural resources on Earth, with an indisputable central role in ecosystems, human society, economic development, and global environmental regulation [1]. Research on this topic has increasingly become a critical area of contemporary global governance. As the global population grows, industrialization accelerates, and the impacts of climate change intensify, the gap between the demand and supply of water resources has become more acute. Achieving a balanced relationship between water resources, socio-economic development, and the ecological environment has become an urgent issue that requires resolution [2]. The WRCC is a “bottleneck” indicator that evaluates whether regional water resources can sustain the coordinated development of population, economy, and the environment. It is a crucial measure for assessing the sustainability of ecological environments, socio-economic systems, and water resources [3]. Therefore, exploring the intrinsic mechanisms of the carrying capacity system can help mitigate the water supply–demand conflict and promote sustainable social development.
In the field of WRCC evaluation, scholars have proposed numerous algorithms to study WRCC. For example, Xinguo Sun and his team developed the SD model to conduct a dynamic, stepwise evaluation of WRCC in Hebei Province [4]. Yangcheng Hu and colleagues evaluated WRCC in Jiangxi Province using principal component analysis (PCA) [5]. Cui Yi and his research team carried out a quantitative evaluation and analysis of the WRCC in the Yellow River irrigation region by employing dynamic difference coefficient set pair analysis [6]. Liu Yang and his research team performed a simulation analysis of the WRCC in the Hangbu River Basin by utilizing the system dynamics model alongside the TOPSIS approach [7]. The research methods for evaluating WRCC can be classified into the following categories: (1) Approaches like risk matrices and set pair analysis, which consider WRCC and its capacity indicators as uncertain systems; (2) techniques such as principal component analysis, projection pursuit, fuzzy matter element analysis, artificial neural networks, and logistic attribution models, which are employed to classify WRCC and assess capacity based on indicator data; (3) methods such as TOPSIS, which calculate the distance between the ideal optimal value and the deviation of indicator data, provide a comprehensive evaluation of carrying capacity. These approaches offer a rational framework for assessing WRCC under different conditions.
Scholars have conducted extensive research on the definition and evaluation of WRCC, yet some gaps remain. WRCC encompasses various subsystems, including social, economic, and ecological systems, and it is through the coordination and harmony between these subsystems that the WRCC level can be effectively enhanced. Studies on the internal mechanisms of WRCC are scarce, and related discussions are limited. Most of the existing literature calculates WRCC by constructing evaluation systems, but it often overlooks in-depth analysis of the influencing factors, which prevents these studies from providing more intuitive and targeted improvement suggestions for practical use. To address these gaps, this study utilized the Spatial PVAR model to analyze and capture the dynamic interactions among multiple variables, while accounting for individual heterogeneity [8]. This model integrates the dynamic characteristics of the traditional VAR model with the cross-sectional features of panel data, making it effective in capturing the dynamic interdependencies among different variables. In contrast to the VAR model, the PVAR model effectively addresses the issue of individual heterogeneity by using panel data. Due to the nature of panel data, the PVAR model does not require long time series, making it ideal for research that lacks extensive time series data [9]. The built-in Granger causality test and impulse response function can visually reflect the interactions between systems. In recent years, the PVAR model has seen broader applications and is no longer limited to the financial sector [9].
However, in the field of water resources, few studies have used the PVAR model to examine interactions between systems. Therefore, understanding how water resources, society, economy, and the ecological environment interact within the WRCC system is crucial [10]. Given the differences in natural conditions and development priorities across regions, the collaborative evolution process and driving mechanisms of WRCC may differ. Hence, it is essential to further investigate the dynamic interactions within regional WRCC systems to provide a foundation for sustainable development decision making [11].
This research focuses on examining the collaborative evolution of the components within the WRCC system and identifying the driving forces behind this process (Figure 1). The evaluation of the WRCC of Ningxia Hui Autonomous Region from 2010 to 2022 is based on carrying subjects and carrying objects. To eliminate errors associated with single weighting and improve the reliability of the weights, the Entropy-CRITIC method is utilized. TOPSIS is commonly used in WRCC evaluation; however, it overlooks the relationships between evaluation criteria, focusing solely on their proximity to the ideal solution. Meanwhile, GRA can capture the advantages, disadvantages, magnitude, and ranking of the evaluation criteria. To address these limitations, GRA is integrated with the TOPSIS method to enhance the evaluation of WRCC [12]. This study is the first to systematically analyze the dynamic interactions between subsystems in the WRCC of arid regions, emphasizing the dynamic impact of the water resources subsystem on WRCC. Given the spatiotemporal heterogeneity of the research topic, the GTWR model is employed to explore the driving mechanisms behind the coordinated evolution of WRCC. Unlike the traditional GWR model, GTWR overcomes the limitations of addressing temporal heterogeneity, offering a more comprehensive understanding of the complex spatiotemporal dynamics in the Ningxia region [13]. Based on the driving factor analysis from GTWR, this study delves into the mechanisms driving the collaborative evolution of WRCC. It provides a theoretical foundation for the sustainable management of water resources in the Ningxia Hui Autonomous Region and recommends practical policy strategies to improve the regional WRCC.
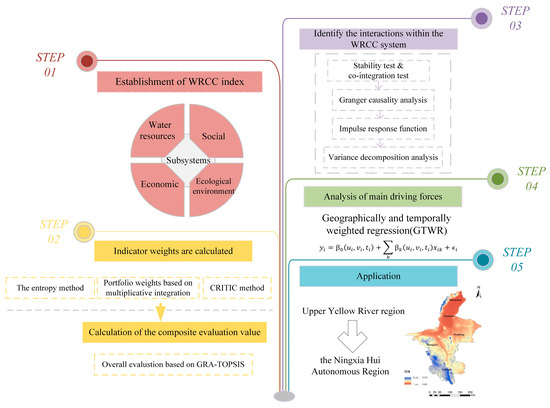
Figure 1.
The schematic of the research methodology for WRCC index establishment and analysis.
2. Materials and Methods
2.1. Study Area and Date
Located in the northwest of China, the Ningxia Hui Autonomous Region covers an area of 66,400 km2, with geographic coordinates ranging from 35°14′ N to 39°23′ N and 104°17′ E to 107°39′ E (Figure 2). As of 2023, the region, which includes five prefecture-level cities, has a permanent population of approximately 7.29 million. Situated at the Inner Mongolia Plateau and the Helan Mountains, Ningxia occupies a unique and dynamic transitional zone. Its terrain slopes from southeast to northwest, creating a landscape pattern with alternating mountains, plains, hills, and deserts. The region is water-scarce, with an average total water resource volume of 112 million cubic meters per year. Each individual in the region has access to only 430 cubic meters of water annually [14]. The northwestern part of Ningxia is adjacent to the Tengger Desert and the Mu Us Desert, with a significant area of desertified land. According to the 2022 report from the National Forestry and Grassland Administration, Ningxia’s desertified land covers 17,600 km2, which constitutes 26% of the total area. In recent years, Ningxia has taken measures such as closing mountains for forest regeneration and artificial tree planting to address desertification. By 2023, the forest coverage rate in Ningxia has increased to 15.6%, a 3 percentage point improvement since 2015, but the ecological environment quality still needs improvement.
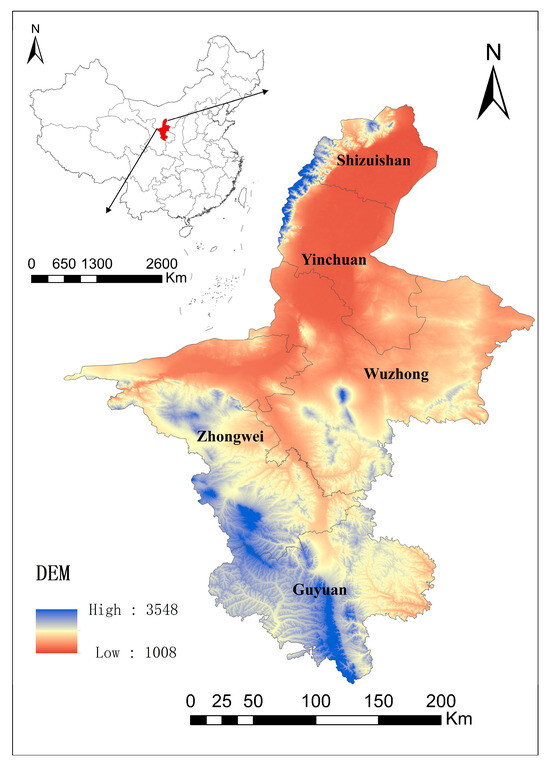
Figure 2.
Location of Ningxia Hui Autonomous Region in China.
This study draws on comprehensive statistical data from five cities within the Ningxia Hui Autonomous Region, covering the period from 2010 to 2022. The data encompass socio-economic, water resource, and ecological environmental dimensions. The socio-economic data were primarily sourced from the Ningxia Statistical Yearbook (https://www.nx.gov.cn/) (accessed on 15 October 2024), while water resource information was obtained from the Ningxia Water Resources Bulletin (https://slt.nx.gov.cn/xxgk_281/fdzdgknr/gbxx/szygb/) (accessed on 15 October 2024) and corresponding bulletins from various cities. Ecological environmental indicators were synthesized from relevant sections within both the statistical yearbooks and the water resource bulletins. In addition, some indicators are derived through the calculation and processing of raw data.
2.2. Subsystems of WRCC Evaluation
WRCC is a multifaceted and intricate system that encompasses various fields [15]. To accurately assess WRCC, it is essential to develop a scientifically rational indicator system [16]. For a thorough and balanced assessment of the WRCC system, it is crucial that the chosen indicators span all pertinent dimensions. Simultaneously, these indicators must strike a balance between being fully representative and avoiding redundancy, ensuring both clarity and precision in their selection. This study developed a WRCC evaluation indicator system, structured around four dimensions: water resources, economy, society, and the ecological environment. Building on this, by integrating domestic and international research outcomes and taking into account the characteristics of the study area and data availability [17], 21 representative evaluation indicators for the regional water resources, economy, society, and ecological environment subsystems were selected (Table 1).

Table 1.
WRCC indicator evaluation system.
2.3. Entropy-CRITIC Method
The entropy weight method and the CRITIC method are key weighting approaches in water resource carrying capacity analysis. The entropy weight method uses information entropy to reflect the variability of indicators, while the CRITIC method computes weights by considering both the dispersion and correlation of indicators through standard deviation and the correlation matrix. The integration of both methods enables a comprehensive evaluation of the differences and redundancies among indicators, enhancing the scientific distribution of weights and the accuracy of decision analysis, offering distinct advantages in complex decision-making contexts [18].
2.3.1. Entropy Method
The entropy weight method`s core principle lies in assigning weights according to the level of uncertainty associated with each indicator in the dataset. By quantifying the dispersion of values for each indicator, the method captures its relative significance within the system. A greater degree of dispersion signifies that the indicator conveys more information, thereby exerting a stronger influence on decision making, which justifies its assignment of a higher weight. Conversely, if the indicator values are relatively concentrated and the information entropy is higher, it indicates that the indicator has a smaller contribution in differentiating between evaluation objects and should be assigned a lower weight [19].
- (1)
- Step 1: Calculate the weight of the indicator .where represents the entropy value of the indicator.
- (2)
- Step 2: Compute the entropy value of the indicator.where represents the entropy value of the indicator.
- (3)
- Step 3: Calculate the entropy weight of the indicator.where represents the entropy weight of the indicator.
2.3.2. CRITIC Method
The CRITIC method evaluates the significance of each criterion in decision making by analyzing the intensity of contrasts and the correlations between the criteria [20]. It does not require the decision-maker’s subjective judgment and is applicable when there are significant correlations or conflicts between criteria.
- (1)
- Step 1: Calculate the standard deviation of the indicator.where represents the average deviation of data points around the meaning.
- (2)
- Step 2: Calculate the correlation coefficient and conflicts between indicators.where denotes the correlation coefficient between indicators, and indicates the conflict between indicators.
- (3)
- Step 3: Calculate the weight of the indicator.where represents the amount of information.
2.3.3. Combined Weight
By applying the geometric mean method, the weights from both methods are combined, balancing the effects of different weight sources. This allows the final weights to reflect both the objectivity of the data and the interrelationship between the criteria. It balances the influence of factors, preventing excessive emphasis on any specific weight, in contrast to the multiplicative method [21]. Furthermore, this study normalizes the calculation of the combined weights.
2.4. GRA-TOPSIS Method
The TOPSIS method is a decision-making technique that evaluates and ranks alternatives by calculating the distances from ideal and negative ideal points [22]. This approach focuses exclusively on the distances to these idealized solutions, overlooking the relative correlations among the alternatives. Grey relational analysis (GRA) measures the similarity between alternatives and the ideal solution by calculating the grey relational degree, overcoming the limitations of the TOPSIS method, which only uses distance-based calculations [23]. This approach improves the precision and reliability of decision making, offering a more thorough assessment of the strengths and weaknesses of each alternative [12].
- (1)
- Step 1: Construct the decision matrix.
- (2)
- Step 2: Determine the positive and negative ideal solutions of the indicators. The ideal values for evaluating the relative merits of different indicators.
For positive ideal solution
For negative ideal solution
- (3)
- Step 3: Calculate the Euclidean distance of each indicator object from the positive and negative ideal solutions. The Euclidean distance reflects the difference between the indicators and the ideal solution, aiding in the evaluation of the performance of each indicator.
- (4)
- Step 4: Calculate the grey relational coefficient. The gray relational coefficient reflects the degree of similarity between each alternative and the ideal solution, offering a comprehensive ranking of their advantages and disadvantages.where is the minimum difference between the two levels; is the maximum difference between the two levels; ρ is the decomposition factor, ρ ∈ [0, 1] (in our study, ρ = 0.5).
- (5)
- Step 5: Calculate the grey relational degree.
- (6)
- Step 6: Dimensionless treatment of formulas.where is ; is .
- (7)
- Step 7: Calculate relative closeness.where are the deviation coefficients, indicating the evaluator’s level of bias. For . In this study, = 0.5 and = 0.5.
2.5. PVAR Model
Building upon the analysis of the overall WRCC, the PVAR model is applied to explore the long-term interactions and dynamic relationships among the sub-systems of WRCC. This model extends the VAR framework to panel data, accounting for both individual fixed effects and temporal effects. To further investigate the interdependencies between variables, methods such as impulse response analysis and variance decomposition are employed. By treating all variables as endogenous, this approach provides a comprehensive assessment of each variable’s influence, including its lagged effects, and highlights their impact on other factors within the system [24]. The process is illustrated in Figure 3.
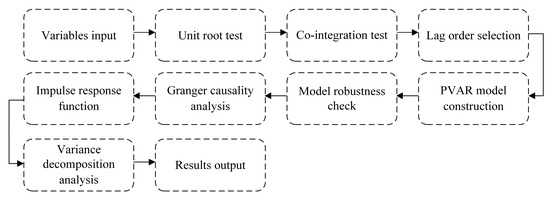
Figure 3.
Steps for building the PVAR model.
This research employed the PVAR model to analyze the dynamic interactions within the WRCC system of the Ningxia Hui Autonomous Region. The model was built using development indicators from the water resources, economic, social, and environmental subsystems within the WRCC framework as the study variables. It then analyzed the causal relationships and impulse response functions among the four subsystems from a statistical viewpoint.
The PVAR model is presented as shown in the equation:
where is the endogenous variable of city in year , consisting of the carrying capacities of the water resources subsystem (WAT), social subsystem (SOC), economic subsystem (ECO), and ecological environment subsystem (ENV). is the lag vector of ; represents the coefficient matrix to be estimated; is the vector representing individual fixed effects; is the vector for time fixed effects.
2.6. GTWR Model
The GTWR model is designed to simultaneously capture the heterogeneity of data in both spatial and temporal dimensions. In contrast to the traditional GWR model, the GTWR model expands upon it by enabling regression coefficients to change spatially and adapt to different time periods. By incorporating spatial and temporal weighting functions in the regression analysis, the GTWR model can more accurately capture the variations in the data across different locations and time points [25].
The mathematical equation of the GTWR model is represented as
where is the dependent variable at point ; represent the spatiotemporal coordinates of point ; is the spatiotemporal intercept term; is the value of the explanatory variable at point ; represents the random error term; is the regression coefficient for the explanatory variable at point .
3. Discussion
3.1. GRA-TOPSIS
3.1.1. Calculation of Combined Weight
Figure 4 shows the weight distribution characteristics of the 21 indicators. It is evident that indicators like “precipitation”, “industrial waste recycling”, and “per capita water resources” are crucial influencing factors in the evaluation, highlighting the current emphasis on resource supply, environmental pollution control, and water use efficiency in water resource carrying capacity assessments. In comparison, some socio-economic indicators have lower weights, suggesting that their direct influence in the evaluation is limited, with a greater focus on reflecting the impact of economic and social factors through indirect channels.
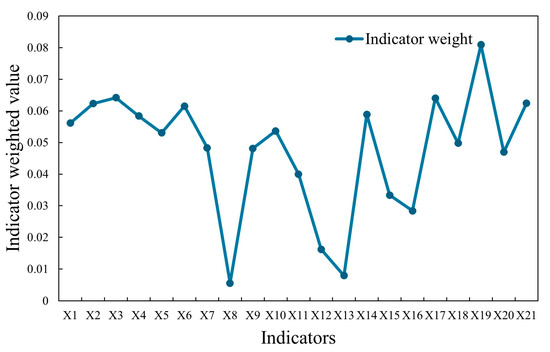
Figure 4.
Indicator weight results.
3.1.2. Interannual Variability Features
Figure 5 displays the changes in WRCC across five cities in Ningxia from 2010 to 2022. Overall, the WRCC levels in these five cities exhibit some fluctuation, without a distinct upward or downward trend. Notably, driven by improved water use efficiency and ecological environment enhancement, Zhongwei’s WRCC value grew the fastest, reaching an increase of 8.0% by 2022. Guyuan follows with a growth rate of 7.5%. In comparison, the WRCC values in Yinchuan, Shizuishan, and Wuzhong all declined in 2022, with decreases of 4.3%, 7.4%, and 1.8%, respectively.
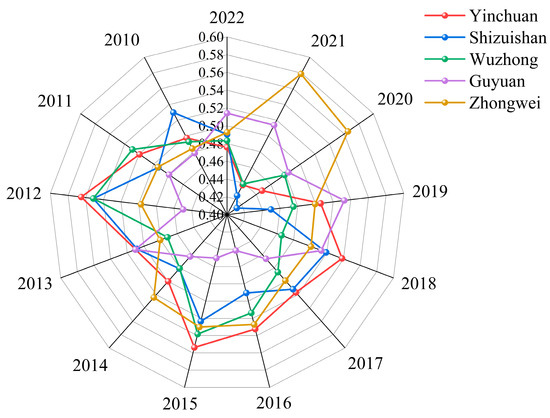
Figure 5.
WRCC levels across different cities.
3.2. PVAR Analysis
3.2.1. Stability Test and Co-Integration Test
To build an effective PVAR model, it is necessary to perform unit root tests on the panel data first, in order to evaluate whether the model variables are stationary [26,27]. The homogenous unit root test methods selected were HT, Breitung, and LLC, while the heterogeneous unit root test methods chosen were IPS, ADF-Fisher, and PP-Fisher. The specific results are presented in Table 2. The original WAT series passed all six unit root tests at both 5% and 1% significance levels. In contrast, the original SOC series failed all unit root tests. The original ECO series passed the LLC test only at the 5% significance level. The initial ENV series did not pass the ADF-Fisher test. After the first differencing, the variables DWAT, DSOC, DECO, and DENV passed the test at the 1% significance level. This indicates that the original variable series exhibited a unit root but became stationary after first differencing. Therefore, further cointegration analysis of variables such as WAT, SOC, ECO, and ENV is necessary to determine whether a long-term cointegration relationship exists among the WRCC subsystems in the Ningxia Hui Autonomous Region.
Table 2.
Results of unit root test.
When unit root test results show that each time series is non-stationary, cointegration analysis must be conducted to identify the stationary linear combinations between the time series in order to reveal the long-term dynamic equilibrium relationships between the variables [28]. This study applied several cointegration methods, including the Westerlund test, the heterogeneous Pedroni test, and the homogeneous Kao test (Table 3). Among the three methods, the relationships between WAT and SOC, WAT and ECO, WAT and ENV, and ECO and ENV all passed the significance tests. This indicates the existence of a long-term, stable cointegration relationship not only between water resources and the other three subsystems, but also between economic development and the ecological environment. On the other hand, while the relationships between SOC and ENV, as well as SOC and ECO, passed the Kao test and some Pedroni tests, they did not meet the criteria of the Westerlund test. This suggests that a cointegration relationship might exist between these two variables in specific cities.
Table 3.
Results of the co-integration test.
3.2.2. Granger Causality Test
To investigate the interactions and relationships among the variables, we applied additional techniques, including Granger causality tests, impulse response analysis, and variance decomposition, all within the framework of the PVAR model, under the assumption that the variable sequences are stationary [29]. The variable sequences of the four subsystems of Ningxia WRCC meet the requirements for constructing a PVAR model, so this model was applied to analyze the DWAT, DECO, DSOC, and DENV variable sequences.
At the 5% significance level, the water resources subsystem is the Granger cause of the ecological environment subsystem, and the ecological environment subsystem is the Granger cause of the economic subsystem. At the 10% significance level, the water resources subsystem is the Granger cause of the economic subsystem. Additionally, a significant Granger causality relationship was observed between the combined water resources, social, and ecological environment subsystems and the economic subsystem. However, no significant Granger causality relationship was detected between the other subsystems (Table 4).
Table 4.
Results of the Granger causality test.
3.2.3. Impulse Response Analysis
The panel impulse response is used to quantify the impact of a one-standard-deviation shock in an endogenous variable on both the current and future values of all endogenous variables [30]. Figure 6 illustrates the impulse response functions of DWAT, DSOC, DECO, and DENV under a one-standard-deviation impact. The x-axis represents different stages following the shock, while the y-axis depicts the dynamic responses of each variable to the shock. The corresponding analytical findings are as follows:
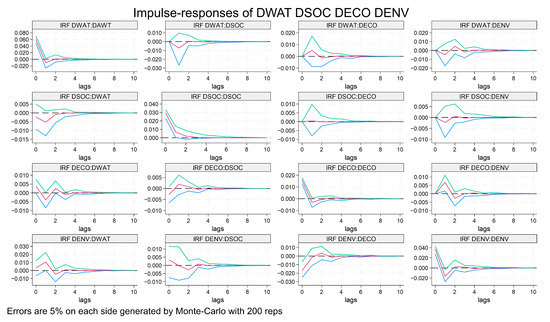
Figure 6.
Impulse response results. The red line represents the average response of the impact variable to the response variable, the range of the blue and green lines represents the 95% confidence interval.
(1) Each subsystem exhibited notable inertia in its operation. Initially, all subsystems showed a significant positive effect, but this influence gradually declined. Except for the social subsystem, the remaining subsystems experienced short-term negative impacts, stabilizing near zero after a four-period lag. This suggests that the development of each subsystem promotes itself to some extent, but this effect diminishes quickly over time, highlighting the system’s inherent self-reinforcement and adaptive mechanisms. (2) The water resources subsystem significantly influenced the other three subsystems. Typically, a one standard deviation shock to the water resources subsystem induced “V”-shaped and “inverted V”-shaped fluctuations in the responses of the subsystems, with stabilization occurring after four lag periods. (3) The impulse response of the social subsystem to the water resources subsystem initially showed a negative effect, which was followed by a gradual recovery. A similar negative effect was observed in the economic and ecological subsystems, although the shocks were less intense in these systems. (4) The economic subsystem’s response to the other three subsystems included both positive and negative reactions. The ecological subsystem first experienced a peak in its positive response, which then stabilized over time, typically after four lag periods. (5) The ecological subsystem’s negative response to the economic subsystem was most prominent at the present stage, gradually stabilizing thereafter. Its impact on the water resources subsystem first manifested as a positive peak, followed by subsequent fluctuations, eventually diminishing to near zero.
3.2.4. Variance Decomposition
The variance decomposition approach a applied to quantify the contribution of one subsystem to the fluctuations of other subsystems [31]. According to the variance analysis table, DWAT, DSOC, DECO, and DENV contributed the most to their own variance, yet they also exhibited some degree of explanatory power over one another. Apart from the subsystem’s contribution to itself, the variance contribution of the water resources subsystem ranked from highest to lowest DENV, DSOC, and DECO. The variance contribution of the social subsystem followed the order of DWAT, DENV, and DECO from highest to lowest. The variance contribution of the economic subsystem was ranked from highest to lowest as DWAT, DENV, and DSOC. The variance contributions of the ecological environment subsystem were ranked as follows: DWAT, DECO, and DSOC. Excluding the variance contribution of the water resources subsystem itself, DWAT contributed the most to the variance in the social, economic, and ecological environment subsystems, accounting for 3.6% and 14.6%, respectively.
3.3. Spatial Evolution Features
To analyze the spatial characteristics of WRCC and evaluate the levels of its four subsystems, this study applied the quantile method to classify WRCC into five levels, using 2011, 2016, 2020, and 2022 as representative years. The spatial distribution results were of each subsystem’s carrying capacity (Figure 7). In the water resources subsystem, the growth rate of plain cities was significantly higher than that of mountain cities. Particularly in the areas traversed by the Yellow River, regions like Yinchuan and Shizuishan, which face water scarcity, have seen remarkable improvements with the implementation of new policies that emphasize “water conservation first” in the modern water management system. In the social subsystem, the urbanization process in the northern region has advanced rapidly, with the urbanization rates in Yinchuan and Shizuishan reaching 81.74% and 79.7%, respectively, both notably higher than the provincial average of 66.34%. Regarding the ecological subsystem, the southern region benefits from more favorable natural conditions and is less impacted by human activities, leading to a higher ecological carrying capacity compared to the northern region. In the economic subsystem, the northern region outperforms the southern region. Yinchuan, as the fastest-growing city with the most favorable conditions for economic development in Ningxia, has a significant driving effect that has facilitated the development of surrounding cities. As a result, its overall economic carrying capacity is noticeably higher than that of the southern region.
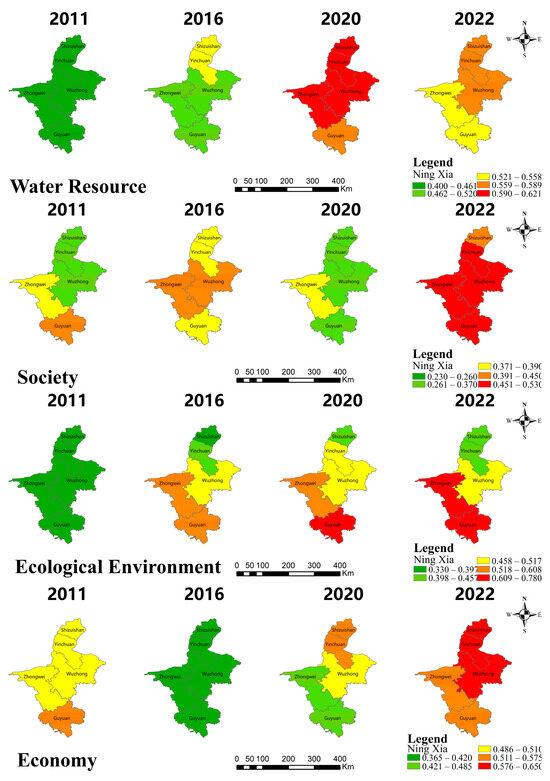
Figure 7.
Spatial distribution of subsystem driving strength in Ningxia’s cities.
Based on the GTWR model, we obtained the evolution of various driving forces (water resources, social, economic, and ecological environment subsystems) in the Ningxia Hui Autonomous Region. From an urban perspective, there are notable differences in the driving intensity across the different subsystems. (Figure 8). Between 2010 and 2022, the evolution of the main driving forces in the five cities of Ningxia was as follows: (1) The water resources subsystem in Shizuishan was consistently the main driving force, while the significance of the ecological subsystem steadily increased. (2) The water resources subsystem in Yinchuan remained the primary driving force, although the driving influences of the four subsystems were gradually approaching balance. (3) The water resources subsystem in Zhongwei continued to exert a strong influence, with the economic subsystem’s impact becoming increasingly significant. (4) In Wuzhong, the impact of the water resources subsystem gradually aligned with that of the other three subsystems, while the driving force of the ecological environment subsystem continued to increase. In Guyuan, except for the social subsystem, the differences in the driving intensity of the other subsystems were relatively small, with the driving force of the economic subsystem gradually becoming more prominent. The driving force characteristics of cities in Ningxia displayed notable regional variations, with the water resources subsystem maintaining a dominant position overall. This variability reflects the differences in natural resource availability and development priorities across regions.
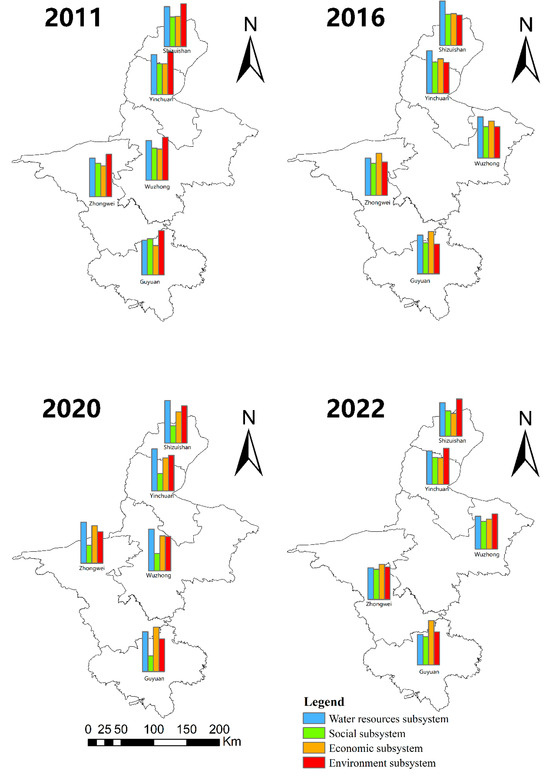
Figure 8.
Evolution of the driving contribution of subsystems in Ningxia’s cities.
3.4. Temporal Evolution of WRCC
A dynamic relationship exists between water scarcity and water resource carrying capacity. Research indicates that the development of water resource carrying capacity in Ningxia Autonomous Region is mainly restricted by water availability. Researchers have drawn the same conclusion in their studies on Ningxia [32]. Based on the per capita water resource indicator (Figure 9), Ningxia’s per capita water resources are approximately 153.8 cubic meters, well below the national average, and demonstrate a yearly decreasing trend. The scarcity of water resources directly reduces the region’s water carrying capacity, especially in areas where water availability is already constrained. As water volume decreases, the sustainable water supply capability of Ningxia faces significant threats.
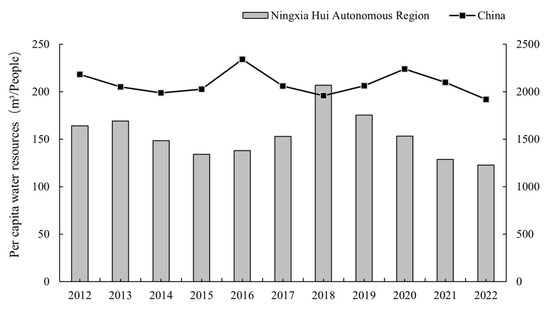
Figure 9.
Temporal dynamics of per capita water resources in Ningxia.
From a dynamic perspective, water scarcity is not only evident in the reduction of total volume but also in the uneven spatial distribution of water resources. In Ningxia, water resources are mainly concentrated along the Yellow River, while other areas experience significant shortages. This geographical imbalance further intensifies conflicts between varying regional demands. In recent years, Ningxia has reinforced its strategy for the ecological sustainability of the Yellow River, prioritizing the green economy, fostering high-quality development, and facilitating industrial restructuring. At present, ecological conservation has emerged as the key driver for enhancing water resource carrying capacity. Within this context, the impetus for ecological development must be further reinforced.
3.5. Dynamic Interactions Between WRCC Subsystems
In recent years, the PVAR has seen growing application in environmental science to analyze system interactions and inform cleaner production strategies [33]. The PVAR model exhibits strong potential in analyzing the interrelations among social, economic, and environmental subsystems within urban carrying capacity systems. Building on this model, time series variables for WRCC subsystems are developed using development indices, which are employed to uncover the complex dynamic interactions and reciprocal influences among water resources, the economy, society, and the ecological environment.
In the Ningxia Hui Autonomous Region, the water resources, social, ecological, and economic subsystems exhibit strong dynamic interconnections. As the core component of the WRCC system, the water resources subsystem maintains strong linkages with the economic, social, and ecological subsystems (Figure 10).
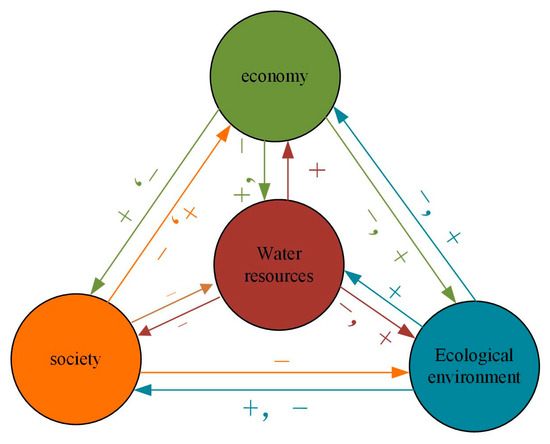
Figure 10.
Relationship diagram of subsystems.
Specifically, as Ningxia’s economy grows, the demand for water resources rises sharply, resulting in an economic system response that first exhibits positive fluctuations followed by negative impacts. This phenomenon is primarily driven by Ningxia’s location in the upper reaches of the Yellow River, where water resources are limited, and precipitation is unevenly distributed both temporally and spatially. The region’s rapid socio-economic development has significantly increased the demand for water, directly influencing the pace and scale of economic growth. At the same time, a well-preserved ecological environment exerts a lasting positive effect on economic growth. Economic progress relies not only on the availability of water resources but also on a sound ecological system, which facilitates high-quality development and significantly contributes to the sustainable expansion of Ningxia’s economy.
The delayed response of the social subsystem imposes a negative impact on economic growth. As population size increases and domestic water demand rises, the tension between water supply and demand worsens, hindering further economic development. In alignment with stringent water resource management policies, urbanization and heightened public awareness of water conservation have accelerated policy execution and wastewater treatment advancements, ultimately enhancing the efficiency of economic water consumption. However, the limited availability of water resources restricts uncontrolled population growth and economic expansion. The growing demand for domestic water use, to some extent, limits the allocation of water for economic activities.
On the other hand, the impact of economic growth on the water resources system follows a pattern of initial enhancement followed by suppression, suggesting that while economic expansion improves water resource utilization, it also intensifies resource stress. Despite improvements in water use efficiency due to economic advancement in Ningxia, both water consumption and wastewater discharge levels remain high, consequently leading to negative repercussions. The interaction between the ecological environment and water resources exhibits a two-way dynamic of mutual enhancement and constraint. While water resources serve as a foundational guarantee for ecosystems, environmental degradation adversely impacts the sustainable use of water. The advancement of the social subsystem imposes considerable strain on both water resources and the ecological environment, with population growth and economic expansion exacerbating resources and environmental pressures. Hence, achieving sustainable development in Ningxia necessitates reinforced water resource management and environmental conservation efforts to harmonize the dynamic interactions of the four subsystems, fostering a balanced relationship between regional economic growth and ecological stability.
3.6. Analysis of the Driving Mechanisms of WRCC
Between 2010 and 2022, Ningxia Hui Autonomous Region transitioned from water-resource-driven economic growth to eco-economic development. During the initial phase, the driving force behind WRCC development in Ningxia was mainly water resource and environmental development. During this developmental phase, Ningxia’s socio-economic landscape evolved rapidly, with 2010 marking the start of the second decade of the Western Development Strategy implementation. Urbanization underwent significant acceleration, with the urbanization rate exceeding 50% by 2013. Economically, Ningxia experienced steady growth in total economic output, accompanied by substantial transformations in its industrial structure. Efforts to shift development models and adjust the economic structure progressed rapidly, resulting in a more balanced industrial composition. This indicates that during this phase, water resource and ecological development exerted a stronger driving influence, while socio-economic forces played a comparatively lesser role. Analyzing the interactions among subsystems, socio-economic expansion somewhat constrained water resource utilization and ecological conservation, primarily due to its continued dependence on natural resource consumption and environmental occupation during this phase. As time progressed, WRCC development in Ningxia became increasingly centered on economic growth and ecological conservation, with economic expansion emerging as a key driving force. Especially during this period, the impact of social development as a driving force significantly diminished. At the same time, rapid population growth intensifies the pressure on water resources and the ecological environment, further strengthening the constraints on social development. Economic expansion continues to be the driving force behind WRCC development, sustaining its strong momentum. The positive effects of economic growth foster the efficient use of water resources and support ecological conservation efforts, ultimately enhancing the overall sustainability of WRCC. These findings are consistent with existing research conclusions [34].
In recent years, the driving force of the ecological environment has significantly increased, making it the primary driver of WRCC development in Ningxia. The momentum for ecological development has been steadily growing. Some studies highlight that changes in the quality of the ecological environment are essential for the stable development of the Loess Plateau [35]. The dynamic interaction between subsystems shows that ecological development positively influences the growth of water resources, society, and the economy, further emphasizing the importance of the ecological environment in WRCC development. Therefore, in the future, Ningxia must not only prioritize rapid economic and social development but also continuously enhance the driving role of ecological protection, thereby advancing WRCC.
4. Conclusions
To promote the coordinated development of the WRCC system, this study employed the improved TOPSIS-GRA method to assess WRCC, analyzed the dynamic interactions between WRCC subsystems using the PVAR model, and identified the driving and influencing factors of WRCC development through the GTWR model. The main conclusions are as follows:
- (1)
- The WRCC in Ningxia remained stable between 2010 and 2022, with all five cities maintaining moderate WRCC levels. In terms of spatial distribution, WRCC exhibited clustering patterns, with cities in the southern region showing increases, while cities in the northern part experienced varying degrees of decline. In terms of temporal changes, Guyuan City experienced the highest increase at 7.53%, followed by Zhongwei City with an increase of 1.78%. Wuzhong City, Yinchuan City, and Shizuishan City saw different degrees of decline, with decreases of 1.88%, 4.36%, and 7.46%, respectively.
- (2)
- The water resources subsystem is the key driving force behind WRCC and exhibits significant dynamic interactions with other subsystems. Ecological development enhances water resources, while social and economic progress exerts pressure on water resources.
- (3)
- The driving force of WRCC has transitioned from a “resource-dominated” model to an “ecology-first” approach. Initially, water resource-driven forces had a major impact on WRCC, but in recent years, the influence of ecological environmental forces has steadily increased.
However, this study has some limitations. In terms of time, it mainly focuses on the past and present WRCC, while future development trends require further exploration. The data used in this study are primarily from the Ningxia Hui Autonomous Region, which, although facing typical water scarcity issues, may limit the generalizability of the conclusions due to the focus on a single region. Future research could expand the data sources and conduct cross-regional comparative studies to examine the performance differences of WRCC in various types of regions, such as those with abundant or scarce water resources.
Author Contributions
Conceptualization, H.Z. and S.D.; methodology, H.Z.; software, S.D.; validation, S.D. and C.L.; formal analysis, H.Z. and S.D.; investigation, H.Z.; resources S.D.; data curation, H.Z.; writing—original draft preparation, H.Z.; writing—review and editing, H.Z. and S.D.; visualization, H.Z.; supervision, S.D. and C.L.; project administration, S.D. and C.L.; funding acquisition, S.D. and C.L. All authors have read and agreed to the published version of the manuscript.
Funding
This research was funded by National Key Research and Development Program of China (no. 2021YFC3201105).
Data Availability Statement
Data will be made available on request.
Conflicts of Interest
The authors declare no conflicts of interest.
References
- Kummu, M.; Guillaume, J.H.A.; de Moel, H.; Eisner, S.; Floerke, M.; Porkka, M.; Siebert, S.; Veldkamp, T.I.E.; Ward, P.J. The world’s road to water scarcity: Shortage and stress in the 20th century and pathways towards sustainability. Sci. Rep. 2016, 6, 38495. [Google Scholar] [CrossRef] [PubMed]
- Jia, Z.; Cai, Y.; Chen, Y.; Zeng, W. Regionalization of water environmental carrying capacity for supporting the sustainable water resources management and development in China. Resour. Conserv. Recycl. 2018, 134, 282–293. [Google Scholar] [CrossRef]
- Bu, J.; Li, C.; Wang, X.; Zhang, Y.; Yang, Z. Assessment and prediction of the water ecological carrying capacity in Changzhou city, China. J. Clean. Prod. 2020, 277, 123988. [Google Scholar] [CrossRef]
- Sun, X.; Peng, A.; Hu, S.; Shi, Y.; Lu, L.; Bi, A. Dynamic Successive Assessment of Water Resource Carrying Capacity Based on System Dynamics Model and Variable Fuzzy Pattern Recognition Method. Water 2024, 16, 304. [Google Scholar] [CrossRef]
- Hu, Y.; Yao, L.; Hu, Q. Evaluation of Water Resources Carrying Capacity in Jiangxi Province Based on Principal Component Analysis. J. Coast. Res. 2020, 105, 147–150. [Google Scholar] [CrossRef]
- Cui, Y.; Zhou, Y.; Jin, J.; Wu, C.; Zhang, L.; Ning, S. Quantitative Evaluation and Diagnosis of Water Resources Carrying Capacity (WRCC) Based on Dynamic Difference Degree Coefficient in the Yellow River Irrigation District. Front. Earth Sci. 2022, 10, 816055. [Google Scholar] [CrossRef]
- Liu, Y.; Gao, C.; Ji, X.; Zhang, Z.; Zhang, Y.; Liu, C.; Wang, Z. Simulation of water resources carrying capacity of the Hangbu River Basin based on system dynamics model and TOPSIS method. Front. Environ. Sci. 2022, 10, 1045907. [Google Scholar] [CrossRef]
- Zhang, J.; Chen, S.; Liu, H. Central bank communication, shadow banking, and bank risk-taking: Theoretical model and PVAR empirical evidence. PLoS ONE 2022, 17, e0275110. [Google Scholar] [CrossRef] [PubMed]
- Ochi, A.; Saidi, A. Impact of governance quality, population and economic growth on greenhouse gas emissions: An analysis based on a panel VAR model. J. Environ. Manag. 2024, 370, 122613. [Google Scholar] [CrossRef]
- Shao, Q.; Liu, X.; Zhao, W. An alternative method for analyzing dimensional interactions of urban carrying capacity: Case study of Guangdong-Hong Kong-Macao Greater Bay Area. J. Environ. Manag. 2020, 273, 111064. [Google Scholar] [CrossRef]
- Wang, T.; Jian, S.; Wang, J.; Yan, D. Dynamic interaction of water-economic-social-ecological environment complex system under the framework of water resources carrying capacity. J. Clean. Prod. 2022, 368, 133132. [Google Scholar] [CrossRef]
- Gulishengmu, A.; Yang, G.; Tian, L.; Pan, Y.; Huang, Z.; Xu, X.; Gao, Y.; Li, Y. Analysis of Water Resource Carrying Capacity and Obstacle Factors Based on GRA-TOPSIS Evaluation Method in Manas River Basin. Water 2023, 15, 236. [Google Scholar] [CrossRef]
- Du, Z.; Wu, S.; Zhang, F.; Liu, R.; Zhou, Y. Extending geographically and temporally weighted regression to account for both spatiotemporal heterogeneity and seasonal variations in coastal seas. Ecol. Inform. 2018, 43, 185–199. [Google Scholar] [CrossRef]
- Yue, C.; Qian, Y.; Liu, F.; Cui, X.; Meng, S. Analysis of Ningxia Hui Autonomous District’s Gray Water Footprint from the Perspective of Water Sustainability. Sustainability 2023, 15, 12638. [Google Scholar] [CrossRef]
- Xu, W.; Jin, J.; Zhang, J.; Yuan, S.; Tang, M.; Liu, Y.; Guan, T. Prediction of regional water resources carrying capacity based on stochastic simulation: A case study of Beijing-Tianjin-Hebei Urban Agglomeration. J. Hydrol.-Reg. Stud. 2024, 56, 101976. [Google Scholar] [CrossRef]
- Su, Y.; Xu, X.; Dai, M.; Hu, Y.; Li, Q.; Shu, S. A Comprehensive Evaluation of Water Resource Carrying Capacity Based on the Optimized Projection Pursuit Regression Model: A Case Study from China. Water 2024, 16, 2650. [Google Scholar] [CrossRef]
- Chen, Q.; Zhu, M.; Zhang, C.; Zhou, Q. The driving effect of spatial-temporal difference of water resources carrying capacity in the Yellow River Basin. J. Clean. Prod. 2023, 388, 135709. [Google Scholar] [CrossRef]
- Xu, W.; Jin, J.; Zhang, J.; Liu, Y.; Shu, Z.; Wang, G.; Bao, Z.; Liu, C.; Guan, T.; He, R. Evaluation and analysis of spatio-temporal variation of water resources carrying capacity and restraining factor: A case study in Anhui Province, China. Mitig. Adapt. Strateg. Glob. Chang. 2024, 29, 50. [Google Scholar] [CrossRef]
- Song, Q.; Wang, Z.; Wu, T. Risk analysis and assessment of water resource carrying capacity based on weighted gray model with improved entropy weighting method in the central plains region of China. Ecol. Indic. 2024, 160, 111907. [Google Scholar] [CrossRef]
- Krishnan, A.R.; Kasim, M.M.; Hamid, R.; Ghazali, M.F. A Modified CRITIC Method to Estimate the Objective Weights of Decision Criteria. Symmetry 2021, 13, 973. [Google Scholar] [CrossRef]
- Pavlacka, O. On various approaches to normalization of interval and fuzzy weights. Fuzzy Sets Syst. 2014, 243, 110–130. [Google Scholar] [CrossRef]
- Jia, G.; Li, S.; Jie, F.; Ge, Y.; Liu, N.; Liang, F. Assessing Water Resource Carrying Capacity and Sustainability in the Cele-Yutian Oasis (China): A TOPSIS-Markov Model Analysis. Water 2023, 15, 3652. [Google Scholar] [CrossRef]
- Ebrahimi, M.; Rahmani, D. A five-dimensional approach to sustainability for prioritizing energy production systems using a revised GRA method: A case study. Renew. Energy 2019, 135, 345–354. [Google Scholar] [CrossRef]
- Somosi, S.; Kiss, G.D.; Alam, S.M.T. Examination of carbon dioxide emissions and renewables in Southeast Asian countries based on a panel vector autoregressive model. J. Clean. Prod. 2024, 436, 140174. [Google Scholar] [CrossRef]
- Zhang, J.; Dong, Z. Assessment of coupling coordination degree and water resources carrying capacity of Hebei Province (China) based on WRESP2D2P framework and GTWR approach. Sustain. Cities Soc. 2022, 82, 103862. [Google Scholar] [CrossRef]
- Herwartz, H.; Wang, S. Statistical identification in panel structural vector autoregressive models based on independence criteria. J. Appl. Econom. 2024, 39, 620–639. [Google Scholar] [CrossRef]
- Xu, G.; Zhang, L.; Li, Z.; Huang, Z.; Jiang, H.; Marma, K.J.S. Exploring the Supporting Role of Finance in the Development of Clean Energy in China Based on the Panel Vector Autoregressive Model. Sustainability 2024, 16, 6258. [Google Scholar] [CrossRef]
- Aziz, A.; Memon, J.A.; Qader, A.A. Functional income distribution in Pakistan: Co-integration and vector error correction model analysis. Int. J. Financ. Econ. 2023, 28, 1081–1091. [Google Scholar] [CrossRef]
- Nhat Minh, P.; Toan Luu Duc, H.; Nasir, M.A. Environmental consequences of population, affluence and technological progress for European countries: A Malthusian view. J. Environ. Manag. 2020, 260, 110143. [Google Scholar] [CrossRef]
- Dong, Y.; Jin, G.; Deng, X. Dynamic interactive effects of urban land-use efficiency, industrial transformation, and carbon emissions. J. Clean. Prod. 2020, 270, 122547. [Google Scholar] [CrossRef]
- Charfeddine, L.; Kahia, M. Impact of renewable energy consumption and financial development on CO2 emissions and economic growth in the MENA region: A panel vector autoregressive (PVAR) analysis. Renew. Energy 2019, 139, 198–213. [Google Scholar] [CrossRef]
- Gao, H.; Liu, X.; Wei, L.; Li, X.; Li, J. Dynamic simulation of the water-energy-food nexus (WEFN) based on a new nexus in arid zone: A case study in Ningxia, China. Sci. Total Environ. 2023, 898, 165593. [Google Scholar] [CrossRef] [PubMed]
- Topcu, E.; Altinoz, B.; Aslan, A. Global evidence from the link between economic growth, natural resources, energy consumption, and gross capital formation. Resour. Policy 2020, 66, 101622. [Google Scholar] [CrossRef]
- Wang, X.; Bu, X.; Wang, J.; Du, L.; Hong, Z.; Shi, G.; Baqiatullah. Study on the coordination and factors affecting the coupling of resource and environmental carrying capacity and regional economy in ecologically fragile areas. Ecol. Indic. 2024, 167, 112656. [Google Scholar] [CrossRef]
- Huang, H.; Wang, R.; Wang, J.; Chai, J.; Xiao, Y. Temporal and spatial evolution and obstacle diagnosis of resource and environment carrying capacity in the Loess Plateau. PLoS ONE 2021, 16, e0256334. [Google Scholar] [CrossRef]
Disclaimer/Publisher’s Note: The statements, opinions and data contained in all publications are solely those of the individual author(s) and contributor(s) and not of MDPI and/or the editor(s). MDPI and/or the editor(s) disclaim responsibility for any injury to people or property resulting from any ideas, methods, instructions or products referred to in the content. |
© 2025 by the authors. Licensee MDPI, Basel, Switzerland. This article is an open access article distributed under the terms and conditions of the Creative Commons Attribution (CC BY) license (https://creativecommons.org/licenses/by/4.0/).