
Assessment of Low-Flow Trends in Four Rivers of Chile: A Statistical Approach
 , ,
, ,  , ,
, , 
Abstract
1. Introduction
2. Materials and Methods
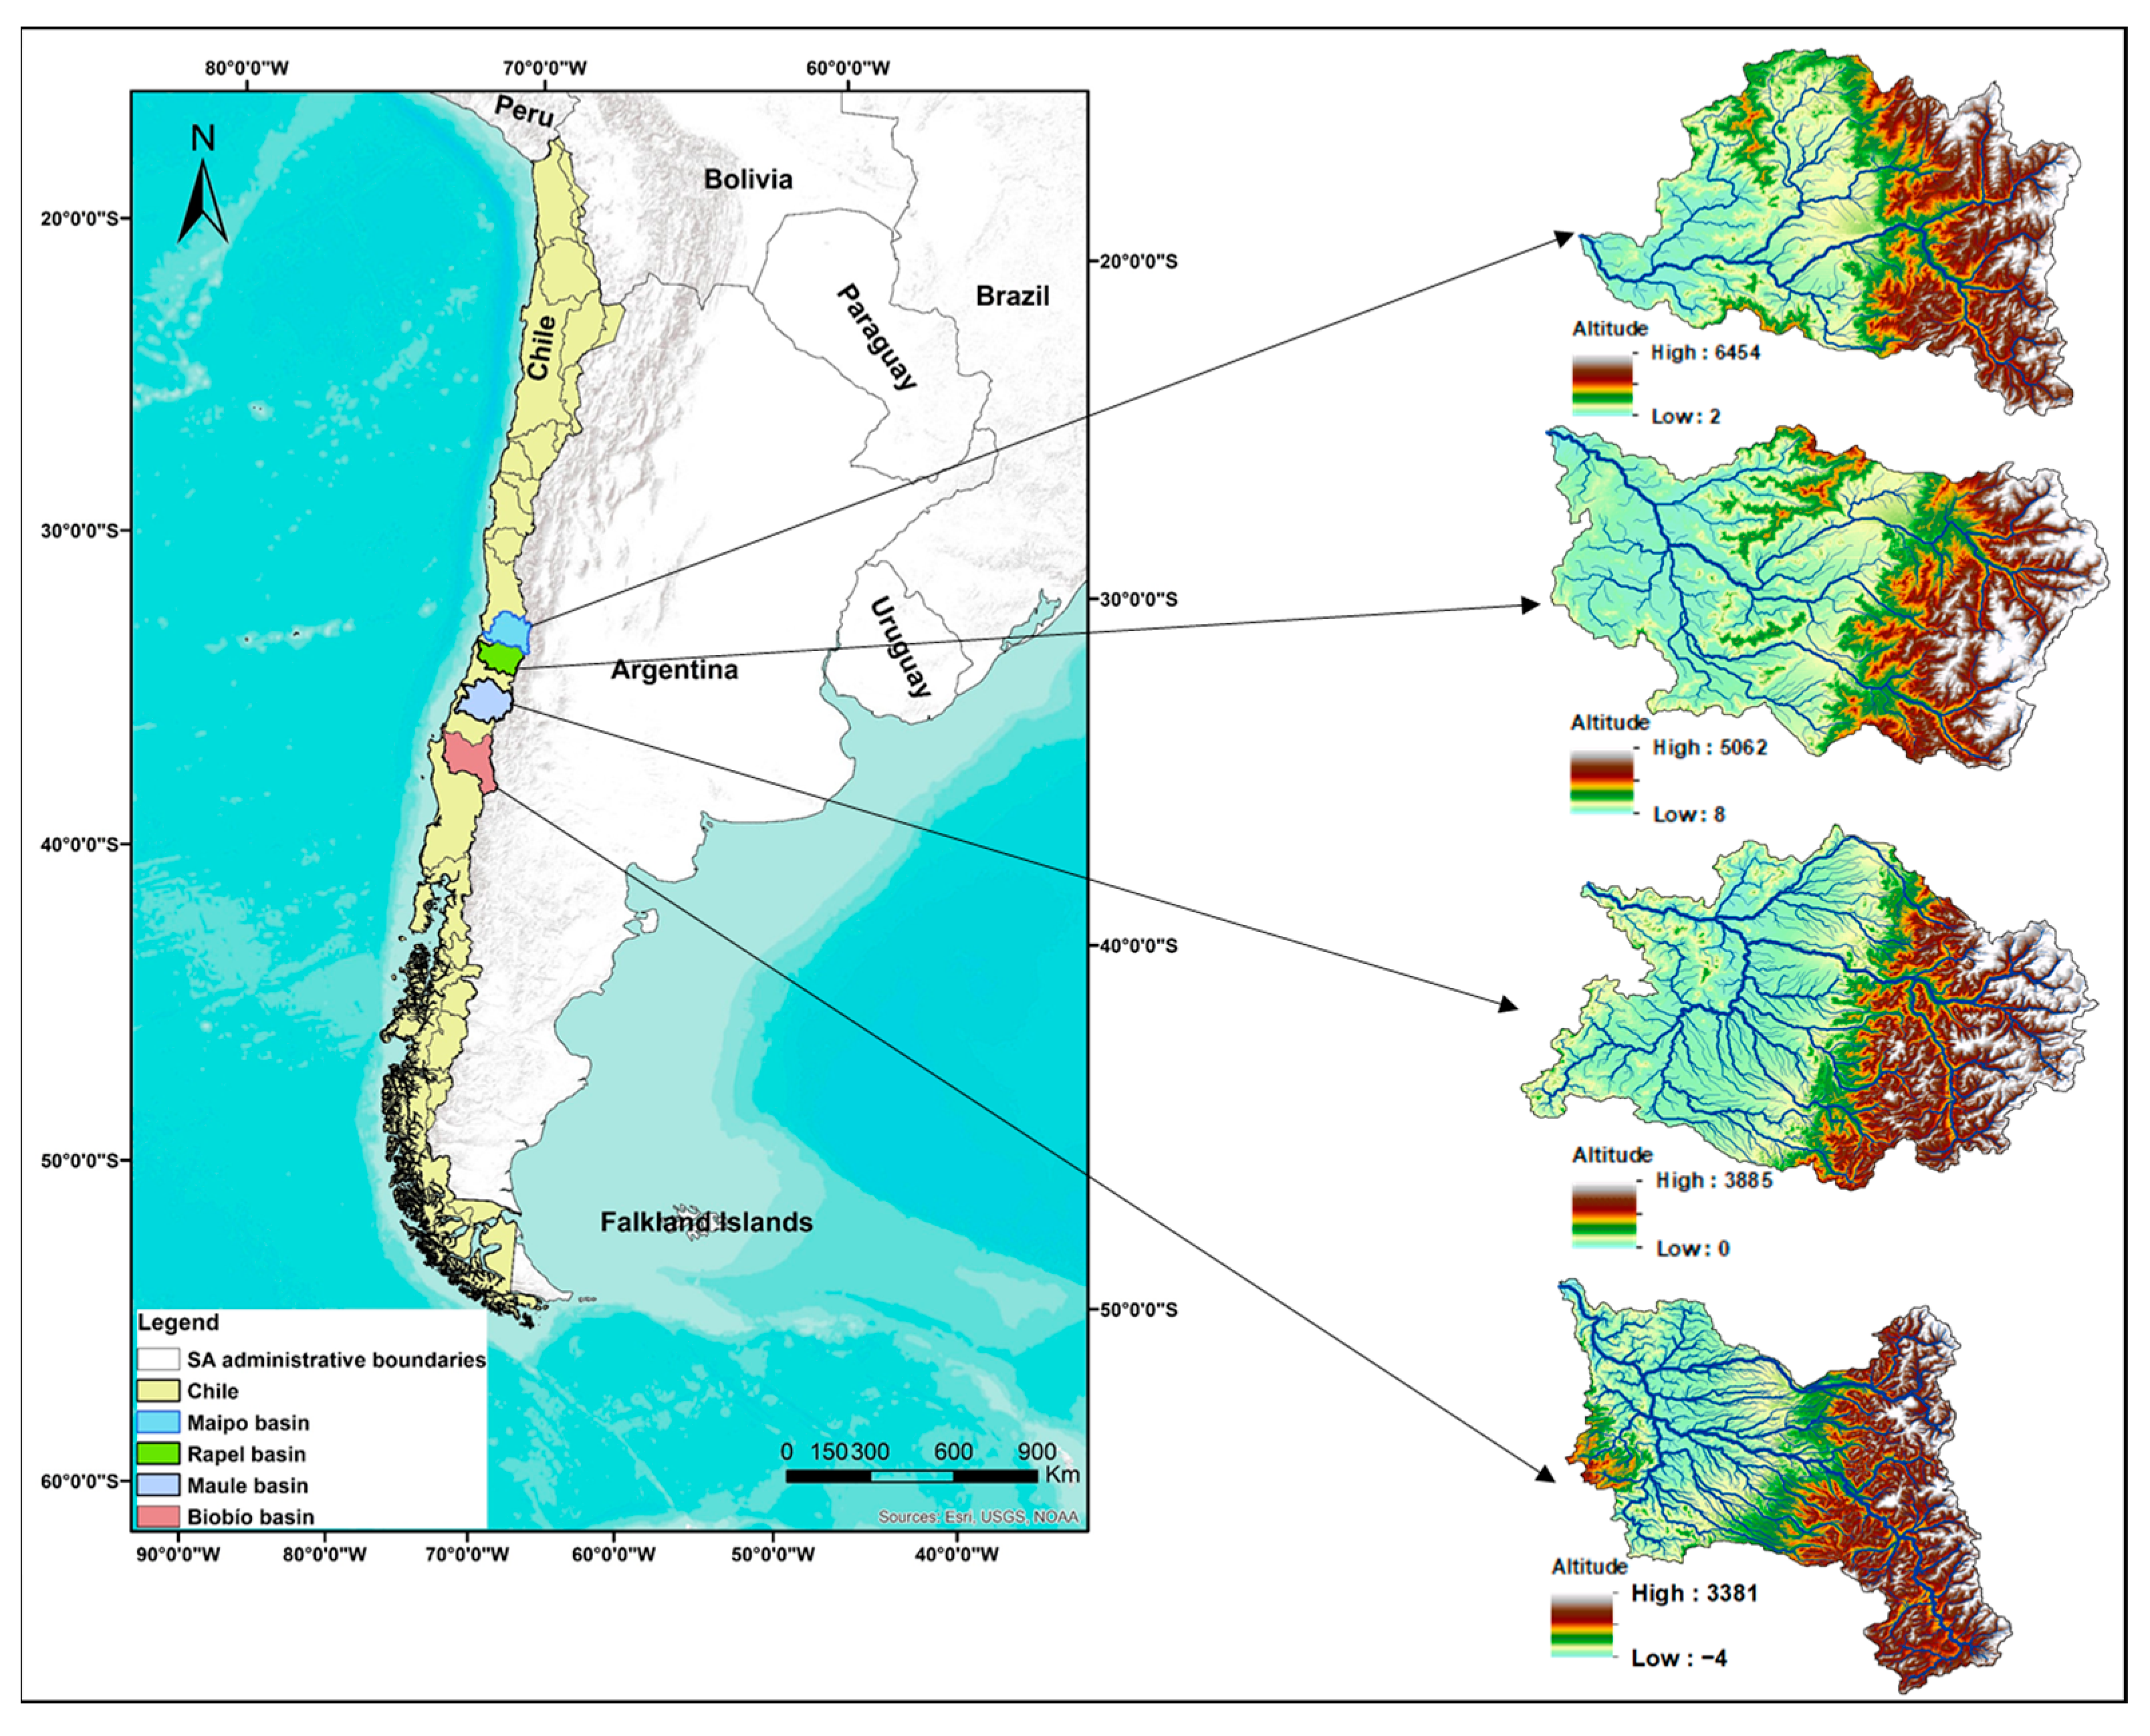
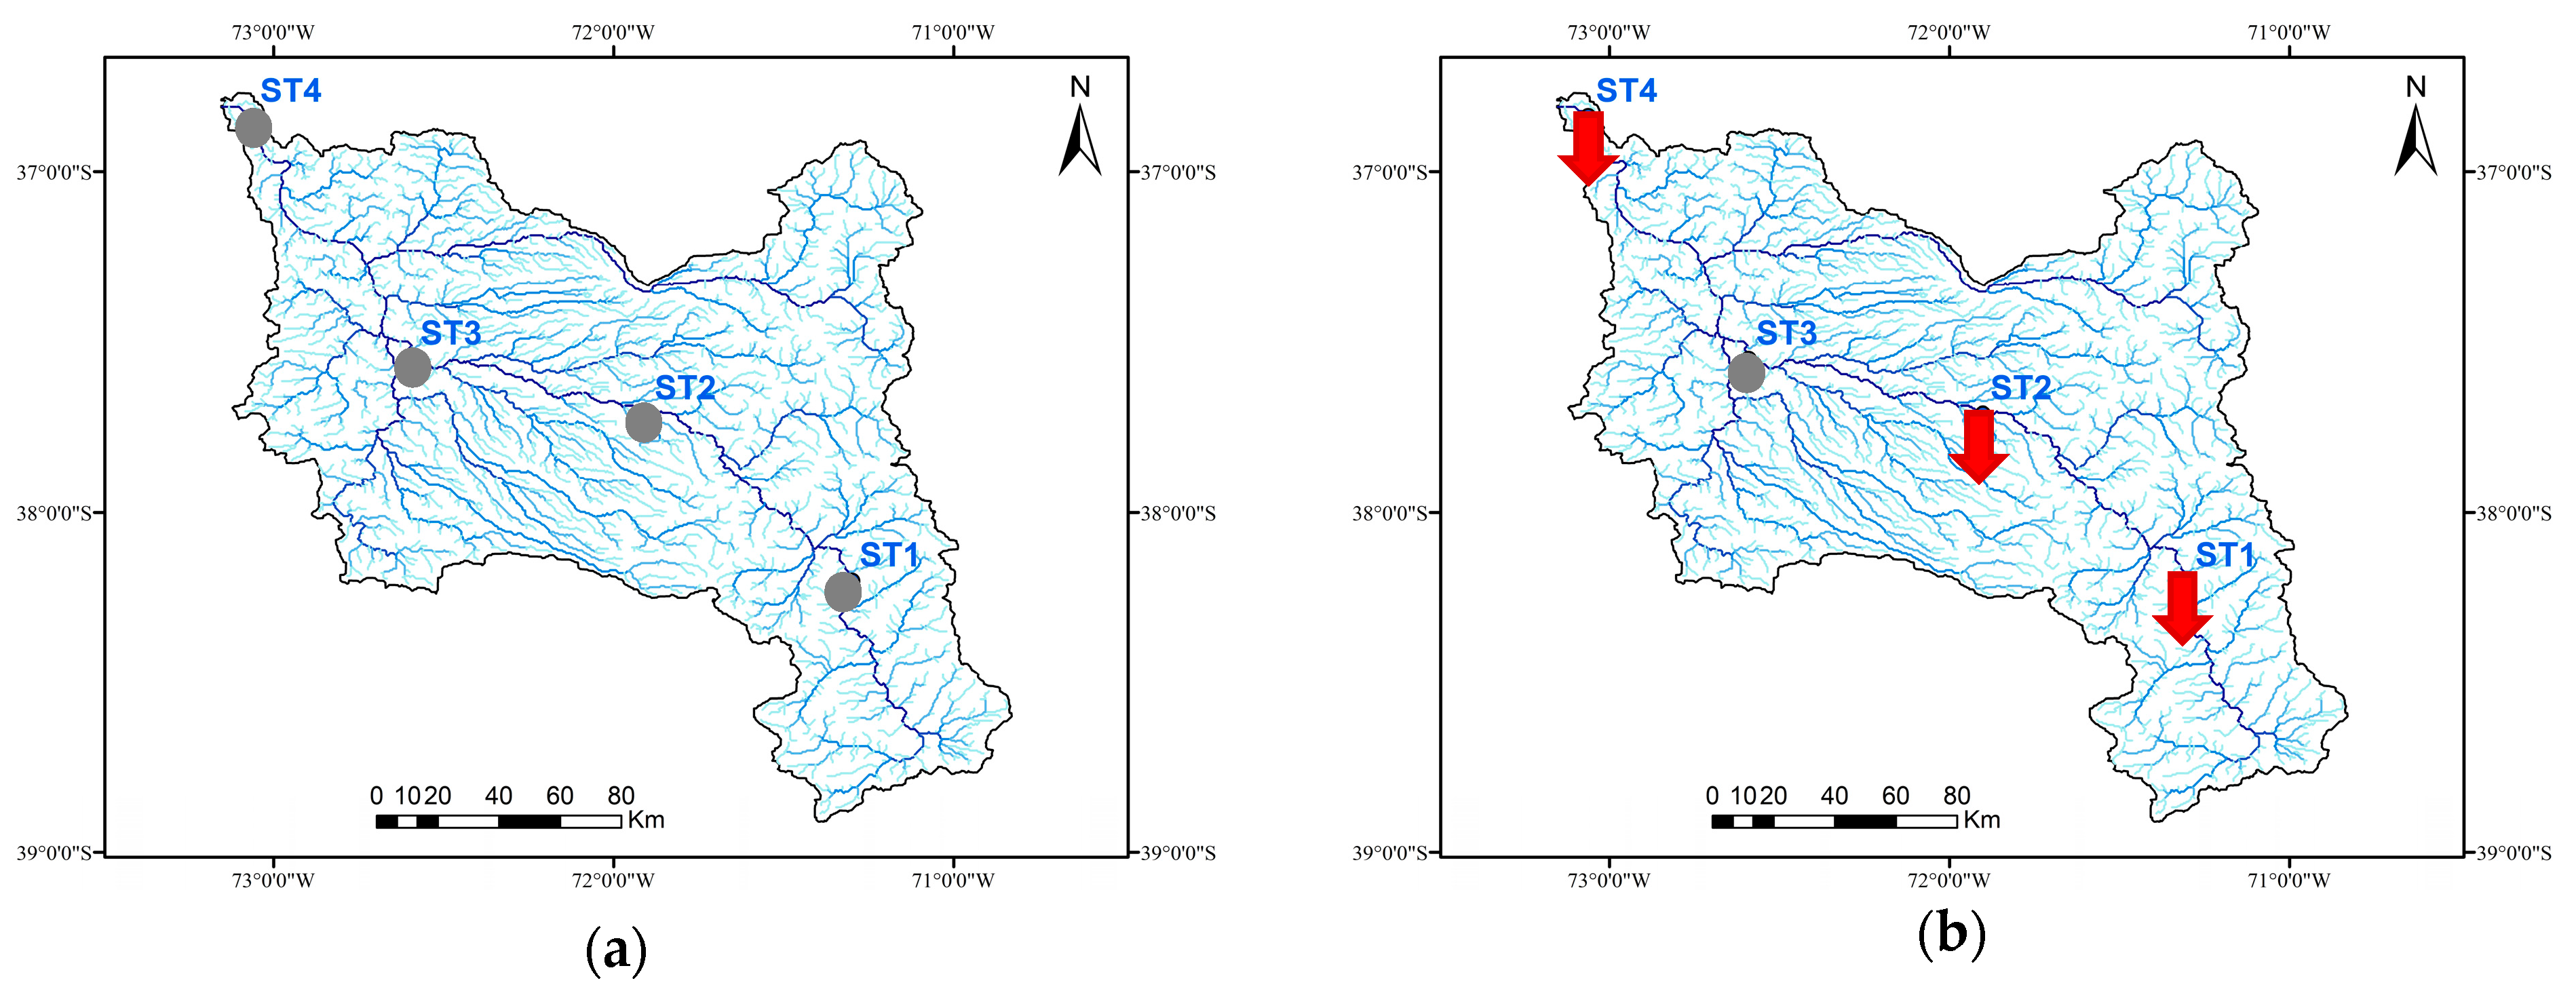
2.1. Study Area
2.2. Data Collection
2.3. Data Pre-Processing
2.4. Statistical Analysis
3. Results
3.1. Flow Trends and Statistical Analysis
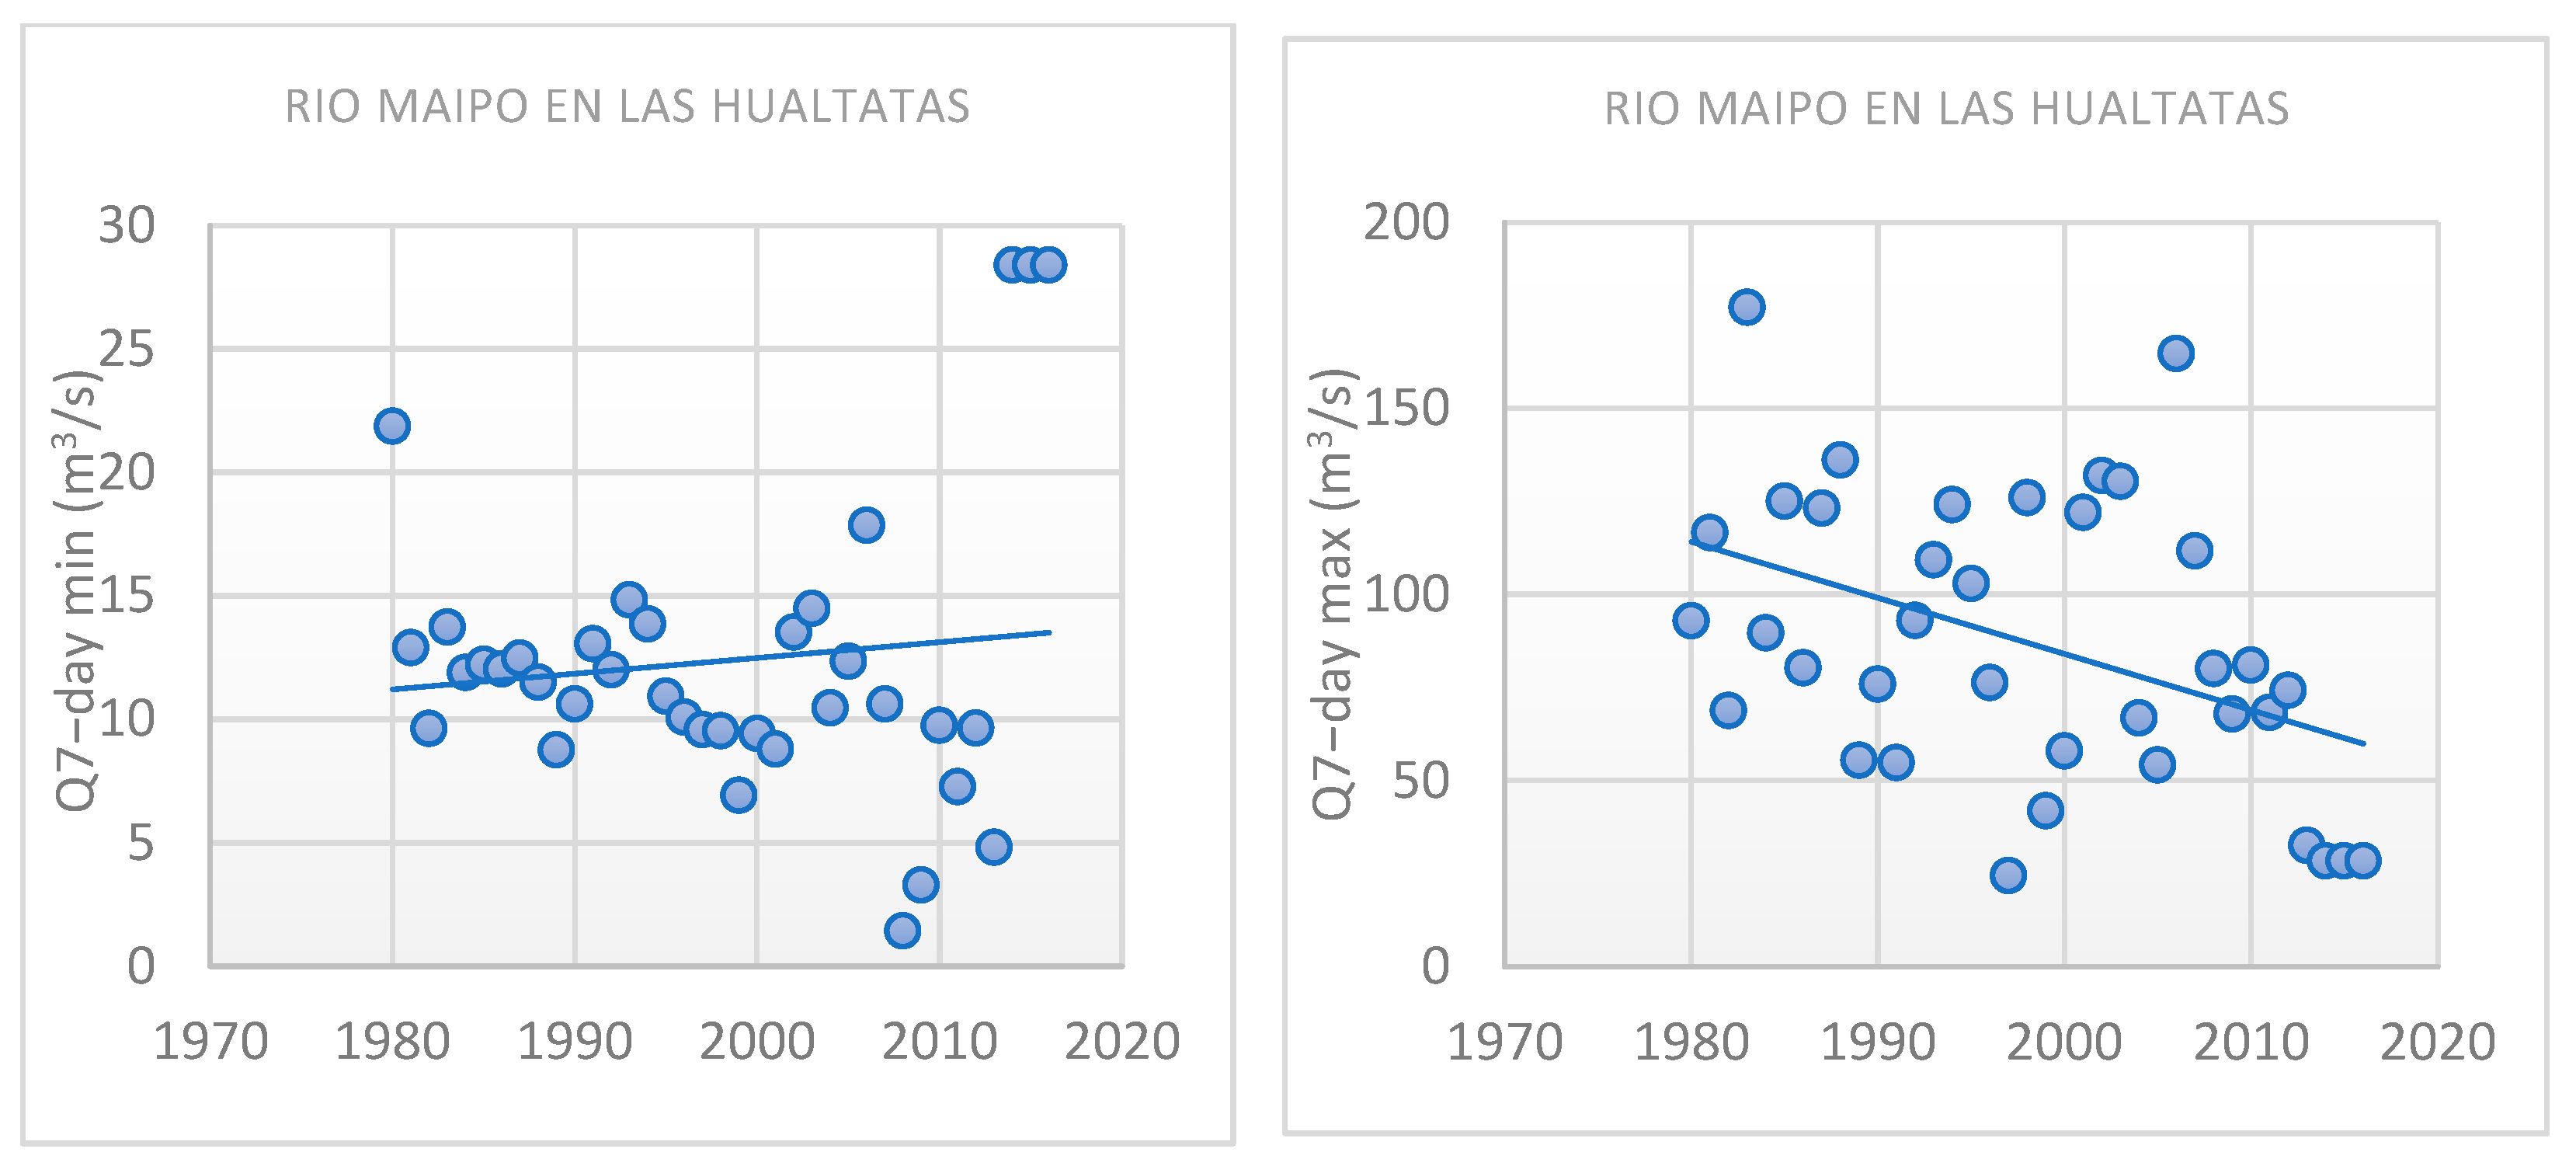
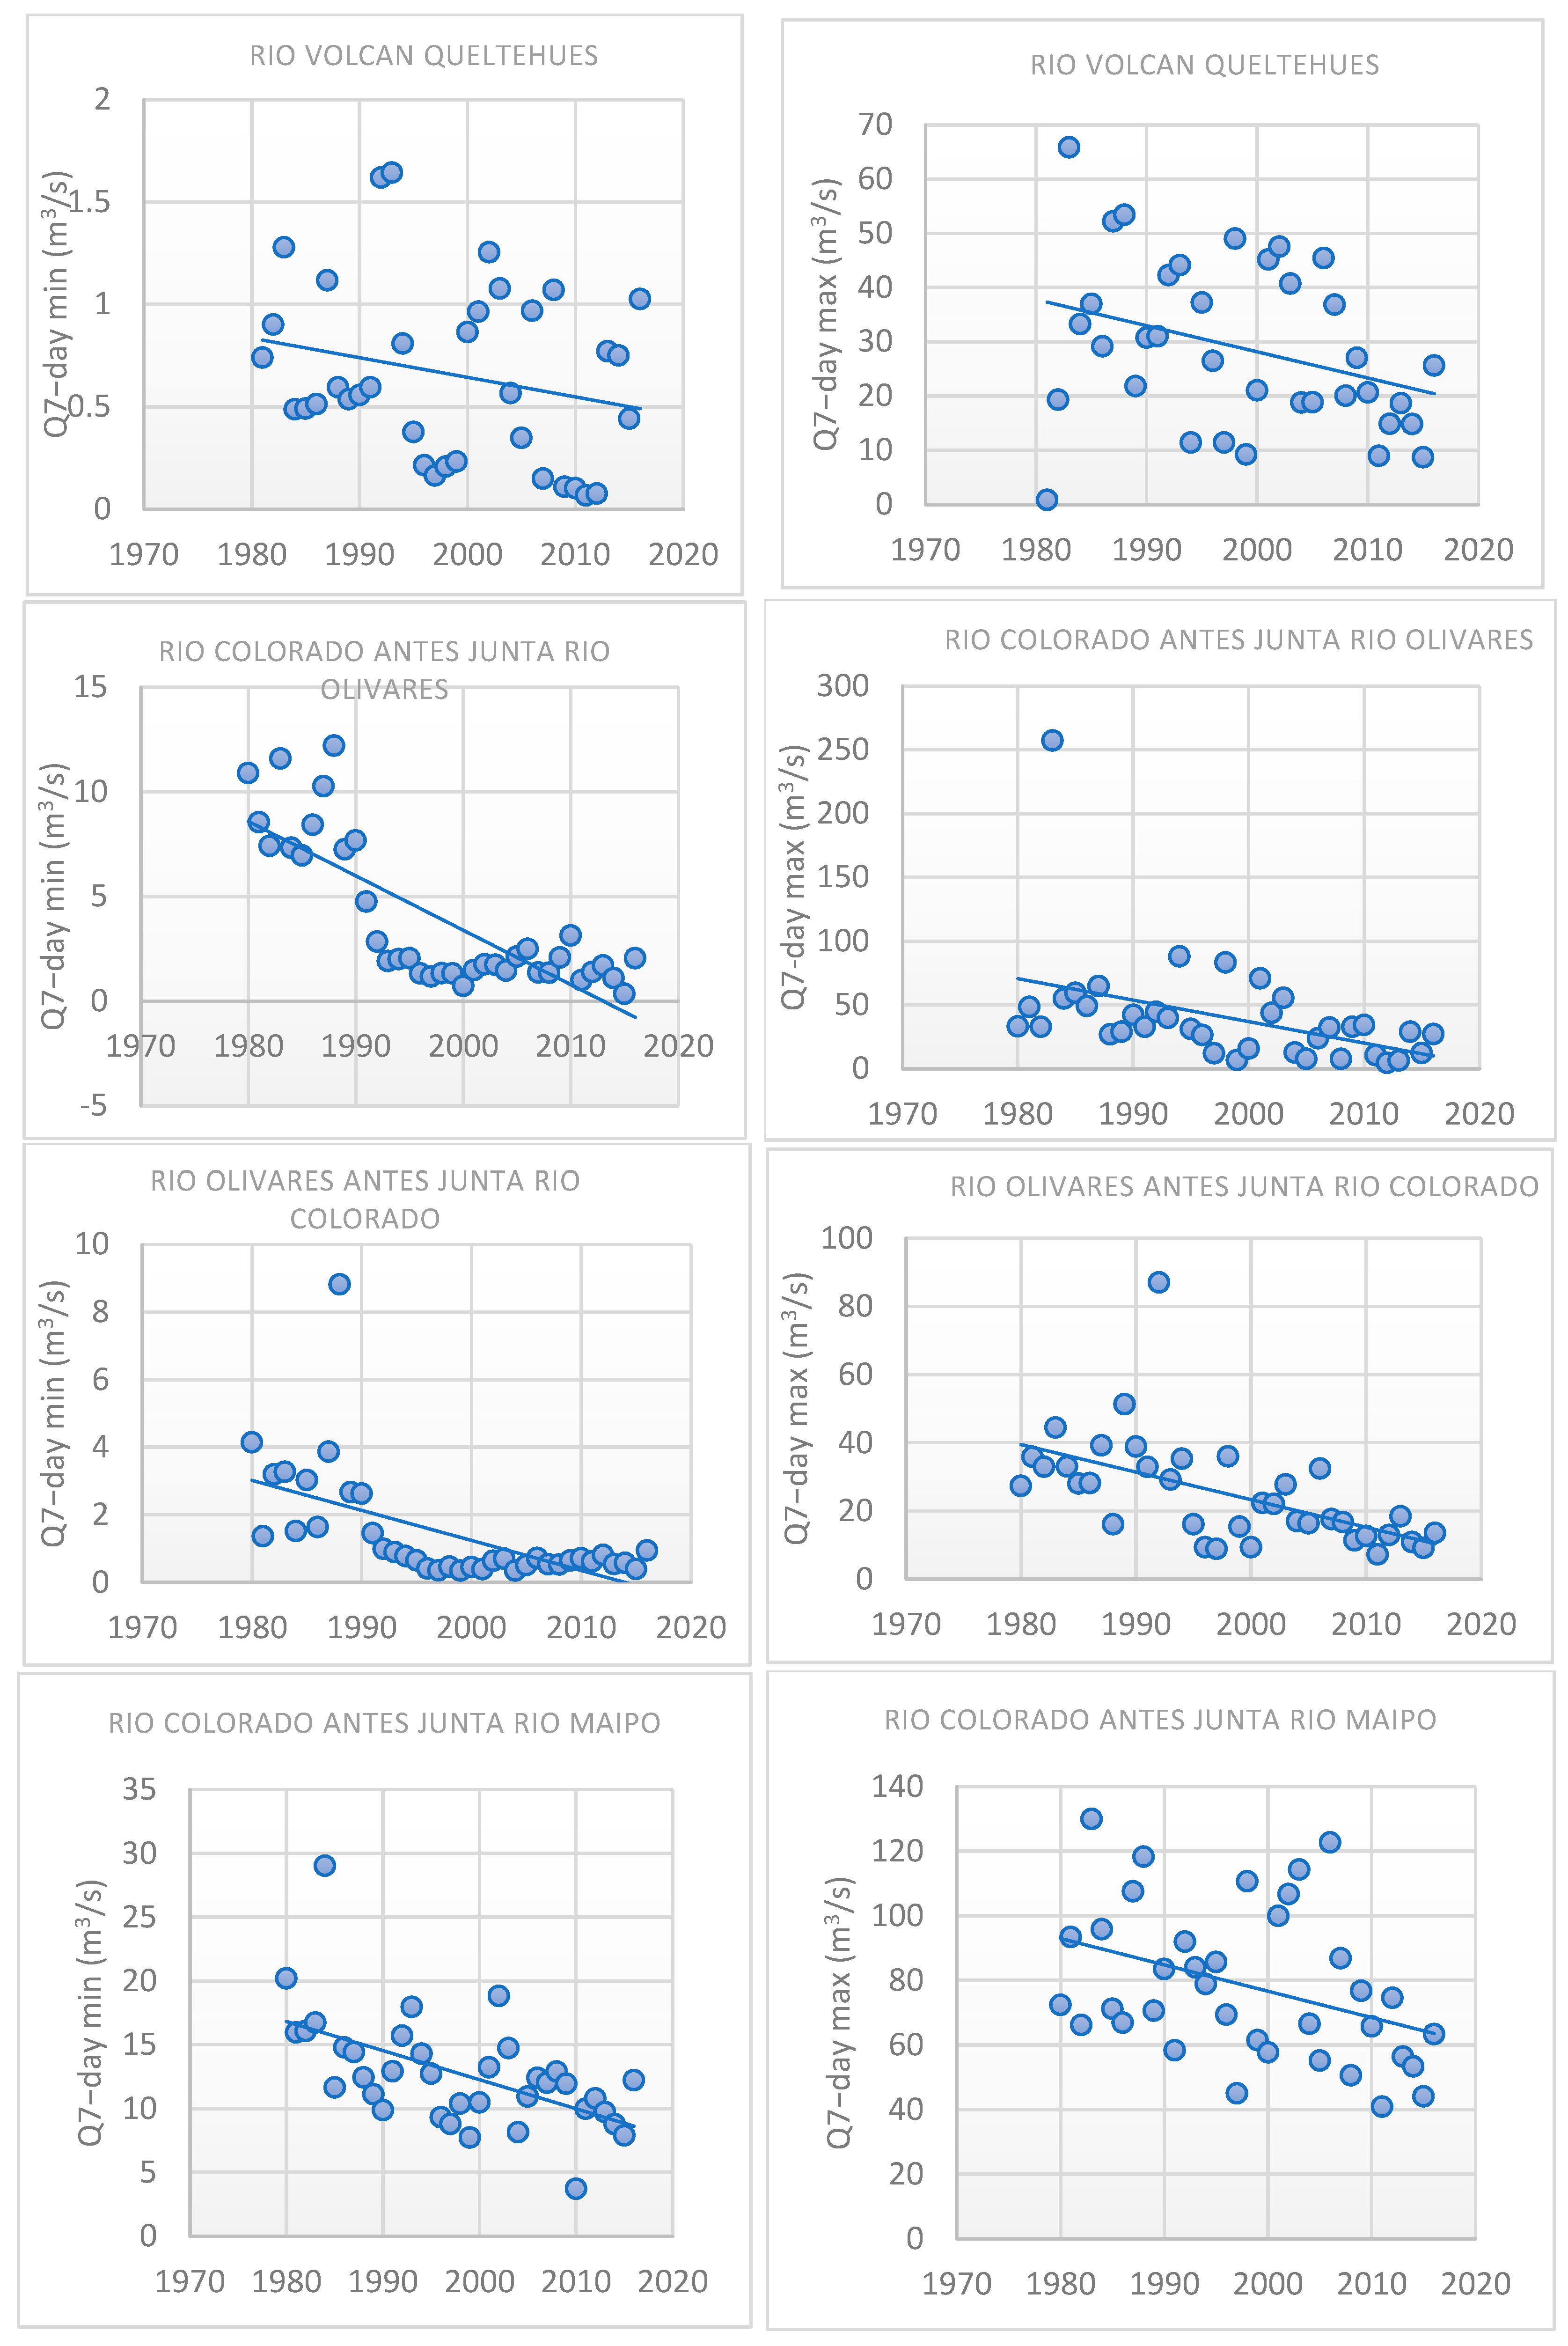
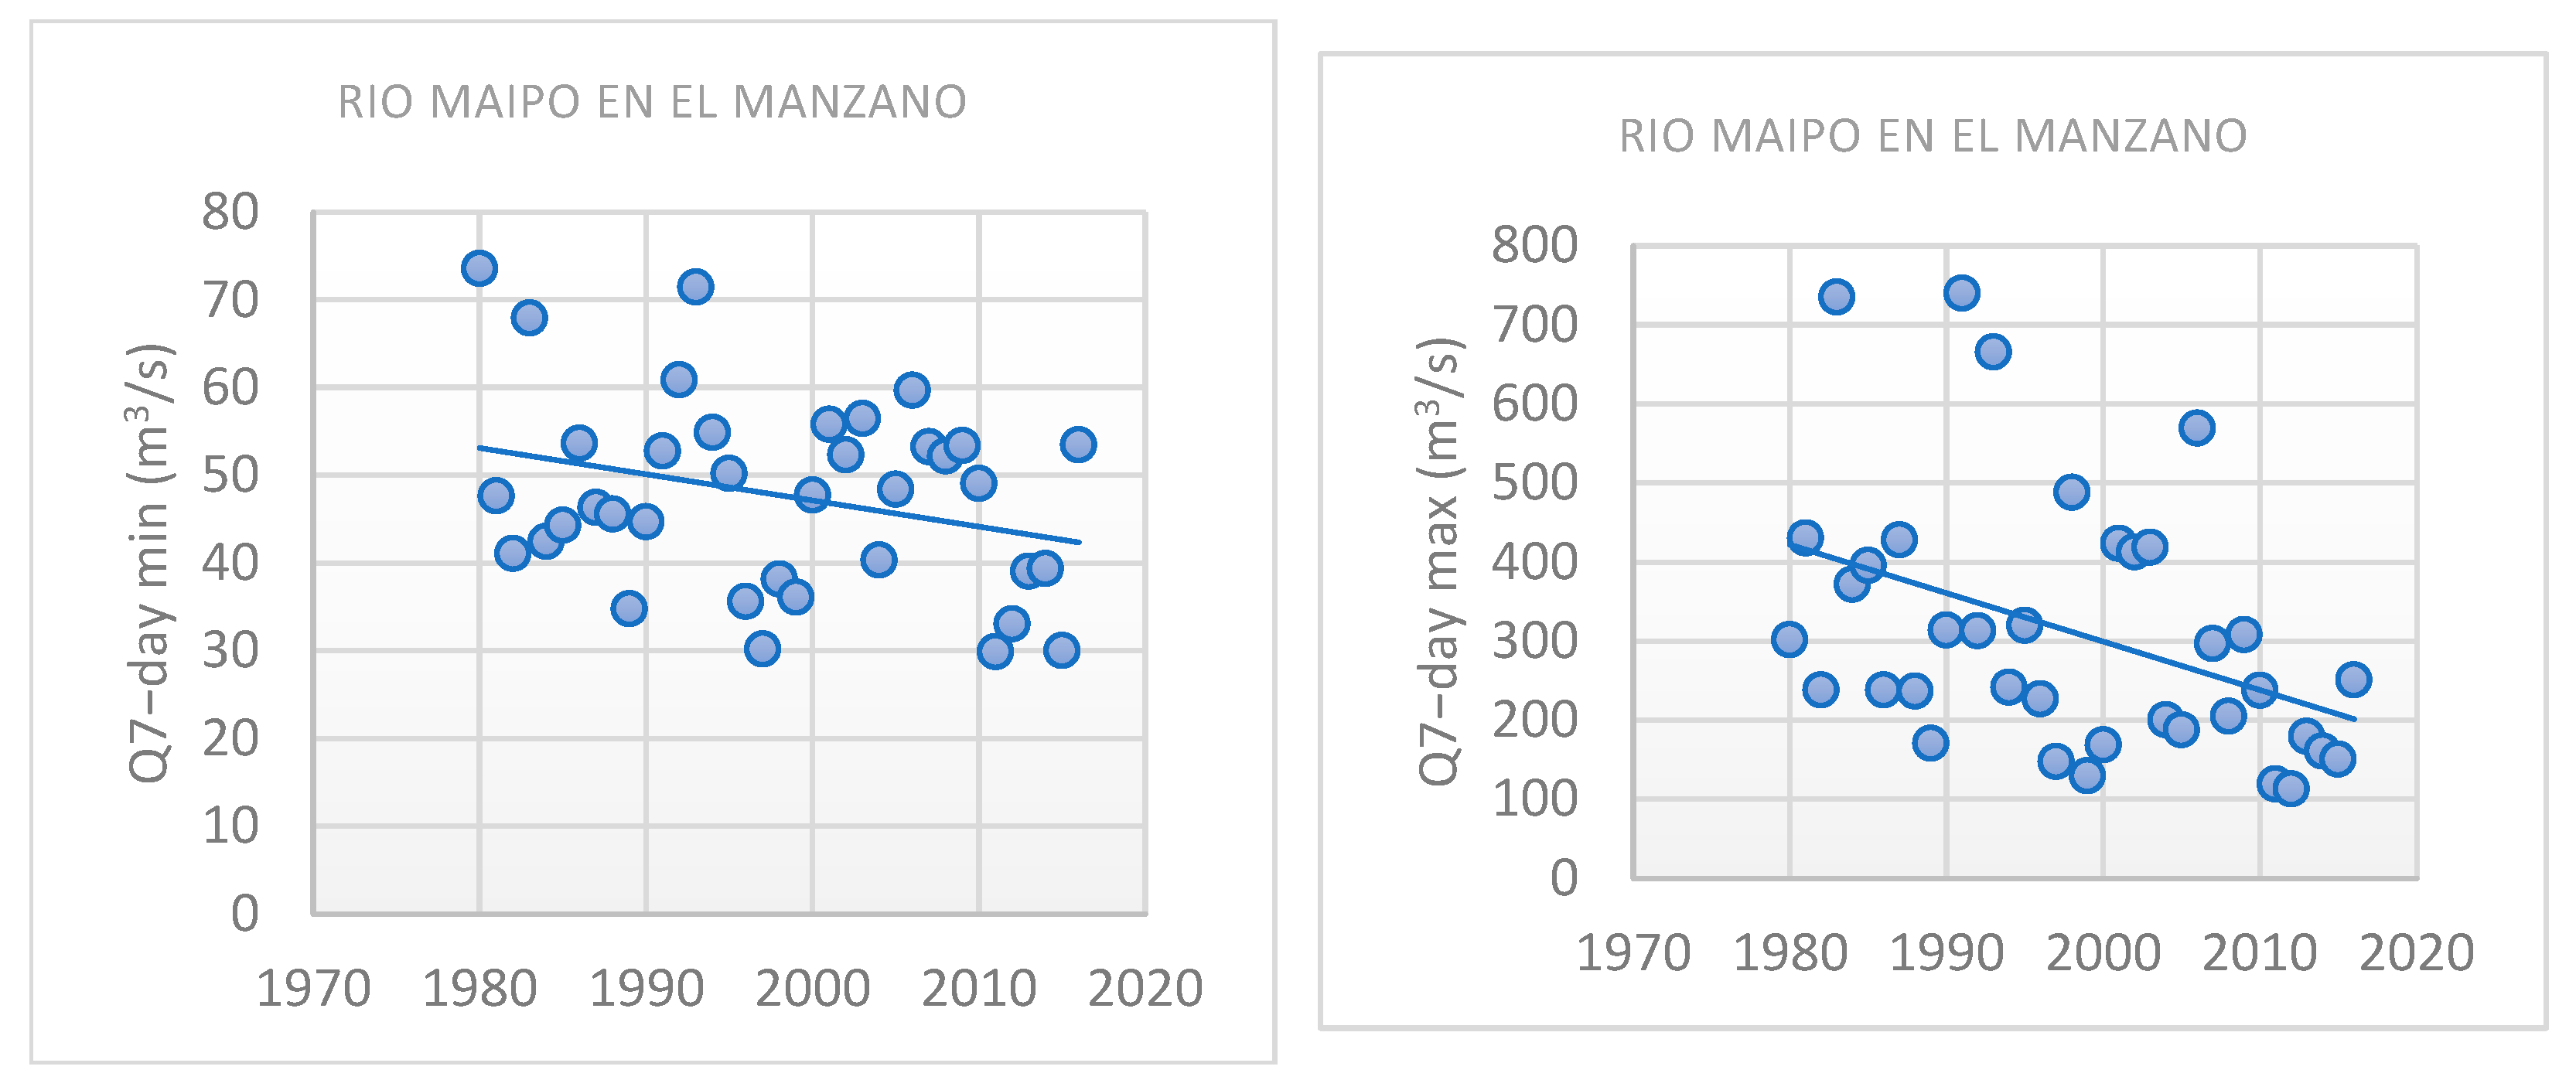
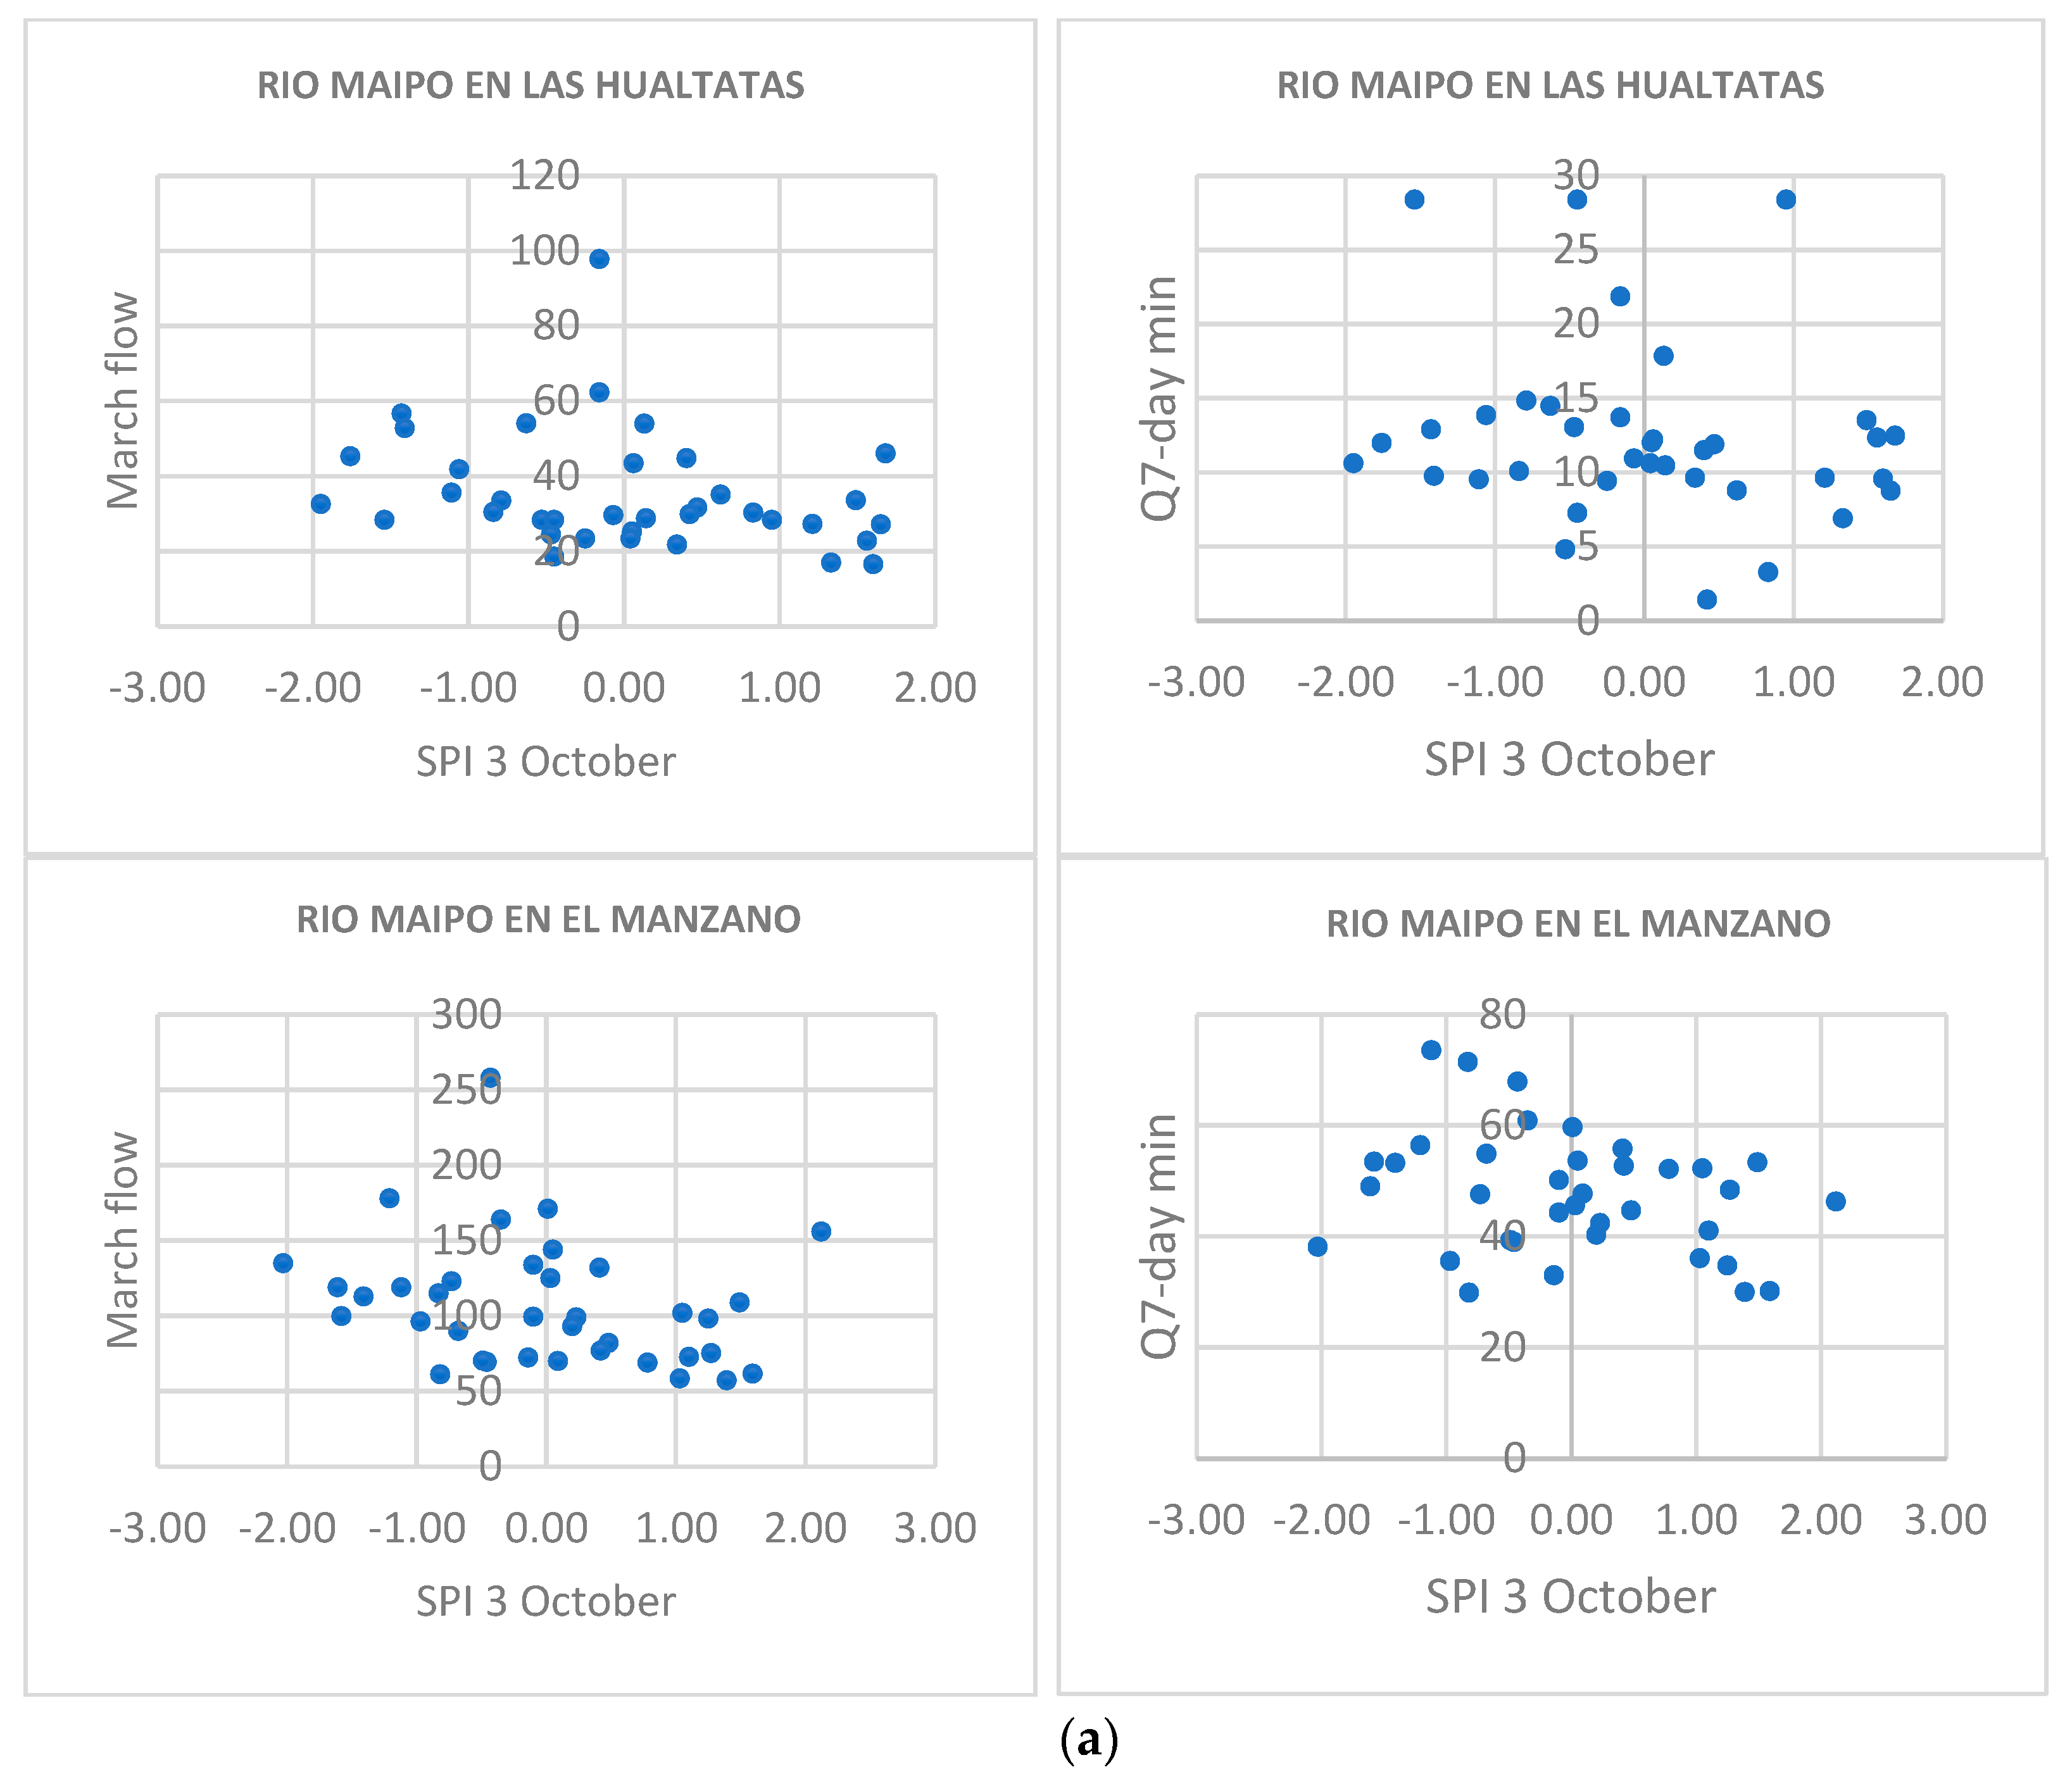
3.1.1. Maipo River Basin
3.1.2. Rapel River Basin
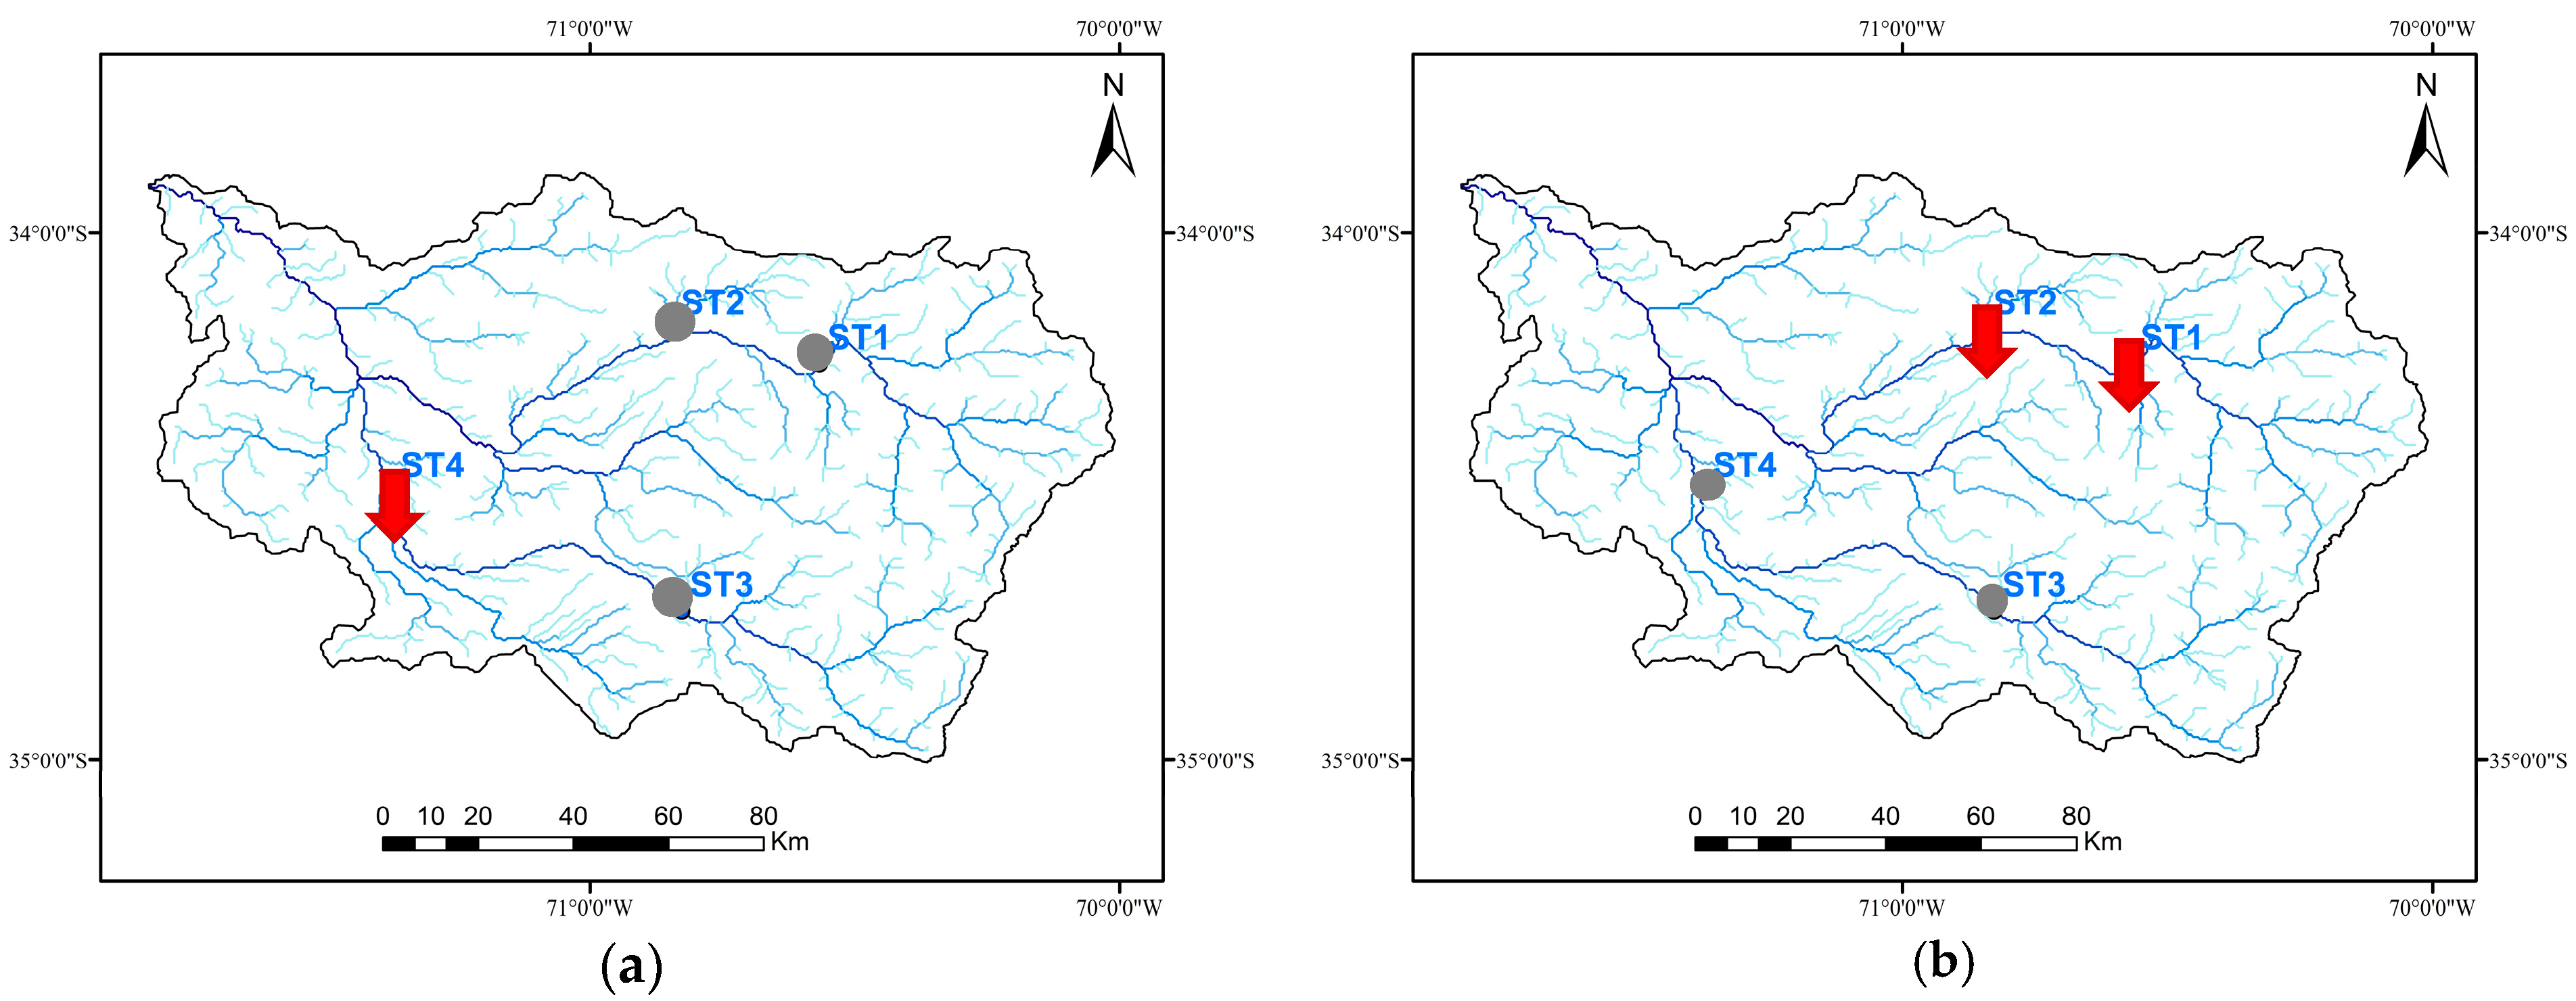
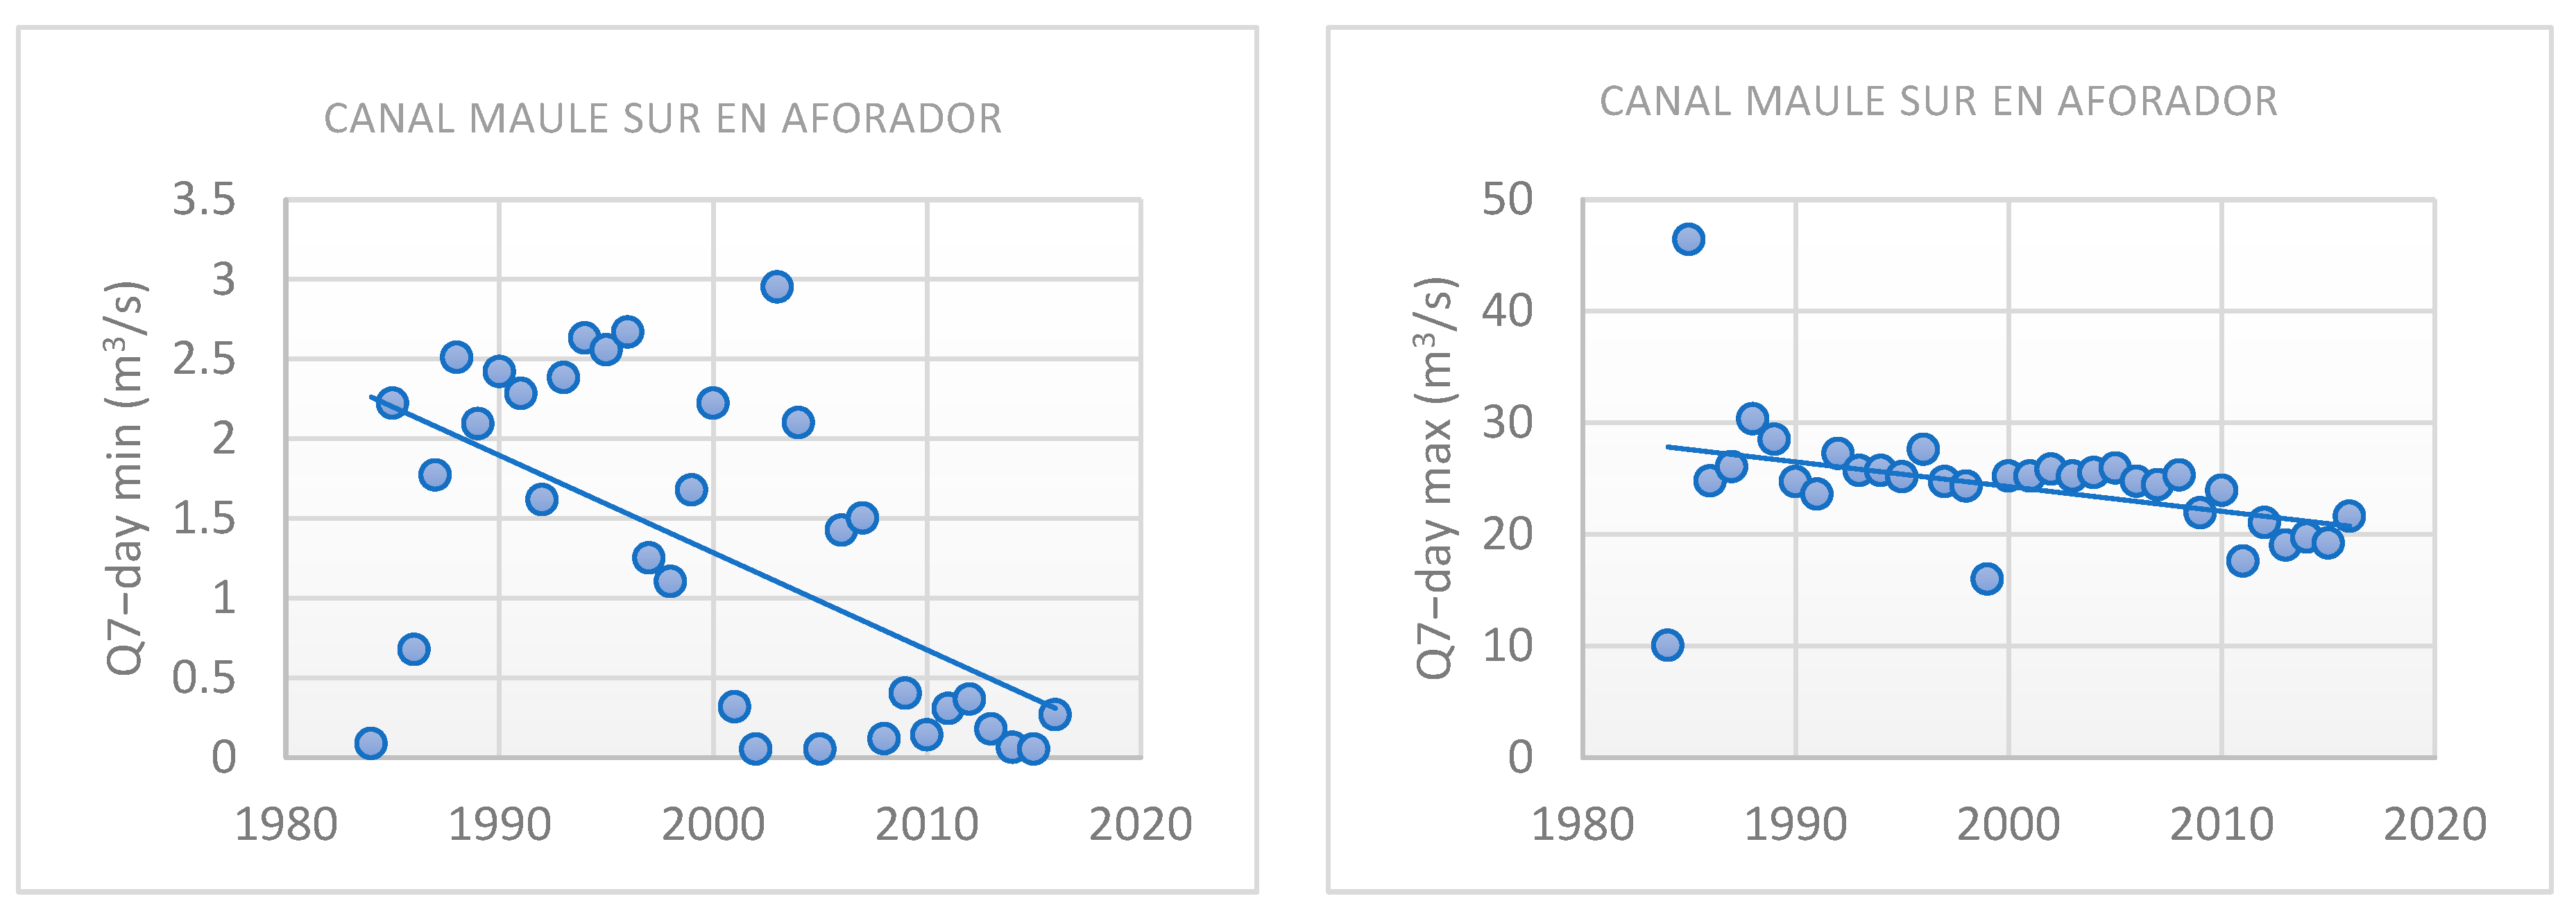
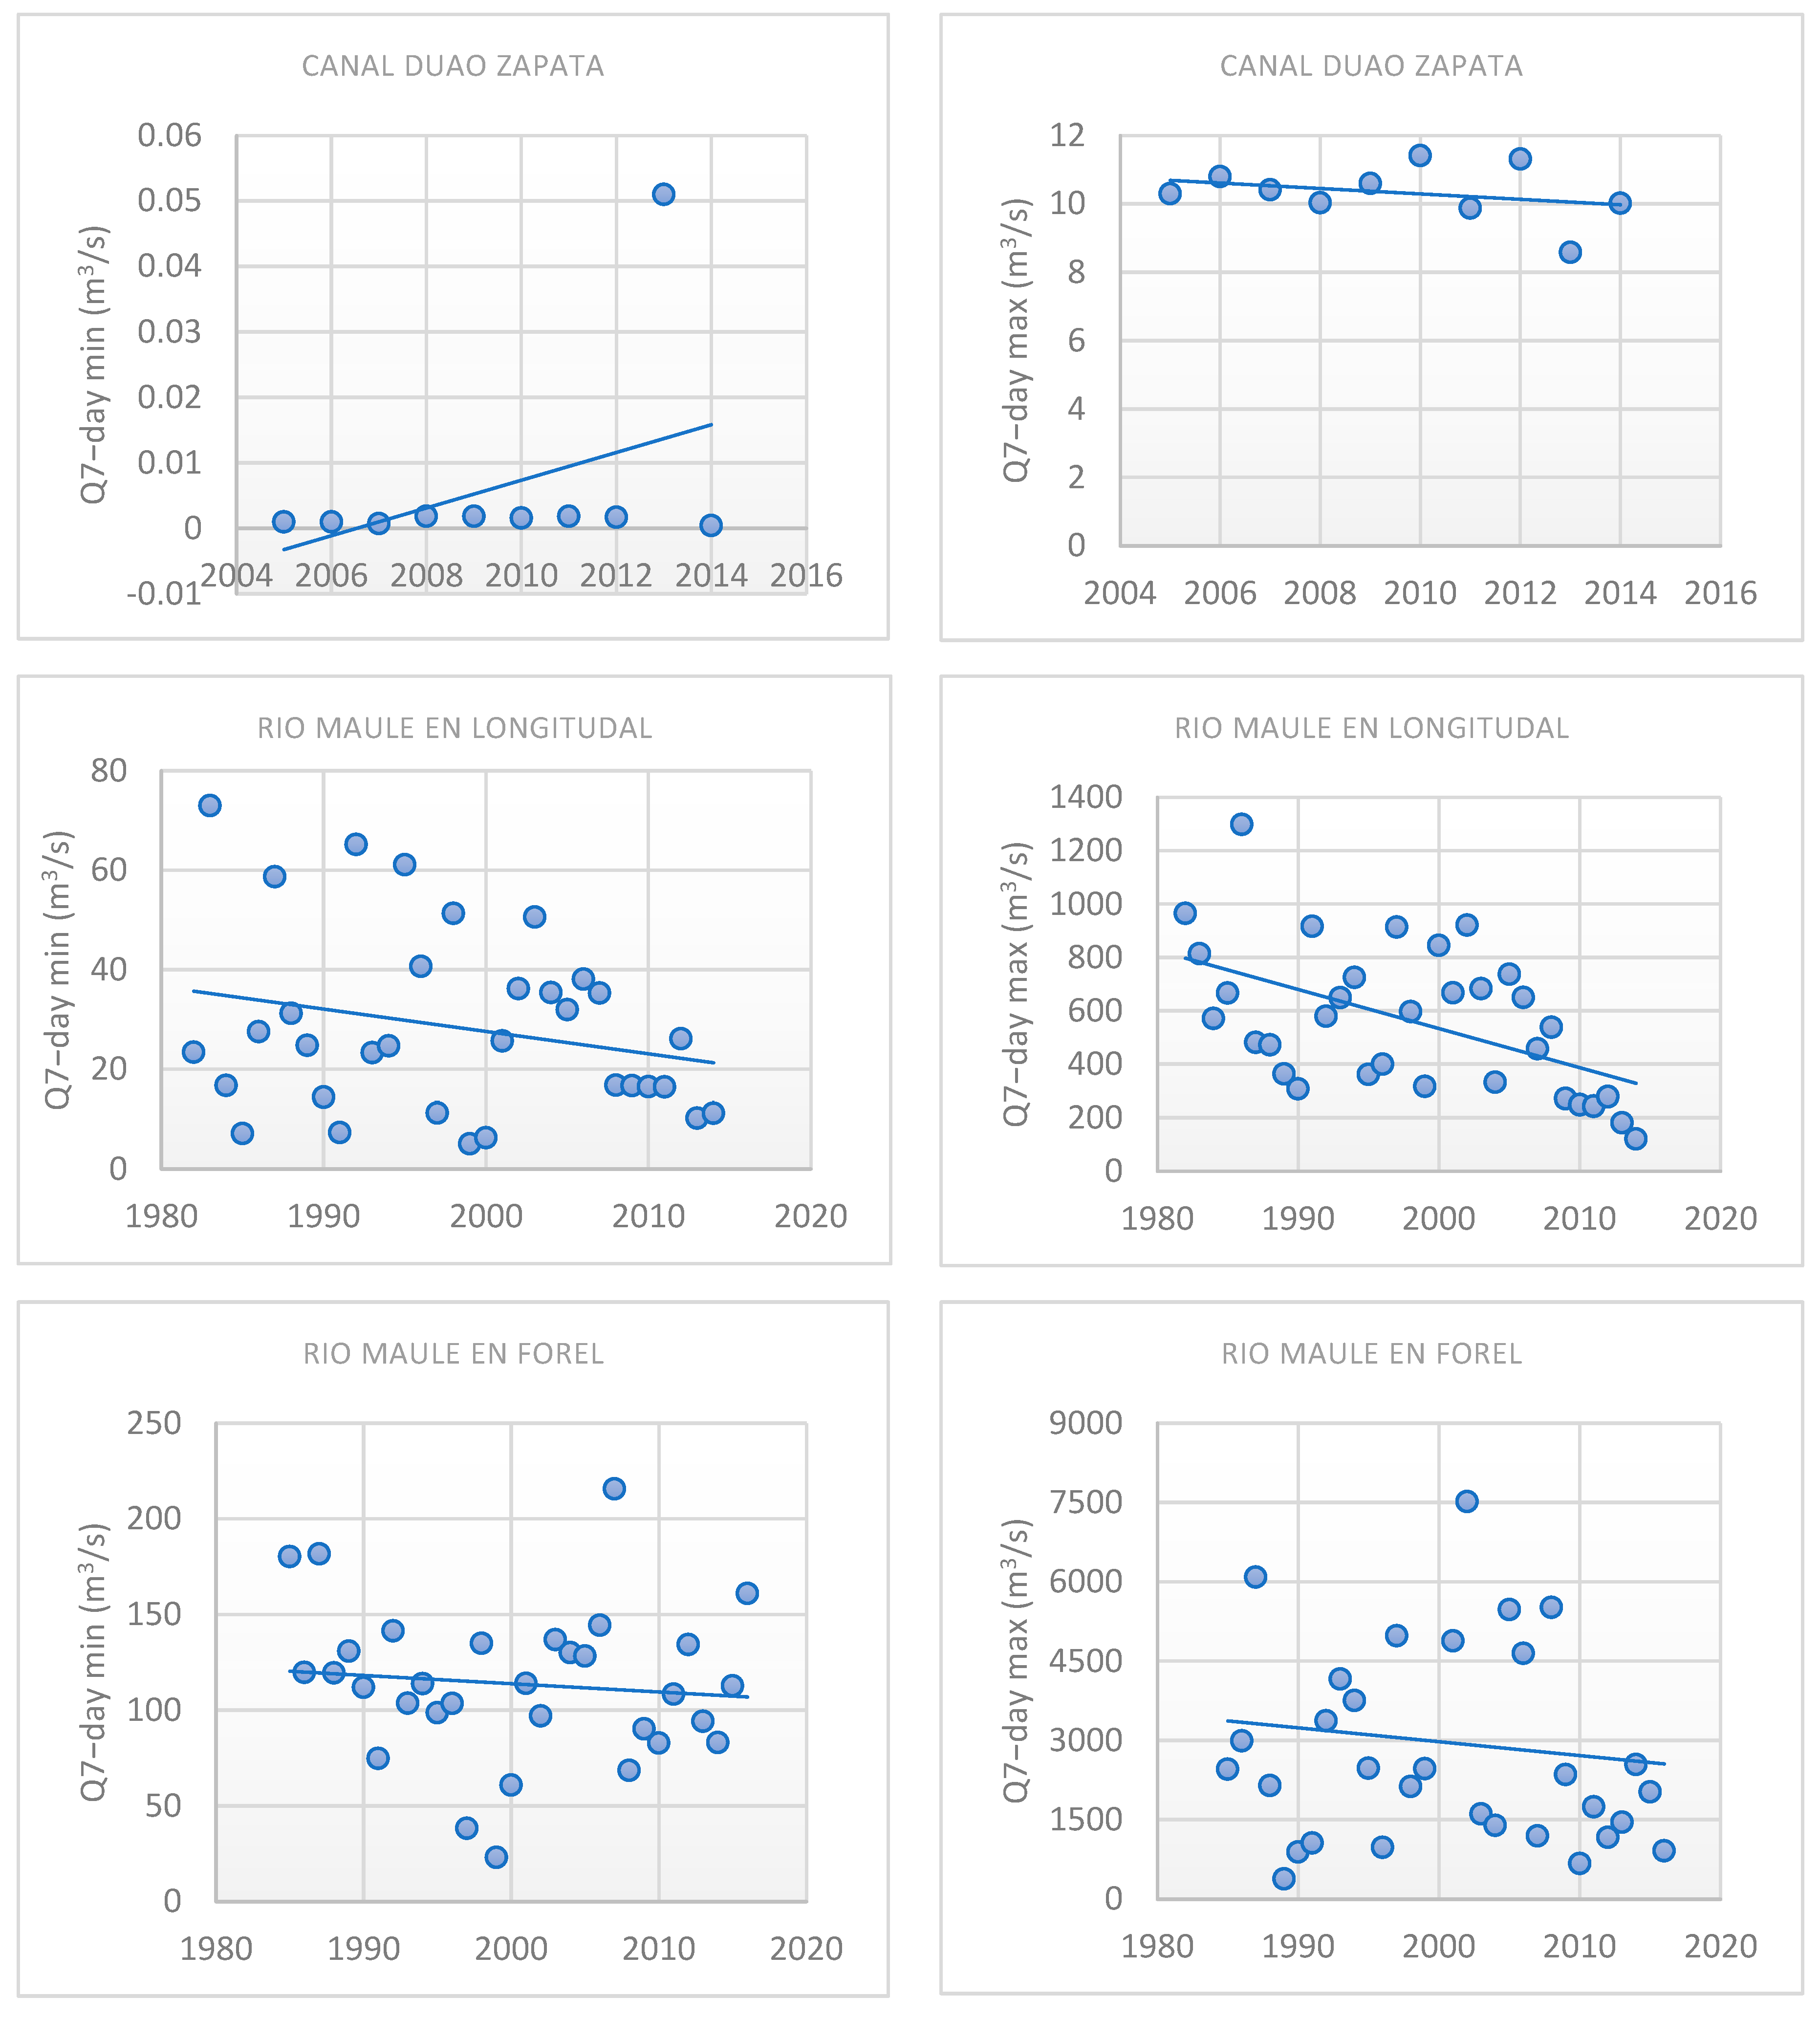
3.1.3. Maule River Basin
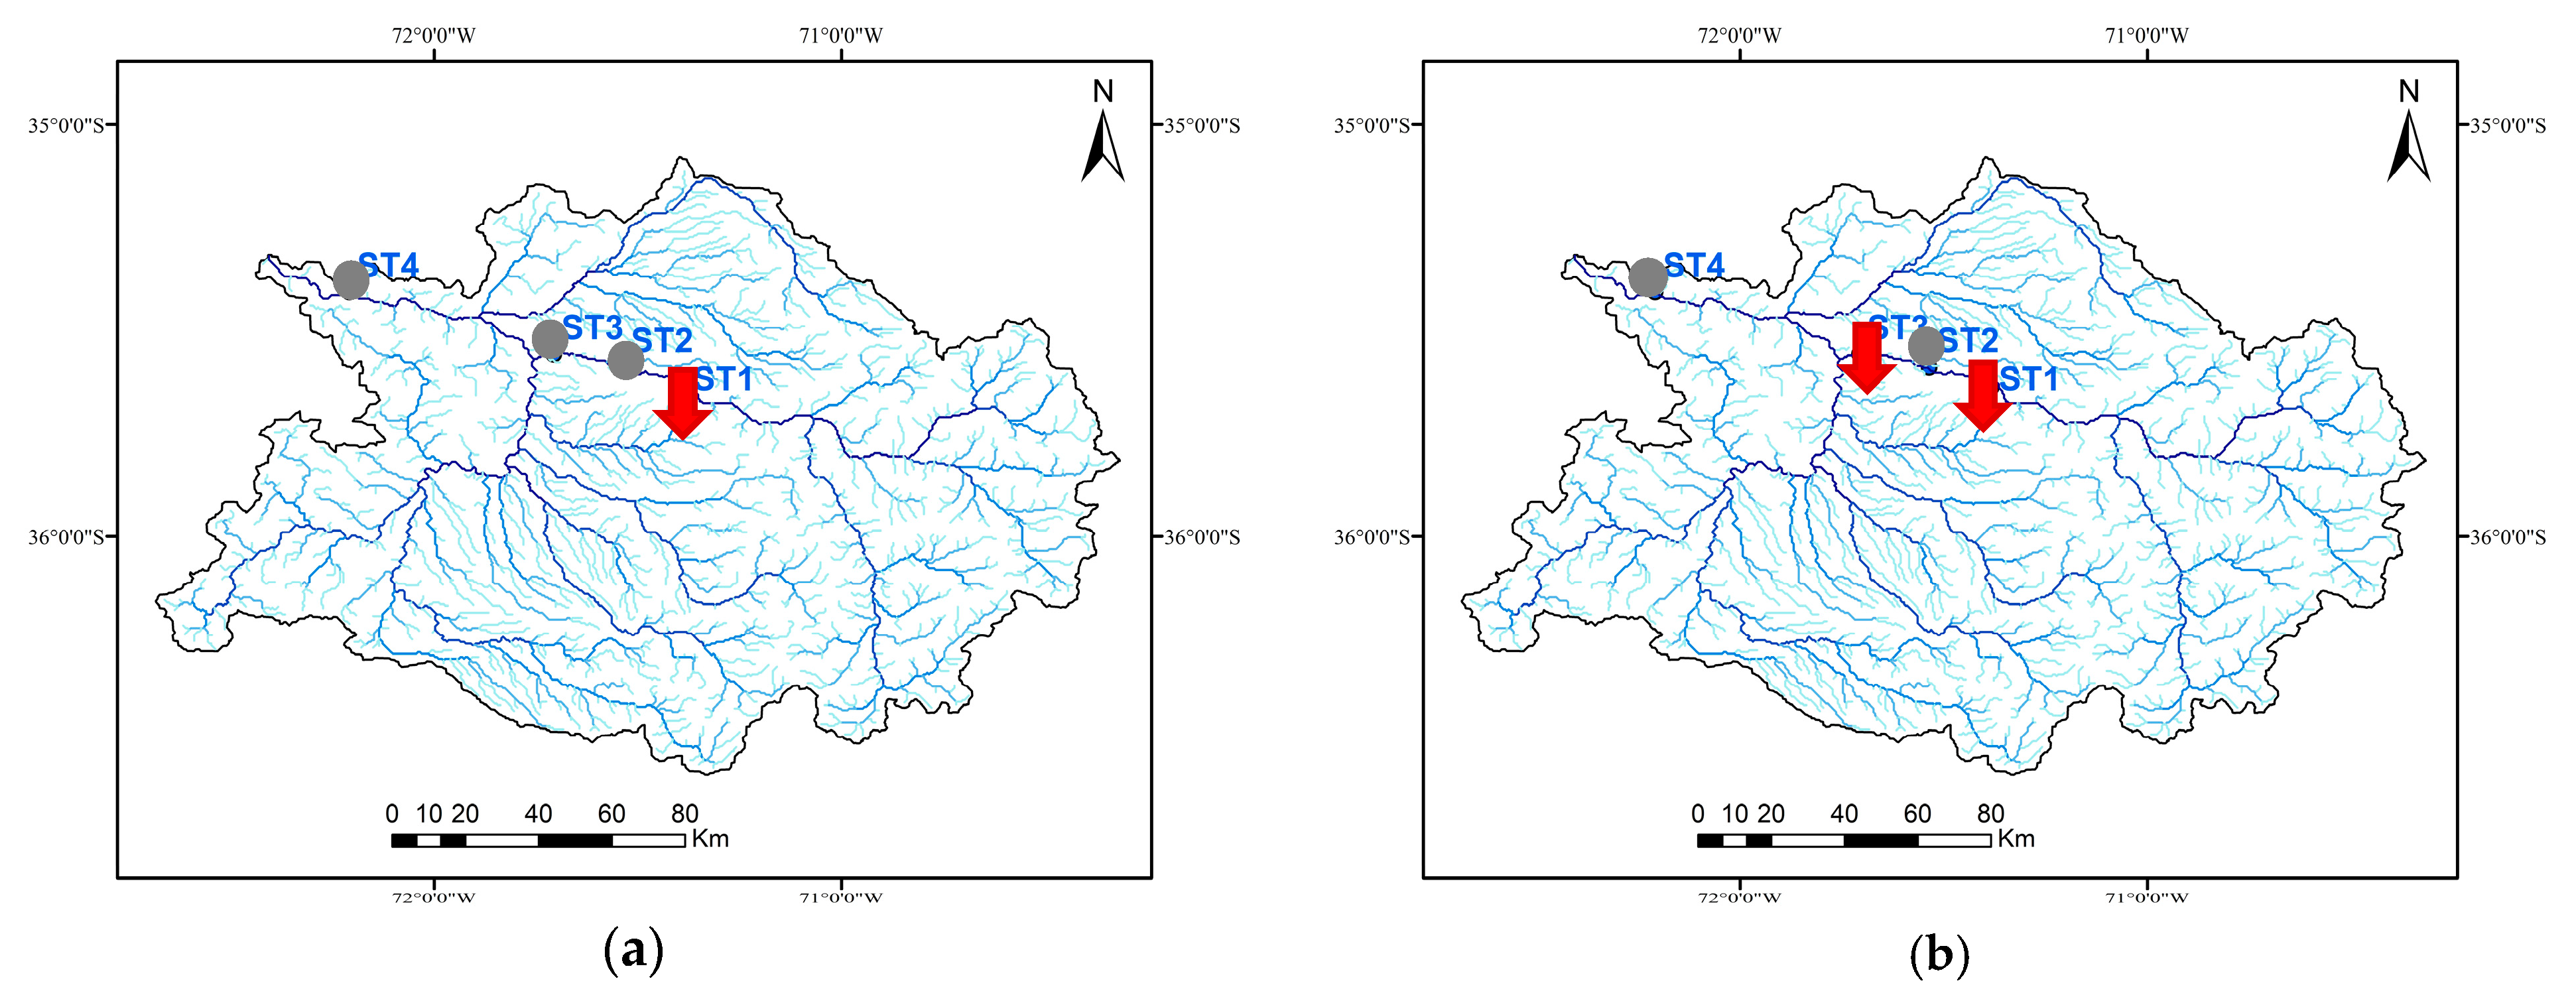
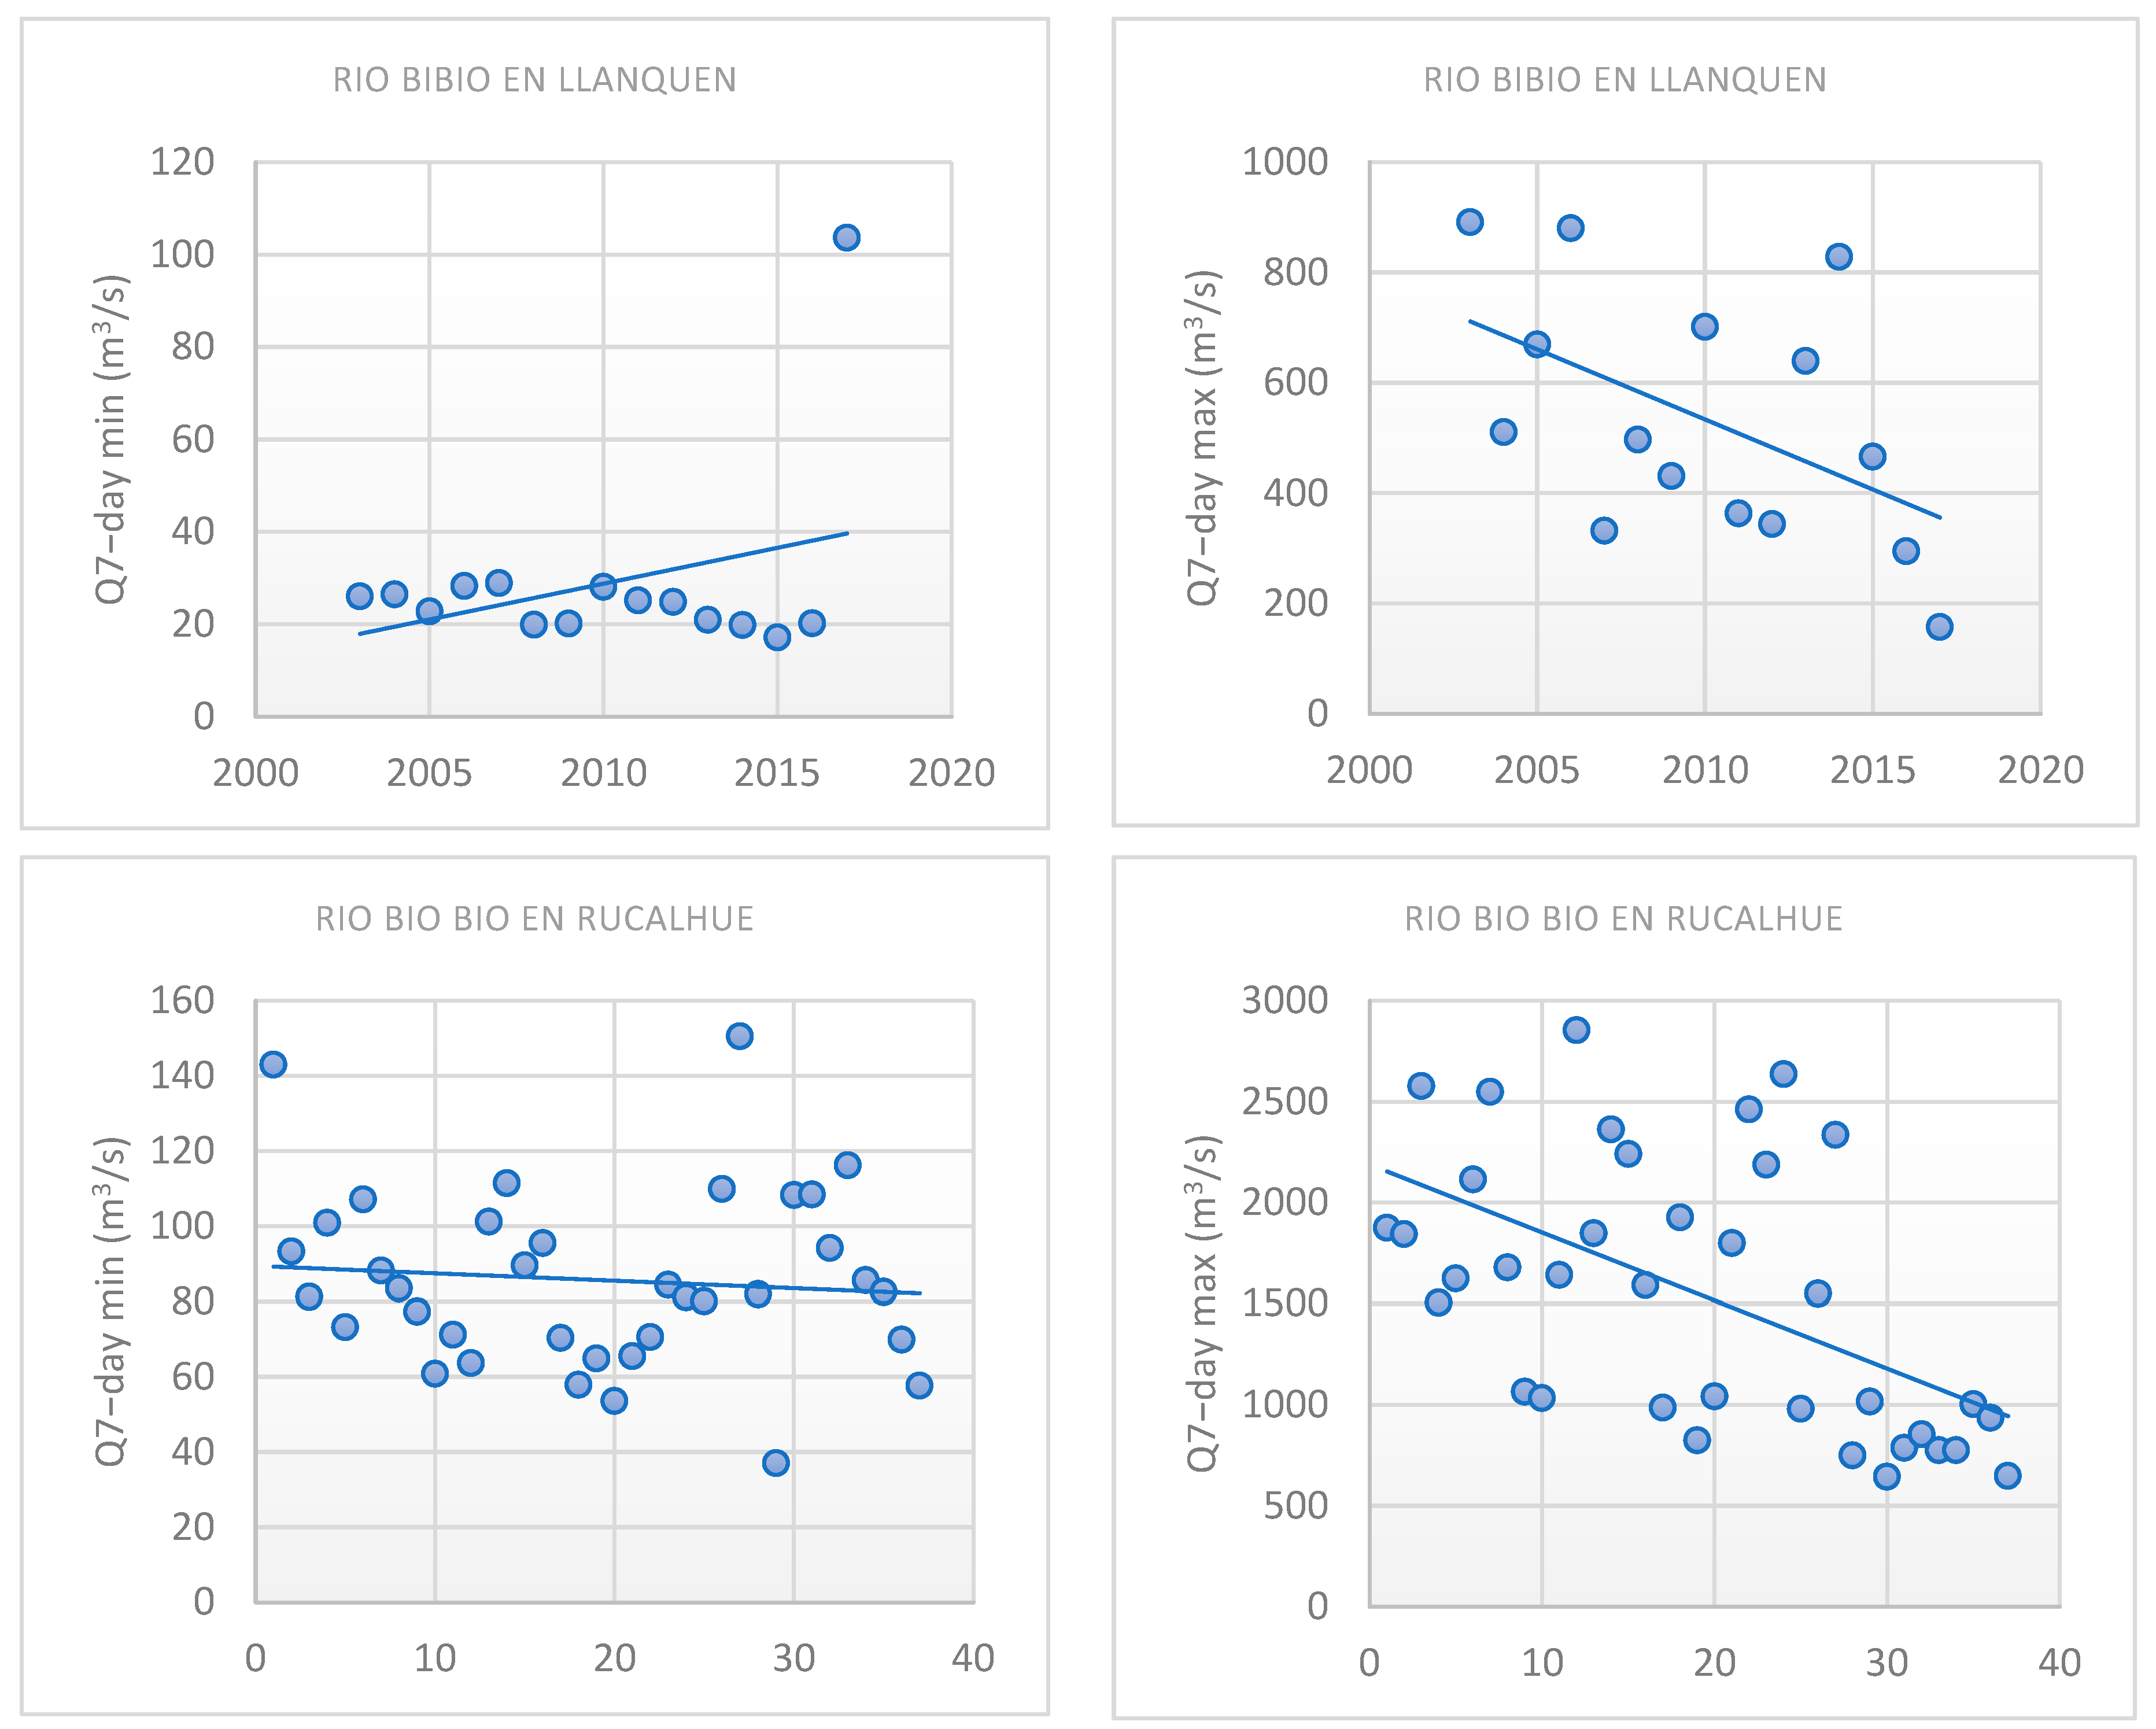
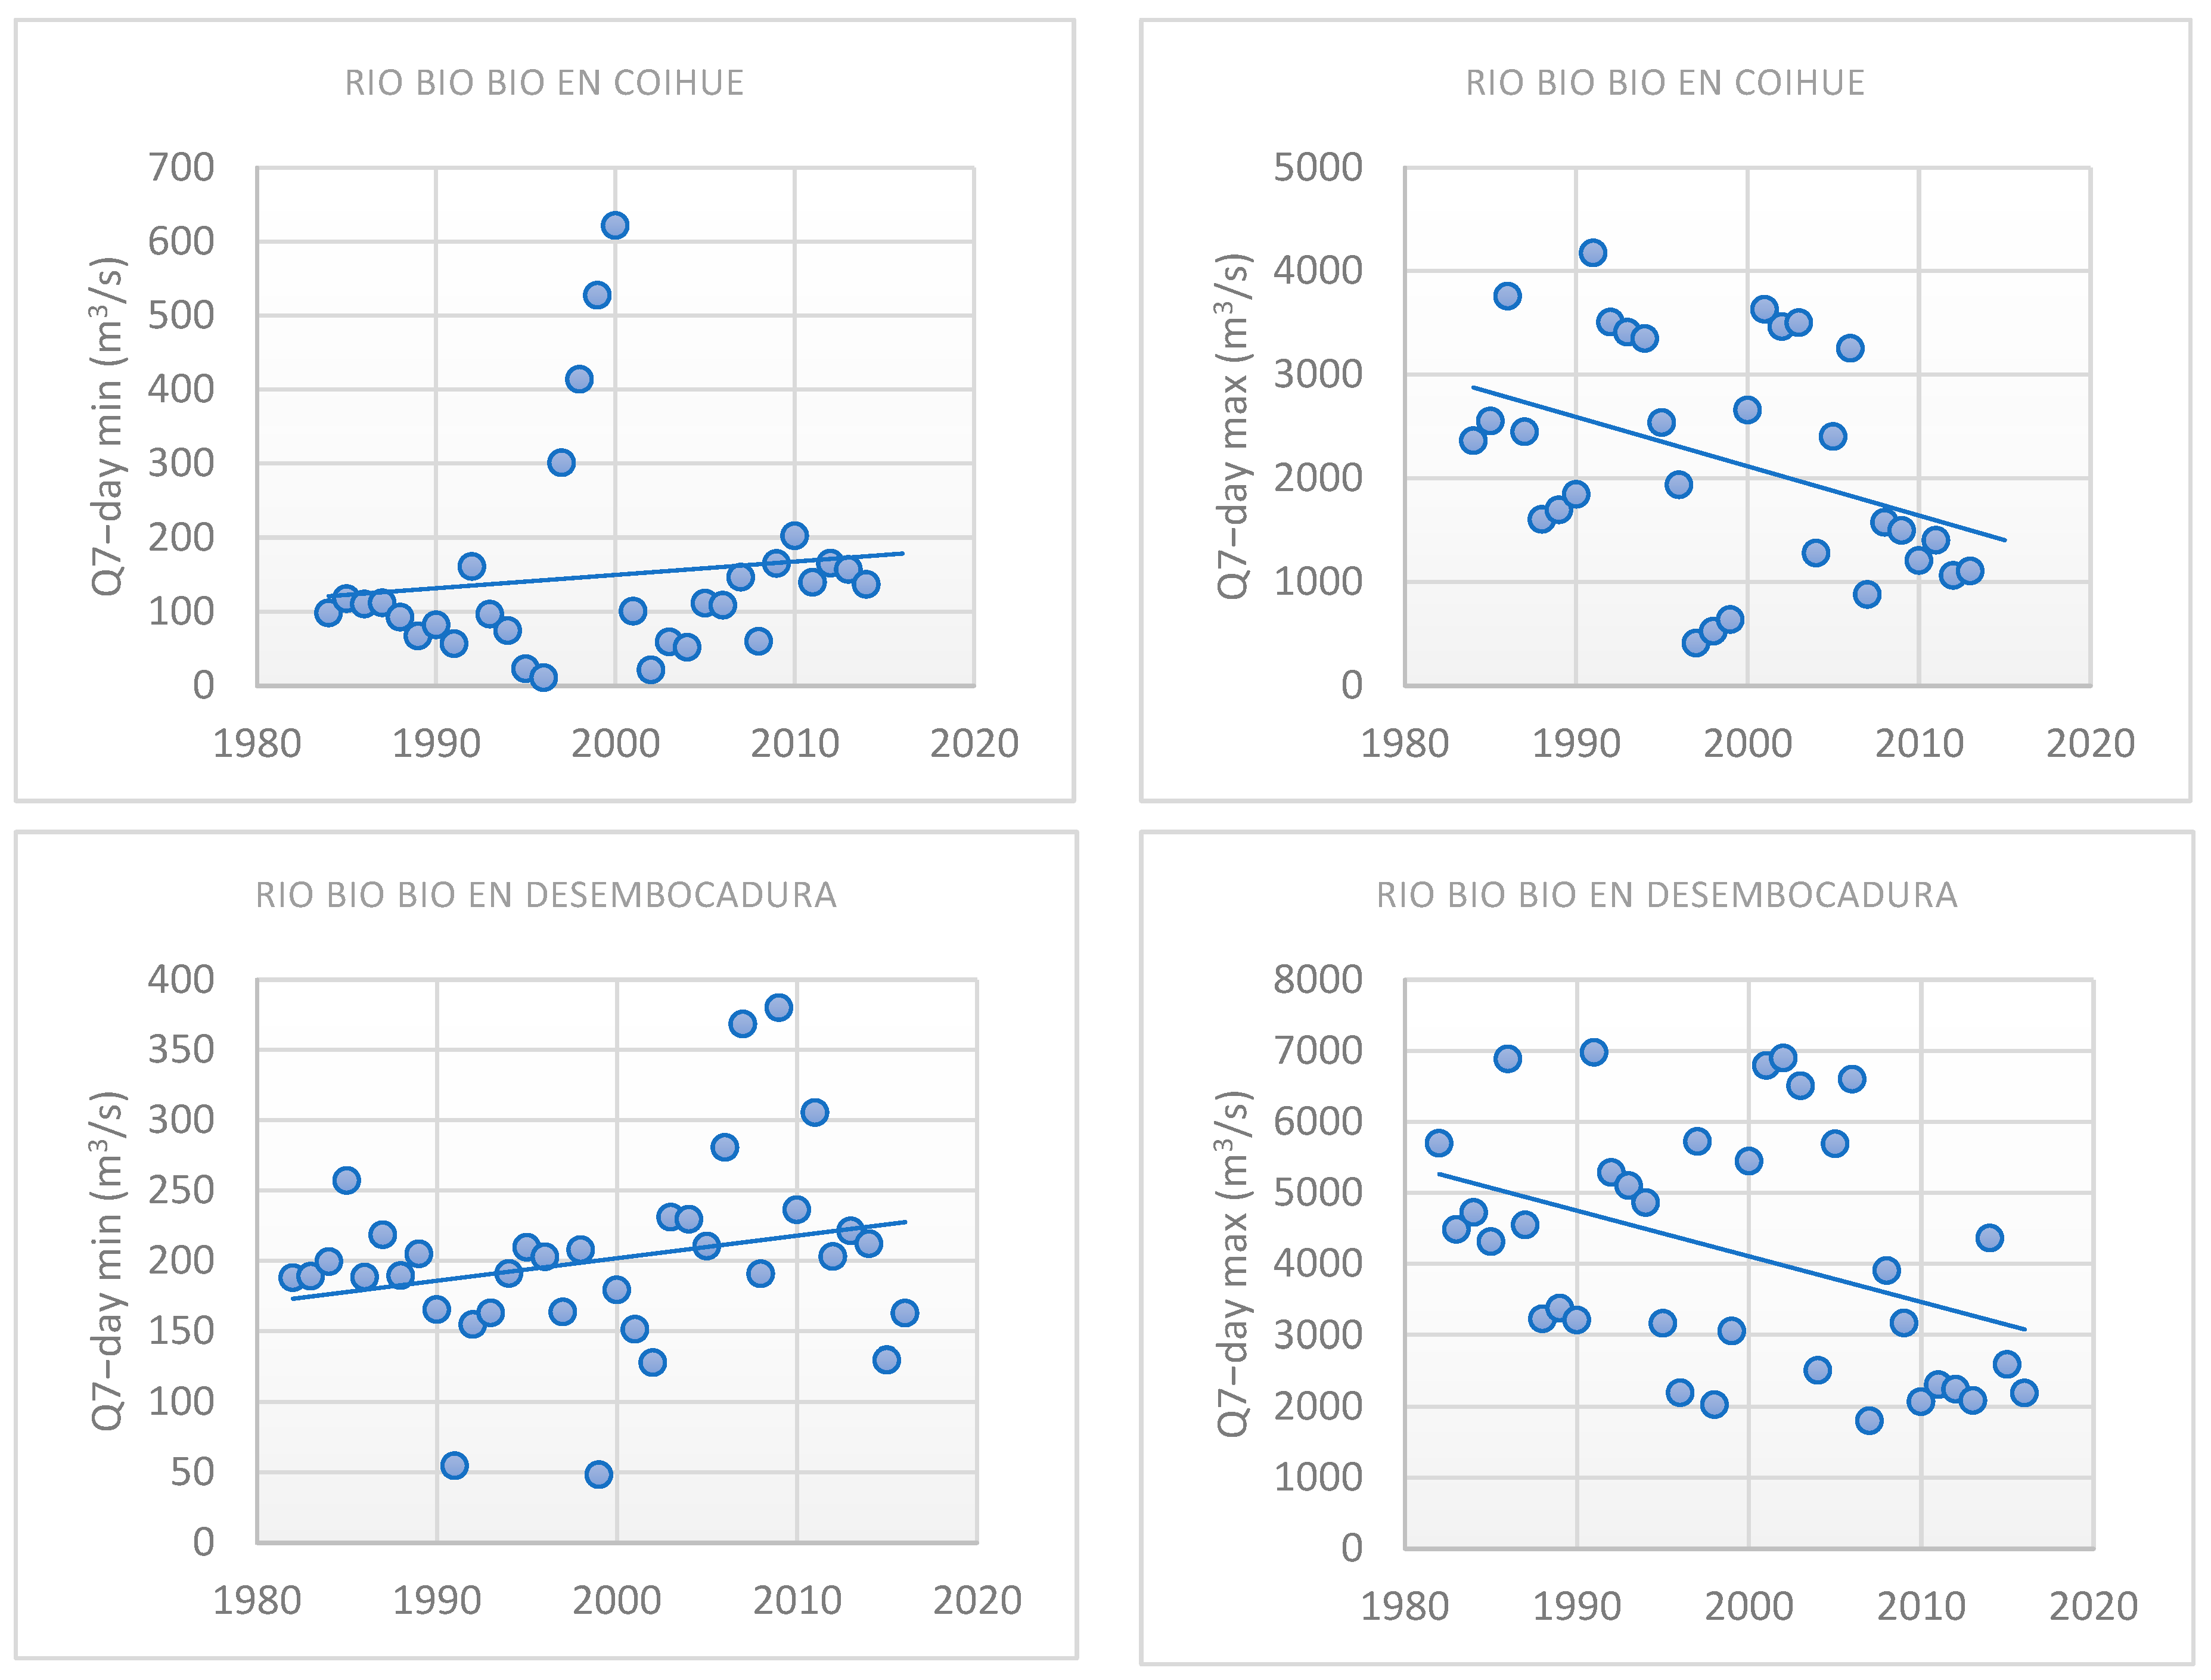
3.1.4. Biobío River Basin
3.2. Baseflow Index (BFI)
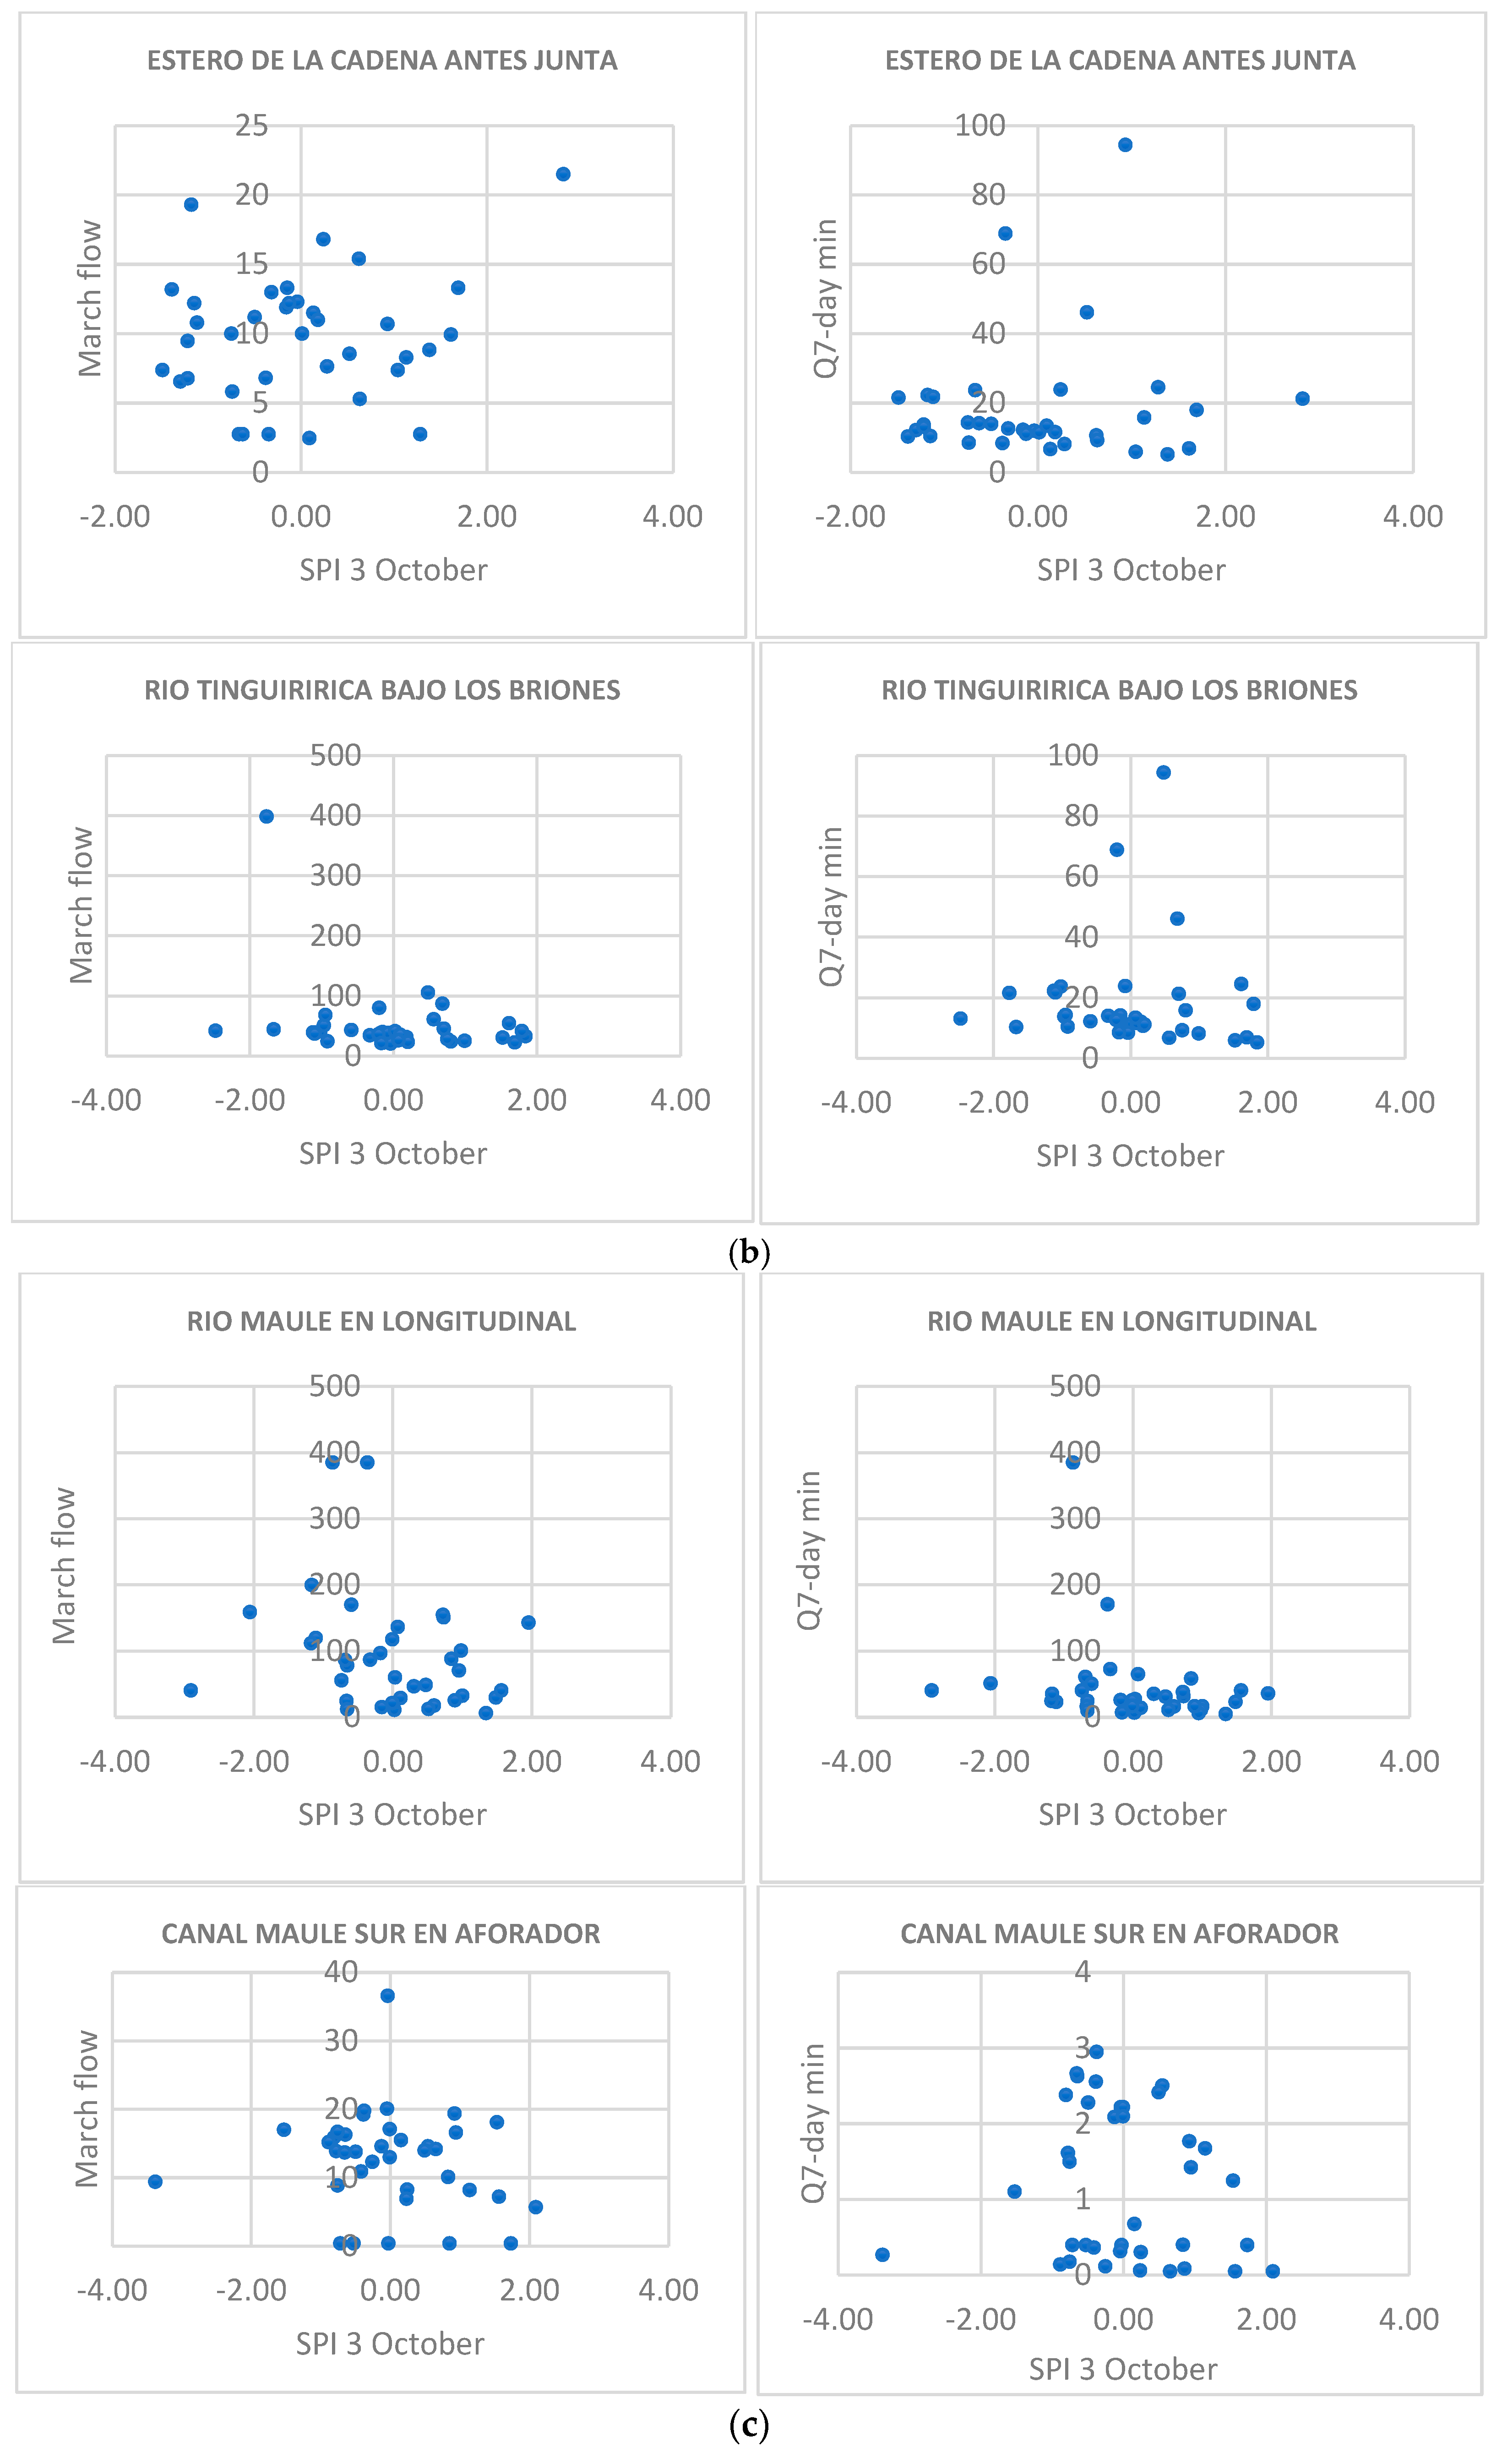
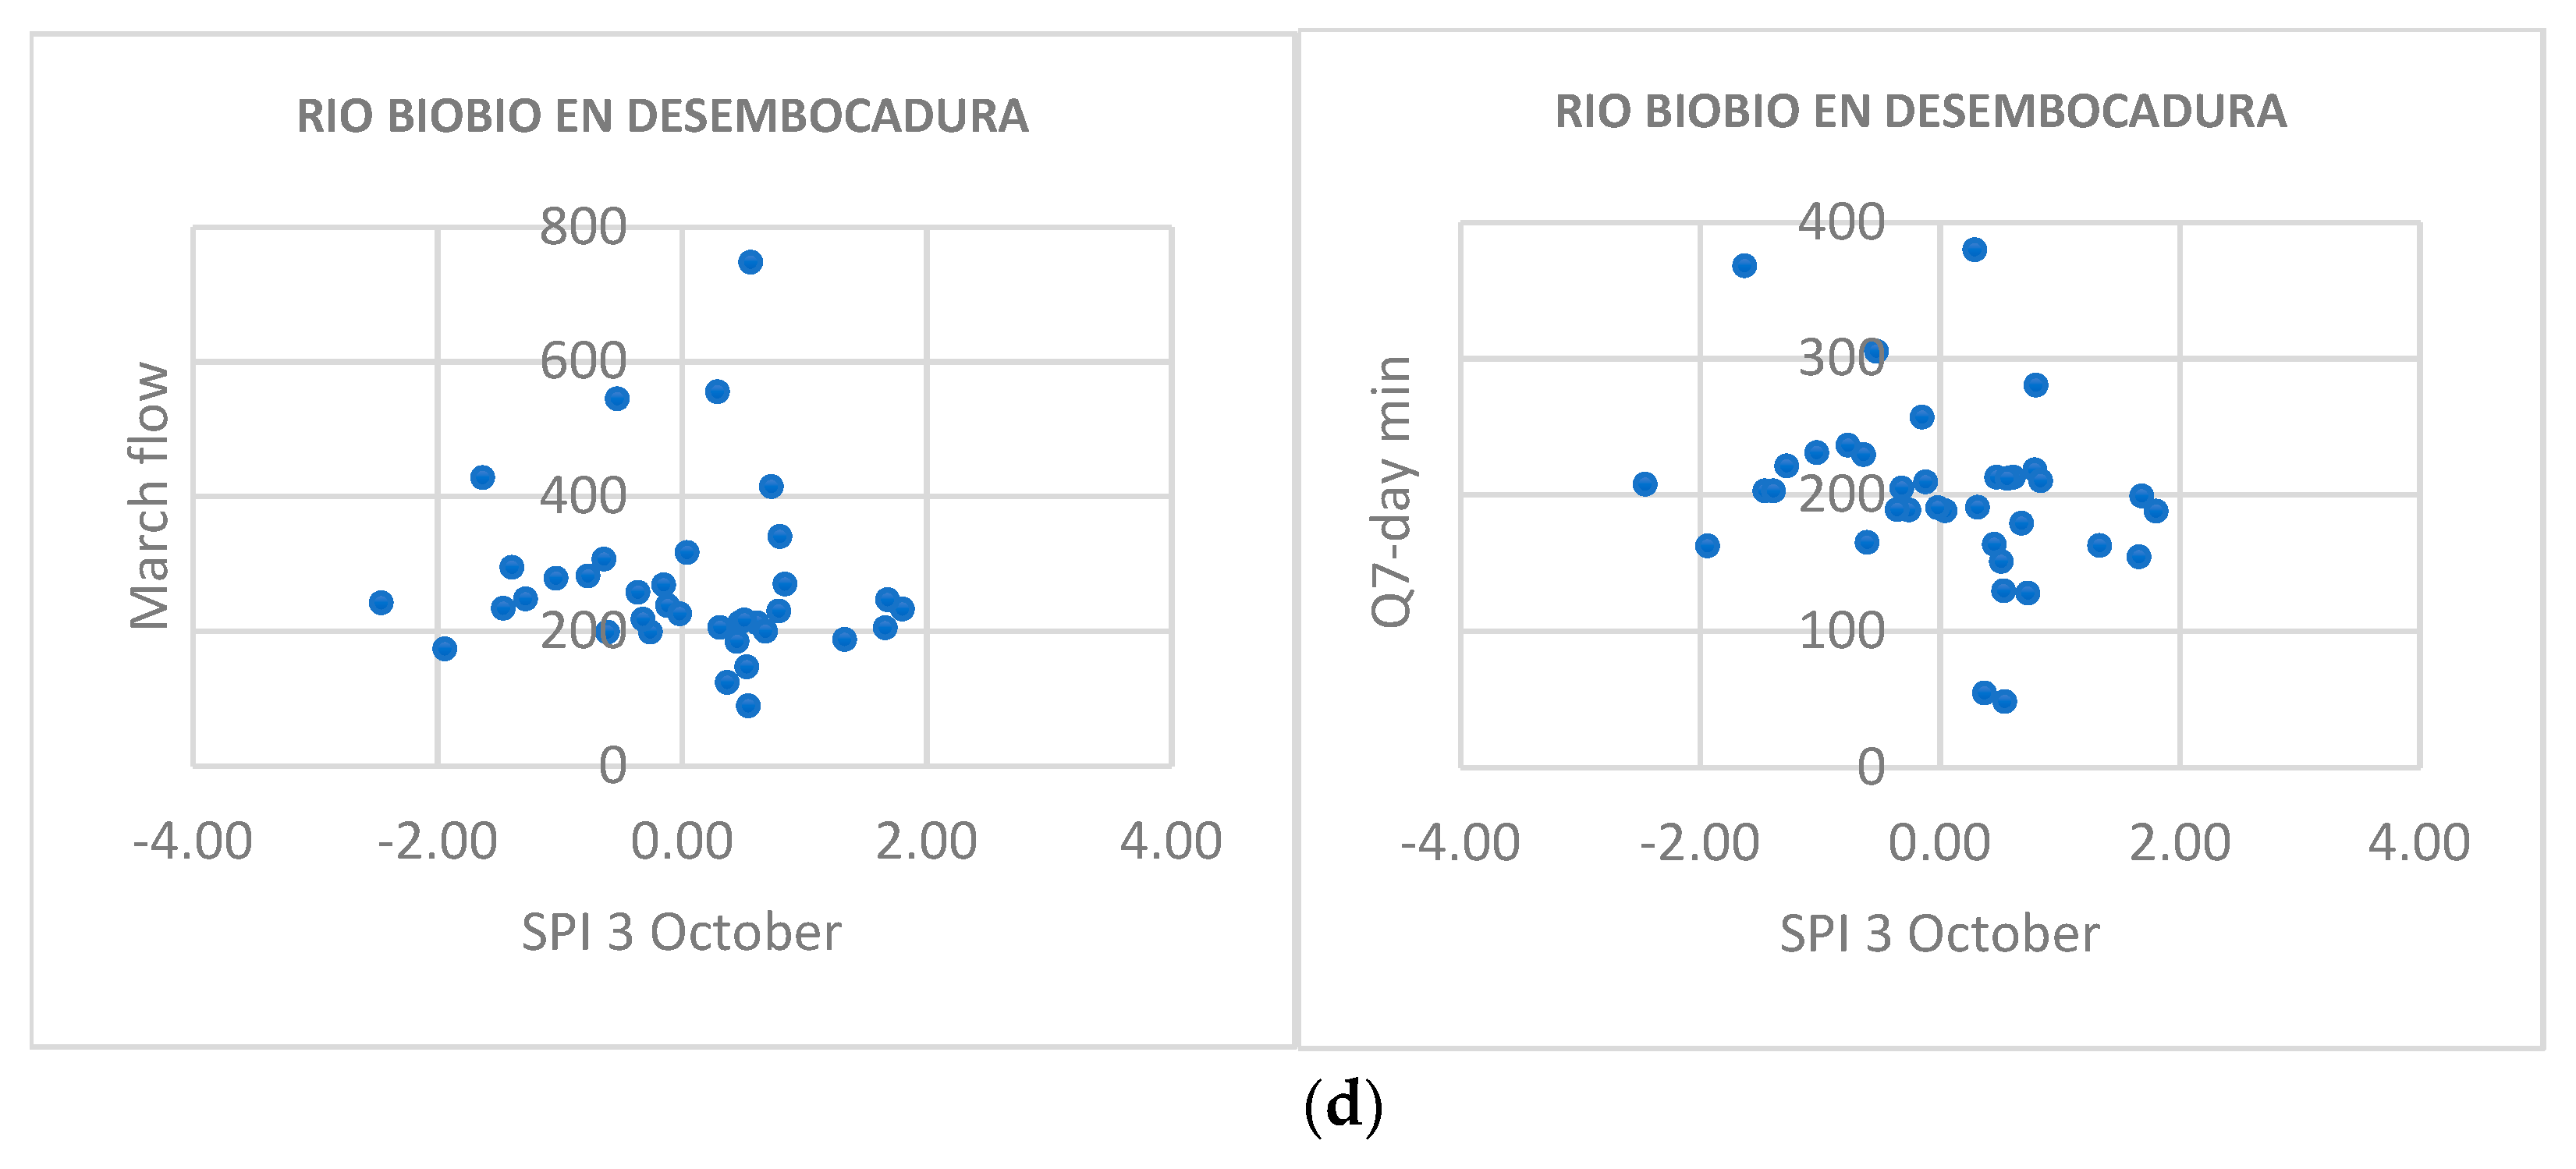
3.3. SPI Index
4. Discussions
5. Conclusions
Author Contributions
Funding
Data Availability Statement
Acknowledgments
Conflicts of Interest
References
- IPCC. Summary for Policymakers. In Climate Change 2023: Synthesis Report. Contribution of Working Groups I, II and III to the Sixth Assessment Report of the Intergovernmental Panel on Climate Change; Core Writing Team, Lee, H., Romero, J., Eds.; Intergovernmental Panel on Climate Change (IPCC): Geneva, Switzerland, 2023. [Google Scholar] [CrossRef]
- MacAlister, C.; Baggio, G.; Perera, D.; Qadir, M.; Taing, L.; Smakhtin, V. Global Water Security 2023 Assessment; United Nations, University Institute for Water, Environment and Health: Hamilton, ON, Canada, 2023. [Google Scholar]
- OECD. Water Governance in OECD Countries: A Multi-Level Approach; OECD Publishing: Paris, France, 2011. [Google Scholar]
- Agarwal, A.; de los Angeles, M.; Bhatia, R.; Chéret, I.; Davila-Poblete, S.; Falkenmark, M.; Gonzalez Villareal, F.; Jønch-Clausen, T.; Ait Kadi, M.; Kindler, J. Integrated Water Resources Management; Global Water Partnership: Stockholm, Sweden, 2000. [Google Scholar]
- Stewart, B. Measuring what we manage–the importance of hydrological data to water resources management. Proc. Int. Assoc. Hydrol. Sci. 2015, 366, 80–85. [Google Scholar] [CrossRef]
- Ghannem, S.; Bergillos, R.J.; Paredes-Arquiola, J.; Martínez-Capel, F.; Andreu, J. Coupling hydrological, habitat and water supply indicators to improve the management of environmental flows. Sci. Total Environ. 2023, 898, 165640. [Google Scholar] [CrossRef] [PubMed]
- OECD. OECD Principles on Water Governance; OECD Water Governance Programme: Paris, France, 2015. [Google Scholar]
- Grantham, T.E.; Figueroa, R.; Prat, N. Water management in mediterranean river basins: A comparison of management frameworks, physical impacts, and ecological responses. Hydrobiologia 2013, 719, 451–482. [Google Scholar] [CrossRef]
- Andrew, J.T.; Sauquet, E. Climate change impacts and water management adaptation in two mediterranean-climate watersheds: Learning from the Durance and Sacramento Rivers. Water 2017, 9, 126. [Google Scholar] [CrossRef]
- Figueroa, R.; Bónada, N.; Guevara, M.; Pedreros, P.; Correa-Araneda, F.; Díaz, M.E.; Ruiz, V.H. Freshwater biodiversity and conservation in mediterranean climate streams of Chile. Hydrobiologia 2013, 719, 269–289. [Google Scholar] [CrossRef]
- Armesto, J.J.; Arroyo, M.T.K.; Hinojosa, L.F. The mediterranean environment of Chile. In The Physical Geography of South America; Veblen Thomas, T., Young Kenneth, R., Orme Antony, R., Eds.; Universidad de Chile: Santiago, Chile, 2007. [Google Scholar]
- World Bank Group. Climate Risk Country Profile: Chile. 2021. Available online: https://climateknowledgeportal.worldbank.org/country/chile/climate-data-historical (accessed on 3 January 2025).
- Niemeyer, H.; Cereceda, P. Geografía de Chile. Tomo VIII Hidrografía; Instituto Geográfico Militar: Santiago, Chile, 1989. [Google Scholar]
- Fuentes, E. Sinopsis de paisajes de Chile central. In Ecología del Paisaje en Chile Central Estudios sobre sus Espacios Montañosos; Fuentes, E., Prenafeta, S., Eds.; Universidad Católica de Chile: Santiago, Chile, 1988; pp. 17–27. [Google Scholar]
- Garreaud, R.D.; Alvarez-Garreton, C.; Barichivich, J.; Boisier, J.P.; Christie, D.; Galleguillos, M.; LeQuesne, C.; McPhee, J.; Zambrano-Bigiarini, M. The 2010–2015 megadrought in central Chile: Impacts on regional hydroclimate and vegetation. Hydrol. Earth Syst. Sci. 2017, 21, 6307–6327. [Google Scholar] [CrossRef]
- Grafton, R.Q.; Pittock, J.; Davis, R.; Williams, J.; Fu, G.; Warburton, M.; Udall, B.; McKenzie, R.; Yu, X.; Che, N.; et al. Global insights into water resources, climate change and governance. Nat. Clim. Change 2013, 3, 315–321. [Google Scholar] [CrossRef]
- Rivera, R.; Leal, C.; Barra, R.O. Toward Water Security (SDG 6) amidst the Climate and Water Crisis: Lessons from Chile. Environ. Sci. Technol. 2023, 57, 12940–12943. [Google Scholar] [CrossRef]
- Alcayaga, H.; Palma, S.; Caamaño, D.; Mao, L.; Soto-Alvarez, M. Detecting and quantifying hydromorphology changes in a chilean river after 50 years of dam operation. J. S. Am. Earth Sci. 2019, 93, 253–266. [Google Scholar] [CrossRef]
- Dirección General de Aguas. Atlas del Agua; Ministerio de Obras Públicas: Santiago, Chile, 2016. [Google Scholar]
- Vicuña, S.; Bustos, E. Vulnerability and Adaptation to Climate Variability and Change in the Maipo Basin, Central Chile. Final Technical Report. 2016. Available online: https://cambioglobal.uc.cl/wp-content/uploads/2023/09/Informe_Tecnico_Final_Proyecto_MAPA-Maipo_Plan_de_Adaptacion.pdf (accessed on 17 February 2025).
- Dirección General de Aguas. Diagnostico y Clasificacion de los Cursos y Cuerpos de Agua Segun Objetivos de Calidad. Cuenca del río Rapel. 2004. Available online: https://mma.gob.cl/wp-content/uploads/2017/12/Rapel.pdf (accessed on 15 December 2024).
- Roco, L.; Poblete, D.; Meza, F.; Kerrigan, G. Farmers’ options to address water scarcity in a changing climate: Case studies from two basins in Mediterranean Chile. Environ. Manag. 2016, 58, 958–971. [Google Scholar] [CrossRef]
- Elgueta, A.; Thoms, M.C.; Górski, K.; Díaz, G.; Habit, E.M. Functional process zones and their fish communities in temperate Andean river networks. River Res. Appl. 2019, 35, 1702–1711. [Google Scholar] [CrossRef]
- Escenarios Hidricos 2030. Maipo Resiliente, de la Crisis a la Regeneración Hídrica en la Cuenca del Río Maipo; Fundación Chile: Santiago, Chile, 2024. [Google Scholar]
- BCN. Hidrografía Región del Maule. Biblioteca del Congreso Nacional de Chile. 2017. Available online: https://www.bcn.cl/siit/nuestropais/region7/hidrografia.htm (accessed on 10 December 2024).
- Masotti, I.; Aparicio-Rizzo, P.; Yevenes, M.A.; Garreaud, R.; Belmar, L.; Farías, L. The influence of river discharge on nutrient export and phytoplankton biomass off the Central Chile coast (33–37 S): Seasonal cycle and interannual variability. Front. Mar. Sci. 2018, 5, 423. [Google Scholar] [CrossRef]
- CIREN. Precordillera de Santiago-Cajón del Maipo. 2021. Available online: https://observatorio.ciren.cl/profile/clima/precordillera-santiago-cajon-del-maipo (accessed on 20 December 2024).
- Bennison, G.; Rojas, R.; Claro, E.; Gálvez, V.; Bridgart, R.; Caroca, M. Gestión Integrada de Recursos Hídricos Cuenca del Río Rapel–Informe Final (Etapas 1 y 2); Fundación CSIRO Chile Research: Santiago, Chile, 2021. [Google Scholar]
- Escenarios Hidricos 2030. Cuenca del río Maule. Available online: https://escenarioshidricos.cl/nuestro-trabajo/cuenca-del-rio-maule/ (accessed on 15 November 2024).
- Universidad de Concepción-Departamento de Recursos Hídricos. Plan Estratégico de Gestión Hidrica En La Cuenca Del Biobío; Dirección General de Aguas-Ministerio de Obras Públicas: Santiago, Chile, 2021. [Google Scholar]
- Dirección General de Aguas. Inventario de Cuencas, Subcuencas y Subsubcuenas de Chile, Gobierno de Chile. Available online: https://bibliotecadigital.ciren.cl/items/d9c31b57-5479-49d3-af64-d03e6a374b1a (accessed on 22 November 2024).
- Instituto Nacional de Estadísticas. Síntesis de Resultados. Censo 2017; Instituto Nacional de Estadísticas: Santiago, Chile, 2018. [Google Scholar]
- Vicuña, S.; Bustos, E. Plan Estratégico de Gestión Hídrica en la Cuenca del Maule; DGA-División de Estudios y Planificación: Santiago, Chile, 2020. [Google Scholar]
- Dirección General de Aguas. Estimación de la Demanda Actual, Proyecciones Futuras y Caracterización de la Calidad de Los Recursos Hídricos en Chile; Ministerio de Obras Públicas: Santiago, Chile, 2017. [Google Scholar]
- Fundación Chile. Reporte Huella hídrica en Chile. Sectores Prioritarios de la Cuenca del río Rapel; Fundación Chile: Santiago, Chile, 2015. [Google Scholar]
- Barría, P.; Rojas, M.; Moraga, P.; Muñoz, A.; Bozkurt, D.; Alvarez-Garreton, C. Anthropocene and streamflow: Long-term perspective of streamflow variability and water rights. Elem. Sci. Anthr. 2019, 7, 2. [Google Scholar] [CrossRef]
- Figueroa, R.; Parra, O.; Díaz, M.E. La cuenca hidrográfica del río Biobío. In Centro EULA Evoución y Perspectivas a 30 años de su Creación; Universidad de Concepción: Concepción, Chile, 2020; pp. 91–138. [Google Scholar]
- Bormann, H.; Pinter, N.; Elfert, S. Hydrological signatures of flood trends on German rivers: Flood frequencies, flood heights and specific stages. J. Hydrol. 2011, 404, 50–66. [Google Scholar] [CrossRef]
- Richter, B.D.; Baumgartner, J.V.; Powell, J.; Braun, D.P. A method for assessing hydrologic alteration within ecosystems. Conserv. Biol. 1996, 10, 1163–1174. [Google Scholar] [CrossRef]
- Richter, B.D.; Baumgartner, J.V.; Wigington, R.; Braun, D. How much water does a river need? Freshw. Biol. 1997, 37, 231–249. [Google Scholar] [CrossRef]
- Olden, J.D.; Poff, N.L. Redundancy and the choice of hydrologic indices for characterizing streamflow regimes. River Res. Appl. 2003, 19, 101–121. [Google Scholar] [CrossRef]
- Xiong, B.; Xiong, L.; Chen, J.; Xu, C.-Y.; Li, L. Multiple causes of nonstationarity in the Weihe annual low-flow series. Hydrol. Earth Syst. Sci. 2018, 22, 1525–1542. [Google Scholar] [CrossRef]
- Jelovčan, M.; Šraj, M. Comprehensive low-flow analysis of the Vipava river. Acta Geogr. Slov. 2022, 62, 37–53. [Google Scholar] [CrossRef]
- Massey, F.J., Jr. The Kolmogorov-Smirnov test for goodness of fit. J. Am. Stat. Assoc. 1951, 46, 68–78. [Google Scholar] [CrossRef]
- Kendall, M.G. Rank Correlation Methods; Griffin: London, UK, 1975. [Google Scholar]
- McKee, T.B.; Doesken, N.J.; Kleist, J. The relationship of drought frequency and duration to time scales. In Proceedings of the 8th Conference on Applied Climatology, Anaheim, CA, USA, 17–22 January 1993; pp. 179–183. [Google Scholar]
- CADE-IDEPE. Diagnóstico y Clasificación de los Cursos y Cuerpos de Agua Según Objetivos de Calidad: Informe Final, año 2004; Dirección General de Aguas: Santiago, Chile, 2004. [Google Scholar]
- Salcedo-Castro, J.; Olita, A.; Saavedra, F.; Saldías, G.S.; Cruz-Gómez, R.C.; De La Torre Martínez, C.D. Modeling the interannual variability in Maipo and Rapel river plumes off central Chile. Ocean Sci. 2023, 19, 1687–1703. [Google Scholar] [CrossRef]
- Villablanca, L.; Batalla, R.J.; Piqué, G.; Iroumé, A. Hydrological effects of large dams in Chilean rivers. J. Hydrol. Reg. Stud. 2022, 41, 101060. [Google Scholar] [CrossRef]
- Álamos, N.; Alvarez-Garreton, C.; Muñoz, A.; González-Reyes, Á. The influence of human activities on streamflow reductions during the megadrought in central Chile. Hydrol. Earth Syst. Sci. 2024, 28, 2483–2503. [Google Scholar] [CrossRef]
- Escanilla-Minchel, R.; Alcayaga, H.; Soto-Alvarez, M.; Kinnard, C.; Urrutia, R. Evaluation of the impact of climate change on runoff generation in an andean glacier watershed. Water 2020, 12, 3547. [Google Scholar] [CrossRef]
- Cortés Gonzalez, A.C.; Alcayaga, H.; Escanilla-Minchel, R.; Aguayo, M.; Aguayo, M.; Orellana, C. Evaluation of the effects of climatic variabilities on future hydrological scenarios: Application to a coastal basin in Central Chile. Hydrol. Res. 2024, 55, 1197–1216. [Google Scholar] [CrossRef]
- Garreaud, R.D.; Boisier, J.P.; Rondanelli, R.; Montecinos, A.; Sepúlveda, H.H.; Veloso-Aguila, D. The central Chile mega drought (2010–2018): A climate dynamics perspective. Int. J. Climatol. 2020, 40, 421–439. [Google Scholar] [CrossRef]
- Masiokas, M.H.; Rabatel, A.; Rivera, A.; Ruiz, L.; Pitte, P.; Ceballos, J.L.; Barcaza, G.; Soruco, A.; Bown, F.; Berthier, E.; et al. A review of the current state and recent changes of the Andean cryosphere. Front. Earth Sci. 2020, 8, 1–27. [Google Scholar] [CrossRef]
- Flörke, M.; Schneider, C.; McDonald, R.I. Water competition between cities and agriculture driven by climate change and urban growth. Nat. Sustain. 2018, 1, 51–58. [Google Scholar] [CrossRef]
- Gleick, P.H. Water use. Annu. Rev. Environ. Resour. 2003, 28, 275–314. [Google Scholar] [CrossRef]
- Vuille, M.; Carey, M.; Huggel, C.; Buytaert, W.; Rabatel, A.; Jacobsen, D.; Soruco, A.; Villacis, M.; Yarleque, C.; Timm, O.E.; et al. Rapid decline of snow and ice in the tropical Andes—Impacts, uncertainties and challenges ahead. Earth-Sci. Rev. 2018, 176, 195–213. [Google Scholar] [CrossRef]
- Donoso, G. Water Policy in Chile; Global Issues in Water Policy Series Vol. 21; Springer International Publishing: Cham, Switzerland, 2018. [Google Scholar] [CrossRef]
- Walters, J.P.; Alcayaga, H.; Busco, C.; Araya, T. Mapping and Managing Organization Objectives: A Case Study of the Alto Maipo Hydroelectric Project in Chile. J. Water Resour. Plan. Manag. 2021, 147, 5021022. [Google Scholar] [CrossRef]
- Díaz, G.; Arriagada, P.; Górski, K.; Link, O.; Karelovic, B.; Gonzalez, J.; Habit, E. Fragmentation of Chilean Andean rivers: Expected effects of hydropower development. Rev. Chil. Hist. Nat. 2019, 92, 1. [Google Scholar] [CrossRef]
- Poff, N.L.; Allan, J.D.; Bain, M.B.; Karr, J.R.; Prestegaard, K.L.; Richter, B.D.; Sparks, R.E.; Stromberg, J.C. The natural flow regime. Bioscience 1997, 47, 769–784. [Google Scholar] [CrossRef]
- Bin Ashraf, F.; Haghighi, A.T.; Riml, J.; Alfredsen, K.; Koskela, J.J.; Kløve, B.; Marttila, H. Changes in short term river flow regulation and hydropeaking in Nordic rivers. Sci. Rep. 2018, 8, 17232. [Google Scholar] [CrossRef]
- Vorosmarty, C.J.; Green, P.; Salisbury, J.; Lammers, R.B. Global water resources: Vulnerability from climate change and population growth. Science 2000, 289, 284–288. [Google Scholar] [CrossRef]
- Drobinski, P.; Ducrocq, V.; Alpert, P.; Anagnostou, E.; Béranger, K.; Borga, M.; Braud, I.; Chanzy, A.; Davolio, S.; Delrieu, G.; et al. HyMeX: A 10-year multidisciplinary program on the Mediterranean water cycle. Bull. Am. Meteorol. Soc. 2014, 95, 1063–1082. [Google Scholar] [CrossRef]
- Tramblay, Y.; Arnaud, P.; Artigue, G.; Lang, M.; Paquet, E.; Neppel, L.; Sauquet, E. Changes in Mediterranean flood processes and seasonality. Hydrol. Earth Syst. Sci. Discuss. 2023, 27, 2973–2987. [Google Scholar] [CrossRef]
- Calizaya, E.; Mejía, A.; Barboza, E.; Calizaya, F.; Corroto, F.; Salas, R.; Vásquez, H.; Turpo, E. Modelling snowmelt runoff from tropical Andean glaciers under climate change scenarios in the Santa River sub-basin (Peru). Water 2021, 13, 3535. [Google Scholar] [CrossRef]
- Alvarez-Garreton, C.; Boisier, J.P.; Garreaud, R.; Seibert, J.; Vis, M. Progressive water deficits during multiyear droughts in basins with long hydrological memory in Chile. Hydrol. Earth Syst. Sci. 2021, 25, 429–446. [Google Scholar] [CrossRef]
- McCarthy, M.; Meier, F.; Fatichi, S.; Stocker, B.D.; Shaw, T.E.; Miles, E.; Dussaillant, I.; Pellicciotti, F. Glacier contributions to river discharge during the current Chilean megadrought. Earth’s Futur. 2022, 10, e2022EF002852. [Google Scholar] [CrossRef]
- Bloomfield, J.P.; Gong, M.; Marchant, B.P.; Coxon, G.; Addor, N. How is Baseflow Index (BFI) impacted by water resource management practices? Hydrol. Earth Syst. Sci. 2021, 25, 5355–5379. [Google Scholar] [CrossRef]
- Van Dongen, R.; Scherler, D.; Wendi, D.; Deal, E.; Mao, L.; Marwan, N.; Meier, C.I. El Niño Southern Oscillation (ENSO)-induced hydrological anomalies in central Chile. EGUsphere 2022, 2022, 1–31. [Google Scholar] [CrossRef]
- Bormann, H.; Pinter, N. Trends in low flows of German rivers since 1950: Comparability of different low-flow indicators and their spatial patterns. River Res. Appl. 2017, 33, 1191–1204. [Google Scholar] [CrossRef]


| Maipo | Rapel | Maule | Biobío | |
|---|---|---|---|---|
| Basin area (km2) | 15,273 [19] | 13,766 [19] | 21,052 [19] | 24,369 [19] |
| Location | 32°55′ and 34°15′ south latitude | 33°53′ and 35°01′ south latitude | 35°05′ and 36°30′ south latitude | 36.7° and 38.9° south latitude |
| River length (Km) | 225 [19] | 240 [10] | 213 [19] | 370 [19] |
| Climate | Mediterranean semi-arid [20] | Mediterranean template [21] | Temperate Mediterranean [22] | Wet–temperate with a Mediterranean influence [23] |
| Average discharge (m3 s−1) | 145,.67 m3/s [24] | Cachapoal: 89.0 m3/s Tinguiririca: 50.2 m3/s [19] | 467 m3/s [25] | 1000 m3/s [26] |
| Mean annual precipitation | 380 mm [27] | 898 mm [28] | 735 mm [29] | 1746.72 mm [30] |
| Sub-basins | Maipo Alto, Maipo Medio, Mapocho Alto, Mapocho Bajo, and Maipo Bajo [31] | Cachapoal alto, Cachapoal bajo Tinguiririca alto, Tinguiririca bajo, Alhue, and Rapel [31] | Maule Alto, Melado, Maule Medio, Perquilauquen Alto, Perquilauquen Bajo, Loncomilla, Maule entre Loncomilla y Claro, Claro, Maule Bajo [31] | Río Biobío Alto (hasta después junta Río Lamin), Río Biobío entre Río Ranquil y Río Duqueco, Río Duqueco, Río Biobío entre Río Duqueco y Río Vergara, Río Renaico, Ríos Malleco y Vergara, Río Biobío entre Río Vergara y Río Laja, Río Laja Alto (hasta bajo junta Río Rucue), Laja Bajo, Río Biobío Bajo [31] |
| Population | 7,112,808 96.3% urban [32] | 866,000 72% urban [32] | 852,035 72.1% urban 38.9 rural [33] | 1,400,000 90% urban [32] |
| Agriculture water demands | 61.6% of total water use [34] | 93% of total water use [35] | 26% of total water use [36] | 42% of total water use [34] |
| Drinking water demands | 659,893 Mm3/year urban 11,570 Mm3/year rural [34] | 43,074 Mm3/year urban 28,524 Mm3/year rural [34] | 31,240 Mm3/year urban 11,240 Mm3/year rural [33] | 41,745 Mm3/year Urban 4575 Mm3/year Rural [34] |
| Industry water demands | 38,468 Mm3/year [34] | 12,276 Mm3/year [34] | 35,500 Mm3/year [33] | 350,470 Mm3/year [34] |
| Mining water demands | 23,442 Mm3/year [34] | 70,721 [34] | - | - |
| Energy water demands | 300 MW [20] | 26 hydroelectric power plants 1033.85 MW [28] | 25 hydroelectric power plants 447.01 m3/s 1680 MW [33] | 17 hydroelectric power plants, producing more than 2800 MW) [37] 17% of total water consumption [34] |
| Basin | Stations | Latitude | Longitude | Altitude (m) | |
|---|---|---|---|---|---|
| Maipo River | ST1 | Río Maipo en las Hualtatas | 33°59′ | 70°10′ | 1820 |
| ST2 | Río Volcan en Queltehues | 33°48′ | 70°12′ | 1365 | |
| ST3 | Río Colorado antes junta Río Olivares | 33°30′ | 70°08′ | 1500 | |
| ST4 | Río Olivares antes junta Río Colorado | 33°29′ | 70°08′ | 1500 | |
| ST5 | Río Colorado antes junta Río Maipo | 33°59′ | 70°22′ | 890 | |
| ST6 | Río Maipo en El Manzano | 33°35′ | 70°24′ | 850 | |
| Rapel River | ST1 | Río Cachapoal en Puente Termas de Cauquenes | 34°15′00″ | 70°34′00″ | 700 |
| ST2 | Estero La Cadena antes junta Río Cachapoal | 34°11′03″ | 70°50′37″ | 440 | |
| ST3 | Río Tinguiririca Bajo los Briones | 34°43′07″ | 70°49′36″ | 560 | |
| ST4 | Río Tinguiririca en los Olmos | 34°29′32″ | 71°22′23″ | 223 | |
| Maule River | ST1 | Canal Maule Sur en Aforador | 35°38′20″ | 71°23′02″ | 315 |
| ST2 | Canal Duao Zapata | 35°35′21″ | 71°32′09″ | 0 | |
| ST3 | Río Maule en Longitudal | 35°33′27″ | 71°42′24″ | 90 | |
| ST4 | Río Maule en Forel | 35°24′25″ | 72°12′30″ | 30 | |
| Biobío River | ST1 | Río Biobío en Llanquén | 38°12′03″ | 71°17′56″ | 767 |
| ST2 | Río Biobío en Rucalhue | 37°42′38″ | 71°54′06″ | 261 | |
| ST3 | Río Biobío en Coihue | 37°33′01″ | 72°35′25″ | 60 | |
| ST4 | Río Biobío en Desembocadura | 36°50′19″ | 73°03′43″ | 16 | |
| Station Name | Río Maipo En Las Hualtatas | Station Name | Río Volcan En Queltehues | ||||||
| Indices (m3/s) | Norm test Result | Flow Range (m3/s) | Slope | p-Value | Indices (m3/s) | Norm test Result | Flow Range (m3/s) | Slope | p-Value |
| 1-day min | normal | 1.15–28.4 | 0.150 | 0.250 | 1-day min | normal | 0.0530–1.46 | −0.003 | 0.50 |
| 3-day min | normal | 1.37–28.4 | 0.128 | 0.250 | 3-day min | normal | 0.0563–1.48 | −0.003 | 0.50 |
| 7-day min | normal | 1.44–28.4 | 0.124 | 0.250 | 7-day min | normal | 0.0676–1.64 | −0.002 | 0.50 |
| 30-day min | normal | 1.61–28.4 | 0.110 | 0.250 | 30-day min | normal | 0.1251–2.4 | −0.002 | 0.50 |
| 90-day min | normal | 6.60–30.1 | 0.106 | 0.250 | 90-day min | normal | 0.3244–4.76 | −0.005 | 0.50 |
| 1-day max | normal | 27.00–181 | −1.740 | 0.005 | 1-day max | normal | 0.9570–71.5 | −0.508 | 0.10 |
| 3-day max | normal | 26.07–180 | −1.700 | 0.005 | 3-day max | normal | 0.9110–69.7 | −0.473 | 0.10 |
| 7-day max | normal | 24.39–177 | −1.630 | 0.005 | 7-day max | normal | 0.8544–65.9 | −0.395 | 0.10 |
| 30-day max | normal | 23.43–165 | −1.440 | 0.005 | 30-day max | normal | 0.7787–58.6 | −0.323 | 0.25 |
| 90-day max | normal | 20.77–139 | −1.220 | 0.005 | 90-day max | normal | 0.7662–49.5 | −0.288 | 0.10 |
| Station Name | Río Colorado Antes Junta Río Olivares | Station Name | Río Olivares Antes Junta Río Colorado | ||||||
| Indices (m3/s) | Norm test Result | Flow Range m3/s | Slope | p-Value | Indices (m3/s) | Norm test Result | Flow Range m3/s | Slope | p-Value |
| 1-day min | not | 0.369–14.8 | −0.24 | 0.001 | 1-day min | not | 0.284–7.92 | −0.074 | 0.001 |
| 3-day min | not | 0.369–14.8 | −0.25 | 0.001 | 3-day min | not | 0.339–8.18 | −0.076 | 0.001 |
| 7-day min | not | 0.369–14.8 | −0.26 | 0.001 | 7-day min | not | 0.346–8.82 | −0.082 | 0.001 |
| 30-day min | not | 0.369–14.8 | −0.28 | 0.001 | 30-day min | not | 0.385–10.9 | −0.098 | 0.001 |
| 90-day min | not | 0.664–18.4 | −0.31 | 0.001 | 90-day min | not | 0.423–13.1 | −0.121 | 0.001 |
| 1-day max | normal | 6.59–262 | −1.74 | 0.005 | 1-day max | normal | 8.710–91.9 | −0.809 | 0.001 |
| 3-day max | normal | 4.903–192 | −1.48 | 0.005 | 3-day max | normal | 8.543–90.2 | −0.821 | 0.001 |
| 7-day max | normal | 4.674–182 | −1.4 | 0.005 | 7-day max | normal | 7.220–87 | −0.84 | 0.001 |
| 30-day max | normal | 3.828–149 | −1.15 | 0.005 | 30-day max | normal | 3.690–71.8 | −0.817 | 0.001 |
| 90-day max | normal | 3.156–142 | −1.05 | 0.005 | 90-day max | normal | 2.173–35.6 | −0.715 | 0.001 |
| Station Name | Río Colorado Antes Junta Río Maipo | Station Name | Río Maipo En El Manzano | ||||||
| Indices (m3/s) | Norm test Result | Flow Range m3/s | Slope | p-Value | Indices (m3/s) | Norm test Result | Flow Range m3/s | Slope | p-Value |
| 1-day min | normal | 2.13–19.8 | −0.14 | 0.005 | 1-day min | normal | 26.40–70.8 | −0.111 | 0.500 |
| 3-day min | normal | 2.17–25.6 | −0.18 | 0.005 | 3-day min | normal | 27.37–72.1 | −0.127 | 0.500 |
| 7-day min | normal | 3.71–29 | −0.19 | 0.005 | 7-day min | normal | 29.90–73.6 | −0.146 | 0.500 |
| 30-day min | normal | 8.13–33.2 | −0.20 | 0.005 | 30-day min | normal | 32.03–85.8 | −0.184 | 0.500 |
| 90-day min | normal | 8.55–50.9 | −0.26 | 0.025 | 90-day min | normal | 33.43–91.2 | −0.188 | 0.500 |
| 1-day max | normal | 44.30–135 | −1.32 | 0.001 | 1-day max | normal | 135.0–1135 | −6.951 | 0.025 |
| 3-day max | normal | 42.90–133 | −1.02 | 0.005 | 3-day max | normal | 120.7–985 | −6.5 | 0.025 |
| 7-day max | normal | 40.89–130 | −0.93 | 0.01 | 7-day max | normal | 113.0–740 | −6.265 | 0.010 |
| 30-day max | normal | 34.24–119 | −0.9 | 0.005 | 30-day max | normal | 100.4–654 | −4.761 | 0.010 |
| 90-day max | normal | 28.14–105 | −0.97 | 0.001 | 90-day max | normal | 87.06–533 | −3.592 | 0.010 |
| Station Name | Cachapoal En Puente Termas De Cauquenes | Station Name | Estero La Cadena Antes Junta Río Cachapoal | ||||||
| Indices (m3/s) | Norm Test Result | Flow Range m3/s | Slope | p-Value | Indices (m3/s) | Norm Test Result | Flow Range m3/s | Slope | p-Value |
| 1-day min | normal | 0.225–2.590 | 0.041 | 0.500 | 1-day min | normal | 0.225–5.54 | −0.004 | 0.500 |
| 3-day min | normal | 0.239–2.667 | 0.044 | 0.500 | 3-day min | normal | 0.2727–6.16 | −0.005 | 0.500 |
| 7-day min | normal | 0.281–3.166 | 0.056 | 0.500 | 7-day min | normal | 0.3246–6.461 | −0.006 | 0.500 |
| 30-day min | normal | 0.426–4.418 | 0.086 | 0.250 | 30-day min | normal | 0.4808–8.575 | −0.006 | 0.500 |
| 90-day min | normal | 1.130–7.130 | −0.049 | 0.500 | 90-day min | normal | 1.108–11.38 | −0.028 | 0.500 |
| 1-day max | normal | 62.30–618.0 | −37.95 | 0.001 | 1-day max | normal | 10.3–239 | −3.052 | 0.005 |
| 3-day max | normal | 53.53–540.0 | −31.07 | 0.001 | 3-day max | normal | 9.557–168 | −2.295 | 0.010 |
| 7-day max | normal | 44.57–515.9 | −24.41 | 0.010 | 7-day max | normal | 8.736–132.8 | −1.552 | 0.010 |
| 30-day max | normal | 26.81–461.1 | −19.37 | 0.025 | 30-day max | normal | 7.692–64.81 | −0.761 | 0.010 |
| 90-day max | normal | 21.58–330.3 | −13.76 | 0.025 | 90-day max | normal | 5.025–53.32 | −0.386 | 0.025 |
| Station Name | Río Tinguirririca Bajo Los Briones | Station Name | Río Tinguirririca En Los Olmos | ||||||
| Indices (m3/s) | Norm Test Result | Flow Range m3/s | Slope | p-Value | Indices (m3/s) | Norm Test Result | Flow Range m3/s | Slope | p-Value |
| 1-day min | not | 2.23–94.21 | −0.499 | 0.10 | 1-day min | normal | 0.245–11.20 | −0.427 | 0.050 |
| 3-day min | not | 3.85–94.28 | −0.458 | 0.10 | 3-day min | normal | 0.279–11.40 | −0.432 | 0.050 |
| 7-day min | not | 5.23–94.42 | −0.454 | 0.10 | 7-day min | normal | 0.299–11.50 | −0.561 | 0.025 |
| 30-day min | not | 6.18–95.23 | −0.524 | 0.05 | 30-day min | normal | 0.571–20.15 | −0.515 | 0.500 |
| 90-day min | not | 8.84–97.33 | −0.566 | 0.05 | 90-day min | normal | 0.744–38.27 | −0.867 | 0.500 |
| 1-day max | normal | 61.60–521.0 | 1.920 | 0.50 | 1-day max | normal | 162.0–1554.0 | −28.62 | 0.500 |
| 3-day max | normal | 58.73–506.6 | 0.810 | 0.50 | 3-day max | normal | 157.7–887.3 | −11.14 | 0.500 |
| 7-day max | normal | 57.24–499.4 | 0.510 | 0.50 | 7-day max | normal | 135.6–491.9 | −4.824 | 0.500 |
| 30-day max | not | 47.50–457.9 | 0.414 | 0.50 | 30-day max | normal | 75.51–297.1 | −4.138 | 0.500 |
| 90-day max | normal | 45.20–351.0 | 0.161 | 0.50 | 90-day max | normal | 51.16–227.1 | −5.468 | 0.050 |
| Station Name | Canal Maule Sur En Aforador | Station Name | Canal Duao Zapata | ||||||
| Indices (m3/s) | Norm Test Result | Flow Range m3/s | Slope | p-Value | Indices (m3/s) | Norm Test Result | Flow Range m3/s | Slope | p-Value |
| 1-day min | not | 0.033–2.950 | −0.038 | 0.010 | 1-day min | not | 0–0.004 | 0 | 0.50 |
| 3-day min | not | 0.050–2.95 | −0.057 | 0.001 | 3-day min | not | 0–0.0097 | 0 | 0.50 |
| 7-day min | normal | 0.050–2.950 | −0.061 | 0.001 | 7-day min | not | 0.0004–0.0510 | 0.002 | 0.25 |
| 30-day min | normal | 0.398–3.381 | −0.062 | 0.001 | 30-day min | not | 0.0010–0.4872 | 0.021 | 0.25 |
| 90-day min | normal | 0.398–4.262 | −0.068 | 0.001 | 90-day min | not | 0.0025–1.437 | 0.045 | 0.50 |
| 1-day max | not | 13.10–46.40 | −0.209 | 0.025 | 1-day max | normal | 9.13–11.60 | −0.056 | 0.50 |
| 3-day max | not | 12.10–46.40 | −0.200 | 0.050 | 3-day max | normal | 9.067–11.47 | −0.071 | 0.50 |
| 7-day max | normal | 10.02–46.40 | −0.221 | 0.050 | 7-day max | normal | 8.584–11.41 | −0.080 | 0.50 |
| 30-day max | normal | 5.713–45.89 | −0.243 | 0.050 | 30-day max | normal | 8.134–11.12 | −0.106 | 0.50 |
| 90-day max | normal | 2.631–45.57 | −0.259 | 0.050 | 90-day max | normal | 7.214–9.89 | −0.098 | 0.50 |
| Station Name | Río Maule En Longitudal | Station Name | Río Maule En Forel | ||||||
| Indices (m3/s) | Norm Test Result | Flow Range m3/s | Slope | p-Value | Indices (m3/s) | Norm Test Result | Flow Range m3/s | Slope | p-Value |
| 1-day min | normal | 4.860–70.6 | −0.336 | 0.250 | 1-day min | normal | 21.00–197.0 | −0.367 | 0.50 |
| 3-day min | normal | 4.877–71.53 | −0.417 | 0.250 | 3-day min | normal | 21.70–210.7 | −0.393 | 0.50 |
| 7-day min | normal | 5.107–72.99 | −0.450 | 0.250 | 7-day min | normal | 23.01–215.7 | −0.432 | 0.50 |
| 30-day min | normal | 5.384–118.2 | −0.129 | 0.500 | 30-day min | normal | 24.18–283.9 | −0.352 | 0.50 |
| 90-day min | normal | 5.636–175.4 | 0.069 | 0.500 | 90-day min | normal | 29.00–337.2 | −0.668 | 0.50 |
| 1-day max | normal | 158.0–1994 | −21.47 | 0.025 | 1-day max | normal | 414.0–15,810 | −50.23 | 0.50 |
| 3-day max | normal | 147.7–1582 | −17.96 | 0.010 | 3-day max | normal | 387.3–13,560 | −39.74 | 0.50 |
| 7-day max | normal | 120.8–1299 | −14.64 | 0.005 | 7-day max | normal | 380.9–9390 | −26.26 | 0.50 |
| 30-day max | normal | 88.89–696.4 | −8.218 | 0.005 | 30-day max | normal | 362.3–4022 | −14.52 | 0.50 |
| 90-day max | normal | 77.55–552.9 | −5.457 | 0.025 | 90-day max | normal | 326.6–2014 | −6.853 | 0.50 |
| Station Name | Río Biobío En Llanquén | Station Name | Río Biobío En Rucalhue | ||||||
| Indices (m3/s) | Norm Test Result | Flow Range m3/s | Slope | p-Value | Indices (m3/s) | Norm Test Result | Flow Range m3/s | Slope | p-Value |
| 1-day min | normal | 16.80–95.20 | 1.396 | 0.250 | 1-day min | normal | 29.30–135 | −0.62 | 0.100 |
| 3-day min | normal | 16.95–96.97 | 1.417 | 0.250 | 3-day min | normal | 33.07–137.3 | −0.309 | 0.500 |
| 7-day min | normal | 17.14–103.6 | 1.552 | 0.250 | 7-day min | normal | 37.03–150.6 | 0.147 | 0.500 |
| 30-day min | normal | 18.61–114 | 1.674 | 0.250 | 30-day min | normal | 45.73–166.7 | 0.379 | 0.500 |
| 90-day min | normal | 20.34–114 | 1.458 | 0.500 | 90-day min | normal | 68.89–234.9 | 0.133 | 0.500 |
| 1-day max | normal | 174.0–1592 | −46.38 | 0.100 | 1-day max | normal | 701.0–5589 | −58.6 | 0.005 |
| 3-day max | normal | 163.7–1292 | −38.46 | 0.050 | 3-day max | normal | 667.3–3824 | −48.42 | 0.001 |
| 7-day max | normal | 157.0–891.1 | −25.39 | 0.010 | 7-day max | normal | 643.7–2855 | −35.92 | 0.001 |
| 30-day max | normal | 130.9–603.1 | −13.97 | 0.025 | 30-day max | normal | 545.0–1612 | −18.46 | 0.001 |
| 90-day max | normal | 119.6–418.7 | −9.497 | 0.010 | 90-day max | normal | 448.1–1252 | −11.98 | 0.001 |
| Station Name | Río Biobío En Coihue | Station Name | Río Biobío En Desembocadura | ||||||
| Indices (m3/s) | Norm Test Result | Flow Range m3/s | Slope | p-Value | Indices (m3/s) | Norm Test Result | Flow Range m3/s | Slope | p-Value |
| 1-day min | normal | 10.6–526.1 | 1.278 | 0.500 | 1-day min | normal | 32.60–349.0 | 1.041 | 0.500 |
| 3-day min | normal | 10.6–551.7 | 1.538 | 0.500 | 3-day min | normal | 46.83–355.4 | 1.364 | 0.250 |
| 7-day min | normal | 10.6–621.6 | 1.806 | 0.500 | 7-day min | normal | 48.41–380.0 | 1.600 | 0.250 |
| 30-day min | normal | 15.97–643.8 | 2.391 | 0.500 | 30-day min | normal | 51.93–460.5 | 1.805 | 0.250 |
| 90-day min | normal | 49.19–653.1 | 2.174 | 0.500 | 90-day min | normal | 77.56–553.5 | 2.393 | 0.250 |
| 1-day max | normal | 412.7–7372 | −63.8 | 0.250 | 1-day max | normal | 2367–13,750 | −97.25 | 0.050 |
| 3-day max | normal | 412.4–6388 | −52.59 | 0.100 | 3-day max | normal | 1994–9877 | −80.58 | 0.050 |
| 7-day max | normal | 411.7–4175 | −40.89 | 0.100 | 7-day max | normal | 1798–6974 | −64.31 | 0.025 |
| 30-day max | normal | 408.2–2542 | −13.24 | 0.500 | 30-day max | normal | 1217–4600 | −31.56 | 0.025 |
| 90-day max | normal | 398.9–1998 | −7.056 | 0.500 | 90-day max | normal | 774–3375 | −20.71 | 0.050 |
| ST1 | ST2 | ST3 | ST4 | ST5 | ST6 | |
|---|---|---|---|---|---|---|
| Maipo | 0.90 | 0.82 | 0.84 | 0.67 | 0.87 | 0.88 |
| Rapel | 0.65 | 0.77 | 0.82 | 0.68 | - | - |
| Maule | 0.70 | 0.90 | 0.65 | 0.70 | - | - |
| Biobío | 0.68 | 0.71 | 0.75 | 0.74 | - | - |
Disclaimer/Publisher’s Note: The statements, opinions and data contained in all publications are solely those of the individual author(s) and contributor(s) and not of MDPI and/or the editor(s). MDPI and/or the editor(s) disclaim responsibility for any injury to people or property resulting from any ideas, methods, instructions or products referred to in the content. |
© 2025 by the authors. Licensee MDPI, Basel, Switzerland. This article is an open access article distributed under the terms and conditions of the Creative Commons Attribution (CC BY) license (https://creativecommons.org/licenses/by/4.0/).
Share and Cite
Daide, F.; Julio, N.; Gaganis, P.; Tzoraki, O.; Alcayaga, H.; Gaganis, C.M.; Figueroa, R. Assessment of Low-Flow Trends in Four Rivers of Chile: A Statistical Approach. Water 2025, 17, 791. https://doi.org/10.3390/w17060791
Daide F, Julio N, Gaganis P, Tzoraki O, Alcayaga H, Gaganis CM, Figueroa R. Assessment of Low-Flow Trends in Four Rivers of Chile: A Statistical Approach. Water. 2025; 17(6):791. https://doi.org/10.3390/w17060791
Chicago/Turabian StyleDaide, Fatima, Natalia Julio, Petros Gaganis, Ourania Tzoraki, Hernán Alcayaga, Cleo M. Gaganis, and Ricardo Figueroa. 2025. "Assessment of Low-Flow Trends in Four Rivers of Chile: A Statistical Approach" Water 17, no. 6: 791. https://doi.org/10.3390/w17060791
APA StyleDaide, F., Julio, N., Gaganis, P., Tzoraki, O., Alcayaga, H., Gaganis, C. M., & Figueroa, R. (2025). Assessment of Low-Flow Trends in Four Rivers of Chile: A Statistical Approach. Water, 17(6), 791. https://doi.org/10.3390/w17060791