Article

Moisture Change of Modified Soil and Spatial–Temporal Evolution of Vegetation Cover for Bio-Slope Engineering in a Plateau Railway

1
School of Civil Engineering, Southwest Jiaotong University, Chengdu 610031, China
2
China Railway Academy Co., Ltd., Chengdu 610032, China
*
Author to whom correspondence should be addressed.
Water 2025, 17(6), 778; https://doi.org/10.3390/w17060778
Submission received: 10 February 2025 / Revised: 5 March 2025 / Accepted: 5 March 2025 / Published: 7 March 2025

Abstract

:
Bio-slope engineering protection plays an important role in preventing soil erosion, enhancing slope stability, and improving soil and water conservation capabilities. To establish a foundation for the preparation of modified soil for bio-slope engineering, the common gravel soil used in bio-slope engineering protection was selected. Amendments such as peat soil and water-retaining agents were then incorporated to support these preparations. This study examines the influence of the content of peat soil and water-retaining agent on the modified soil’s moisture constants, infiltration coefficient, and water absorption capacity. Additionally, utilizing remote sensing technology, 20 rock cutting sites sprayed with vegetation were monitored over a 15-year period. The results suggest that the addition of peat soil and water-retaining agents aids in augmenting the available water capacity and water absorption speed of the soil, allowing it to absorb and retain a substantial amount of available water capacity. However, as the content of peat soil increases, the modified soil’s wilting point improves, while the infiltration coefficient increases. Based on the findings of the optimum proportion tests and the field spraying experiments, it is recommended that the proportion is granular soil with 80%, peat with 20%, water-retaining agent with 1.0‰, aggregate agent with 1.0‰, and fertilizer with 100 g/m2. A comprehensive analysis of the spatial–temporal evolution characteristics of vegetation cover in the area post-railway construction indicates that vegetation cover in this region wilted extensively only in 2011 due to drought. Subsequently, the vegetation on the sprayed rock slopes has thrived, according to the proportion. The research findings are of considerable importance for guiding the design and construction of substrate spraying for bio-slope engineering protection in railway construction.

1. Introduction

Bio-slope engineering technology stabilizes slopes by employing vegetation to absorb water and consolidate soil, and enhances the aesthetic quality of the ecological environment [1]. This technology has been widely applied to projects in China, such as expressways, railways, hydropower, and municipal engineering for slope protection and vegetation restoration [2,3]. The effectiveness of bio-slope engineering relies on the stable growth and propagation of slope plants, which necessitates addressing two key issues: first, the selection and combination of slope plant species; and second, the provision of suitable growing conditions within the artificially created soil environment.
In mountainous regions of China, large-scale railway construction has created many rock-cut slopes, which affect local railway safety and ecological protection efforts [4], as shown in Figure 1. One highly effective method for restoring these rock-cut slopes is hydroseeding. It involves spraying a mixture of plant seeds and modified soil on the slope surface, creating a matrix for seed attachment and a nutrient source for root growth. This technique has yielded significant results in numerous regions around the world [1,3,5,6,7,8,9]. The plant seeds used in hydroseeding typically fall into three categories: herbaceous plants, a combination of herbaceous plants and shrubs, and a mix of herbaceous plants, shrubs, and trees. The artificial soil employed in hydroseeding consists of a specific proportion of gravel, agricultural soil, straw, compound fertilizer, water-retaining agents, and binders [10]. Chen et al. [11] observed that the quality of artificial soil is inferior to that of natural soil due to an inadequate soil formation process. Soil erosion on these slopes is exacerbated by factors such as steep gradients, poor soil quality, and rainwater run-off.
For the success of bio-slope engineering, the moisture content of the soil is a critical factor. Unlike urban greening, which typically involves intensive management, bio-slope engineering is generally managed extensively. Consequently, the moisture required for the growth and reproduction of slope plants primarily comes from atmospheric precipitation. The characteristics of bio-slope engineering require that the modified soil has good moisture absorption, moisture storage, and water retention properties. One reason for the rapid decline and death of plants is that the moisture parameters of the slope soil do not meet the plants’ growth requirements. Additionally, the density of the modified soil impedes the quick infiltration of rainfall, resulting in slower moisture absorption rates. The interaction between plants, soil, and moisture is crucial for the stability of vegetative cover on slopes [1,5], moisture absorption efficiency [12], and overall plant growth [8].
Organic matter is rich in peat soil, and incorporation of the peat soil can significantly enhance the physical structure of the modified soil. Additionally, peat soil has excellent water retention capabilities, allowing it to absorb and store substantial amounts of moisture. This property helps soil maintain relatively moist conditions during droughts, thereby conserving water. Furthermore, peat soil enhances soil aeration and drainage, while providing long-term nutrients essential for plant growth [13,14]. Water-retaining agents, composed of polymeric materials, can absorb and retain a significant amount of water, thereby improving the soil’s water retention capacity. In addition, these agents can form a sponge-like structure within the soil, effectively reducing water evaporation and deep percolation. Therefore, soil moisture is retained in the root zone for a longer period, and water loss is minimized. In any case, the presence of water-retaining agents enhances soil stability, reduces soil compaction, and promotes root development [15,16]. The mechanisms by which peat soil and water-retaining agents promote soil vegetation growth are illustrated in Figure 2.
Field monitoring analysis indicates that the long-term effectiveness of many bio-slope engineering projects is often suboptimal. The normalized difference vegetation index (NDVI) is a widely used and readily accessible remote sensing indicator [17], effectively reflecting the vegetation cover within the study region and closely correlating with biomass [18,19]. NDVI is a commonly used index for remote sensing to monitor vegetation cover and health. The formula for calculating NDVI is
NDVI = NIR R NIR + R
where, NIR represents the reflectance in the near-infrared band, and R represents the reflectance in the red light band. The NDVI ranges from −1 to 1, with higher values typically indicating denser vegetation. NDVI is a standardized method for assessing vegetation health. Higher NDVI values generally correspond to healthier vegetation, while lower NDVI values indicate sparse or no vegetation. Specifically, an NDVI value close to 1 signifies well-covered and healthy vegetation, an NDVI value close to 0 indicates a lack of vegetation, which may be bare soil or water bodies, and negative values are usually associated with non-vegetated areas such as deserts or snowfields.
Potential beneficial environmental exposures and their associations with noise annoyance or other health impacts can be quantified through various “green indicators” of vegetation. For instance, satellite-derived NDVI can quantify the degree of greenness effectively [20,21,22,23,24,25,26]. Assessments of outdoor vegetation visible from specific viewpoints, conducted through Geographic Information System (GIS)-based visual field analysis, have found that such greenery can reduce annoyance [27,28].
Mozumder et al. [29] conducted a meticulous analysis of the surface composition of the wetland, distinguishing the predominant cover types that constitute the surface. By referencing relevant literature and field data, thresholds for satellite indices were established, facilitating feature extraction within the vegetation. Employing rule-based image analysis methodologies, the researchers identified and classified the wetland cover types, subsequently investigating their temporal and spatial distributions from 1989 to 2012. Zhang et al. [30] elucidated the spatiotemporal evolution of future vegetation coverage in the Huainan mining area and conducted a quantitative assessment of its driving factors. Building on the regional environmental characteristics and data accessibility, they constructed a structural equation model to quantitatively identifying the multi-factor contributions among the driving factors of vegetation coverage. Mori et al. [31] utilized satellite imagery to estimate defoliation areas in native regions and employed this data to predict species distribution through a species distribution model. They applied an NDVI-based estimation via satellite remote sensing and used this in MaxEnt.
Currently, modified soil is widely used for bio-slope engineering. However, due to a lack of research on the moisture characteristics of modified soil for this purpose, determining an optimal proportion of modified soil remains challenging. Furthermore, while the modified soil in these studies is suitable for plant growth, it often does not meet the requirements of mountainous engineering projects. In practical bio-slope engineering projects, modified soil is often composed of locally sourced, poor-quality materials such as excavated gravel soil and sand.
This study therefore uses gravel soil obtained from slope excavation, incorporating peat soil and water-retaining agents, to conduct optimum proportion test. The objective is to investigate the effects of peat soil and water-retaining agent content on the field capacity, wilting point, available water capacity, infiltration coefficient, and water absorption capacity of the modified soil. The findings aim to provide a basis for formulating modified gravel soil suitable for vegetative slope protection. To monitor the long-term health of the vegetation derived from these optimum proportion tests, this study estimated the defoliation area in a plateau railway from Zhanyi to Kunming, using Mapping Satellite-1 imagery. By incorporating the defoliation data acquired from satellite images, we employed NDVI to predict the spatial–temporal evolution characteristics of vegetation coverage. This approach allowed us to evaluate the optimum proportion for a plateau railway.

2. Materials and Methods

The study region is located in the eastern part of Yunnan Province, with the field test site situated along the section of a plateau railway from Zhanyi to Kunming. This area belongs to the hilly, eroded landform of the Yunnan–Guizhou Plateau, where the railway runs along the edge of a wide, gentle U-shaped valley at Huangniwan. The bedrock on the slopes is primarily composed of Upper Silurian Series Guandi Formation mudstone and shale (S3g), which are weakly water-bearing strata containing only trace amounts of fissured bedrock aquifers. The slope residual clayey soil contains a small amount of pore water. Surface water, which is mainly seasonal runoff from gullies, varies in volume according to the seasons.

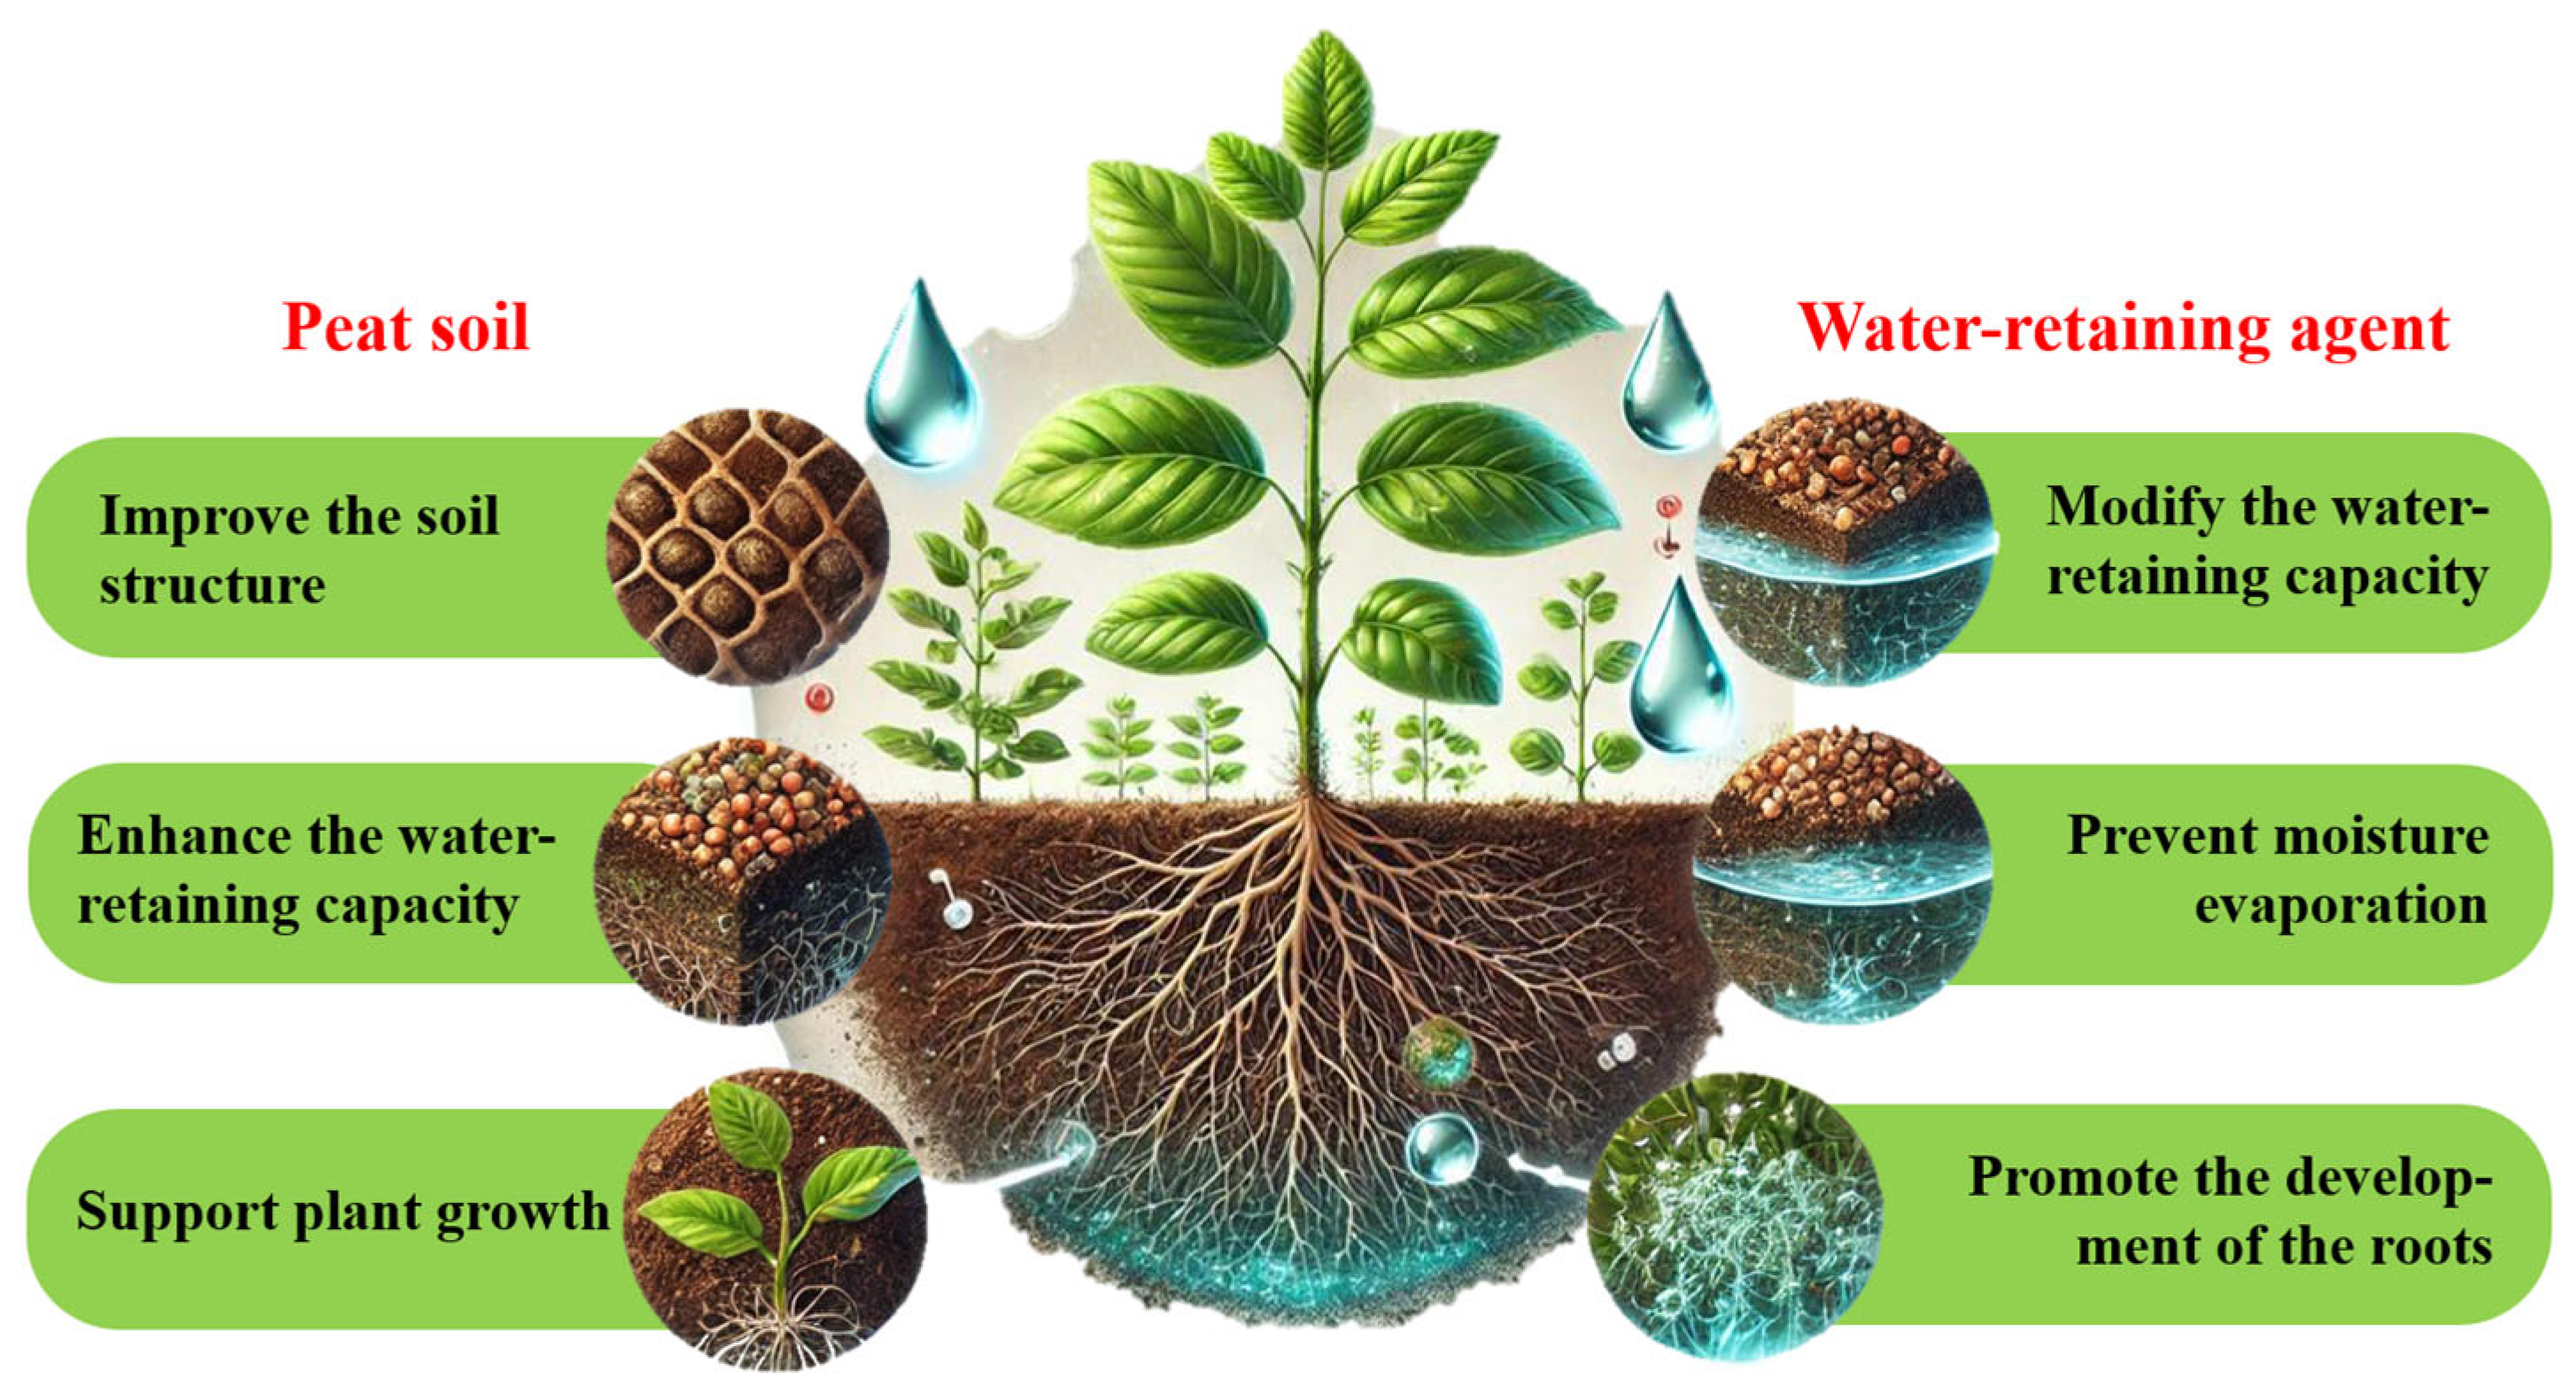
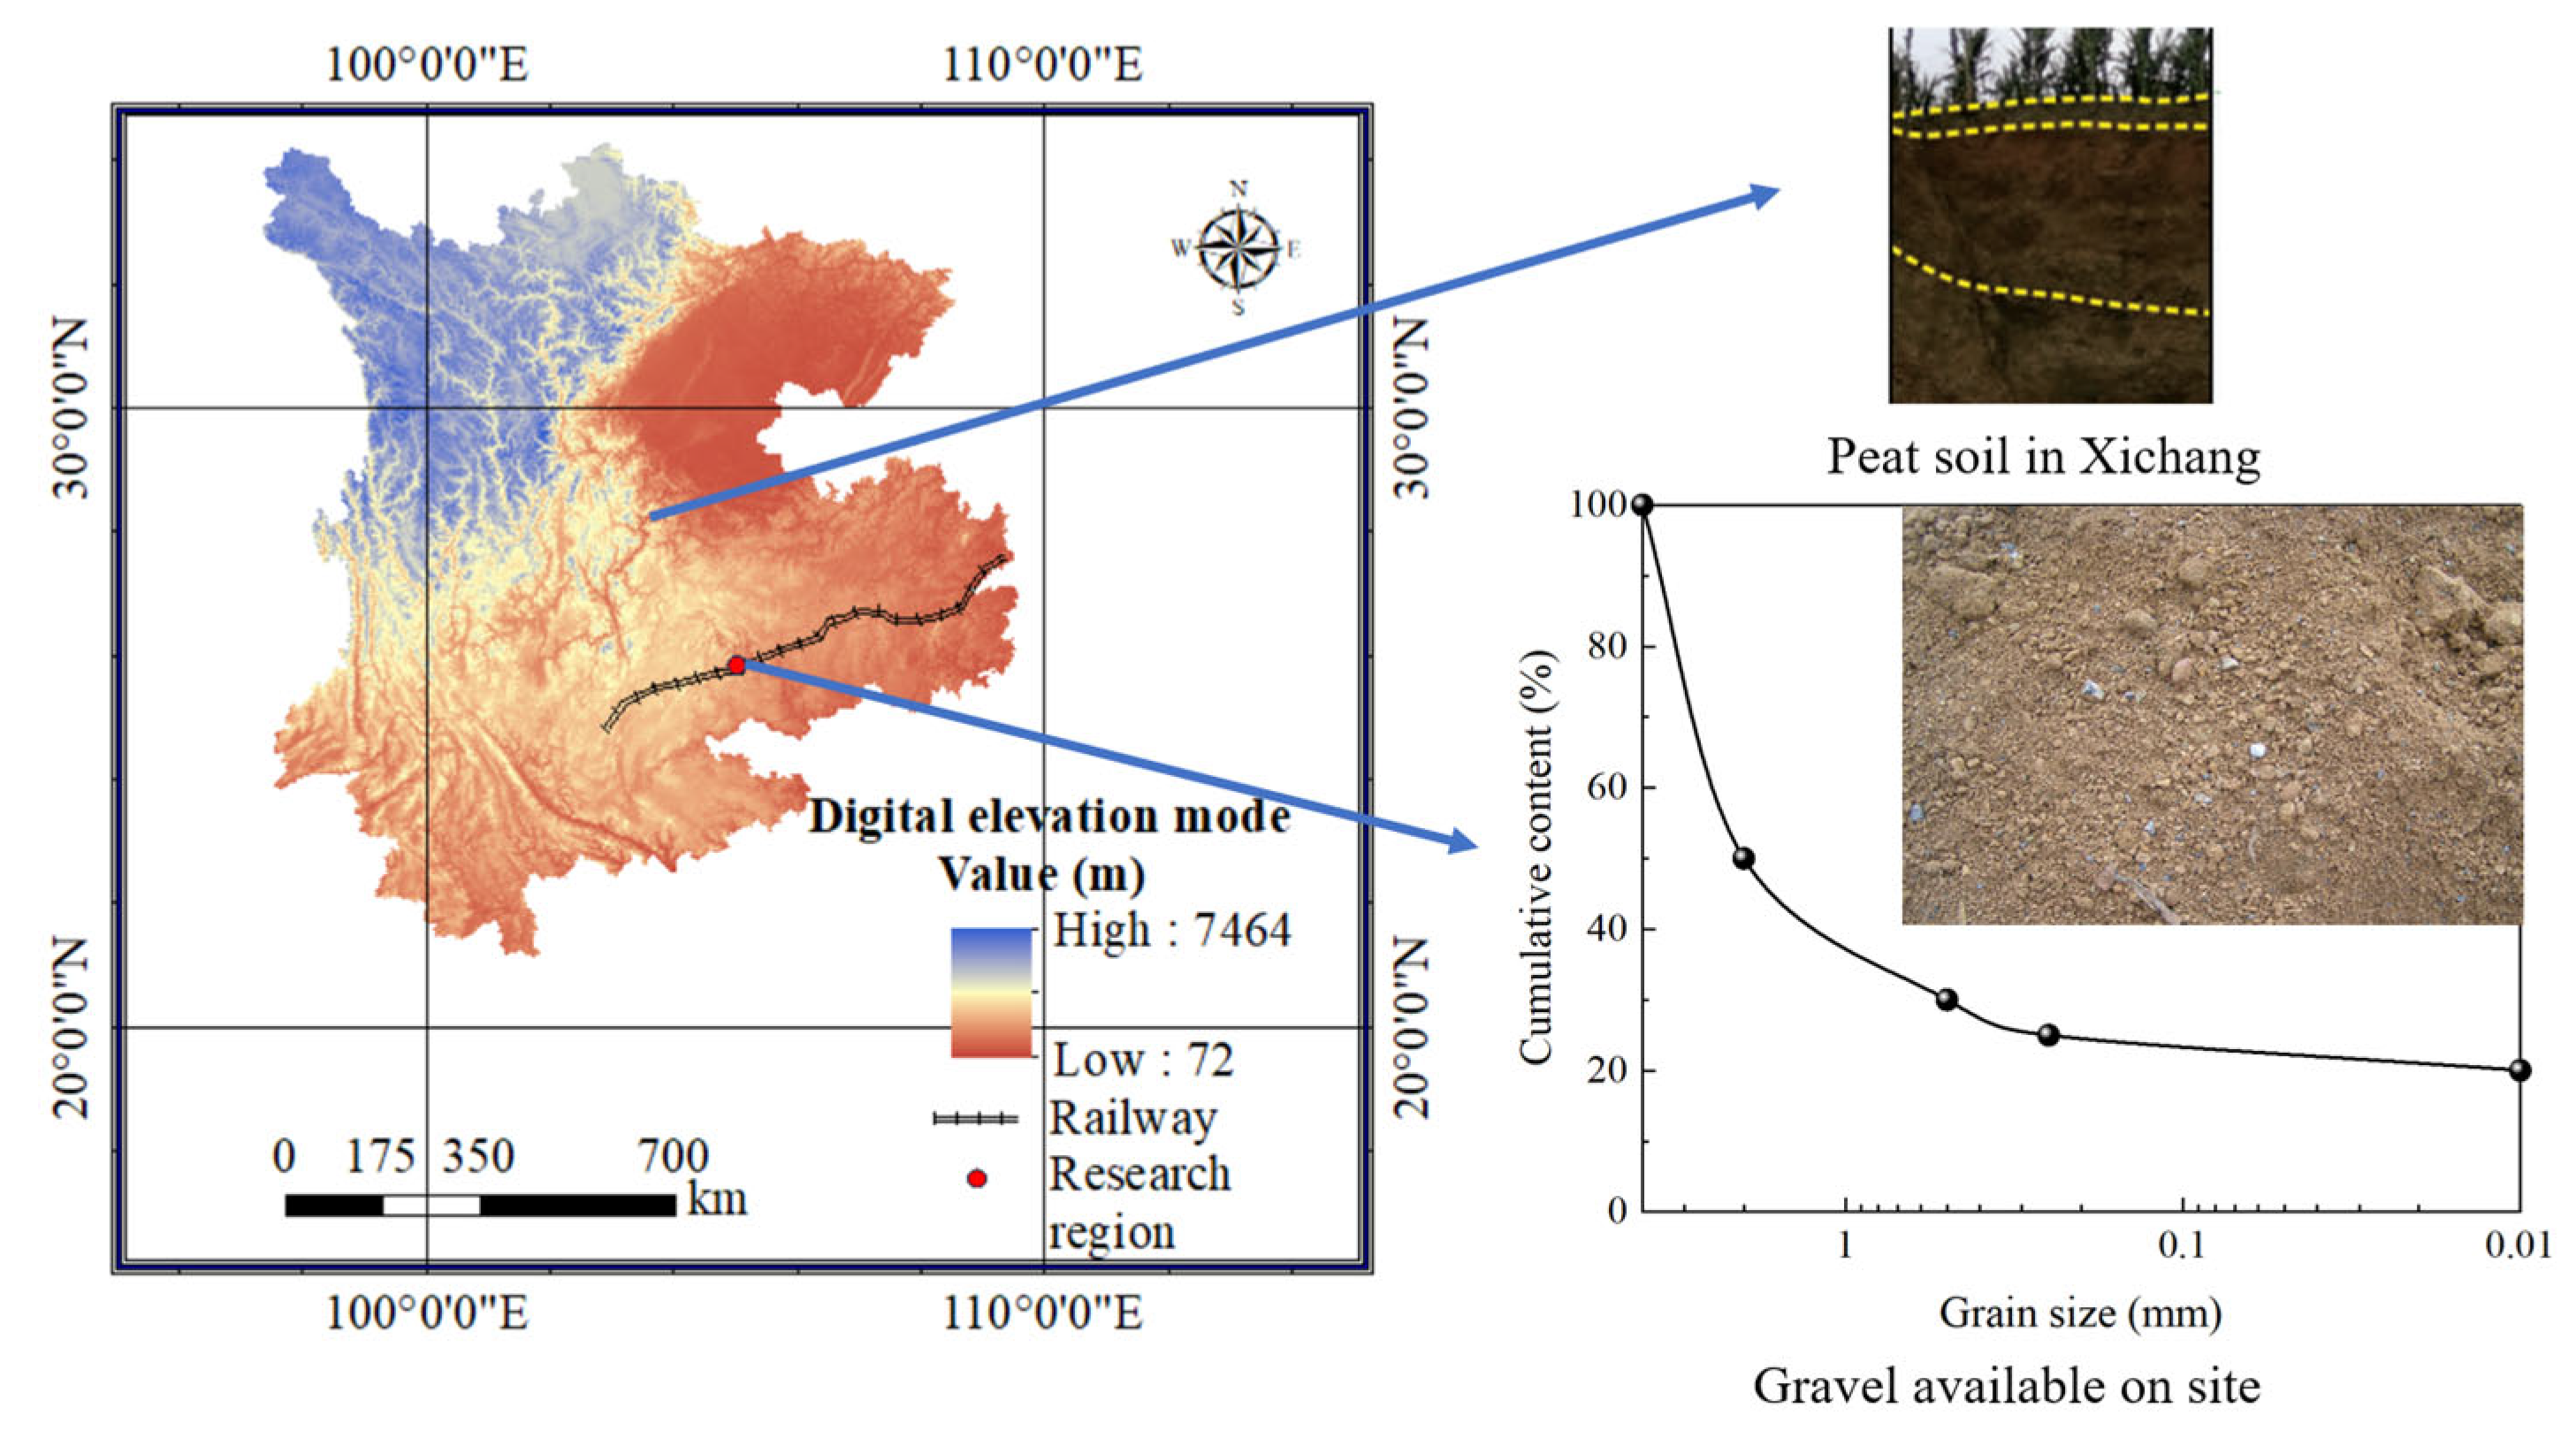
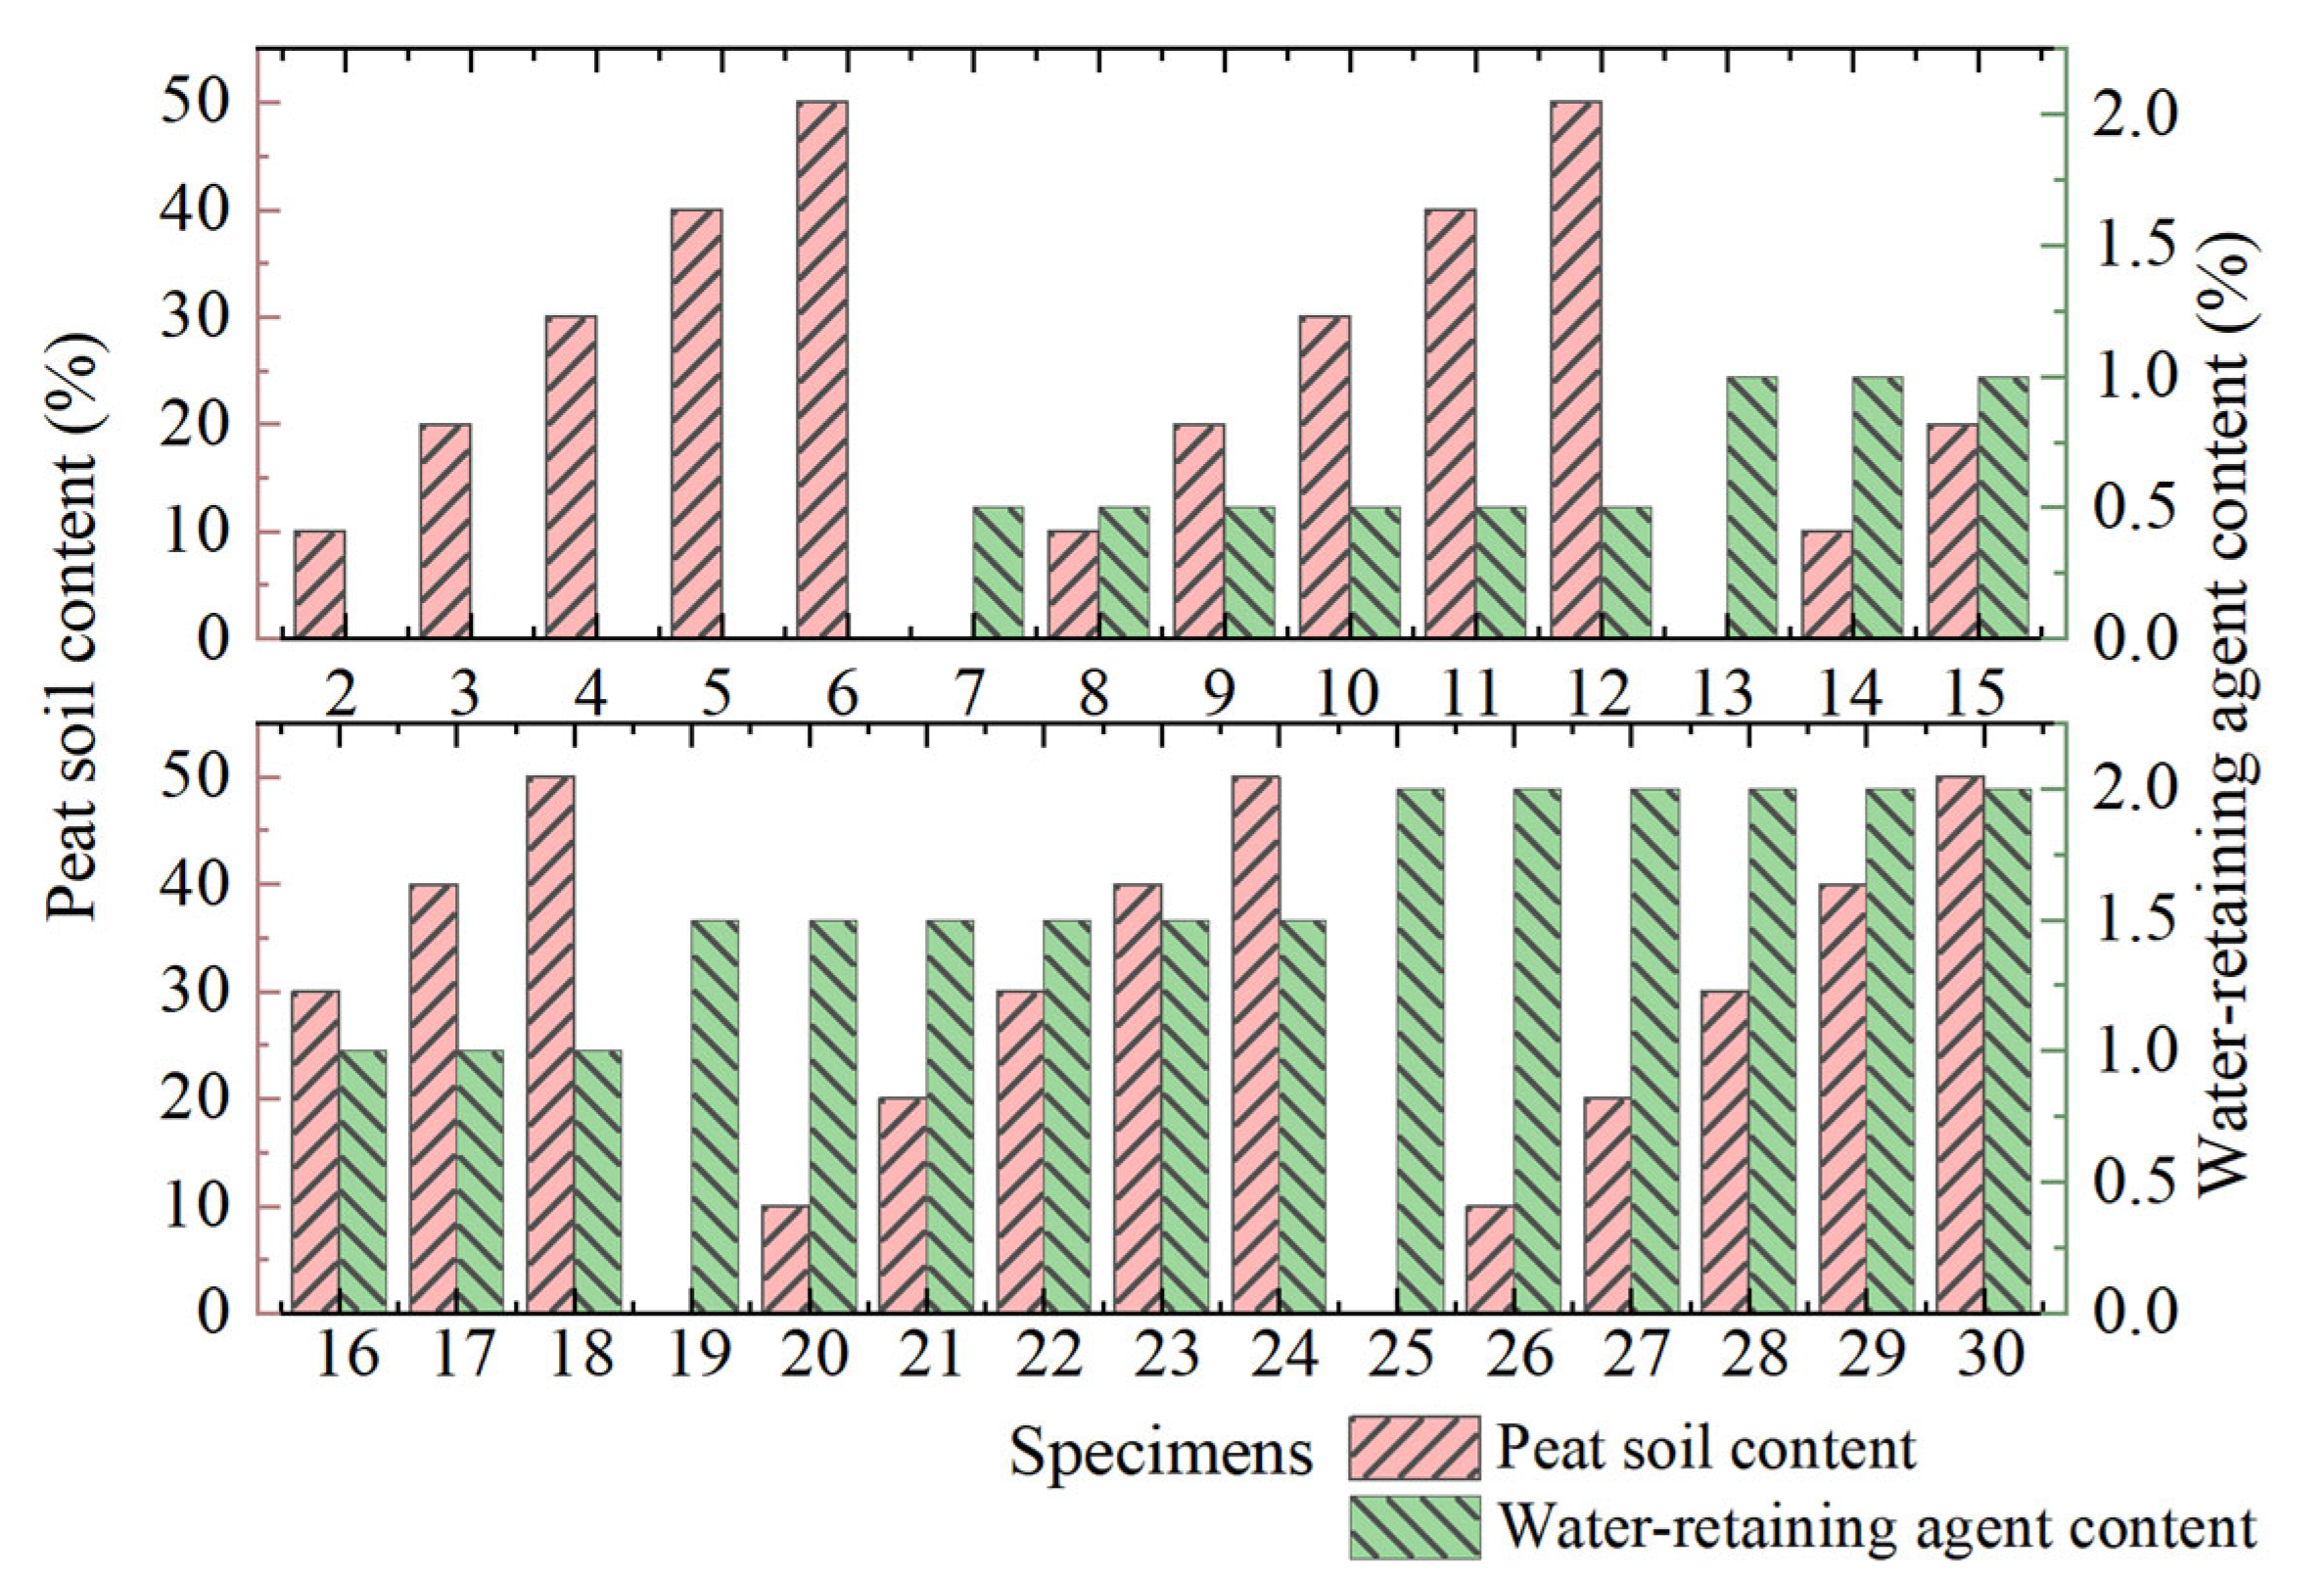
2.1. Experimental Materials

The primary material for the experiment was highly weathered mudstone and shale collected from the embankment excavation. The gravel had a maximum particle size of 4 mm, and its gradation is illustrated in Figure 3. The dry density of the material was 1.49 g/cm3, when lightly compacted. The aggregate agent used was polyacrylamide with a molecular weight of 6 million. Its role is to promote the formation of aggregate structure in the modified soil, which benefits plant growth. The fertilizer used was a compound fertilizer with an available nutrient content of 45%, with an N-P2O5-K2O ratio of 15-15-15. The purpose of the fertilizer is to supply readily available nutrients required for plant growth. The grass seed used was dehulled Bermuda grass, i.e., Cynodon dactylon, with a germination rate of 95%.
The organic matter used was peat soil sourced from Xichang City, characterized by high porosity, loose structure, high compression rate, and low bulk density with 0.16 g/cm3 in its packed state and a water absorption ratio of three times, as shown in Figure 3. The average organic matter content is 55.20%, and the water content is 191%. The water-retaining agent used was granular polyacrylate water-absorbent resin with a water absorption ratio of 400 times. This study mainly considers two indicators: the peat soil content and the water-retaining agent content.
The amounts of the aggregate agent, fertilizer, and grass seed in the modified soil were 1.0‰ (by volume), 100 g/m2, and 6 g/m2, respectively. The gravel soil was mixed with peat soil, water-retaining agent, aggregate agent, and fertilizer until homogeneous, and then placed into containers with dimensions of 0.44 × 0.33 m with a filling thickness of 10 cm. The mixture was moderately compacted, and grass seeds were evenly sown on the surface of the modified soil layer, followed by watering for maintenance. The design of the modified soil mixture is shown in Figure 4.

2.2. Testing Methods

The field capacity, wilting point, available water capacity, and infiltration coefficient of the modified soil were tested according to the standards specified in “Determination of forest soil moisture-physical properties”, “Determination of forest soil permanent wilting water content”, and “Determination of forest soil percolation rate” [32]. Sampling was conducted one week and two months after the modified soil was placed in the containers, representing the soil before and during the peak plant growth periods, respectively. Soil samples were collected using a ring knife with dimensions of Φ 50.46 × 50 mm, with three samples taken for each mix ratio and analyzed based on their average values, as shown in Figure 5.

3. Results and Discussion

3.1. Moisture Constants of Modified Soil

Figure 6 depicts the relationship between field capacity and wilting point in the modified soil, under conditions of varying proportions of peat soil and water-retaining agent. As the content of peat soil increased, the field capacity of the modified soil exhibited an upward trend, thereby facilitating increased water storage for plants. Moreover, the wilting point of the modified soil increased with rising peat soil content. As the wilting point signifies the lower limit of water content available to plants, its increase negatively impacts the availability of water for plant use. Notably, the absolute increase in the wilting point was less than that of the field capacity. Specifically, when the peat soil content increased from 0 to 50%, the wilting point rose from 3.7% to 5.9%. One week after sampling, the field capacity of the modified soil increased from 38.0% to 52.2%. Consequently, as the peat soil content increased, the available water capacity of the modified soil also improved. The reduction in moisture constants observed two months after sampling, as illustrated in Figure 6, may be attributed to the compaction of the modified soil over time.
As the content of water-retaining agents increased, the field capacity of the modified soil exhibited a corresponding increase. In comparison to the effect of peat soil, the impact of the water-retaining agent was smaller. For instance, when the water-retaining agent content increased from 0 to 2.0‰, the field capacity of the modified soil two months after the peak plant growth period rose from 38.8% to 42.2%, representing an increase of 3.4%. On the other hand, with an increase in peat soil content from 0 to 50%, the field capacity rose from 35.6% to 49.0%, representing an increase of 13.4%. The cost of the water-retaining agent required to achieve this effect was more than 10 times that of peat soil. As the content of the water-retaining agent increased, the wilting point of the modified soil exhibited a decreasing trend. For example, when the content of water-retaining agents increased from 0 to 2.0‰, the wilting point decreased from 5.4% to 4.1%, representing a decrease of 1.3%. This is beneficial for providing more available water to plants, especially in water-deficient and dry conditions, where it facilitates plants’ absorption of the water necessary for their survival. Owing to the increasing trend of the field capacity and the decreasing trend of the wilting point, with the increase in water-retaining agent content, the available water capacity of the modified soil exhibited a corresponding increasing trend.

3.2. Infiltration Coefficient of Modified Soil

Figure 7 depicts the relationship between the infiltration coefficient of the modified soil and the contents of peat soil and water-retaining agent. When the peat content is below 10%, the infiltration coefficient of the modified soil remains relatively low, ranging from 0.13 × 10⁻⁶ m/s to 0.26 × 10⁻⁶ m/s after one week. As the peat soil content increased to levels between 20% and 40%, the infiltration coefficient changed minimally, ranging from 0.79 × 10⁻⁶ m/s to 1.07 × 10⁻⁶ m/s after one week. However, when the peat content exceeded 40%, the infiltration coefficient increased rapidly; at a peat content of 50%, the coefficient reached 1.89 × 10⁻⁶ m/s after one week, representing an increase of 77%. A high infiltration coefficient in the modified soil facilitated rapid water infiltration into the underlying slope, which was detrimental to slope stability. Therefore, it is advisable that the peat content in the modified soil not exceed 40%.
As the content of the water-retaining agent increased, the infiltration coefficient of the modified soil showed a decreasing trend. This is primarily because the water-retaining agent absorbs water, converting it into non-flowing water that adheres to the agent. This reduces the soil’s porosity to some extent, thereby lowering the infiltration coefficient. However, the reduction was less significant compared to the impact of peat soil. When the water-retaining agent content increased from 0 to 2.0‰, the infiltration coefficient of the modified soil decreased from 0.95 × 10⁻⁶ m/s to 0.80 × 10⁻⁶ m/s, representing a reduction of 16% after one week.

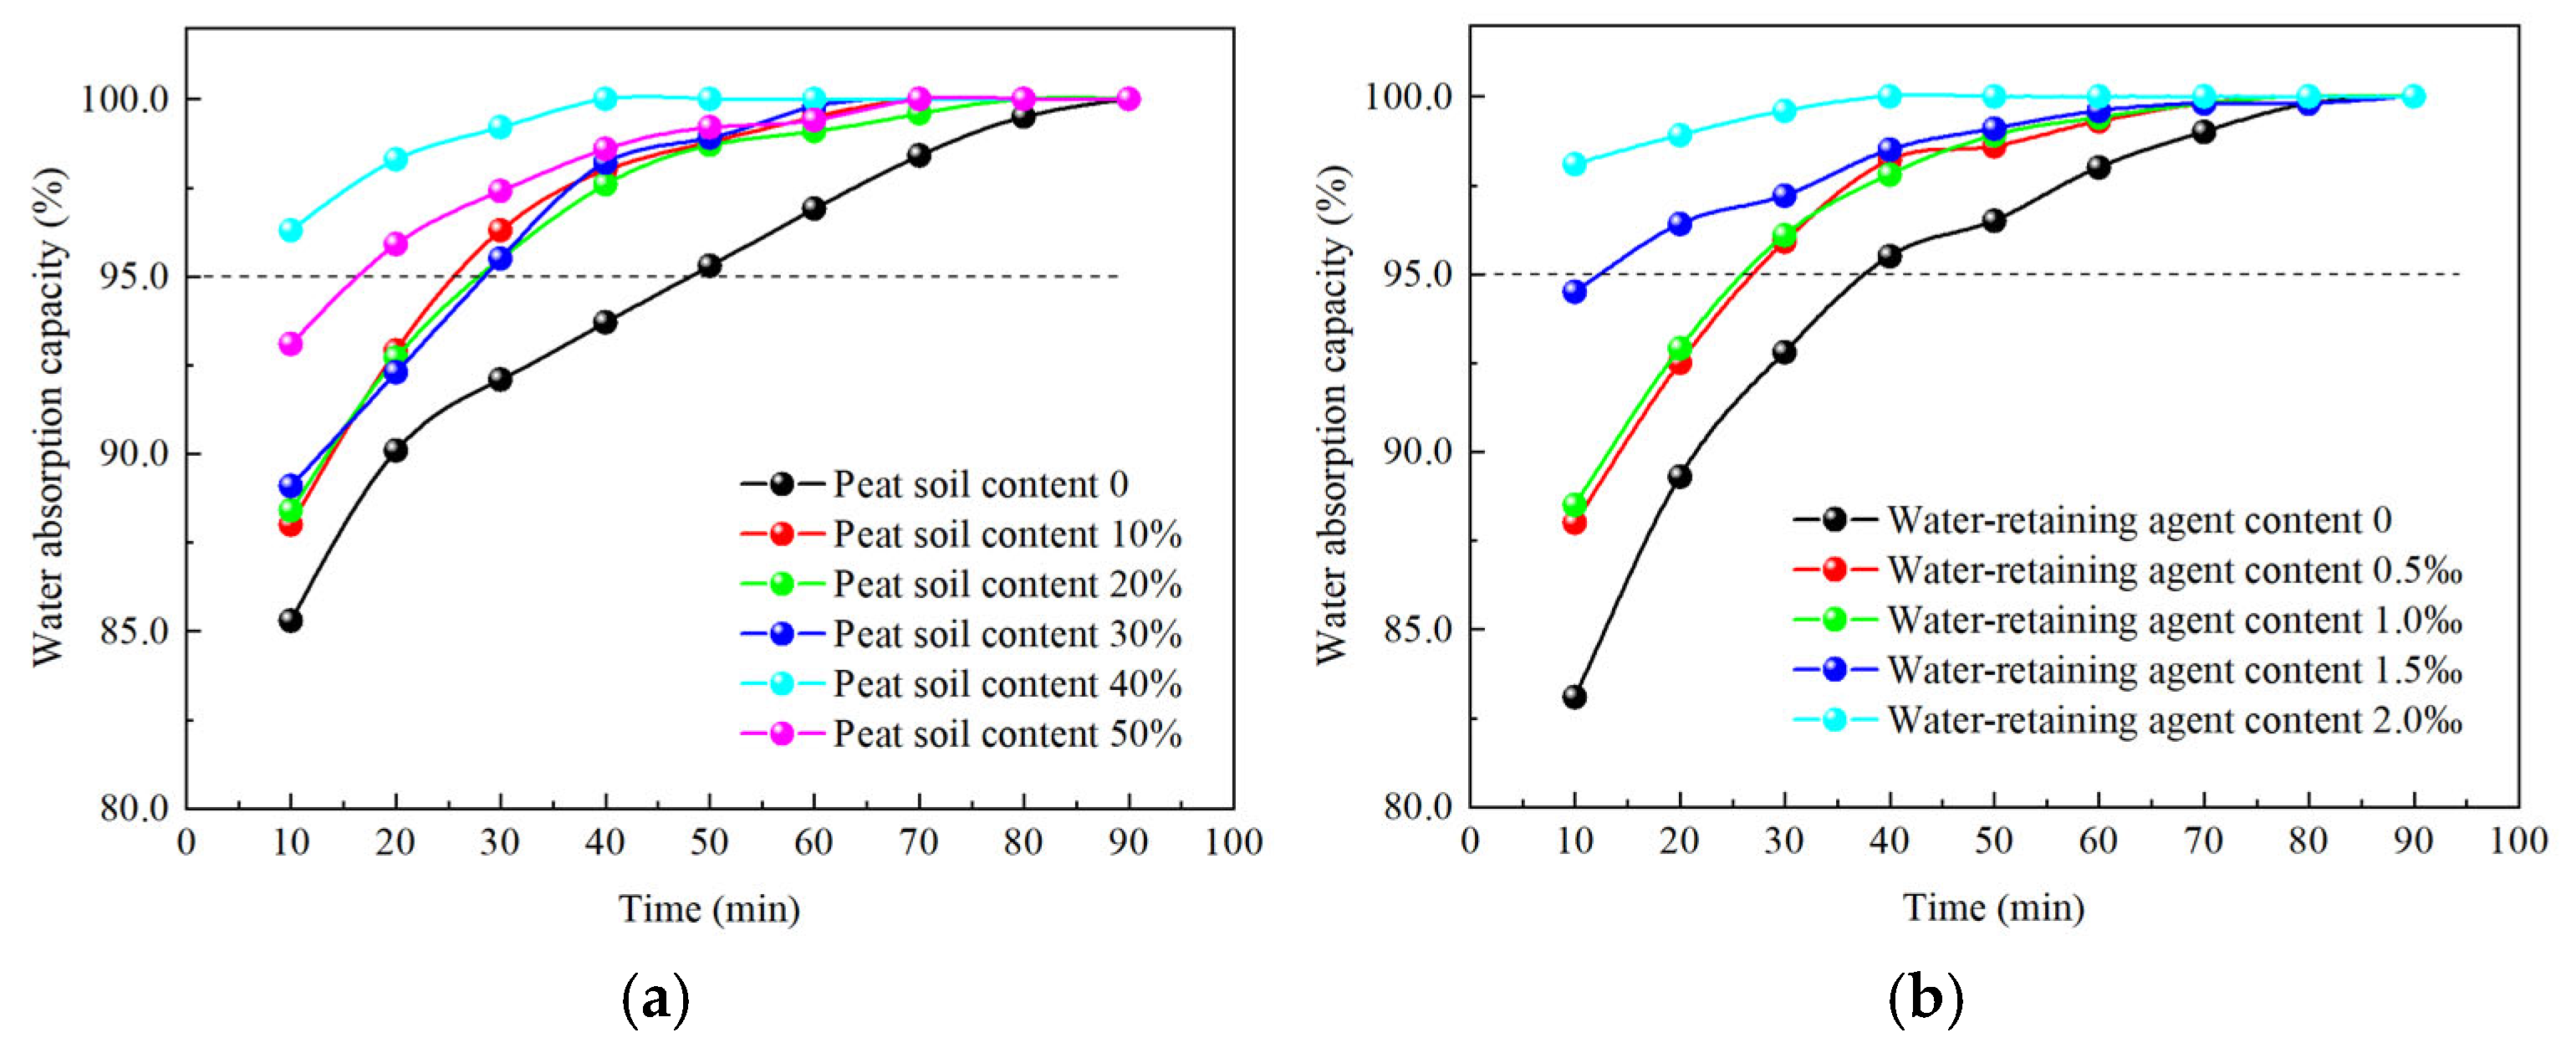
3.3. Water Absorption Capacity of Modified Soil

As shown in Figure 8, it is evident that a higher content of peat soil results in a faster water absorption capacity. When the content of peat soil exceeded 10%, the water absorption capacity of the modified soil could reach 95% within 30 min; when the content of peat soil exceeded 40%, the water absorption capacity could reach 95% within 20 min. A higher content of the water-retaining agent results in a faster water absorption capacity. When the water-retaining agent content exceeded 0.5‰, the water absorption capacity of the modified soil could exceed 95% within 30 min; when the content exceeded 1.5‰, the water absorption capacity could exceed 95% within 20 min.

3.4. Optimum Proportion

Based on the results of the aforementioned test, the addition of peat soil and water-retaining agent to the soil was beneficial in terms of enhancing its available water capacity. Given the reasonable infiltration coefficient of the modified soil, the peat soil content should range between 20% and 40%. To enhance the soil’s water absorption capacity, the content of peat soil should not be less than 10%, and the water-retaining agent content should not be less than 0.5‰.
In addition to the technical factors previously mentioned, economic considerations also need to be accounted for in determining the reasonable proportion of modified soil. While the incorporation of peat soil and water-retaining agents can enhance the available water capacity of the soil, the full potential of these additives’ water absorption and storage capabilities may not be fully realized. According to water absorption tests, the selected peat soil for this optimum proportion test can absorb water three times its weight, whereas the water-retaining agent can absorb water 65 times its weight. Nevertheless, the inherent constraints imposed by the modified soil limit the extent to which the water absorption capacity of the added peat soil and water-retaining agents can be effectively utilized. The water absorption efficiency of peat soil (or water-retaining agent) is defined as the ratio of the water absorbed by the peat soil (or water-retaining agent) in the modified soil, relative to its inherent water absorption capacity, expressed as a percentage. Figure 8 illustrates the relationship between the water absorption efficiency of peat soil in modified soil and the content of peat soil. Similarly, Figure 9 depicts the relationship between the water absorption efficiency of the water-retaining agent in modified soil and its content.
As depicted in Figure 9, the water absorption efficiency of the peat soil reaches a maximum when its content is between 20% and 30%, with values ranging from 60.4% to 63.2%. Consequently, considering the water absorption efficiency of peat soil, an appropriate content of peat soil in the modified soil is determined to be between 20% and 30%. For the water-retaining agent, the maximum water absorption efficiency of 75.6% is observed at a content of 1.0‰. Notably, as the content of the water-retaining agent increases, its efficiency actually decreases. Consequently, based on the water absorption efficiency ratio of the water-retaining agent, a suitable content in the modified soil is determined to be 1.0‰. Based on the moisture constants, infiltration coefficient, water absorption capacity, and water absorption efficiency of peat soil and water-retaining agents, the optimal composition for the modified soil is as follows: 80% gravel, 20% peat soil, 1.0‰ water-retaining agent, 1.0‰ aggregate agent, and 100 g/m2 of fertilizer.

4. Field Spraying Test of Modified Soil

4.1. Testing and Analysis of Soil Moisture Characteristics

The climate in this region is a subtropical plateau monsoon, characterized by an annual rainfall range of 991.5 to 1200 mm and surface evaporation exceeding 635 mm. The region experiences significant evaporation and exhibits distinct wet and dry seasons. Winters and springs are characterized by dry and windy conditions, whereas summers and autumns feature concentrated rainfall, with 80% to 90% of the annual precipitation occurring between May and October. The peak rainfall occurs from June to August, contributing approximately 60% of the annual precipitation. The average annual sunshine duration exceeds 2100 h, thereby classifying it as a region with extended daylight hours.
The test area encompasses 29 rock-cut slopes. Twenty of these slopes were chosen for the modified soil spraying test, featuring slope gradients ranging from 1:0.75 to 1:1, with a combined test area totaling 26,696 m2. The proportion of modified soil employed was determined based on the outcomes of optimum proportion tests. Regarding slope vegetation, a mixture of Dogtooth grass and shrubs was applied, with grass seeds being sprayed and shrub seedlings being transplanted. The construction process for the field test involved clearing and leveling the slope→drilling→installing anchor rods→laying and securing wire mesh→mixing modified soil→spraying modified soil→planting shrub seedlings→early maintenance. Figure 10 shows photos of the field spraying test.
Three to six months following the completion of modified soil spraying, after the slope surface has been fully vegetated and plant growth is well established, soil samples are collected to evaluate the field capacity, infiltration coefficient, and water absorption capacity of the modified soil through field tests. The test results are shown in Figure 11 and Figure 12.
As depicted in Figure 11, the field capacity of the modified soil, as determined through field tests, ranges from 28.1% to 36.8%, with an average value of 31.9%. A reduction of 23% was observed in the soil’s field capacity, which was measured at 41.5% as determined by the optimum proportion test. The infiltration coefficient of modified soil in the field tests ranges from 0.38 × 10⁻⁶ m/s to 0.66 × 10⁻⁶ m/s, with an average of 0.49 × 10⁻⁶ m/s. There was a reduction of 27% compared to the 0.67 × 10⁻⁶ m/s infiltration coefficient of the optimum proportion test.
As shown in Figure 12, the water absorption capacity of the field-tested modified soil was lower than that of the optimum proportion test results. It took nearly 50 min to reach 95% water absorption, about 15 min longer than in the optimum proportion test. Despite this, the imported soil used in the field trials effectively ensures the normal growth and reproduction of plants on the rock-cut slope. The field trial sites, which have been in place for 7 years, show that the plants on the trial slopes are still growing well. A stable and diverse plant community has gradually formed. Figure 13 illustrates the growth status of slope plants at the trial site, captured in autumn four years after completion.

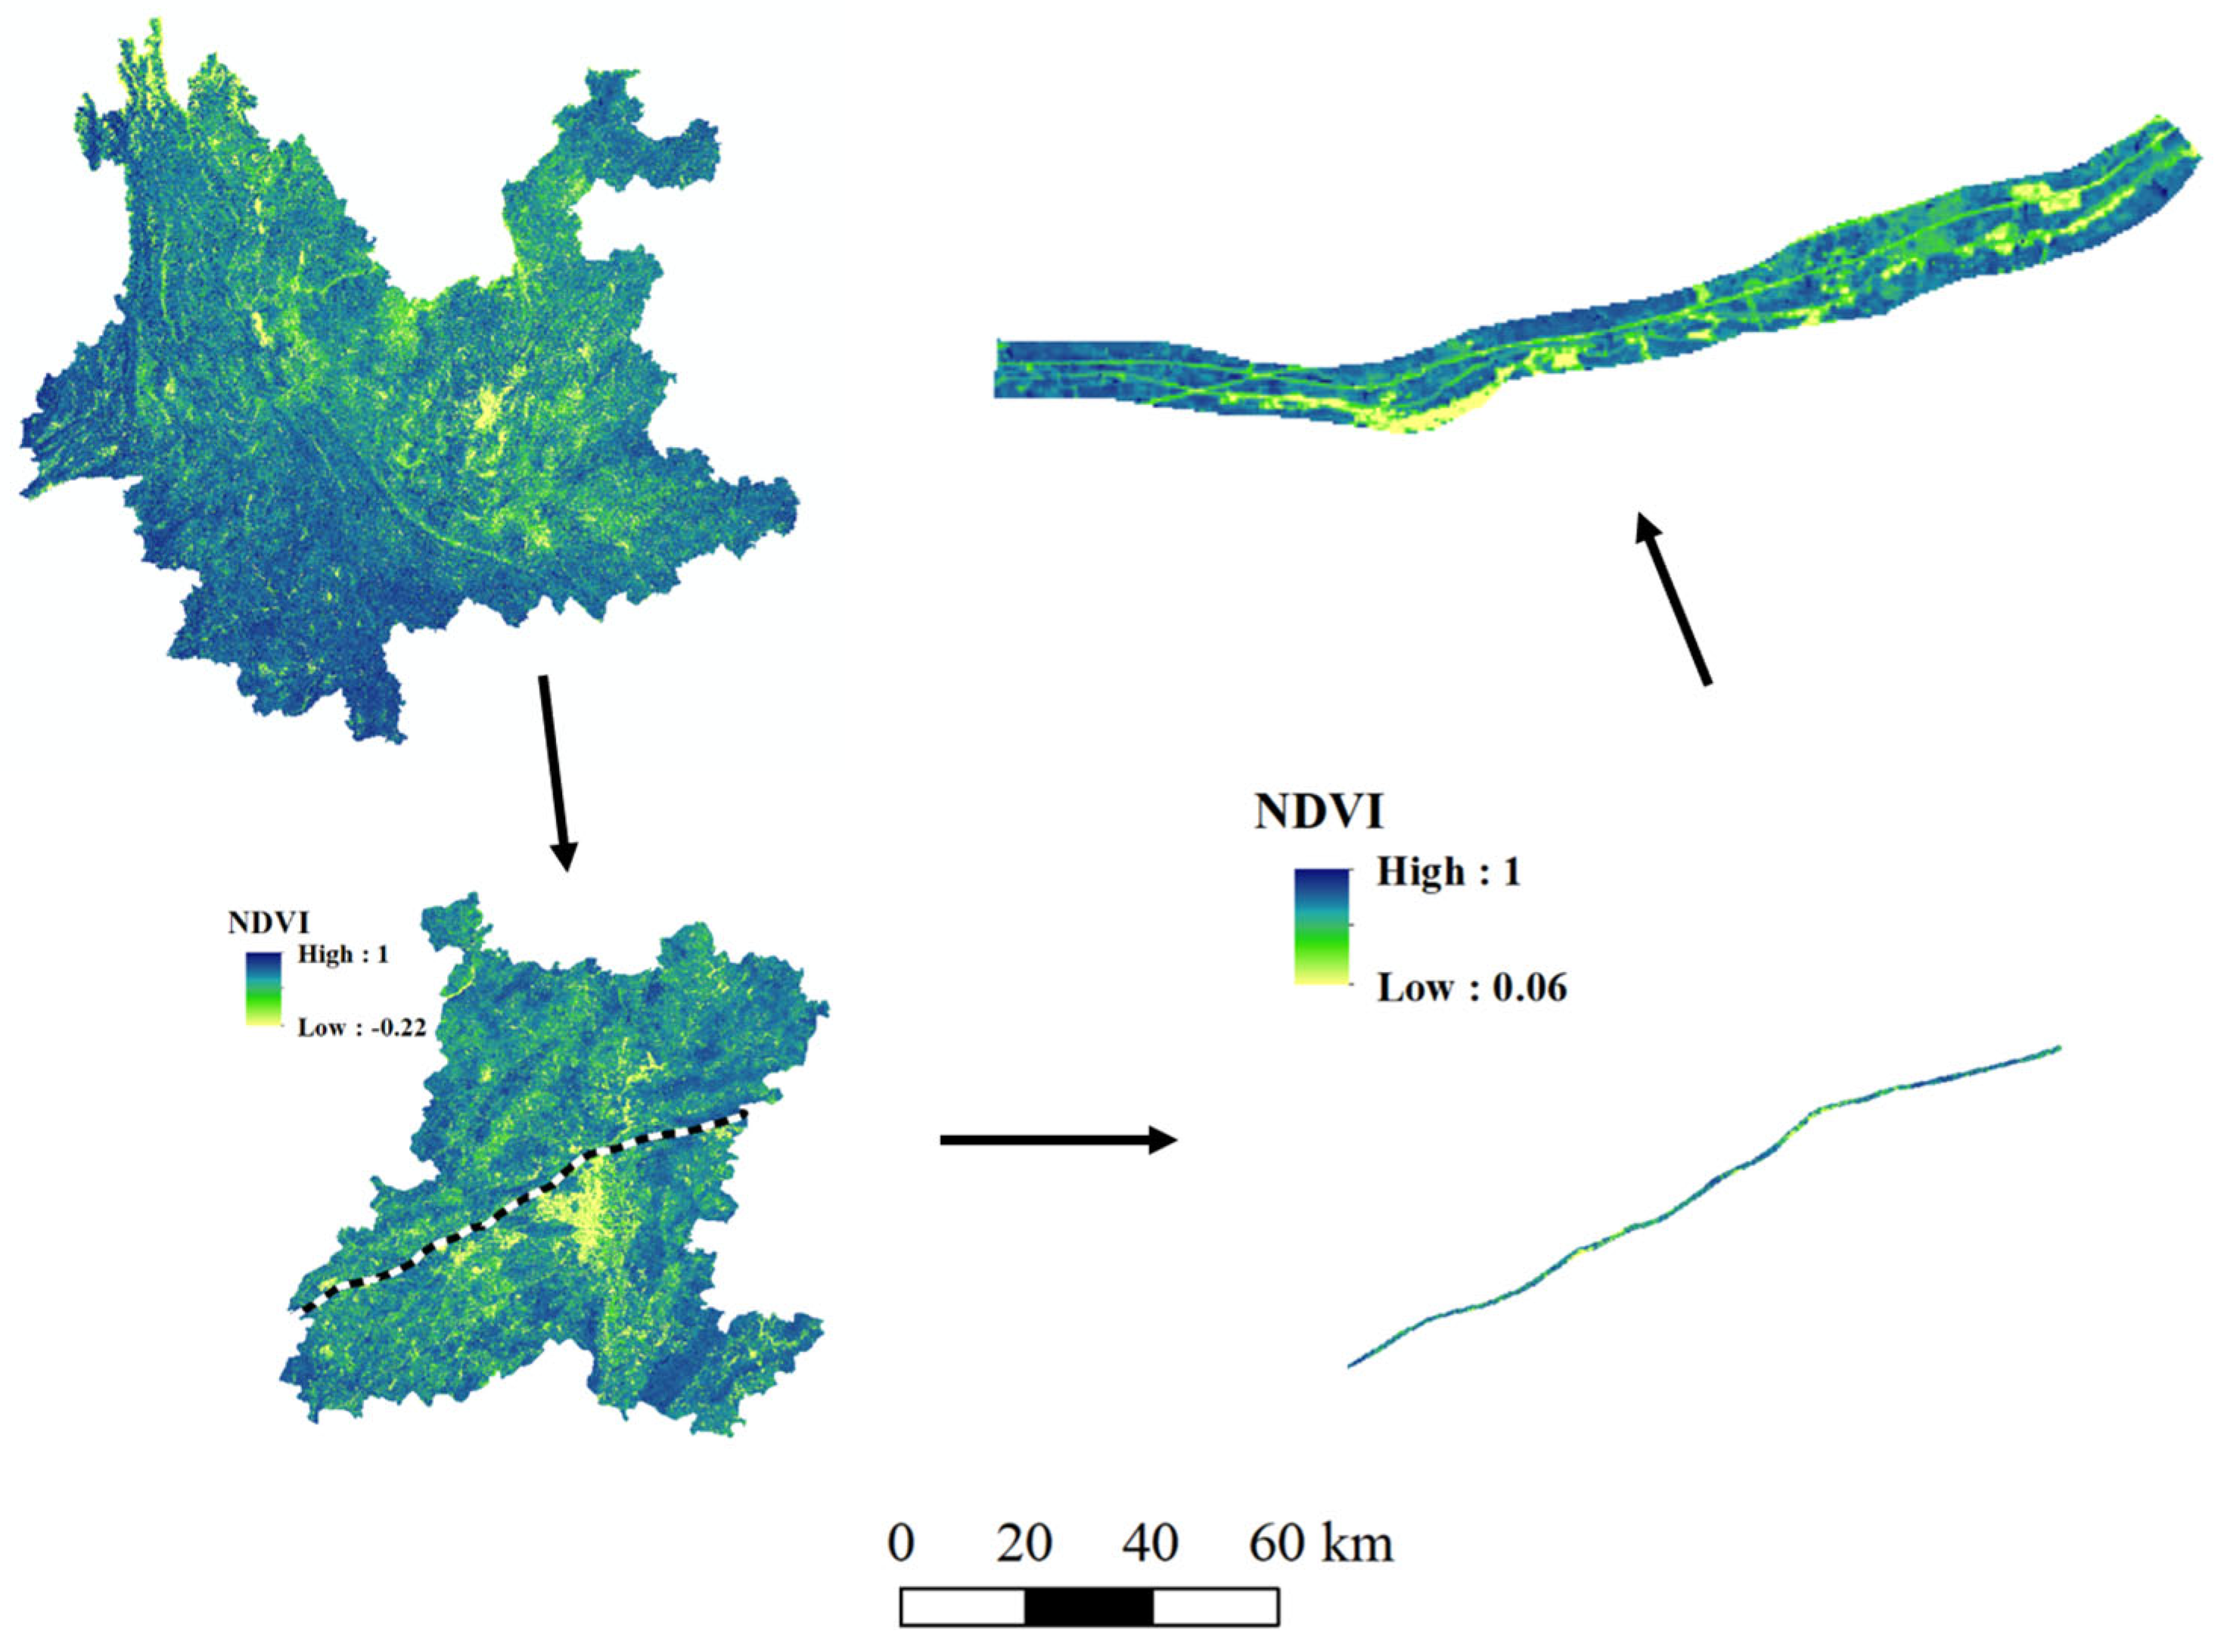
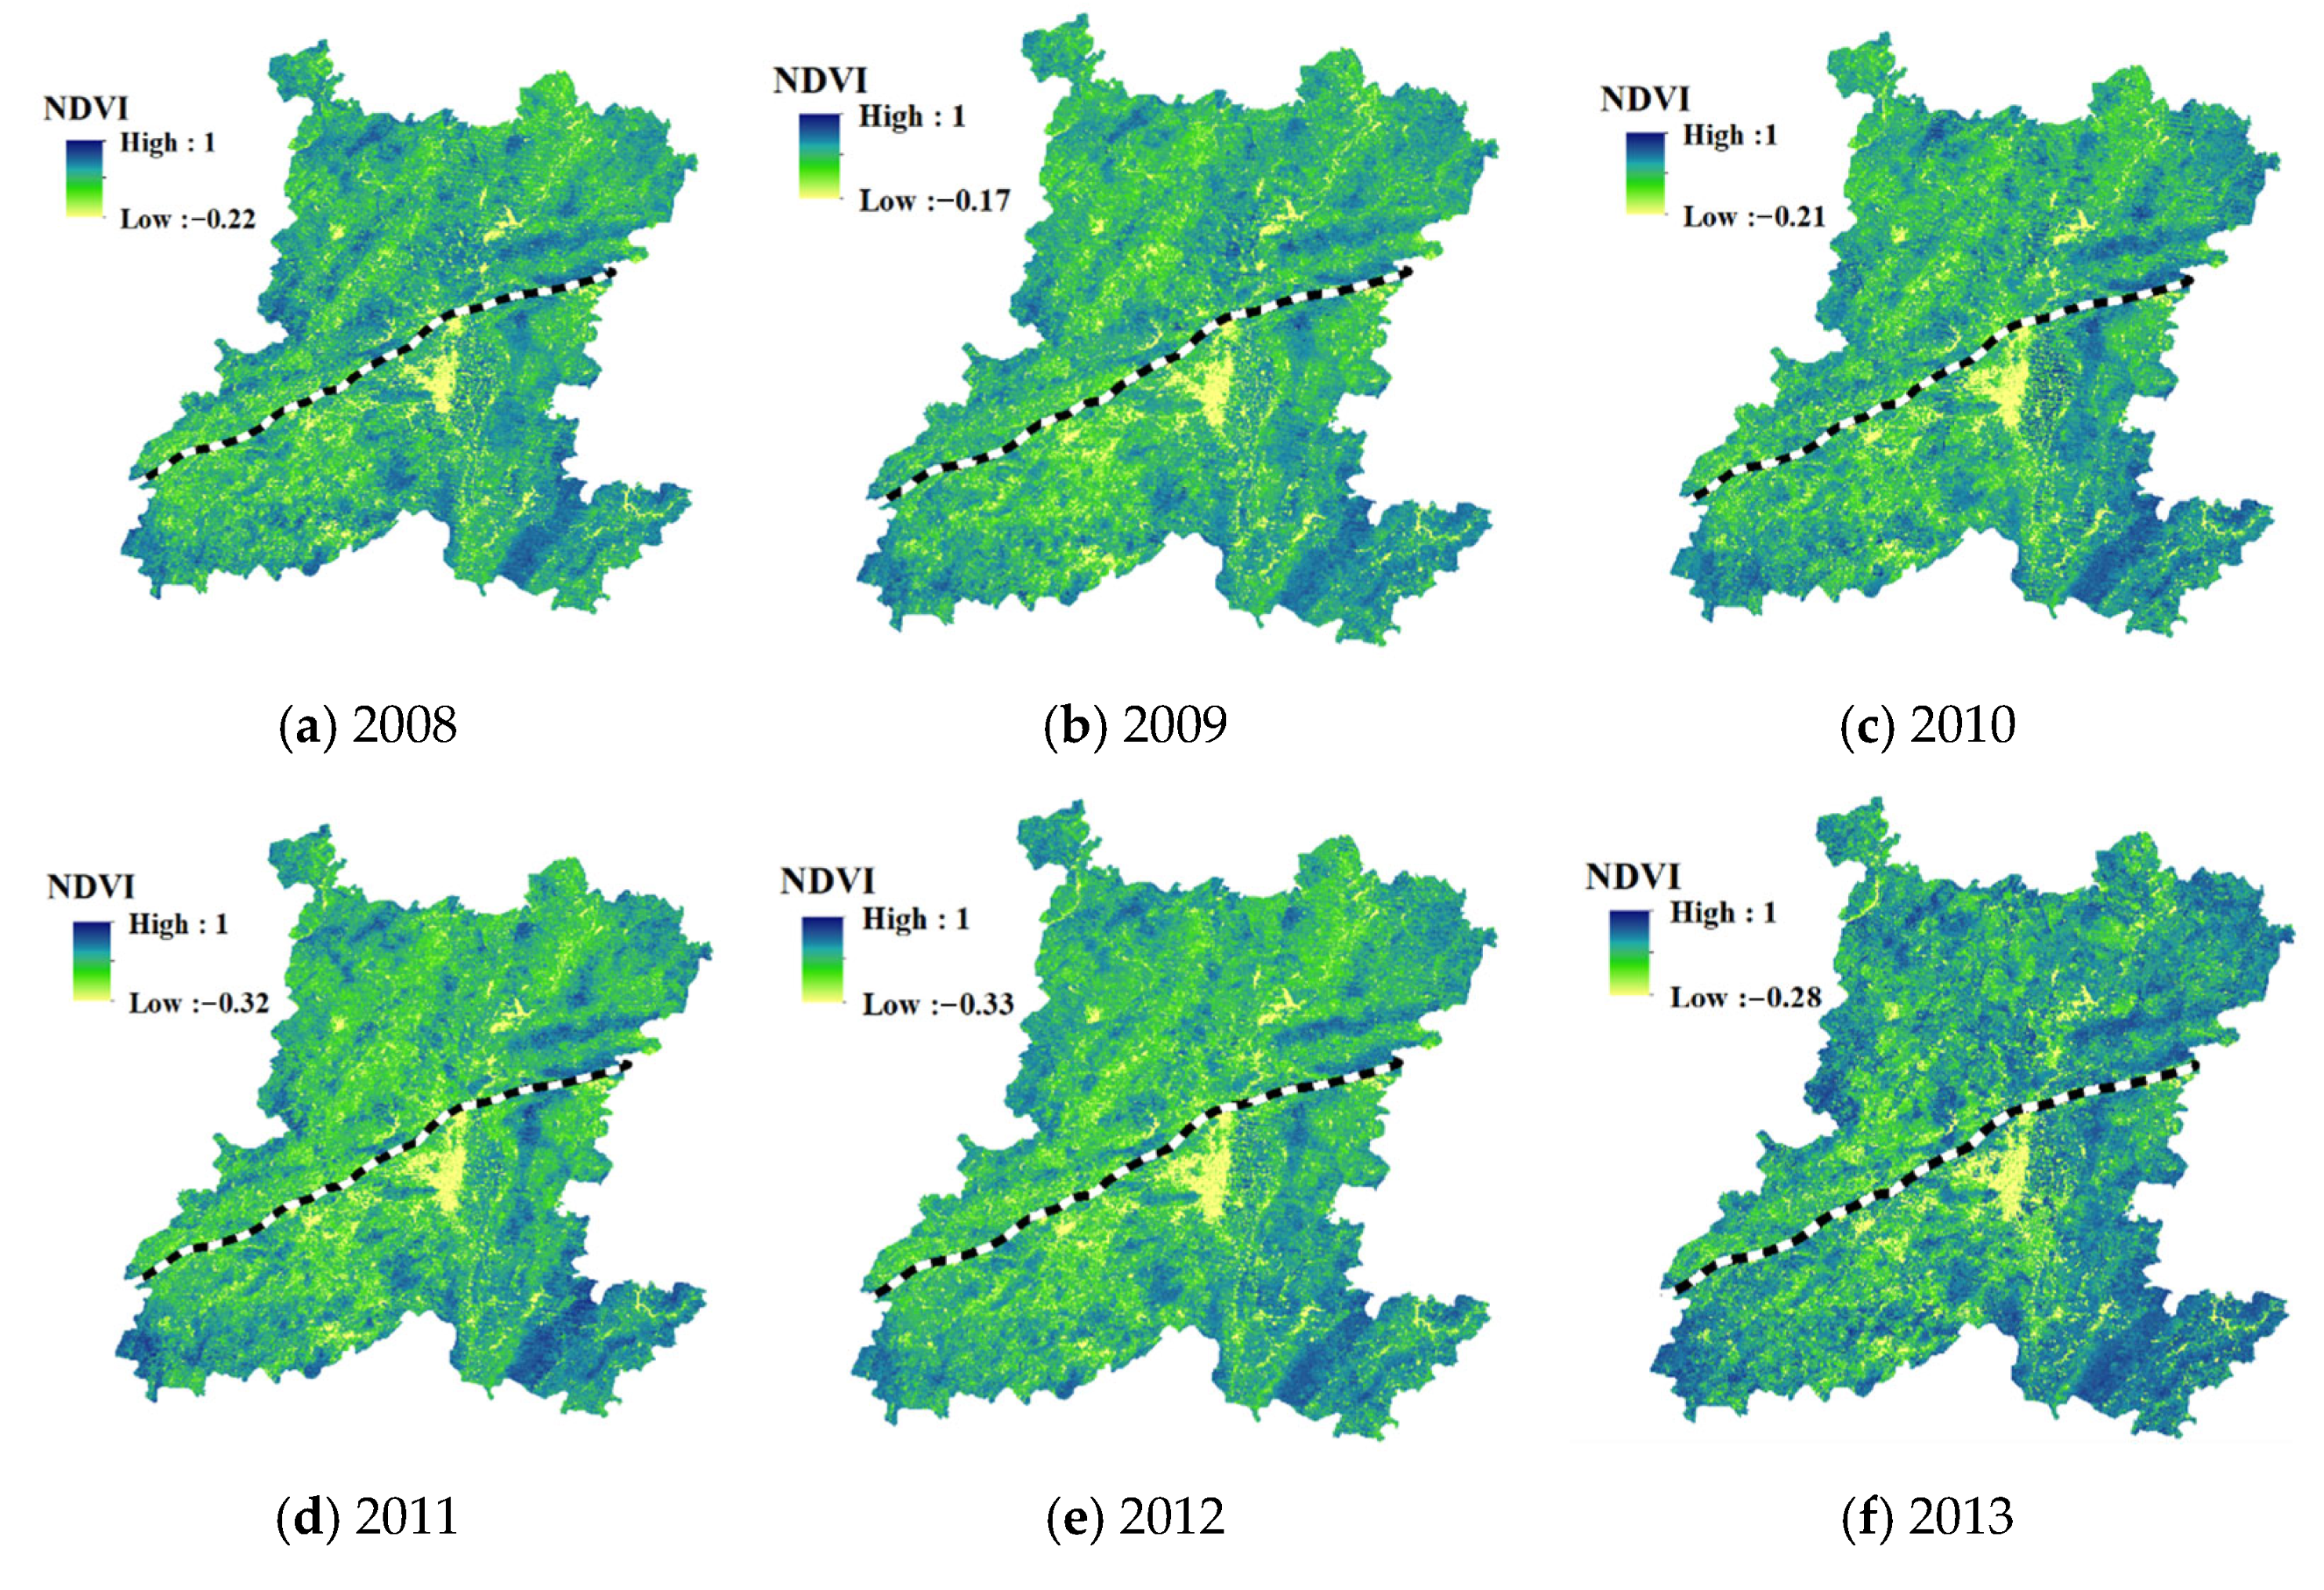
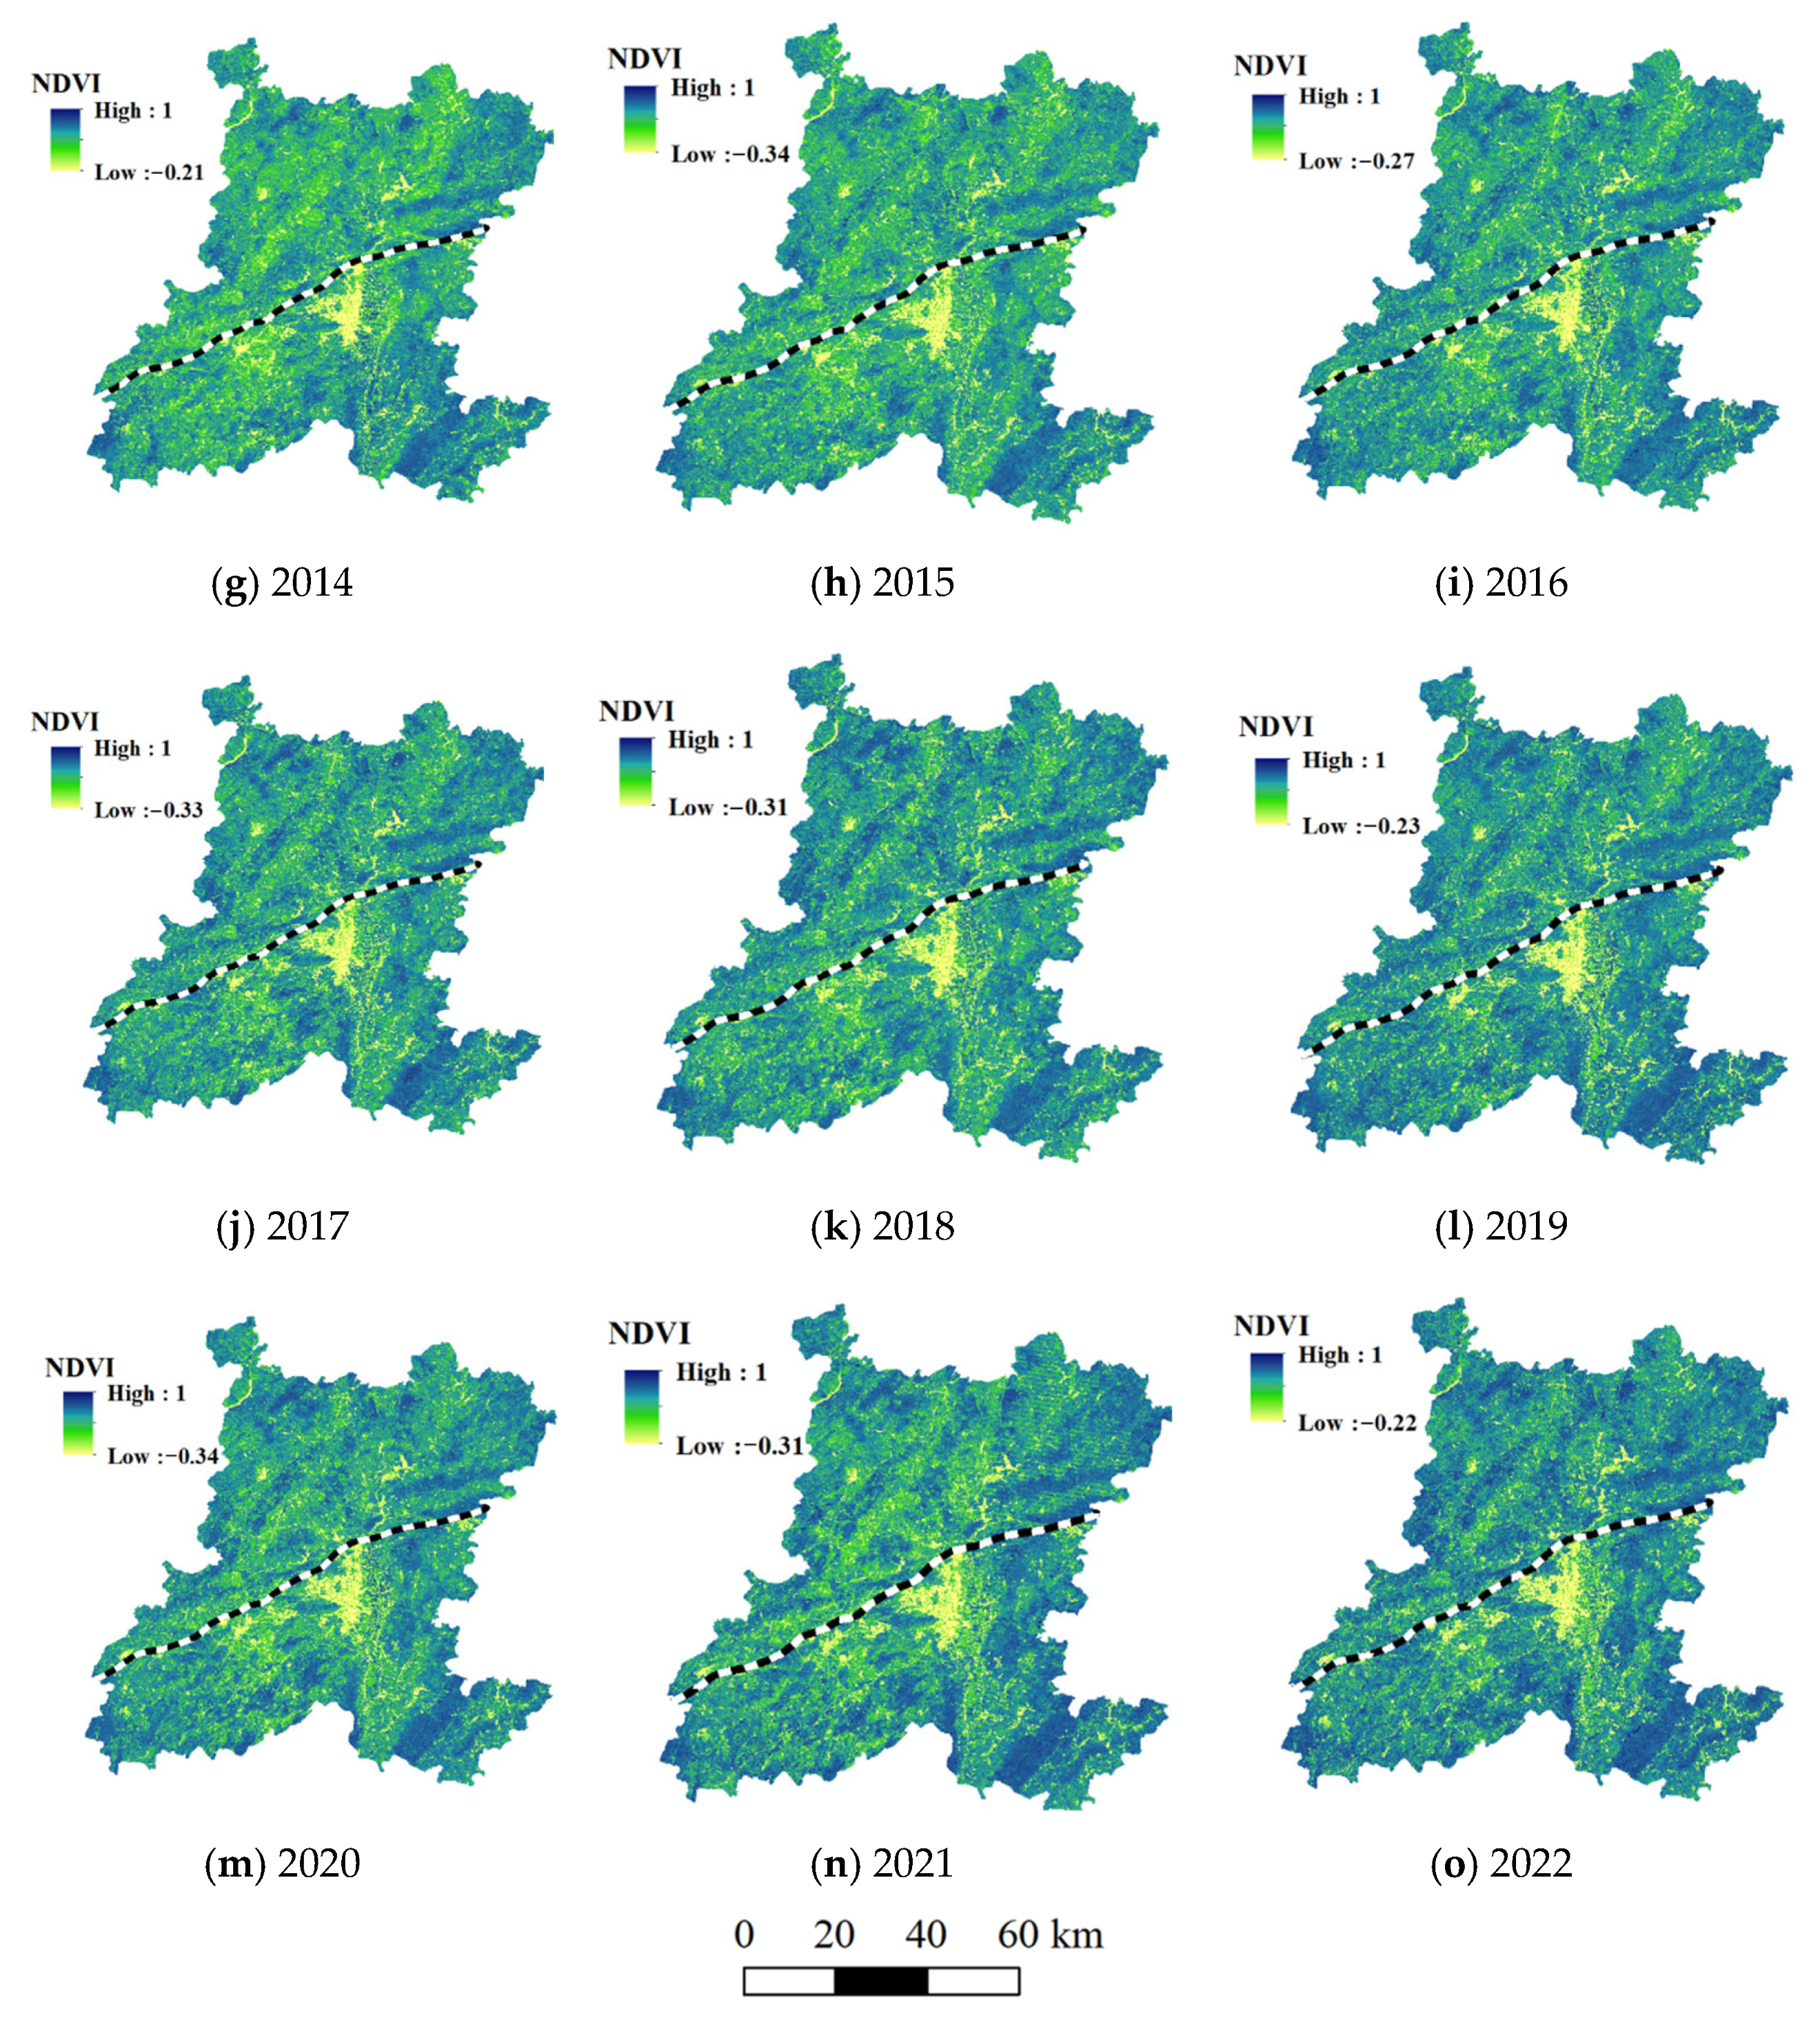
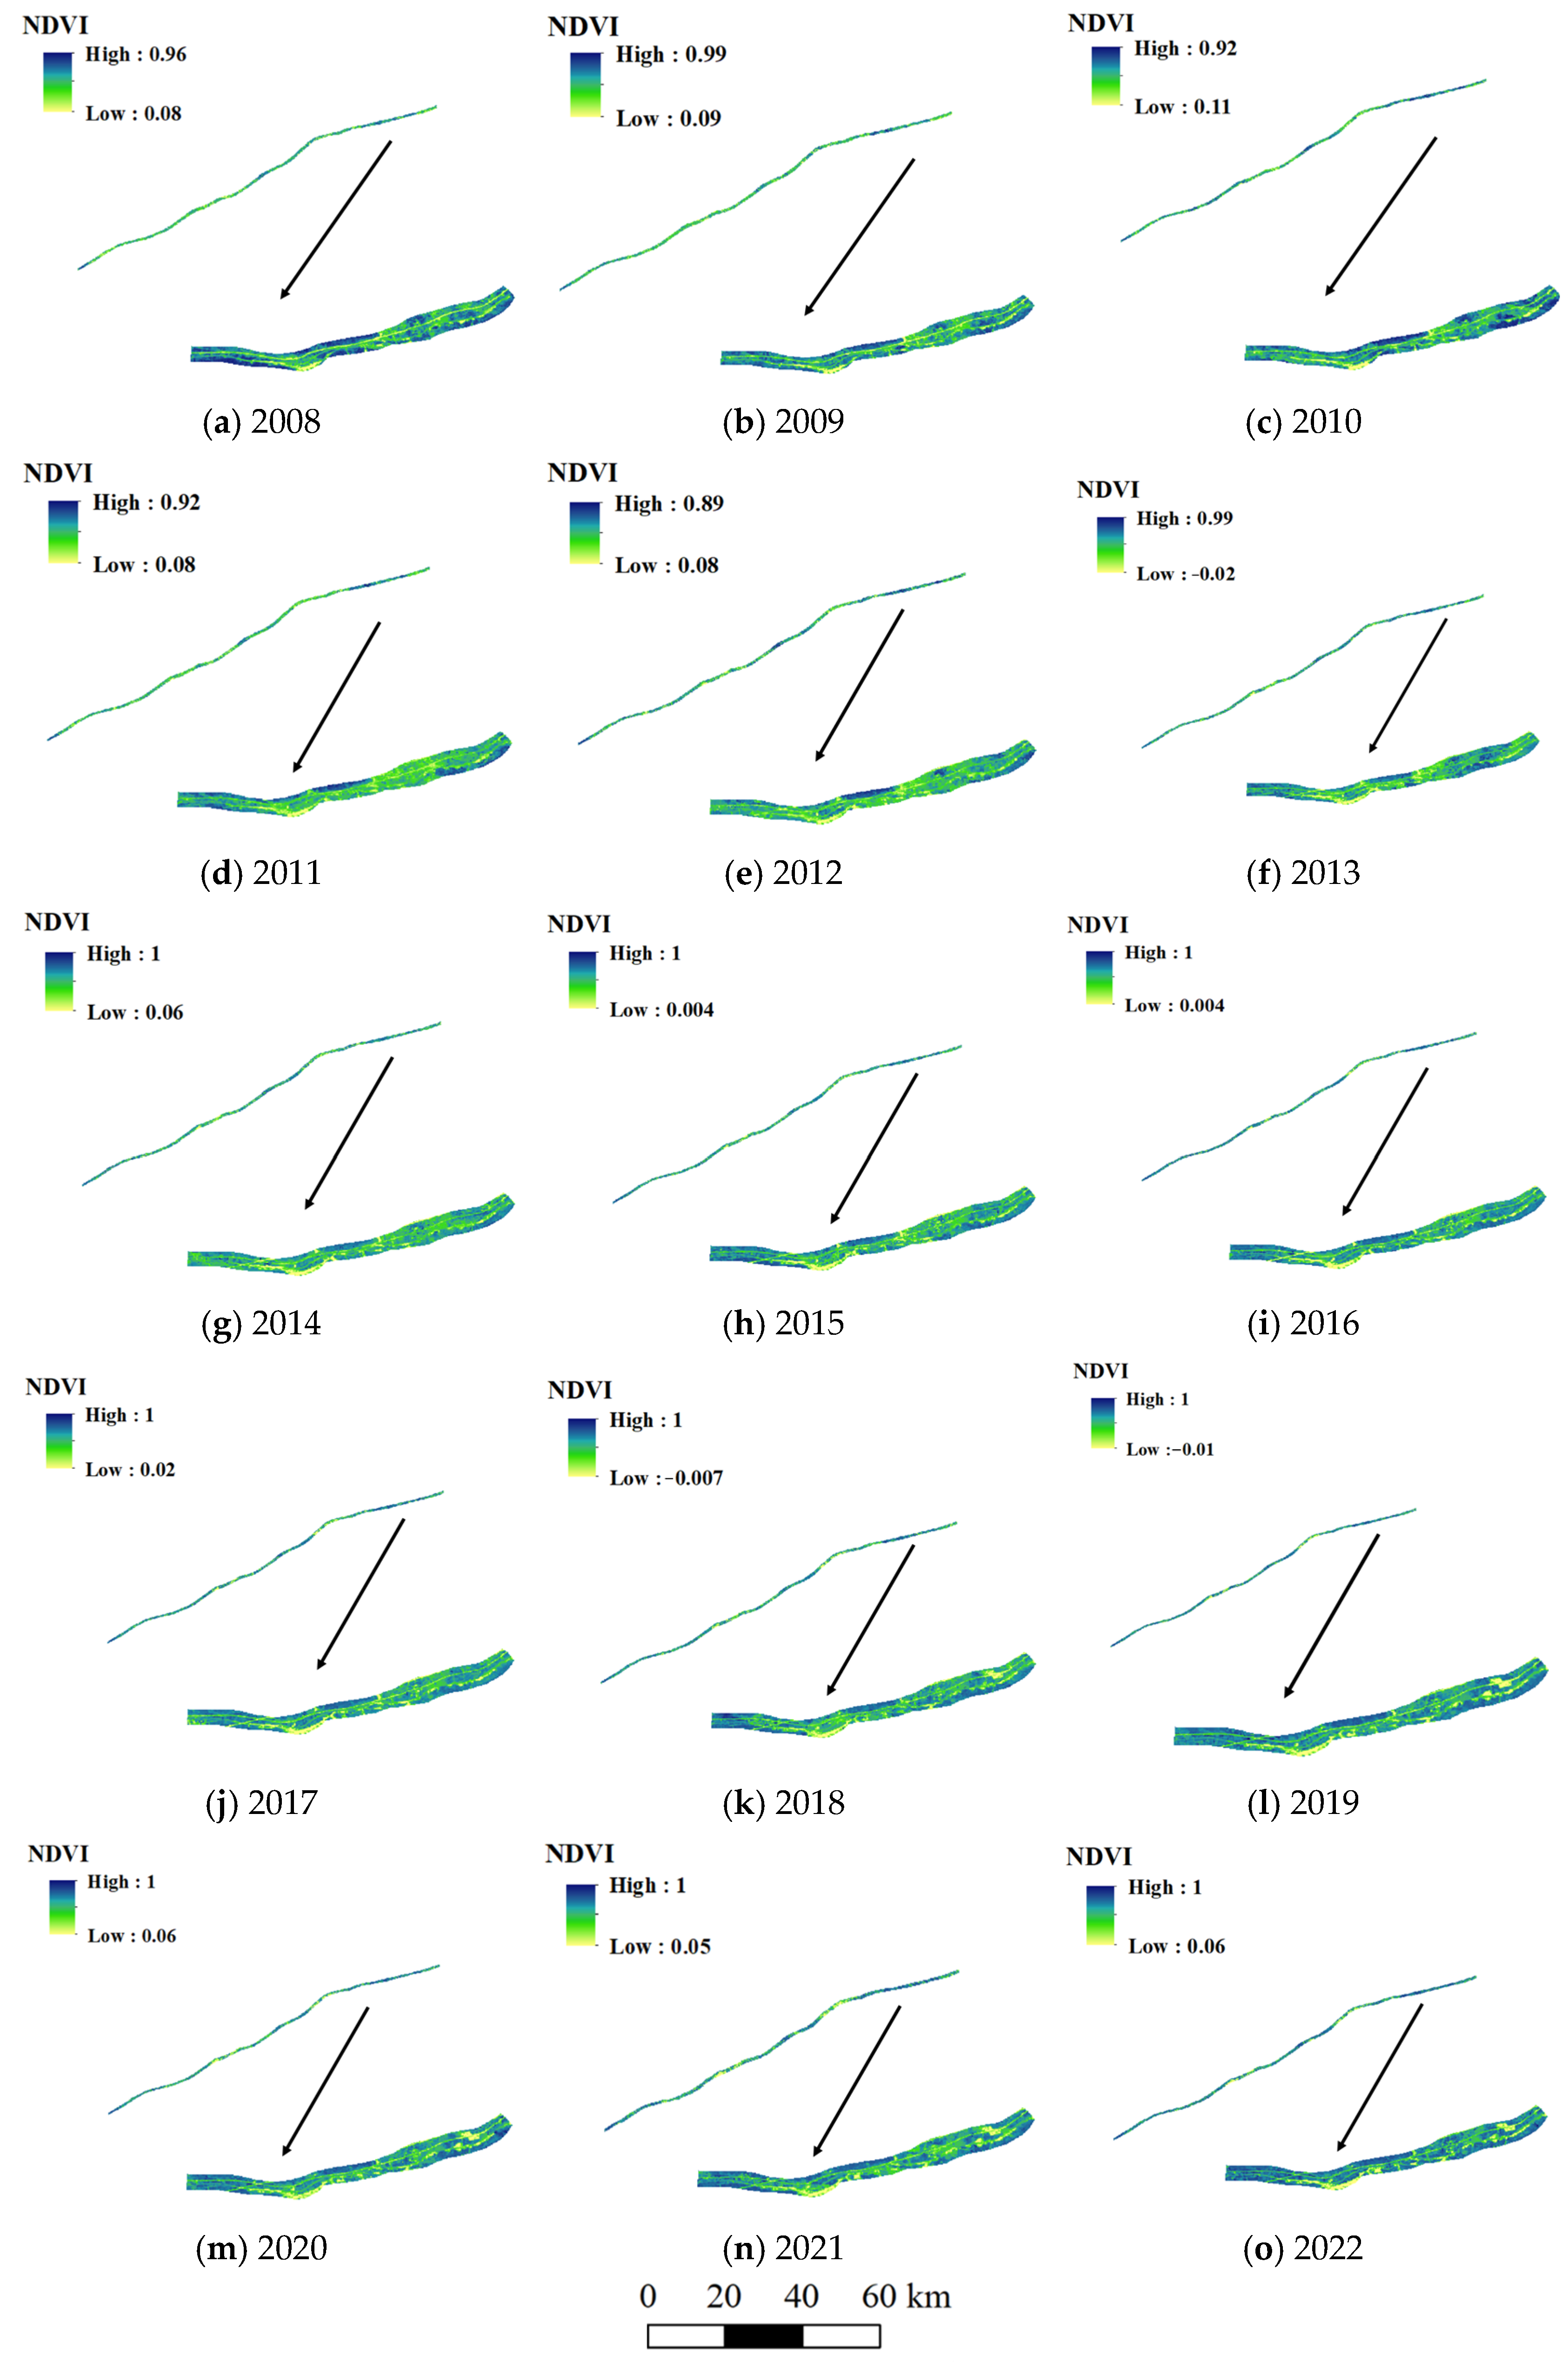
4.2. Vegetation Temporal–Spatial Characteristics Inversion

4.2.1. Inversion Index

NDVI data with a resolution at 30 m are sourced from the Geographic Remote Sensing Ecological Network platform and can be accessed via the following URL: http://www.gisrs.cn. The dataset comprises annual NDVI data from 2008 to 2022.
The process primarily utilizes ArcToolbox→Data Management Tools→Raster→Raster Processing→Clip. First, the regional remote sensing image is clipped from the provincial-level remote sensing image. Subsequently, the same method is applied to extract railway zones within the study area. The analysis process is shown in Figure 14.
As depicted in Figure 15, NDVI values primarily range from −0.34 to 1, with notably lower values along railway routes and in the central urban area of the study region. Surrounding the urban area, where forest cover is more abundant, many regions exhibit NDVI values reaching up to 0.99.
Furthermore, in 2011, this area experienced severe drought, which resulted in extensive vegetation dieback, with NDVI values along the line ranging from 0.11 to 0.92. Moreover, the NDVI values, which serve as indicators of vegetation health, were relatively low in the section from Zhanyi to Kunming in 2011 and 2012. Subsequently, as the climate normalized, the vegetation health in this region gradually improved.

4.2.2. NDVI Evolution Characteristics and Prediction After Application of Modified Soil

To further analyze the applicability of the proportion used in this study, NDVI data were collected from 20 test sites where hydroseeding was conducted using modified soil in the region. It is evident that vegetation along the railway line is relatively sparse, with more dense vegetation primarily located on the slopes on either side of the line, as shown in Figure 16 and Figure 17a. As illustrated in Figure 17b, this study defines δ as the difference between the NDVI value at 3000 points in the current year and the previous year. The extensive vegetation dieback caused by the severe drought in 2011 resulted in δ being generally negative. Since 2013, most of the remaining points have NDVI values above zero, indicating an overall increase in NDVI within the study region. This suggests that the shrubs applied according to the proportion are growing relatively well.
Furthermore, this study computed the average NDVI for 15 years across the 20 test sites, as shown in Figure 17c. Aside from the severe drought in 2011, the area primarily features sparse herbaceous vegetation. Overall, the NDVI trend is positive and shows a gradual increase. Between 2008 and 2016, NDVI values increased from 0.145–0.712 to 0.165–0.771. Subsequently, NDVI levels at the test sites progressively reached healthier levels, and by 2022, they even achieved a value of 0.67. Over the past 15 years, the average NDVI value of the region has experienced significant changes, gradually increasing from an initial value of 0.52 in 2008 to a higher level. The trajectory of the average NDVI value indicates an overall upward trend, with an accelerated growth rate observed especially after 2018. However, this growth trend was not always smooth, as fluctuations occurred due to external factors, such as a severe drought in 2011. Despite the occurrence of two droughts over the past 15 years, the standard deviation remained relatively stable, suggesting a degree of resilience in the system. Nonetheless, this observation does not directly imply that the climate was generally stable, as other factors may have influenced the variability.
Linear regression trend analysis is a method for conducting regression analysis on a set of variables that change over time. In this study, φ slope is defined to predict their future change trends, as shown in Equation (2). According to the results of the simple linear regression trend analysis, illustrated in Figure 17d, φ slope can be observed after the completion and operation of a plateau railway. The NDVI variation range for the 20 rock slopes sprayed in the study region over nearly 15 years is between 0.000283 and 0.0003. According to the classification in Table 1, this is categorized as “slight improvement,” indicating that the vegetation in general has shown a slight improvement each year.
φ slope = n i = 1 n ( i × NDVI i ) i = 1 n i × i = 1 n NDVI i n i = 1 n i 2 ( i = 1 n i ) 2
where n represents the total number of years; NDVIi denotes the mean of NDVI for the i-th year; and φ slope is the slope of the trend line.
The trend in NDVI is determined based on the slope of the trend line. The classification of the trend line slopes is provided in Table 1 [33].

5. Discussion

This study investigates the incorporation of peat soil and water-retaining agents into gravel soil, aiming to optimize the soil’s moisture characteristics. Additionally, the study employs satellite-derived NDVI to monitor the long-term health and spatial–temporal evolution of vegetation coverage in a plateau railway project from Zhanyi to Kunming.
Previous studies have highlighted the importance of soil–plant–moisture interactions in slope stability and vegetation growth but have often overlooked the specific moisture requirements of modified soils in bio-slope engineering [1,6,9,13]. While peat soil and water-retaining agents have been recognized for their ability to enhance soil structure, water retention, and nutrient availability, their application in bio-slope engineering has not been thoroughly investigated [16,17]. This study bridges this gap by systematically testing the effects of peat soil and water-retaining agents on the moisture characteristics of modified gravel soil. Furthermore, the use of NDVI for long-term vegetation monitoring represents a significant advancement over traditional field-based assessments, providing a more efficient and scalable method for evaluating the effectiveness of bio-slope engineering projects. The integration of satellite imagery and NDVI-based analysis also allows for a more comprehensive understanding of the spatial–temporal evolution of vegetation coverage, which has not been extensively explored in previous research [18,19,20,21,22,23,24,25,26,27].
Future research should focus on refining the optimal proportions of peat soil and water-retaining agents for different types of modified soils and environmental conditions. Additionally, the long-term performance of bio-slope engineering projects should be further investigated using advanced remote sensing techniques, such as high-resolution satellite imagery and machine learning algorithms, to improve the accuracy of vegetation health assessments. Exploring the interactions between soil amendments, plant species, and climatic factors could also provide valuable insights into enhancing the resilience of vegetative slope protection systems. Finally, the development of standardized guidelines for the application of modified soils in bio-slope engineering would facilitate the widespread adoption of these practices, ensuring their effectiveness in diverse geographical and climatic contexts.

6. Conclusions

This study is based on bio-slope engineering protection along a plateau railway from Zhanyi to Kunming. The 30 proportion experiments about peat soil and water-retaining agent contents were conducted. Field monitoring was performed, and remote sensing technology was employed to quantitatively analyze the spatial–temporal evolution of vegetation cover on 20 rock slopes over nearly 15 years following the application of modified soil. The main research conclusions are as follows:
(1)
The addition of peat soil to the gravel soil improves its field capacity and water absorption capacity, facilitating the absorption and storage of more water in a shorter period. However, increased peat soil content also raises the wilting point of modified soil, which is detrimental to plant survival under drought conditions. Additionally, excessive use of peat soil content can significantly increase the infiltration coefficient of the modified soil, adversely affecting slope stability.
(2)
The addition of a water-retaining agent to the gravel soil similarly enhances its field capacity and water absorption capacity, and it also lowers the wilting point, which benefits the absorption and storage of more water in a shorter time.
(3)
Field spraying of the modified soil indicates that, considering soil moisture constant, infiltration coefficient, and water absorption capacity, the proposed proportion—gravel soil with 80%, peat soil with 20%, water-retaining agent with 1.0‰, aggregate agent with 1.0‰, and fertilizer with 100 g/m2—is reasonable.
(4)
According to remote sensing data over 15 years since the completion of the railway construction, except for significant vegetation dieback in 2011 due to drought, the NDVI in the study region has generally improved since 2013. The NDVI of 3000 points has consistently increased year by year and stabilized around 2016, with the average NDVI rising from 0.59 to 0.67. The vegetation improvement on the rock slope cuttings over the past 15 years has shown a trend of slight improvement.

Author Contributions

G.Y.: Investigation, methodology, validation, writing—original draft, writing—review and editing. Z.H.: Conceptualization, writing—review and editing. K.W.: Investigation, data curation, formal analysis. J.Z.: Conceptualization, writing—review and editing, project administration. Y.Z.: Resources, investigation, writing—review and editing. All authors have read and agreed to the published version of the manuscript.

Funding

This research was funded by China Railway Corporation Limited Science and Technology Research and Development Plan, grant number [2023-Key-20].

Data Availability Statement

The datasets used and/or analyzed during the current study are available from the corresponding author on reasonable request.

Acknowledgments

This research was conducted as part of China Railway Corporation Limited Science and Technology Research and Development Plan.

Conflicts of Interest

Authors Gui Yu and Kun Wu were employed by the company China Railway Academy Co., Ltd. The remaining authors declare that the research was conducted in the absence of any commercial or financial relationships that could be construed as a potential conflict of interest. The authors declare that this study received funding from China Railway Corporation Limited Science and Technology Research and Development Plan, grant number [2023-Key-20]. The funder was not involved in the study design, collection, analysis, interpretation of data, the writing of this article or the decision to submit it for publication.

References

  1. Bordoloi, S.; Ng, C.W.W. The effects of vegetation traits and their stability functions in bio-engineered slopes: A perspective review. Eng. Geol. 2020, 24, 105742. [Google Scholar] [CrossRef]
  2. Karina, S.R.; Havana, V.G. Compressive strength of cement stabilized fly ash-soil mixtures. Cem. Concr. Res. 1999, 29, 673–677. [Google Scholar]
  3. Xuan, D.; Zhan, B.; Zheng, W. Innovative reuse of concrete slurry waste from ready-mixed concrete plants in construction products. J. Hazard. Mater. 2016, 312, 65–72. [Google Scholar] [CrossRef] [PubMed]
  4. Shao, Q.; Gu, W.; Dai, Q.Y.; Makoto, S.; Liu, Y. Effectiveness of geotextile mulches for slope restoration in semi-arid northern China. Catena 2014, 116, 1–9. [Google Scholar] [CrossRef]
  5. Abdi, E.; Azhdari, F.; Abdulkhani, A.; Mariv, H.S. Tensile strength and cellulose content of Persian ironwood (Parrotia persica) roots as bioengineering material. J. For. Sci. 2014, 60, 425–430. [Google Scholar] [CrossRef]
  6. Giustozzi, F. Polymer-modified pervious concrete for durable and sustainable transportation infrastructures. Constr. Build. Mater. 2016, 111, 502–512. [Google Scholar] [CrossRef]
  7. Aziz, M.M.; Palta, J.A.; Siddique, K.H.; Sadras, V.O. Five decades of selection for yield reduced root length density and increased nitrogen uptake per unit root length in Australian wheat varieties. Plant Soil 2017, 413, 181–192. [Google Scholar] [CrossRef]
  8. Das, G.K.; Hazra, B.; Garg, A.; Ng, C.W.W. Stochastic hydro-mechanical stability of vegetated slopes: An integrated copula based framework. Catena 2018, 160, 124–133. [Google Scholar] [CrossRef]
  9. Qing, L.; Qiu, Q.; Jun, Z.; Wang, J.; Qiang, Z. Fractal dimension of concrete incorporating silica fume and its correlations to pore structure, strength and permeability. Constr. Build. Mater. 2019, 228, 116986. [Google Scholar]
  10. Chen, J.; Chen, Z.; Ai, Y.; Xiao, J.; Pan, D.; Li, W.; Huang, Z.; Wang, Y. Impact of soil composition and electrochemistry on corrosion of rock-cut slope nets along railway lines in China. Sci. Rep. 2015, 5, 14939. [Google Scholar] [CrossRef]
  11. Chen, Z.Q.; Luo, R.H.; Huang, Z.Y.; Tu, W.G.; Chen, J.; Li, W.; Chen, S.N.; Xiao, J.Y.; Ai, Y.W. Effects of different backfill soils on artificial soil quality for cut slope revegetation: Soil structure, soil erosion, moisture retention and soil C stock. Ecol. Eng. 2015, 83, 5–12. [Google Scholar] [CrossRef]
  12. Das, G.K.; Hazra, B.; Garg, A.; Ng, C.W.W. Impact of hydrological and mechanical correlations on the reliability of vegetated slopes. ASCE-ASME J. Risk Uncertain. Eng. Syst. Part A Civ. Eng. 2017, 3, 04017029. [Google Scholar] [CrossRef]
  13. Evans, C.; Peacock, M.; Baird, A.; Artz, R.; Burden, A.; Callaghan, N.; Chapman, P.; Cooper, H.; Coyle, M.; Craig, E.; et al. Overriding water table control on managed peatland greenhouse gas emissions. Nat.-Int. J. Sci. 2021, 593, 548–552. [Google Scholar] [CrossRef] [PubMed]
  14. Yli-Halla, M.; Lötjönen, T.; Kekkonen, J.; Virtanen, S.; Marttila, H.; Liimatainen, M.; Saari, M.; Mikkola, J.; Suomela, R.; Joki-Tokola, E. Thickness of peat influences the leaching of substances and greenhouse gas emissions from a cultivated organic soil. Sci. Total Environ. 2022, 806, 150499. [Google Scholar] [CrossRef]
  15. Ahanger, M.A.; Qi, M.; Huang, Z.; Xu, X.D.; Begum, N.; Qin, C.; Zhang, C.X.; Ahmad, N.; Mustafa, N.S.; Ashraf, M.; et al. Improving growth and photosynthetic performance of drought stressed tomato by application of nano-organic fertilizer involves up-regulation of nitrogen, antioxidant and osmolyte metabolism. Ecotoxicol. Environ. Saf. 2021, 216, 112195. [Google Scholar] [CrossRef]
  16. Anokye, E.; Lowor, S.T.; Dogbatse, J.A.; Padiet, F.K. Potassium application positively modulates physiological responses of cocoa seedlings to drought stress. Agronomy 2021, 11, 563. [Google Scholar] [CrossRef]
  17. Martinez, A.; Labib, S.M. Demystifying normalized difference vegetation index (NDVI) for greenness exposure assessments and policy interventions in urban greening. Environ. Res. 2023, 220, 115155. [Google Scholar] [CrossRef]
  18. Rahetlah, V.B.; Salgado, P.; Andrianarisoa, B.; Tillard, E.; Ramalanjaona, V.L. Relationship between normalized difference vegetation index (NDVI) and forage biomass yield in the Vakinankaratra region. Madagascar. Livest. Res. Rural Dev. 2014, 26, S33–S36. [Google Scholar]
  19. Tian, F.; Brandt, M.; Liu, Y.Y.; Verger, A.; Tagesson, T.; Diouf, A.A. Remote sensing of vegetation dynamics in drylands: Evaluating vegetation optical depth (VOD) using AVHRR NDVI and in situ green biomass data over West African Sahel. Remote Sens. Environ. 2016, 177, 265–276. [Google Scholar] [CrossRef]
  20. Nutsford, D.; Reitsma, F.; Pearson, A.L.; Kingham, S. Personalising the viewshed: Visibility analysis from the human perspective. Appl. Geogr. 2015, 62, 1–7. [Google Scholar] [CrossRef]
  21. van Renterghem, T.; Botteldooren, D. View on outdoor vegetation reduces noise annoyance for dwellers near busy roads. Landsc. Urban Plan. 2016, 148, 203–215. [Google Scholar] [CrossRef]
  22. Gascon, M.; Triguero-Mas, M.; Martínez, D.; Dadvand, P.; Rojas-Rueda, D.; Plasència, A.; Nieuwenhuijsen, M.J. Residential green spaces and mortality: A systematic review. Environ. Int. 2016, 86, 60–67. [Google Scholar] [CrossRef] [PubMed]
  23. Gascon, M.; Zijlema, W.; Vert, C.; White, M.P.; Nieuwenhuijsen, M.J. Outdoor blue spaces, human health and well-being: A systematic review of quantitative studies. Int. J. Hyg. Environ. Health 2017, 220, 1207–1221. [Google Scholar] [CrossRef] [PubMed]
  24. Vienneau, D.; de Hoogh, K.; Faeh, D.; Kaufmann, M.; Wunderli, J.M.; Röösli, M.; SNC Study Group. More than clean air and tranquillity: Residential green is in dependently associated with decreasing mortality. Environ. Int. 2017, 108, 176–184. [Google Scholar] [CrossRef]
  25. Leung, T.M.; Xu, J.M.; Chau, C.K.; Tang, S.K.; Pun-Cheng, L.S.C. The effects of neighborhood views containing multiple environmental features on road traffic noise perception at dwellings. J. Acoust. Soc. Am. 2017, 141, 2399–2407. [Google Scholar] [CrossRef]
  26. Dzhambov, A.M.; Markevych, I.; Tilov, B.; Arabadzhiev, Z.; Stoyanov, D.; Gatseva, P.; Dimitrova, D.D. Lower noise annoyance associated with GIS-derived greenspace: Pathways through perceived greenspace and residential noise. Int. J. Environ. Res. Public Health 2018, 15, 1533. [Google Scholar] [CrossRef]
  27. Banerjee, B.; Pal, A.; Tiwari, A.K.; Kanchan, R. Assessing the land use dynamics and thermal environment using geospatial techniques in the industrial city of Chotanagpur Plateau Region, India. Environ. Monit. Assess. 2024, 196, 609. [Google Scholar] [CrossRef]
  28. Wu, S.; Zhang, Y.; Kang, W. Employing NDVI as vegetation correction variable to improve soil moisture measurements of mobile cosmic-ray neutron sensor near the Qilian Mountains. Geoderma 2024, 441, 116764. [Google Scholar] [CrossRef]
  29. Mozumder, C.; Tripathi, N.K.; Tipdecho, T. Ecosystem evaluation (1989–2012) of Ramsar wetland Deepor Beel using satellite-derived indices. Environ. Monit. Assess. 2014, 186, 7909–7927. [Google Scholar] [CrossRef]
  30. Zhang, X.; Zhou, Y.; Long, L.; Hu, P.; Huang, M.; Chen, Y.; Chen, X. Prediction of the spatiotemporal evolution of vegetation cover in the Huainan mining area and quantitative analysis of driving factors. Environ. Monit. Assess. 2023, 195, 776. [Google Scholar] [CrossRef]
  31. Mori, N.; Yamashita, M.; Inoue, M.N. Integration of satellite remote sensing and MaxEnt modeling for improved detection and management of forest pests. Environ. Monit. Assess. 2024, 196, 616. [Google Scholar] [CrossRef] [PubMed]
  32. Forestry Industry Standard of the People’s Republic of China. Forest Soil Analysis Method; China Standards Press: Beijing, China, 2000. [Google Scholar]
  33. Xing, Y.; He, Z. An NDVI-based Analysis of the Temporal and Spatial Characteristics of Vegetation Coverage in Guizhou Province. J. S. China Norm. Univ. (Nat. Sci. Ed.) 2021, 53, 84–95. [Google Scholar]
Figure 1. Bio-slope engineering for railway embankments.
Water 17 00778 g001
Figure 2. Mechanism of growth promotion in plants by peat and water-retaining agents.
Water 17 00778 g002
Figure 3. Research region and granular soil.
Water 17 00778 g003
Figure 4. The gradation of modified soil.
Water 17 00778 g004
Figure 5. The data collected using a ring knife.
Water 17 00778 g005
Figure 6. Effect of peat soil and water-retaining agent on the moisture constant of the modified soil.
Water 17 00778 g006
Figure 7. Relationship of infiltration coefficient of modified soil and peat content.
Water 17 00778 g007
Figure 8. Analysis of water absorption capacity of modified soil. (a) Relationship of water absorption capacity and peat soil. (b) Relationship of water absorption capacity and water-retaining agent.
Water 17 00778 g008
Figure 9. Relationship of efficient ratio of water absorption and peat content and water-retaining agent content.
Water 17 00778 g009
Figure 10. Modified soil spraying test on site.
Water 17 00778 g010
Figure 11. Field capacity (black dots) and permeability coefficient (red dots) of modified soil spraying test on site.
Water 17 00778 g011
Figure 12. Water absorption capacity of modified soil.
Water 17 00778 g012
Figure 13. Growth status of plants on rock slope.
Water 17 00778 g013
Figure 14. The process of NDVI analysis.
Water 17 00778 g014
Figure 15. NDVI changes in the study region.
Water 17 00778 g015aWater 17 00778 g015b
Figure 16. NDVI changes of section from Zhanyi to Kunming in a plateau railway.
Water 17 00778 g016
Figure 17. Analysis and prediction of NDVI evolution for the Zhanyi to Kunming section of a plateau railway.
Water 17 00778 g017
Table 1. The table of NDVI variation.
Trend Line Slope ClassificationNDVI Change Trend
φ slope 0.0091 Severe degradation
0.009 φ slope 0.0046 Moderate degradation
0.0045 φ slope 0.0010 Light degradation
0.0009 φ slope 0.0009 Essentially unchanged
0.0010 φ slope 0.0045 Slight improvement
0.0046 φ slope 0.0090 Moderate improvement
φ slope 0.0091 Significant improvement
Disclaimer/Publisher’s Note: The statements, opinions and data contained in all publications are solely those of the individual author(s) and contributor(s) and not of MDPI and/or the editor(s). MDPI and/or the editor(s) disclaim responsibility for any injury to people or property resulting from any ideas, methods, instructions or products referred to in the content.

