Abstract
Treating contamination plumes in relatively lower-permeability zones (LPZs) presents a significant challenge for injection-based remediation due to aquifer heterogeneity. Currently, xanthan gum, as a co-remediation agent, has been confirmed to enhance the removal efficiency of contaminants in these zones. However, its associated effects on plume migration remain to be clarified. This study revealed the mechanisms by which xanthan addition enhances the removal rate of perchloroethylene (PCE), as well as its effects on plume migration. The results demonstrated that the injection of xanthan induces adverse migration of contamination plumes. A nonlinear relationship was observed between xanthan concentration, injection rate, and remediation performance. Within the studied range (0 g/L–0.8 g/L; 10 mL/min–40 mL/min), an optimal xanthan concentration (0.8 g/L) and injection rate (25 mL/min) were identified, at which the PCE removal efficiency was significantly improved, and the contamination plume migration was effectively inhibited. For combinations of porous media with a lower permeability contrast, adding xanthan led to better performance. To provide a comprehensive assessment of the remediation performance, four key indicators were proposed: remediation measurement factor, PCE removal rate, sweeping uniformity, and injection pressure. The results identified the optimal remediation conditions: M-F combination with the lowest permeability contrast (4.9), 0.4 g/L xanthan, and an injection rate of 25 mL/min. These findings contribute valuable insights for the formulation of more efficient remediation strategies.
1. Introduction
Due to millions of years of geologic processes, the spatial distribution and properties of aquifer media have become extremely inhomogeneous [1]. Aquifer heterogeneity has been shown to not only affect the distribution of the contaminant but also affect the path through which the remedial agent is delivered to the contaminated area [2,3]. In contaminated areas, contaminants have been observed to migrate outward from the plume, typically moving from higher-permeability zones (HPZs) to lower-permeability zones (LPZs); however, in the process of in situ chemical remediation, due to the existence of preferential flow paths in heterogeneous aquifers, remedial fluids tend to flow through areas of higher permeability and bypass those of lower permeability, leading to insufficient contact between the oxidant and the target contaminant trapped in the LPZs [4]. After treatment, contaminants in low-permeability areas have been found to be prone to reverse diffusion, which has greatly limited the treatment effectiveness of in situ chemical oxidation (ISCO) remediation [5,6,7,8]. Especially in source zones of DNAPL contamination, the complex distribution of DNAPL in heterogeneous media has made it difficult for remedial fluids to capture all contamination plumes [9,10]. Since the completion of remediation projects in ISCO-treated DNAPL source zones, the phenomenon of contaminant concentration rebound has often been observed [11,12,13]. The stronger the site heterogeneity, the more frequently concentration rebound has occurred [14]. West et al. [15] investigated the treatment of PCE source zones in field-scale heterogeneous porous media utilizing a transport model. The simulation results demonstrated that the remediation performance was highly variable due to the heterogeneity of the geological structure. Additionally, the tailing effect observed during the post-treatment phase of the simulations diminished the benefits achieved during active treatment.
Drawing on the mobility-controlled method applied in the petroleum industry [16], research on the synergistic delivery of polymers with remedial agents has advanced to address bypassing problems caused by aquifer heterogeneity in the field of groundwater contaminant remediation [17,18,19,20]. Using water-soluble polymers (such as shear-thinning polymer xanthan gum, hydrolyzed polyacrylamide, etc.) to increase the viscosity of the replacement fluid has been found to increase the resistance of the displacement phase flow in the higher-permeability layer, thereby promoting fluid penetration into adjacent lower-permeability layers [16,21]. Therefore, the adverse effect of aquifer heterogeneity on the uniform distribution of remedial agents during injection has been mitigated [22,23,24,25]. In particular, xanthan gum, as an environmentally friendly polymer, has been demonstrated in numerous studies to exhibit outstanding performance in the application of mobility control technologies for aquifer remediation [14,26,27,28,29].
Although initial studies on the fluid viscosity-modifying technique have demonstrated its potential to improve the subsurface distribution of co-injected remedial fluids within a heterogeneous aquifer [28,29,30,31,32,33,34,35], the effect of the driving force during injection has been shown to cause contamination plumes to migrate, increasing the difficulty of in situ remediation [2,3,36,37,38]. Therefore, a good understanding of the effects of injection conditions on PCE removal and migration, particularly when the viscous polymer is co-injected with the remedial agent, is essential for designing an optimal injection scheme that can improve the efficiency of ISCO remediation without aggravating contamination plume migration.
In the present study, xanthan gum was employed as a representative polymer to investigate its impact on the permanganate-induced oxidation of PCE under various transport mechanisms in a two-dimensional sand tank. This tank contained both transmissive and less permeable zones, which were spiked with dissolved-phase PCE. Flooding experiments were conducted, with the removal efficiency of PCE identified as a key parameter for evaluation. A numerical model was developed to predict the flow paths of viscous fluids across different porous media layers. This model was further utilized to assess the effects of the convection–dispersion processes of different remedial fluids within the porous media, as well as to examine the role of xanthan addition in enhancing the efficiency of PCE removal. Furthermore, this study explored the influence of system variables on the remediation of PCE-contaminated low-permeability zones (LPZs) while comprehensively evaluating the overall remedial effectiveness under varying injection conditions. The findings of this study offer valuable insights for the design of optimized field injection schemes aimed at improving the efficiency of in situ chemical oxidation (ISCO) remediation.
2. Materials and Methods
2.1. Materials
The synergistic delivery reagent xanthan (Aladdin Biochemical Technology Co., Ltd., Shanghai, China) was used to modify the viscosity of the remedial fluid. The method for preparing the xanthan solution followed that of Xu et al. [39]. The mixture of potassium permanganate (Beijing Chemical Works, Beijing, China) and xanthan was prepared in a volume ratio of 1:1. Potassium permanganate solution at a concentration of 0.5 g/L was mixed with various concentrations of xanthan solutions (0, 0.2, 0.4, and 0.8 g/L), and the mixtures were expressed as X-KM (0), X-KM (0.2), X-KM (0.4), and X-KM (0.8), respectively.
The sand was immersed in a dissolved PCE solution (48.9 mg/L, Shanghai Macklin Biochemical Co., Ltd., Shanghai, China), with Naphthol green B dye (Macklin, China) added to the solution for visual identification of the contaminated sand [36]. The sand was then allowed to fully adsorb PCE before being removed and drained. The PCE concentration in the contaminated sand samples was determined by placing a known amount (about 1–2 g) of the contaminated sand into a 20 mL headspace sample bottle for PCE content analysis, which was conducted using headspace gas chromatography–mass spectrometry.
2.2. Experimental Methods
2.2.1. Transport Testing in a Single-Permeability System
The experimental apparatus was a rectangular tank made of Plexiglas with internal dimensions of 500 mm × 200 mm × 34 mm (Figure A1). The contaminated strip media system (single-permeability system) was simulated, and the arrangement of the structure is shown in Figure 1. The contaminated area was filled with PCE-contaminated sand, while the sand in the clean area remained uncontaminated. After filling the two-dimensional tank, five random sand samples were taken from the contaminated area to measure the PCE concentration in each. The average value was used as the initial PCE concentration in the contaminant source. The hydraulic heads at the inlet and outlet were kept constant, measured as 28 cm (H1) and 5.5 cm (H2), respectively (for details of the test setup, see Xu et al. [39]). The time was marked as 0 s when the fluid was first observed entering the 2-D tank in the video. The camera was fixed on a tripod and placed directly below the 2-D tank. The movement of the fluid in the tank was recorded throughout the experiment for subsequent image analysis. Three grades of quartz sand (10/20 mesh, 20/40 mesh, and 40/60 mesh, with porosities of 0.324, 0.367, and 0.393, respectively) were used as the experimental porous media, designated as sand C (coarse), sand M (medium), and sand F (fine). The injected mixture was X-KM (0.4).
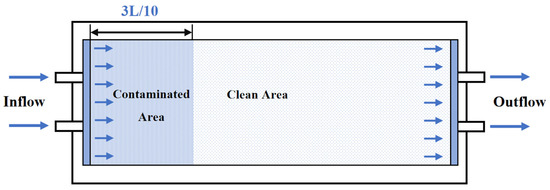
Figure 1.
Schematic diagram of the PCE removal test in a single-permeability system.
The injection of the remedial fluid was performed as follows: The time required for the fluid to drive half of the length L in the higher-permeability media (PM1) was recorded as t1/2. Samples were collected along the contaminated area to quantify the residual PCE concentration. Subsequently, an injection experiment was performed in a strip media system consisting of lower-permeability media (PM2), with the fluid injection time controlled to t1/2. The progression of the fluid front was recorded. After the flushing experiment, samples were taken in the contaminated area to determine the residual PCE content. Meanwhile, sand samples were collected from the clean area based on the distribution of the blue zone (PCE plume) to measure the PCE content and assess its migration. The concentration distribution of PCE was mapped, and the overall removal efficiency was calculated using Origin 9.2.
2.2.2. Transport Testing in a Dual-Permeability System
The experimental apparatus was a rectangular tank made of Plexiglas with internal dimensions of 500 mm × 360 mm × 34 mm (Figure A1). A contaminated strip media system, representing a dual-permeability system, was simulated, with the arrangement of the structure shown in Figure 2. The experimental procedures followed those used for the single-permeability system. During the experiment, the movement of the remedial fluid front in each media layer was recorded. Once the fluid had advanced to half the length L in the higher-permeability media (PM1), the PCE concentrations in both media layers were measured.
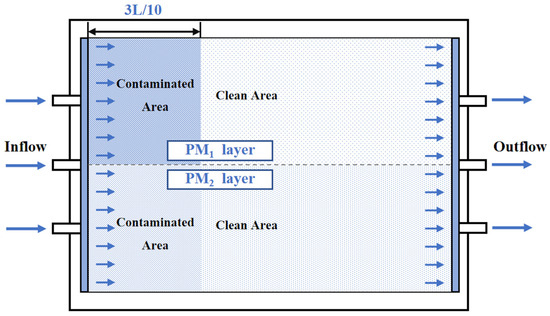
Figure 2.
Schematic diagram of the PCE removal test in a dual-permeability system.
2.2.3. PCE Removal and Migration Testing
As presented in Figure 3, PCE-contaminated sand was hand-packed in the lower-permeability media area (PM2 zone) of the tank system to simulate the contamination plume. During the tests, remedial fluid was injected through a peristaltic pump, and a digital camera (DSC-RX100M7) was used to capture the migration of the contamination plume at each injection stage (0.05 pore volume, PV). The total injection amount was 0.5 PV. After the injection, the PCE concentrations in the contaminated area and the surrounding clean area were measured. Details of the PCE removal tests are presented in Table 1. The experimental apparatus was the same as that described in Section 2.2.2.
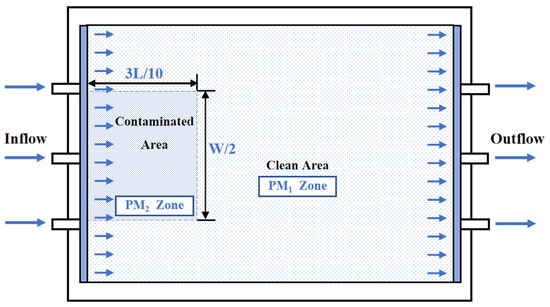
Figure 3.
Schematic diagram of the PCE removal test in the lower-permeability area.

Table 1.
Experimental settings for the PCE removal tests.
2.3. Numerical Methods
2.3.1. Hydraulic Conductivity Variation
The effect of the convection–dispersion of different remedial fluids in porous media, as well as the effect of the addition of xanthan to the remedial fluid on the removal of PCE, was evaluated through numerical simulation. The convection–dispersion equation for two-dimensional solute transport can be expressed as follows:
where C is the solute concentration; Rd is the retardation factor; and k is the rate constant of the chemical reaction. Ux and Uy are the actual average flow velocity components; Dxx, Dxy, Dyx, and Dyy are the components of the hydrodynamic dispersion coefficient.
The initial condition is expressed as follows:
where C0 is the initial concentration of PCE in the contaminated area, and it is set that C0 = 1.
The injection end of the remedial solution is considered the first type of boundary, , expressed as follows:
The boundary at the exit end is the second type of boundary, , where the dispersion flux is zero, which is expressed as follows:
where nx and ny are the components of the unit external normal vector in the x- and y-directions of this boundary, respectively.
The boundaries on both sides are set as boundaries where the solute flux is zero (the third type of boundary ), expressed as follows:
The convection–dispersion equations (Equation (1)) and the boundary conditions (Equations (2)–(5)) together constitute the mathematical model for PCE migration. The PCE concentration at each node at different time points was obtained using the finite element method. Since the Fortran software (Fortran Power Station 4.0) cannot directly simulate the chemical reaction between the remedial agent and the target contaminant, the degradation of PCE by potassium permanganate is represented as PCE attenuation. This is achieved by calculating the driving distance of the remedial fluid, combined with the chemical reaction rate constant, k, between X-KM (0), X-KM (0.4), and PCE (the values of k are 0.021 min−1 and 0.018 min−1, respectively) [40].
For the injection of the X-KM (0) solution, the flow velocity components Ux and Uy at each point can be obtained using Darcy’s law. For the injection of the viscous fluid X-KM (0.4), since the inlet and outlet ends of the sand tank are fixed hydraulic head boundaries, the equivalent hydraulic conductivity of the viscous fluid in the porous media layer changes continuously with the injection time t, meaning that the flow velocity at each point is time-dependent. The relationship between Uy and t is derived (Equation (6)) based on Equations (14) and (15), proposed by Xu et al. [39]. As the effect of transverse flow movement is not considered, the transverse flow velocity, Ux, is set to 0. The results are shown in Table 2, and the dispersivity of the viscous fluid in different porous media layers is presented in Table 3.
where Uy is the component of the actual average flow velocity in the y-direction, Kw and KP are the hydraulic conductivities of DI water and the xanthan–KMnO4 solution in porous media, respectively; ne is the effective porosity of the porous media; ΔH is the hydraulic head difference between the inlet and outlet of the sand tank; L is the length of the porous media layer, and t is the fluid driving time.
Table 2.
Actual average flow velocity of the fluid in the porous media layer at each time point (M-F sand).
Table 3.
Degree of fluid dispersion in different porous media layers.
2.3.2. Transverse Flow Movement
The mathematical model for simulating the driving of remedial fluid in the presence of transverse flow is also derived from the convection–dispersion equations (Equation (1)) and the boundary conditions (Equations (4), (5), (7) and (8)).
The initial condition is expressed as follows:
The injection end of the remedial solution is the first type of boundary, , expressed as follows:
where C0 is the concentration of the injected remedial agent.
The transverse flow rate, Ux, of the fluid is inconsistent at each point along the layer, which is determined by the transverse pressure difference between two layers during the flow process. And due to the existence of fluid cross-flow between the strip media layers, the data for Ux and Uy at each time point are difficult to obtain theoretically. The flow field analysis software Flow C [41] and Fortran program were used to conduct an interactive simulation: (1) Based on the initial flow field, the Fortran program calculates the distribution of fluid at a certain time point (the research domain consists of 72 × 100 grid cells, with each cell having a spatial step of 0.5 cm × 0.5 cm). (2) According to fluid distribution, the hydraulic conductivity of the fluid in each grid cell is determined. (3) By inputting the corresponding hydraulic conductivity of the fluid into Flow C as an operating parameter, the actual average flow velocity (Ux, Uy) at that time point is obtained. (4) The values of Ux and Uy are then put into the Fortran program as boundary conditions to simulate the fluid distribution at the next time point (∆t = 40 s). These steps are repeated until the end of the simulation.
2.4. The TOPSIS Method for Group Decision-Making
TOPSIS (Technique for Order Preference by Similarity to an Ideal Solution) is a method for multi-objective decision analysis. By calculating the relative proximity (Euclidean distance) to an ideal solution, a comprehensive evaluation of each evaluated object is made [42]. As there are several parameters that can contribute to the removal of PCE as well as the migration of the PCE contamination plume, the TOPSIS method was applied here to derive an optimal remedial scheme.
The calculation steps of the TOPSIS method are as follows:
First is the normalization of the decision matrix. This is performed with the following conversion formula:
where Xij is the value of the ith alternative on the jth indicator, and Zij is the normalized Xij.
Determine both the positive and negative ideal solutions according to the formula below:
- Positive ideal solution:
- Negative ideal solution:
Calculate the Euclidean distances between the alternative and the positive or negative ideal solutions, as follows:
If the weight of each indicator is considered, the formula should be modified as follows:
where wj is the weight coefficient of the jth indicator.
The closeness of each alternative to the ideal solution (Ci) is defined as follows:
Finally, according to the corresponding Ci value of each alternative solution, the larger the value is, the better the overall performance of the solution will be.
Based on the relative importance of each indicator in achieving the objective of in situ remediation, weight coefficients are assigned accordingly. First, the score is calculated according to the criteria shown in Table 4 (the respondents to the questionnaire are professors and postgraduate students engaged in related majors), and the weight coefficient, wj, of each indicator is then determined according to Equation (17).
where Xij is the score provided by the ith respondent on the jth indicator, and the number of respondents is n.
Table 4.
Evaluation criteria for the importance of each indicator in ISCO remediation.
3. Results
3.1. The Contribution of Hydraulic Conductivity Variation to PCE Removal
Under varying injection conditions (X-KM (0) vs. X-KM (0.4)), the concentration distribution of PCE in the contaminated area of the lower-permeability layer (refer to Figure 1 for the configuration) is shown in Figure 4. The initial PCE concentration is normalized to 1. The injection time corresponds to the duration required for the fluid to displace half of the length L within the higher-permeability layer (see Xu et al. [39] for additional details). As illustrated in Figure 4c,d, when a viscous mixture is injected, the concentration of PCE within the porous media layer (sand F) exhibits a marked reduction compared to the X-KM (0) injection (Figure 4a,b), as evidenced by the expansion of the blue region.
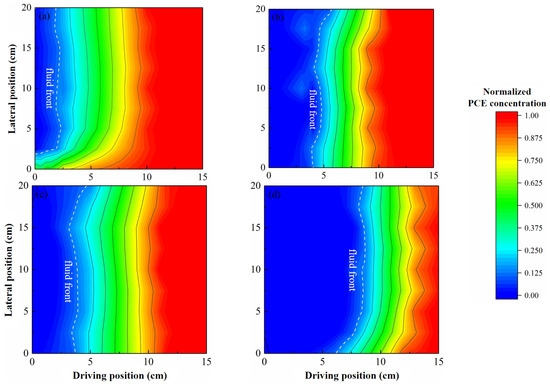
Figure 4.
PCE removal in the lower-permeability porous media layer under no cross-flow conditions: (a) configuration C-F with X-KM (0) injection; (b) configuration M-F with X-KM (0) injection; (c) configuration C-F with X-KM (0.4) injection; (d) configuration M-F with X-KM (0.4) injection.
For configuration C-F with the X-KM (0) injection, the PCE removal rate in the contaminated area of sand F (the lower-permeability layer) was approximately 37.4% (Figure 4a). Upon injection of the viscous mixture X-KM (0.4), the removal rate increased to 48.1% (Figure 4c). A similar trend was observed in configuration M-F, where the addition of xanthan gum led to an increase in the PCE removal rate in sand F from 47.0% to 68.7%.
Figure 5 illustrates the simulation of PCE removal in the porous media layers under no cross-flow conditions. Compared to the X-KM (0) solution injection (Figure 5a), the X-KM (0.4) injection, which incorporates the hydraulic conductivity adjustment mechanism, exhibited a more pronounced precursor front in the removal of PCE from the lower-permeability layer (sand F) (Figure 5b). A notable reduction in the distance between the complete PCE removal fronts in the higher- and lower-permeability layers was observed (i.e., ∆D′PCE0 < ∆DPCE0). These results suggest that the addition of xanthan gum mitigated the preferential flow effect of the remedial agent, enhancing the removal of PCE in heterogeneous layers.
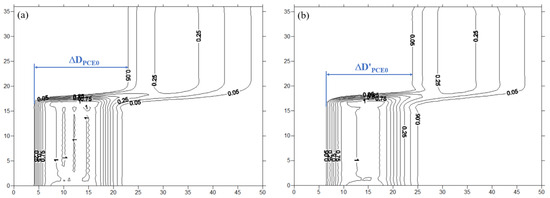
Figure 5.
Simulation of PCE removal in porous media layers under no cross-flow conditions (configuration M-F): (a) X-KM (0) injection; (b) X-KM (0.4) injection.
3.2. The Contribution of Transverse Flow Movement to PCE Removal
The results of the numerical simulation are presented in Figure 6, which illustrates the behavior of the remedial fluid in the dual-permeability system under conditions of transverse flow movement. When the remedial fluid was driven to the halfway point of the higher-permeability layer, it was observed that the X-KM (0) solution propagated independently through the two porous media layers (Figure 6a,c). In contrast, during the injection of the X-KM (0.4) fluid, a distinct transverse flow movement from the higher-permeability layer to the lower-permeability layer was evident (Figure 6b,d). Experimental data revealed that the co-injection of xanthan gum enhanced the sweeping efficiency of the remedial fluid in the lower-permeability layer (sand F), increasing it from 10.8% to 19.6%. The numerical simulation results are in good agreement with the experimental observations, further indicating that the transverse flow movement plays a significant role in improving the sweeping efficiency of the remedial fluid in the lower-permeability layer.
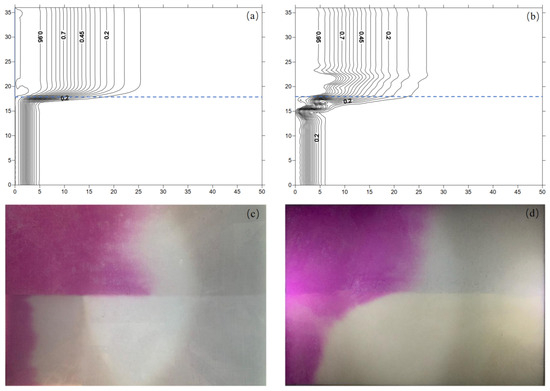
Figure 6.
The driving situation for the remedial fluid in a dual-permeability system (configuration M-F): (a) simulated injection of X-KM (0); (b) simulated injection of X-KM (0.4); (c) experimental injection of X-KM (0); (d) experimental injection of X-KM (0.4).
During the X-KM (0.4) injection, under conditions of transverse flow movement, the distribution of PCE in the contaminated area of the lower-permeability layer is illustrated in Figure 7, where the remedial fluid was driven halfway through the higher-permeability layer. The configuration is referenced in Figure 2. Compared to the PCE removal observed in Figure 4c,d, the removal rate in the contaminated area of the lower-permeability layer was significantly enhanced due to the influence of transverse flow movement. Specifically, for the C-F combination, the removal rate increased from 48.1% to 52.1%, while for the M-F combination, it increased from 68.7% to 76.8%. The transverse flow movement facilitated the migration of the remedial fluid from the higher-permeability layer into the adjacent fine sand, thereby improving the overall remediation efficiency. Furthermore, it is evident that the M-F sand combination, characterized by a lower permeability contrast (Figure 7b), exhibited a more pronounced transverse flow effect compared to the C-F combination (Figure 7a), as indicated by the transverse displacement of the blue advanced front. These observations are consistent with the findings of Xu et al. [39].
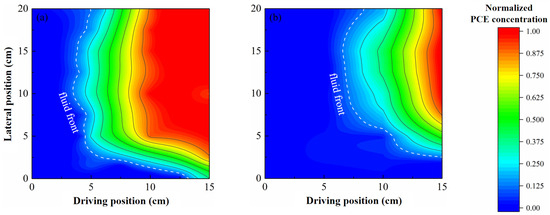
Figure 7.
PCE removal in the lower-permeability layer of the dual-permeability system: (a) configuration C-F with X-KM (0.4) injection; (b) configuration M-F with X-KM (0.4) injection.
3.3. The Effects of System Variables on the Remediation of PCE-Contaminated LPZs
3.3.1. Xanthan Gum Concentration
As illustrated in Figure 8a, the addition of xanthan enhanced the displacement of remedial fluid within the lower-permeability layer. When equal volumes of remedial fluid were injected, the overall driving distance of the viscous mixture was greater than that of the X-KM (0) solution, with the driving distance gap between the two increasing progressively throughout the injection process. Additionally, the driving efficiency of the remedial fluid in the lower-permeability layer exhibited a positive correlation with xanthan gum concentration. For instance, when the injection volume was 0.5 PV, the driving distance of the viscous mixture increased by 1.6 cm, 3.8 cm, and 5.2 cm, respectively, after the addition of xanthan gum at concentrations of 0.2 g/L, 0.4 g/L, and 0.8 g/L, compared to the X-KM (0) injection. This effect can be attributed to the increased resistance to fluid flow in the higher-permeability layer induced by the addition of xanthan, which facilitated a greater volume of fluid flow into the adjacent lower-permeability layer.
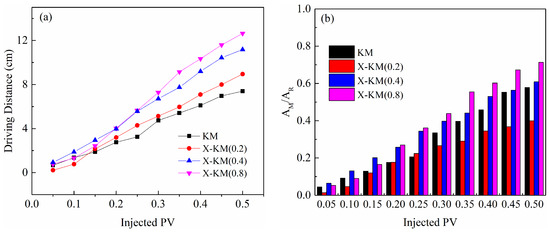
Figure 8.
The effect of fluid viscosity on remediation performance: (a) driving distance of fluid in the LPZ; (b) PCE removal and migration.
In site-specific remediation, the primary factors influencing the overall remediation effectiveness are not only the contact efficiency between the remedial fluid and the contamination plume but also the driving effect of fluid injection on the migration of the contamination plume, which may complicate in situ remediation efforts. To assess the remediation impact of fluid injection on both the removal and migration of the contamination plume, a measurement factor (AM/AR) was introduced. In this context, AM represents the mixing area between the remedial fluid and the contamination plume, while AR denotes the area occupied by residual PCE, which includes both the area not swept by the remedial fluid and the area into which PCE has migrated. A higher AM/AR value signifies better remediation performance, indicating that the remedial fluid achieves maximum sweeping efficiency with minimal contaminant migration.
Compared to the X-KM (0) injection, the injection of the viscous mixture inevitably exacerbated PCE migration, particularly when a low concentration of xanthan gum (0.2 g/L) was added. However, it is important to note that the co-injection of xanthan also enhanced the fluid sweeping efficiency within the contamination plume. It was observed that the addition of a low concentration of xanthan (0.2 g/L) was insufficient to improve PCE remediation, as evidenced by a decrease in the AM/AR value. In contrast, with increasing xanthan concentrations (0.4 g/L and 0.8 g/L), after injecting 0.5 PV of remedial fluid, the AM/AR value increased from 0.58 (X-KM (0) injection) to 0.61 (X-KM (0.4) injection), and it further increased to 0.71 under the X-KM (0.8) injection (Figure 8b). These results indicate an improvement in the contact between the remedial fluid and the contamination while also mitigating further migration of the contamination plume.
3.3.2. Permeability Contrast
As shown in Figure 9a, the driving distance of the viscous fluid in the LPZ exhibited significant differences across porous media combinations with varying permeability contrasts. Among these, the M-F combination demonstrated the most effective driving, with the difference in driving distances between the three porous media combinations increasing notably with continued injection. After injecting 0.5 PV of fluid, the driving distance of the remedial fluid in the LPZ of the M-F combination reached 11.2 cm, which was substantially greater than that observed in the C-M combination (5.0 cm) and C-F combination (8.5 cm). According to previous studies, the hydraulic conductivities of the viscous mixture X-KM (0.4) in sand C, sand M, and sand F were 108, 16.8, and 3.4 m/day, respectively [39]. Accordingly, the permeability contrasts of the viscous fluid in these three combinations were 4.9 (M-F combination), 6.4 (C-M combination), and 31.8 (C-F combination), respectively. It is hypothesized that a smaller permeability contrast between the two media facilitates a greater volume of remedial fluid flowing into the LPZ, thereby enhancing the driving effect of the remedial fluid in that region.
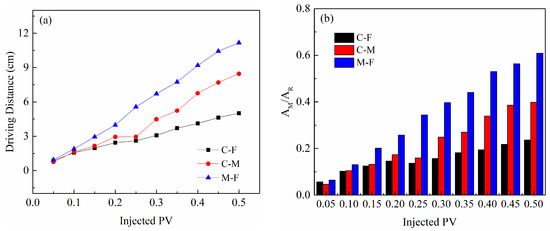
Figure 9.
The effect of permeability contrast between porous media layers on remediation performance: (a) driving distance of fluid in the LPZ; (b) PCE removal and migration.
Once the injection stabilized, the remediation performance of the three combinations followed the order M-F combination > C-M combination > C-F combination. As the injection volume increased, the difference in remediation effectiveness among these combinations became more pronounced (Figure 9b). For combinations with a lower permeability contrast, a longer driving distance of the remedial fluid in the LPZ indicated a larger mixing area (AM) between the remedial fluid and the contamination. At the same time, contamination plume migration occurred more readily in the higher-permeability regions. For the M-F and C-F combinations, PCE migrated more easily in sand C, which has higher permeability than sand M, and the area occupied by residual PCE (AR) was smaller in the M-F combination. Therefore, the M-F combination demonstrated better remediation performance. In the case of the C-M and C-F combinations, since both involved sand C as the higher-permeability medium, the migration of PCE in this region was nearly identical. Furthermore, for the lower-permeability areas in these two combinations, the sweeping efficiency of the remedial fluid in sand M was significantly higher than that in sand F (Figure 9a). Consequently, the remediation performance of the C-M combination was superior to that of the C-F combination. For instance, after injecting 0.5 PV of fluid, the AM/AR values were 0.61, 0.40, and 0.24 for the M-F, C-M, and C-F combinations, respectively. A higher AM/AR value indicates better PCE remediation performance.
3.3.3. Fluid Injection Rate
The effect of the injection rate on the driving of remedial fluid in the LPZ exhibited a fluctuating trend (Figure 10a). At an injection rate of 10 mL/min, after injecting 0.5 PV of fluid, the driving distance of the remedial fluid in the LPZ was 8.2 cm. When the injection rate increased to 25 mL/min, the driving distance increased by 3 cm. However, further increasing the injection rate did not result in a significant enhancement of the driving effect, as the driving distance only reached 10.2 cm at an injection rate of 40 mL/min.
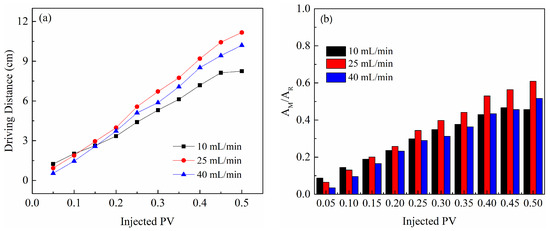
Figure 10.
The effect of the injection rate on remediation performance: (a) driving distance of fluid in the LPZ; (b) PCE removal and migration.
Once the injection stabilized (>0.15 PV), it was observed that an appropriate increase in the injection rate contributed to improved remediation performance. At an injection rate of 25 mL/min, the AM/AR value was consistently higher than that observed at an injection rate of 10 mL/min (Figure 10b). However, when the injection rate was further increased to 40 mL/min, the remediation effect showed a decreasing trend. This decline can be attributed to the relatively poor permeability of the fluid in the LPZ (sand F), where an increased injection rate did not significantly enhance the driving effect. In contrast, in higher-permeability media (sand M), the increased injection rate had a more pronounced effect on PCE migration, as the injection force more effectively mobilized contaminants in these media.
3.3.4. Comprehensive Analysis of PCE Remediation Performance
The evaluation of optimal injection conditions is complicated by the differing and non-uniform effects of each condition on the removal and migration of contaminants. To address this, TOPSIS analysis was employed to comprehensively assess the overall performance of various injection conditions (including remedial fluid viscosity, permeability contrast between different media, and injection rate) in PCE remediation within the lower-permeability layer. The remediation measurement factor (AM/AR), PCE removal rate, and sweeping uniformity factor (R) were used as the three evaluation criteria to determine the optimal remediation condition. The weight coefficients assigned to these criteria are 0.31 for R, 0.31 for AM/AR, and 0.38 for the PCE removal rate, respectively. The sweeping uniformity factor (R) quantifies the uniformity of the remedial fluid’s displacement between the higher- and lower-permeability layers; a more uniform sweeping process indicates that a greater portion of the remedial fluid reaches the lower-permeability layer. This factor can be expressed as follows:
where ΔD represents the difference in the driving distance of the remedial fluid between the two media when the fluid in the higher-permeability zone is driven to the halfway point (L/2). A value of R close to 1 indicates more uniform fluid transport between the different media layers (for a more detailed description, refer to Xu et al. [39]).
The results of the TOPSIS analysis are presented in Table 5. The value of C represents the overall PCE remediation performance for each condition. Among the different porous media combinations, the M-F sand combination demonstrated the best PCE remediation performance, as indicated by C3 > C2 > C1 (Exp. 1). The M-F combination also exhibited superior sweeping uniformity, PCE removal efficiency, and inhibition of PCE migration, consistent with the finding that a smaller permeability contrast between the media results in better overall remediation.
Table 5.
Evaluation index of TOPSIS-1.
Regarding fluid viscosity, the remediation performance followed the order 0.8 g/L > 0.4 g/L > 0 g/L > 0.2 g/L, with corresponding C-values of 1.0, 0.736, 0.429, and 0.418 (Exp. 2). This suggests that a sufficient concentration of xanthan gum is necessary to outperform X-KM (0) injection in the in situ remediation process.
For the injection rate, a rate of 25 mL/min yielded the best PCE remediation performance, followed by 40 mL/min and 10 mL/min, as reflected in the order C9 > C10 > C8 (Exp. 3). Increasing the injection rate enhances the penetration of remedial fluid into the LPZ, improving contaminant removal efficiency. However, excessively high injection rates can lead to undesirable migration of the contamination plume, reducing overall remediation effectiveness, as evidenced by the relatively smaller C-value (0.576) for the 40 mL/min injection rate.
The results above demonstrate that higher xanthan gum concentrations lead to better remediation performance. However, in actual site remediation, the high viscosity of the remedial fluid can complicate injection processes, particularly in aquifers with low permeability. The increased injection pressure due to high viscosity can also disturb the structure of strata. Therefore, considering operational constraints as well as the environmental and economic benefits of site remediation, injection pressure was introduced as an additional evaluation index for optimization. To ensure its compatibility with the TOPSIS calculation method, the inverse method was applied to adjust the values accordingly.
The weight coefficients for the four indices are 0.24 (R), 0.25 (AM/AR), 0.31 (PCE removal rate), and 0.20 (injection pressure), respectively. The results, presented in Table 6, indicate that the ranking of remediation performance for each porous media combination remained unchanged after incorporating injection pressure, with the order as follows: M-F combination > C-M combination > C-F combination. However, the ranking of xanthan gum concentration in terms of remediation performance shifted to 0.4 g/L > 0.8 g/L > 0 g/L > 0.2 g/L, with corresponding C-values of 0.647, 0.641, 0.532, and 0.522, respectively. Additionally, when injection pressure was included as an index, the fluid injection rate ranking changed to 25 mL/min > 10 mL/min > 40 mL/min. Therefore, the optimal injection conditions were identified as the M-F sand combination, xanthan gum concentration of 0.4 g/L, and an injection rate of 25 mL/min.
Table 6.
Evaluation index of TOPSIS-2 (considering injection pressure).
4. Conclusions
Flooding experiments demonstrated that the addition of xanthan gum significantly improved the PCE removal rate in LPZs through mechanisms involving changes in hydraulic conductivity and transverse flow dynamics. In the C-F configuration, the injection of the viscous mixture X-KM (0.4) increased the PCE removal rate in the LPZ (sand F) from 37.4% (with X-KM (0) injection) to 48.1%, due to changes in hydraulic conductivity, and further to 52.1% with the induction of transverse flow. Similarly, in the M-F configuration, the PCE removal rate exhibited a similar trend under the influence of both mechanisms. The results of the numerical simulations were in high agreement with the experimental data.
It was observed that the driving force generated during viscous fluid injection facilitated the migration of the contamination plume. The remediation effect on the contaminant plume showed a significant correlation with the xanthan concentration, the permeability contrast between media layers, and the injection rate of the remedial solution. A nonlinear relationship was observed between xanthan concentration and remediation performance. Within the investigated range (0 g/L–0.8 g/L), adding a low concentration of xanthan gum (0.2 g/L) proved ineffective in enhancing PCE remediation within the M-F configuration, primarily attributable to its role in facilitating the migration of the contamination plume. However, a concentration of 0.8 g/L significantly enhanced PCE removal while minimizing plume migration. Remediation performance was also better with lower permeability contrasts, as shown by the higher AM/AR values in the C-F (0.24), C-M (0.40), and M-F (0.61) combinations. Increasing the injection rate did not consistently enhance the driving effect of the remedial fluid within the LPZs but may have facilitated the migration of the contamination plume. Within the tested range of 10 mL/min to 40 mL/min, a moderate injection rate of 25 mL/min yielded the optimal remediation performance.
Considering site operational constraints, potential in situ structural disturbance, and economic considerations, a comprehensive evaluation of PCE remediation performance was conducted based on four key indicators: the remediation measurement factor (AM/AR), PCE removal rate, sweeping uniformity factor (R), and injection pressure. The results indicated that the M-F combination (with the lowest permeability contrast of 4.9), the 0.4 g/L xanthan gum concentration, and a moderate injection rate of 25 mL/min represented the most effective remediation conditions. These findings offer a robust foundation for the development of tailored remediation strategies for contaminated sites.
Author Contributions
Conceptualization, J.C.; methodology, Q.X.; software, Q.X.; validation, J.C.; formal analysis, Q.X.; investigation, Q.X.; resources, J.C., X.W. and Z.J.; data curation, Q.X.; writing—original draft preparation, Q.X.; writing—review and editing, Q.X., Y.X. and H.Z.; visualization, Q.X.; supervision, J.C.; project administration, J.C. and Q.X.; funding acquisition, J.C. All authors have read and agreed to the published version of the manuscript.
Funding
This research was funded by the National Natural Science Foundation of China, grant number 4157020343.
Data Availability Statement
Data is contained within the article.
Conflicts of Interest
Author Zhuofei Jia was employed by the company SG Environment Technology Co., Ltd. The remaining authors declare that the research was conducted in the absence of any commercial or financial relationships that could be construed as a potential conflict of interest.
Appendix A. Structure Diagram of the 2-D Plexiglass Tank
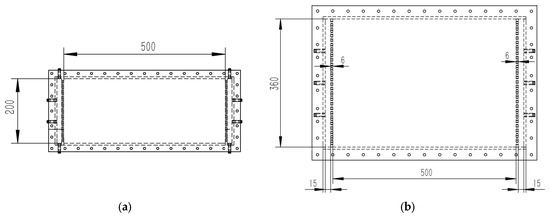
Figure A1.
Structure diagram of the 2-D plexiglass tank: (a) single-permeability system; (b) dual-permeability system.
References
- Soltanian, M.R.; Ritzi, R.W. A new method for analysis of variance of the hydraulic and reactive attributes of aquifers as linked to hierarchical and multiscaled sedimentary architecture. Water Resour. Res. 2014, 50, 9766–9776. [Google Scholar] [CrossRef]
- Siegrist, R.L.; Crimi, M.; Simpkin, T.J. In Situ Chemical Oxidation for Groundwater Remediation; Springer: New York, NY, USA, 2011. [Google Scholar]
- Song, X.R.; Chen, J.J.; Xu, Q.; Wang, Y. Mechanisms that influence the interactions between remediation agent injection and contamination plume variation. J. Contam. Hydrol. 2020, 231, 103631. [Google Scholar] [CrossRef]
- Darwish, M.; McCray, J.E.; Currie, P.K.; Zitha, P.L.J. Polymer-Enhanced DNAPL Flushing from Low-Permeability Media: An Experimental Study. Groundw. Monit. Remediat. 2010, 23, 92–101. [Google Scholar] [CrossRef]
- Chapman, S.W.; Parker, B.L. Plume persistence due to aquitard back diffusion following dense nonaqueous phase liquid source removal or isolation. Water Resour. Res. 2005, 41, 2179–2187. [Google Scholar] [CrossRef]
- Honning, J.; Broholm, M.M.; Bjerg, P.L. Role of diffusion in chemical oxidation of PCE in a dual permeability system. Environ. Sci. Technol. 2007, 41, 8426–8432. [Google Scholar] [CrossRef]
- Reynolds, D.A.; Kueper, B.H. Numerical examination of the factors controlling DNAPL migration through a single fracture. Ground Water 2002, 40, 368–377. [Google Scholar] [CrossRef]
- Sleep, B.E.; Seepersad, D.J.; Mo, K.; Heidorn, C.M.; Hrapovic, L.; Morrill, P.L.; McMaster, M.L.; Hood, E.D.; LeBron, C.; Lollar, B.S.; et al. Biological enhancement of tetrachloroethene dissolution and associated microbial community changes. Environ. Sci. Technol. 2006, 40, 3623–3633. [Google Scholar] [CrossRef]
- Saenton, S.; Illangasekare, T.H.; Soga, K.; Saba, T.A. Effects of source zone heterogeneity on surfactant-enhanced NAPL dissolution and resulting remediation end-points. J. Contam. Hydrol. 2002, 59, 27–44. [Google Scholar] [CrossRef]
- Struse, A.M.; Siegrist, R.L.; Dawson, H.E.; Urynowicz, M.A. Diffusive Transport of Permanganate during In Situ Oxidation. J. Environ. Eng. 2002, 128, 327–334. [Google Scholar] [CrossRef]
- Krembs, F.J.; Siegrist, R.L.; Crimi, M.L.; Furrer, R.F.; Petri, B.G. ISCO for Groundwater Remediation: Analysis of Field Applications and Performance. J. Groundw. Monit. Remediat. 2010, 30, 42–53. [Google Scholar] [CrossRef]
- Kueper, B.H.; Stroo, H.F.; Vogel, C.M.; Ward, C.H. Chlorinated Solvent Source Zone Remediation; Springer Science & Business Media: New York, NY, USA, 2014. [Google Scholar] [CrossRef]
- Mcguire, T.M.; Mcdade, J.M.; Newell, C.J. Performance of DNAPL Source Depletion Technologies at 59 Chlorinated Solvent-Impacted Sites. Groundw. Monit. Remediat. 2006, 26, 73–84. [Google Scholar] [CrossRef]
- Zhong, L.; Oostrom, M.; Truex, M.J.; Vermeul, V.R.; Szecsody, J.E. Rheological behavior of xanthan gum solution related to shear thinning fluid delivery for subsurface remediation. J. Hazard. Mater. 2013, 244, 160–170. [Google Scholar] [CrossRef] [PubMed]
- West, M.R.; Kueper, B.H. Numerical simulation of DNAPL source zone remediation with in situ chemical oxidation (ISCO). Adv. Water Resour. 2012, 44, 126–139. [Google Scholar] [CrossRef]
- Jackson, R.E.; Dwarakanath, V.; Meinardus, H.W.; Young, C.M. Mobility control: How injected surfactants and biostimulants may be forced into low-permeability units. Remediation 2003, 13, 59–66. [Google Scholar] [CrossRef]
- Lian, J.; Fu, Y.; Guo, C.; He, Y.; Qin, C. Performance of polymer-enhanced KMnO4 delivery for remediation of TCE contaminated heterogeneous aquifer: A bench-scale visualization. J. Contam. Hydrol. 2019, 225, 103507.1–103507.11. [Google Scholar] [CrossRef]
- Martel, R.; Hebert, A.; Lefebvre, R.; Gelinas, P.; Gabriel, U. Displacement and sweep efficiencies in a DNAPL recovery test using micellar and polymer solutions injected in a five-spot pattern. J. Contam. Hydrol. 2004, 75, 1–29. [Google Scholar] [CrossRef]
- Martel, R.; Portois, C.; Robert, T.; Uyeda, M. Etched glass micromodel for laboratory simulation of NAPL recovery mechanisms by surfactant solutions in fractured rock. J. Contam. Hydrol. 2019, 227, 103550. [Google Scholar] [CrossRef]
- Silva, J.A.K.; Liberatore, M.; McCray, J.E. Characterization of Bulk Fluid and Transport Properties for Simulating Polymer-Improved Aquifer Remediation. J. Environ. Eng. 2013, 139, 149–159. [Google Scholar] [CrossRef]
- Sorbie, K.S. Polymer-Improved Oil Recovery; CRC Press: Boca Raton, FL, USA, 1991. [Google Scholar] [CrossRef]
- El-hoshoudy, A.N.; Desouky, S.E.M.; Al-sabagh, A.M.; Betiha, M.A.; Elkady, M.Y.; Mahmoud, S.A. Evaluation of solution and rheological properties for hydrophobically associated polyacrylamide co-polymer as a promised enhanced oil recovery candidate. Egypt. J. Pet. 2017, 26, 779–785. [Google Scholar] [CrossRef]
- Sarsenbekuly, B.; Kang, W.; Yang, H.; Zhao, B.; Aidarova, S.; Yu, B.; Issakhov, M. Evaluation of rheological properties of a novel thermo-viscosifying functional polymer for enhanced oil recovery. Colloid Surf. A 2017, 532, 405–410. [Google Scholar] [CrossRef]
- Wang, Y.; Lu, Z.Y.; Han, Y.G.; Feng, Y.J.; Tang, C.L. A Novel Thermoviscosifying Water-Soluble Polymer for Enhancing Oil Recovery from High-Temperature and High-Salinity Oil Reservoirs. Adv. Mater. Res. 2011, 306–307, 654–657. [Google Scholar] [CrossRef]
- Zhong, C.; Luo, P.; Ye, Z.; Chen, H. Characterization and Solution Properties of a Novel Water-soluble Terpolymer For Enhanced Oil Recovery. Polym. Bull. 2009, 62, 79–89. [Google Scholar] [CrossRef]
- Xin, J.; Han, J.; Zheng, X.; Shao, H.; Kolditz, O. Mechanism insights into enhanced trichloroethylene removal using xanthan gum-modified microscale zero-valent iron particles. J. Environ. Manag. 2015, 150, 420–426. [Google Scholar] [CrossRef]
- Xin, J.; Tang, F.; Zheng, X.; Shao, H.; Kolditz, O. Transport and retention of xanthan gum-stabilized microscale zero-valent iron particles in saturated porous media. Water Res. 2016, 88, 199–206. [Google Scholar] [CrossRef]
- Zhong, L.; Oostrom, M.; Wietsma, T.W.; Covert, M.A. Enhanced remedial amendment delivery through fluid viscosity modifications: Experiments and numerical simulations. J. Contam. Hydrol. 2008, 101, 29–41. [Google Scholar] [CrossRef]
- Zhong, L.; Szeesody, J.; Oostrom, M.; Truex, M.; Shen, X.; Li, X. Enhanced remedial amendment delivery to subsurface using shear thinning fluid and aqueous foam. J. Hazard. Mater. 2011, 191, 249–257. [Google Scholar] [CrossRef]
- Childs, J.; Acosta, E.; Annable, M.D.; Brooks, M.C.; Enfield, C.G.; Harwell, J.H.; Hasegawa, M.; Knox, R.C.; Rao, P.S.C.; Sabatini, D.A.; et al. Field demonstration of surfactant-enhanced solubilization of DNAPL at Dover Air Force Base, Delaware. J. Contam. Hydrol. 2006, 82, 1–22. [Google Scholar] [CrossRef]
- Chokejaroenrat, C.; Kananizadeh, N.; Sakulthaew, C.; Comfort, S.; Li, Y. Improving the sweeping efficiency of permanganate into low permeable zones to treat TCE: Experimental results and model development. Environ. Sci. Technol. 2013, 47, 13031–13038. [Google Scholar] [CrossRef]
- Dugan, P.J.; Siegrist, R.L.; Crimi, M.L. Coupling Surfactants/Cosolvents With Oxidants for Enhanced DNAPL Removal: A Review. Remediation 2010, 20, 27–49. [Google Scholar] [CrossRef]
- Martel, K.E.; Martel, R.; Lefebvre, R.; Gelinas, P.J. Laboratory Study of Polymer Solutions Used for Mobility Control During In Situ NAPL Recovery. Groundw. Monit. Remediat. 1998, 18, 103–113. [Google Scholar] [CrossRef]
- McCray, J.E.; Munakata-Marr, J.; Silva, J.A.K.; Davenport, S.; Smith, M.M. Multi-Scale Experiments to Evaluate Mobility Control Methods for Enhancing the Sweep Efficiency of Injected Subsurface; Project. No. ER-1486; Department of Defense Strategic Environmental Research and Development Program (SERDP): Alexandria, VA, USA, 2010. [Google Scholar]
- Robert, T.; Martel, R.; Conrad, S.H.; Lefebvre, R.; Gabriel, U. Visualization of TCE recovery mechanisms using surfactant-polymer solutions in a two-dimensional heterogeneous sand model. J. Contam. Hydrol. 2006, 86, 3–31. [Google Scholar] [CrossRef] [PubMed]
- Du, Z.; Chen, J.; Ke, S.; Xu, Q.; Wang, Z. Experimental investigations on spreading and displacement of fluid plumes around an injection well in a contaminated aquifer. J. Hydrol. 2023, 617, 129062. [Google Scholar] [CrossRef]
- Du, Z.P.; Chen, J.J.; Yao, W.Q.; Zhou, H.B.; Wang, Z.Q. The critical mixed transport process in remediation agent radial injection into contaminated aquifer plumes. J. Contam. Hydrol. 2024, 261, 104301. [Google Scholar] [CrossRef] [PubMed]
- Ziliotto, F.; Hazas, M.B.; Rolle, M.; Chiogna, G. Mixing enhancement mechanisms in aquifers affected by hydropeaking: Insights from flow-through laboratory experiments. Geophys. Res. Lett. 2021, 48, 12. [Google Scholar] [CrossRef]
- Xu, Q.; Chen, J.J.; Wang, Y.T.; Ke, S.N. Quantitative analysis of dominant mechanisms in improving fluid sweeping uniformity in a layered heterogeneous system via xanthan gum addition. Environ. Sci. Pollut. R. 2022, 29, 25759–25773. [Google Scholar] [CrossRef]
- Wang, Y.T.; Zhou, H.B.; Chen, J.J.; Xu, Q. A Quantitative Evaluation Method for Xanthan Enhanced Transport Uniformity and Factors Affecting This Process. Water 2022, 14, 2630. [Google Scholar] [CrossRef]
- Wang, H.T. Dynamics of Fluid Flow and Contaminant Transport in Porous Media; Higher Education Press: Beijing, China, 2008. [Google Scholar]
- Zhou, W.; Jiang, W. Two-phase TOPSIS of uncertain multi-attribute group decision-making. J. Syst. Eng. Electrons. 2012, 21, 423–430. [Google Scholar] [CrossRef]
Disclaimer/Publisher’s Note: The statements, opinions and data contained in all publications are solely those of the individual author(s) and contributor(s) and not of MDPI and/or the editor(s). MDPI and/or the editor(s) disclaim responsibility for any injury to people or property resulting from any ideas, methods, instructions or products referred to in the content. |
© 2025 by the authors. Licensee MDPI, Basel, Switzerland. This article is an open access article distributed under the terms and conditions of the Creative Commons Attribution (CC BY) license (https://creativecommons.org/licenses/by/4.0/).