Article

Changes in Sea Level, Storm and Wave Conditions, and Ice Cover—Over 70 Years of Observation in the Southern Baltic Sea

Institute of Meteorology and Water Management—National Research Institute, Waszyngtona 42, 81-342 Gdynia, Poland
*
Author to whom correspondence should be addressed.
Water 2025, 17(5), 680; https://doi.org/10.3390/w17050680
Submission received: 30 January 2025 / Revised: 25 February 2025 / Accepted: 25 February 2025 / Published: 26 February 2025
(This article belongs to the Special Issue Climate Risk Management, Sea Level Rise and Coastal Impacts)

Abstract

:
This study demonstrates changes in the hydrodynamic regime associated with climate change in the southern Baltic over more than 70 years. The analysis of long-term data about sea level, the occurrence of ice cover, waves, and storm surges in the southern Baltic enabled the identification of spatiotemporal variability, including the detection of changes in intensity, frequency, and repeatability of these phenomena. The sea level in the southern Baltic rose by approximately 1 cm/decade from 1886 to 1955. Then, from 1956 to 2019, intensification was observed, and the sea level rose by 1.6 cm/decade and 1.9 cm in the western and eastern parts, respectively. The most intense decadal sea level change in 1955–2019 occurred in March (3.1 cm) and January (2.5 cm), while from July to December, it was at 0.8–1.3 cm. Statistical direct correlation analyses using Spearman’s rank method showed a weak but statistically significant relationship between the mean daily sea level with water temperature and air temperature measured at the same stations. An increase in the frequency of storms in individual decades and a decrease in the number of days with ice was demonstrated. There was no clear trend in the wave conditions regime during the period covered by the analysis in 1980–2021.

1. Introduction

Contemporary climate change is evidenced by increased air temperature and atmospheric circulation changes, mainly in wind conditions and atmospheric pressure. These changes directly affect the land and significantly impact the hydrosphere, making this a global phenomenon considering the area of the world’s oceans. The main effects of changing atmospheric conditions in marine areas are rising sea levels, changes in ice cover, and an increase in the spatial extension, intensity, and frequency of extreme events such as storms and storm surges. The impact of climate change is also observed in the Baltic Sea basin. Large-scale atmospheric variability, including circulations such as the North Atlantic Oscillation (NAO) and the Atlantic Multidecadal Oscillation (AMO) [1], plays a vital role in shaping the climate of the Baltic Sea [2,3,4], not only in terms of anemometric conditions but also sea levels [5,6,7,8,9,10,11] and waves conditions [12,13,14,15]. This is crucial knowledge for a broader understanding of the hydrodynamic climate and its severity, the associated impact on the coastal zone regarding infrastructure and population, and shipping and investment in the offshore zone.
One of the indicators of climate change in the marine environment is ice cover. In the southern Baltic Sea, ice formation occurs only during severe winters and mainly in closed and semi-closed water areas. In the last decade, such events have been observed in 2010, 2011, 2012, and 2019 [16]. The observed change—the lack of ice formation and ice-free regime observed in recent years—may indicate an influence of climate change. Of key importance is the detected increase in seawater temperature, which in the southern Baltic Sea has been, on average, 0.6 °C per decade over the last 60 years [17]. Maximum annual ice extent and thickness are estimated to decrease in the future (RCP 8.5 scenario for 2021–2090). Firm ice is specific to the northern part of the Baltic Sea [18,19], while in the Gulf of Finland and the Åland Islands, it appears during harsh winters [20,21].
The most widely discussed impact of climate change on the world ocean is the rising sea level, which results mainly from melting glaciers. The sea level in the Baltic, besides the calving of glaciers, is determined by atmospheric pressure, the inflow of water from the North Sea, and the isostatic movements of the Earth and the wind, the intensity of which drives the increased transport of water masses through the Danish Straits. IPCC researchers’ estimates from 2019 indicate that the average global sea level rise by 2100 compared to the years 1986–2005 will range from 43 cm (RCP 2.6) to 84 cm (RCP 8.5), and for the period 2090–2099 compared to the period 1980–1999, the absolute increase in sea level in the Baltic Sea is predicted to be approximately 80% of the global increase [22]. Unlike the entire Baltic Sea, an apparent drop in sea level is observed due to isostatic movements in the northern part of the Baltic Sea. The elevation and inclination of part of the Earth’s crust upwards, due to changes in its load by the retreating ice sheet, result in lower sea levels relative to the terrain.
Extreme sea levels in the Baltic Sea are caused by atmospheric cyclones that sometimes interact with seiches [23,24,25,26,27,28]. Cyclones associated with onshore solid winds can cause coastal storm surges lasting from several hours to about one day [29]. Any hydrological situation during which the maximum observed sea level exceeds 570 cm, where 500 cm equals 0 cm according to the Old Amsterdam system, is considered a storm surge [30]. In such conditions, storm flooding may occur, which most often occurs on the Polish coast during winds from the northern sector [31]. The southwestern part of the Baltic Sea is particularly frequently exposed to the impact of storms [32], where a storm surge exceeding 3 m was recorded in 1871 [29]. More than 70 perilous storm surges from the period 1976–2000, reaching or exceeding the level of 600 cm along the western and central coasts of the southern Baltic Sea, were described in detail considering the development of the barometric situation and the analysis of the course of the flood in direct response to the action of storm winds as well as numerous characteristics of the flood, such as the culmination level, the speed of increase, the duration of the flood, and the daily reference level [33]. Century storm surges are higher (up to 2.4 m) at the inner edges of the basins, furthest from the Baltic Sea proper, than in the centre of the Baltic Sea (up to 1.2 m). The highest average and maximum significant wave heights are reached in autumn and winter, while summer usually has the mildest wave climate. The highest values of the maximum single wave height exceed 13 m [34], and according to some researchers, they may even exceed 20 m [35]. This significant wave height has been increasing since the 1990s in some parts of the sea [36,37], and it is assumed that the median significant wave height will increase by 15% by the end of the 21st century [38]. Ruosteenoja et al. [39] estimated that the frequency of strong westerly winds would increase while the share of eastern ones would decrease.
This study aimed to carry out a long-term analysis of sea level changes, the occurrence of ice cover and storm surges, and wave conditions in the southern Baltic, considering their intensity and frequency in the context of climate change, which impacts the Baltic Sea (e.g., [17]). The research carried out is based on a very long series of data on sea levels, including observations of storm and ice conditions supplemented with data from wave reanalysis, which allows the obtaining of information on long-term changes taking place in the waters of the southern Baltic Sea, which can constitute the basis for further scenarios prediction assuming climate changes.

2. Materials and Methods

2.1. Sea Level, Storm Surges, Filling of the Baltic Sea, Ice Cover

The study area covers the southern Baltic. Water levels were measured at water gauge stations in Świnoujście, Kołobrzeg, Ustka, Władysławowo, Hel, Gdynia, and Gdańsk (Figure 1). The measurements cover the period from 1955 to 2019. The time resolution of the measurements changed during the research period due to the development of the devices and methodology routine. Currently, measurements are carried out using equipment prod. SEBA (Germany). From 1955 to 2006, observations were made 6 times a day, followed by a telemetry system with measurements every 10 min. Water gauge station levels were recorded continuously throughout the research period without longer gaps. The data used in this study are based on average daily water levels and came from a verified, uniform Institute of Meteorology and Water Management—National Research Institute database [29,32]. The zero level of the tide gauge is related to Amsterdam 55NN, but ground elevation refers to the current reference system (in Poland, EVRF2007—from 2023, early Kronsztadt 86 and Kronsztadt 60) [30].
The analysis of storm situations is based on identified and catalogued storm events for the western coast from 1950 to 2020 and the eastern coast from 1980 to 2020. After verifying the quality of hydrological data for all the stations mentioned above, characteristics were prepared, including determining maximum, minimum, and average sea levels over many years in an annual and monthly regime.

2.2. Wave

The study area of the wave regime is the southern Baltic Sea, delineated by the EEZ Polish, with the division into sub-basins (Figure 1). Data from the Copernicus reanalysis [40] were used to analyse the wave climate in the southern Baltic Sea area from 1980 to 2021—https://data.marine.copernicus.eu/product/BALTICSEA_MULTIYEAR_WAV_003_015/description. (accessed on 16 December 2024). The product grid has a horizontal resolution of 1 nautical mile (~2 km × 2 km). The reanalysis data were quality-controlled and verified in two depth zones using data from measurements taken at two locations (Figure 1). Correlation analysis showed high values of correlation coefficients: 0.92 in the open sea zone on the Petrobaltic platform (P1) and 0.78 in the shallow water zone—Pomeranian Bay (P2). Several operations, such as file merging, calculation of area average, and point extractions of correlation calculations, were performed on the acquired dataset using CDO (Climate Data Operators) software version 2.2.0 (on Linux), https://code.mpimet.mpg.de/projects/cdo (accessed on 16 December 2024) nd the R programming language. As part of the statistical analyses, calculations were made of the average height of the significant wave and the average duration of the storm expressed in hours, where conditions of significant wave height exceeding 2.5 m, which corresponds to the fifth degree of the sea state scale according to Douglas, are considered a storm. The average values of the significant wave height and the storm’s total duration were included in the annual summary. In addition, the monthly averaged (based on data for the whole period) significant wave heights were compared with sea level data extracted from the reanalysis [41]. The averages of significant wave height calculated for each month in every year were compiled with the monthly average North Atlantic Oscillation index (NAO). A positive NAO index phase occurs when the average pressure value for the study period is greater in the Azores Gulch than the multi-year average and, at the same time, when the pressure value in the Icelandic Low is less than the multi-year average. This phase is associated with strong northeast winds that generate storms. A negative phase of the NAO index generates conditions opposite to those of the positive phase, i.e., increased precipitation, cold and dry air masses from the north, or warm and moist ones from the south.

3. Results and Discussion

3.1. Long-Term Sea Level Changes

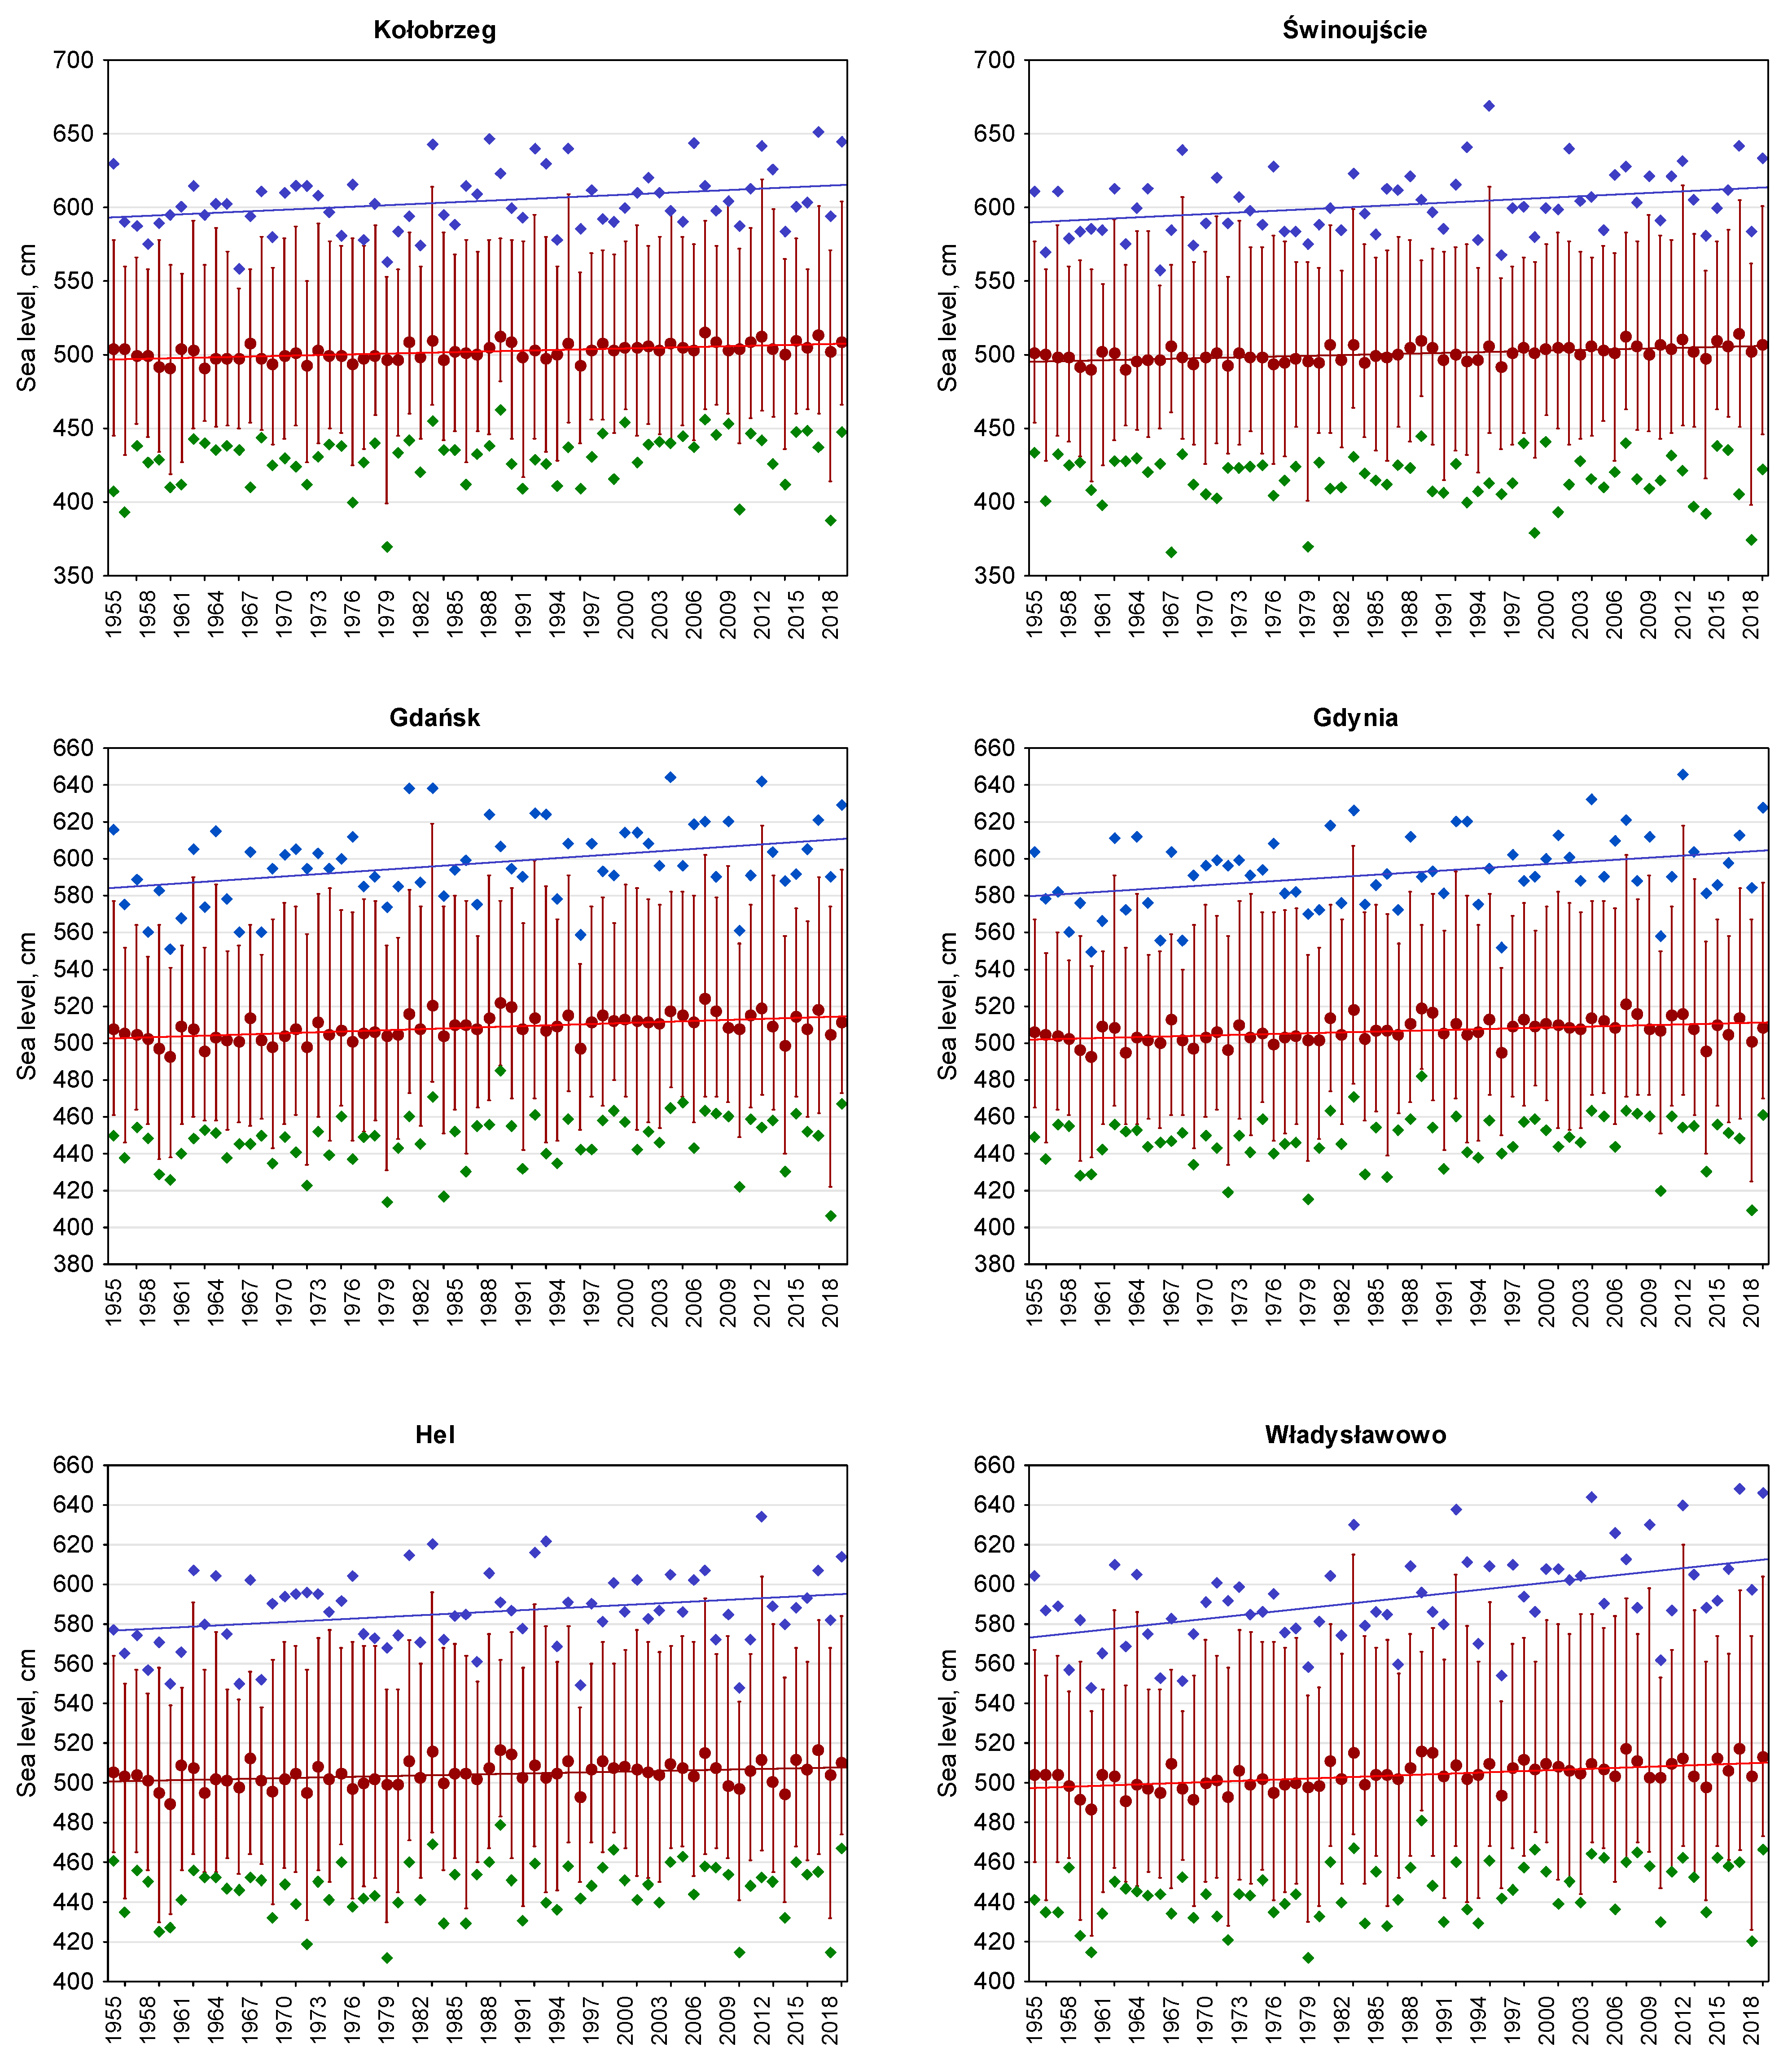
The oldest series of sea levels come from measurements carried out at stations in Gdańsk since 1886 and in Świnoujście since 1811 (Figure 2). Since 1886, at both stations, a statistically significant upward trend has been observed, and considering this whole period, the sea level increase on the eastern coast is 1.5 cm/decade while on the western coast, it is 1.2 cm/decade. At the same time, a more detailed analysis allows us to distinguish approximately 70-year periods that differ in the slope of the trend line. In Gdańsk, these are the period 1886 to 1955, in which the sea level increased by approximately 1 cm/decade, and from 1955 to 2020, with an increase almost twice as high—1.9 cm/decade. In Świnoujście, three periods can be distinguished: 1811–1886, in which no sea level rise was observed; 1886–1955, with an increase identical to that in Gdańsk (1.0 cm/decade); and 1955–2020, with an increase of 1.6 cm/decade. This indicates that the decadal rate of sea level rise has increased in the last 70 years. To illustrate the characteristics of sea level changes at individual stations, average, minimum, and maximum values were determined based on daily values for 1955–2019 (Figure 3). Also, the lowest and highest values measured in a given year are indicated. Average daily sea level values ranged from 398 cm for Świnoujście and 399 cm for Kołobrzeg to 619 cm for Gdańsk and 620 cm for Władysławowo. A statistically significant upward trend (p = 0.0000) is observed at all locations for average and maximum annual water levels (Figure 3).
At the station in Kołobrzeg, the range of average annual water levels was from 490 cm in 1963 to 515 cm in 2007, the range of yearly maximum water levels was from 558 in 1966 to 651 cm in 2017, and the range of minimum annual water levels was from 370 cm in 1979 to 463 cm in 1989 (Figure 3). The highest values of yearly maximum water levels (above 640 cm) were observed in Kołobrzeg in the 1980s (1983 and 1988) and after 2005 (2006, 2021, 2017, and 2019). The lowest values of maximum annual water levels (below 570 cm) were recorded only twice in 1966 and 1979. Maximum annual water levels most often occurred at 581–600 cm (in less than 37% of cases) and 601–620 cm (in less than 34%). Average annual water levels occurred at 501–520 cm (60% of cases) and 481–500 cm (40%).
At the station in Świnoujście, the range of average annual water levels was from 490 cm in 1963 to 514 cm in 2017, the range of yearly maximum water levels was from 557 in 1966 to 669 cm in 1995, and the range of minimum annual water levels was from 366 cm in 1967 to 445 cm in 1989 (Figure 3). The highest values of yearly maximum water levels (above 640 cm) were observed in Świnoujście in the 1990s (1993 and 1995) and 2017. The lowest values of maximum annual water levels (below 570 cm) were recorded only twice, in 1966 and 1996. Maximum annual water levels most often occurred at 581–600 cm (in over 40% of cases) and 601–620 cm (25%). Annual average water levels most often occurred at 501–520 cm (in over 52% of cases) and 481–500 cm (in less than 48%).
At the Gdańsk Northern Port, the range of average annual water levels was from 493 cm in 1963 to 524 cm in 2007, the range of yearly maximum water levels was from 551 in 1960 to 644 cm in 2004, and the range of minimum annual water levels was from 406 cm in 2018 to 485 cm in 1985 (Figure 3). The highest values of yearly maximum water levels (above 630 cm) were observed at the station in Gdańsk after 1980: in 2004 (644 cm), in 2012 (642 cm), and in the early 1980s (638 cm in 1981 and 1983). The lowest values of maximum annual water levels (560 cm and below) were recorded in the 1950s and 1960s and 1996. Most often, maximum annual water levels occurred at 581–600 cm (in over 35% of cases) and 601–620 cm (in less than 30%). Annual average water levels most often occurred in the 501–520 cm range (in almost 85% of cases).
In Gdynia, the range of average annual water levels was from 493 cm in 1960 to 521 cm in 2007, the range of yearly maximum water levels was from 550 in 1960 to 646 cm in 2012, and the range of minimum annual water levels was from 409 cm in 2018 to 482 cm in 1989 (Figure 3). The highest values of yearly maximum water levels (above 630 cm) were observed at the station in Gdynia over the last 20 years: in 2012 (646 cm) and 2004 (632 cm). The highest maximum level was associated with a significant storm surge recorded on our coast in January 2012. The lowest values of maximum annual water levels (below 560 cm) were recorded in the 1960s, 1996, and 2010. Like Gdańsk, maximum annual water levels most often occurred at 581–600 cm (in over 41% of cases) and 601–620 cm (in less than 25%). Average annual water levels most often occurred in the 501–520 cm range (in almost 85% of cases). The highest annual average water levels in Gdańsk and Gdynia were recorded in 2007. This was caused by the very high filling of the Baltic Sea for over a month at the beginning of this year, and numerous storm surges were observed at that time.
At the station in Hel, the range of average annual water levels was from 489 cm in 1960 to 517 cm in 2017, the range of yearly maximum water levels was from 548 in 2010 to 634 cm in 2012, and the range of minimum annual water levels was from 12 cm in 1979 to 479 cm in 1989 [42] (Figure 3). The highest values of maximum annual water levels (above 630 cm) were observed in Hel in the last 65 years only once, in 2012 (634 cm). The lowest values of maximum annual water levels (below 560 cm), similarly to Gdańsk, were recorded in the 1950s and 1960s, as well as in 1996 and 2010. Most often, maximum annual water levels occurred at 581–600 cm (in over 35% of cases) and 561–580 cm (in less than 30%). Average annual water levels most often occurred at 501–520 cm (in almost 77% of cases).
At the station in Władysławowo, the range of average annual water levels was from 487 cm in 1960 to 517 cm in 2007, the range of yearly maximum water levels was from 548 in 1960 to 648 cm in 2017, and the range of minimum annual water levels was from 412 cm in 1979 to 481 cm in 1989. The highest yearly maximum water levels (above 640 cm) were observed in Władysławowo in 2004, 2017, and 2019. The highest maximum level was associated with a significant storm surge recorded on our coast in January 2017. Maximum annual water levels most often occurred in the 581–610 cm range (in almost 57% of cases). Yearly average water levels most often occurred at 501–510 cm (in over 52% of cases). The minimum annual water levels most often occurred in the range of 431–460 (in almost 70% of cases).
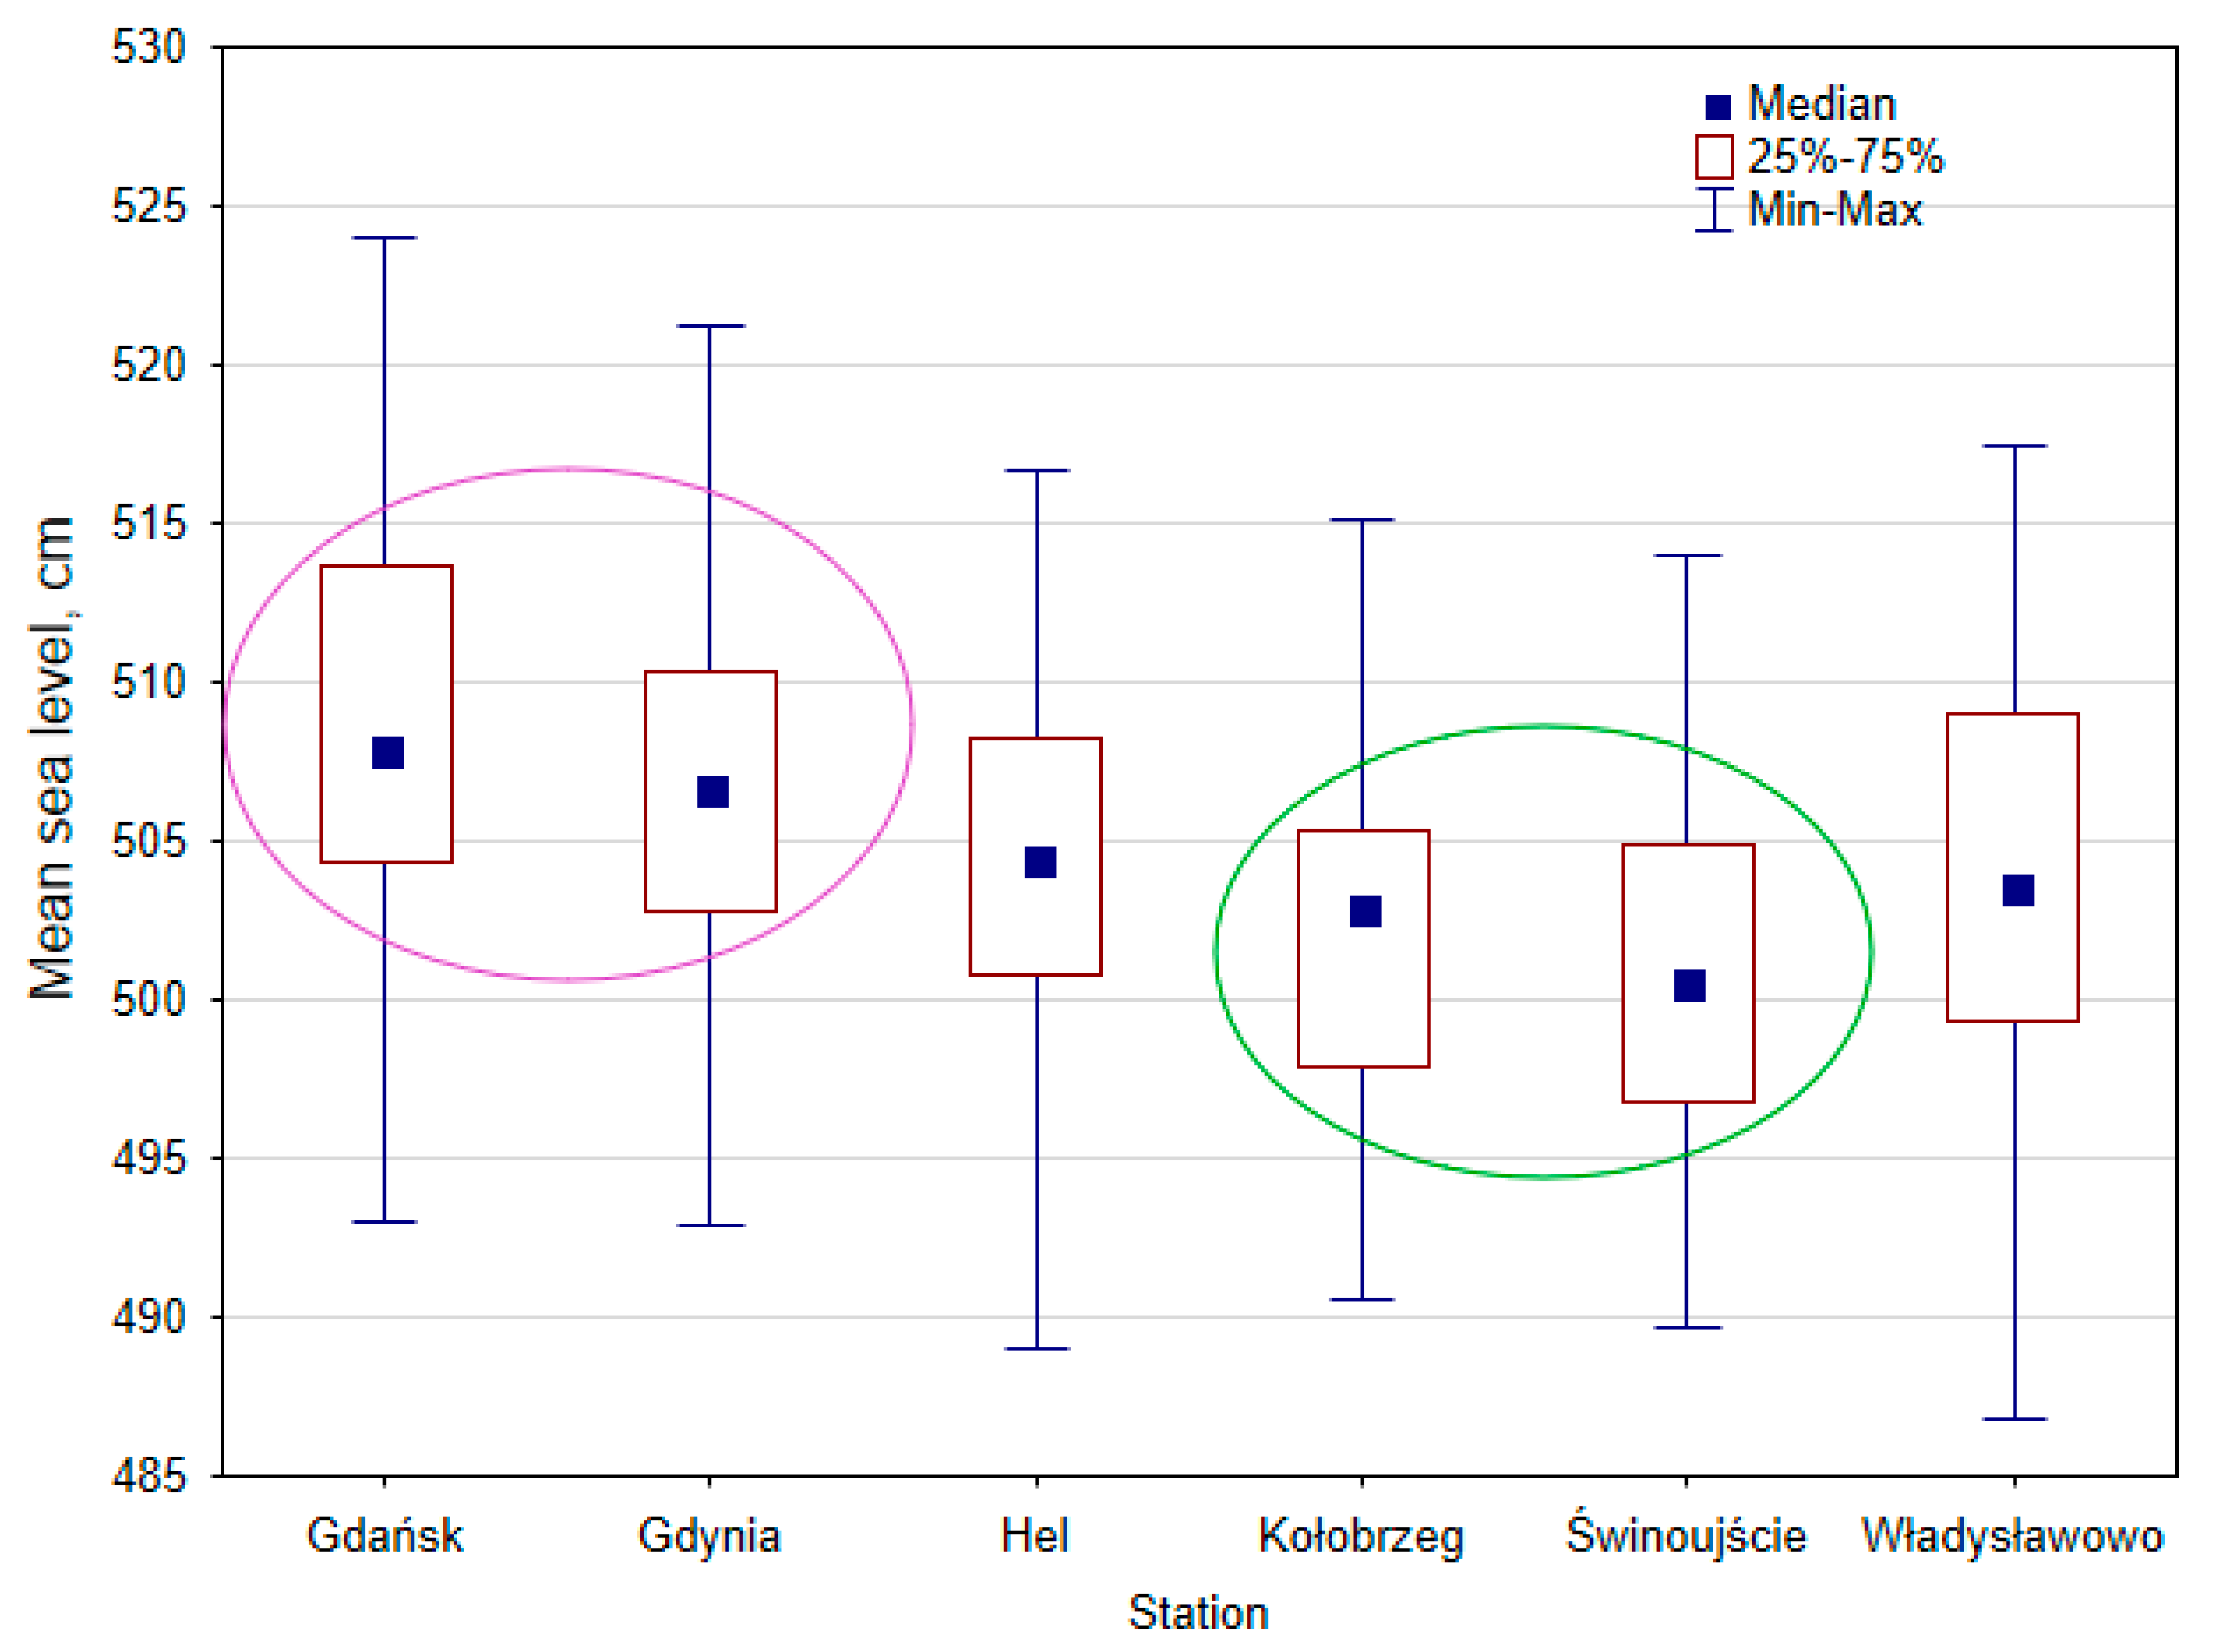
To investigate the significance of sea level differences between individual stations, and the east and west coasts, a statistical analysis of distributions (annual averages) was carried out using the Kruskal–Wallis test, which allows a comparison of many independent samples. The null hypothesis assuming the equality of distributions was rejected in the case of the comparison of Gdańsk with other stations, except for Gdynia (Figure 4). In the case of Gdynia, a statistically significantly different distribution was found in the case of Kołobrzeg and Świnoujście and in the case of Hel—Gdańsk and Świnoujście. In the case of Świnoujście, significant differences were found for Gdańsk, Gdynia, and Hel, while in the case of Kołobrzeg, for Gdańsk and Gdynia. In this way, significant differences were shown between the stations in the Gulf of Gdańsk on the east coast and the stations on the west coast (Figure 4). As a rule, sea level is mainly shaped by the barometric system in the region of Europe and the North Atlantic, but in this case, there were clearly higher levels at the Gdańsk and Gdynia stations located in the mouth of the large Vistula River, depending on hydrological processes in its basin.
As part of the analysis of long-term changes in sea levels along the Polish coast, the frequency of average daily sea levels in 10 cm intervals from 440 to 640 cm was also calculated (Figure 5), with red indicating a higher frequency expressed as a percentage. Both at the stations in Kołobrzeg and in Władysławowo, frequency distributions until the end of the 1980s were more or less similar, with the most common range being 500–510. Since the 1990s, there has been a clear shift towards levels 510–530, especially in the last two years. The same shift towards higher values also applies to lower and higher sea level ranges, which indicates a change in the dynamics of the sea level rise phenomenon.
The analysis of the average sea level calculated for individual months based on data from all stations in the period 1955–2019 showed that values characterising the months from July to December and January were at a similar level, ranging from 507 to 510 cm (Figure 6). The lowest average values of 495 cm occurred in the months from March to May, while in February and June, they amounted to 501 cm. Seasonal sea level differences resulting mainly from atmospheric circulation conditions are described by a range defined by minimum and maximum values. The greatest spread was observed in November (216 cm), January (194 cm), and February (186 cm), with the smallest value of 398 cm recorded in November and the highest value of 620 cm in January. In the period from May to July, the spread was 90 cm. Similar seasonal patterns were found on the Lithuanian coast [43].
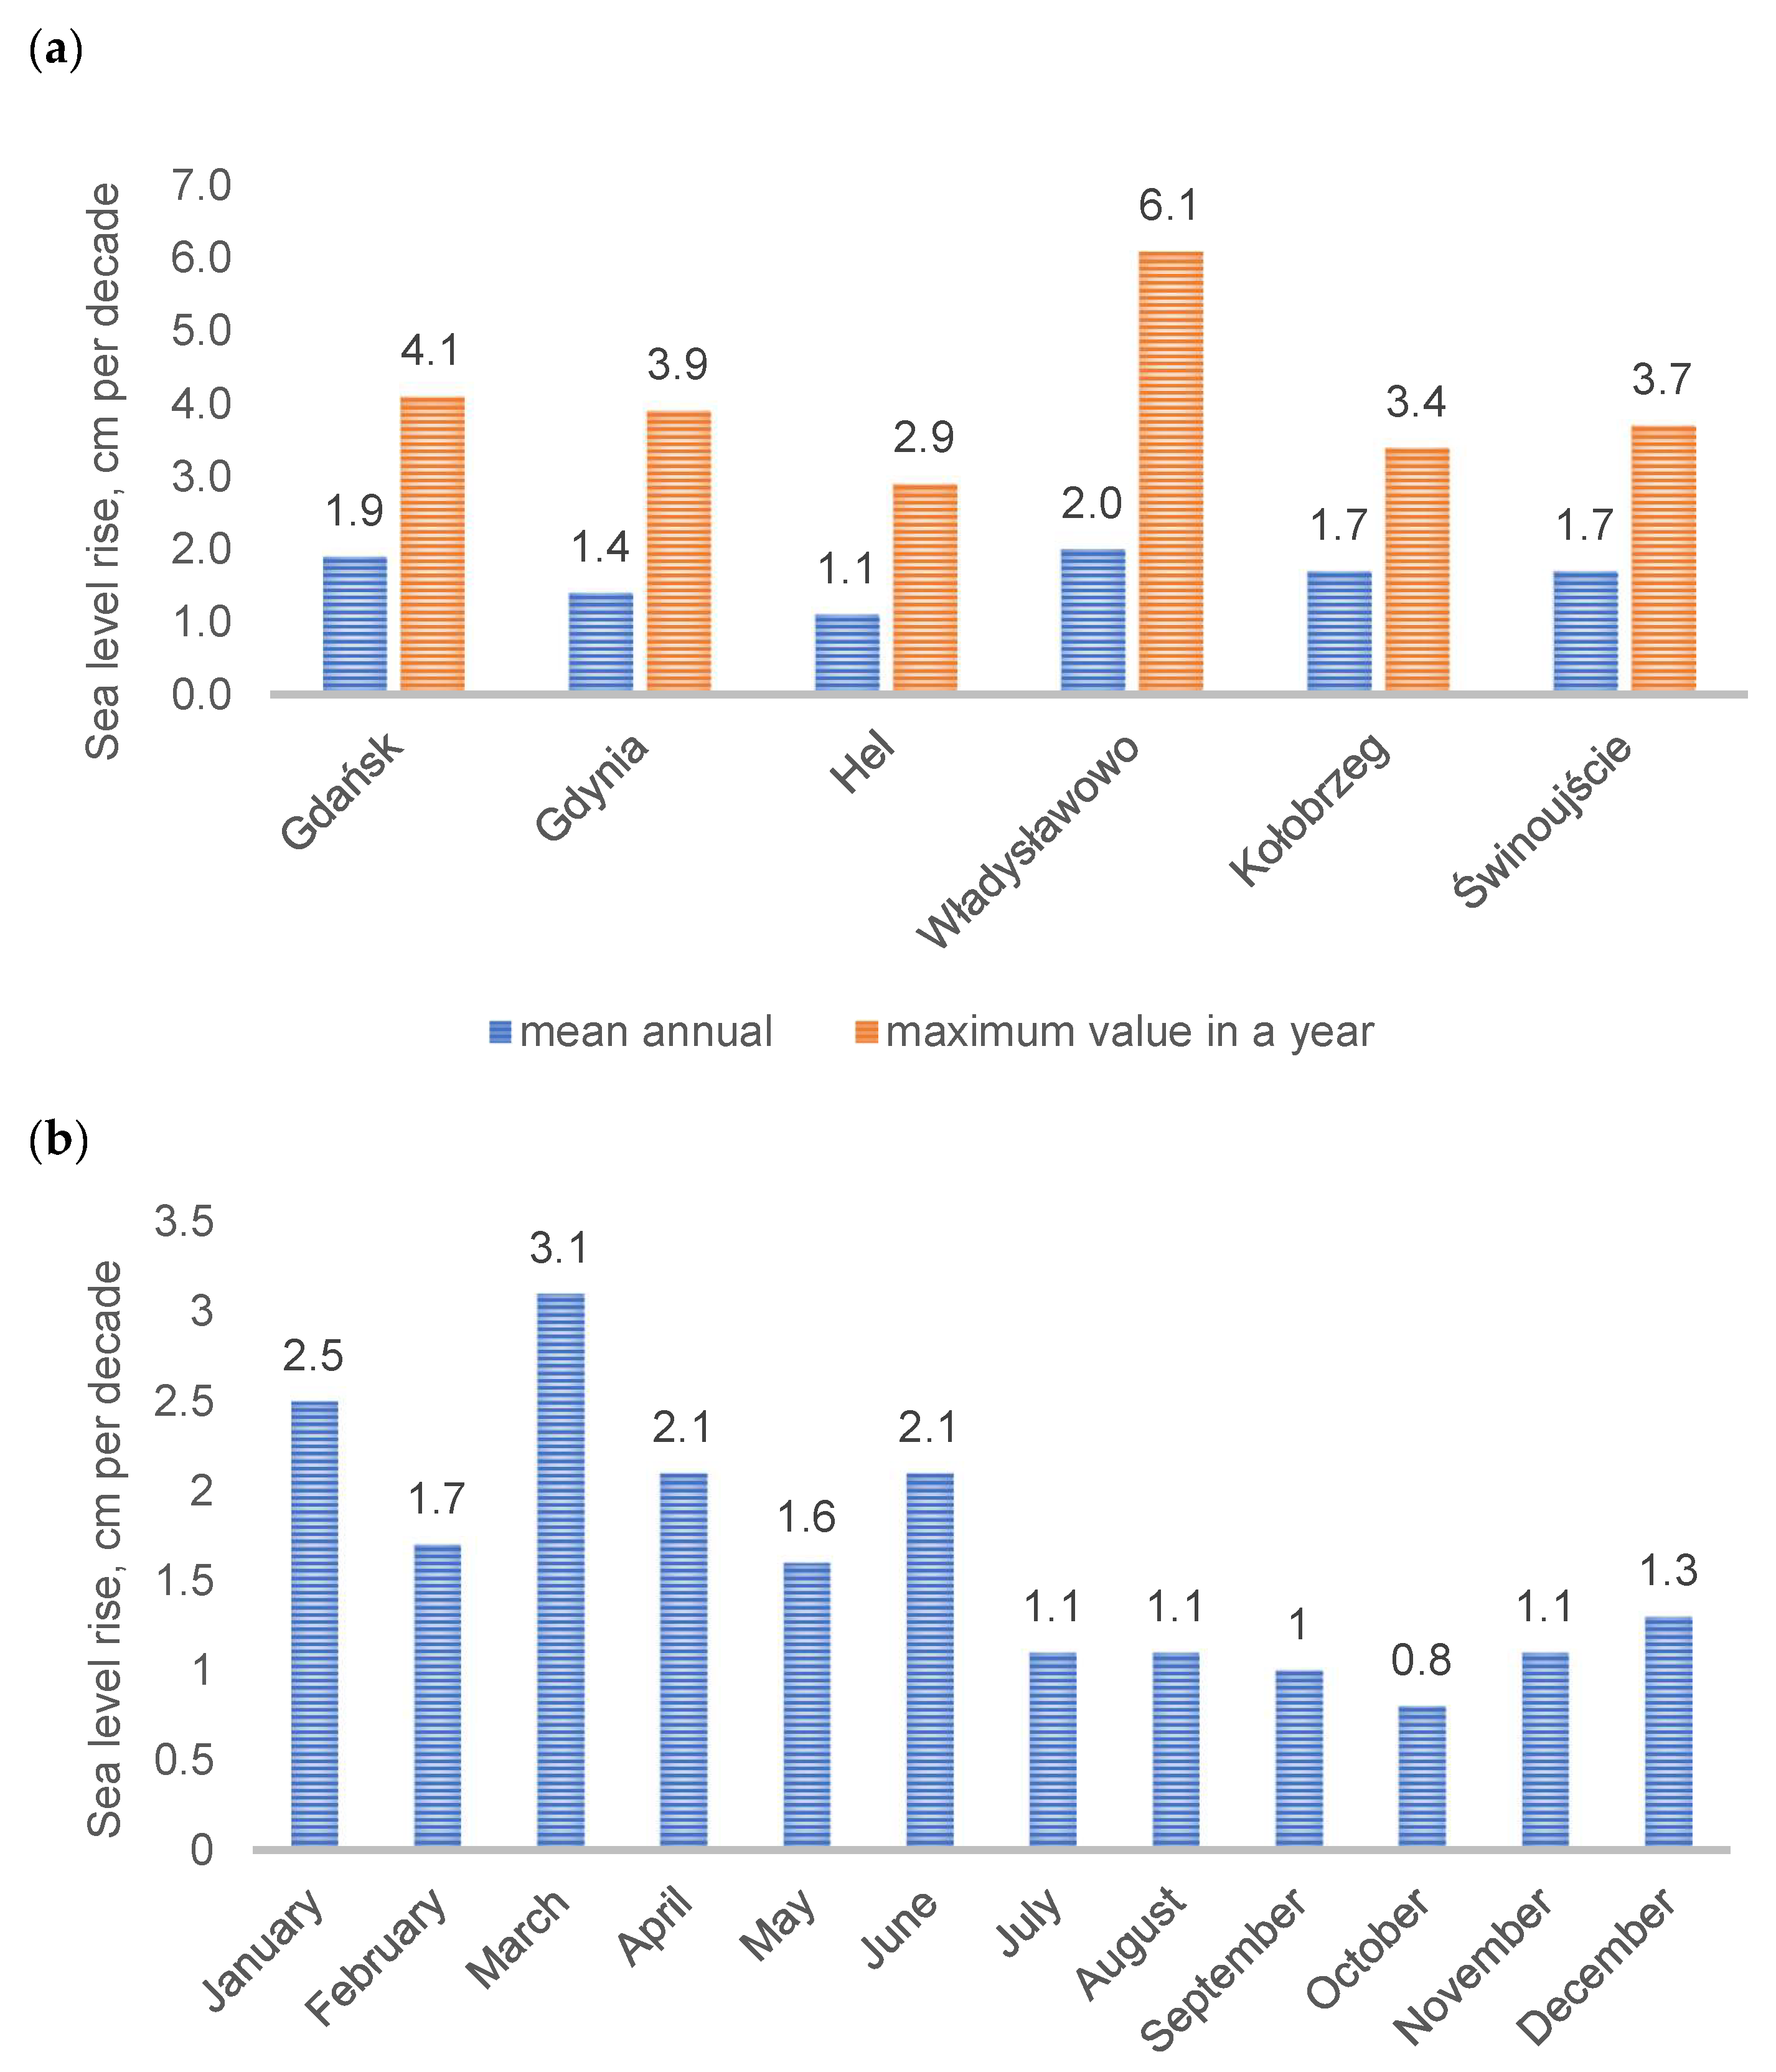
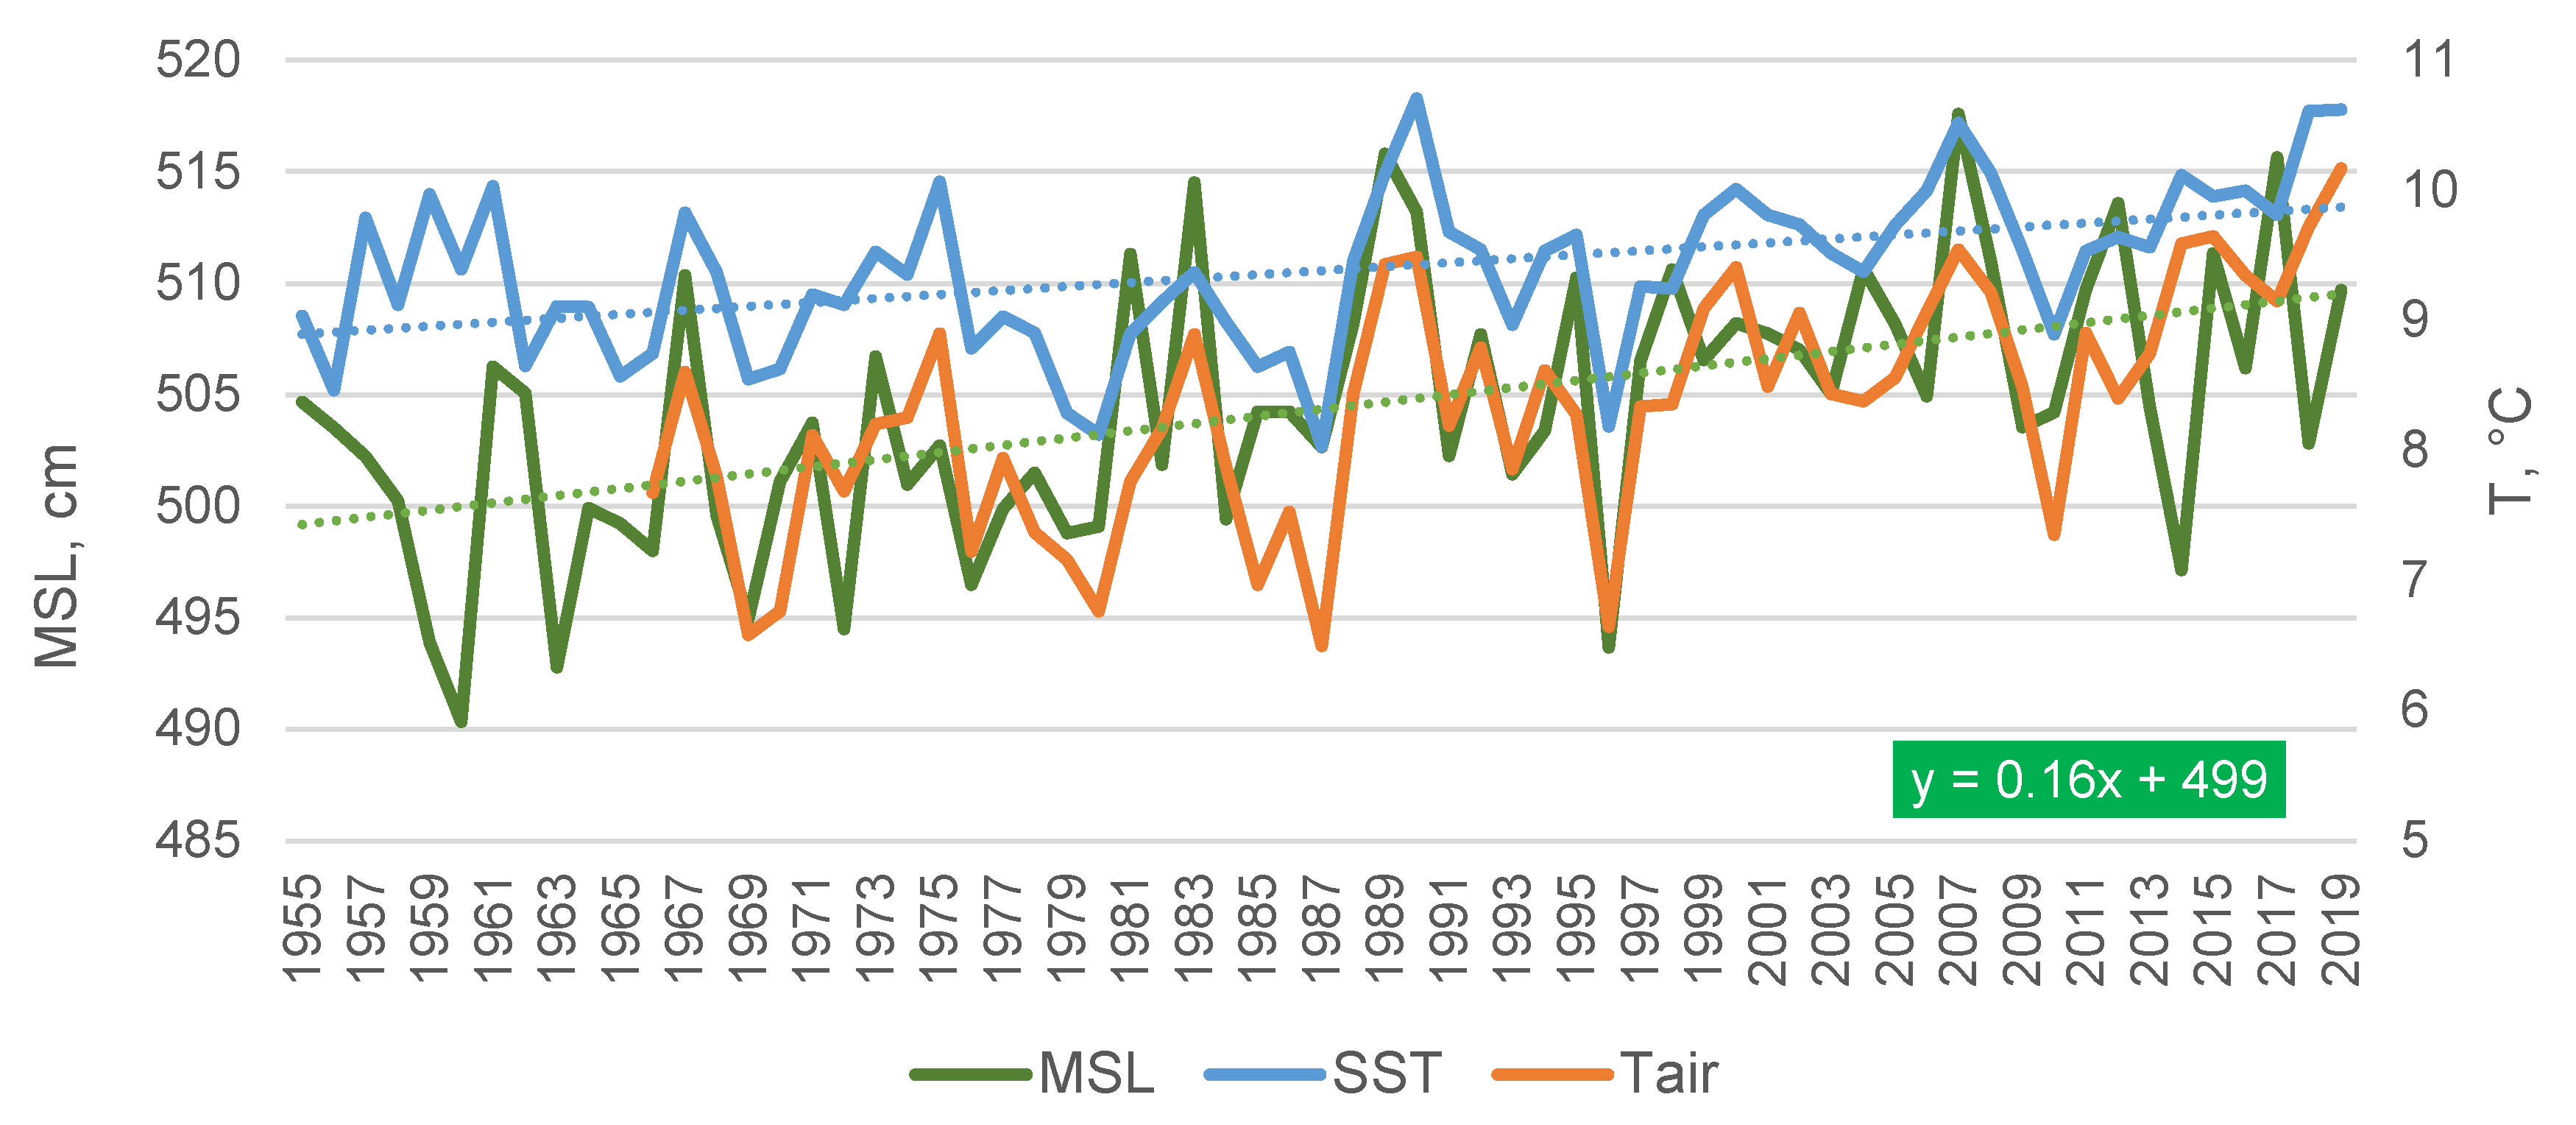
The statistical analysis of sea level changes carried out at individual stations in 1955–2019 showed some geographical diversity. The lowest sea level change per decade was recorded in Hel (1.1 cm) (Figure 7a). Next on the east coast was Gdynia (1.4 cm) and Gdańsk (1.9 cm). From 1951 to 2008, the sea level in Gdańsk increased at a rate of 2.8 cm/10 years, while from 2008 to now, a slight weakening of the average sea level increase has been observed compared to previous years. The west coast had a value of 1.7 cm/decade. The highest increase, amounting to 2 cm/decade, occurred at the station in Władysławowo, which is also reflected in the very high slope coefficient of the trend line of extreme values (single measurements), which in the case of this location was 6.1 cm/decade. In contrast, at the other stations, it remains in the range from 2.9 to 4.1 cm/decade (Figure 7a). Taking into account the values of average annual levels determined based on data for all stations, a statistically significant (r = 0.518, p < 0.05) upward trend is visible (Figure 8), and the sea level rise determined on this basis was 1.6 cm per decade in the period from 1955 to 2019.
Based on data from all locations and comparing average values determined for individual months, the most intense sea level change in the period from 1955 to 2019 was characteristic of March (3.1 cm) and January (2.5 cm), which may be related to the intensification of storm surges, which in the case of March fell in the period from 2000 (Figure 7). In February, April, May, and June, the decadal sea level change remained in the range of 1.6–2.1 cm, while from July to December, it was at the level of 0.8–1.3 cm.
To determine the convergence of the direction of changes in the temperature of seawater and air temperature with changes in sea level from 1955 to 2019 (Figure 8), a statistical correlation analysis using Spearman’s rank method (one of the nonparametric measures of monotonic statistical dependence between random variables) was carried out. The analysis, including the annual average values of mean sea levels and sea and air temperatures, showed statistically significant correlations taking into account all stations as well as the cases of individual stations (Table 1). For data from all stations, the correlation coefficients for mean sea level were 0.528 and 0.630, respectively, for sea surface temperature and air temperature. Regarding the correlation between mean sea level and sea surface temperature, the lowest coefficient was found at the Świnoujście station, while the strongest relation was found at the Władysławowo station (Table 1).

3.2. Filling of the Baltic Sea and Storm Surges

One of the parameters characterising the hydrological conditions in marine areas is filling the Baltic Sea [33]. It is a one-dimensional parameter representing the hypothetical sea level in the boundary condition, i.e., the level to which the water level would tend along the coast without other forces generating water movement. The formula of this parameter is based on the air pressure differences on particular cross-sections of the Baltic Sea, air and surface water temperature differences, wind directions, and the cold and warm seasons. The formula was developed empirically. The level of the filling parameter contains information about the current hydrological situation and helps determine the synoptic estimates for the next 48 h. The value of this parameter is calculated daily at the Hydrological Forecasting Office in IMWM-NRI in Gdynia. This parameter is used as a reference level for short-term hydrological forecasts and indicates the beginning of a storm surge [31].
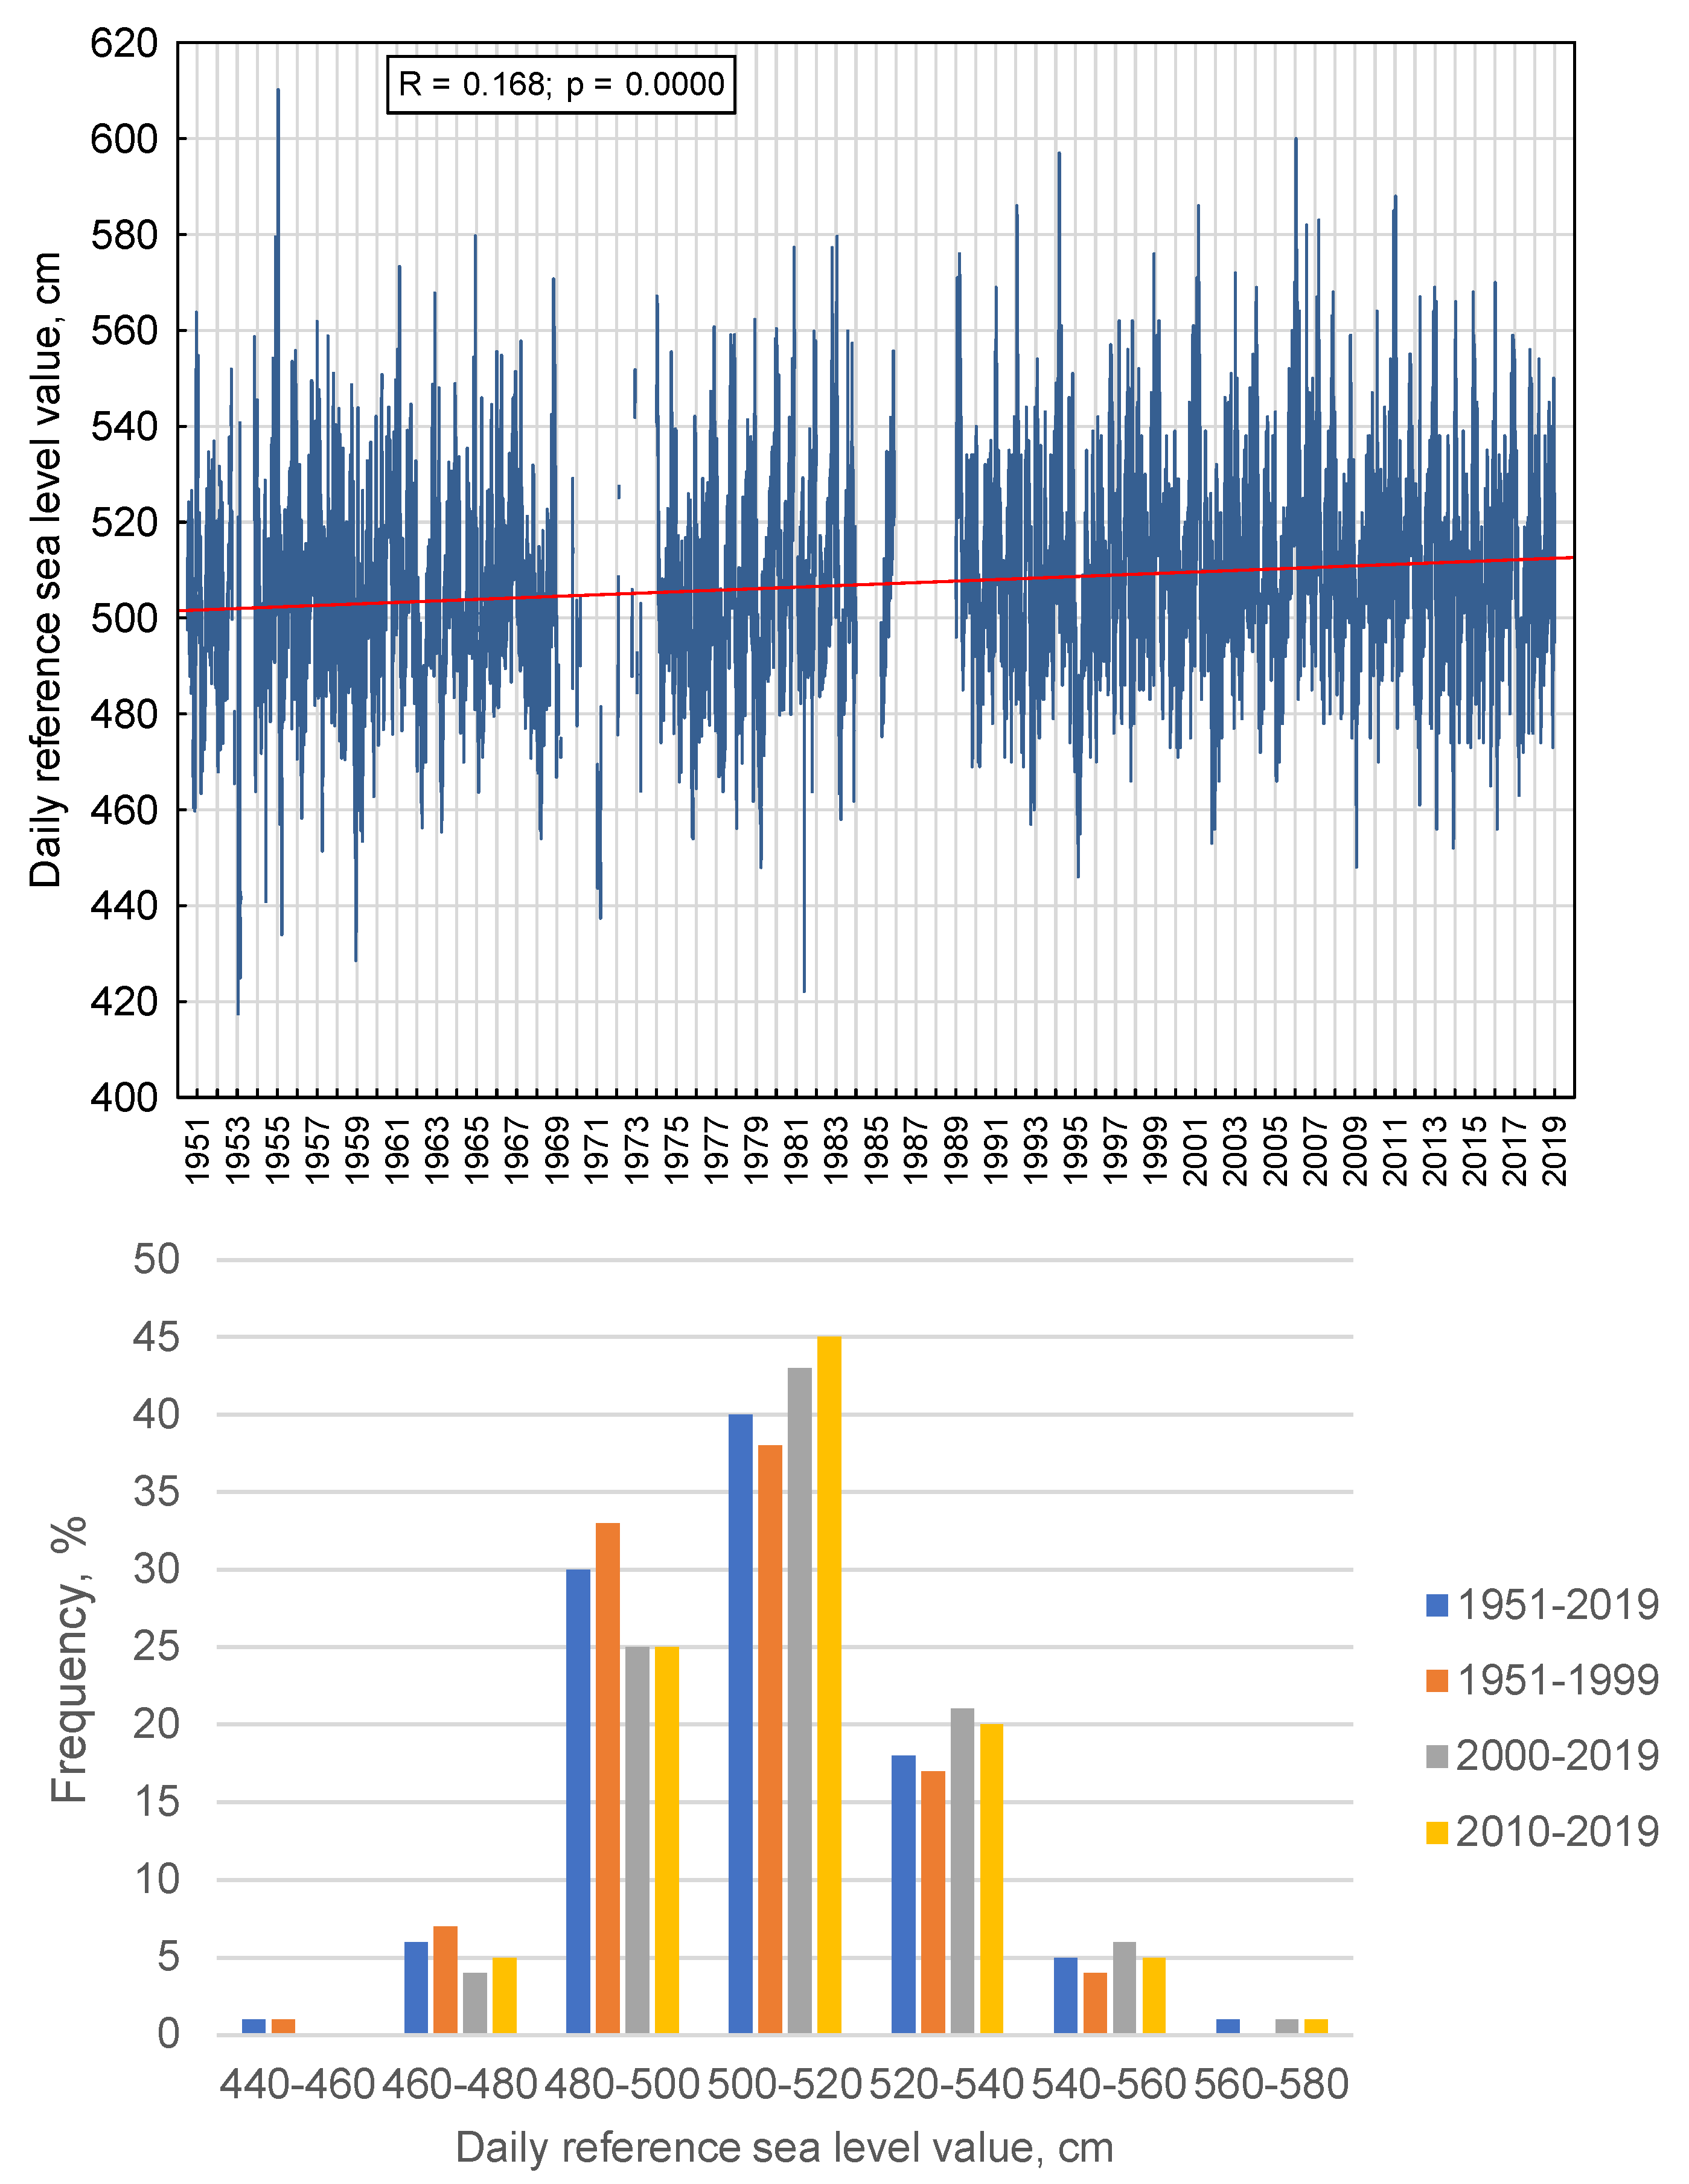
The minimum filling value of the Baltic Sea during almost seventy years of observations from 1951 to 2019 was 417 cm, recorded in January 1954. The highest filling value was 610 cm, recorded in January 1956. The trend line shows a slight, statistically significant upward trend in the Baltic Sea filling value (Figure 9) over the observed period.
The filling parameter values percentage share in intervals was compared throughout the observation period 1951–2019 and in individual periods 1951–1999, 2000–2019, and 2010–2019. In each of the analysed periods, the filling values were most often in the range of 500–520 cm, but in the period 1951–1999, they accounted for 37.5% of all values, and in the last period, 2010–2019, already for 45% of the values. In the high-water range of 540–560 cm, filling values were most frequently observed in 2000–2019, accounting for 6.1% of all values. The incidence of low filling in the 420–480 cm range has decreased over the last 20 years (2000–2019) compared to 1951–1999 from 7.9% to 4.2%.
The filling of the Baltic Sea is a parameter used to determine the duration of storm surges. According to the current methodology [29], the beginning and end of the flood were considered to be the filling value of the Baltic Sea calculated on the day of the maximum level during a given flood or on the previous day.
Catastrophic storm floods that threaten human life occur sporadically every few years. They cause enormous material losses in coastal areas, port and shipyard infrastructure, and agglomerations in estuary sections of rivers. Based on this research, three main types of storm surge patterns were selected depending on the duration and the maximum sea level reached [29,44].
Storm surges along the Polish coast appeared irregularly, as shown for the Świnoujście station, considering the division in decades (Figure 10a). The smallest number of floods was recorded in the 1950s—only 17 cases. In the following decades, storm surges in Świnoujście systematically increased from 22 in the 1960s, to 34 in the 1970s, and to 49 in the 1980s. In the 1990s, there was a decrease to 34 cases (perhaps related to the observed change in circulation at that time). Then, the number of these phenomena increased again and, in the next two decades, remained at a high level again, from 47 in 2000–2009 to 44 in 2010–2020. In total, 247 storm surges were observed during the abovementioned period.
In the period 1980–2020, storm surges on the western coast occurred much more often than on the eastern shore (Figure 10b), especially in the 1980s; in the following decades, there was a significant increase in the number of storm surges in Władysławowo and Gdańsk in the 1990s and the first decade of the 21st century. In the annual course of sea levels, the seasonality of storm surges is very clearly visible (autumn and winter).
Using the example of Świnoujście, it should be emphasised that the highest frequency of storm surges was observed on the entire coast in the autumn months from October to December and in the winter months from January to March. Statistically, in 1950–2020, storm surges in Świnoujście occurred most often in January (24% of cases), December (almost 19%), and November (17%). In the most recent period, 2000–2020, floods dominated in January and December, but they also occurred very often in March, which did not happen in the 1970s and 1980s. A detailed distribution of the frequency of storm surges in Świnoujście over the last 70 years is presented in Figure 10c.

3.3. Ice Cover

Ice formation is one of the elements influencing the hydrodynamics of marine areas and is strongly dependent on climate change. In the Polish coastal zone, ice formation occurs only during moderate and severe winters [45]. Winters are classified as mild, moderate, and severe based on average daily air temperatures, from which the sum of cold is calculated. The sum of cold is the absolute value of the sum of average daily negative air temperatures from five stations (Świnoujście, Kołobrzeg, Ustka, Hel, and Gdynia) from October to April. A value of 0–100 corresponds to a mild winter, 100–200 to a moderate winter, and above 200 to a severe winter. Ice phenomena are often limited to the western coast with the Szczecin Lagoon and internal waters of the Vistula Lagoon, the Bay of Puck, and coastal ports. Ice phenomena in the open sea zone are rare.
The most severe ice conditions in the 20th century occurred in the 1940s, 1950s, and 1960s, when ice occurred almost yearly. Then, apart from the winter of 1986/1987, a systematic decline in the number of days with ice was observed on the Polish coast, and even in the 21st century, there have been more and more frequent occurrences of ice-free seasons [16,46,47,48].
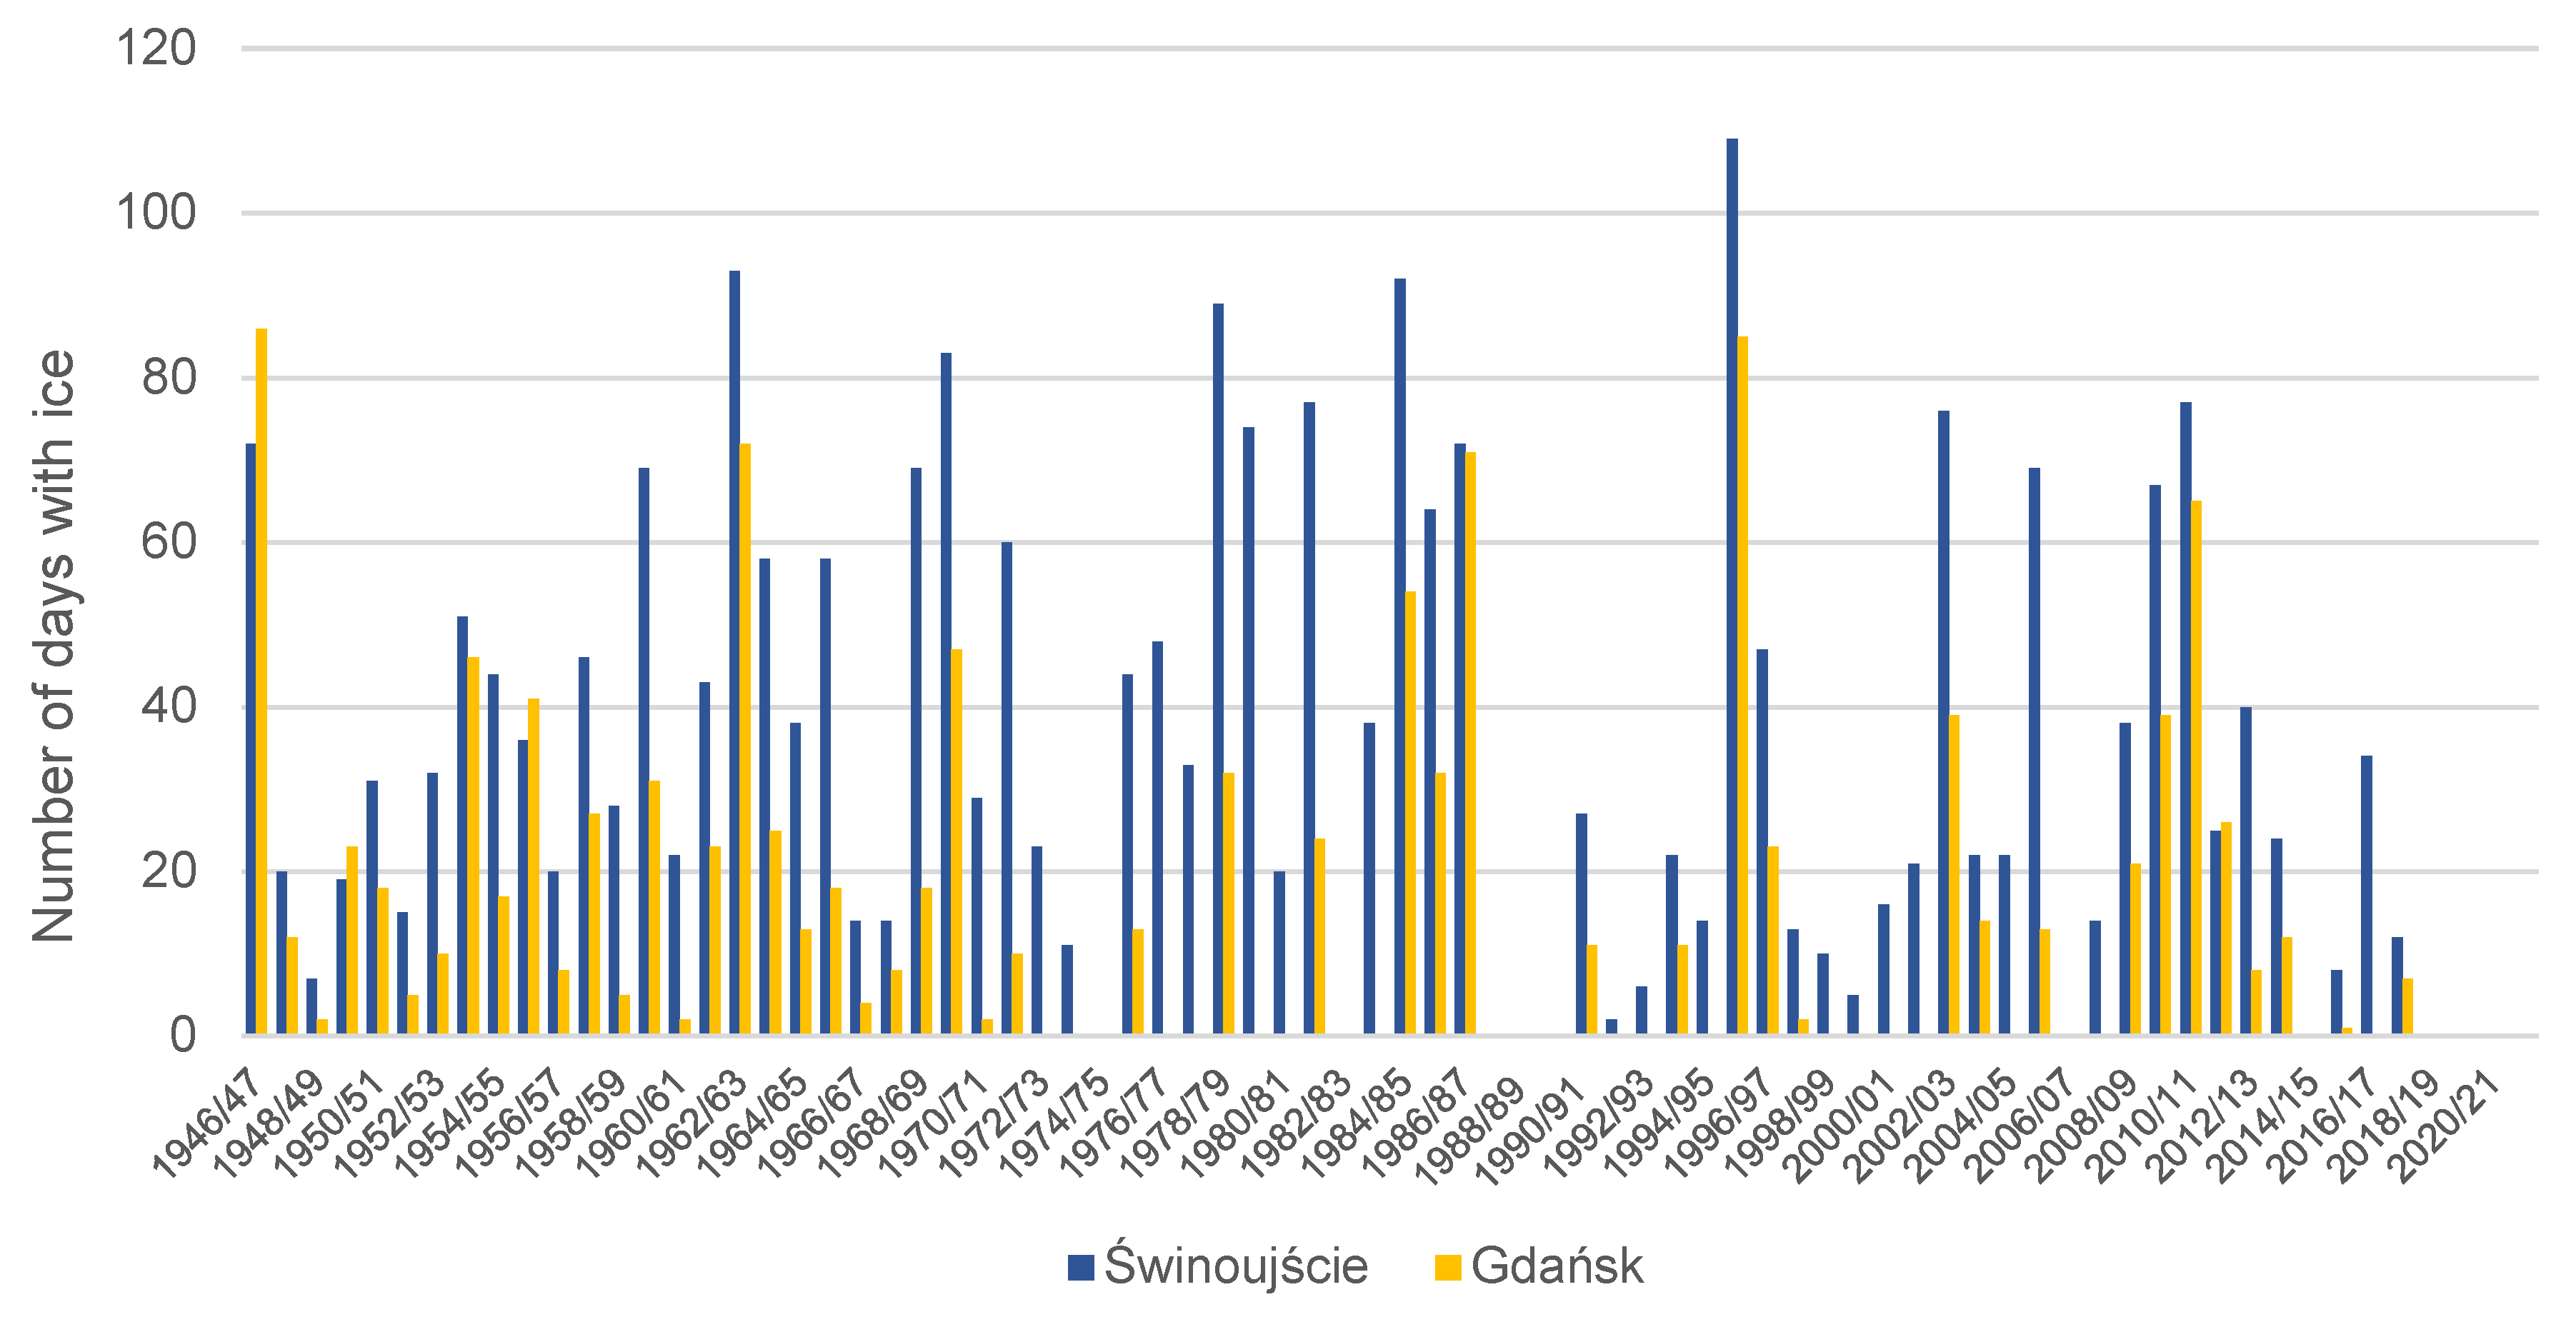
The most characteristic ice indicators are the number of days with ice. The number of days with ice was compared on the western coast, using the example of the port in Świnoujście, and on the eastern coast, using the example of the port in Gdańsk (Figure 11). Ice days occurred every year from 1946 to the early 1970s. The days on the western coast, in Świnoujście, varied from 7 in 1948 to 93 in 1962. However, on the eastern shore, in Gdańsk, the number of days with ice in this period was much smaller (2–46). Since the 1972/73 season, there have been years without ice days, a more common occurrence in the Gdańsk area. The coldest season, with 109 days of ice in Świnoujście and 85 in Gdańsk, was in the winter of 1995/1996. Since 2010, a decrease in the number of days with ice has been observed, and in recent years in the Polish coastal zone, ice phenomena occurred mainly in the Vistula Lagoon, the Szczecin Lagoon, the Bay of Puck, and occasionally the Pomeranian Bay. No ice has been observed in the coastal zone of the open sea since the winter of 2010/11. In the 2019/20 season, there was no ice at all; it was an exceptionally mild winter, and in the 2020/21 season, it was observed mainly on the western coast with the Szczecin Lagoon and in internal waters—the Vistula Lagoon and the Bay of Gdańsk.

3.4. Waves and Storms

The evaluation of the values of significant wave heights averaged for the selected basins for each year of the 1980–2021 period does not show a significant intensification of the wave regime, including an increase in the values of significant wave heights or an increase in storm duration (Table 2). The highest average values of significant wave heights are specific to the southeastern part of the Gotland Basin and the eastern part of the Bornholm Basin, where, in most cases, they exceeded 1.6 m. The highest average values of significant wave heights occurred in 1999 in both basins and were 2.0 m and 2.1 m, respectively. The basins with the smallest average values of significant wave height were the Pomeranian Bay and the Gulf of Gdańsk. This was due to the occurrence of shallows in the case of the Pomeranian Bay and limited exposure to wind, the varied shape of the coastline and seabed, and the short wave fetch in the Gulf of Gdańsk. The highest average values of significant wave height were 1.2 m in the Gulf of Gdańsk and occurred in 1980 and 1987, while in the Pomeranian Bay, they did not exceed 0.8 m and occurred in 1980, 1988, 1995, and 2002. The longest-lasting storms, expressed in terms of total storm duration with waves exceeding 2.5 m, also occurred in the southeastern part of the Gotland Basin and the eastern part of the Bornholm Basin, i.e., in 1982 (1011 h), 1988 (above 759 h), 1989 (above 846 h), and 2006 (717 h in the eastern part of the Bornholm Basin). The smallest number of hours classified as a storm was detected in the Pomeranian Bay and the Gulf of Gdańsk, where they did not exceed 57 h (1994) and 171 (1982), respectively. Monthly averaged values of significant wave heights and sea levels (expressed as a deviation from mean sea level, where 0 cm equals 500 cm according to the Old Amsterdam system) show a similar pattern regarding intensification. Both the significant wave height and sea levels are the highest in the autumn and winter months (Table 3). The highest average significant wave heights, i.e., 1.51 m in the western part of the Bornholm Basin, 1.76 m in the southeastern part of the Gotland Basin, 1.82 m in the eastern part of the Bornholm Basin, 0.95 m in the Gulf of Gdańsk, and 0.77 m in the Pomeranian Bay, occurred in November and December. The lowest average values of significant wave heights occurred in the spring–summer months, i.e., from April to July, when the values did not exceed 1.0 m in parts of the Gotland and Bornholm Basins adjacent to the Polish coast and 0.54 m in the Gulf of Gdańsk and Pomeranian Bay. Similar to wave conditions, the lowest sea levels, reconstructed from the reanalysis, occurred in the spring months. However, in contrast to the wave regime, the highest sea levels occurred in August (except in the Gulf of Gdańsk, where the highest increase was observed in November).
Atmospheric circulation is one of the main factors influencing the hydrodynamic conditions of the sea. In addition to local and regional wind conditions, the impact of NAO circulation on the waves of the southern Baltic Sea should be considered [49]. For this purpose, the monthly averaged significant wave heights for the entire southern Baltic area for each year in 1980–2021 were compared with the NAO index values (Table 4). To facilitate the analysis, a colour code was used, with the highest values red and the lowest values (also taking into account negative values in the case of NAO) blue. The highest average monthly wave heights exceeding 2 m were recorded in January, November, and December, in which the NAO index also reached the highest values. Values below 1 m occurred in all months; at the same time, they most often described the situation from April to August. The NAO index also reached the lowest positive and negative values in the same period. A positive NAO phase occurs when the average pressure value for a given year/month in the Azores High is greater than the long-term average, and at the same time, when the pressure value in the Icelandic Highlands is lower than the long-term average. This phase is associated with strong northeasterly winds, which generate storms. The negative phase of the NAO index generates conditions opposite to the positive phase, i.e., increased precipitation, cold and dry air masses from the north, or warm and humid air masses from the south. At the same time, a statistically significant correlation between the monthly mean value of the significant wave height and the value of the NAO index was found only in the cases of January and December, for which the correlation coefficient determined by the Spearman rank method was 0.37 and 0.55, respectively. The results correspond to a generalised division into storm and non-storm seasons [50,51].
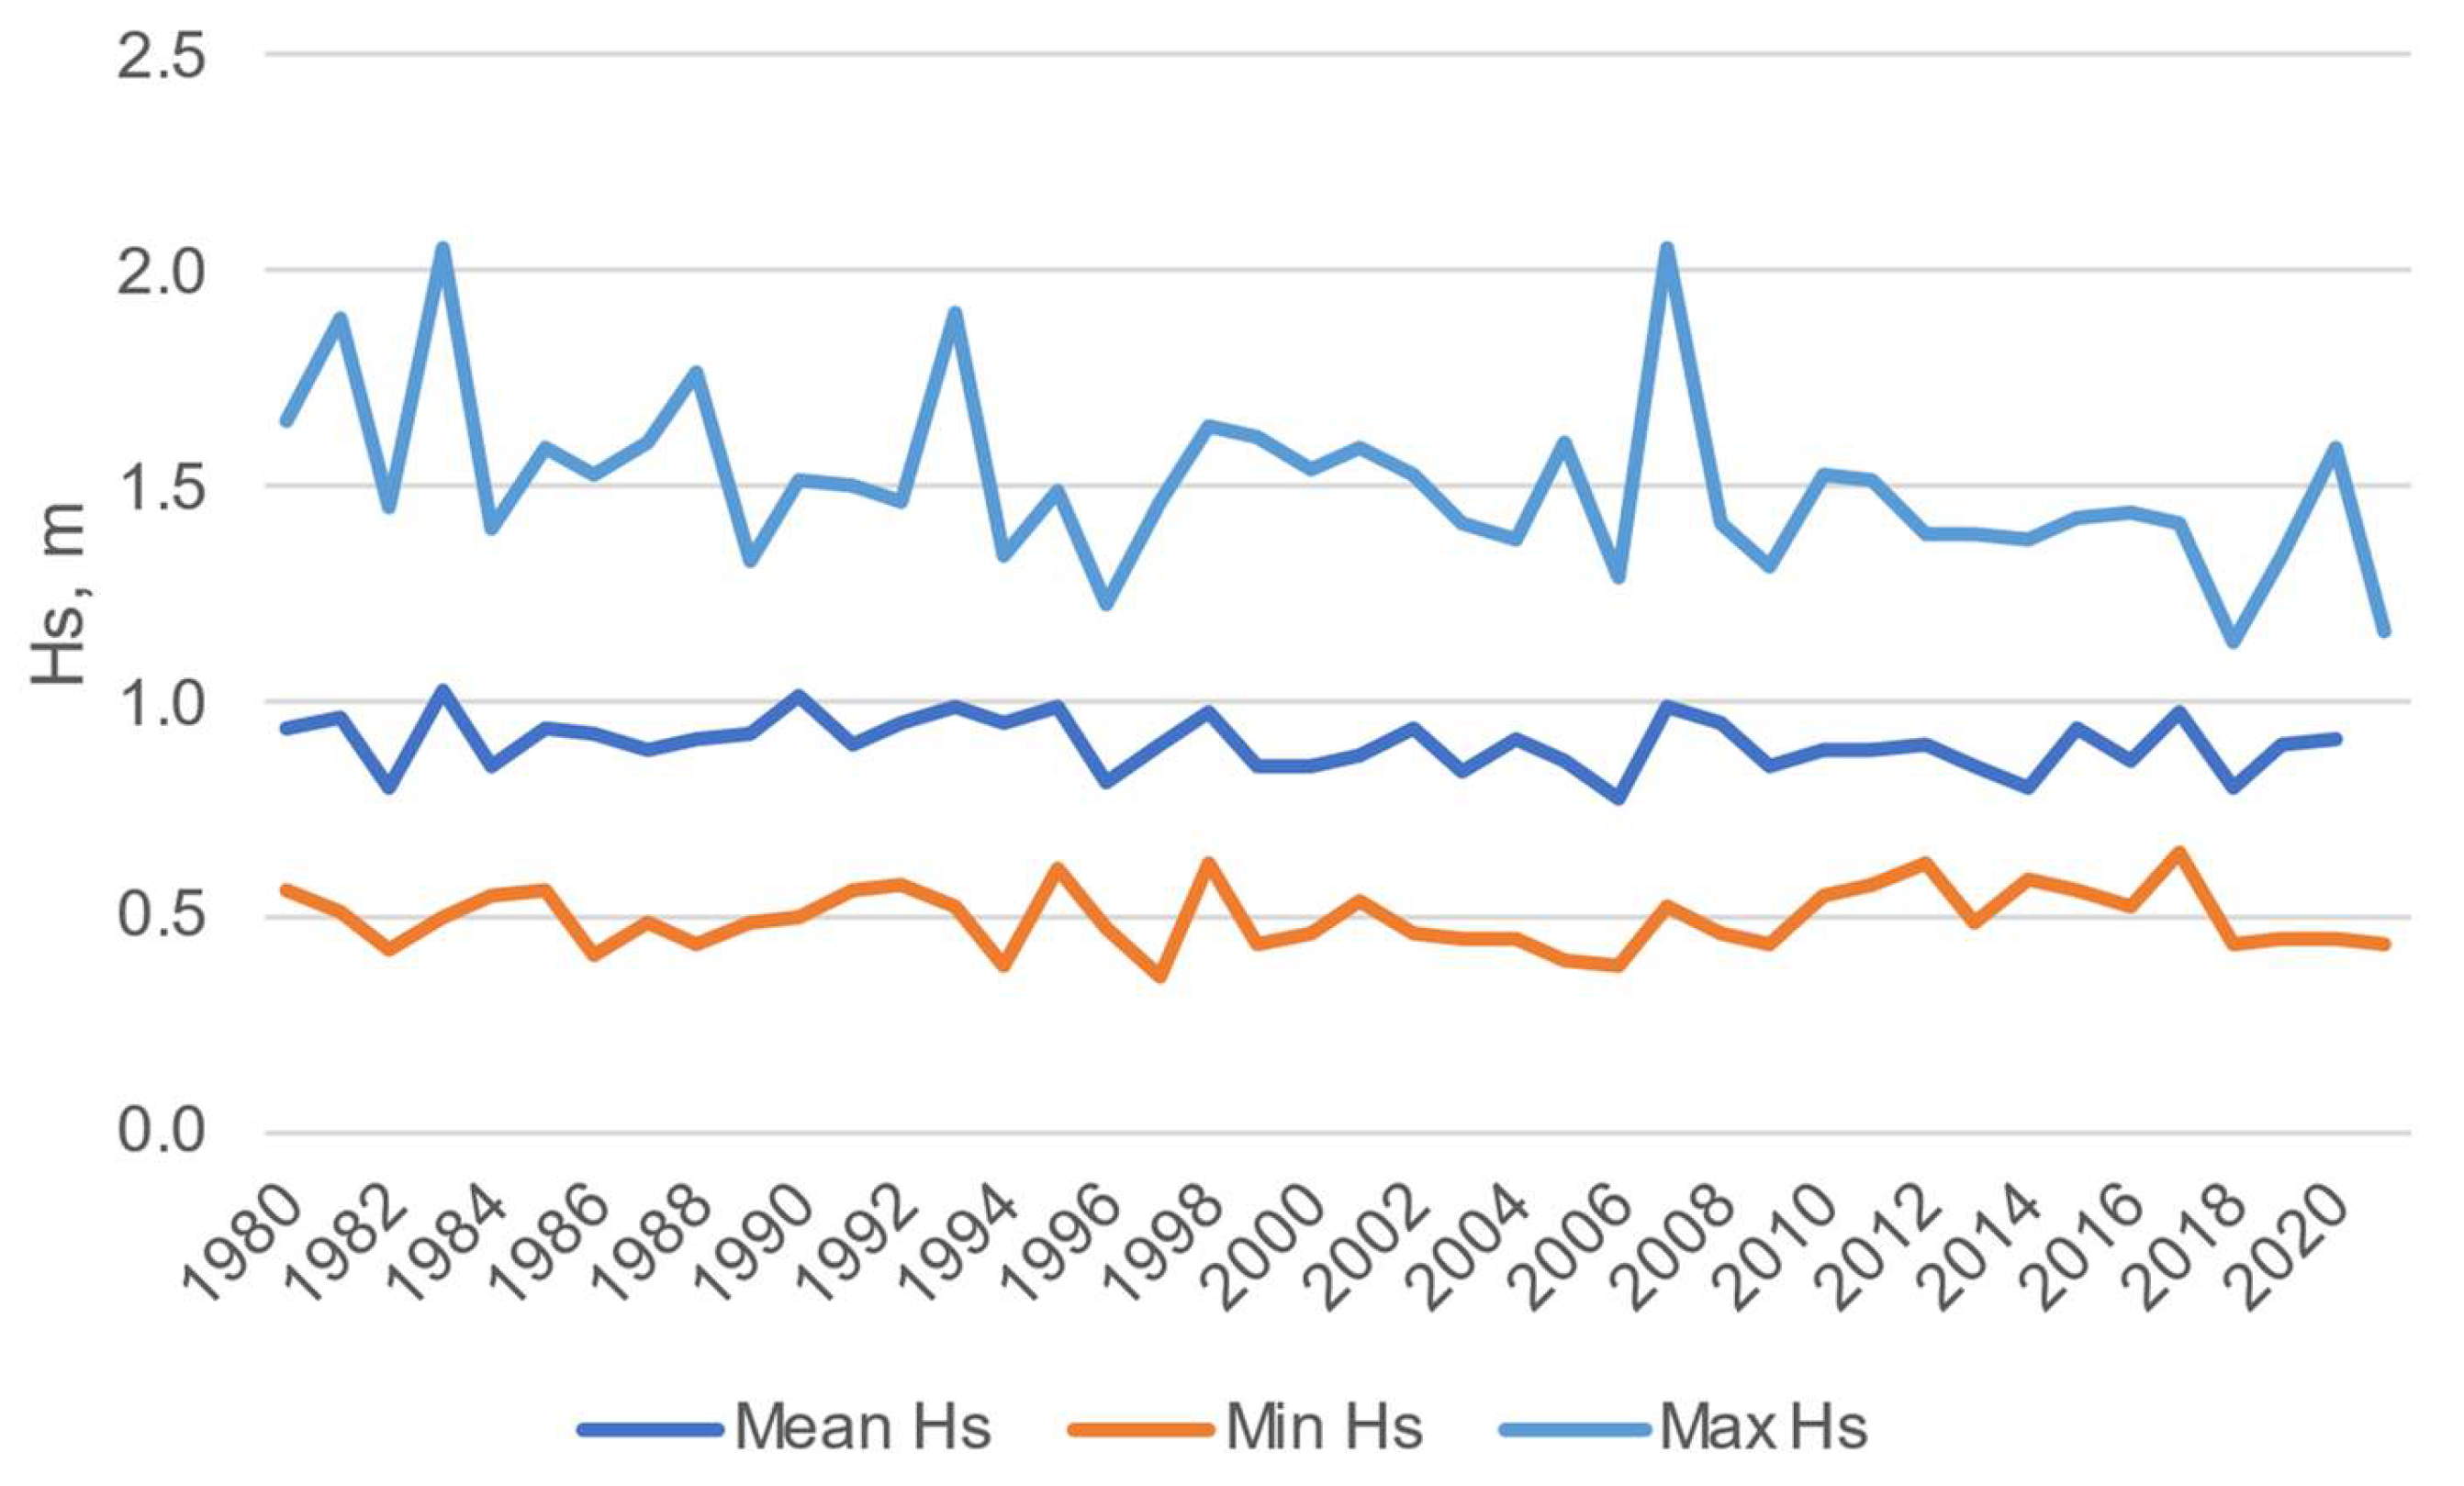
The analysis of the average annual significant wave height for the southern Baltic, calculated based on monthly averages (Table 4), which remained in the range from 0.8 to 1 m, did not show significant changes in 1980–2020 (Figure 12). In the case of minimum values, which oscillated around 0.5 m, no changes were observed either. A slightly downward trend with a statistically significant character (R = −0.458, p < 0.05) is observed in the case of monthly average maximum values, which changed in the range of 1.1–2.1 m (Figure 12).

4. Conclusions

Continuous and intensifying climate change affects the state of the marine environment and the hydrodynamic characteristics of the Baltic Sea, as we have shown in our research in the southern Baltic Sea area. This analysis of long-term data on sea level and the occurrence of ice cover, waves, and storm surges enabled the identification of spatiotemporal variability, including the detection of changes in the intensity, frequency, and repeatability of the analysed parameters. The sea level in the southern Baltic rose by approximately 1 cm/decade from 1886 to 1955. This intensification was observed in this period, and the sea level rose by 1.6 cm/decade and 1.9 cm in the western and eastern parts, respectively. Between 1955 and 2019, a statistically significant increase of 1.6 cm/decade in sea level along the southern coast was recorded. The differences in average sea levels between the stations in the Gulf of Gdańsk and the west coast are mainly due to the hydrological situation being shaped by the inflowing waters of the Vistula River. The lowest sea level change per decade was recorded in Hel (1.1 cm) and Gdynia (1.4 cm); in Gdańsk, it was 1.9 cm. The west coast had a value of 1.7 cm/decade. The highest increase, amounting to 2 cm/decade, occurred at the station in Władysławowo. The analysis of the frequency of average daily sea levels in 10 cm intervals from 440 to 640 cm at two stations, Kołobrzeg and Władysławowo, showed that the frequency distributions were relatively stable until the end of the 1980s, with the most common range being 500–510. Since the 1990s, there has been a clear shift towards levels 510–530, especially in the last two years.
The analysis of the average sea level calculated for individual months based on data from all stations in the period 1955–2019 showed that values characterising the months from July to December and January were in the range of 507–510 cm, while the lowest average values of 495 cm occurred in the months from March to May. The most intense sea level change from 1955 to 2019 occurred in March (3.1 cm) and January (2.5 cm). In February, April, May, and June, the decadal sea level change remained in the range of 1.6–2.1 cm, while from July to December, it was at the level of 0.8–1.3 cm.
In the same period, a statistically significant increase in the average annual water temperature and air temperature was recorded. Statistical correlation analyses using Spearman’s rank method, aimed at demonstrating the convergence of changes in the average annual values of sea level with the temperature of water and air, showed a weak but statistically significant relationship (p < 0.05).
Our research has shown an increase in the frequency of storms in individual decades of 1950–2020, with the highest frequency in the winter months from November to January. This is concurrent with the significant statistical trend of the Baltic Sea filling parameter increase. Since 2010, the number of days with ice has decreased. In recent years, ice phenomena have occurred mainly in the Vistula Lagoon, the Szczecin Lagoon, the Bay of Puck, and occasionally the Pomeranian Bay in the Polish coastal zone. No ice has been observed in the coastal zone of the open sea since the winter of 2010/11.
Regarding wave conditions, there was no clear trend in the regime during the period covered by the analysis of 1980–2021. There were no trends in the case of annual average values of significant wave height; only a slightly statistically significant downward trend was observed in the case of monthly average maximum values. However, some periods of wave conditions intensification were distinguished, which are connected to the commonly used division into storm and non-storm seasons. The highest significant wave heights are characteristic of the open sea basins: Bornholm and Eastern Gotland, where the average annual values reached 2 m.

Author Contributions

Conceptualisation, T.Z., B.K., K.K. and P.S.; methodology, T.Z., B.K., K.K. and P.S.; validation, T.Z., B.K., K.K. and P.S.; formal analysis, T.Z., B.K., K.K. and P.S.; investigation, T.Z., B.K., K.K. and P.S.; data curation, T.Z., B.K., K.K. and P.S.; writing—original draft preparation, T.Z., B.K., K.K. and P.S.; writing—review and editing, T.Z., B.K., K.K. and P.S.; visualisation, T.Z., B.K., K.K. and P.S. All authors have read and agreed to the published version of the manuscript.

Funding

This research received no external funding.

Data Availability Statement

Data are contained within the article.

Conflicts of Interest

The authors declare no conflicts of interest.

References

  1. Wills, R.C.J.; Armour, K.C.; Battisti, D.S.; Hartmann, D.L. Ocean–Atmosphere Dynamical Coupling Fundamental to the Atlantic Multidecadal Oscillation. J. Clim. 2018, 32, 251–272. [Google Scholar] [CrossRef]
  2. Lehmann, A.; Krauss, W.; Hinrichsen, H.-H. Effects of remote and local atmospheric forcing on circulation and upwelling in the Baltic Sea. Tellus A Dyn. Meteorol. Oceanogr. 2002, 54, 299–316. [Google Scholar] [CrossRef]
  3. Meier, H.E.M.; Kauker, F. Modeling decadal variability of the Baltic Sea: 2. Role of freshwater inflow and large-scale atmospheric circulation for salinity. J. Geophys. Res. Oceans 2003, 108, 3368. [Google Scholar] [CrossRef]
  4. Andersson, H.C. Influence of long-term regional and large-scale atmospheric circulation on the Baltic sea level. Tellus A Dyn. Meteorol. Oceanogr. 2002, 54, 76. [Google Scholar] [CrossRef]
  5. Johansson, M.; Boman, H.; Kahma, K.K.; Launiainen, J. Trends in sea level variability in the Baltic Sea. Boreal Environ. Res. 2001, 6, 159–180. [Google Scholar]
  6. Dailidienė, I.; Davulienė, L.; Tilickis, B.; Stankevičius, A.; Myrberg, K. Sea level variability at the Lithuanian coast of the Baltic Sea. Boreal Environ. Res. 2006, 11, 109–121. [Google Scholar]
  7. Karabil, S.; Zorita, E.; Hünicke, B. Contribution of atmospheric circulation to recent off-shore sea-level variations in the Baltic Sea and the North Sea. Earth Syst. Dyn. 2018, 9, 69–90. [Google Scholar] [CrossRef]
  8. Bastos, A.; Trigo, R.M.; Barbosa, S.M. Discrete wavelet analysis of the influence of the North Atlantic Oscillation on Baltic Sea level. Tellus A Dyn. Meteorol. Oceanogr. 2013, 65, 20077. [Google Scholar] [CrossRef]
  9. Suursaar, Ü.; Sooäär, J. Decadal variations in mean and extreme sea level values along the Estonian coast of the Baltic Sea. Tellus A Dyn. Meteorol. Oceanogr. 2007, 59, 249–260. [Google Scholar] [CrossRef]
  10. Stramska, M.; Chudziak, N. Recent multiyear trends in the Baltic Sea level. Oceanologia 2013, 55, 319–337. [Google Scholar] [CrossRef]
  11. Wolski, T.; Wiśniewski, B. Characteristics of seasonal changes of the Baltic Sea extreme sea levels. Oceanologia 2023, 65, 151–170. [Google Scholar] [CrossRef]
  12. Różyński, G. Long-term evolution of Baltic Sea wave climate near a coastal segment in Poland; its drivers and impacts. Ocean Eng. 2010, 37, 186–199. [Google Scholar] [CrossRef]
  13. Różyński, G. Wave climate in the Gulf of Gdańsk vs. open Baltic Sea near Lubiatowo, Poland. Arch. Hydro-Eng. Environ. Mech. 2010, 57, 167–176. [Google Scholar]
  14. Myslenkov, S.; Medvedeva, A.; Arkhipkin, V.; Markina, M.; Surkova, G.; Krylov, A.; Dobrolyubov, S.; Zilitinkevich, S.; Koltermann, P. Long-term statistics of storms in the Baltic, Barents and White seas and their future climate projections. Geogr. Environ. Sustain. 2018, 11, 93–112. [Google Scholar] [CrossRef]
  15. Surkova, G.V.; Arkhipkin, V.S.; Kislov, A.V. Atmospheric circulation and storm events in the Baltic Sea. Open Geosci. 2015, 7, 20150030. [Google Scholar] [CrossRef]
  16. Girjatowicz, J.P.; Łabuz, T.A. Forms of piled ice at the southern coast of the Baltic Sea. Estuar. Coast. Shelf Sci. 2020, 239, 106746. [Google Scholar] [CrossRef]
  17. Zalewska, T.; Wilman, B.; Łapeta, B.; Marosz, M.; Biernacik, D.; Wochna, A.; Saniewski, M.; Grajewska, A.; Iwaniak, M. Seawater temperature changes in the southern Baltic Sea (1959–2019) forced by climate change. Oceanologia 2024, 66, 37–55. [Google Scholar] [CrossRef]
  18. Haapala, J.; Meier, H.E.M.; Rinne, J. Numerical investigations of future ice conditions in the Baltic Sea. AMBIO 2001, 30, 237–244. [Google Scholar] [CrossRef]
  19. Meier, H.E.M. Regional ocean climate simulations with a 3D ice–ocean model for the Baltic Sea. Part 2: Results for sea ice 2001. Clim. Dyn. 2002, 19, 255–266. [Google Scholar] [CrossRef]
  20. Björkqvist, J.-V.; Särkkä, J.; Kanarik, H.; Tuomi, L. Wave Climate Change in the Gulf of Bothnia. In Proceedings of the EGU General Assembly Conference Abstracts, Online, 19–30 April 2021; p. EGU21–9808. [Google Scholar]
  21. Granskog, M.; Kaartokallio, H.; Kuosa, H.; Thomas, D.N.; Vainio, J. Sea ice in the Baltic Sea—A review. Estuar. Coast. Shelf Sci. 2006, 70, 145–160. [Google Scholar] [CrossRef]
  22. Grinsted, A. Projected Change—Sea Level In: Second Assessment of Climate Change for the Baltic Sea Basin; BACC II Author Team, Ed.; Regional Climate Studies; Springer: Cham, Switzerland, 2015; pp. 253–263. [Google Scholar] [CrossRef]
  23. Neumann, G. Eigenschwingungen der Ostsee. Arch. Dtsch. Seewarte Mar. 1941, 61, 249–260. [Google Scholar]
  24. Wübber, C.; Krauss, W. The two-dimensional seiches of the Baltic Sea. Oceanol. Acta 1979, 2, 435–446. [Google Scholar]
  25. Matthäus, W.; Franck, H. Characteristics of major Baltic inflows—A statistical analysis. Cont. Shelf Res. 1992, 12, 1375–1400. [Google Scholar] [CrossRef]
  26. Wolski, T.; Wiśniewski, B.; Giza, A.; Kowalewska-Kalkowska, H.; Boman, H.; Grabbi-Kaiv, S.; Hammarklint, T.; Holfort, J.; Lydeikaitė, Ž. Extreme sea levels at selected stations on the Baltic Sea coast. Oceanologia 2014, 56, 259–290. [Google Scholar] [CrossRef]
  27. Girjatowicz, J.P.; Kożuchowski, K. Contemporary changes of Baltic Sea ice. Geogr. Pol. 1995, 65, 43–50. [Google Scholar]
  28. Leppäranta, M. Land-ice interaction in the Baltic Sea. Est. J. Earth Sci. 2013, 62, 2–14. [Google Scholar] [CrossRef]
  29. Wolski, T.; Wiśniewski, B. Geographical diversity in the occurrence of extreme sea levels on the coasts of the Baltic Sea. J. Sea Res. 2020, 159, 101890. [Google Scholar] [CrossRef]
  30. Majewski, A.; Dziadziuszko, Z.; Wiśniewska, A. Ogólna charakterystyka powodzi sztormowych u polskiego wybrzeża Bałtyku. In Monografia Powodzi Sztormowych 1951–1975; WKiŁ: Warszawa, Poland, 1983. [Google Scholar]
  31. Sztobryn, M.; Kowalska, B.; Letkiewicz, B. Maksymalne Wysokie Poziomy Morza na Bałtyku w Zachodniej Części Polskiego Wybrzeża; Polskie Towarzystwo Geofizyczne, IMGW: Warszawa, Poland, 2005; pp. 447–455. [Google Scholar]
  32. Wolski, T.; Wiśniewski, B. Characteristics and long-term variability of occurrences of Storm surges in the Baltic Sea. Atmosphere 2021, 12, 1679. [Google Scholar] [CrossRef]
  33. Sztobryn, M.; Stigge, H.-J.; Wielbińska, D.; Weidig, B.; Stanisławczyk, I.; Kańska, A.; Krzysztofik, K.; Kowalska, B.; Letkiewicz, B.; Mykita, M. Storm Surges in the Southern Baltic Sea (Western and Central Parts); Sztobryn, M., Stigge, H.-J., Eds.; Bundesamt für Seeschifffahrt und Hydrographie: Hamburg, Germany, 2005. [Google Scholar]
  34. IMGW. 2019. Bulletin the South Baltic Monitoring of Selected Meteorological and Oceanographical Elements in the Polish Coastal Zone, Issue: January 2019. Available online: https://klimat.imgw.pl/pl/biuletyn-baltyk/ (accessed on 16 December 2024).
  35. Sulisz, W.; Paprota, M.; Reda, A. Extreme waves in the southern Baltic Sea. Cienc. Mar. 2016, 42, 123–137. [Google Scholar] [CrossRef]
  36. Soomere, T.; Räämet, A. Spatial patterns of the wave climate in the Baltic Proper and the Gulf of Finland. Oceanologia 2011, 53, 335–371. [Google Scholar] [CrossRef]
  37. Kudryavtseva, N.; Soomere, T. Satellite altimetry reveals spatial patterns of variations in the Baltic Sea wave climate. Earth Syst. Dynam. 2012, 8, 697–706. [Google Scholar] [CrossRef]
  38. Groll, N.; Grabemann, I.; Hünicke, B.; Meese, M. Baltic Sea wave conditions under climate change scenarios. Boreal Environ. Res. 2017, 22, 1–12. [Google Scholar]
  39. Ruosteenoja, K.; Vihma, T.; Venäläinen, A. Projected Changes in European and North Atlantic Seasonal Wind Climate Derived from CMIP5 Simulations. J. Clim. 2019, 32, 6467–6490. [Google Scholar] [CrossRef]
  40. CMEMS (E.U. Copernicus Marine Service Information) Marine Data Store. Baltic Sea Wave Hindcast. Available online: https://doi.org/10.48670/moi-00014 (accessed on 16 December 2024).
  41. CMEMS (E.U. Copernicus Marine Service Information) Marine Data Store. Baltic Sea Physics Reanalysis. Available online: https://doi.org/10.48670/moi-00013 (accessed on 16 December 2024).
  42. Case Studies Worldwide. In Coastal Risk Management in a Changing Climate; Zanuttigh, B., Nicholls, R., Vanderlinden, J.P., Burcharth, H.F., Thompson, R.C., Eds.; Elsevier: Amsterdam, The Netherlands, 2015; ISBN 978-0-12-397310-8. [Google Scholar]
  43. Männikus, R.; Soomere, T.; Viška, M. Variations in the mean, seasonal and extreme water level on the Latvian coast, the eastern Baltic Sea, during 1961–2018. Estuar. Coast. Shelf Sci. 2020, 245, 106827. [Google Scholar] [CrossRef]
  44. Sztobryn, M.; Kańska, A.; Krzysztofik, A.; Kowalska, B. Types of Storm Surges at the Polish Coast 1951–1990: Water Gauge Świnoujście. In Proceedings of the Baltex Conference, Visby, Sweden, 28 August–1 September 1995. [Google Scholar]
  45. Sztobryn, M.; Wójcik, R.; Miętus, M. Występowanie zlodzenia na Bałtyku—Stan obecny i spodziewane zmiany w przyszłości. In Warunki Klimatyczne i Oceanograficzne w Polsce i na Bałtyku Południowym. Spodziewane Zmiany i Wytyczne do Opracowania Strategii Adaptacyjnych w Gospodarce Krajowej; Wibig, J., Jakusik, E., Eds.; IMGW PIB: Warszawa, Poland, 2012; pp. 189–215. [Google Scholar]
  46. Sztobryn, M. Long-term Changes in Ice Conditions at the Polish Coast of the Baltic Sea. In Proceedings of the 12th International Symposium on Ice, Trondheim, Norway, 23–26 August 1994; pp. 345–354. [Google Scholar]
  47. Sztobryn, M.; Stanisławczyk, I. Changes of sea ice climate during the XX century—Polish coastal Walters. In Proceedings of the Fourth Workshop on the Baltic Sea Ice Climate, Norrköping, Sweden, 22–24 May 2002. [Google Scholar]
  48. Sztobryn, M.; Przygrodzki, P. Climatological Ice Atlas for the Western and Southern Baltic Sea (1961–2010); Schmelzer, N., Holfort, J., Eds.; Bundesamt für Seeschifffahrt und Hydrographie: Hamburg, Germany, 2012; pp. 1–88. [Google Scholar]
  49. Medvedeva, A.; Myslenkov, S.; Arkhipkin, V. The Connection of Storms and Significant Wave Heights in the Baltic Sea with Indices of Large-Scale Atmospheric Circulation (NAO, AO, SCAND). In The Baltic Sea in Transition, Proceedings of the 2nd Baltic Earth Conference, Helsingør, Denmark, 11–15 June 2018; International Baltic Earth Secretariat Publications: Geesthacht, Germany, 2018; pp. 95–96. [Google Scholar]
  50. Miętus, M.; Von Storch, H. Reconstruction of the Wave Climate in the Proper Baltic Basin, April 1947–March 1988; 97/E/28; GKSS Research Centre: Geesthacht, Germany, 1997; pp. 1–30. [Google Scholar]
  51. Soomere, T. Numerical simulations of wave climate in the Baltic Sea: A review. Oceanologia 2022, 65, 117–140. [Google Scholar] [CrossRef]
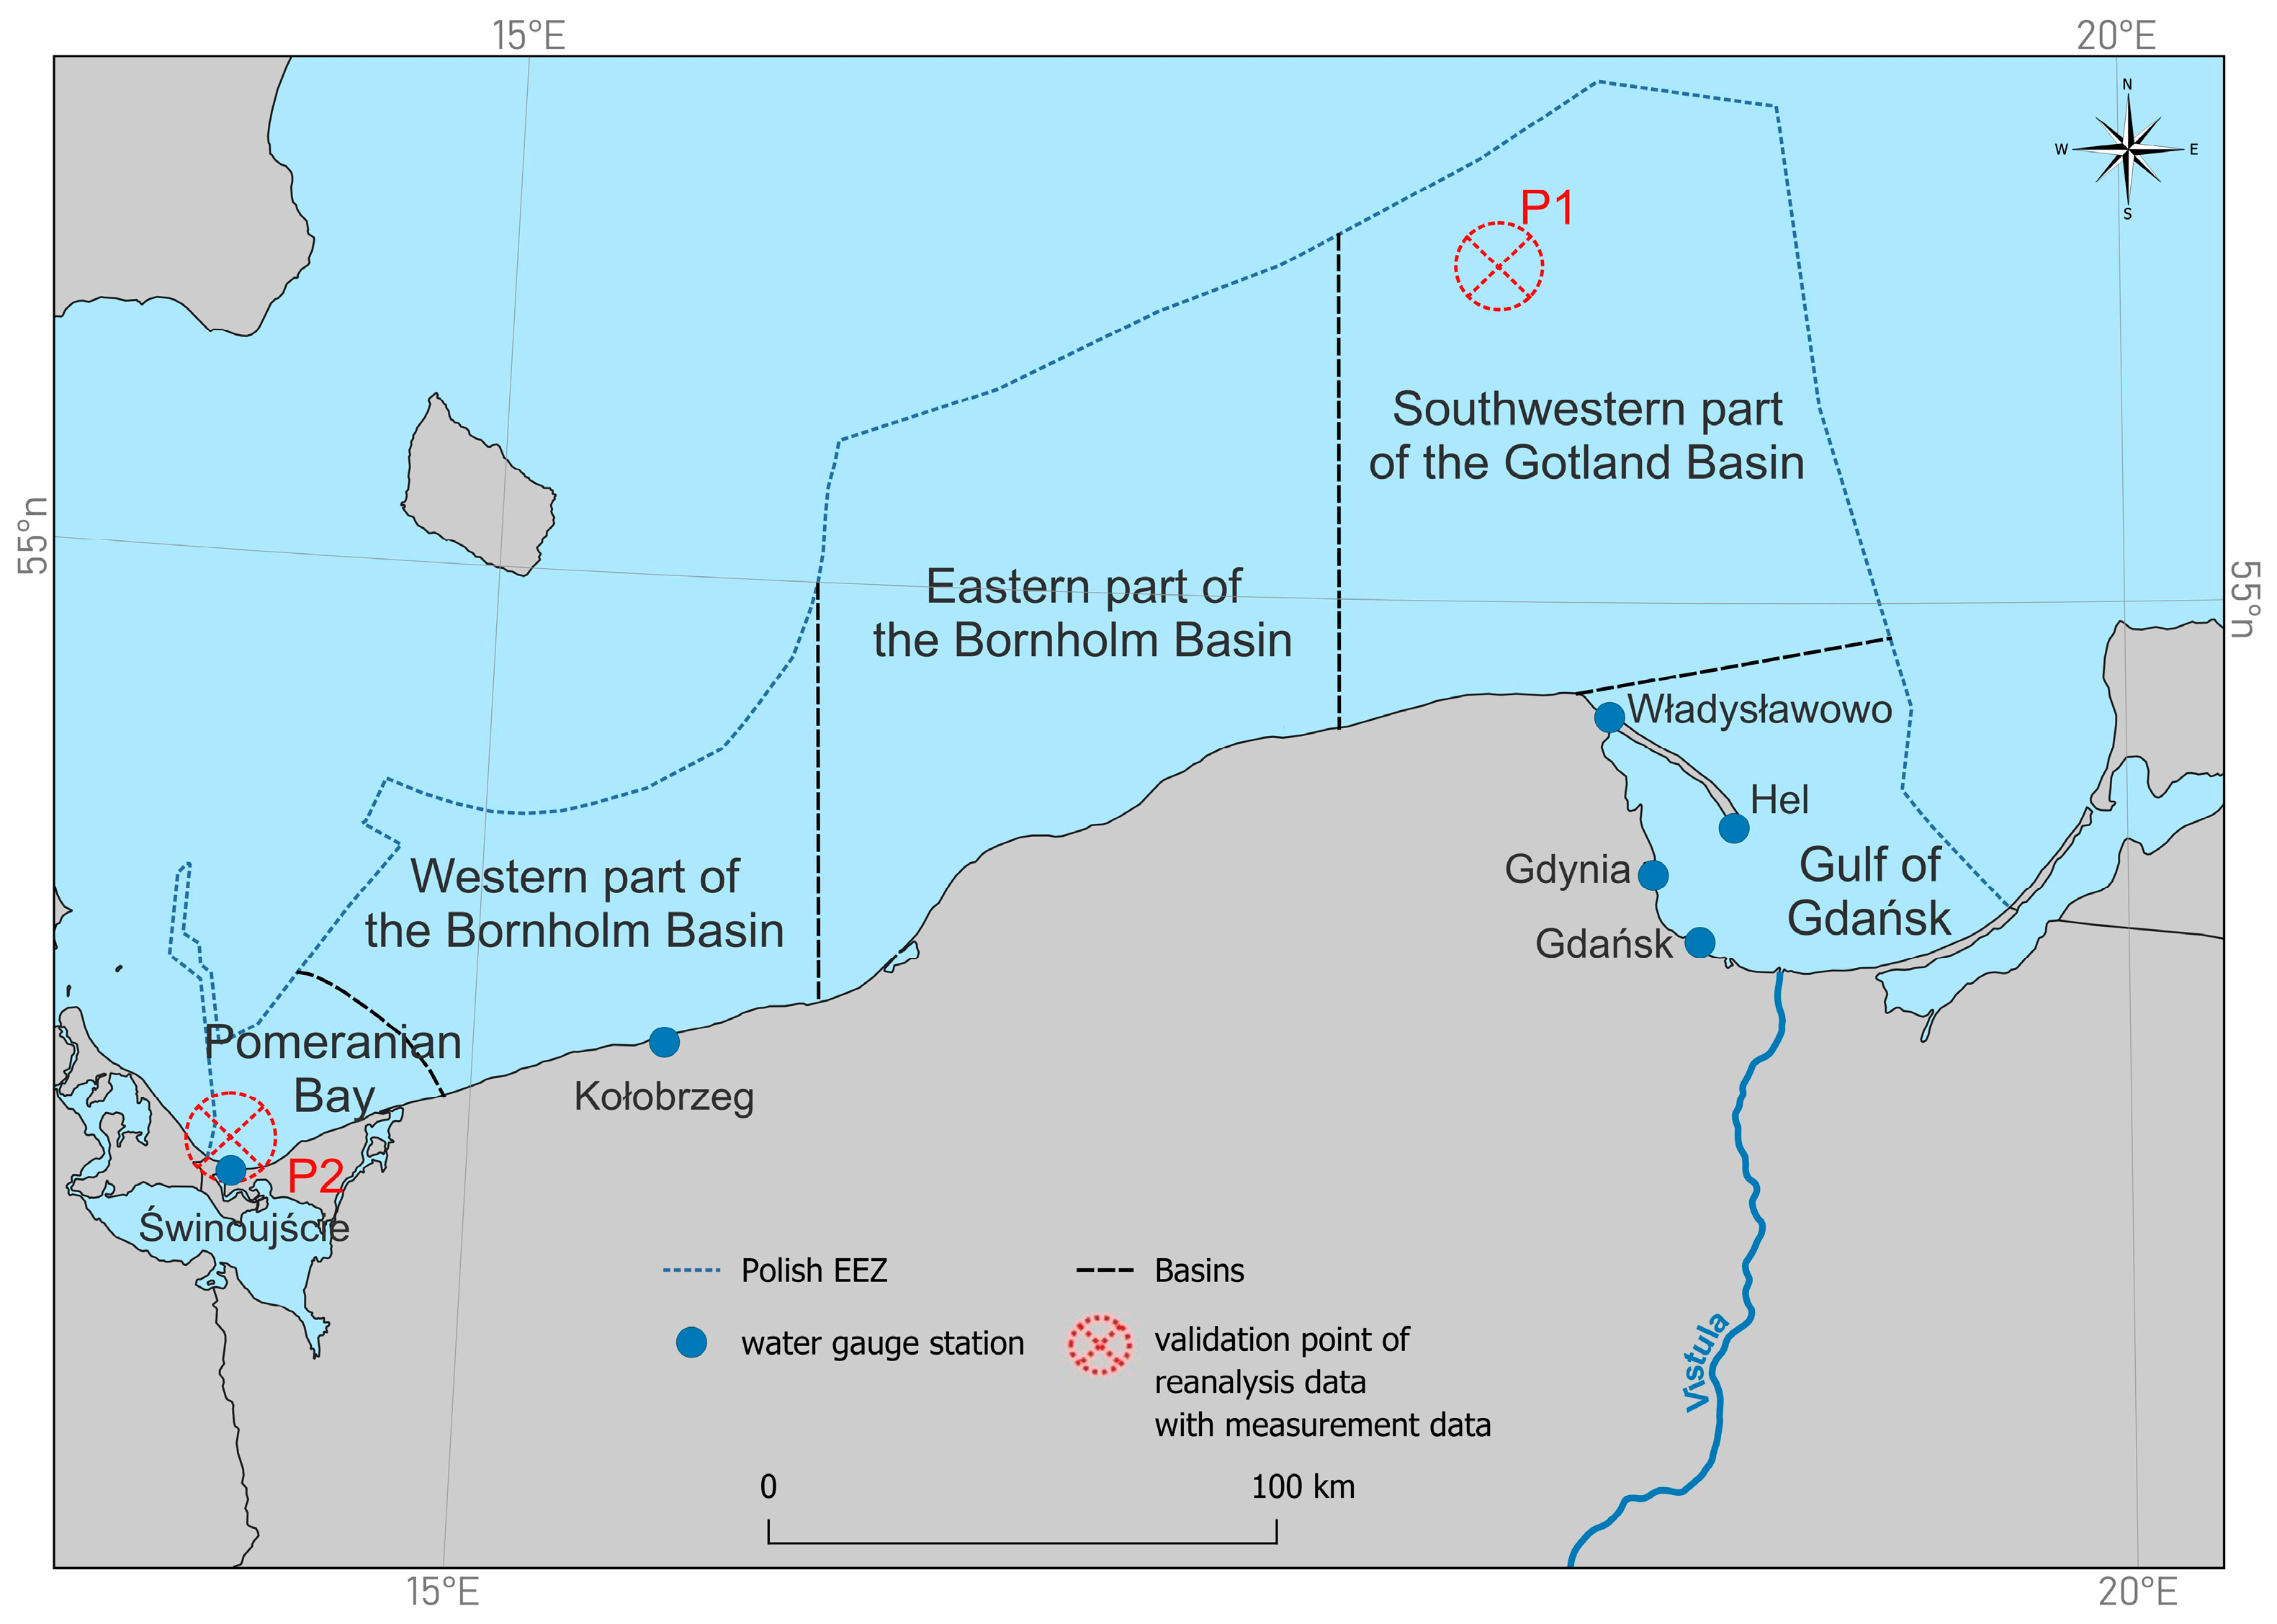
Figure 1. Location of water gauge stations and wave data validation points, including division into basins and sub-basins (modified and based on HELCOM, 2022).
Water 17 00680 g001
Figure 2. Sea level at stations in Świnoujście and Gdańsk in the years 1886–2019.
Water 17 00680 g002
Figure 3. Characteristics of sea level changes at sea stations divided into east and west coasts expressed in the value of the annual average (red dot), maximum, and minimum values determined on the basis of daily values (whiskers), minimum values measured in a given year (green diamonds), and maximum values measured in a given year (blue diamonds).
Water 17 00680 g003
Figure 4. Distributions of yearly mean sea level at stations in 1955–2019.
Water 17 00680 g004
Figure 5. Annual frequency of sea levels in ranges (%) in Kołobrzeg and Władysławowo in 1955–2019.
Water 17 00680 g005
Figure 6. Average (circle), maximum, and minimum (whiskers) sea levels by month determined from data for all stations in the period 1955–2019.
Water 17 00680 g006
Figure 7. Decade-by-station sea level changes based on annual averages and trend coefficients based on the maximum (extreme) values in a given year (a) and decadal change in sea level by month based on average values (b).
Water 17 00680 g007
Figure 8. Mean sea level (MSL), surface seawater temperature (SST), and air temperature (Tair) in 1955–2019 at the coast of the southern Baltic.
Water 17 00680 g008
Figure 9. Daily reference sea level value in 1951–2019 (red line—trend) and frequency of occurrence in four periods.
Water 17 00680 g009
Figure 10. Storm surges, number of cases in Świnoujście 1950–2020 (a), frequency in months in Świnoujście 1950–2020 (b), number of cases at the west and east coast in 1980–2020 (c).
Water 17 00680 g010
Figure 11. Number of days with ice.
Water 17 00680 g011
Figure 12. Annual, minimum, and maximum average monthly significant wave heights in the southern Baltic Sea in 1980–2021.
Water 17 00680 g012
Table 1. Spearman’s rank correlation coefficients between a yearly mean sea level and seawater and air temperatures measured at the same stations (r value: p < 0.05) (red colour—statistically significant correlation).
Sea Surface Temperature
(SST)
Air Temperature at 2 m
All stations0.5280.630
Gdańsk0.4650.559
Gdynia0.549
Hel0.5630.591
Kołobrzeg0.4330.687
Świnoujście0.3100.616
Władysławowo0.646
Table 2. Yearly averages of significant wave heights (Hs) and total storm durations (Tstorm) in the discriminated basins of the southern Baltic Sea in 1980–2021.
BasinWestern Part of the Bornholm BasinSouthwestern Part of the Gotland BasinEastern Part of the Bornholm BasinGulf of GdańskPomeranian Bay
Water 17 00680 i001Water 17 00680 i002Water 17 00680 i003Water 17 00680 i004Water 17 00680 i005
Hs [m]TSTORM [h]Hs [m]TSTORM [h]Hs [m]TSTORM [h]Hs [m]TSTORM [h]Hs [m]TSTORM [h]
19801.14321.66541.77051.2870.833
19811.32311.74651.83930.9720.76
19821.05821.410111.410110.91710.618
19831.33481.74411.75820.7330.70
19840.93151.34981.25370.8690.624
19851.12701.25461.36090.8840.627
19861.12461.35311.44500.7330.712
19871.32311.36391.46601.21410.721
19881.33061.77591.37771.01080.812
19891.14171.58461.18820.7300.79
19901.22401.35491.55880.7240.60
19910.93541.26571.16511.0930.59
19921.03811.56661.27950.9900.615
19931.23511.76031.76720.6360.70
19940.94861.16571.28550.9660.557
19951.22731.23691.35220.7270.815
19961.22581.15191.24890.9690.721
19971.12851.35251.26691.0360.70
19980.92611.55371.15311.0660.615
19991.22432.03812.14650.8570.718
20001.33241.25941.35730.81080.70
20011.13481.34621.35820.9420.621
20021.22761.65521.55910.91170.86
20031.12761.35281.35761.0570.715
20041.32521.54291.44560.7150.70
20051.11321.53061.53510.8330.515
20061.14171.26571.27170.9720.712
20071.13841.76751.57620.8720.712
20081.02461.43571.33691.0480.627
20091.24261.53691.56570.6120.76
20101.12821.06481.26211.0420.63
20111.02641.64921.44560.9330.63
20120.92611.23901.24740.8600.624
20131.52251.22701.74050.7300.73
20141.13421.36061.26660.9870.76
20151.22611.75131.55700.8690.618
20161.23661.25401.46600.9870.73
20171.12701.33631.34380.9240.60
20181.02491.34291.15041.1540.63
20190.94141.65491.26061.1780.63
20200.93421.76061.36660.9870.66
20211.23141.75461.56140.9770.65
Table 3. Monthly averages of significant wave heights and sea levels in the discriminated basins of the southern Baltic Sea in 1980–2021.
BasinWestern Part of the Bornholm BasinSouthwestern Part of the Gotland BasinEastern Part of the Bornholm BasinGulf of GdańskPomeranian Bay
Water 17 00680 i006Water 17 00680 i007Water 17 00680 i008Water 17 00680 i009Water 17 00680 i010
Hs [m]Sea Level [m]Hs [m]Sea Level [m]Hs [m]Sea Level [m]Hs [m]Sea Level [m]Hs [m]Sea Level [m]
I1.240.0121.410.0441.540.0370.730.0500.66−0.020
II1.22−0.0181.390.0121.520.0060.680.0180.59−0.036
III0.88−0.0651.11−0.0421.21−0.0540.66−0.0240.53−0.059
IV0.72−0.0580.66−0.0520.86−0.0640.51−0.0460.45−0.075
V0.68−0.0690.59−0.0600.95−0.0550.50−0.0450.44−0.074
VI0.720.0310.520.0460.980.0360.500.0660.480.026
VII0.640.1150.460.1410.920.1200.540.1560.490.105
VIII0.850.0970.780.1141.220.1020.550.1220.580.085
IX1.100.0981.190.1081.760.1010.800.1270.610.078
X1.140.0691.430.0891.600.0840.850.0990.700.049
XI1.300.0511.570.0791.810.0830.900.9400.700.041
XII1.510.0461.760.0521.820.0460.950.7900.770.006
Table 4. Monthly averages of significant wave height for the southern Baltic Sea and the NAO index in the 1980–2021.
JanuaryFebruaryMarchAprilMayJuneJulyAugustSeptemberOctoberNovemberDecember
HsNAOHsNAOHsNAOHsNAOHsNAOHsNAOHsNAOHsNAOHsNAOHsNAOHsNAOHsNAO
19800.9−0.80.70.11.0−0.30.71.30.6−1.50.6−0.40.7−0.41.0−2.20.80.71.3−1.81.4−0.41.70.8
19811.40.41.30.90.9−1.20.70.40.50.20.7−0.50.60.10.80.40.5−1.51.2−1.41.9−0.41.20.0
19821.4−0.90.41.20.81.20.80.10.5−0.50.6−1.60.51.20.80.30.71.80.7−0.71.21.61.21.8
19832.11.61.1−0.50.71.00.7−0.90.5−0.10.61.00.71.20.61.61.1−1.11.60.71.4−1.01.30.3
19841.41.70.70.70.7−0.40.6−0.30.50.50.9−0.40.8−0.10.61.21.00.21.2−0.11.0−0.10.90.0
19851.2−1.61.6−0.50.70.20.70.30.6−0.50.6−0.80.61.20.6−0.51.3−0.50.90.91.3−0.71.10.2
19861.41.11.2−1.00.61.70.9−0.60.40.90.51.20.70.10.6−1.11.2−1.11.01.61.22.31.51.0
19871.6−1.20.7−0.71.20.10.62.00.61.00.5−1.80.70.50.7−0.81.0−1.20.70.10.90.21.30.3
19880.91.01.00.80.9−0.20.7−1.20.40.60.60.90.5−0.40.70.01.1−1.01.0−1.11.3−0.31.80.6
19891.31.21.32.00.91.90.70.30.51.40.5−0.30.81.00.90.00.62.11.20.01.10.21.3−1.2
19901.41.01.41.41.51.50.72.00.5−1.50.50.00.90.50.61.01.21.11.00.21.1−0.21.30.2
19911.20.91.21.00.6−0.20.60.30.80.10.7−0.80.6−0.50.81.20.80.51.0−0.21.10.51.50.5
19921.4−0.11.21.11.00.90.71.90.62.60.60.20.70.20.70.90.9−0.41.1−1.81.51.20.90.5
19931.91.61.20.51.10.70.61.00.5−0.80.8−0.60.9−3.20.80.10.9−0.60.8−0.70.92.61.41.6
19941.31.00.80.51.31.30.61.10.7−0.60.91.50.41.30.80.41.0−1.31.1−1.01.30.61.22.0
19951.50.91.51.11.21.31.1−0.90.7−1.50.60.10.6−0.20.80.71.10.30.80.21.2−1.40.9−1.7
19960.7−0.11.1−0.10.7−0.20.6−0.20.8−1.10.60.60.80.70.51.01.1−0.90.6−0.31.2−0.61.0−1.4
19970.7−0.51.51.71.01.51.1−1.00.7−0.30.6−1.50.60.30.40.81.20.61.4−1.70.7−0.90.9−1.0
19981.20.41.5−0.11.10.90.6−0.70.6−1.30.7−2.70.8−0.51.00.00.6−2.01.6−0.30.8−0.31.10.9
19991.00.81.30.30.60.20.8−1.00.50.90.41.10.6−0.90.70.40.50.41.20.21.00.71.61.6
20001.50.61.21.71.30.80.50.00.51.60.80.00.7−1.00.6−0.30.7−0.20.70.90.7−0.90.8−0.6
20010.70.31.20.50.8−1.30.70.00.70.00.6−0.20.5−0.30.8−0.10.8−0.70.9−0.21.60.61.3−0.8
20021.50.41.51.11.10.70.51.20.5−0.20.80.40.70.60.50.40.8−0.71.3−2.30.9−0.20.9−0.9
20031.20.20.60.60.60.30.9−0.20.40.00.8−0.10.50.10.9−0.10.70.01.2−1.30.70.91.40.6
20041.0−0.31.1−0.11.01.00.51.20.70.20.8−0.90.61.10.6−0.51.10.40.9−1.11.40.71.21.2
20051.61.51.2−0.11.0−1.80.6−0.30.4−1.30.7−0.10.6−0.50.80.40.60.60.8−1.01.0−0.31.2−0.4
20060.81.30.8−0.50.8−1.30.51.20.6−1.10.40.80.40.90.7−1.70.7−1.60.9−2.21.30.41.31.3
20072.10.21.1−0.50.91.40.80.20.50.70.7−1.30.9−0.60.7−0.11.00.70.80.51.30.61.00.3
20081.30.91.30.71.10.10.6−1.10.5−1.70.7−1.40.6−1.30.9−1.20.81.01.10.01.4−0.30.8−0.3
20091.00.01.00.10.80.60.4−0.20.71.70.9−1.20.6−2.20.7−0.20.91.51.3−1.01.00.00.8−1.9
20101.1−1.10.8−2.00.8−0.90.6−0.70.7−1.50.5−0.80.6−0.40.7−1.21.2−0.80.9−0.91.2−1.61.5−1.9
20110.9−0.91.30.70.90.60.82.50.6−0.10.6−1.30.7−1.50.8−1.40.90.51.00.40.81.41.52.5
20121.41.21.30.40.91.30.70.50.6−0.90.7−2.50.6−1.30.6−1.01.0−0.61.0−2.10.9−0.61.00.2
20131.10.40.9−0.51.1−1.60.60.70.50.60.60.50.70.70.61.00.80.20.9−1.31.10.91.41.0
20141.30.30.61.30.80.80.60.30.7−0.90.6−1.00.60.20.8−1.70.81.60.7−1.30.70.71.41.9
20151.41.80.91.30.91.50.90.70.70.20.6−0.10.9−3.20.6−0.80.8−0.70.80.41.31.71.42.2
20161.00.11.11.60.60.70.70.40.5−0.80.5−0.40.7−1.80.8−1.70.50.61.30.41.3−0.21.40.5
20171.10.51.01.00.80.70.91.70.7−1.90.90.10.71.30.7−1.10.9−0.61.40.21.10.01.40.9
20181.01.40.81.60.8−0.90.71.20.42.10.71.10.61.40.72.01.01.71.10.90.7−0.11.00.6
20191.30.61.00.31.11.20.70.50.8−2.60.5−1.10.9−1.40.5−1.21.1−0.20.9−1.40.80.31.21.2
20201.31.31.61.30.91.00.8−1.00.8−0.40.6−0.20.9−1.20.50.10.81.01.1−0.71.12.50.9−0.3
20211.1−1.11.00.10.90.70.9−1.40.6−1.20.40.80.60.00.9−0.30.8−0.21.0−2.31.1−0.21.20.3
R0.370.190.26−0.13−0.3−0.19−0.24−0.23−0.15−0.09−0.110.55
Note: The red color indicates a statistically significant relationship.
Disclaimer/Publisher’s Note: The statements, opinions and data contained in all publications are solely those of the individual author(s) and contributor(s) and not of MDPI and/or the editor(s). MDPI and/or the editor(s) disclaim responsibility for any injury to people or property resulting from any ideas, methods, instructions or products referred to in the content.