Article

Effectiveness of Eco-Engineering Structures to Promote Sediment Particles Retention in Estuarine Salt Marshes

by
Carlos Gonçalves
1,2,*,
Tiago Verdelhos
1,3,
Isabel Caçador
2,
Paulo J. Venda Oliveira
4,
Diana Marques
1 and
Helena Veríssimo
1,*
1
MARE—Marine and Environmental Sciences Centre/ARNET—Aquatic Research Network, Department of Life Sciences, University of Coimbra, Calçada Martim de Freitas, 3004-456 Coimbra, Portugal
2
MARE—Marine and Environmental Sciences Centre/ARNET—Aquatic Research Network, Department of Vegetal Biology, Faculty of Sciences, University of Lisbon, 1749-016 Lisbon, Portugal
3
CIVG—Vasco da Gama Research Center/EUVG—Vasco da Gama University School, 3020-210 Coimbra, Portugal
4
ISISE—Institute for Sustainability and Innovation in Structural Engineering, Department of Civil Engineering, University of Coimbra, 3030-788 Coimbra, Portugal
*
Authors to whom correspondence should be addressed.
Water 2025, 17(5), 678; https://doi.org/10.3390/w17050678
Submission received: 31 January 2025 / Revised: 21 February 2025 / Accepted: 23 February 2025 / Published: 26 February 2025
(This article belongs to the Section Water Erosion and Sediment Transport)

Abstract

:
Salt marshes, which provide vital ecosystem services and play a key role in coastal protection, require innovative restoration strategies to enhance their resilience to sea level rise (SLR) in the context of ongoing climate change. This study evaluated the effectiveness of various eco-engineering structures in promoting sediment accretion within a temperate estuary (Mondego estuary, Portugal). Five experimental cells were tested: (1) a control cell with bare soil, (2) a cell with autochthonous vegetation, (3) a cell with a wooden palisade, (4) a cell with geotextile fabric, and (5) a cell with geotextile bags filled with sand. Sediment accretion was measured seasonally from 2019 to 2022, and sedimentation rates and patterns were compared across the different structures. Environmental variables, including precipitation and tidal flow, were also monitored to assess their influence on sediment dynamics. Results indicated that eco-engineering structures enhanced sedimentation compared to the control. The highest accumulation was observed near the wooden palisades and geotextile bags, particularly in areas aligned with the river flow. This study underscores the potential of eco-engineering approaches to promote localized sediment stabilization and enhance marsh resilience. However, long-term monitoring and adaptive management are essential to address challenges associated with SLR and hydrodynamic variability. The findings provide valuable insights for designing effective and targeted restoration strategies in estuarine environments.

1. Introduction

Salt marshes are coastal wetlands that provide essential ecological and economic benefits, including carbon sequestration, water quality enhancement, habitat provision, and coastal defence [1,2,3]. These ecosystems act as natural barriers, mitigating the impacts of storms and reducing flood risks by attenuating wave energy and erosion, thereby playing a crucial role in coastal protection [2]. However, the sustainability of salt marshes habitats is being increasingly threatened by sea level rise (SLR), reduced sediment supply, and anthropogenic hydrological alterations [4,5,6,7]. In response to these challenges, innovative solutions, such as nature-based solutions (NbS) and eco-engineering approaches, are being developed to restore and protect these threated ecosystems [8,9]. One such strategy is sediment addition, which involves directly depositing sediment onto marsh surfaces to increase elevation and counteract the effects of SLR, thereby enhancing marsh resilience [10,11]. However, interventions like sediment nourishment or shoreline protection can disrupt natural processes. Integrating sediment dynamics data and models and overall ecosystem impacts into early planning ensures effective, long-term solutions, especially as marshes face ongoing threats from sea-level rise and storms [12]. Other methods leverage eco-engineering principles, which integrate natural processes and materials to promote sediment retention, stabilize marsh substrates, and foster vegetation growth. Creating and restoring ecosystems offers a more sustainable, cost-efficient, and environmentally beneficial alternative to traditional coastal engineering, as solutions like sea walls are becoming increasingly difficult to maintain in many areas [13].
Ecoengineering methods have gained attention for their ability to incorporate natural processes and materials to enhance salt marsh resilience. These interventions offer promising solutions to address the sediment deficits and hydrodynamic pressures that hinder salt marsh recovery, particularly in estuarine systems where sediment dynamics are influenced by tidal flows, riverine inputs, and climatic variability. For example, brushwood dams have been employed to stabilize sediment and support vegetation establishment, enabling marsh expansion into intertidal zones [14]. In addition, marsh terracing and hybrid engineering approaches have proven effective in creating new marsh habitats, increasing sediment accretion, and reducing wave energy [15,16]. Recent studies have also examined the combined use of bamboo pile fencing, vegetation planting, and sediment addition, with encouraging results for marsh restoration [17]. These methods illustrate the potential of combining natural and engineered solutions to address environmental challenges. By incorporating natural processes and materials, these methods aim to promote sediment accretion, stabilize soils, and foster the establishment of vegetation, thereby countering the erosive forces associated with rising sea levels. Despite their demonstrated potential, the effectiveness of specific eco-engineering structures in promoting sediment retention and accretion remains underexplored, particularly in temperate estuaries characterized by diverse environmental conditions. To address this knowledge gap, the present study evaluates the performance of different eco-engineering structures implemented in the Mondego Estuary (Portugal), as part of a restoration effort aimed at promoting sediment accretion and enhancing the resilience of salt marshes to sea level rise. The Mondego estuary has undergone significant environmental changes over recent decades due to anthropogenic pressures and climate change, making it an ideal site to test restoration strategies [18,19].
Five experimental cells were established to test the effectiveness of different eco-engineering interventions: (1) a control cell with bare soil, (2) a cell with autochthonous vegetation (species naturally occurring in the salt marsh area), (3) a cell with a wooden palisade, (4) a cell with geotextile fabric, and (5) a cell with geotextile bags filled with sand. These structures were designed to facilitate sediment deposition and accretion by altering hydrodynamic conditions and trapping suspended sediments. Sediment accretion was monitored seasonally from 2019 to 2022, alongside environmental variables such as precipitation and tidal flow, to assess the influence of hydrodynamic factors on sediment dynamics.
This study aims to advance the understanding of eco-engineering as a tool for salt marsh restoration and management. By comparing the performance of different structures, the research provides practical insights into their effectiveness in promoting localized sediment stabilization and enhancing marsh resilience to SLR. The findings have broader implications for the design and implementation of targeted restoration strategies in estuarine environments, offering a foundation for adaptive management approaches that address the challenges posed by climate change and human pressures.

2. Materials and Methods

2.1. Study Area

The present study was conducted in a salt marsh area within the Mondego Estuary, located on Portugal’s western coast (40°08′01.3″ N 8°48′05.8″ W). This estuary comprises two distinct arms that split about 7 km from the sea, forming an island (Murraceira), before converging again near the estuarine mouth. The North arm is deeper and regularly dredged to support port operations for large vessels, while the South arm is shallower and experiences minimal navigational disturbances. Spanning an area of 9 km2, the estuary encompasses a diversity of habitats, including salt marshes dominated by halophytic vegetation, mudflats that support diverse macroinvertebrate communities, and seagrass beds of Zostera noltei. These habitats play a crucial role as nursery grounds for commercially important fish species and wildlife, and they provide vital feeding areas for migratory birds [20].
The estuary experiences a semidiurnal tidal regime, with tidal ranges varying between 0.35 and 3.3 m. The mean residence time of freshwater discharge differs between the two arms, averaging 2 days in the North arm and 9 days in the South arm [21]. These hydrodynamic attributes significantly influence sediment transport and deposition, which are primarily driven by tidal currents that flow from upstream areas toward the Atlantic Ocean.

2.2. Experimental Setup

This study explores the potential of eco-engineering structures to enhance salt marsh restoration by examining sedimentation dynamics across five experimental cells. Each cell was designed with an internal front perimeter measuring approximately 8 m and 4 m on each side. The internal areas varied slightly depending on the material and structural setup.
The control cell (C1) consisted of a bare-bottom area devoid of vegetation or structures, and served as a baseline reference, covering approximately 32 m2. In contrast, the Plants cell (C2) featured naturally occurring vegetation dominated by Bolboschoenus maritimus, also spanning around 32 m2. The wooden palisade cell (C3) was constructed using 230 treated wooden stakes, each 1.5 m in height and 6 cm in diameter, arranged in a fence-like structure. This cell covered a slightly smaller area of 27 m2, with the stakes strategically positioned to disrupt hydrodynamic forces and promote sediment trapping. The geotextile fabric cell (C4) incorporated a nonwoven geotextile fabric (Naue Secutex® R 2004, Espelkamp, Germany) secured to 17 evenly spaced wooden stakes using nails and small wooden boards. This configuration, designed to facilitate sediment deposition, covered approximately 28 m2. Finally, the geotextile bags cell (C5) consisted of 42 geotextile Secutex Soft Rock R601 (Espelkamp, Germany) sandbags, each with a volume of 1 m3. These sandbags were made of needle-punched nonwoven geotextile with a roughened surface to enhance sediment embedding over time, creating a protective layer. The cell spanned an area of 27 m2. All experimental cells were arranged in a linear formation parallel to the North arm of the main river channel. This alignment ensured that water and sediment flow followed the natural hydrodynamic regime of the estuary, optimizing conditions for sediment capture and retention. This strategic placement aimed to maximize the efficiency of the eco-engineering structures in supporting sedimentation and promoting the resilience of salt marsh habitat (Figure 1).
The installation of the geotextile bags took place in August 2019. Sand was delivered to a road approximately 70 m from the installation site, and the bags were filled using a bulk bagger. Each bag was loaded one at a time with a backhoe, then securely sealed. Once filled, the bags were transported to a higher area adjacent to the road before being carefully moved across the muddy sediment to the salt marsh site. This part of the process presented a significant challenge due to the difficult terrain. To overcome this, the bags were placed using a combination of an excavator and a telescopic crane, ensuring they were positioned correctly to form the experimental cell.
The installation of the geotextile fabric cell also occurred in August 2019. For this process, 40.6 m2 strips of Naue Secutex ® R 2004 nonwoven geotextile fabric was secured to 17 evenly spaced treated wooden stakes. The fabric was firmly attached using nails and small wooden boards to ensure stability and prevent displacement by tidal movements.
In September 2019, the construction of the wooden palisade cell began. A total of 230 treated wood stakes, each measuring 1.5 m in height, were manually driven into place using a pile driver. This process ensured that the stakes were securely anchored, forming a sturdy barrier to capture and retain sediment.
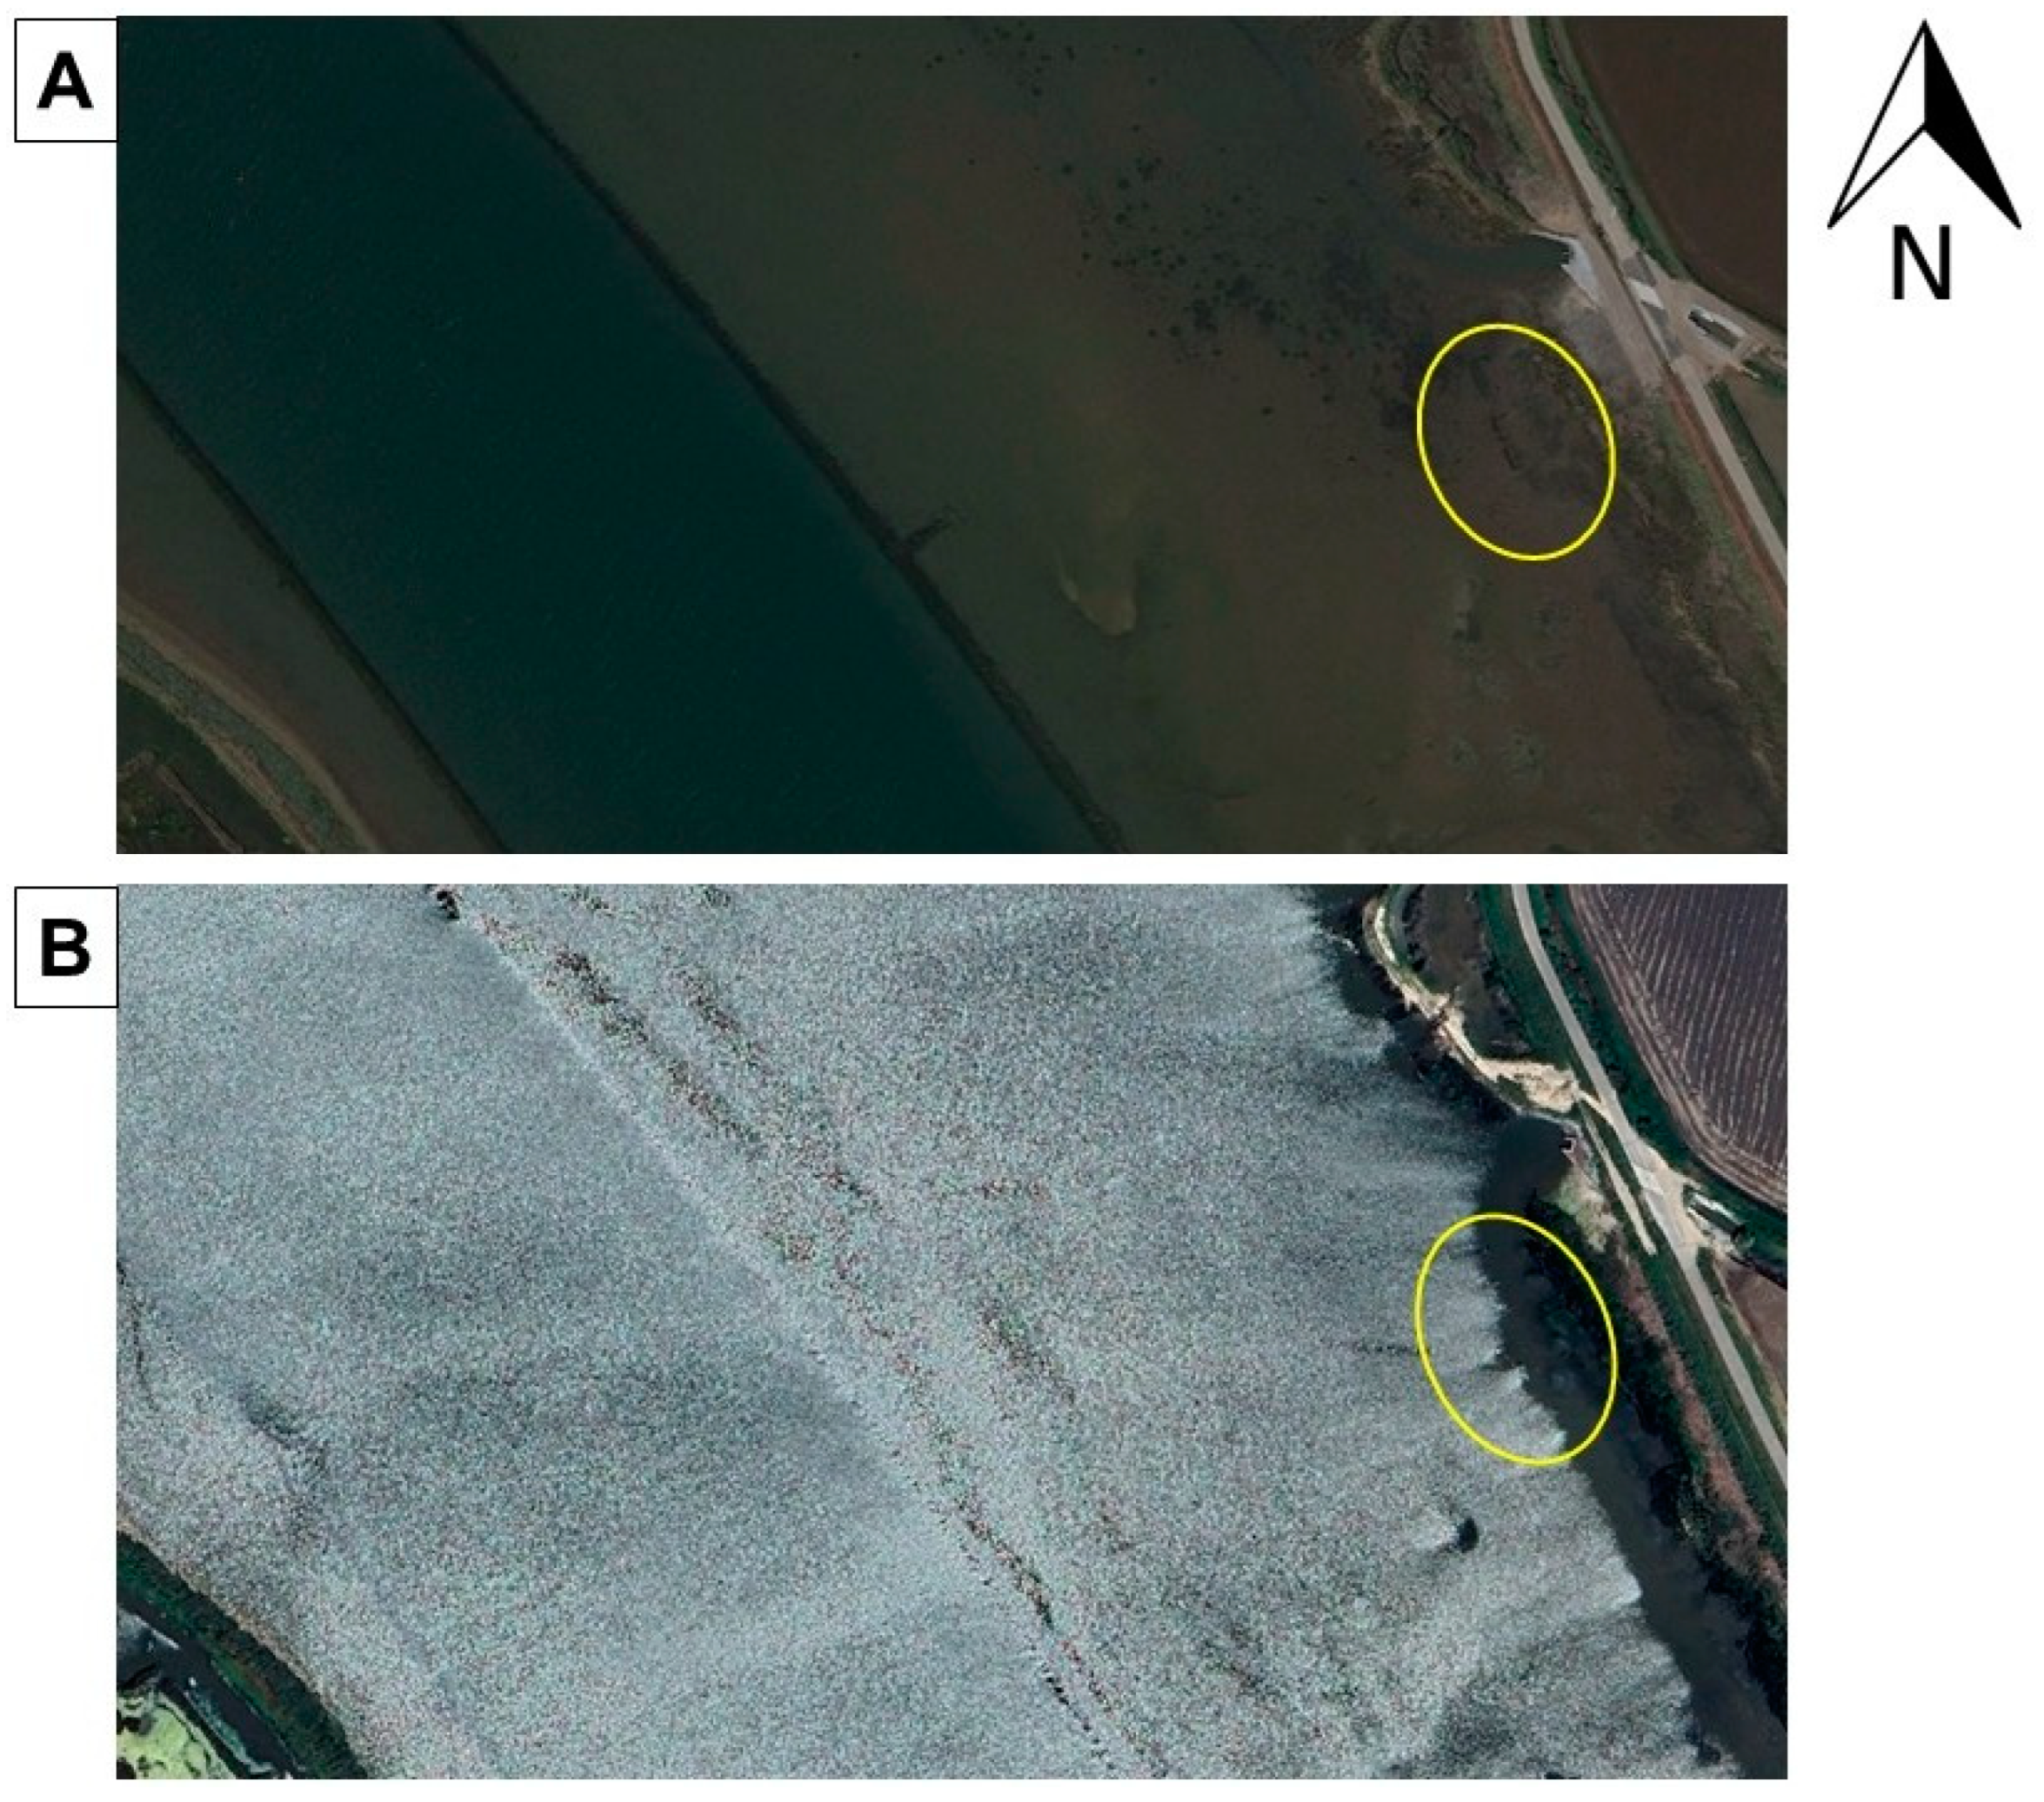
The experimental cells were submerged during high tide, allowing water and suspended sediment to flow into the cells (Figure 2). As the tide receded, sediment was deposited within the cells. The permeable design of the structures facilitated water flow, while sediment retention occurred through various mechanisms: gaps in the wooden palisade (C3), spaces between the geotextile sandbags (C5), and filtration through the geotextile fabric (C4). All cells, except for the Plants cell (C2), remained free of vegetation, although occasional macroalgae species such as Gracilaria sp., Fucus sp., and Ulva sp. were observed sporadically.
Table 1 summarizes the costs associated with materials, number of workers required, installation time, and maintenance efforts for each experimental cell. The geotextile sandbags required the highest financial investment (EUR 12,000) and were the most labour-intensive to install, involving five workers over the course of six hours. In contrast, the geotextile fabric and wooden palisades cells were more cost-effective (EUR 4000 and EUR 1000, respectively), though they still required several workers and hours for installation. The plants and control cells incurred the lowest costs, primarily related to the materials for the stake’s measurements, tiles, and a few tools (EUR 25 each), with minimal time and labour needs. Maintenance requirements varied across the cells. The geotextile fabric required frequent interventions (mainly to repair the fabric or add additional stakes to stabilize the structure). In contrast, the geotextile sandbags and wooden palisades required little to no maintenance. This comparison highlights the trade-offs between cost, effort, and long-term sustainability, offering valuable insights for assessing the feasibility of large-scale implementation.

2.3. Monthly Monitoring: Sedimentation and Environmental Data

To evaluate the performance of the experimental cells in promoting sedimentation and to monitor environmental conditions, monthly data were collected from each cell, along with relevant environmental parameters from October 2019 to December 2022.
Sedimentation was monitored using two complementary methods:
(a)
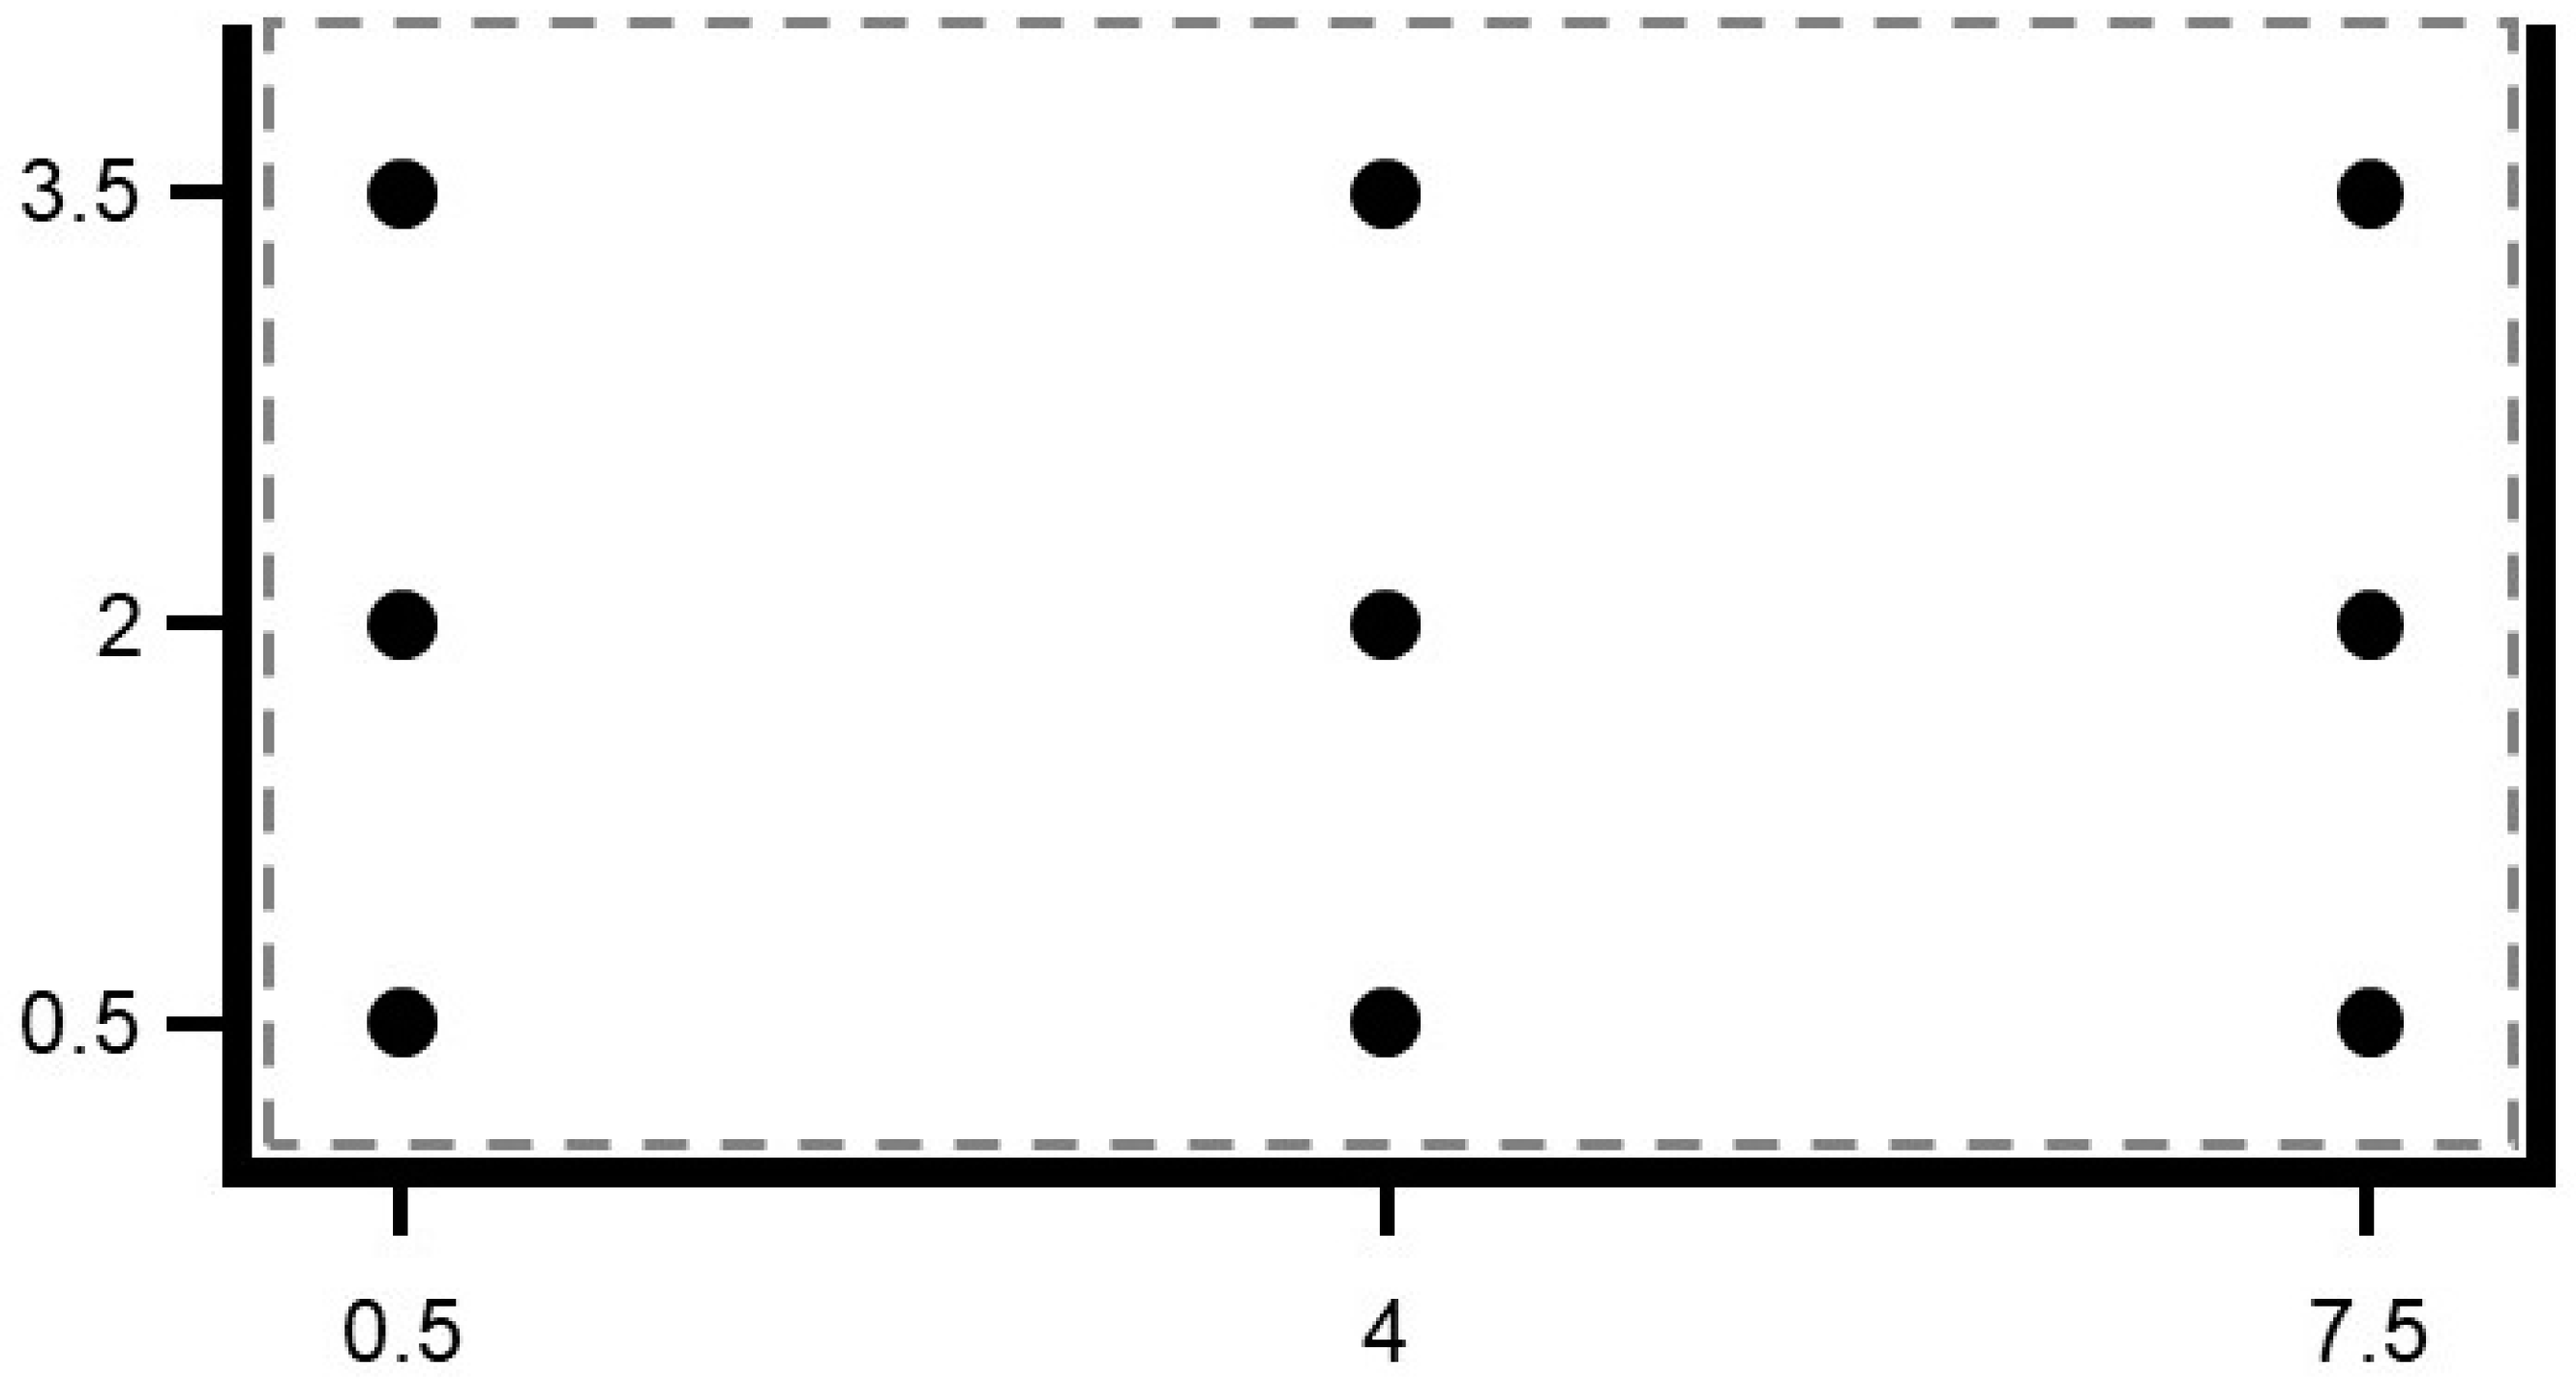
Ruler stakes: nine stakes were evenly distributed across each experimental cell (Figure 3). Three stakes were placed at the centre, and three were positioned along each side to capture spatial variability. Each stake was fitted with a measuring tape, with the zero-mark aligned at the point where the stake met the soil. A unique code was assigned to each stake to facilitate visualizing sediment accumulation in three-dimensional space, capturing the seasonal variations.
(b)
Buried tiles: one ceramic tile (30 cm × 30 cm) was buried 10 cm below the sediment surface in each cell. Monthly, sediment accumulation on the tile was measured by inserting a 5 mm metal rod (knitting needle) five times (five replicates) at random locations within the tile’s footprint, and the sediment height was recorded.
To account for natural hydrodynamic forces that caused scouring around the base of the stakes, the area eroded near each stake was excluded from the measurements. The sediment height was measured at the nearest undisturbed point using a flat ruler. Initial measurements were taken in October 2019 to establish baseline sediment heights relative to each stake, and subsequent measurements of erosion and accretion were calculated by subtracting the baseline from the recorded values. The same approach was applied to the buried tiles, with initial measurements taken in October 2019, and monthly changes in erosion and accretion determined relative to these initial values.
To analyze spatial and temporal variations in sediment accumulation (both at the ruler stakes and buried tiles), a Repeated Measures ANOVA was conducted. The sphericity assumption was tested using Mauchly’s test, and if necessary, degrees of freedom were adjusted with Greenhouse–Geisser corrections. Data analysis was performed using IBM SPSS Statistics version 29.0.0.0 (241).
Environmental variables that could influence sediment dynamics were monitored using data from national online databases:
(a)
Temperature and salinity: monthly averages were calculated from daily data made freely available by the CoastNet infrastructure (CoastNet geoportal: http://geoportal.coastnet.pt (assessed on 4 November 2024)).
(b)
Precipitation and river flow: monthly precipitation and river flow data were obtained from monitoring stations at “Soure” and “Açude Ponte Coimbra”, respectively, and were provided by the SNIRH (“Sistema Nacional de Informação de Recursos Hídricos”; https://snirh.apambiente.pt (assessed on 4 November 2024)).

2.4. Seasonal Monitoring: Organic Matter Content and Granulometry

In addition to monthly monitoring, sediment samples were collected seasonally to assess organic matter content and grain size distribution, while minimizing disturbance to the experimental site. These samples were taken at the following intervals: June 2019 (before the installation of the experimental cells), October 2019, May 2020, October 2020, May 2021, October 2021, and December 2022.
The organic matter content was determined using the loss-on-ignition method: (i) sediment samples were dried at 60 °C until achieving constant weight; (ii) combusted at 450 °C for 8 h; (iii) organic matter % was calculated as the weight difference before and after combustion, relative to the initial dry weight.
Granulometric analysis was performed following organic matter removal using H2O2—(i) samples were treated with H₂O₂ until the complete oxidation of organic matter, and decanted; (ii) wet sieving was performed using a stack of sieves with mesh sizes of 2 mm, 1 mm, 0.5 mm, 0.25 mm, 0.125 mm, and 63 µm; (iii) the retained material in each sieve was dried at 50 °C until a constant weight was achieved, and weighed; (iv) the proportion of each granulometric fraction was expressed as a percentage of the total sediment weight excluding organic matter.
The mean phi (ɸ) value and sorting coefficient (σ) for each sample were calculated according to the method described by Folk and Ward (1957). The percentages of silt and clay (%) and sand (%) were determined using the GRADISTAT software (version 8.0).

3. Results

3.1. Sedimentation Rates

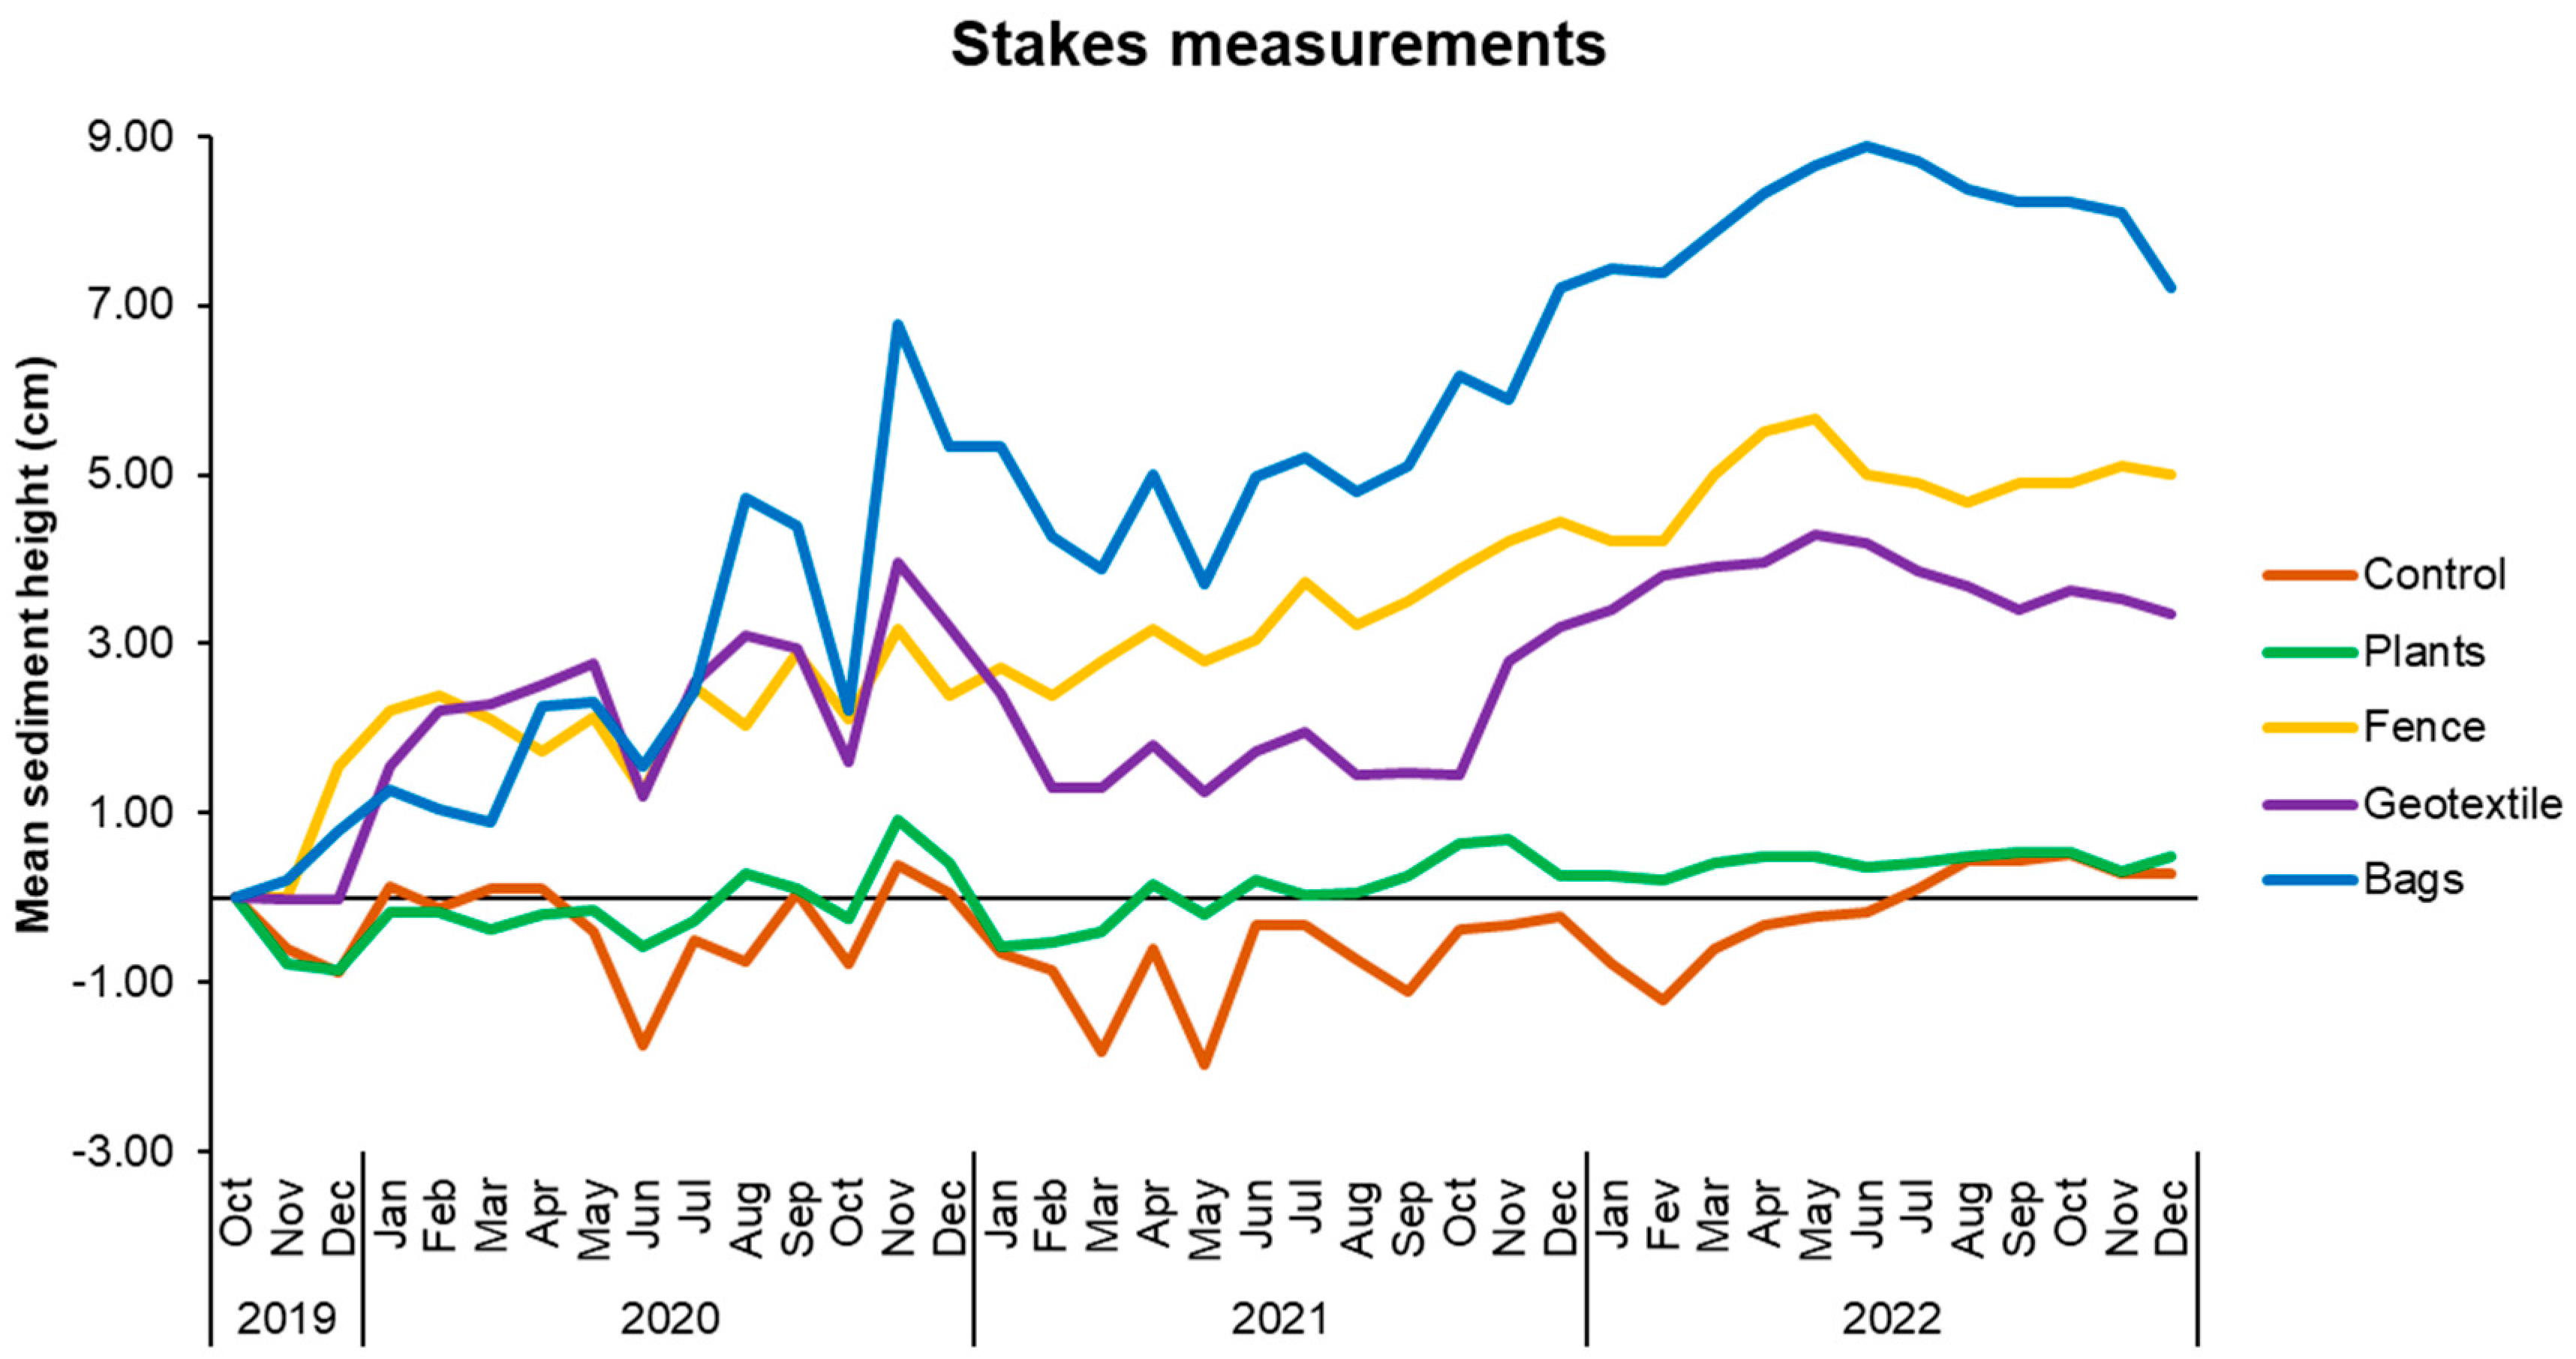
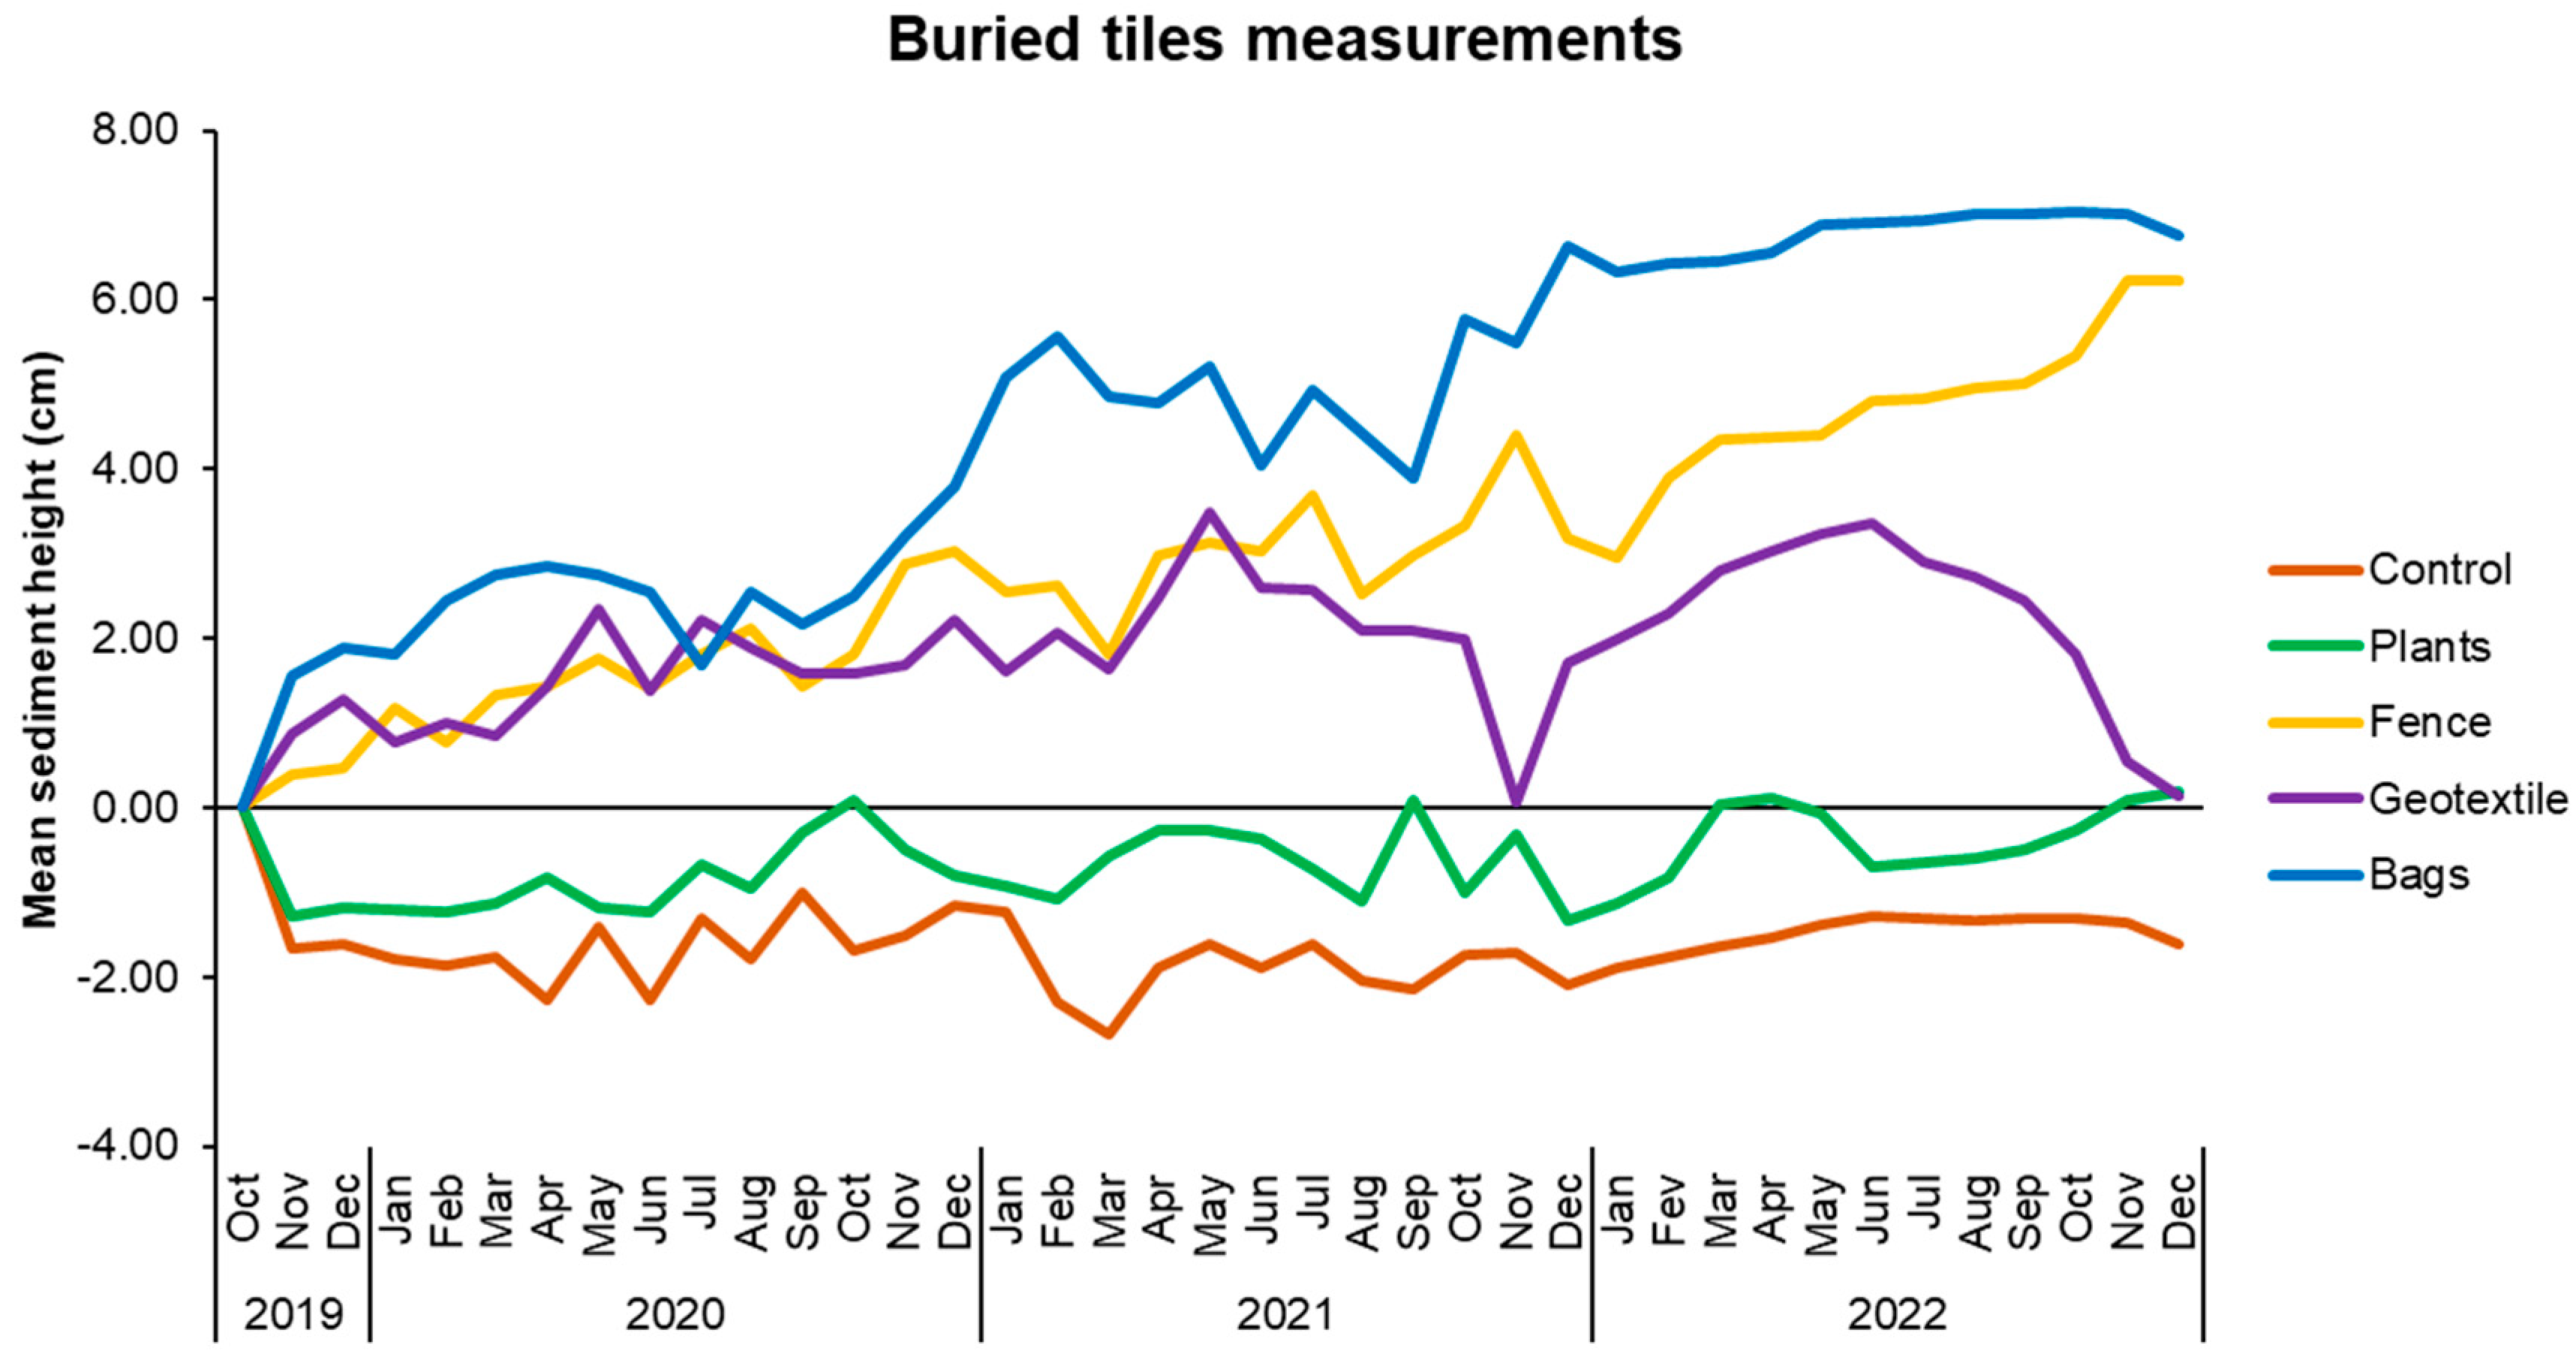
The sediment accumulation measurements over time revealed clear differences among the experimental cells (Bags, Fence, Geotextile, Plants, and Control), as observed in both the stakes measurements (A.) and the tile measurements (B.) (Figure 4 and Figure 5, respectively).
(A.) Stake Measurements: The Bags cell exhibited the highest sediment accumulation, reaching a peak of 8.88 cm in June 2022 (Figure 4). Sedimentation rates increased markedly during late 2020, rising from 2.22 cm in October to 6.77 cm in November. Although sediment levels slightly decreased to 7.21 cm by December 2022, the Bags cell consistently exhibited remarkable effectiveness in retaining and accumulating sediment throughout the study period.
In the Geotextile cell, sedimentation also showed a notable increase, reaching 3.97 cm by November 2020. The highest sediment level was recorded in May 2022 (4.3 cm), followed by a slight decline to 3.36 cm in December 2022. Despite these fluctuations, the Geotextile cell consistently demonstrated a strong capability for sediment trapping over time.
The Fence cell displayed robust sediment retention, reaching 5.67 cm by May 2022 and maintaining a stable range close to 5 cm toward the end of the studied period in December 2022. In terms of overall performance, it ranked just below the Bags cell.
The Plants cell, in contrast, showed limited sediment accumulation. Initial erosion was observed (−0.86 cm in December 2019), with a modest upward trend beginning in 2021. Sedimentation peaked at only 0.53 cm in October 2022, reflecting lower accretion levels compared to the engineered structures.
The Control cell exhibited minor fluctuations and lacked meaningful sediment retention. Early losses (−0.89 cm in December 2019) were followed by slight gains, with sediment levels peaking at 0.28 cm in December 2022.
A repeated measures ANOVA with a Greenhouse–Geisser correction revealed statistically significant differences in mean sediment accumulation between the experimental cells (F(6.124, 152) = 47.858, p < 0.001). Post hoc analysis with a Bonferroni adjustment provided further insights: (i) The Bags cell significantly outperformed the Control (mean difference = 5.407, 95% CI [3.707 to 7.108], p < 0.001), Fence (1.736, 95% CI [0.036 to 3.437], p = 0.042), Geotextile (2.522, 95% CI [0.821 to 4.222], p < 0.001), and Plants (4.917, 95% CI [3.216 to 6.617], p < 0.001). (ii) The Fence cell significantly outperformed the Control (3.671, 95% CI [1.971 to 5.371], p < 0.001) and Plants (3.180, 95% CI [1.480 to 4.881], p < 0.001). However, no significant difference was observed between the Fence and Geotextile cells (0.785, 95% CI [−0.915 to 2.485], p = 1.000). (iii) The Geotextile showed significantly greater sediment retention compared to the Plants cell (2.395, 95% CI [0.695 to 4.096], p = 0.002) but did not differ significantly from the Fence cell (p = 1.000). (iv) Finally, no significant difference was observed between the Control and Plants cells (0.491, 95% CI [−1.210 to 2.191], p = 1.000). These results suggest that the Bags and the Fence cells were the most effective structures in promoting sediment accumulation, with the Bags cell demonstrating the highest overall performance.
(B.) Measurements in the tile: The Bags cell exhibited the highest sediment accumulation among all experimental cells (Figure 5). Starting at 1.56 cm in November 2019, sediment levels increased rapidly, reaching 3.80 cm by December 2020. This upward trend persisted through 2021, peaking at 6.62 cm in December 2021. In 2022, sediment accumulation remained consistently high, ranging between 6.34 cm and 7.02 cm, with a maximum of 7.04 cm recorded in October 2022. The sand-filled geotextile bags demonstrated high efficiency in trapping sediment, outperforming all other experimental structures.
The Geotextile cell also showed positive sediment accumulation, though to a lesser extent than the Bags and Fence cells. Sediment levels steadily increased, reaching 3.36 cm by June 2022. While effective in promoting sediment deposition, its performance was less efficient than that of the Fence cell.
The Fence cell showed a denoted increase in sediment accumulation, particularly from 2020 onwards. Sedimentation steadily rose during the first year, reaching 3.02 cm by December 2020. From 2021 onward, sediment accumulation rates accelerated, peaking at 6.22 cm in December 2022. These findings highlight the effectiveness of the wooden palisade in trapping sediment and significantly contributing to sediment deposition within the experimental cell.
In the Plants cell, sediment accumulation showed a negative trend, with minor seasonal deposition observed. Initial measurements from October 2019 to December 2019 indicated minimal sediment loss. Recovery was observed later, particularly in the latter half of 2021, with values ranging from −0.92 cm in January 2021 to 0.18 cm in December 2022. While sediment levels remained predominantly negative during 2021–2022, the presence of vegetation appeared to moderately contribute to sediment retention, showing better performance than the Control cell.
The Control cell exhibited fluctuating sediment levels, primarily indicating erosion rather than deposition. Accumulation ranged from a minimum of −2.68 cm in March 2021 to a maximum of 0.00 cm in October 2019. The most pronounced sediment loss occurred during the winter and early spring months, with occasional seasonal variations. Overall, sediment loss was consistent throughout the study, particularly during 2021 and 2022.
A repeated measures ANOVA with a Greenhouse–Geisser correction revealed statistically significant differences in mean performance across the treatment groups (F(6.787, 152) = 92.344, p < 0.001). Post hoc analysis with a Bonferroni adjustment showed that the Bags treatment exhibited significantly higher performance compared to the Control (mean difference = 6.16, 95% CI [3.70 to 8.62], p < 0.001), Geotextile (2.66, 95% CI [0.20 to 5.12], p = 0.028), and Plants (5.17, 95% CI [2.71 to 7.63], p < 0.001). The Control cell showed a significantly lower performance compared to Bags (−6.16, 95% CI [−8.62 to −3.70], p < 0.001), Fence (−4.57, 95% CI [−7.03 to −2.11], p < 0.001), and Geotextile (−3.50, 95% CI [−5.96 to −1.04], p = 0.002), but no significant difference was found between Control and Plants (−0.99, 95% CI [−3.45 to 1.47], p = 1.000). No significant differences were found between Fence and Geotextile, while Fence outperformed Plants (3.58, 95% CI [1.12 to 6.04], p = 0.002). Lastly, Plants was significantly different to Bags (−5.17, 95% CI [−7.63 to −2.71], p < 0.001), Fence (−3.58, 95% CI [−6.04 to −1.12], p = 0.002), and Geotextile (−2.51, 95% CI [−4.97 to −0.05], p = 0.044). These results indicate that the geotextile bags filled with sand were the most effective structure for sediment retention, performing significantly better than all other treatments. Conversely, the Control and Plants treatments showed the lowest performance, with minimal sediment retention.

3.2. Sedimentation Patterns

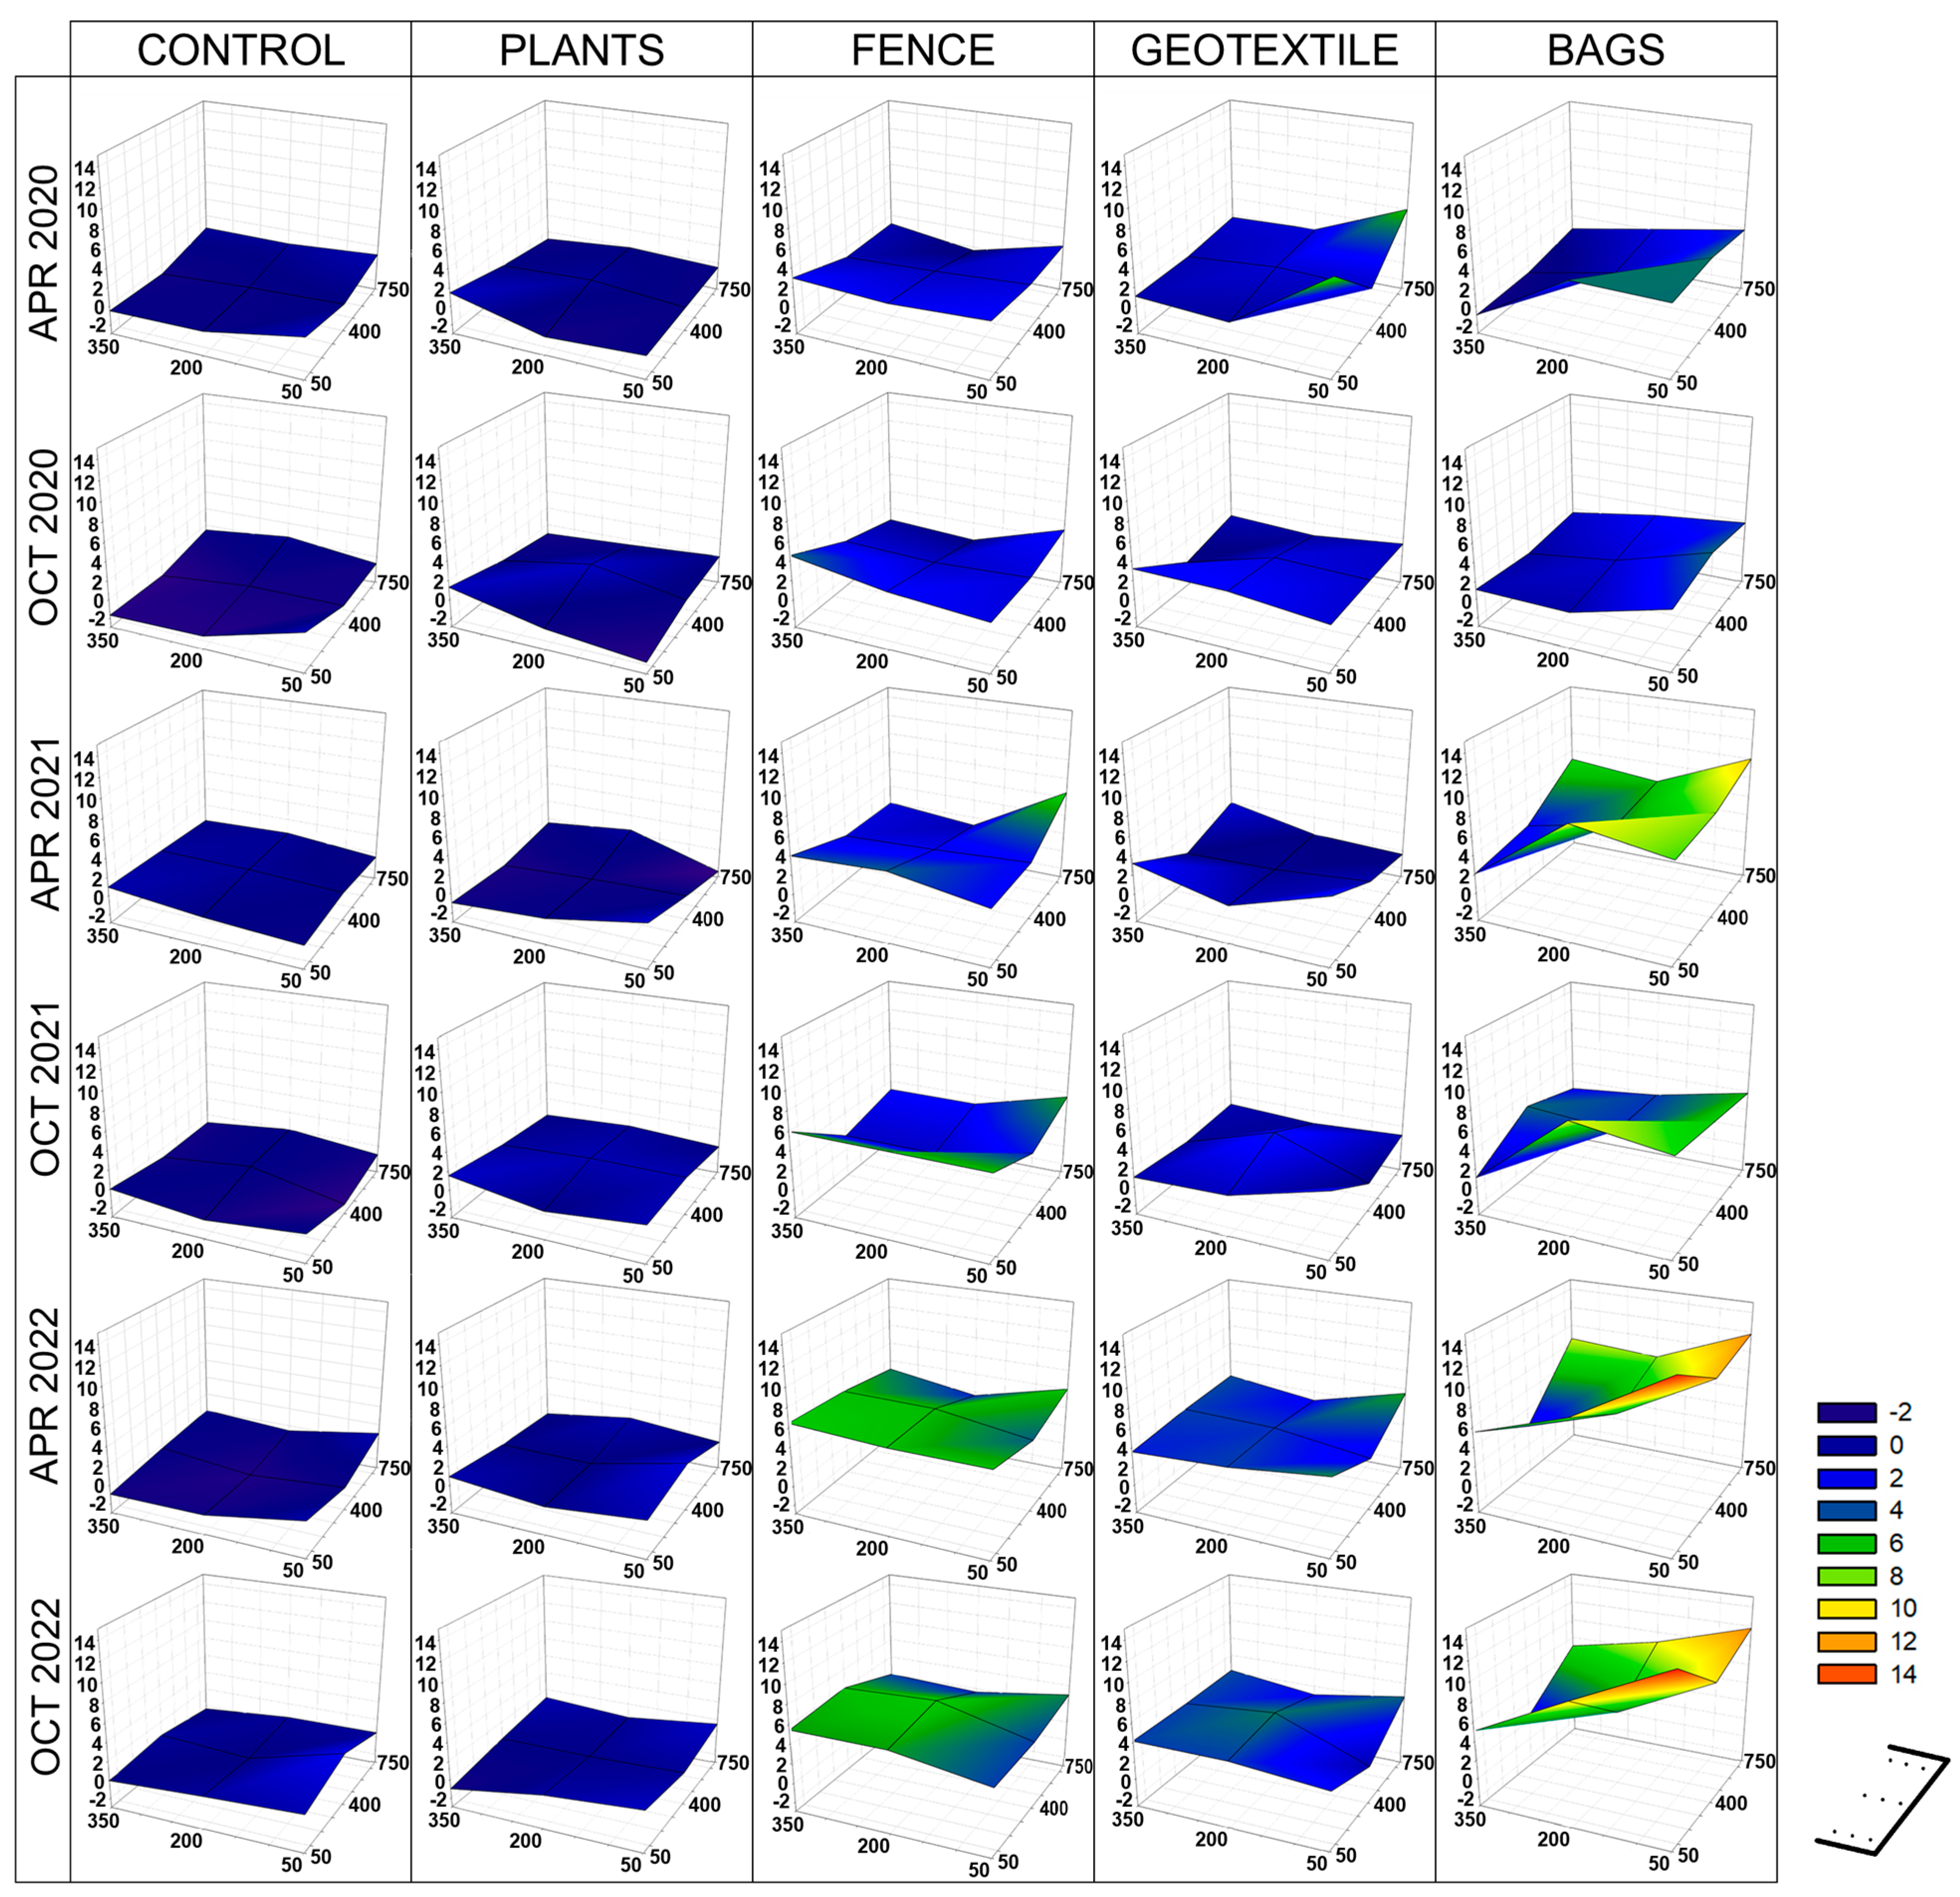
Shaped by the interaction of river flow, tidal dynamics, and the implemented structures, sediment accumulation within the experimental cells followed a distinct spatial pattern, as seen in the tri-dimensional visualization using the data from the months April and October (Figure 6). These months were selected to assess post-winter (including periods of storms and high river discharge) and post-summer sedimentation dynamics. As the tide recedes, water flows through the structures, depositing sediment particles in their proximity. This process leads to more pronounced sedimentation near the upstream sections of the cells, where the structures efficiently trap sediment during tidal outflow. Additionally, sediment accumulation was particularly notable in the front corners of the cells, with the Bags cell demonstrating the highest deposition, followed by a less pronounced pattern in the Fence cell. This pattern suggests that the combined effects of tidal flow and river dynamics concentrates sediment along the river-facing edges and in areas aligned with the prevailing water flow.

3.3. Sediment Characteristics

The sediment organic matter content (OM%) and organic carbon content (C%) showed distinct temporal and spatial variations across the experimental cells (Figure 7). In the Control cell, OM% ranged from 2.16% in October 2019 to 3.63% in May 2021, stabilizing thereafter. Similarly, C% varied from 1.26% and 2.11% over the same period, reflecting limited enrichment. The Plants cell displayed greater variability, with OM% peaking at 8.87% in May 2020 and 8.40% in December 2022. C% followed a comparable pattern, reaching a maximum of 5.14% in May 2020.
The experimental cells with physical structures showed progressive enrichment in OM% and C%, with both metrics generally increasing over time. The Fence cell showed a steady rise in OM% from 1.18% in October 2019 to 5.50% in December 2022, with C% mirroring this trend, also reaching 5.50%. The Geotextile cell exhibited moderate variability, with OM% peaking at 5.50% in May 2021 and C% ranging between 1.27% and 3.65% throughout the study period. The Bags cell consistently recorded the highest values, with OM% peaking at 10.07% in October 2021 and remaining elevated thereafter. C% followed suit, reaching a maximum of 5.84% during the same period.
Overall, both OM% and C% displayed an increasing trend across all experimental cells, with the most pronounced and consistent improvements observed in the Bags cell. Seasonal fluctuations were more evident in the Plants cell, highlighting the role of vegetation in enhancing sediment organic matter and carbon content over time.
The sediment granulometry exhibited notable spatial and temporal variability across the experimental cells (Figure 8). In the Control cells, the median grain size (Md φ) remained relatively stable, ranging from 2.39 φ in May 2021 to 2.59 φ in December 2022, with consistently poor sorting coefficients (σ) between 2.57 and 2.66. Sand content in the Control cells ranged from 70.67% to 74.14%, while silt and clay content varied between 25.86% and 29.33%. The Plants cell demonstrated higher variability in grain size over time. The Md φ increased steadily, reaching a peak of 3.94 φ in December 2022. Sorting coefficients (σ) remained poor, ranging from 2.69 to 2.80. Sand content fluctuated between 63.87% and 68.18%, while silt and clay content ranged from 31.82% to 36.14%. In the Fence cell, Md φ ranged from 1.88 φ in May 2020 to 4.90 φ in December 2022, with poor sorting coefficients (σ) varying between 2.42 and 2.73. Sand content showed a marked decreased, from 79.34% in May 2020 to 55.33% in December 2022, accompanied by an inverse trend in silt and clay content, which increased from 20.66% to 44.67% over the same period. The Geotextile cell showed moderate variability, with Md φ values ranging from 2.64 φ in May 2020 to 3.97 φ in December 2022. Sorting coefficients (σ) remained consistently poor, ranging between 2.60 and 2.78. Sand content varied from 60.01% to 69.76%, while silt and clay content ranged from 30.24% to 39.99%. The Bags cell exhibited the most pronounced changes in sediment composition. Sand content decreased dramatically from 83.92% in October 2019 to 29.82% in December 2022, while silt and clay content increased significantly from 16.08% to 70.17%. The Md φ also increased substantially, from 1.63 φ in October 2019 to 4.83 φ in December 2022.
A general trend of increasing Md φ values and silt and clay content was observed over time, particularly in the eco-engineered cells. In contrast, sand content decreased substantially, especially in the Fence and Bags cell. Poor sorting (σ > 2) was consistent across all cells and time periods, reflecting the heterogeneity of sediment composition in the salt marsh environment.

3.4. Environmental Conditions

Monthly mean temperature (°C) and salinity (psu) were calculated using freely available data from the CoastNet infrastructure for the period between November 2019 and July 2022 (with no data available for the remainder of the study period) (Figure 9). The temperature ranged from a minimum of 9.89 °C in January 2021 to a maximum of 22.81 °C in July 2022, following typical seasonal variations. Salinity showed greater variability, ranging from a low of 0.08 in December 2019 and February 2021 to a high of 16.74 in July 2022. Lower salinity values were generally observed during the winter months, coinciding with periods of higher precipitation, while higher salinity levels occurred during the summer months, when reduced freshwater inflow and elevated temperatures prevailed.
Monthly precipitation exhibited a clear seasonal pattern throughout the study period, with most rainfall occurring during the autumn and winter months (Figure 10). November 2019 recorded the highest precipitation level at 170.2 mm, while July and August consistently experienced low precipitation, with July 2022 being the driest month at just 0.6 mm.
River flow measurements mirrored this seasonal trend, with higher flow rates observed during periods of increased precipitation. The highest flow rate was recorded in December 2019 at 470.16 m3/s. Similarly, February 2021 showed a remarkable flow increase to 434.92 m3/s, following substantial rainfall of 157 mm. From May to September, both precipitation and river flow values were generally lower, reflecting the seasonal conditions typical of the study area (Figure 10).
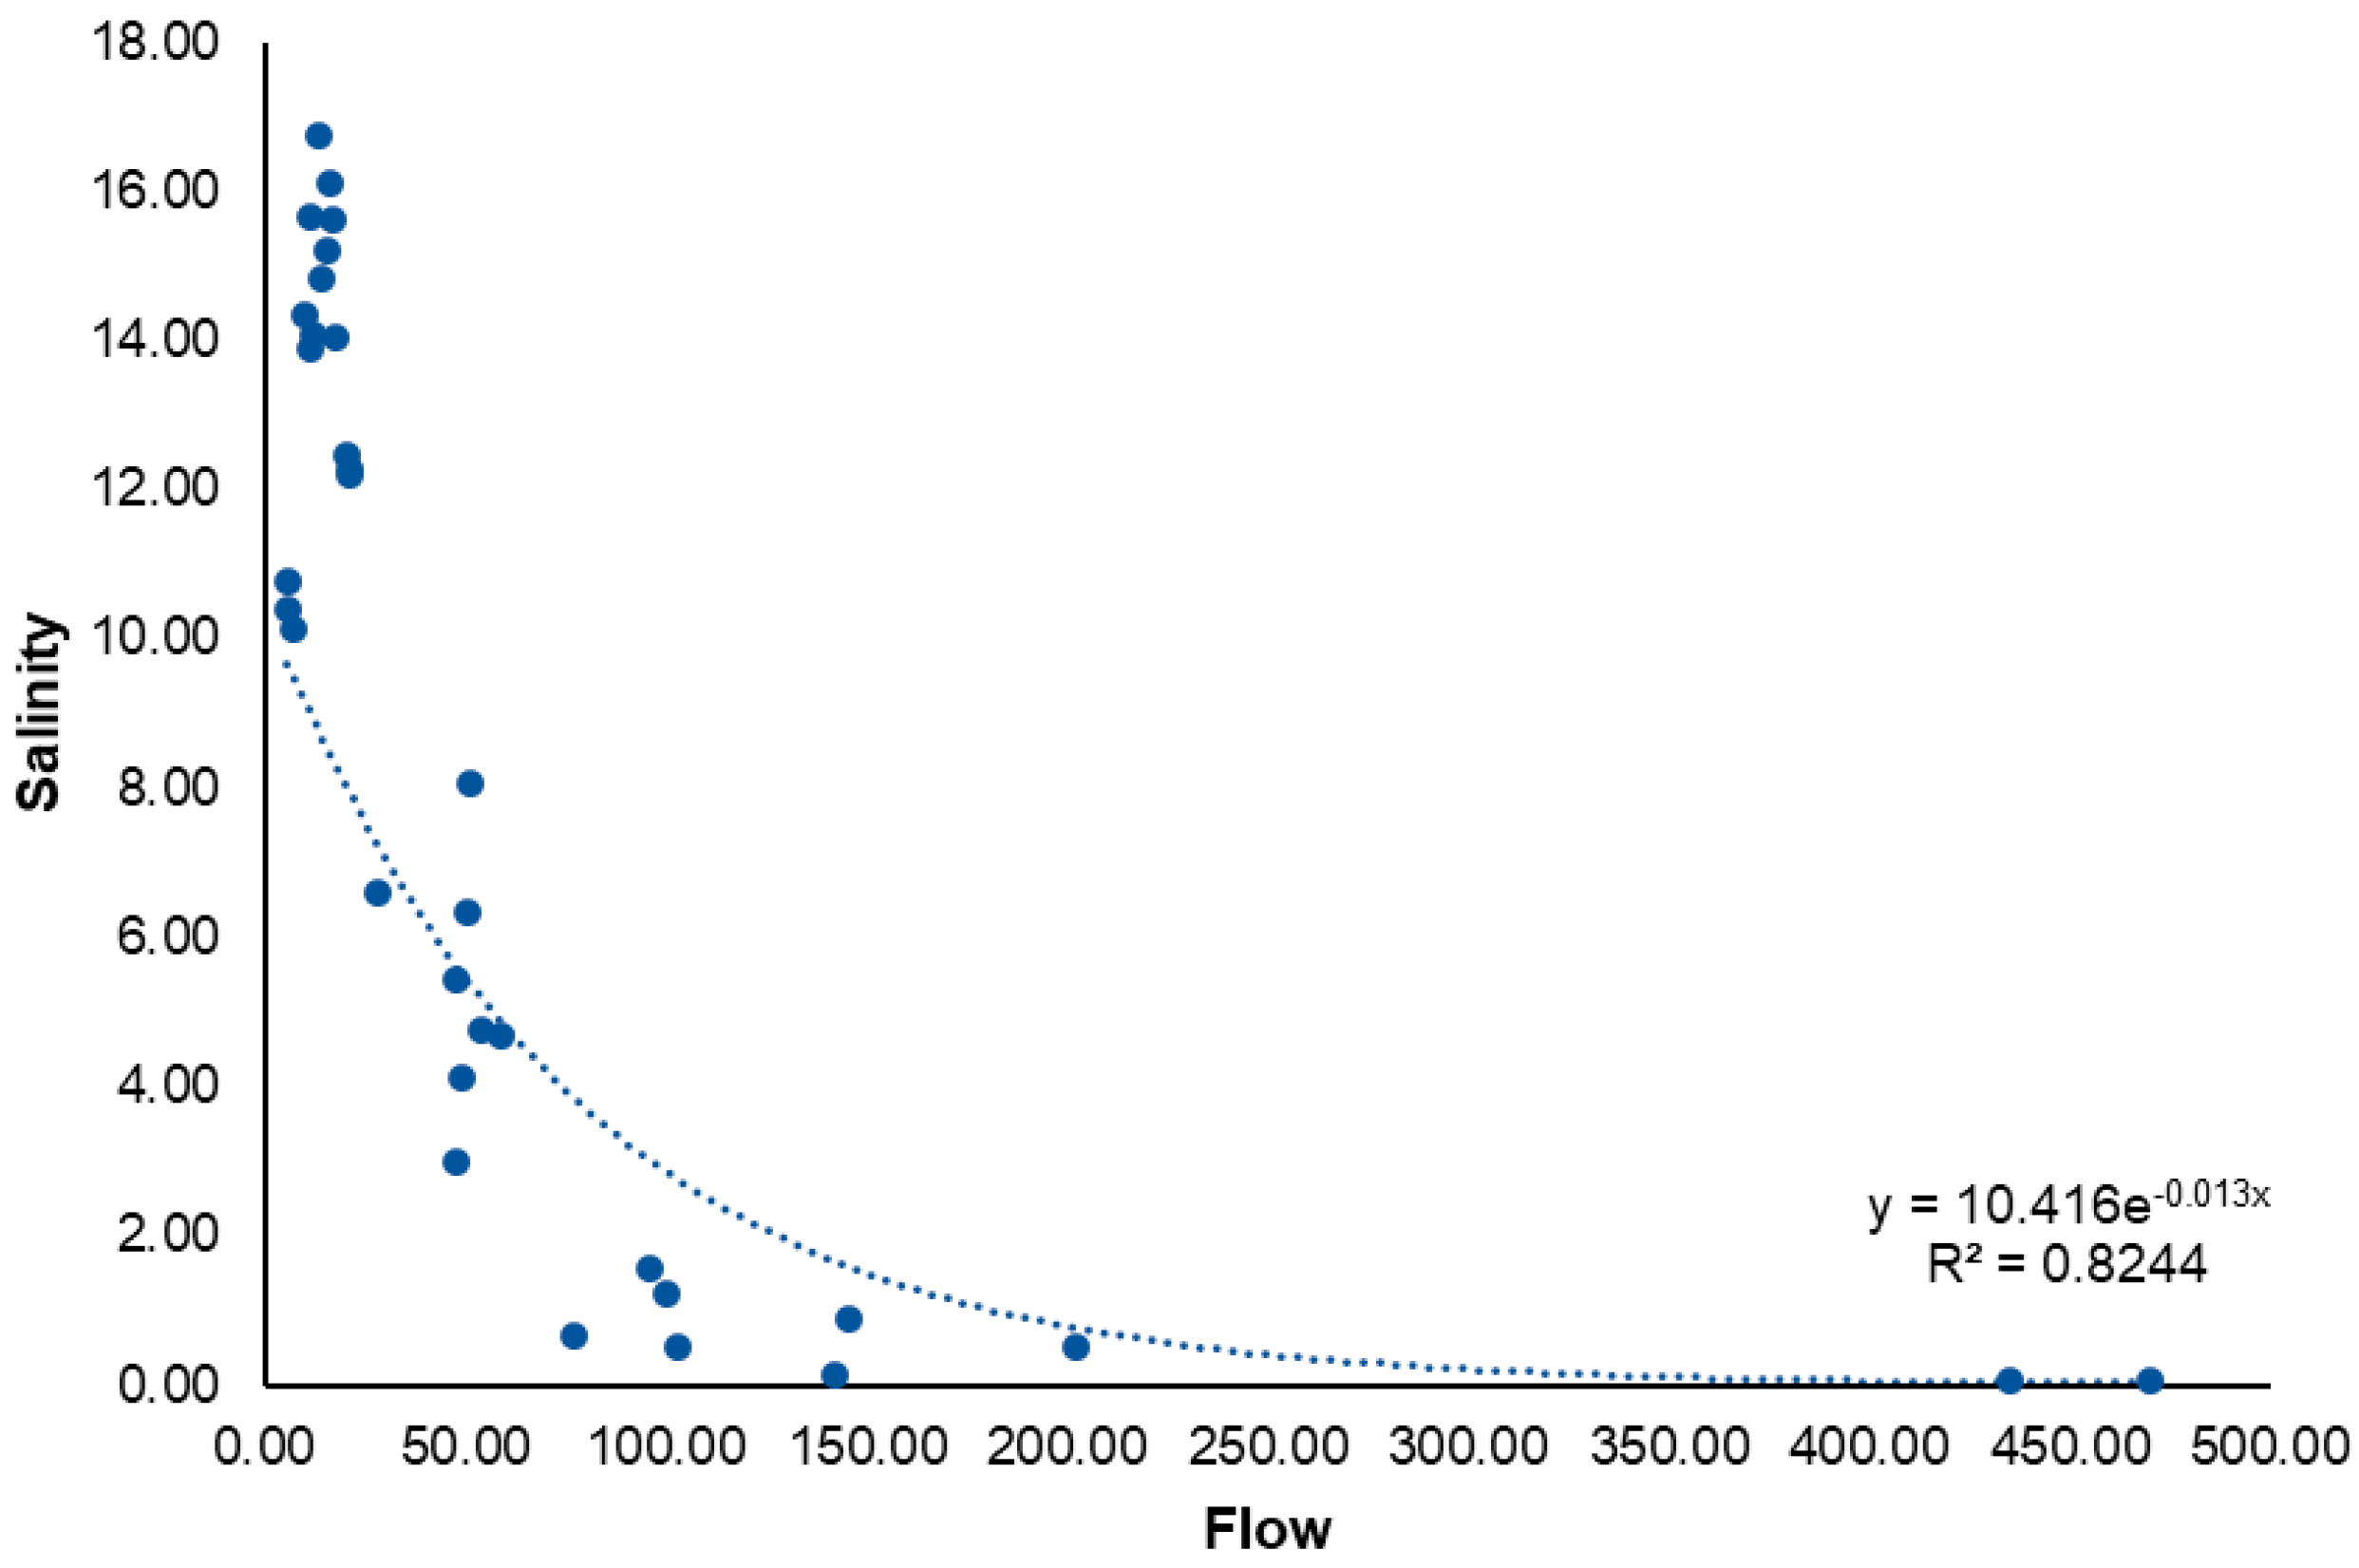
A negative exponential relationship was observed between salinity and river flow (y = 10.416e−0.013x), with 82.44% of the variability in salinity explained by the variation on the river flow (R2 = 0.82). Salinity decreases exponentially as the water flow increases due to the freshwater input into the estuary (Figure 11).

4. Discussion

The present study evaluated the effectiveness of various eco-engineering structures in promoting sediment accretion and retention within a salt marsh area of the Mondego Estuary, Portugal. The findings revealed that all tested interventions enhanced sediment deposition compared to the control cell with bare-bottom.
Among the tested eco-engineering structures, the most significant sediment retention was observed in the Bags and Fence cells. The geotextile sandbags were particularly effective, especially in 2022, when both stake and tile measurements confirmed increased sediment levels. This structure was particularly effective in trapping finer particles, such as silt and clay, thereby enriching the sediment with organic material. This supports ecosystem stability and facilitates the establishment of benthic macroinvertebrates, as previously documented by Gonçalves et al. (2024), where the wood palisades enhanced species richness and density, while geotextile provided improved community stability [22].
The use of wooden palisades and sandbags also demonstrated effectiveness in creating localized zones of sediment deposition, particularly near the front corners of the experimental cells. These results highlight the role of hydrodynamic factors in sedimentation and the potential for such structures to modify water flow, thereby promoting sediment deposition. This is essential for stabilizing marsh surfaces and mitigating erosion in the context of rising sea levels [12,23,24]. In contrast, the Plants cell showed less pronounced sediment accumulation. While gradual sedimentation was observed starting in 2020, it did not significantly outperform the Control cell. This suggests that vegetation alone may be insufficient for substantial sediment retention. However, vegetation still plays an important role in restoring eroded wetlands by dissipating wave energy, reducing wind erosion through root systems, facilitating sediment deposition by slowing water flow, and contributing organic matter that supports elevation accretion [25,26,27,28]. Also, in a similar study using nature-based structures (bamboo piles), significant accretion occurred after marsh vegetation became established [17]. The Control cell exhibited minimal sediment retention, with some areas experiencing erosion. This highlights the vulnerability of unprotected marsh surfaces to tidal and wave action [29].
Eco-engineering structures, particularly the sandbags, contributed significantly to sediment enrichment with organic material. Organic matter (OM%) and carbon (C%) levels in the Bags cell were consistently higher than in the others. This indicates that these structures not only trapped sediment but also facilitated the accumulation of organic material, which is vital for long-term ecological health. The Fence and Geotextile cells also showed increased organic content, while the Plants cell exhibited moderate variability, peaking at higher organic values than the Control cell but remaining below those of the engineered structures.
Granulometric analysis revealed that eco-engineering structures influenced sediment composition. The Bags cell experienced an increase in finer particles and a decrease in sand content over time. The Fence and Geotextile treatments similarly promoted finer sediment retention, although to a lesser extent. This suggests that these structures effectively trap fine sediments that might otherwise be transported downstream into the main channel. Sediment accumulation was most pronounced along the river-facing edges and in areas aligned with river flow, reflecting the combined effects of tidal dynamics and fluvial processes. These findings emphasize the importance of considering local hydrodynamic conditions when designing restoration interventions.
Seasonal environmental conditions, including temperature, salinity, precipitation, and river flow, significantly influenced sediment dynamics and the performance of the implemented structures. The observed negative relationship between river flow and salinity highlights the influence of precipitation-driven freshwater inputs, which dilute estuarine salinity and promote the deposition of finer sediments through flocculation [30,31]. Despite these environmental fluctuations, the Bags and Fence cells demonstrated resilience, continuing to enhance sedimentation during both wet and dry periods.
The results of this study indicate that eco-engineering structures, particularly geotextile sandbags and wooden palisades, are effective tools for enhancing sediment retention and organic matter accumulation in salt marsh restoration efforts. By trapping fine particles and enriching sediments with organic material, these structures not only increase sedimentation rates but may also improve sediment quality, thereby supporting biodiversity and overall ecosystem health. In contrast, vegetation alone stabilized sediment over time but did not achieve the same level of sedimentation or organic matter enrichment as the engineered structures. Combining vegetation with eco-engineering structures could provide a more effective restoration strategy, especially in areas prone to erosion or insufficient sediment accumulation [32].
The ability of salt marshes to keep pace with rising sea levels through sedimentation is crucial for their preservation and ecological functions [33]. Structures like sandbags and wooden fences offer practical solutions to enhance sediment accretion and maintain marsh surfaces, helping to buffer against the impacts of rising tides. Incorporating such eco-engineering structures into restoration projects could booster salt marsh resilience and adaptation to climate change.
While this study provided valuable insights, several limitations should be acknowledged. First, the three-year study duration may not have fully captured long-term trends in sediment dynamics, particularly under variable climatic and hydrodynamic conditions. Additionally, the relatively small-scale experimental cells may limit the applicability of the findings to larger restoration projects. Environmental factors such as storm events or extreme precipitation, which likely influenced sediment transport and deposition, were not directly addressed. Moreover, although the eco-engineering structures demonstrated clear impacts on sediment dynamics, further research is needed to quantify their long-term ecological effects, including impacts on vegetation establishment and faunal communities.
The results highlight the potential of eco-engineering structures to enhance sediment retention and support salt marsh restoration efforts. Wooden palisades, by disrupting hydrodynamic forces and trapping suspended particles effectively, demonstrated superior performance. Geotextile bags also proved to be a practical solution for areas requiring rapid sediment stabilization. These findings carry significant implications for restoration strategies in estuarine systems facing sediment deficits and rising sea levels. By promoting localized sediment accretion, these interventions can help counteract the erosive effects of sea level rise (SLR) and sustain critical ecosystem functions.
Logistical and financial considerations are key to evaluating the feasibility of these techniques for salt marsh restoration. While geotextile sandbags, despite their induced impacts, emerged as the most resource-intensive option, they offer substantial upfront investment with no need for maintenance. This makes them particularly attractive for areas requiring substantial sediment retention and stabilization, especially where long-term maintenance is not feasible. Geotextile fabric and wooden palisades strike a balance between cost and effort, with moderate installation requirements and limited maintenance. Although their impact was less significant than that of the sandbags, these treatments may be more practical for projects with budget constraints or areas facing less severe erosion challenges. In contrast, vegetation, while cost-effective and easy to implement, had a minimal impact on sediment retention, highlighting its limited suitability as a standalone solution. The lower sediment retention observed in the plant cells, compared to engineered structures, contrasts with some findings in the literature [34,35,36]. Several factors may explain this outcome. The vegetation at our study site may have had lower sediment-trapping efficiency compared to other salt marsh species with stronger sediment-binding root systems. Some species are more effective at reducing flow velocity and promoting deposition [37,38,39]. Additionally, since vegetation-driven sediment retention depends on plant structure and density, the plants in our study may not have been mature enough to exert a significant influence on sedimentation. Hydrodynamic conditions at the study site may also have played a role, as strong tidal currents or wave action could have resuspended sediments before they settled within the plant cells. The Mondego estuary, being a relatively high-energy environment, could reduce the effectiveness of vegetation in promoting accretion, particularly in the early stages of establishment or in certain plant species. However, the low environmental footprint and simplicity of vegetation suggest it could complement engineered structures, enhancing overall restoration outcomes.
These findings emphasize the importance of tailoring restoration strategies to site-specific conditions and available resources. Although higher-cost interventions like geotextile sandbags offer substantial benefits, the scalability and long-term success of restoration projects depend on finding a balance between effectiveness, affordability, and environmental sustainability. The use of renewable and biodegradable resources should also be considered, as the implemented structures will persist in the environment for extended periods.
Our study provided valuable insights into sediment accretion within small-scale experimental cells (27–32 m2). However, upscaling these structures to field-scale applications is crucial to fully replicate their effects and presents several challenges. At smaller scales, individual structures operate in relatively isolated conditions, but at larger scales, interactions between multiple structures may alter local water flow, potentially affecting sediment deposition and erosion patterns. This could lead to unintended sediment redistribution or localized scouring, which requires careful evaluation. Cost constraints also pose a challenge, as small-scale installations demand less material and labour, while large-scale implementation involves significant financial investment in materials, installation, and long-term maintenance. Therefore, variations in sediment availability, site-specific hydrodynamic conditions, and the financial feasibility of large-scale implementation must be carefully considered. These findings are crucial for refining cost-effective, scalable nature-based solutions for salt marsh restoration. Nature-based solutions (NbS) play a critical role in sediment retention and coastal resilience, offering alternatives to traditional engineering approaches. While our study focuses on salt marsh restoration, other NbS strategies, such as green nourishment, barrier beach stabilization, and hybrid sediment management techniques, provide complementary benefits. Green nourishment, for instance, involves replenishing sediment in a way that enhances natural coastal dynamics while minimizing ecological disturbance, improving shoreline stability and resilience to erosion [40]. Similarly, barrier beaches act as natural buffers, reducing wave energy and promoting sediment retention, as demonstrated through numerical modelling studies [41]. The effectiveness of NbS strategies is highly dependent on local hydrodynamic conditions, sediment supply, and climate change-driven stressors. Model-based assessments have shown that integrating multiple NbS approaches, such as salt marsh restoration combined with sediment augmentation or engineered barriers, can enhance long-term coastal protection and adaptability [42]. These findings highlight the importance of selecting NbS based on site-specific conditions and considering hybrid approaches to optimize sediment retention and ecological benefits. Future research should explore the synergies between salt marsh restoration and other NbS to develop integrated coastal management strategies that enhance both ecosystem resilience and sediment dynamics.
Integrating hydrodynamic modelling with sediment transport analysis will also help to understand the interactions between eco-engineering interventions and environmental factors. Long-term monitoring is crucial to assess the resilience of these interventions under changing climatic and hydrological conditions. Additionally, expanding the scale of experimental interventions and testing hybrid approaches that integrate multiple structures could further enhance our understanding of their effectiveness. Studies investigating the ecological impacts of these interventions, including effects on vegetation growth, invertebrate communities, and biodiversity, would provide a more comprehensive assessment of their role in salt marsh restoration.

5. Conclusions

This study underscores the potential of eco-engineering structures, such as geotextile sandbags and wooden palisades, to promote sediment accretion and enhance the resilience of salt marshes. The findings suggest that combining these structures with vegetation offers a more effective approach to marsh stabilization, especially in areas vulnerable to erosion or inadequate sediment accumulation. Vegetation plays a complementary role in dissipating wave energy and facilitating sediment deposition, further enhancing the effectiveness of eco-engineering solutions in marsh restoration.
For successful restoration projects, it is essential to consider local hydrodynamic conditions, sediment dynamics, and available resources when selecting appropriate structures. This study highlights the importance of tailoring interventions to site-specific factors to optimize restoration outcomes. Ongoing monitoring of sedimentation, vegetation growth, and macroinvertebrate communities is critical to assess the long-term effectiveness of these interventions and adjust strategies as environmental conditions evolve.
When designing large-scale restoration projects, it is crucial to consider both financial and logistical factors to ensure the sustainability and feasibility of the chosen interventions. Engaging local communities, policymakers, and stakeholders is equally important for ensuring the long-term success of restoration efforts and maximizing their benefits for coastal protection and ecosystem health.
This study provides a foundation for adaptive management strategies that can help salt marshes cope with the challenges posed by climate change and rising sea levels, contributing to the preservation and sustainability of these vital ecosystems.

Author Contributions

C.G., T.V., I.C. and H.V. conceptualized and designed the research. C.G. performed bibliometric research, and field work. D.M. and P.J.V.O. performed sediment analysis. C.G. and T.V. analyzed data. C.G. wrote the original draft of the manuscript. All authors reviewed the original draft. All authors have read and agreed to the published version of the manuscript.

Funding

This work was financed by national funds through FCT-Foundation for Science and Technology, I.P., within the scope of the projects UIDB/04292/2020–MARE-Marine and Environmental Sciences Centre and the project LA/P/0069/2020 granted to the Associate Laboratory ARNET. This work was also funded by FCT and University of Coimbra through the Decree-law 57/2016 contract of Helena Veríssimo (https://doi.org/10.54499/DL57/2016/CP1370/CT0022), subsidized by the European Social Fund and Portuguese Ministry of Science, Technology and Higher Education (MCTES) through the Human Potential Operational Program (POPH); Carlos Gonçalves by the FCT PhD grant (https://doi.org/10.54499/SFRH/BD/147777/2019); MAR2020 through the project RESET (reference MAR-04.03.01-FEAMP-0008).

Data Availability Statement

All data generated or analyzed during this study are included in this published article. More detailed data can be provided upon request to the corresponding author.

Conflicts of Interest

The authors declare no conflicts of interest. The funders had no role in the design of the study; in the collection, analyses, or interpretation of data; in the writing of the manuscript; or in the decision to publish the results.

References

  1. McLeod, E.; Chmura, G.L.; Bouillon, S.; Salm, R.; Björk, M.; Duarte, C.M.; Lovelock, C.E.; Schlesinger, W.H.; Silliman, B.R. A blueprint for blue carbon: Toward an improved understanding of the role of vegetated coastal habitats in sequestering CO2. Front. Ecol. Environ. 2011, 9, 552–560. [Google Scholar] [CrossRef]
  2. Shepard, C.C.; Crain, C.M.; Beck, M.W. The Protective Role of Coastal Marshes: A Systematic Review and Meta-analysis. PLoS ONE 2011, 6, e27374. [Google Scholar] [CrossRef] [PubMed]
  3. Silliman, B.R. Salt marshes. Curr. Biol. 2014, 24, R348–R350. [Google Scholar] [CrossRef]
  4. Crosby, S.C.; Sax, D.F.; Palmer, M.E.; Booth, H.S.; Deegan, L.A.; Bertness, M.D.; Leslie, H.M. Salt marsh persistence is threatened by predicted sea-level rise. Estuar. Coast. Shelf Sci. 2016, 181, 93–99. [Google Scholar] [CrossRef]
  5. Gedan, K.B.; Silliman, B.R.; Bertness, M.D. Centuries of human-driven change in salt marsh ecosystems. Annu. Rev. Mar. Sci. 2009, 1, 117–141. [Google Scholar] [CrossRef]
  6. Ladd, C.J.; Duggan-Edwards, M.F.; Bouma, T.J.; Pagès, J.F.; Skov, M.W. Sediment Supply Explains Long-Term and Large-Scale Patterns in Salt Marsh Lateral Expansion and Erosion. Geophys. Res. Lett. 2019, 46, 11178–11187. [Google Scholar] [CrossRef]
  7. Mudd, S.M. The life and death of salt marshes in response to anthropogenic disturbance of sediment supply. Geology 2011, 39, 511–512. [Google Scholar] [CrossRef]
  8. Teal, J.M.; Weishar, L. Ecological engineering, adaptive management, and restoration management in Delaware Bay salt marsh restoration. Ecol. Eng. 2005, 25, 304–314. [Google Scholar] [CrossRef]
  9. van der Meulen, F.; IJff, S.; van Zetten, R. Nature-based solutions for coastal adaptation management, concepts and scope, an overview. Nord. J. Bot. 2023, 2023, e03290. [Google Scholar] [CrossRef]
  10. Stagg, C.L.; Mendelssohn, I.A. Restoring Ecological Function to a Submerged Salt Marsh. Restor. Ecol. 2010, 18, 10–17. [Google Scholar] [CrossRef]
  11. Tong, C.; Baustian, J.J.; Graham, S.A.; Mendelssohn, I.A. Salt marsh restoration with sediment-slurry application: Effects on benthic macroinvertebrates and associated soil–plant variables. Ecol. Eng. 2013, 51, 151–160. [Google Scholar] [CrossRef]
  12. Ganju, N.K. Marshes Are the New Beaches: Integrating Sediment Transport into Restoration Planning. Estuaries Coasts 2019, 42, 917–926. [Google Scholar] [CrossRef]
  13. Temmerman, S.; Meire, P.; Bouma, T.J.; Herman, P.M.J.; Ysebaert, T.; De Vriend, H.J. Ecosystem-based coastal defence in the face of global change. Nature 2013, 504, 79–83. [Google Scholar] [CrossRef] [PubMed]
  14. Siegersma, T.R.; Willemsen, P.W.J.M.; Horstman, E.M.; Hu, Z.; Borsje, B.W. Protective structures as adaptive management strategy in Nature-based Solutions to mitigate sea level rise effects. Ecol. Eng. 2023, 196, 107079. [Google Scholar] [CrossRef]
  15. Osorio, R.J.; Linhoss, A.; Skarke, A.; Brasher, M.G.; McFarland, M. Assessment of marsh terrace designs for wave attenuation utilizing a wave model. Dyn. Atmos. Ocean. 2024, 105, 101429. [Google Scholar] [CrossRef]
  16. Slee, N.J.; Gardiner, T.; Underwood, G.J. Hybrid engineering incorporating salt marsh terraces into sea wall repair maintains their defence function and creates new habitats. Estuar. Coast. Shelf Sci. 2023, 294, 108544. [Google Scholar] [CrossRef]
  17. Zhou, K.; Liu, S.X.; Cheng, H.F.; Zhu, K.H.; Zhang, W.; Lyu, Q.; Chen, H.Y.; Xin, P.; Ge, Z.M. Nature-based solutions to mitigate early marsh-edge erosion in a coastal wetland. Ecol. Eng. 2024, 198, 107133. [Google Scholar] [CrossRef]
  18. Veríssimo, H.; Bremner, J.; Garcia, C.; Patrício, J.; Van Der Linden, P.; Marques, J.C. Assessment of the subtidal macrobenthic community functioning of a temperate estuary following environmental restoration. Ecol. Indic. 2012, 23, 312–322. [Google Scholar] [CrossRef]
  19. Veríssimo, H.; Lane, M.; Patrício, J.; Gamito, S.; Marques, J.C. Trends in water quality and subtidal benthic communities in a temperate estuary: Is the response to restoration efforts hidden by climate variability and the Estuarine Quality Paradox? Ecol. Indic. 2013, 24, 56–67. [Google Scholar] [CrossRef]
  20. Teixeira, A.; Duarte, B.; Caçador, I. Salt Marshes and Biodiversity. In Sabkha Ecosystems; Springer: Dordrecht, The Netherlands, 2014; pp. 283–298. [Google Scholar] [CrossRef]
  21. Flindt, M.R.; Kamp-Nielsen, L.; Marques, J.C.; Pardal, M.A.; Bocci, M.; Bendoricchio, G.; Salomonsen, J.; Nielsen, S.N.; Jørgensen, S.E. Description of the three shallow estuaries: Mondego River (Portugal), Roskilde Fjord (Denmark) and the Lagoon of Venice (Italy). Ecol. Model. 1997, 102, 17–31. [Google Scholar] [CrossRef]
  22. Gonçalves, C.; Verdelhos, T.; Caçador, I.; Veríssimo, H. Effectiveness of Eco-Engineering Structures in Salt Marsh Restoration: Using Benthic Macroinvertebrates as Indicators of Success. Coasts 2024, 4, 740–757. [Google Scholar] [CrossRef]
  23. Davidson-Arnott, R.G.; van Proosdij, D.; Ollerhead, J.; Schostak, L. Hydrodynamics and sedimentation in salt marshes: Examples from a macrotidal marsh, Bay of Fundy. Geomorphology 2002, 48, 209–231. [Google Scholar] [CrossRef]
  24. Fagherazzi, S.; Mariotti, G.; Leonardi, N.; Canestrelli, A.; Nardin, W.; Kearney, W.S. Salt Marsh Dynamics in a Period of Accelerated Sea Level Rise. J. Geophys. Res. Earth Surf. 2020, 125, e2019JF005200. [Google Scholar] [CrossRef]
  25. Chen, Y.; Li, Y.; Thompson, C.; Wang, X.; Cai, T.; Chang, Y. Differential sediment trapping abilities of mangrove and saltmarsh vegetation in a subtropical estuary. Geomorphology 2018, 318, 270–282. [Google Scholar] [CrossRef]
  26. Christiansen, T.; Wiberg, P.L.; Milligan, T.G. Flow and Sediment Transport on a Tidal Salt Marsh Surface. Estuar. Coast. Shelf Sci. 2000, 50, 315–331. [Google Scholar] [CrossRef]
  27. Möller, I.; Kudella, M.; Rupprecht, F.; Spencer, T.; Paul, M.; Van Wesenbeeck, B.K.; Wolters, G.; Jensen, K.; Bouma, T.J.; Miranda-Lange, M.; et al. Wave attenuation over coastal salt marshes under storm surge conditions. Nat. Geosci. 2014, 7, 727–731. [Google Scholar] [CrossRef]
  28. Morris, J.T.; Barber, D.C.; Callaway, J.C.; Chambers, R.; Hagen, S.C.; Hopkinson, C.S.; Johnson, B.J.; Megonigal, P.; Neubauer, S.C.; Troxler, T.; et al. Contributions of organic and inorganic matter to sediment volume and accretion in tidal wetlands at steady state. Earth Future 2016, 4, 110–121. [Google Scholar] [CrossRef] [PubMed]
  29. Möller, I. Quantifying saltmarsh vegetation and its effect on wave height dissipation: Results from a UK East coast saltmarsh. Estuar. Coast. Shelf Sci. 2006, 69, 337–351. [Google Scholar] [CrossRef]
  30. Portela, L.I.; Ramos, S.; Teixeira, A.T. Effect of salinity on the settling velocity of fine sediments of a harbour basin. J. Coast. Res. 2013, 165, 1188–1193. [Google Scholar] [CrossRef]
  31. Sun, Z.L.; Jiao, J.G.; Huang, S.J.; Gao, Y.Y.; Ho, H.C.; Xu, D. Effects of Suspended Sediment on Salinity Measurements. IEEE J. Ocean. Eng. 2018, 43, 56–65. [Google Scholar] [CrossRef]
  32. Gonçalves, C.; Fernandes, J.; Neto, J.M.; Veríssimo, H.; Caçador, I.; Verdelhos, T. Evolution and Effectiveness of Salt Marsh Restoration: A Bibliometric Analysis. Water 2024, 16, 1175. [Google Scholar] [CrossRef]
  33. Craft, C.; Clough, J.; Ehman, J.; Jove, S.; Park, R.; Pennings, S.; Guo, H.; Machmuller, M. Forecasting the effects of accelerated sea-level rise on tidal marsh ecosystem services. Front. Ecol. Environ. 2009, 7, 73–78. [Google Scholar] [CrossRef]
  34. Curado, G.; Figueroa, E.; Castillo, J.M. Vertical sediment dynamics in Spartina maritima restored, non-restored and preserved marshes. Ecol. Eng. 2012, 47, 30–35. [Google Scholar] [CrossRef]
  35. Baaij, B.M.; Kooijman, J.; Limpens, J.; Marijnissen RJ, C.; van Loon-Steensma, J.M. Monitoring Impact of Salt-Marsh Vegetation Characteristics on Sedimentation: An Outlook for Nature-Based Flood Protection. Wetlands 2021, 41, 76. [Google Scholar] [CrossRef]
  36. Evans, B.R.; Brooks, H.; Chirol, C.; Kirkham, M.K.; Möller, I.; Royse, K.; Spencer, K.; Spencer, T. Vegetation interactions with geotechnical properties and erodibility of salt marsh sediments. Estuar. Coast. Shelf Sci. 2022, 265, 107713. [Google Scholar] [CrossRef]
  37. Jiang, H.; Chai, C.; Zhang, M. Numerical study on the influence of salt marsh plants on coastal wetland hydrodynamics and suspended sediment transport. Front. Environ. Sci. 2023, 11, 1180457. [Google Scholar] [CrossRef]
  38. Neumeier, U.; Amos, C.L. The influence of vegetation on turbulence and flow velocities in European salt-marshes. Sedimentology 2006, 53, 259–277. [Google Scholar] [CrossRef]
  39. Wu, W.; Biber, P.D.; Peterson, M.S.; Turner, J.; Desai, A.R.; Blackstock, J.M.; Guimond, J.A.; Seyfferth, A.L.; Moffett, K.B.; Chen, M.Y.; et al. Study on the Influence of Salt Marsh Vegetation on Tidal Current and Sediment Transport in Intertidal Zone. J. Phys. Conf. Ser. 2023, 2486, 012049. [Google Scholar] [CrossRef]
  40. Wen, C.L.; Muller, P.; Grabowski, R.C.; Dodd, N. Green Nourishment: An Innovative Nature-Based Solution for Coastal Erosion. Front. Mar. Sci. 2022, 8, 814589. [Google Scholar] [CrossRef]
  41. Sánchez-Artús, X.; Subbiah, B.; Gracia, V.; Espino, M.; Grifoll, M.; Espanya, A.; Sánchez-Arcilla, A. Evaluating Barrier Beach Protection with Numerical Modelling: A Practical Case. Coast. Eng. 2024, 191, 104522. [Google Scholar] [CrossRef]
  42. Marino, M.; Nasca, S.; Alkharoubi, A.I.K.; Cavallaro, L.; Foti, E.; Musumeci, R.E. Efficacy of Nature-Based Solutions for Coastal Protection Under a Changing Climate: A Modelling Approach. Coast. Eng. 2025, 198, 104700. [Google Scholar] [CrossRef]
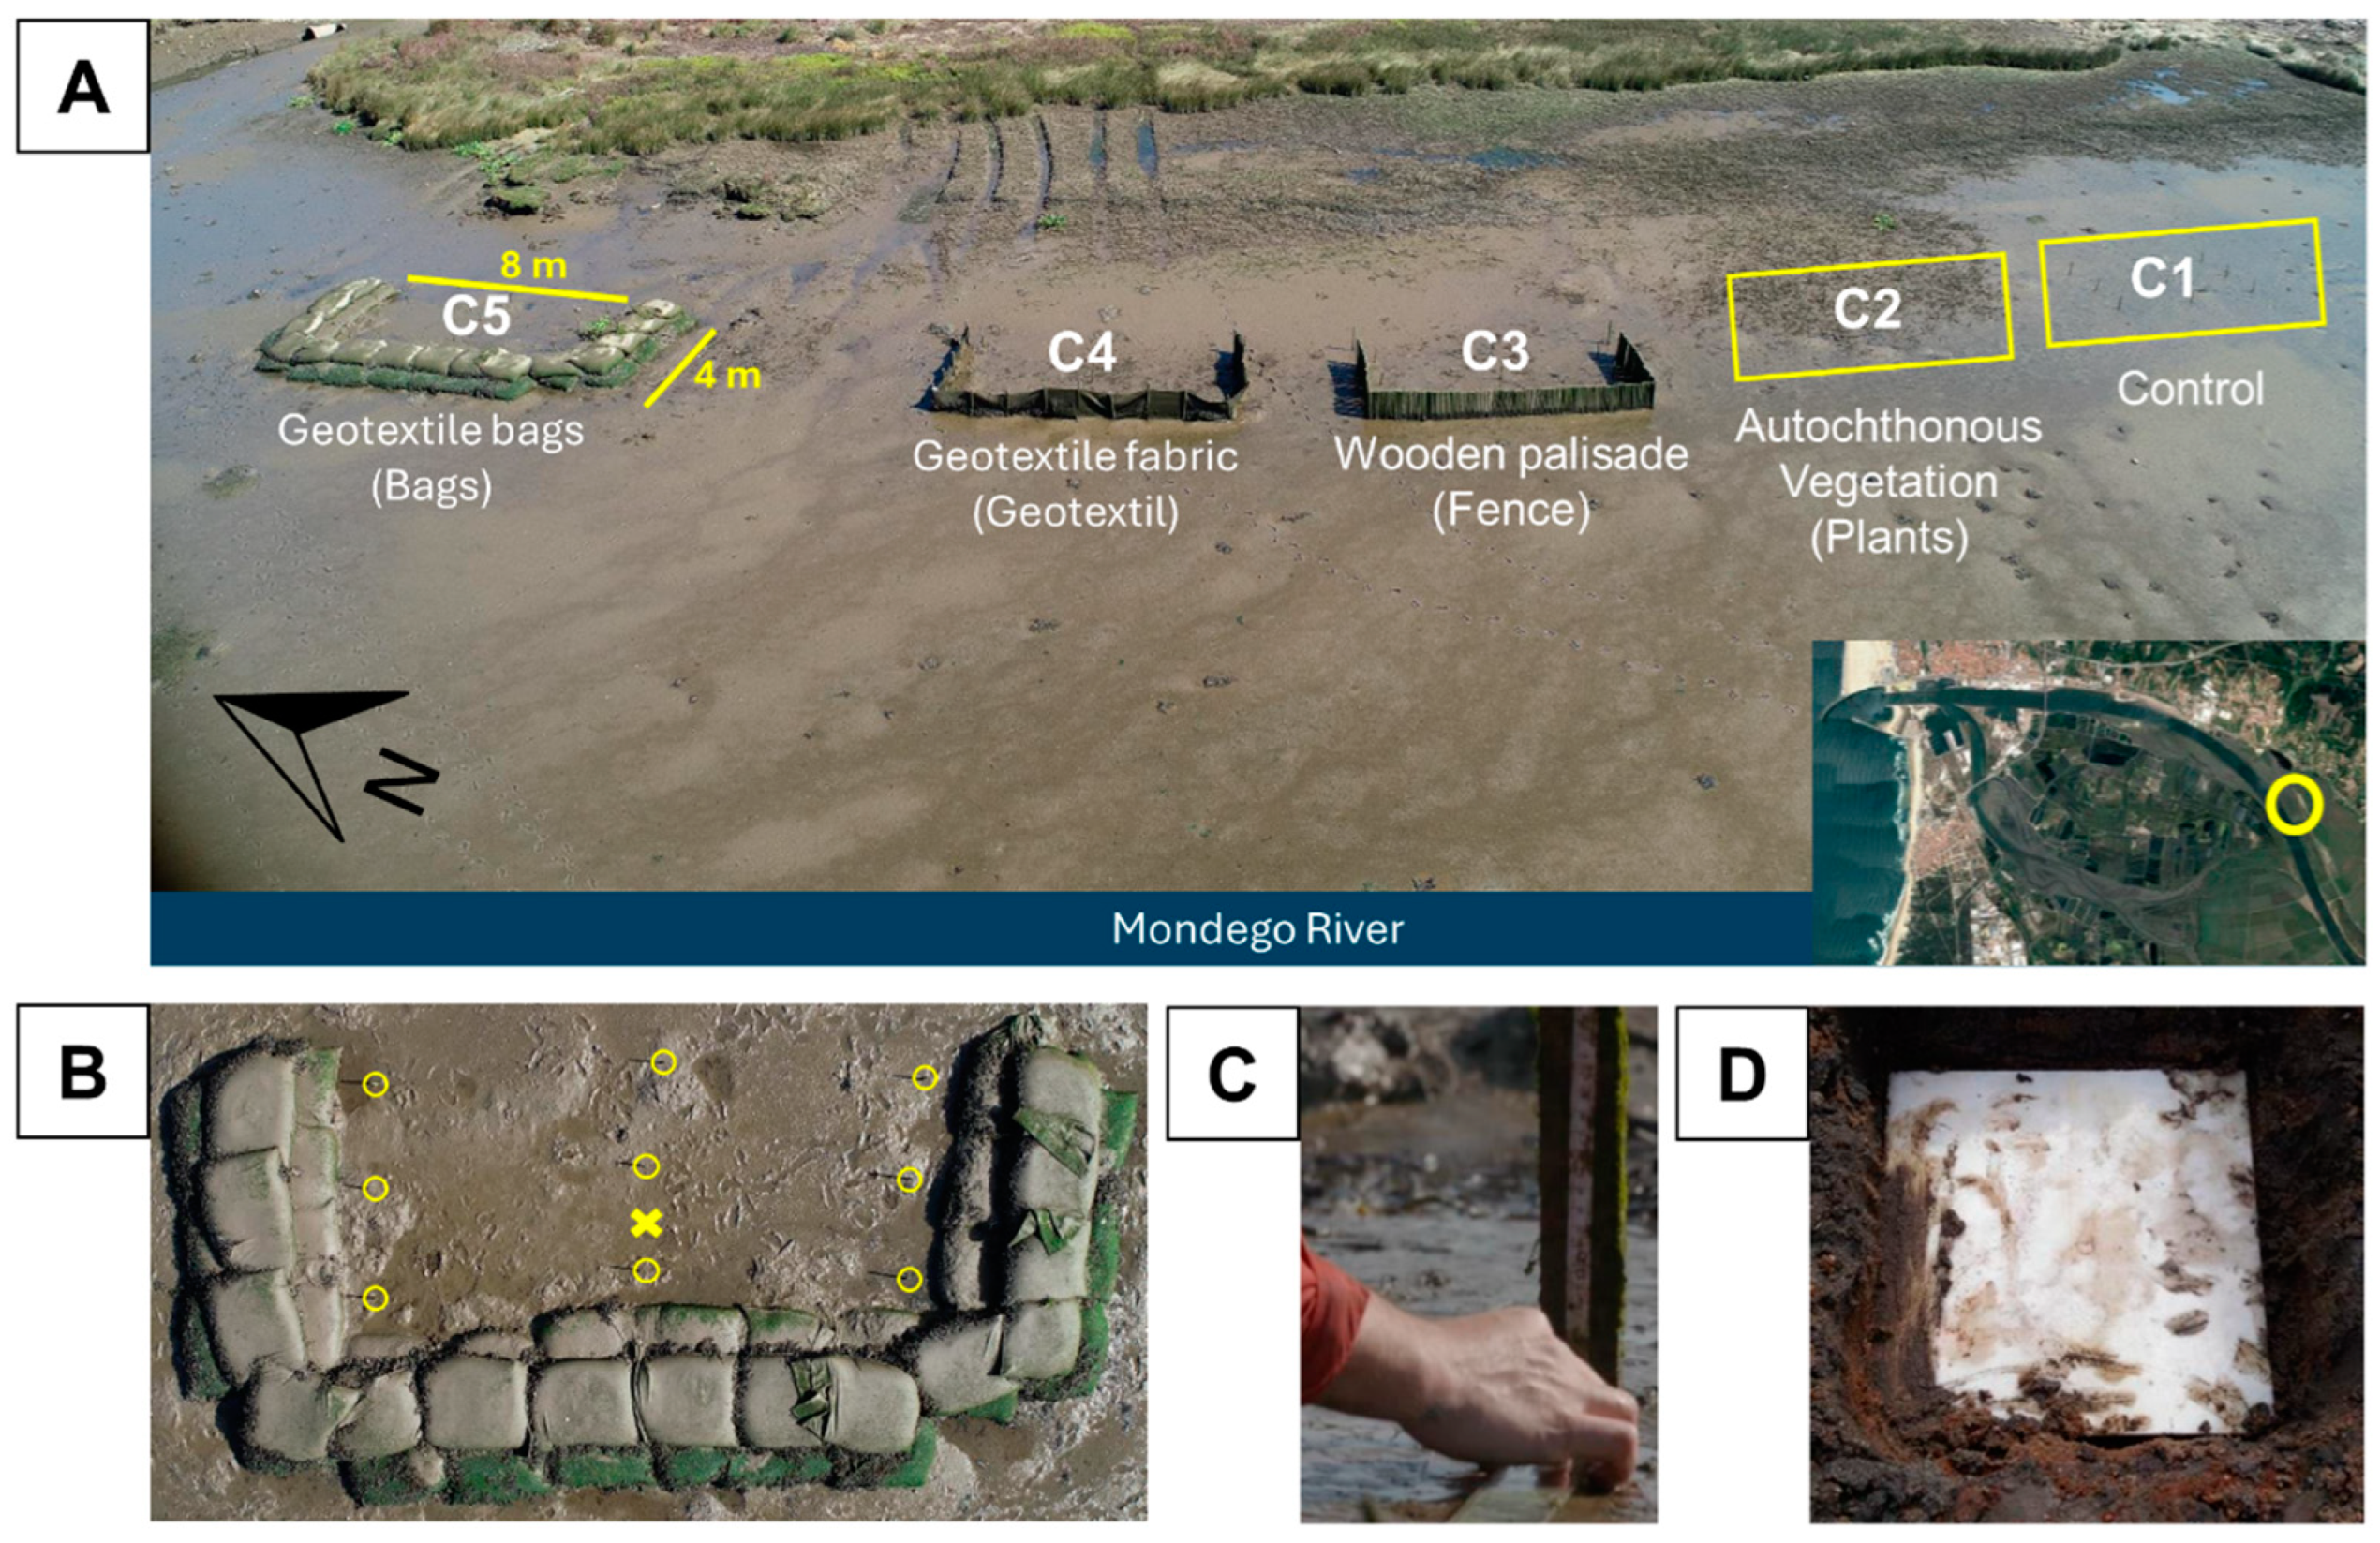
Figure 1. (A) Study site and aerial view of the experimental area (40°08′01.3″ N 8°48′05.8″ W), showing the different material cells and their orientation; (B) Aerial view of one experimental cell (sandbags), with ruler stakes spots (circles) and the measuring tile location (×); (C) Ruler stake measuring; (D) buried tile.
Water 17 00678 g001
Figure 2. Experimental cells (yellow circle) during low (A) and high (B) tide (images from Google Earth).
Water 17 00678 g002
Figure 3. Diagram showing the nine ruler stakes position in each experimental cell (units in metres). Dashed lines represent the entire area considered as the experimental cell. Thick black lines represent the perimeter of the implemented structures (in C3, C4, and C5).
Water 17 00678 g003
Figure 4. Mean height (cm) measured in the stakes in each experimental cell from October 2019 to December 2022.
Water 17 00678 g004
Figure 5. Mean height (cm) measured in the buried tile in each experimental cell October 2019 to December 2022.
Water 17 00678 g005
Figure 6. Tri-dimensional visualization of the sediment deposition in each experimental cell along the studied period. Each point of the 3D mesh plot corresponds to a ruler stake (following the scheme under the legend).
Water 17 00678 g006
Figure 7. Sediment organic matter and organic carbon percentages in each experimental cell during the studied period (October 2019 to December 2022).
Water 17 00678 g007
Figure 8. Silt+Clay, sand, and organic matter percentages, median grain size (Md φ) and sorting coefficient (σ) in each experimental cell during the studied period.
Water 17 00678 g008
Figure 9. Monthly mean temperature (°C) and salinity (psu). Data from the CoastNet infrastructure between November 2019 and July 2022.
Water 17 00678 g009
Figure 10. Monthly precipitation (mm) and mean monthly flow (m3/s) from October 2019 to October 2022.
Water 17 00678 g010
Figure 11. Exponential relationship between salinity (psu) and river flow (m3/s) in the study area.
Water 17 00678 g011
Table 1. Summary of cost, installation time, number of workers, impact and maintenance of the different experimental cells.
Geotextile SandbagsGeotextile FabricWooden PalisadePlantsControl
CostEUR 12,000EUR 4000EUR 1000EUR 25EUR 25
Workers/hours to install5/64/43/121/11/1
ImpactHighLowLowLowLow
MaintenanceNo maintenance3 × 3 h1 × hour
Disclaimer/Publisher’s Note: The statements, opinions and data contained in all publications are solely those of the individual author(s) and contributor(s) and not of MDPI and/or the editor(s). MDPI and/or the editor(s) disclaim responsibility for any injury to people or property resulting from any ideas, methods, instructions or products referred to in the content.