Article

Ozonation Treatment of Simulated Wastewater Containing Characteristic Pollutants from the Petrochemical Industry

1
Jiangsu Fangyang Water Co., Ltd., Lianyungang 222000, China
2
College of Urban Construction, Nanjing Tech University, Nanjing 211800, China
*
Author to whom correspondence should be addressed.
Water 2025, 17(4), 605; https://doi.org/10.3390/w17040605
Submission received: 2 January 2025 / Revised: 11 February 2025 / Accepted: 18 February 2025 / Published: 19 February 2025

Abstract

:
This study investigated key factors in the petrochemical industry and evaluated the oxidation performance of ozonation catalytic oxidation for treating phenol-simulated wastewater and actual wastewater spiked with phenol. In simulated phenol wastewater, optimal conditions (ozone dosage of 8 mg/L/min, pH 11, total dissolved solids (TDSs) of 1000 mg/L, and initial phenol concentration of 50 mg/L) yielded a maximum chemical oxygen demand (COD) removal rate of 90.60%. For actual wastewater spiked with phenol under the same conditions, maximum removal rates of phenol, COD, and total organic carbon (TOC) were 65.45%, 63.57%, and 79.65%, respectively. The degradation mechanisms and changes in organic matter during ozonation were analyzed using three-dimensional fluorescence spectroscopy, ultraviolet spectroscopy, and gas chromatography–mass spectrometry (GC-MS). The findings demonstrate that ozonation oxidation is an effective wastewater treatment method, significantly reducing pollutant concentrations and enhancing water quality.

1. Introduction

The petrochemical industry serves as a vital cornerstone of modern manufacturing, with its products extensively utilized across various sectors including energy, plastics, and chemical raw materials [1,2]. However, the wastewater generated during petrochemical production is characterized by its complex composition, often containing numerous hazardous pollutants [3]. These contaminants typically originate from the chemical raw materials employed in production processes, exhibiting high toxicity and resistance to degradation [4,5]. Due to their stability in the environment, these substances present a long-term risk to both ecosystems and human health. For example, such chemical pollutants can infiltrate the ecological chain through the water cycle, potentially leading to detrimental effects on the human central nervous system and impairing liver and kidney functions [6,7]. Among these pollutants, phenol is one of the most prevalent in petrochemical wastewater and serves as a typical representative that has been extensively studied.
The presence of phenol in petrochemical wastewater not only poses a direct threat to the stability of aquatic ecosystems but also jeopardizes the safety of surrounding water resources [5]. Elevated concentrations of phenol inhibit the activity of microorganisms in wastewater, subsequently diminishing the efficacy of conventional biological treatment methods [8]. Furthermore, due to phenol’s high chemical oxygen demand (COD), it can induce severe hypoxic conditions in water bodies, further disrupting the ecological balance of aquatic environments [9]. Consequently, the efficient treatment of phenolic and other specific pollutants in petrochemical wastewater has emerged as a critical area of research within the field of water treatment.
At present, the removal of characteristic contaminants primarily utilizes a range of technologies, including physical adsorption methods, biological decomposition methods, and advanced oxidation processes [10,11,12,13,14]. Among these, the physical adsorption method, particularly activated carbon adsorption, is notable for its high efficiency and ease of operation. However, its effectiveness can be limited by the saturation levels of the adsorbent, and there are challenges associated with the regeneration of the adsorption materials [15]. The biological degradation method relies on microbial metabolism to convert phenolic compounds into carbon dioxide and water. While this method is cost-effective and environmentally friendly, the high toxicity and variable concentrations of phenol can inhibit microbial activity, adversely impacting treatment efficiency [9]. In contrast, advanced oxidation technology has attracted increasing interest in recent years due to its potent oxidative capabilities and broad applicability.
Advanced oxidation processes (AOPs) serve as a method for wastewater treatment, focusing on the generation of highly reactive oxidants that can effectively decompose persistent organic pollutants in wastewater [16]. Ozone oxidation technology, a subset of advanced oxidation, has gained significant traction in wastewater treatment due to its rapid effectiveness and absence of secondary pollution [17,18]. A key characteristic of ozone oxidation technology is the production of strong oxidizing free radicals through the decomposition of ozone, which can efficiently degrade organic pollutants in wastewater [13,19]. The reaction mechanism involves two primary pathways: one in which ozone molecules directly oxidize pollutants, and another in which the free radicals generated from ozone decomposition react with the pollutants, transforming them into harmless byproducts such as carbon dioxide and water [20,21]. Recent advancements in AOPs have focused on enhancing radical generation efficiency and optimizing process parameters for industrial applications. For instance, Eghbali et al. demonstrated that coupling ozone with heterogeneous catalysts significantly improved hydroxyl radical (•OH) yield, achieving near-complete mineralization of phenolic compounds in synthetic wastewater [22]. Similarly, Hassani and colleagues highlighted the role of pH-responsive catalysts in tailoring ozone decomposition pathways, thereby enhancing selectivity toward target pollutants [23]. These studies underscore the importance of catalyst design and reaction condition optimization in advancing ozone-based AOPs.
Despite these advancements, challenges persist in applying ozone oxidation to real-world petrochemical wastewater, which often contains complex matrices of salts, suspended solids, and competing organic compounds. Previous studies have primarily focused on synthetic wastewater under idealized conditions, leaving a gap in understanding the interplay between ozone dosage, pH, total dissolved solids (TDSs), and initial pollutant concentration in actual industrial effluents. Furthermore, mechanistic insights into the degradation pathways of phenol and its intermediates under varying ionic strengths remain underexplored.
Therefore, this paper systematically investigates the effect of ozone concentration on the removal of phenol, utilizing ozone as an oxidant for phenolic pollution and other pertinent characteristics in petrochemical wastewater. The experimental design examines the influence of various reaction conditions on phenol degradation efficiency, including the initial mass concentration of phenol and the impact of initial pH levels on phenol degradation. Furthermore, based on the experimental data, this study analyzes the reaction kinetics of ozone oxidation of phenol, providing theoretical support and reference for optimizing the practical application of ozone oxidation technology in wastewater treatment.

2. Materials and Methods

2.1. Materials

Phenol, sulfuric acid, and sodium hydroxide were all analytically pure and purchased from Sinopharm Chemical Reagent Co., Ltd, Shanghai, China. Silver sulfate, mercury sulfate, and potassium dichromate, also of analytical purity, were purchased from Nanjing Chemical Reagent Co. Ltd, Nanjing, China. Simulated phenol wastewater was formulated by dissolving analytically pure phenol in deionized water without the addition of any salts or total dissolved solids (TDSs). The concentration of phenol in the simulated wastewater was established at 50 mg/L, with a COD of 120 mg/L. In the case of actual wastewater, the COD was measured at 68 mg/L and the total dissolved solids (TDSs) at 2156 mg/L, with a phenol concentration of 25 mg/L in the spiked wastewater.

2.2. Ozone Oxidation Experiment

At room temperature, 5 L of phenol simulated wastewater (initial pH 8) or actual wastewater (initial pH 8) was injected into the reaction column; ozone was generated by an ozone generator (model: CF-G-3-10g, size: 380 × 840 × 460 mm, Qingdao Guolin, Qingdao, China), and the set flow rate of ozone was passed into the reaction column for aeration. The ozone concentration was checked periodically during the experiment to ensure that it remained stable. The ozone oxidation experimental setup is shown in Figure S1. The reaction conditions—including ozone dosage (ozone concentration of 20 mg/L, aeration volume of 1.5 L/min), pH, and oxidation time—were controlled, and samples were withdrawn every 10 min to measure COD, total organic carbon (TOC), and phenol concentrations. In the experiment, the solution was adjusted to the target pH by adding sodium hydroxide solution or sulfuric acid solution. The phenol concentration was determined spectrophotometrically using 4-aminoantipyrine, with the corresponding standard curves outlined in Figure S2.

3. Results and Discussion

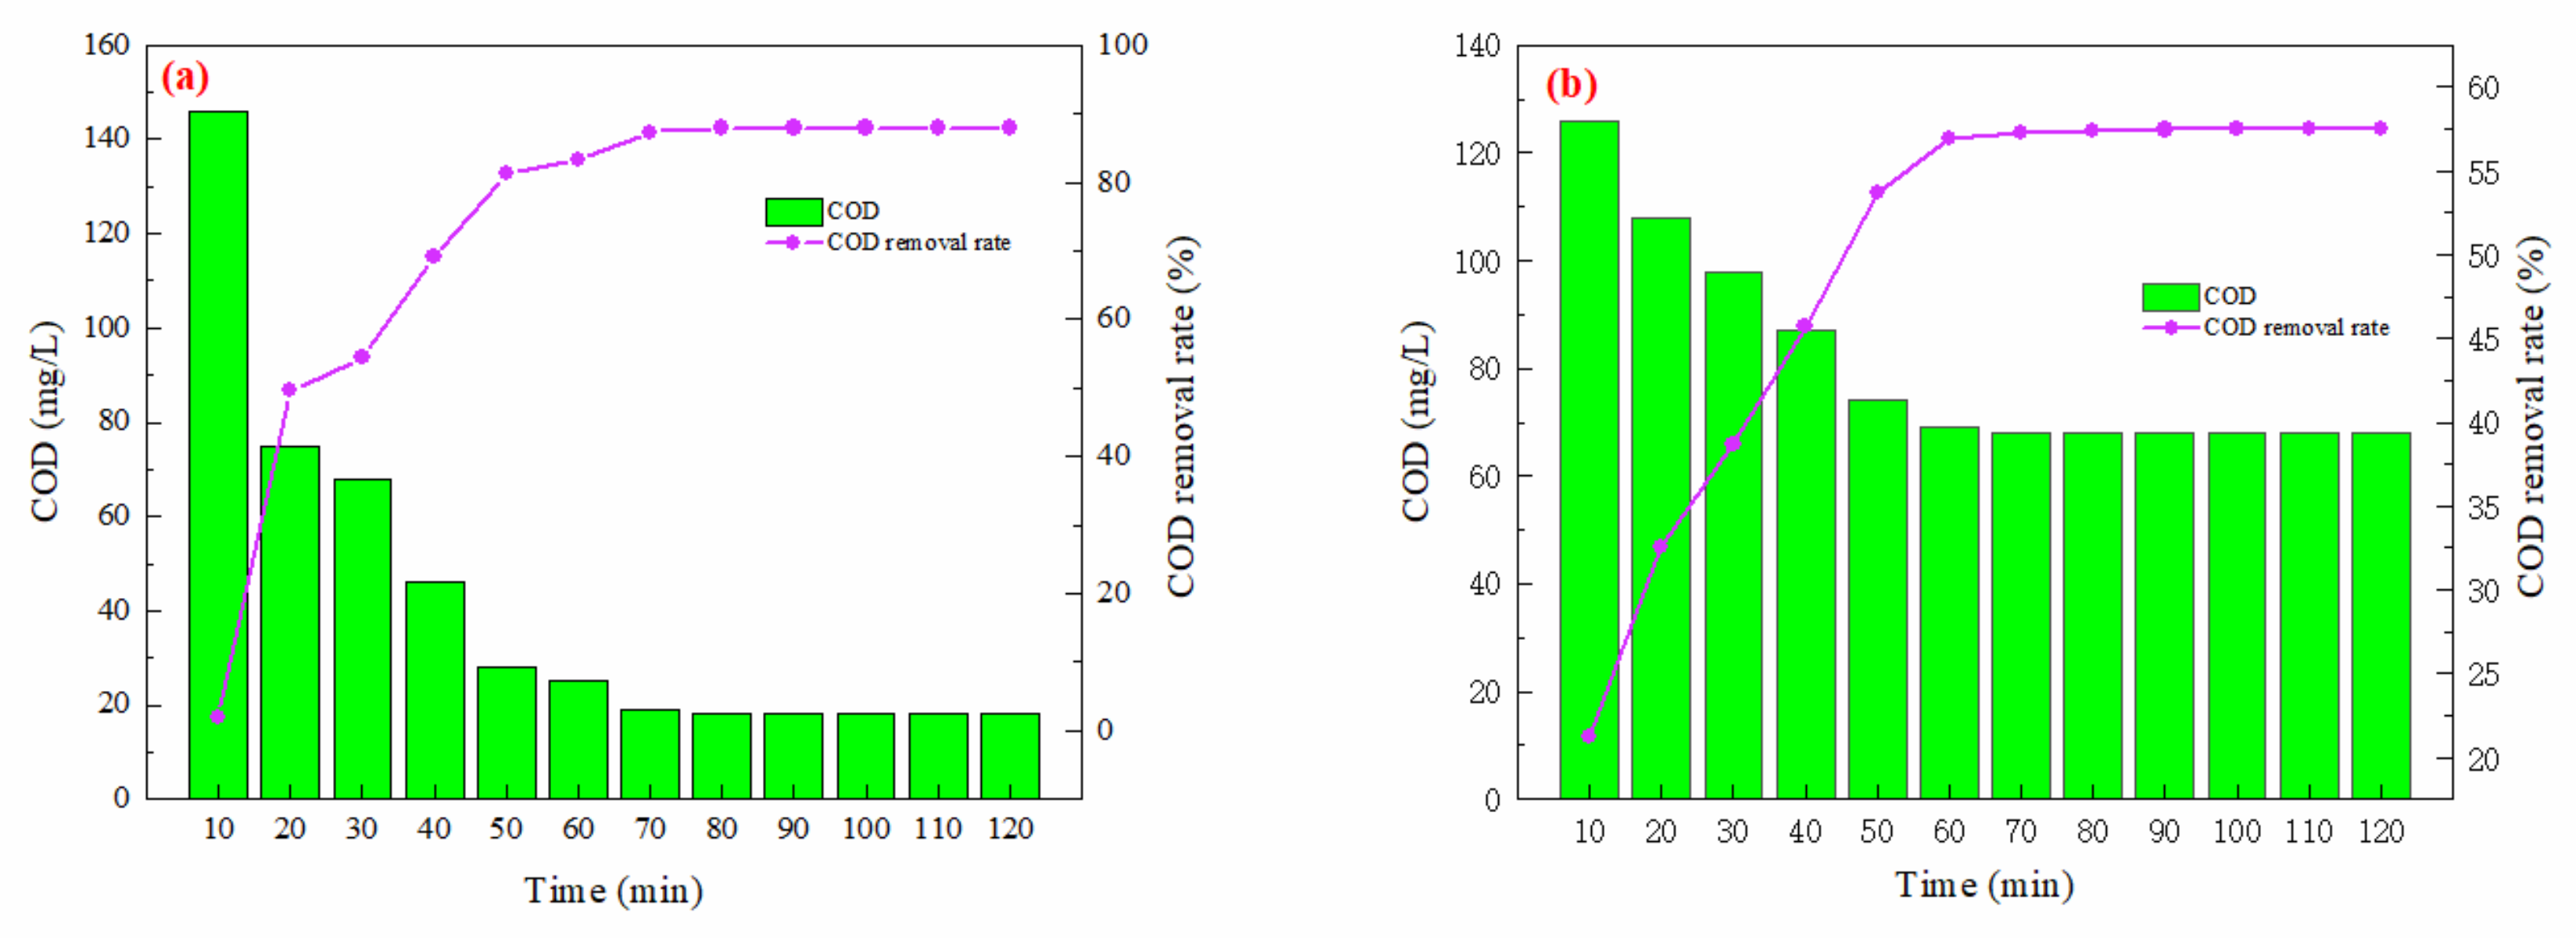
3.1. Effect of Oxidation Time on COD Removal Rate

As illustrated in Figure 1a, the COD removal rate stabilizes around 60 min of reaction time, achieving a rate of 83.22%. Consequently, a total reaction time of 60 min was selected for subsequent simulation experiments. Similarly, as shown in Figure 1b, the COD removal rate for actual wastewater (spiked with phenol) tended towards a plateau at around 60 min, reaching a rate of 57.45%. Thus, a total reaction time of 60 min was also defined for the subsequent experiments involving actual wastewater.
In this reaction mechanism, the trend in the COD removal rate illustrates the relationship between the reaction rate and time. Initially, during the experiment, a high concentration of reactants resulted in rapid oxidation, leading to a significant increase in the COD removal rate. However, after 60 min, the COD removal rate began to plateau. This decrease in efficiency can be attributed to the depletion of readily available reactants and the persistence of remaining, difficult-to-biodegrade organic compounds.

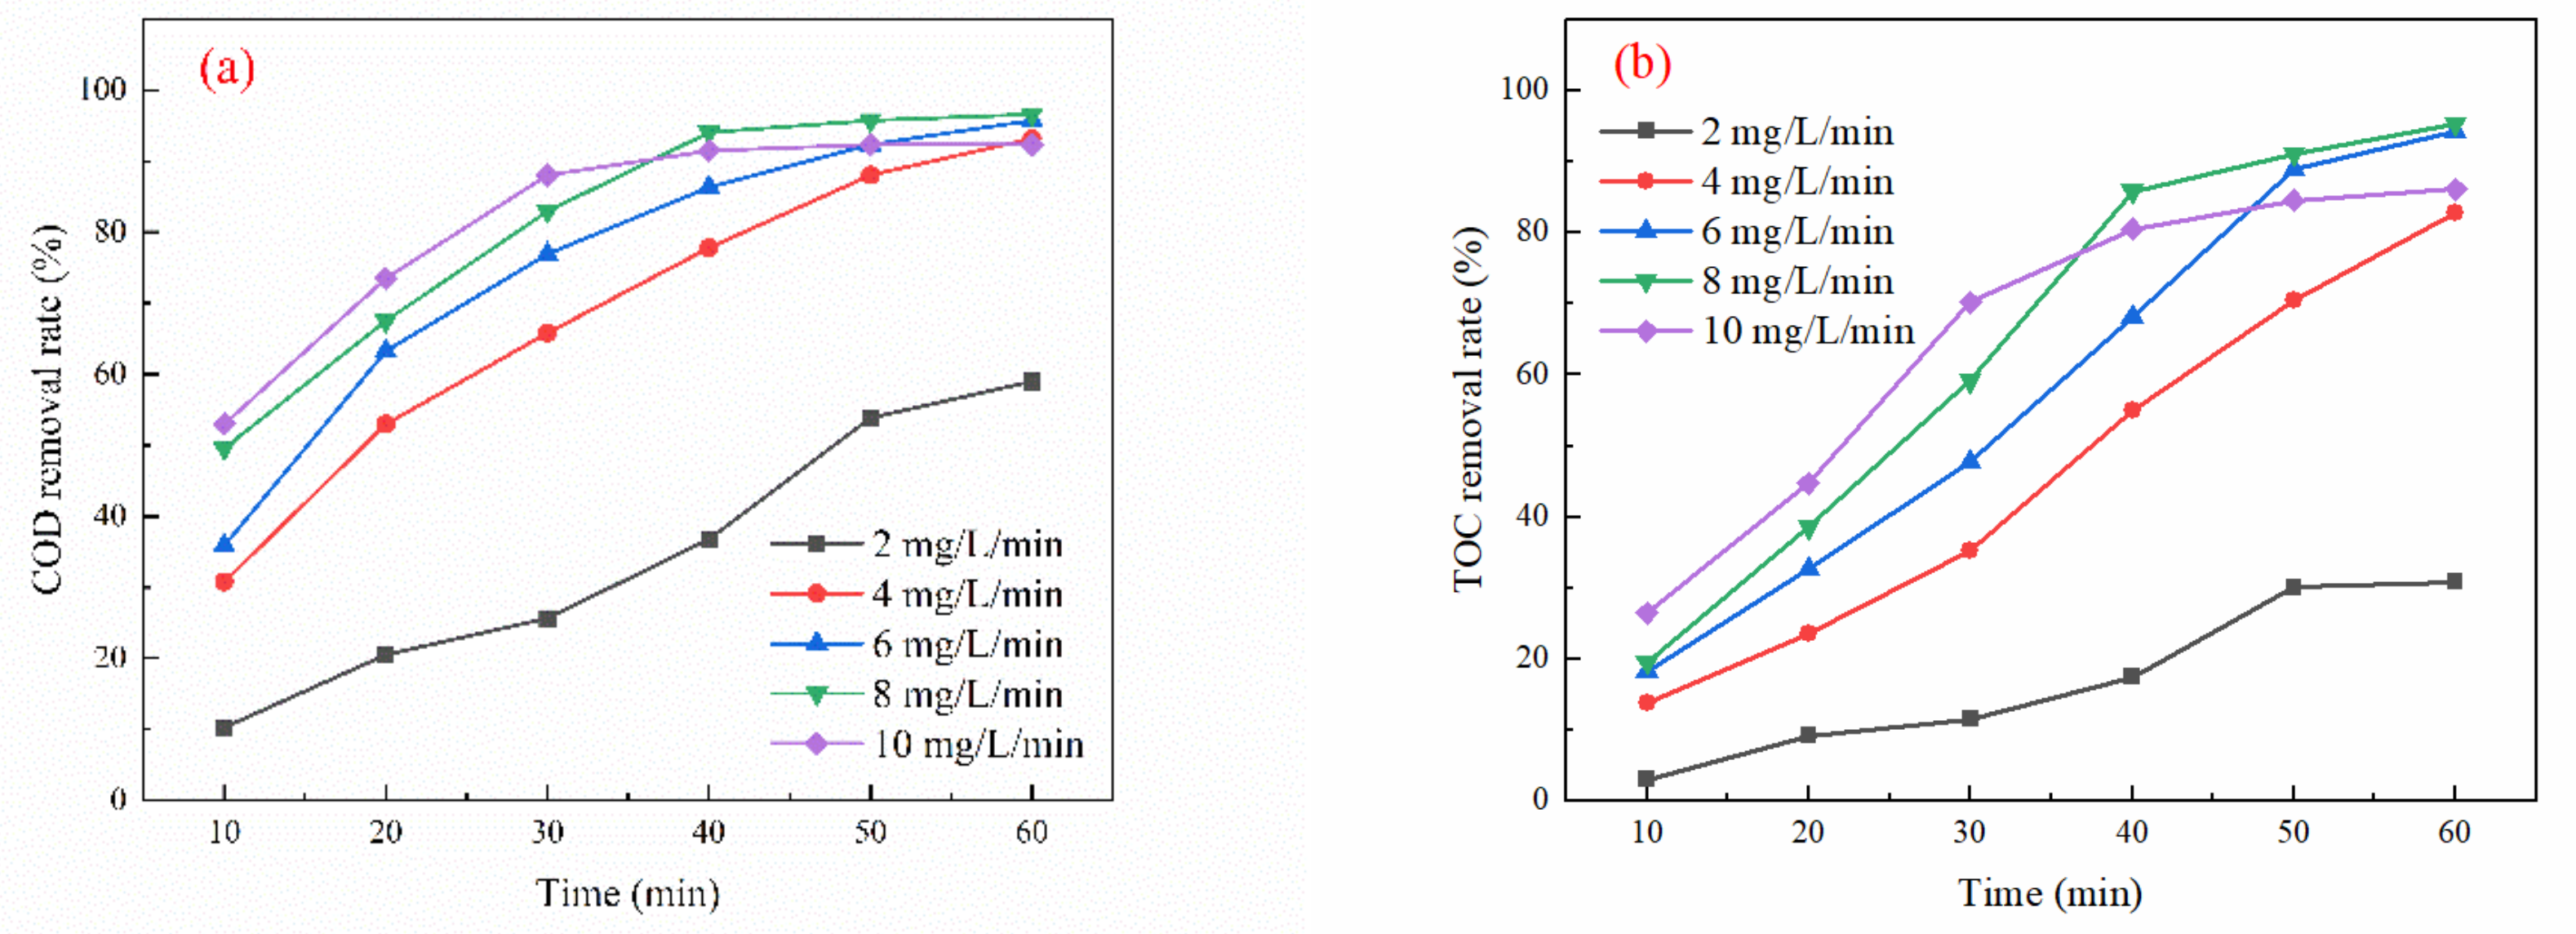
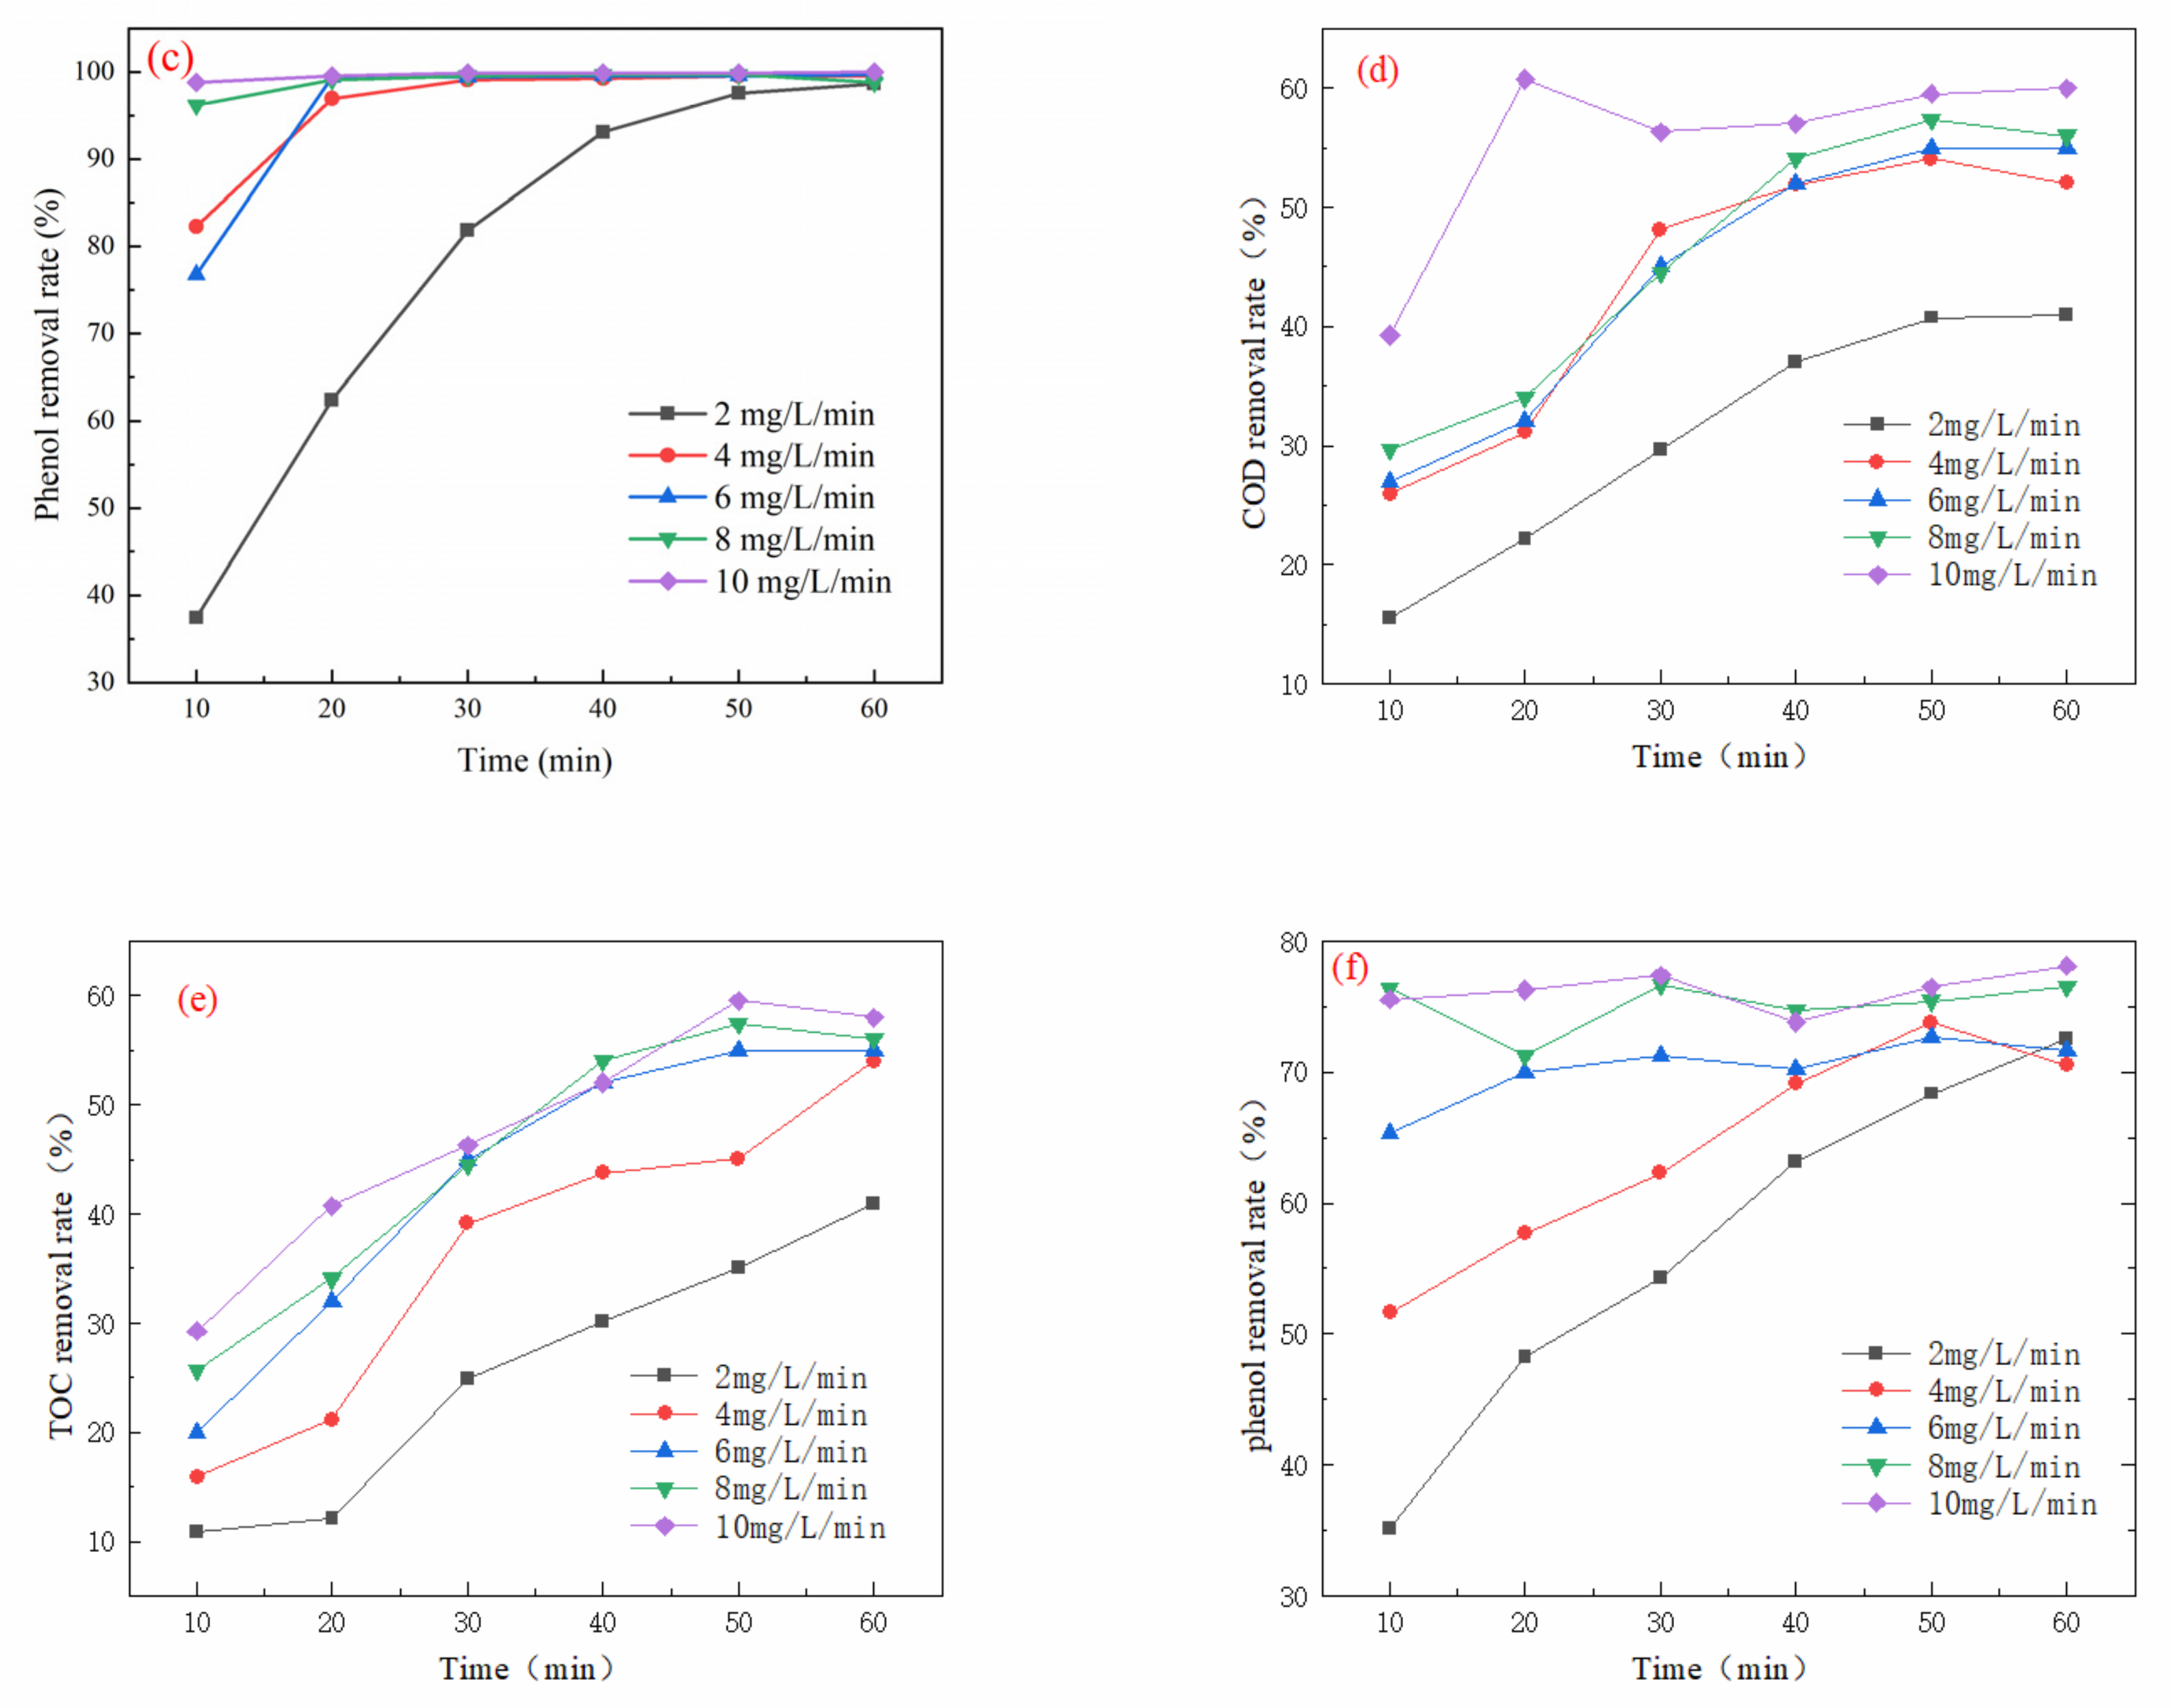
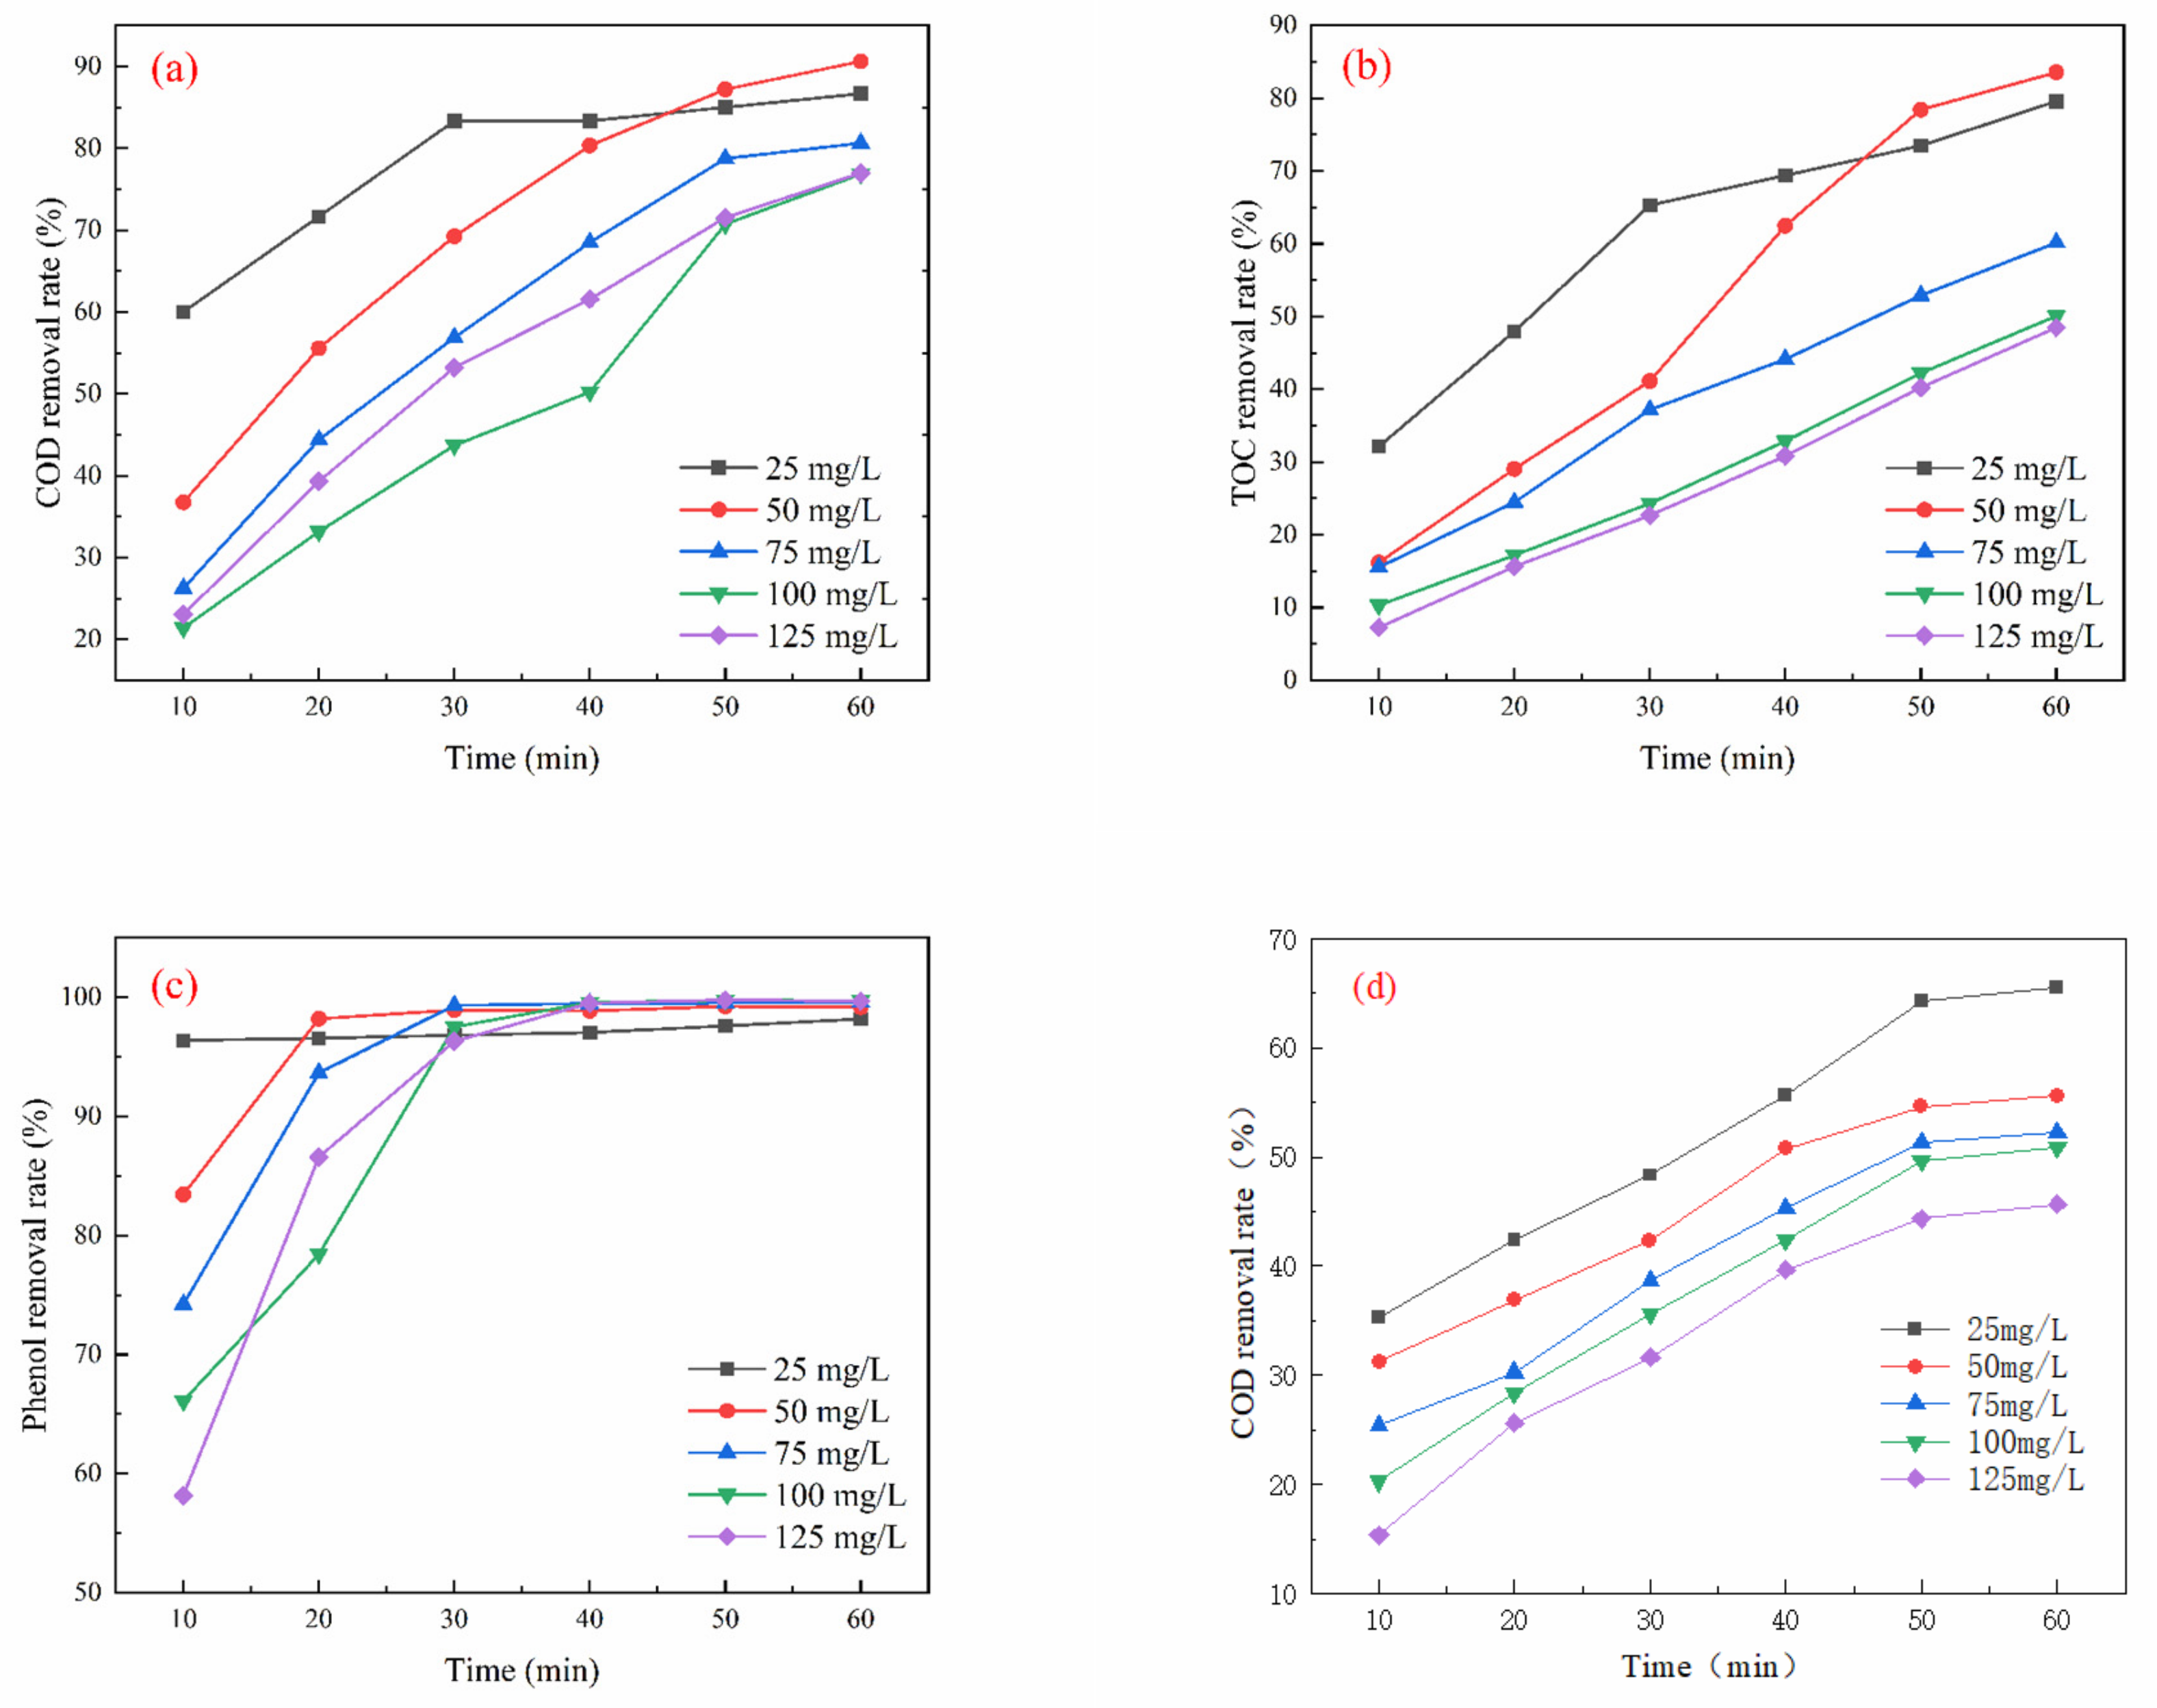
3.2. Effect of Ozone Dosage on COD Removal Rate

As depicted in Figure 2a, the COD removal initially increased with the rising ozone dosage, reaching an optimum of 96.58% at an ozone dosage of 8 mg/L/min after 60 min of oxidation, before subsequently declining. Similarly, in Figure 2b, the TOC removal demonstrated a comparable trend, increasing until it peaked at 95.37% under the same ozone dosage and time conditions. Figure 2c shows that the initial rate of phenol removal increased gradually with the ozone dosage, stabilizing after 20 min. The optimal phenol removal rate reached 99.55% at an ozone dosage of 8 mg/L/min and an oxidation time of 60 min. Further analysis in Figure 2d indicates that the COD removal incrementally increased with ozone dosage, peaking at 56.53% when the ozone dosage was 8 mg/L/min and the oxidation time was 60 min. Figure 2e reveals that the TOC removal rate increased consistently with rising ozone dosage, achieving an optimum of 57.42% under the same dosage and time conditions. Lastly, Figure 2f illustrates that the phenol removal rate also increased steadily with ozone dosage, reaching an optimum of 76.85% at an ozone dosage of 8 mg/L/min and an oxidation time of 60 min.
The removal of organic matter from wastewater increases with higher ozone dosage. This is due to improved ventilation, which supplies sufficient ozone for the treatment process. As the amount of ozone gas increases, so does the driving force for mass transfer between the gas and liquid phases, resulting in enhanced mixing of ozone with wastewater. This enhanced interaction increases the production efficiency of hydroxyl radicals (•OH), allowing for more effective mineralization of organic pollutants [24]. However, various experimental limitations can constrain the efficiency of ozone utilization in oxidation processes. Excessive ozone ventilation does not lead to an unlimited increase in efficiency; rather, it can decrease the residence time of ozone in the wastewater. This reduction in residence time lessens the contact reactions between ozone molecules, active substances, and organic matter [24,25].

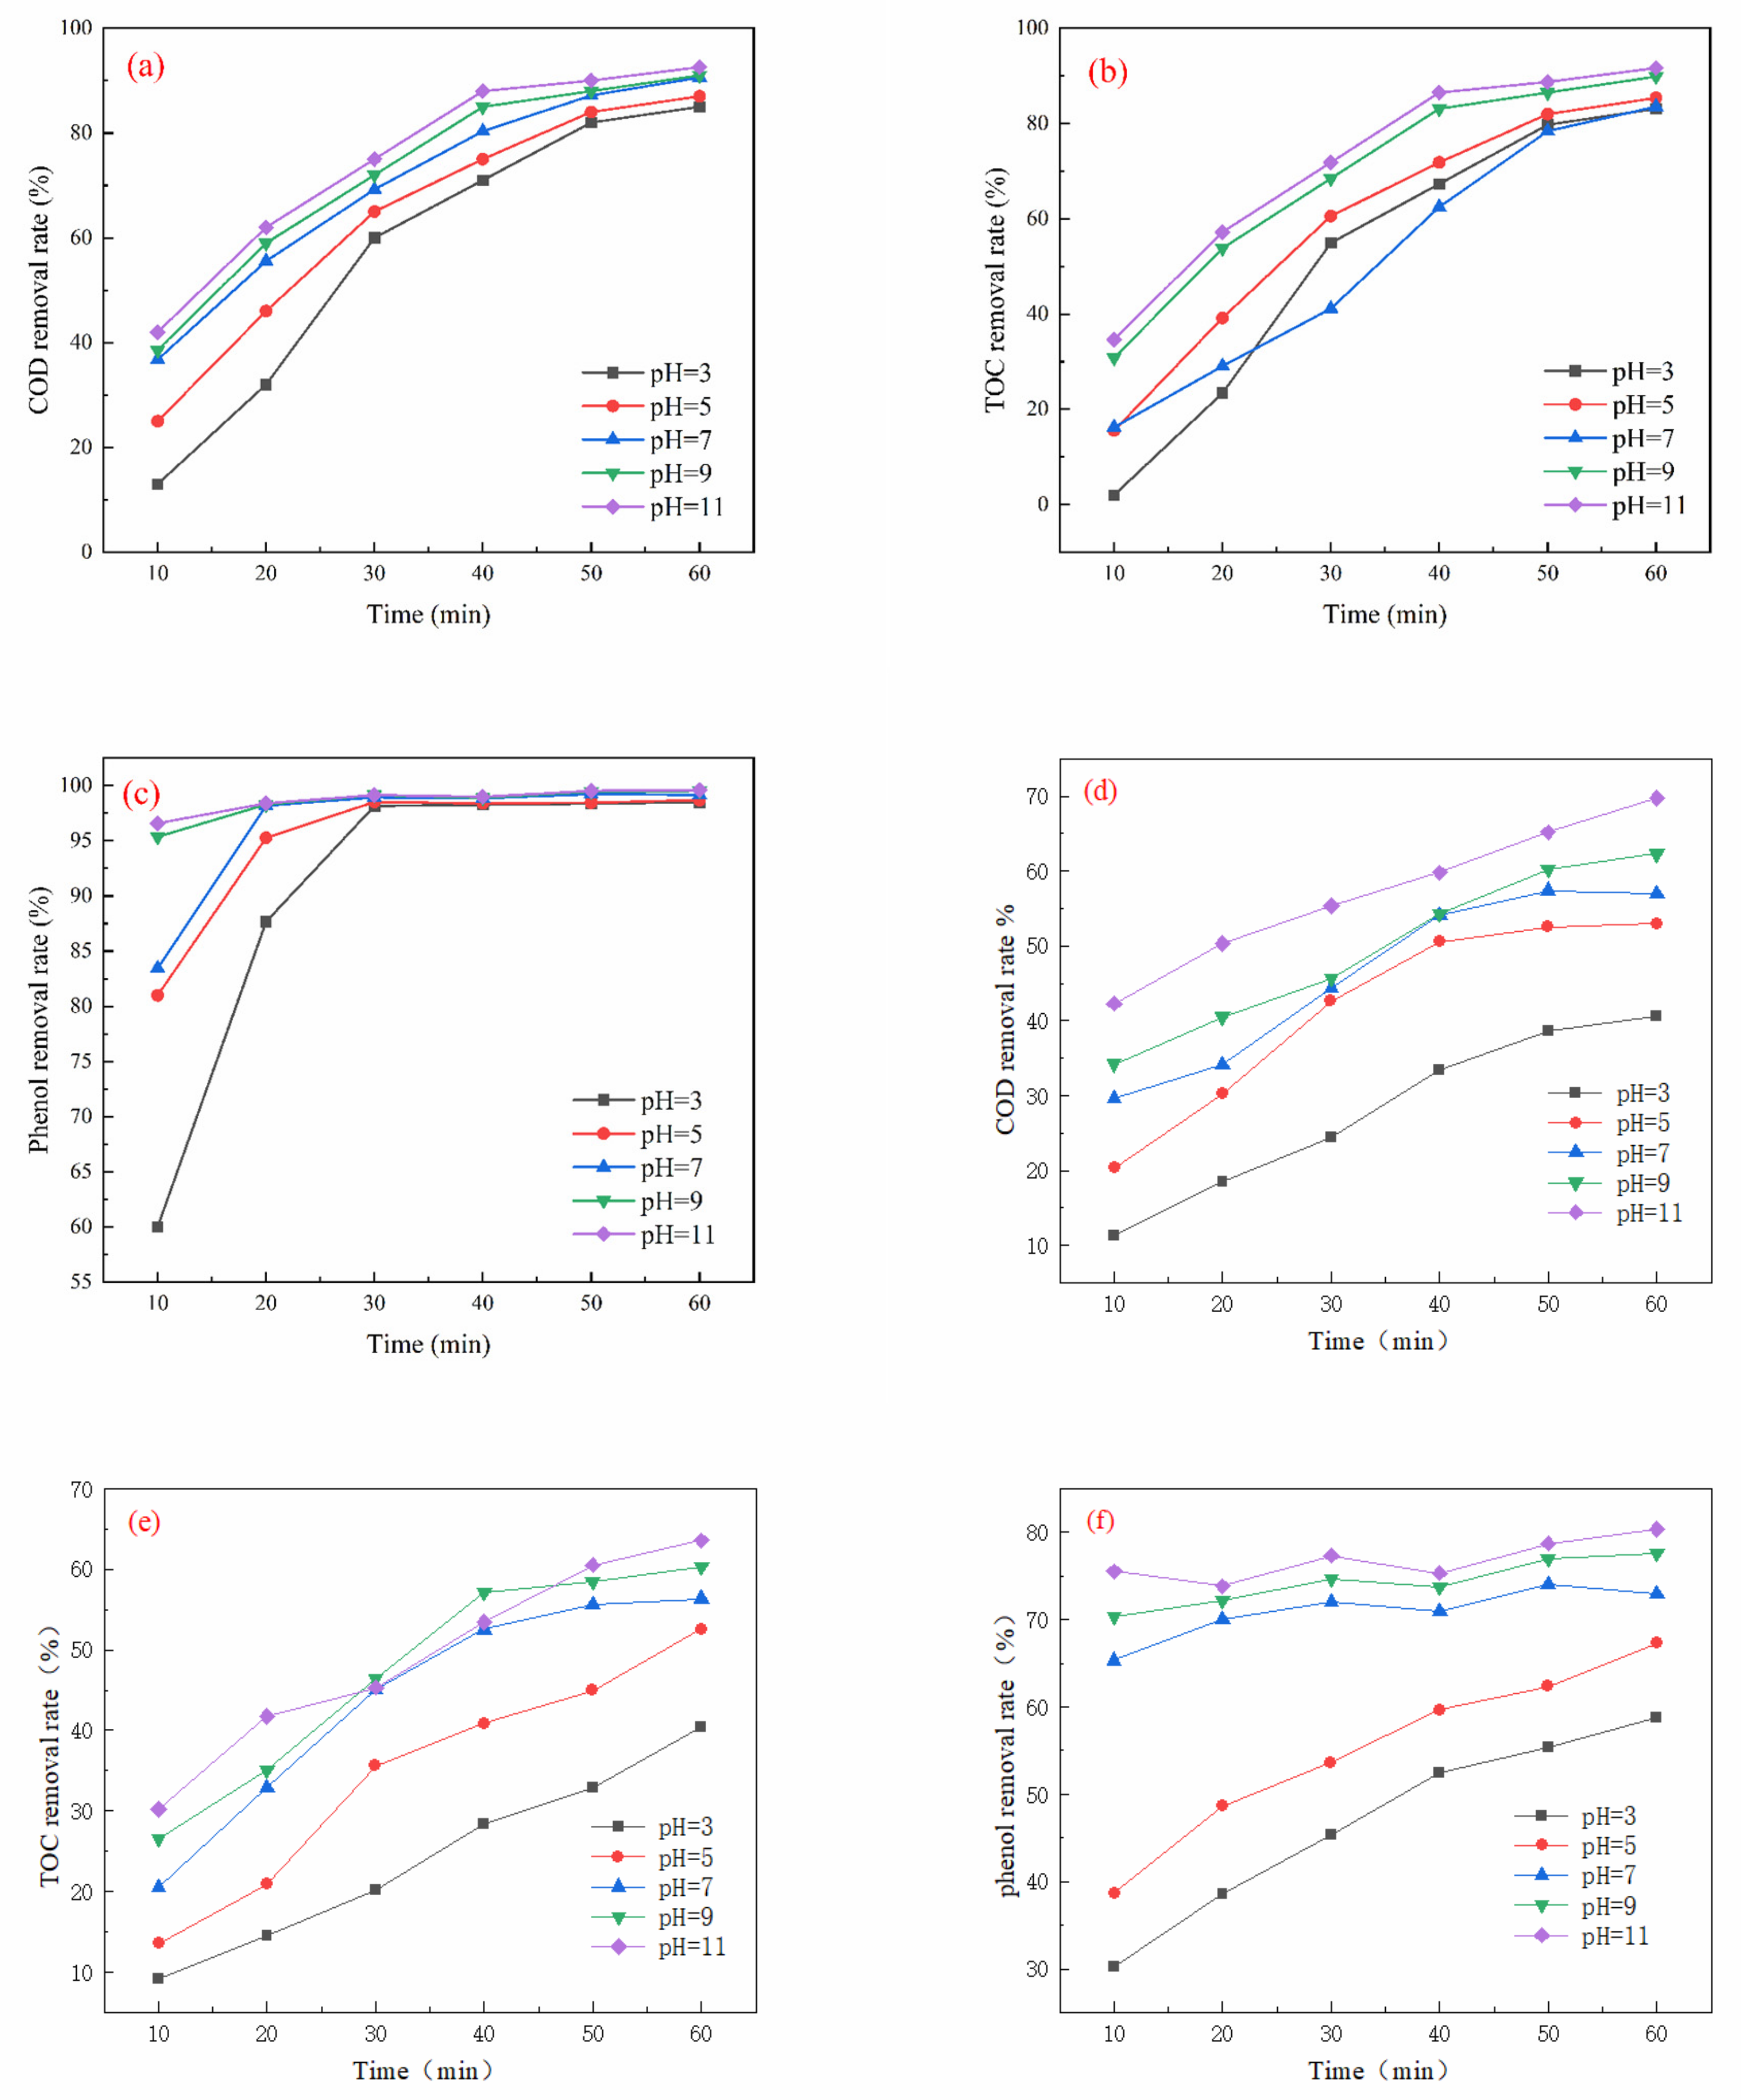
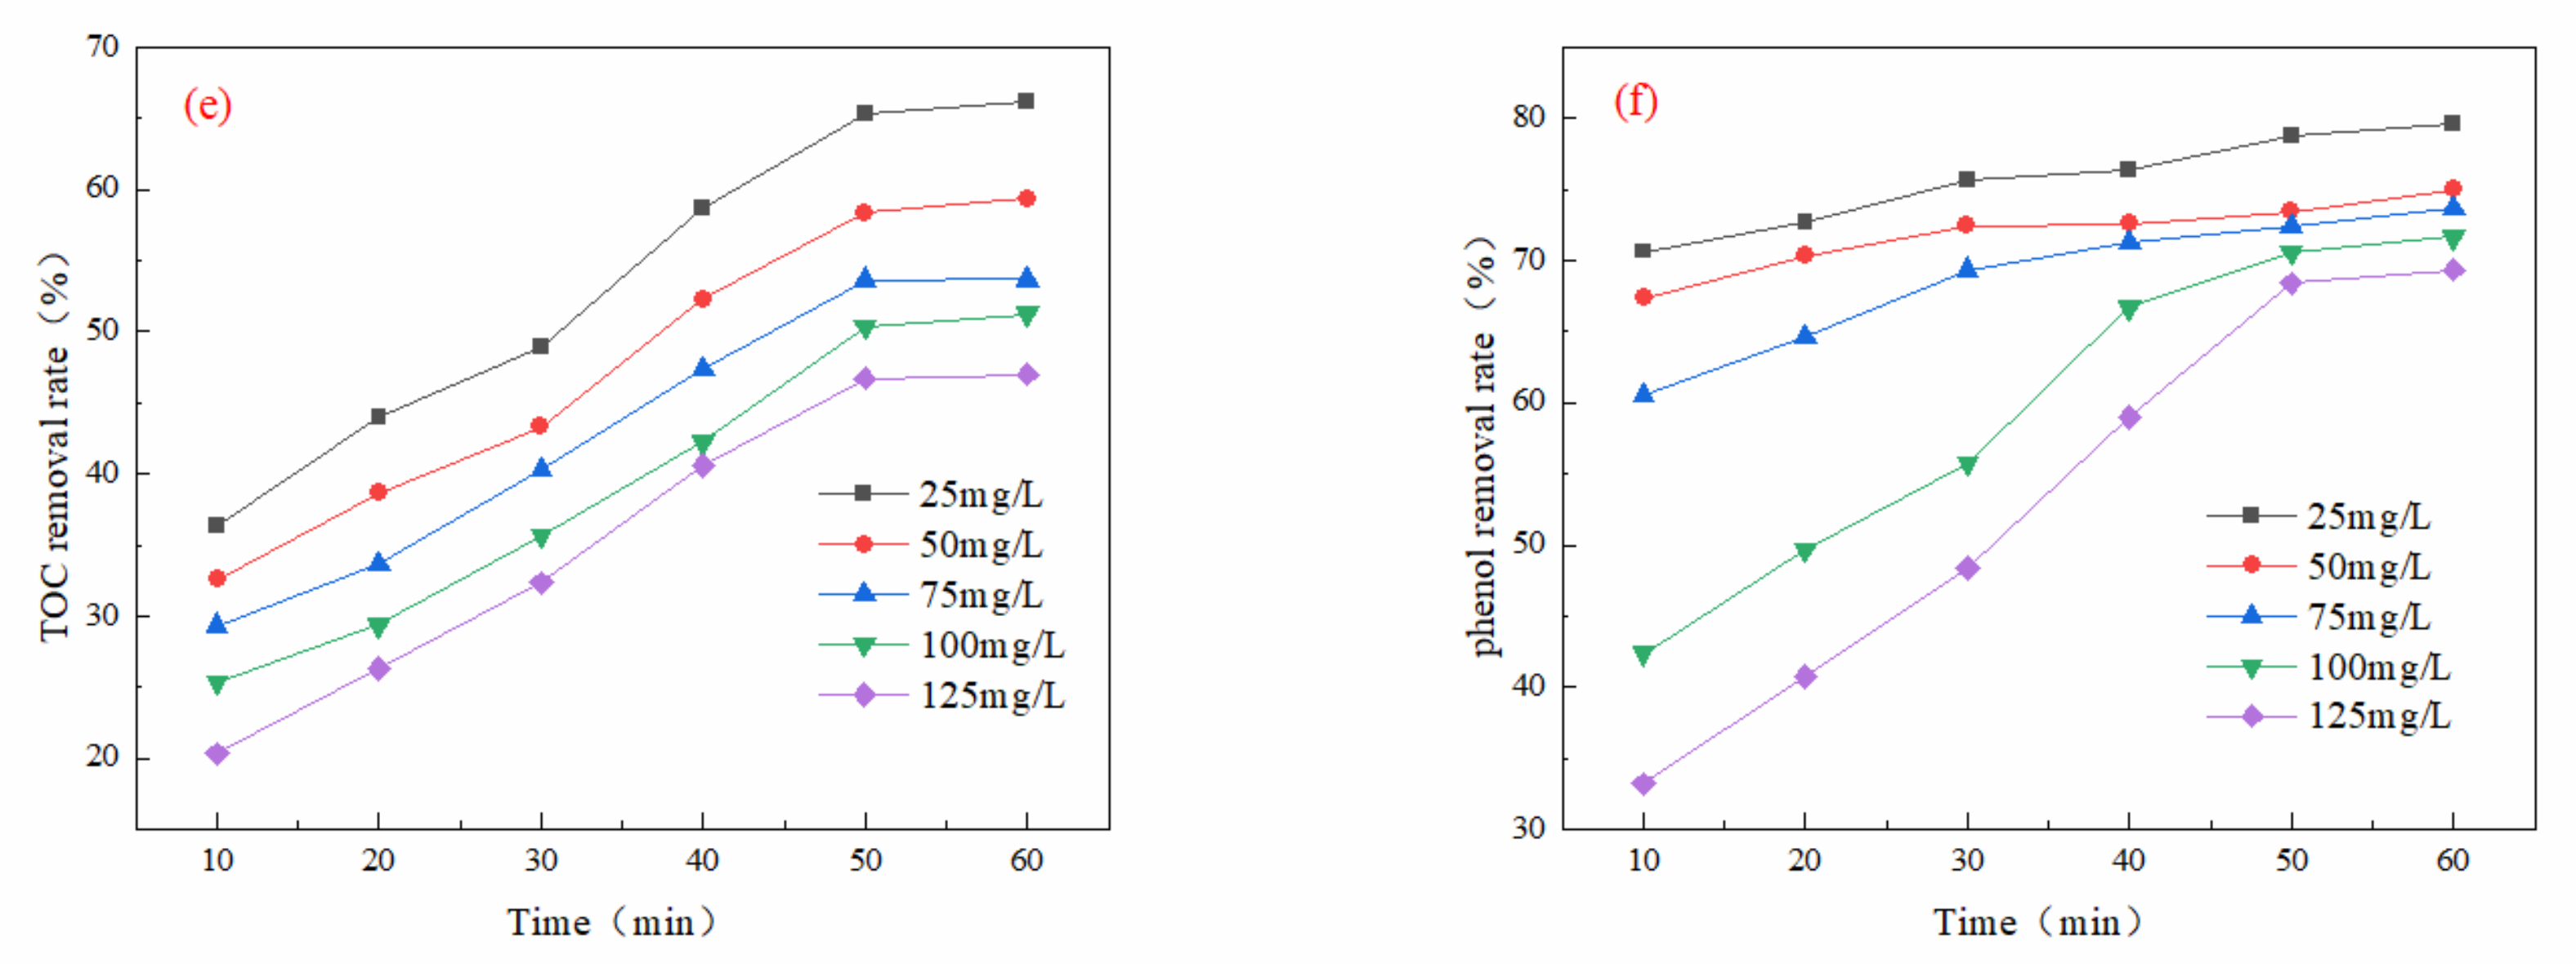
3.3. Effect of pH on COD Removal Rate

As shown in Figure 3a, COD removal increased progressively with increasing pH, achieving an optimum removal rate of 96.58% at a pH of 11 after 60 min of oxidation. Similarly, Figure 3b indicates that TOC removal also increased with rising pH, peaking at 90.33% at a pH of 11 with the same oxidation duration. Figure 3c shows that the removal of phenol increased steadily with higher ozone dosage, stabilizing after 30 min. The best phenol removal rate of 99.60% was observed at a pH of 9 and after 60 min of oxidation. In Figure 3d, the COD removal rate demonstrated a consistent increase with pH, reaching a maximum of 69.75% at a pH of 11 after 60 min. Likewise, Figure 3e illustrates that TOC removal grew steadily with increasing pH, with an optimum removal rate of 63.57% at a pH of 11 and an oxidation time of 60 min. Lastly, as depicted in Figure 3f, phenol removal initially increased steadily with rising ozone dosage, achieving an optimum rate of 80.63% at a pH of 11 and 60 min of oxidation.
Wastewater pH is a crucial factor in the removal of organic matter through catalytic ozone oxidation, as it influences the state of organic compounds, the decomposition of ozone, and the surface properties of the catalyst [26]. Experimental results indicate that the efficiency of the catalytic oxidation reaction is enhanced under alkaline conditions. This enhancement can be attributed to two main reasons: Firstly, an increased presence of •OH in alkaline environments facilitates the reaction with ozone, leading to a greater production of •OH and thereby improving the degradation effect. Secondly, alkaline conditions may alter the structure of organic matter in wastewater, promoting its dissociation and resulting in more effective and rapid oxidation [27]. When pH < pKa, phenol exists as a neutral molecule (C6H5OH) with a low electron density of the benzene ring, and the direct oxidation reaction with ozone molecules (O3) is slow. When pH > pKa, phenol deprotonates to phenol anion (C6H5O); the benzene ring electron density increases, and it is more susceptible to electrophilic attack by ozone and hydroxyl radical (•OH), thus accelerating degradation. At pH 11, the phenol removal of the simulated wastewater was as high as 99.60%, and the COD and TOC removal rates were 96.58% and 90.33%, respectively. The phenol, COD, and TOC removal in the actual wastewater (pH 11) reached 80.63%, 69.75%, and 63.57%, respectively, which was significantly better than that in neutral or acidic conditions. Under alkaline conditions, ozone decomposed rapidly to generate highly reactive •OH (E° = 2.8 V), whose oxidizing capacity is much higher than that of molecular ozone (E° = 2.07 V), thus significantly enhancing the mineralization efficiency.

3.4. Effect of TDSs on COD Removal Rate

As illustrated in Figure 4a, the COD removal rate declined with increasing TDS levels. The optimal COD removal achieved was 88.91% with a TDS dosage of 1000 mg/L and an oxidation duration of 60 min. Figure 4b shows a gradual decrease in the TOC removal rate with rising TDS concentrations, with a maximum TOC removal of 87.51% also recorded at a TDS dosage of 1000 mg/L and an oxidation time of 60 min. In Figure 4c, it is observed that the phenol removal rate initially increases with higher ozone dosages but stabilizes after 30 min. The best phenol removal rate of 98.50% was achieved with a TDS dosage of 1000 mg/L and an oxidation duration of 60 min.
In Figure 4d, a similar trend is noted, where COD removal decreases as TDS levels increase, with an optimal COD removal of 62.30% at a TDS dosage of 1000 mg/L and an oxidation time of 60 min. Figure 4e indicates that TOC removal initially increases with TDS concentration, achieving a peak removal rate of 63.57% under the same dosage and time conditions. As demonstrated in Figure 4f, the phenol removal rate increases with the ozone dosage until it stabilizes after 50 min, achieving a maximum removal rate of 79.36% at a TDS dosage of 1000 mg/L and an oxidation time of 60 min.
The preceding analysis illustrates the impact of TDS content in the solution on ozone oxidation efficiency. An increase in TDSs elevated the ionic strength of the solution, which may hinder the mass transfer and diffusion of ozone molecules, leading to a decrease in COD and TOC removal efficiencies. Conversely, at a TDS level of 1000 mg/L, the electrolytes present in the system might facilitate free radical generation, thereby enhancing ozone oxidation and resulting in improved COD and TOC removal efficiencies. Nonetheless, further increases in TDSs could diminish the effectiveness of free radicals due to the “shielding effect”.

3.5. Effect of Initial Phenol Concentration on COD Removal Rate

As illustrated in Figure 5a, the COD removal rate gradually declined with increasing initial phenol concentration. The optimal COD removal rate reached 90.60% when the initial phenol concentration was 50 mg/L and the oxidation time was 60 min. Figure 5b shows that TOC removal initially increased gradually with the rise in initial phenol concentration, peaking at an optimum removal rate of 83.55% at an initial phenol concentration of 50 mg/L and a 60 min oxidation time. Figure 5c indicates that the phenol removal rate initially increased with the initial phenol concentration but stabilized after 30 min. The optimal phenol removal rate of 99.16% occurred at an initial phenol concentration of 50 mg/L and an oxidation time of 60 min.
In Figure 5d, the COD removal rate demonstrated a gradual decrease with increasing initial phenol concentration, achieving an optimal removal rate of 65.45% at an initial phenol concentration of 50 mg/L and an oxidation time of 60 min. As shown in Figure 5e, TOC removal also increased gradually with higher initial phenol concentrations, with the peak removal rate reaching 63.57% under the same conditions of 50 mg/L phenol concentration and 60 min of oxidation time. Finally, Figure 5f illustrates that the removal rate of phenol experienced an initial increase with increasing concentration, followed by stabilization after 30 min. The optimal phenol removal rate of 79.65% was observed at an initial phenol concentration of 50 mg/L and an oxidation time of 60 min.
The removal of COD exhibited a gradual decrease as the initial concentration of phenol increased. This phenomenon may be attributed to the initial reaction of ozone directly with phenol, resulting in the rapid destruction of the benzene ring through the generation of •OH. This process produces intermediate compounds such as quinones and carboxylic acids. Furthermore, a higher concentration of phenol depletes the available ozone and free radicals, leading to insufficient oxidants in the reaction system and consequently limiting the COD removal efficiency [28]. Therefore, it can be concluded that a greater initial concentration of phenol correlates with a slower mineralization rate.

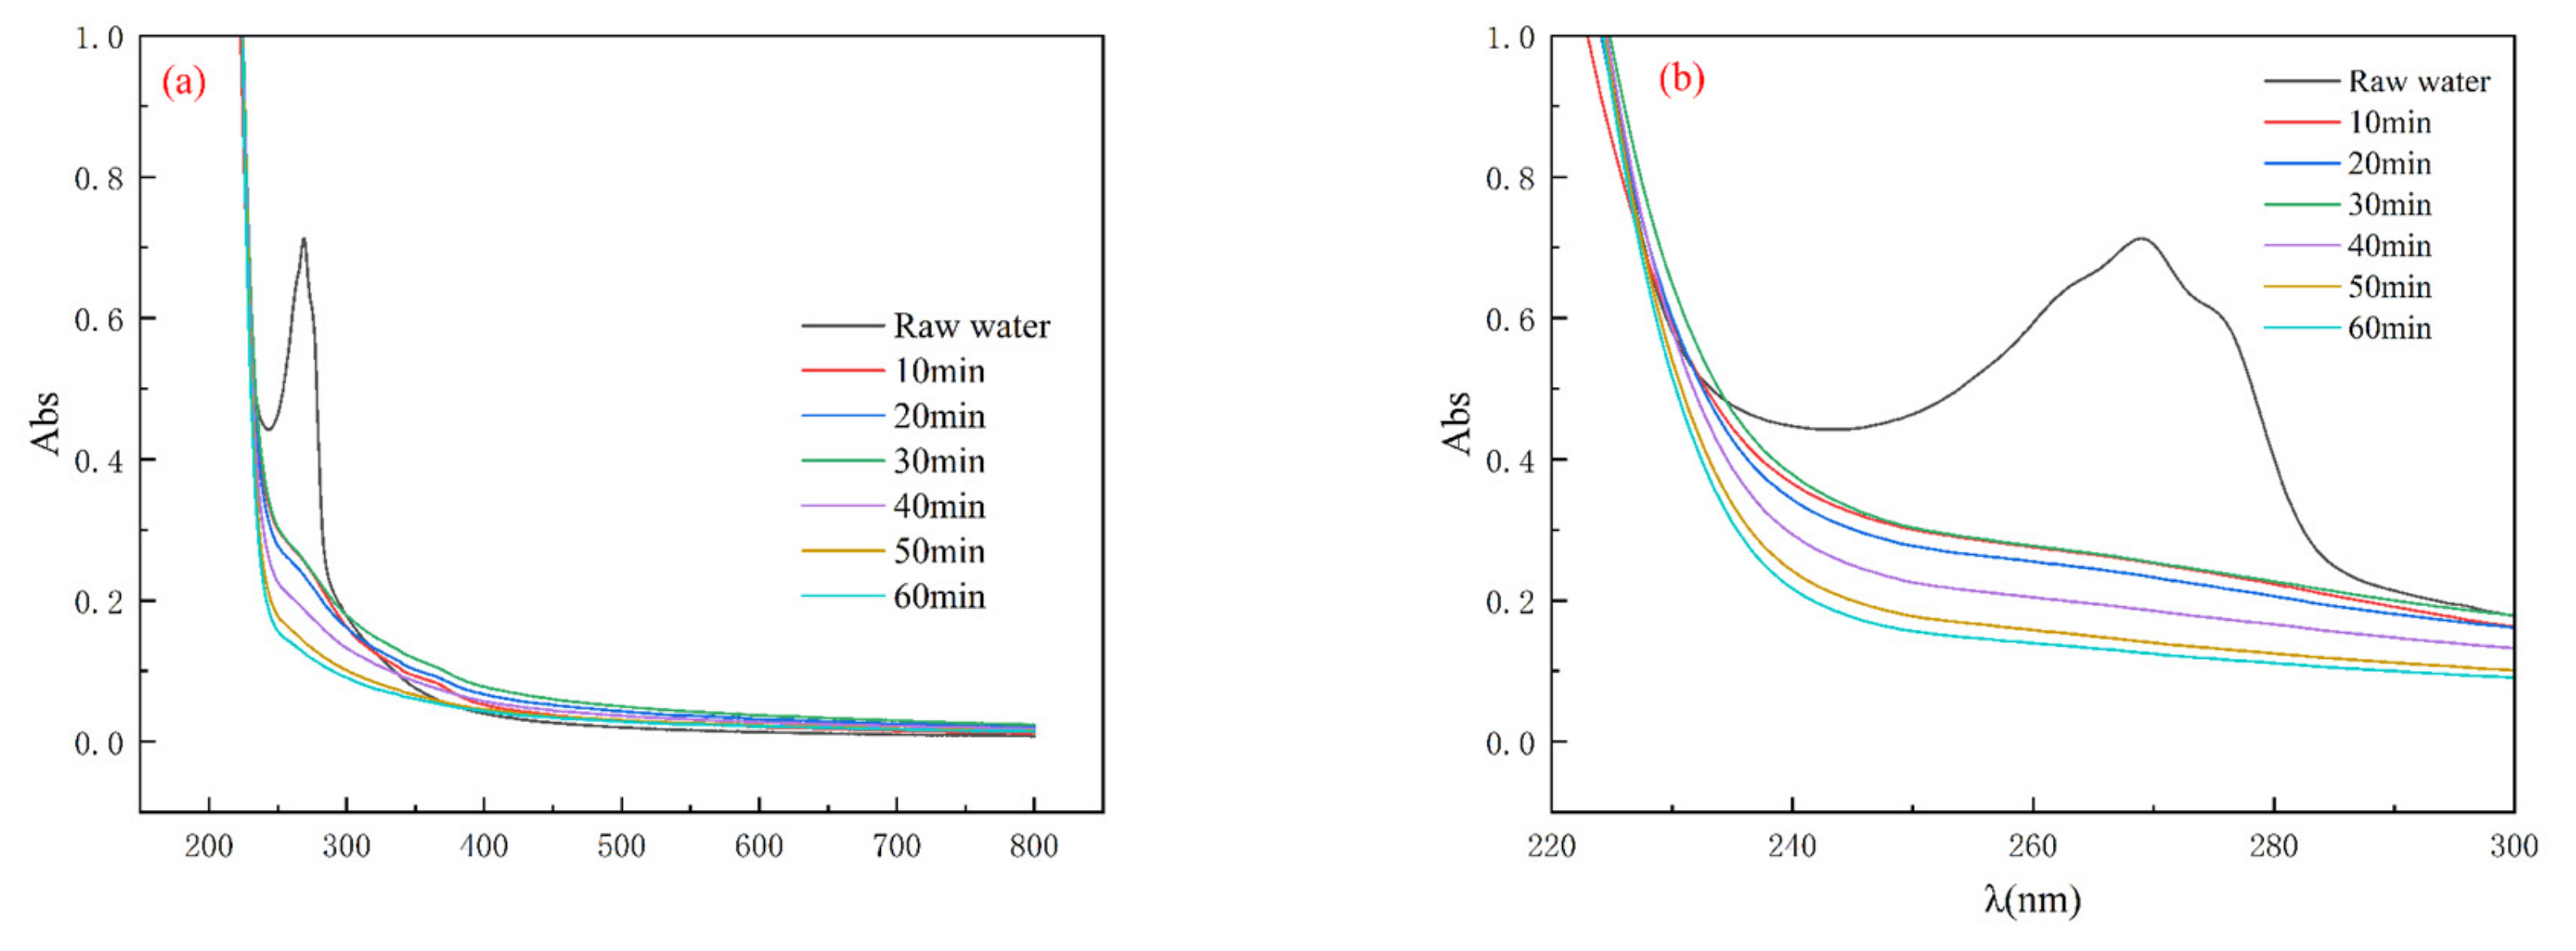
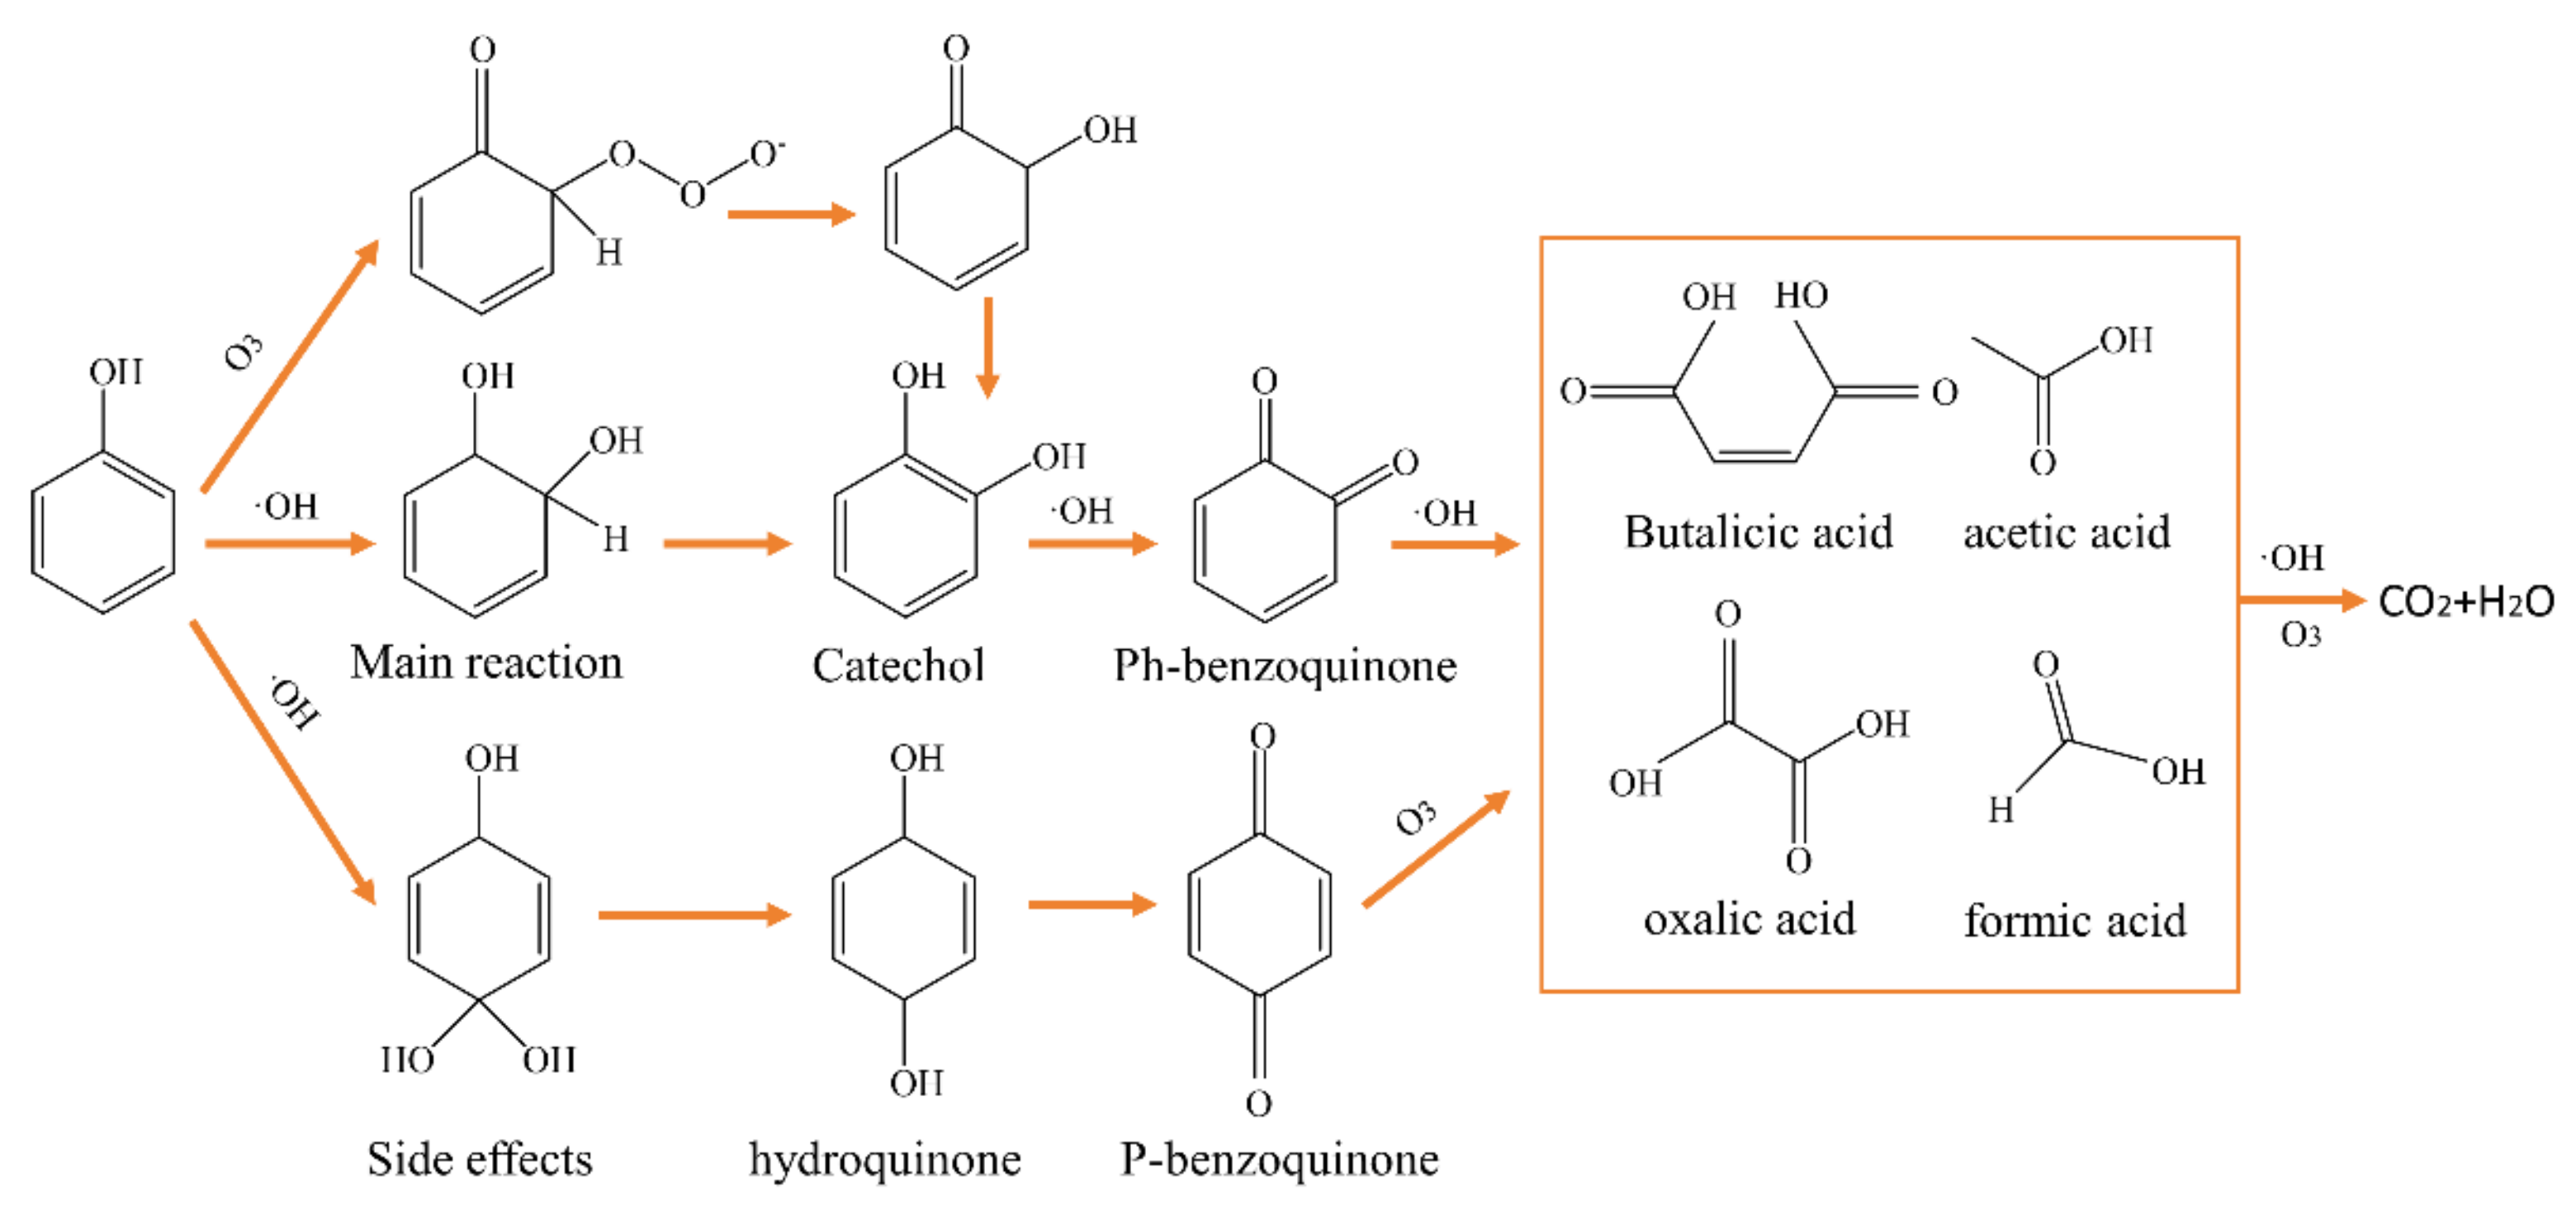
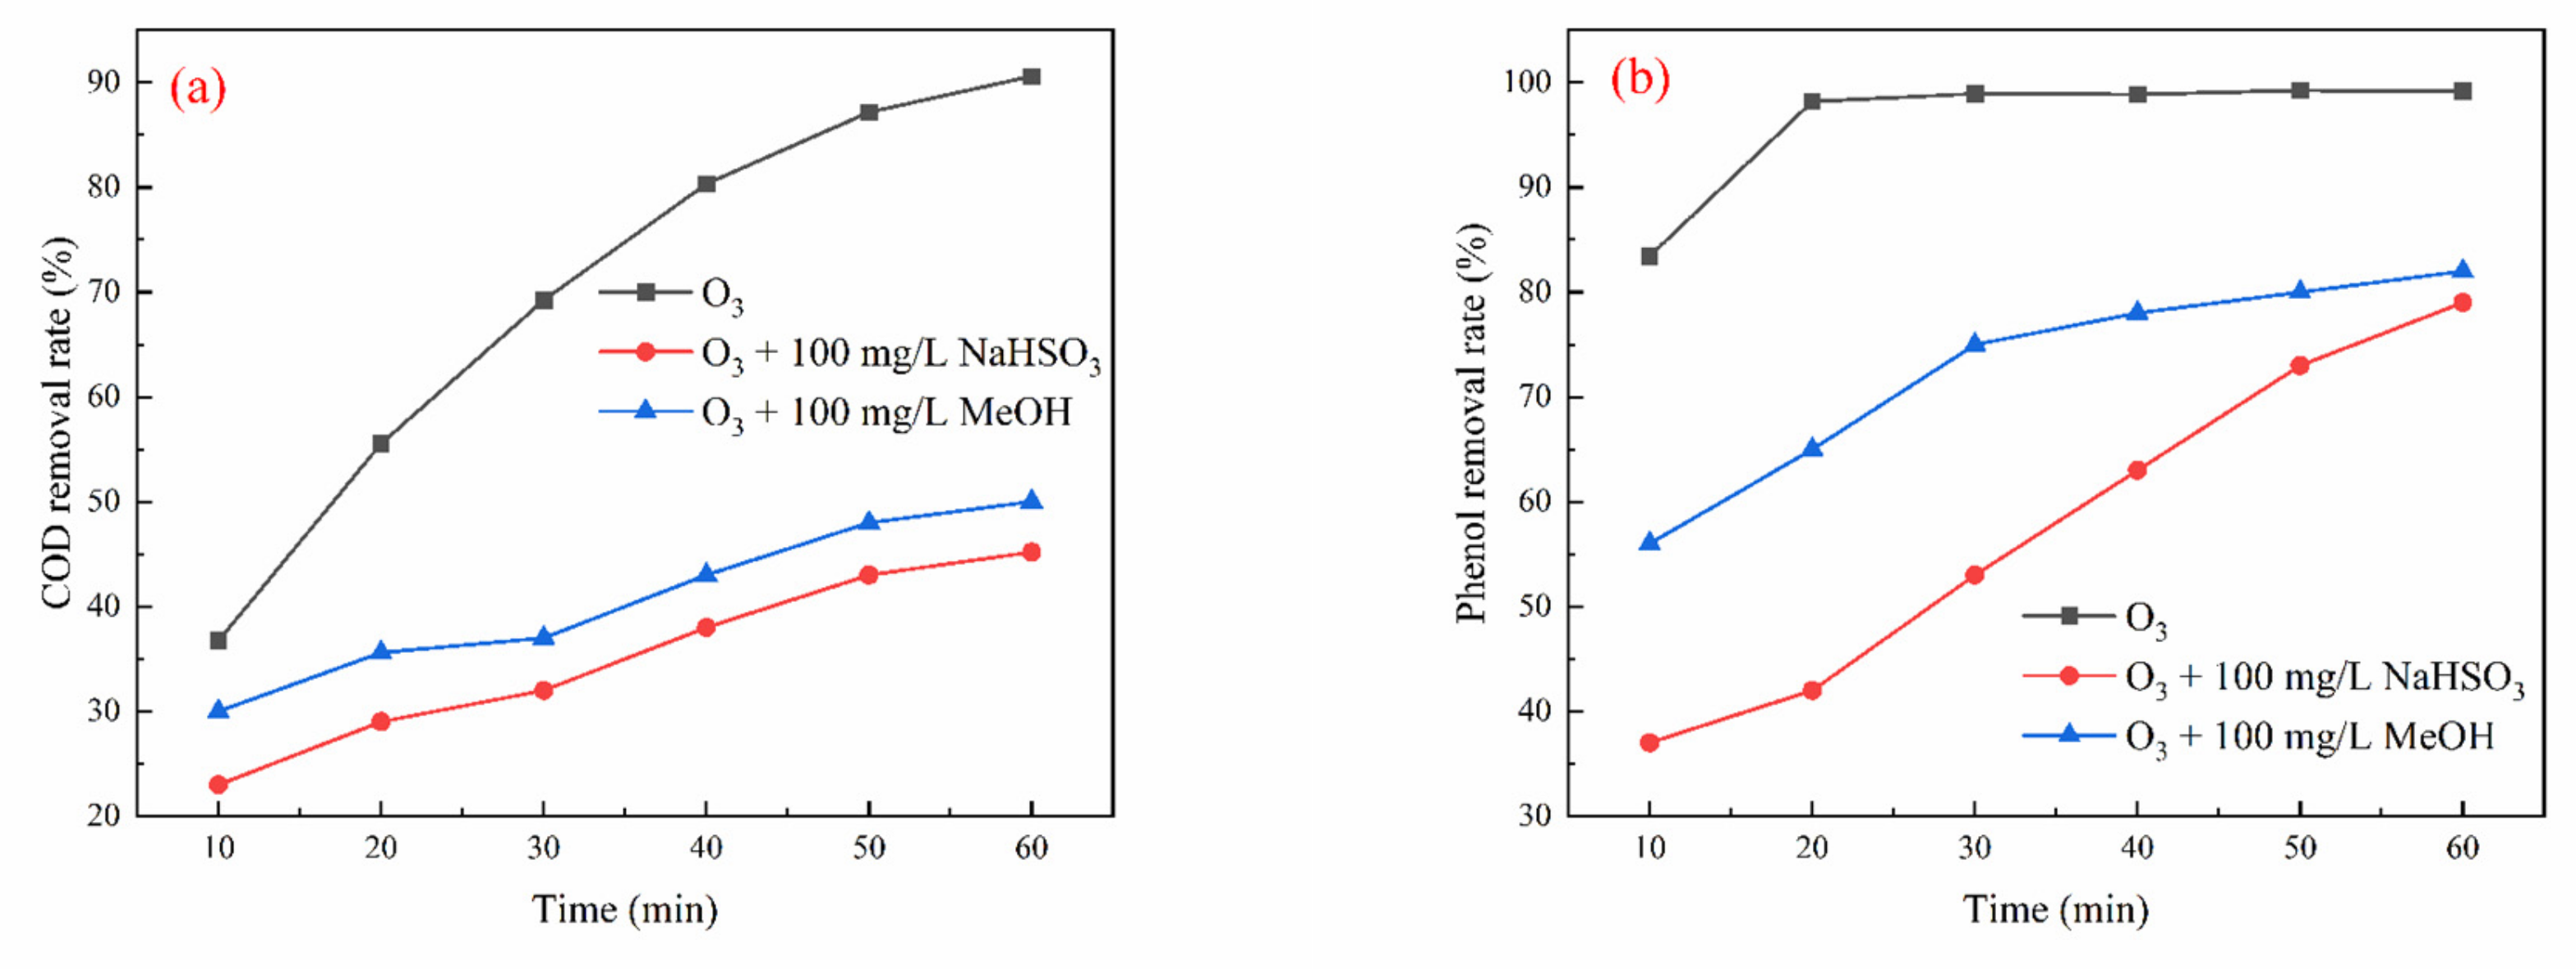
3.6. Oxidation Mechanism

As illustrated in Figure S3a, regional characteristic peak I (Ex/Em: 300–400/300–400) was identified in the raw water, suggesting that the primary soluble organic pollutants present in the simulated wastewater were aromatic proteins, with the highest fluorescence intensity recorded in region II at 9200. Figure S3b demonstrates that the characteristic peak I (Ex/Em: 300–300/300–400) remained detectable in the simulated wastewater following oxidation treatment under optimal conditions for 10 min; however, the highest fluorescence intensity decreased to 327. As shown in Figure S3c,d, after 30 min and 60 min of oxidation treatment, the fluorescence intensity associated with peak I diminished significantly, with the peak intensity stabilizing at 327. Notably, the characteristic peak I completely disappeared in the water samples after 30 min and 60 min of oxidation treatment, indicating the complete degradation of aromatic protein organics present in the raw water.
As shown in Figure S4a, regional characteristic peak I (Ex/Em: 220–270/250–300) was observed in the actual wastewater spiked with phenol, confirming that the primary soluble organic pollutants were aromatic protein organics and microbial metabolites. Figure S4b–d show that the characteristic peak I entirely vanished, and the fluorescence intensity experienced a significant reduction after the wastewater underwent treatment for 10 min under optimal conditions, demonstrating the efficient degradation of aromatic protein organics.
In the initial phase of treatment, ozone molecules exert their strong oxidizing properties by directly attacking the aromatic ring structure present in aromatic protein organics, leading to the rupture of chemical bonds. This stage primarily yields small molecular intermediates, including aldehydes, ketones, and organic acids. The pronounced decrease in fluorescence intensity of the characteristic peaks indicates the disruption and partial degradation of the aromatic structure. As the reaction time extends, ozone and •OH persist in deeply oxidizing the intermediate products, further cleaving C–C and C–H bonds, ultimately converting organic matter into simpler inorganic compounds such as CO2 and H2O [29,30]. At this juncture, the characteristic peaks of aromatic proteins vanish entirely, signifying the complete destruction of their aromaticity and organic structure. The total disappearance of these characteristic peaks indicates the successful degradation of aromatic protein pollutants in water.
As demonstrated in Figure S5, an obvious absorption peak was observed in the 250 nm–300 nm range of the raw water, which is typically associated with phenolic compounds and aromatic structures, thereby confirming the presence of phenol in the wastewater. Following ozone oxidation treatment, the absorption peak in this range diminished significantly, indicating the effective removal of phenol from the wastewater, which was oxidized into various short-chain organic acids and subsequently mineralized into CO2 and H2O. Beyond the 500 nm wavelength, the UV-Vis spectra of the phenol-simulated wastewater across different time intervals converged to a consistent level, devoid of significant absorption peaks. Post-ozone oxidation, the UV absorption peaks in the phenol-simulated wastewater showed a tendency to disappear, suggesting that the majority of phenols were effectively oxidatively degraded and removed. The results from the UV-Vis spectral scanning confirm that the polycyclic aromatic hydrocarbons (PAHs) and phenols in the phenol-simulated wastewater were successfully degraded following ozone oxidation treatment.
As illustrated in Figure 6, the raw water exhibits distinct absorption peaks in the 250 nm–300 nm range, which are typically associated with phenolic compounds and aromatic structures. This observation confirms the presence of phenol in the wastewater [31]. Following ozone oxidation treatment, the absorption peak in this region nearly vanished, indicating that phenol was effectively removed from the wastewater, undergoing oxidation into various short-chain organic acids before being mineralized into CO2 and H2O. Beyond the 500 nm wavelength, the UV-Vis spectra of the actual wastewater (spiked with phenol) showed convergence over time, with no significant absorption peaks. After ozone oxidation, the UV absorption peaks for the actual wastewater (spiked with phenol) also diminished, suggesting that the majority of phenols had undergone oxidative degradation and were effectively eliminated. The results from the UV-Vis spectral scan demonstrated that the PAHs and phenols in the phenol-simulated wastewater were significantly degraded following ozone oxidation treatment.
As depicted in Figure 7, both ozone (O3) and •OH play integral roles in the degradation of phenol during the reaction. In the initial oxidation stage, ozone molecules directly attack the phenol’s benzene ring while generating highly reactive •OH radicals through a chain reaction [32]; the two together trigger the initial oxidation of phenol: •OH preferentially attacks the electron-rich sites of the benzene ring through electrophilic addition, leading to the hydroxylation of phenol and the formation of isomers such as catechol and hydroquinone, which are then further oxidized to quinone intermediates such as o-benzoquinone and p-benzoquinone [33,34]. During the ring opening phase, the quinone intermediate undergoes successive attacks by ozone and •OH, and the benzene ring structure is progressively broken down to form small-molecule organic acids (e.g., oxalic, acetic, formic, and butanedioic acids) [35]. It is worth noting that isomers such as dihydroxybenzene may be generated in the side reactions, but these byproducts are still continuously degraded by the oxidation system. Eventually, all intermediates are further mineralized by the oxidant and converted to CO₂ and H₂O [36]. The mechanism indicates that the high oxidation potential of •OH is pivotal in phenol degradation, while ozone molecules enhance mineralization through direct oxidation and free radical reactions. Figure S6 and Table S2 represent the fitted graphs of zero-, one-, and two-stage reactions for the treatment of simulated wastewater carried out by the reaction system.
As shown in Figure 8, the inhibitory effect of 100 mg/L NaHSO3 on COD and phenol removal was slightly greater than that of 100 mg/L MeOH. COD removal was recorded at 45.19% and 50.00% for systems with 100 mg/L NaHSO3 and 100 mg/L MeOH, respectively. This finding suggests that the oxidation by •OH is the dominant mechanism in the ozone oxidation system alone. NaHSO3 serves as a more effective quencher of •OH [37,38], further supporting the critical role of •OH in the elimination of both COD and phenol within the ozone oxidation process.

4. Conclusions and Discussion

This study systematically investigates the effectiveness of ozone oxidation technology in treating simulated wastewater characteristic of the petrochemical industry. In experiments using phenol-simulated wastewater, the maximum COD removal achieved was 90.60% with an ozone dosage of 8 mg/L/min, a pH of 11, TDSs of 1000 mg/L, and an initial phenol concentration of 50 mg/L. In actual wastewater spiked with phenol, the maximum removals of phenol, COD, and TOC were 65.45%, 63.57%, and 79.65%, respectively, under the same conditions of ozone dosage, pH, TDSs, and initial phenol concentration. The changes in organic matter and the degradation mechanisms during ozone oxidation were evaluated using 3D fluorescence spectroscopy, UV spectroscopy, and gas chromatography–mass spectrometry (GC-MS) analysis. The results demonstrate that ozone oxidation significantly reduces pollutant concentrations in wastewater, primarily through the action of free radical oxidation. Following ozone treatment, unsaturated organic matter, certain conjugated structures, and benzene ring systems in the wastewater were effectively destroyed and transformed into inorganic substances via oxidative degradation. The disappearance of characteristic fluorescence peaks and the declining UV absorption peaks further confirm that pollutants were efficiently removed. Additionally, the ozone oxidation process for phenol followed the kinetic law of primary reactions, and free radical quenching experiments highlighted the dominant role of •OH within the ozone oxidation system.

Supplementary Materials

The following supporting information can be downloaded at https://www.mdpi.com/article/10.3390/w17040605/s1. Figure S1: Ozone oxidation experimental device; Figure S2: Standard curve for the spectrophotometric determination of phenol by 4-aminoantipyrine; Figure S3: Three-dimensional fluorescence spectra of simulated wastewater: (a) raw water, (b) optimal condition reaction for 10 min, (c) optimal condition reaction for 30 min, (d) optimal condition reaction for 60 min; Figure S4: 3D fluorescence spectra of actual wastewater (spiked with phenol): (a) raw water, (b) optimum condition reaction 10 min, (c) optimum condition reaction 30 min, (d) optimum condition reaction 60 min; Figure S5: UV-Vis scanning spectra of simulated wastewater: (a) 200-800 nm, (b) 250-300 nm; Figure S6: Fitted kinetics curves of different stages of reaction for modelling COD degradation in wastewater: (a) zero-stage reaction, (b) one-stage reaction, (c) two-stage reaction; Figure S7: GC-MS product scan spectrum of the phenol; Table S1: Phenol and its degradation intermediates; Table S2: Parameters of the fitted curves for the kinetic equation of COD degradation in simulated wastewater.

Author Contributions

Conceptualization, Y.Z. and Z.Y.; methodology, Y.Z., Z.Y., S.C., W.S. and Y.S.; validation, W.S. and Y.S.; formal analysis, Y.Z., W.S. and Y.S.; investigation, Y.Z., Z.Y., S.C. and Y.S.; resources, W.S. and Y.S.; data curation, W.S. and Y.S.; writing—original draft preparation, W.S. and Y.S.; writing—review and editing, W.S. and Y.S.; visualization, Y.Z., W.S. and Y.S.; supervision, Y.Z. and Y.S.; project administration, Y.Z., W.S. and Y.S.; funding acquisition, Y.Z., W.S. and Y.S. All authors have read and agreed to the published version of the manuscript.

Funding

This research was supported by the National Natural Science Foundation of China (No. 51508268), the Natural Science Foundation of Jiangsu Province in China (No. BK20201362), and the 2018 Six Talent Peaks Project of Jiangsu Province (JNHB-038).

Data Availability Statement

Data are contained within the article.

Conflicts of Interest

Authors Yangyang Zhou and Zhilin Yang were employed by the company Jiangsu Fangyang Water Co., Ltd. The remaining authors declare that the research was conducted in the absence of any commercial or financial relationships that could be construed as a potential conflict of interest.

References

  1. Dai, S.; Harnisch, F.; Morejón, M.C.; Keller, N.S.; Korth, B.; Vogt, C. Microbial electricity-driven anaerobic phenol degradation in bioelectrochemical systems. Environ. Sci. Ecotechnol. 2024, 17, 100307. [Google Scholar] [CrossRef] [PubMed]
  2. Sun, J.; Mu, Q.; Kimura, H.; Murugadoss, V.; He, M.; Du, W.; Hou, C. Oxidative degradation of phenols and substituted phenols in the water and atmosphere: A review. Adv. Compos. Hybrid Mater. 2022, 5, 627–640. [Google Scholar] [CrossRef]
  3. Wu, C.; Li, Y.; Zhou, Y.; Li, Z.; Zhang, S.; Liu, H. Upgrading the Chinese biggest petrochemical wastewater treatment plant: Technologies research and full scale application. Sci. Total Environ. 2018, 633, 189–197. [Google Scholar] [CrossRef] [PubMed]
  4. Alshabib, M.; Onaizi, S.A. A review on phenolic wastewater remediation using homogeneous and heterogeneous enzymatic processes: Current status and potential challenges. Sep. Purif. Technol. 2019, 219, 186–207. [Google Scholar] [CrossRef]
  5. Pavithra, K.G.; Rajan, P.S.; Arun, J.; Brindhadevi, K.; Le, Q.H.; Pugazhendhi, A. A review on recent advancements in extraction, removal and recovery of phenols from phenolic wastewater: Challenges and future outlook. Environ. Res. 2023, 237, 117005. [Google Scholar] [CrossRef]
  6. Bibi, A.; Bibi, S.; Abu-Dieyeh, M.; Al-Ghouti, M.A. Towards sustainable physiochemical and biological techniques for the remediation of phenol from wastewater: A review on current applications and removal mechanisms. J. Clean. Prod. 2023, 417, 137810. [Google Scholar] [CrossRef]
  7. QI, Y. Research progress on degradation of phenolic pollutants by activated persulfate oxidation. Chem. Ind. Eng. Prog. 2022, 41, 6068. [Google Scholar]
  8. Mirdamadian, S.H.; Asad, S.; Dastgheib, S.M.M.; Moghimi, H. Design of a two functional permeable reactive barrier for synergistic enzymatic and microbial bioremediation of phenol-contaminated waters: Laboratory column evaluation: En-zymatic and microbial bioremediation of phenol in a bilayer permeable reactive barrier. BMC Microbiol. 2024, 24, 252. [Google Scholar]
  9. Raper, E.; Stephenson, T.; Anderson, D.R.; Fisher, R.; Soares, A. Industrial wastewater treatment through bioaugmentation. Process Saf. Environ. Prot. 2018, 118, 178–187. [Google Scholar] [CrossRef]
  10. Ge, M.; Wang, X.; Du, M.; Liang, G.; Hu, G.; SM, J.A. Adsorption analyses of phenol from aqueous solutions using magadiite modified with organo-functional groups: Kinetic and equilibrium studies. Materials 2018, 12, 96. [Google Scholar] [CrossRef]
  11. Adeel, M.; Xu, Y.; Ren, L.; Shao, J.; He, Y. Improvement of phenol separation and biodegradation from saline wastewater in extractive membrane bioreactor (EMBR). Bioresour. Technol. Rep. 2022, 17, 100897. [Google Scholar] [CrossRef]
  12. Han, S.; Wang, W.; Xu, Z.; Qi, L. Research and perspective of heterogeneous catalytic oxidation by ozone in the removal of pollutants from industrial wastewater: A review. J. Ind. Eng. Chem. 2024. [Google Scholar] [CrossRef]
  13. Brillas, E.; Garcia-Segura, S. Benchmarking recent advances and innovative technology approaches of Fenton, photo-Fenton, electro-Fenton, and related processes: A review on the relevance of phenol as model molecule. Sep. Purif. Technol. 2020, 237, 116337. [Google Scholar] [CrossRef]
  14. Xu, Y.; Qin, S.; Wang, M.; Du, Z.; Chen, J.; Liu, Y.; Zhang, S. Efficient peroxodisulfate activation by CuO-loaded chitosan hydrogel spheres for phenol degradation in the coexistence of NaHCO3. J. Water Process Eng. 2024, 61, 105229. [Google Scholar] [CrossRef]
  15. Jiang, B.; Shi, S.; Jiang, H.; Feng, X.; Sun, H. Research progress in phenol adsorption mechanism over metal-organic framework from wastewater. Chem. Ind. Eng. Prog. 2021, 40, 4525. [Google Scholar]
  16. Saravanan, A.; Deivayanai, V.C.; Kumar, P.S.; Rangasamy, G.; Hemavathy, R.V.; Harshana, T.; Gayathri, N.; Alagumalai, K. A detailed review on advanced oxidation process in treatment of wastewater: Mechanism, challenges and future outlook. Chemosphere 2022, 308, 136524. [Google Scholar] [CrossRef]
  17. Giwa, A.; Yusuf, A.; Balogun, H.A.; Sambudi, N.S.; Bilad, M.R.; Adeyemi, I.; Chakraborty, S.; Curcio, S. Recent advances in advanced oxidation processes for removal of contaminants from water: A comprehensive review. Process Saf. Environ. Prot. 2021, 146, 220–256. [Google Scholar] [CrossRef]
  18. Ganiyu, S.O.; Sable, S.; El-Din, M.G. Advanced oxidation processes for the degradation of dissolved organics in produced water: A review of process performance, degradation kinetics and pathway. Chem. Eng. J. 2022, 429, 132492. [Google Scholar] [CrossRef]
  19. Mahmoodi, M.; Pishbin, E. Ozone-based advanced oxidation processes in water treatment: Recent advances, challenges, and perspective. Environ. Sci. Pollut. Res. 2025, 1–40. [Google Scholar] [CrossRef]
  20. Li, P.; Yin, Z.; Chi, C.; Wang, Y.; Wang, Y.; Liu, H.; Lv, Y.; Jiang, N.; Wu, S. Treatment of membrane-concentrated landfill leachate by heterogeneous chemical and electrical Fenton processes with Iron-loaded granular activated carbon catalysts. J. Environ. Chem. Eng. 2024, 12, 112337. [Google Scholar] [CrossRef]
  21. Malik, S.N.; Ghosh, P.C.; Vaidya, A.N.; Mudliar, S.N. Hybrid ozonation process for industrial wastewater treatment: Principles and applications: A review. Water Res. 2020, 35, 101193. [Google Scholar] [CrossRef]
  22. Eghbali, P.; Hassani, A.; Wacławek, S.; Lin, K.A.; Sayyar, Z.; Ghanbari, F. Recent advances in design and engineering of MXene-based catalysts for photocatalysis and persulfate-based advanced oxidation processes: A state-of-the-art review. Chem. Eng. J. 2024, 480, 147920. [Google Scholar] [CrossRef]
  23. Hassani, A.; Krishnan, S.; Scaria, J.; Eghbali, P.; Nidheesh, P.V. Z-scheme photocatalysts for visible-light-driven pollutants degradation: A review on recent advancements. Curr. Opin. Solid State Mater. Sci. 2021, 25, 100941. [Google Scholar] [CrossRef]
  24. Liu, Z.; Yang, Y.; Shao, C.; Ji, Z.; Wang, Q.; Wang, S.; Guo, Y.; Demeestere, K.; Van Hulle, S. Ozonation of trace organic compounds in different municipal and industrial wastewaters: Kinetic-based prediction of removal efficiency and ozone dose requirements. Chem. Eng. J. 2020, 387, 123405. [Google Scholar] [CrossRef]
  25. Sun, W.; Zhou, S.; Sun, Y.; Tang, J.; Zheng, H. Ozone catalytic oxidation capacity of Ti-Co@ Al2O3 for the treatment of biochemical tailwater from the coal chemical industry. Water Environ. Res. 2020, 92, 1283–1292. [Google Scholar] [CrossRef]
  26. Chen, J.; Rao, D.; Dong, H.; Sun, B.; Shao, B.; Cao, G.; Guan, X. The role of active manganese species and free radicals in permanganate/bisulfite process. J. Hazard. Mater. 2020, 388, 121735. [Google Scholar] [CrossRef]
  27. Psaltou, S.; Mitrakas, M.; Zouboulis, A. Heterogeneous catalytic ozonation: Solution pH and initial concentration of pollutants as two important factors for the removal of micropollutants from water. Separations 2022, 9, 413. [Google Scholar] [CrossRef]
  28. Song, Z.; Tang, T.; Pan, W.; Zhao, X.; Sun, J.; Mao, Y.; Wang, W. Micro-nano bubbles enhance ozone oxidation and degradation of wastewater containing phenol. Chem. Ind. Eng. Prog. 2024, 43, 4614. [Google Scholar]
  29. Wang, N.; Lv, G.; He, L.; Sun, X. New insight into photodegradation mechanisms, kinetics and health effects of p-nitrophenol by ozonation in polluted water. J. Hazard. Mater. 2021, 403, 123805. [Google Scholar] [CrossRef]
  30. Luo, Z.; Wang, D.; Zeng, W.; Yang, J. Removal of refractory organics from piggery bio-treatment effluent by the catalytic ozonation process with piggery biogas residue biochar as the catalyst. Sci. Total Environ. 2020, 734, 139448. [Google Scholar] [CrossRef]
  31. Al-Hasani, H.; Al-Sabahi, J.; Al-Ghafri, B.; Al-Hajri, R.; Al-Abri, M. Effect of water quality in photocatalytic degradation of phenol using zinc oxide nanorods under visible light irradiation. J. Water Process Eng. 2022, 49, 103121. [Google Scholar] [CrossRef]
  32. Dai, M.; Niu, Q.; Wu, S.; Lin, Y.; Biswas, J.K.; Yang, C. Hydroxyl radicals in ozone-based advanced oxidation of organic contaminants: A review. Environ. Chem. Lett. 2024, 22, 3059–3106. [Google Scholar] [CrossRef]
  33. Xiong, W.; Cui, W.; Li, R.; Feng, C.; Liu, Y.; Ma, N.; Deng, J.; Xing, L.; Gao, Y.; Chen, N. Mineralization of phenol by ozone combined with activated carbon: Performance and mechanism under different pH levels. Environ. Sci. Ecotechnol. 2020, 1, 100005. [Google Scholar] [CrossRef]
  34. Naranov, E.; Ramazanov, D.; Agliullin, M.; Sinyashin, O.; Maximov, A. Recent Advances in Aromatic Hydroxylation to Phenol and Hydroquinone Using H2O2. Catalysts 2024, 14, 930. [Google Scholar] [CrossRef]
  35. Wang, Y.; Tian, H.; Yu, Y.; Hu, C. Enhanced catalytic activity of α-FeOOH-rGO supported on active carbon fiber (ACF) for degradation of phenol and quinolone in the solar-Fenton system. Chemosphere 2018, 208, 931–941. [Google Scholar] [CrossRef] [PubMed]
  36. Viet, N.M.; Huong, N.T.M.; Hoai, P.T.T. Enhanced photocatalytic decomposition of phenol in wastewater by using La–TiO2 nanocomposite. Chemosphere 2023, 313, 137605. [Google Scholar] [CrossRef]
  37. Ragupathi, A.; Charpe, V.P.; Hwu, J.R.; Hwang, K.C. Oxidative destruction of chlorinated persistent organic pollutants by hydroxyl radicals via ozone and UV light irradiation. Green Chem. 2023, 25, 9695–9704. [Google Scholar] [CrossRef]
  38. Yu, G.; Wang, Y.; Cao, H.; Zhao, H.; Xie, Y. Reactive oxygen species and catalytic active sites in heterogeneous catalytic ozonation for water purification. Environ. Sci. Technol. 2020, 54, 5931–5946. [Google Scholar] [CrossRef]
Figure 1. Effect of ozone oxidation time on COD removal rate (ozone dosage: 6 mg/L/min; pH = 7; reaction time: 120 min): (a) simulated wastewater; (b) actual wastewater (spiked with phenol).
Water 17 00605 g001
Figure 2. Effect of ozone dosage on oxidation performance in different wastewater types (pH = 7; reaction time: 60 min): (a) simulated wastewater COD removal rate, (b) simulated wastewater TOC removal rate, (c) simulated wastewater phenol removal rate, (d) actual wastewater (spiked with phenol) COD removal rate, (e) actual wastewater (spiked with phenol) TOC removal rate, and (f) actual wastewater (spiked with phenol) phenol removal rate.
Water 17 00605 g002aWater 17 00605 g002b
Figure 3. Effect of pH on oxidation performance in different wastewater types (ozone dosage: 6 mg/L/min; reaction time: 60 min): (a) simulated wastewater COD removal rate, (b) simulated wastewater TOC removal rate, (c) simulated wastewater phenol removal rate, (d) actual wastewater (spiked with phenol) COD removal rate, (e) actual wastewater (spiked with phenol) TOC removal rate, and (f) actual wastewater (spiked with phenol) phenol removal rate.
Water 17 00605 g003
Figure 4. Effect of TDSs on oxidation performance in different wastewater types (ozone dosage: 6 mg/L/min; pH = 7; reaction time: 60 min): (a) simulated wastewater COD removal rate, (b) simulated wastewater TOC removal rate, (c) simulated wastewater phenol removal rate, (d) actual wastewater (spiked with phenol) COD removal rate, (e) actual wastewater (spiked with phenol) TOC removal rate, (f) actual wastewater (spiked with phenol) phenol removal rate.
Water 17 00605 g004aWater 17 00605 g004b
Figure 5. Effect of initial phenol concentration on oxidation performance in different wastewater types (ozone dosage: 6 mg/L/min; pH = 7; reaction time: 60 min): (a) simulated wastewater COD removal rate, (b) simulated wastewater TOC removal rate, (c) simulated wastewater phenol removal rate, (d) actual wastewater (spiked with phenol) COD removal rate, (e) actual wastewater (spiked with phenol) TOC removal rate, (f) actual wastewater (spiked with phenol) phenol removal rate.
Water 17 00605 g005aWater 17 00605 g005b
Figure 6. UV-Vis scanning spectra of actual wastewater (spiked with phenol): (a) 200–800 nm; (b) 220–300 nm.
Water 17 00605 g006
Figure 7. Possible degradation pathways for phenol.
Water 17 00605 g007
Figure 8. Effect of free radical quencher on ozone oxidation system: (a) COD removal; (b) phenol removal.
Water 17 00605 g008
Disclaimer/Publisher’s Note: The statements, opinions and data contained in all publications are solely those of the individual author(s) and contributor(s) and not of MDPI and/or the editor(s). MDPI and/or the editor(s) disclaim responsibility for any injury to people or property resulting from any ideas, methods, instructions or products referred to in the content.

