Article

Design and Test of a Cavitation Water Jet Net Box Cleaning Device Based on Ansys Fluent

1
College of Mechanical and Power Engineering, Dalian Ocean University, Dalian 116023, China
2
Key Laboratory of Environment Controlled Aquaculture Ministry of Education, Dalian Ocean University, Dalian 116023, China
3
R&D Center of Fisheries Equipment and Engineering, Dalian 116023, China
*
Author to whom correspondence should be addressed.
Water 2025, 17(4), 589; https://doi.org/10.3390/w17040589
Submission received: 30 January 2025 / Revised: 13 February 2025 / Accepted: 16 February 2025 / Published: 18 February 2025

Abstract

:
This study addresses the issue of biofouling on marine aquaculture cages, where organisms like algae and purple mussels negatively impact both the safety of the aquaculture environment and the integrity of the cages. To solve this problem, the paper introduces a cage cleaning device based on the cavitation jet principle. Using finite volume simulation software, the cavitation process of the device’s nozzle was modeled, with the gas-phase volume fraction used as the evaluation metric. Key experimental factors, such as the second section throat contraction angle, second section throat radius, and end diffusion angle, were analyzed through single-factor and quadratic regression orthogonal experiments to assess their effect on the cavitation performance. The optimal combination of nozzle parameters was determined to be a second section throat contraction angle of 41.047°, a second section throat radius of 0.834 mm, and an end diffusion angle of 35.495°. Under these conditions, the gas-phase volume fraction reached 0.941, indicating optimal cavitation performance. To validate these findings and further optimize the nozzle’s operational parameters, a nozzle cavitation test bench was constructed. Test results demonstrated that when the target distance was set at 15 mm and the angle at 20°, the surface roughness and maximum surface depth of the target were 6.215 μm and 22.030 μm, respectively, with the nozzle exhibiting the best cavitation effect at these settings. This nozzle design meets the requirements for efficient mesh cleaning, and the research provides valuable insights for future development and optimization of cleaning devices for aquaculture net cages.

1. Introduction

The marine aquaculture industry is a vital part of China’s marine economy and a key source of high-quality protein for human consumption. In recent years, the Chinese government has actively supported the development of deep-sea net cage aquaculture, promoting the establishment of large-scale marine ranches along coastal areas. This effort aims to address the challenges faced by traditional offshore cage farming, such as pollution, disease, and damage from typhoons. However, the advancement of net cage aquaculture technology has also introduced new challenges, with biofouling on the net cages being a particularly significant issue. As shown in Figure 1, the long-term immersion of net cages in seawater at depths of several dozen meters leads to the attachment of marine organisms, primarily algae, sea squirts, and crustaceans. The accumulation of these organisms increases the weight and stress on the net, compromising its structural integrity and potentially causing the escape of farmed species [1]. Additionally, these attachments obstruct water flow between the inside and outside of the cage, reducing dissolved oxygen levels and impairing the cage’s filtration performance [2], which negatively impacts the quality of the aquaculture environment. Furthermore, the enclosed nature of the cage fosters the growth of pathogenic bacteria, particularly from leftover feed, which can lead to disease outbreaks and large-scale fish mortality. This has a significant effect on the survival rate, yield, and quality of farmed fish [3,4,5]. For a long time, biofouling has been a persistent issue for marine cage aquaculture, posing ongoing challenges to the industry.
Currently, three main methods are used to address biofouling in net cages: manual cleaning, anti-fouling coatings, and mechanical cleaning equipment [6]. The manual cleaning method involves regularly replacing the nets, dragging them ashore for sun exposure, or having divers clean the nets underwater [7]. However, this approach is labor-intensive, inefficient, costly, and generates waste that can pollute the environment. The anti-fouling coating method involves applying a special coating to the net surfaces to prevent organism attachment. While some coatings are designed to be non-toxic, others contain heavy metal ions that can pollute the marine environment and accumulate in aquaculture species, posing risks to food safety and health [8]. While some companies [9] have developed non-toxic, anti-biofouling nets that extend the net replacement cycle, these solutions do not eliminate the problem of biological attachment. The most commonly used method for cleaning net cages is mechanical cleaning. Siyuan Liu [10] developed a net cage cleaning robot that uses water jets through a manifold to clean the net. The robot crawls along the net on tracks and is equipped with an underwater camera to visualize the cleaning process. Similarly, Aurora Marine [11] in Australia developed an ROV underwater net washing robot with a tracked structure and dual water flow system for high-pressure cleaning. AKVA, a Norwegian company [12], designed the FNC8 mesh cleaning robot, which uses high-pressure water jets on rotating disks to remove fouling organisms. While these cleaning robots represent advanced technology, they are not as effective in Chinese waters, and they also come with high costs and maintenance requirements.
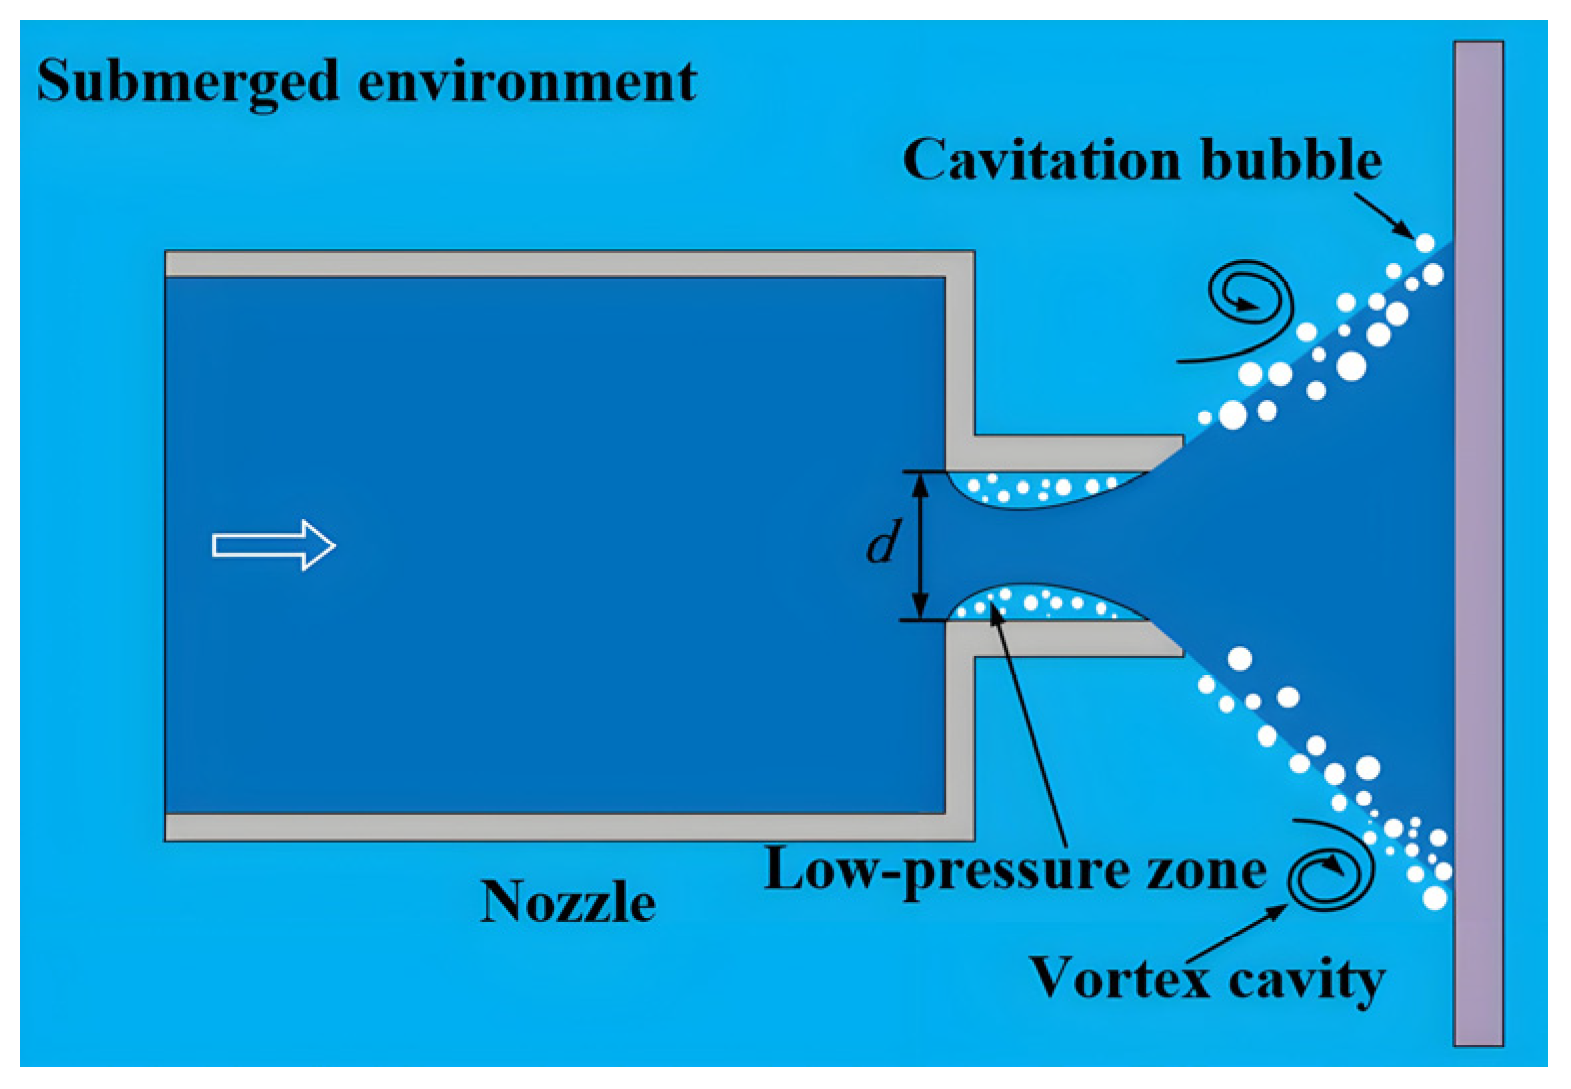
Mechanical cleaning equipment is well suited for the aquaculture industry due to its efficiency, safety, cleaning quality, and cost-effectiveness. However, the effectiveness of standard water jet cleaning diminishes with increased water depth, leading to longer operation times. In contrast, the cavitation jet cleaning method generates a stronger local impact force, enhancing cleaning performance and effectively addressing the limitations of traditional water jet systems. Rayleigh conducted foundational research on the kinematics and dynamics of cavitation bubbles, deriving a differential equation to describe their behavior. Later, Plesset refined this equation by incorporating the effects of surface tension and viscosity during bubble growth and collapse, leading to the development of the Rayleigh–Plesset equation [13]. Zhong [14] demonstrated the effectiveness of underwater cavitation jets in removing marine biofouling from ship hulls, confirming the feasibility of this method for similar applications. When cavitation bubbles collapse underwater, they generate intense pressure disturbances, significantly increasing the stress on the surface being cleaned. Studies have shown that under the same pump pressure and flow rate, the impact pressure of a cavitation jet can be 8.6 to 124 times greater than that of a continuous jet. This high-pressure impact effectively shatters or dislodges biofouling from the net surface [15,16]. Guha [17] conducted high-speed camera experiments on nozzles and observed that when the cavitation cloud formed on a target surface and collapsed, it generated a significant impact force, which in turn created a ring-shaped shock wave on the surface. Liu Haishui and colleagues [18] performed similar experiments on nozzles with different structures, finding that the cavitation clouds produced by these nozzles followed a distinct cycle, including stages of generation, development, rupture, and collapse. Yuan Guangyu [19] studied icebreaking using cavitating water jets in a Venturi nozzle setup. His research, which involved indoor experiments, analyzed the interaction between the cavitation jet and ice, comparing the pressure exerted on a rigid wall by the cavitating jet with that of a non-cavitating jet. These studies highlight the potential for applying cavitation technology to the cleaning of aquaculture net cages.
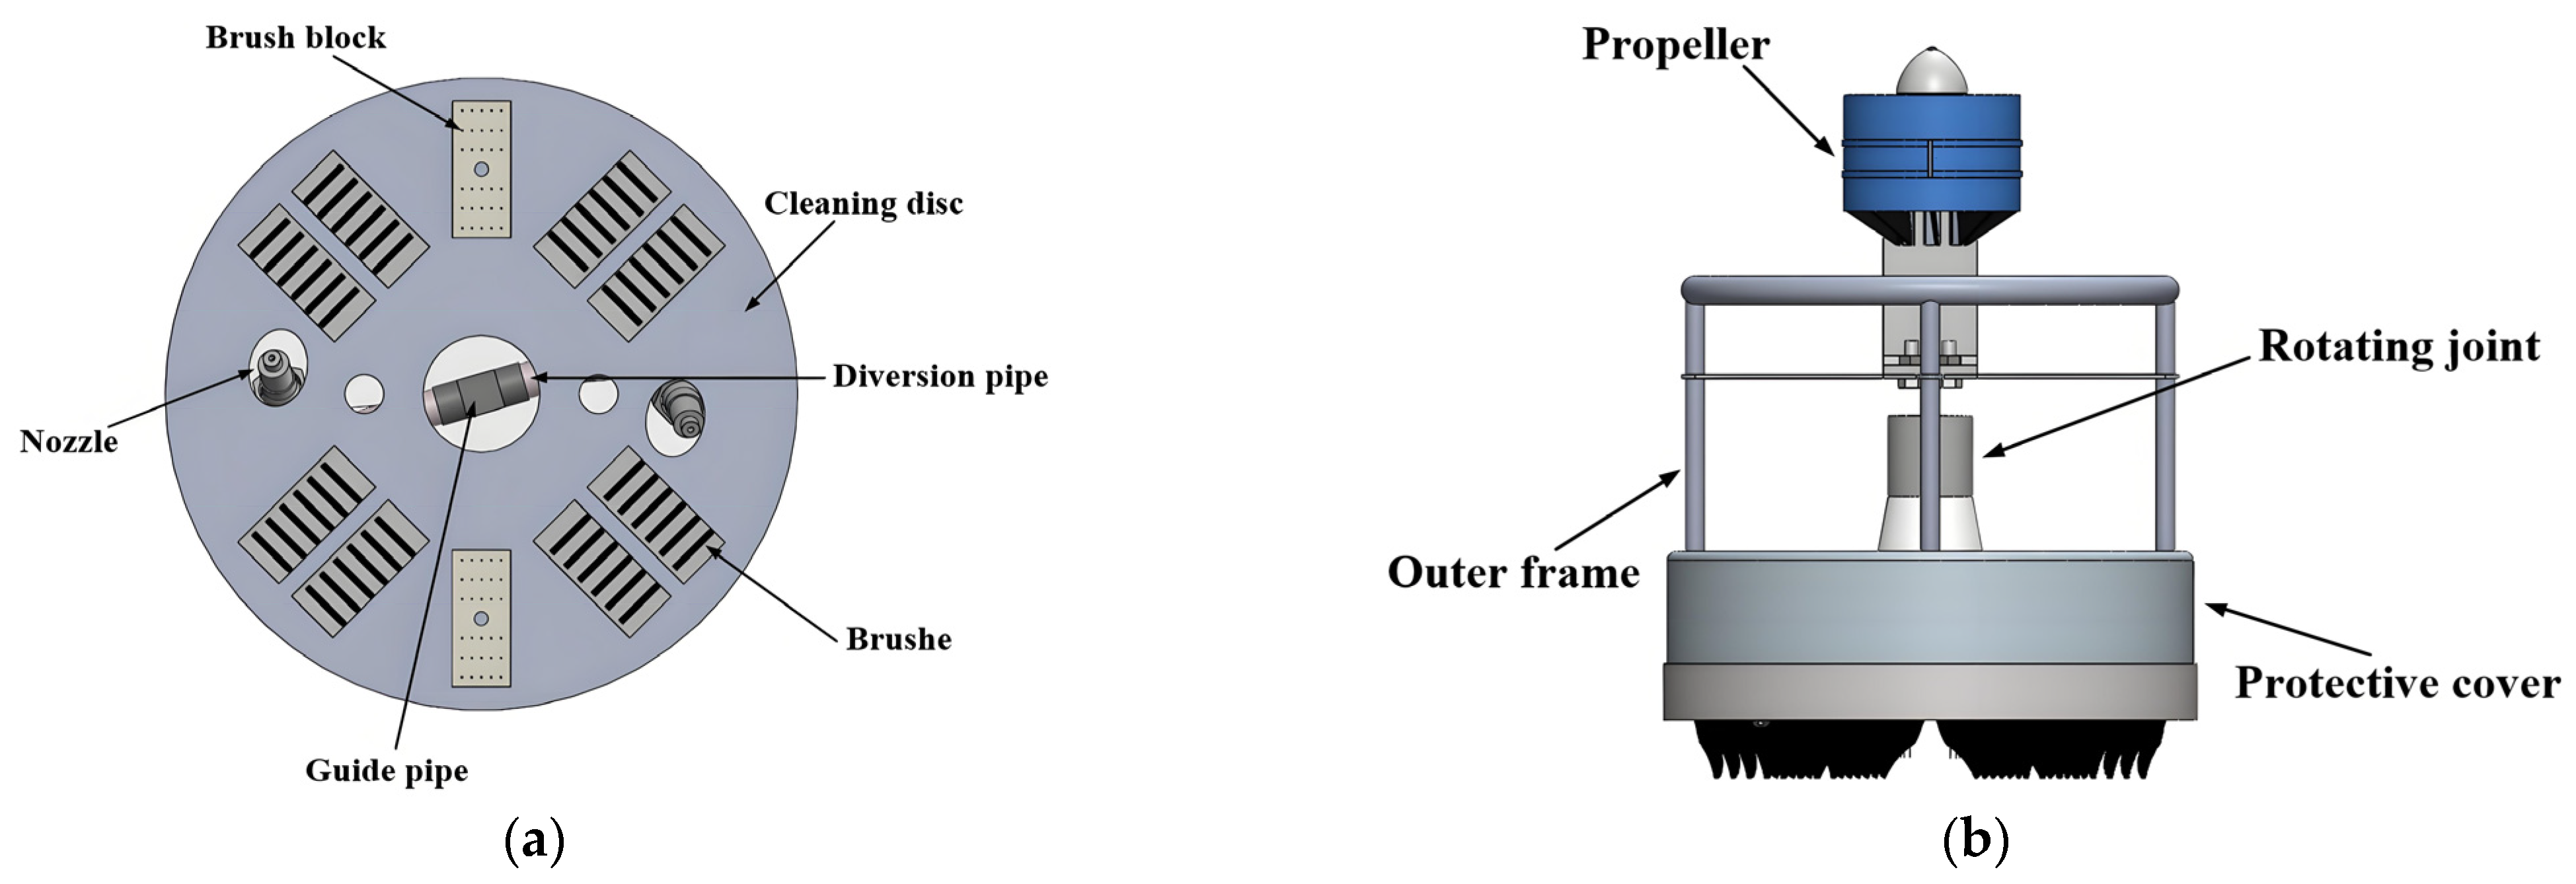
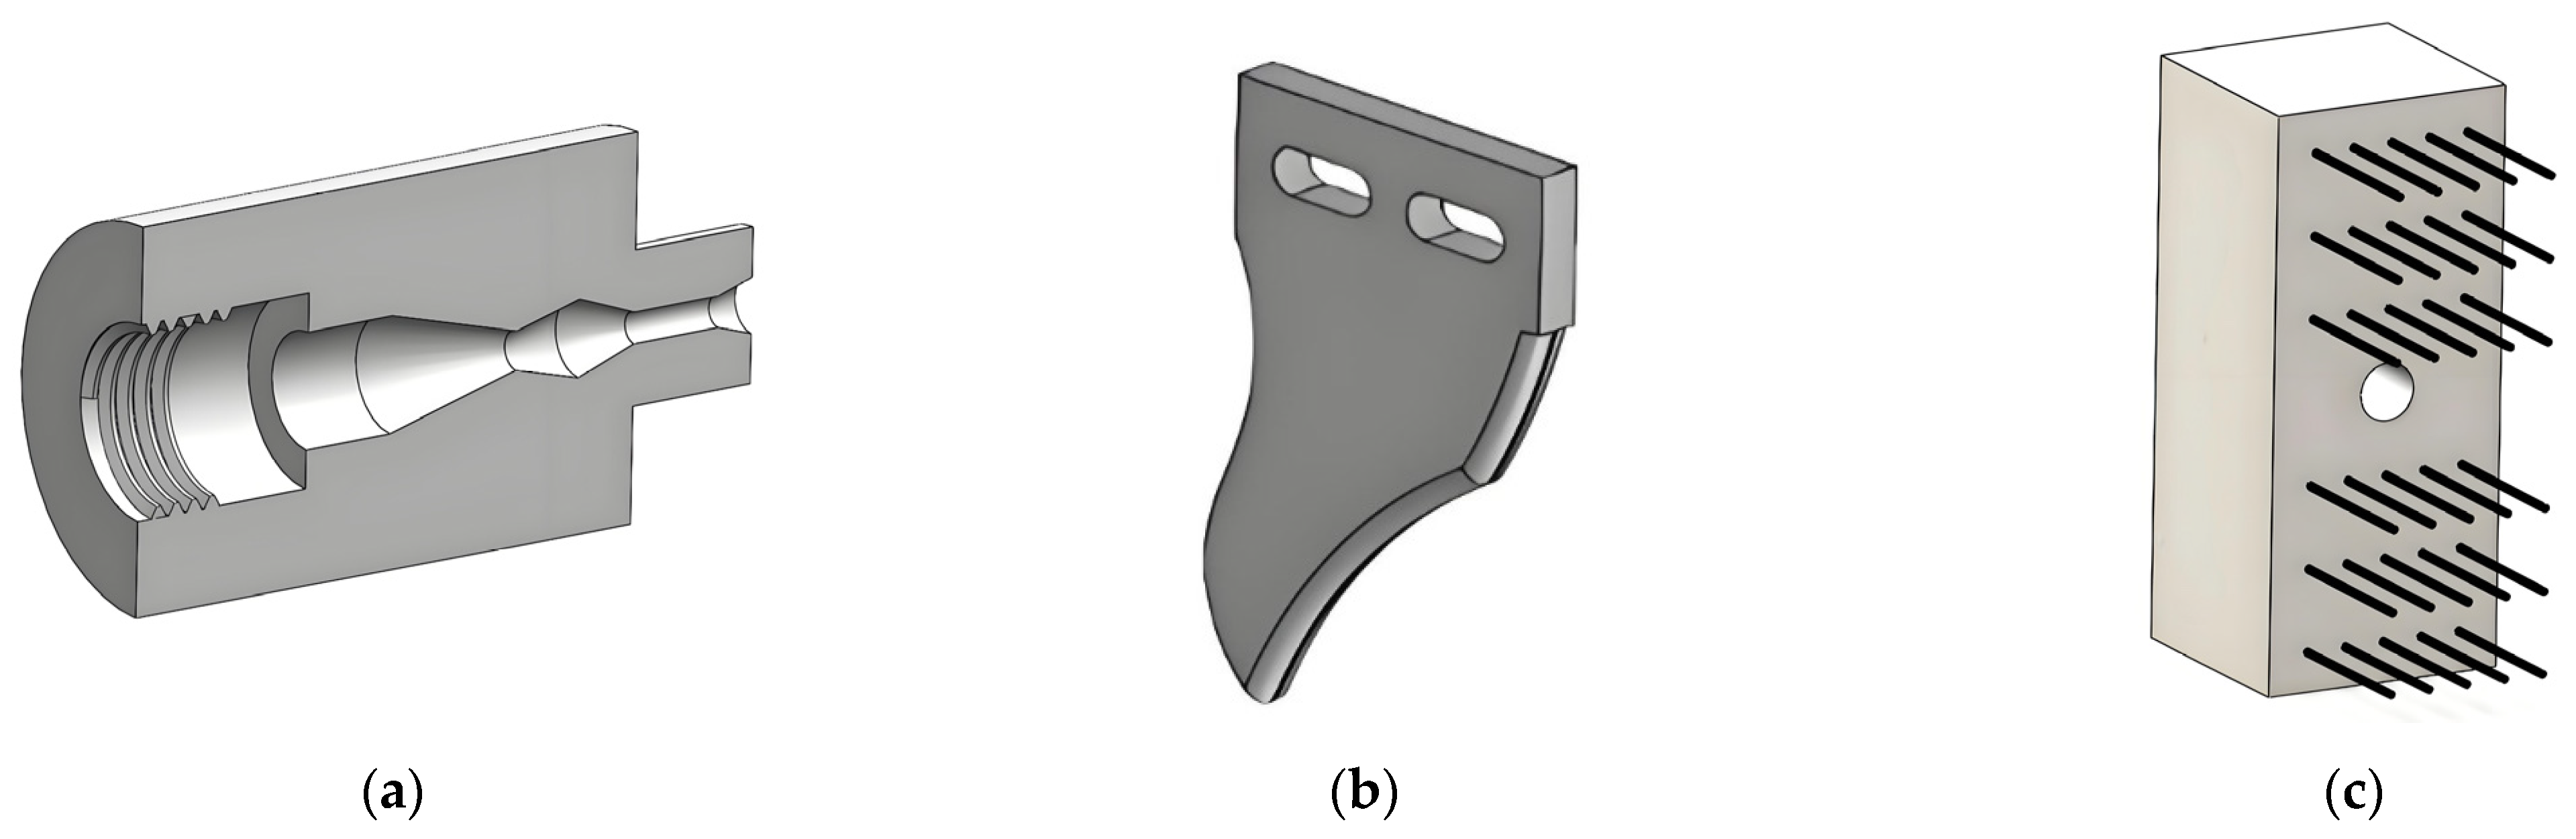
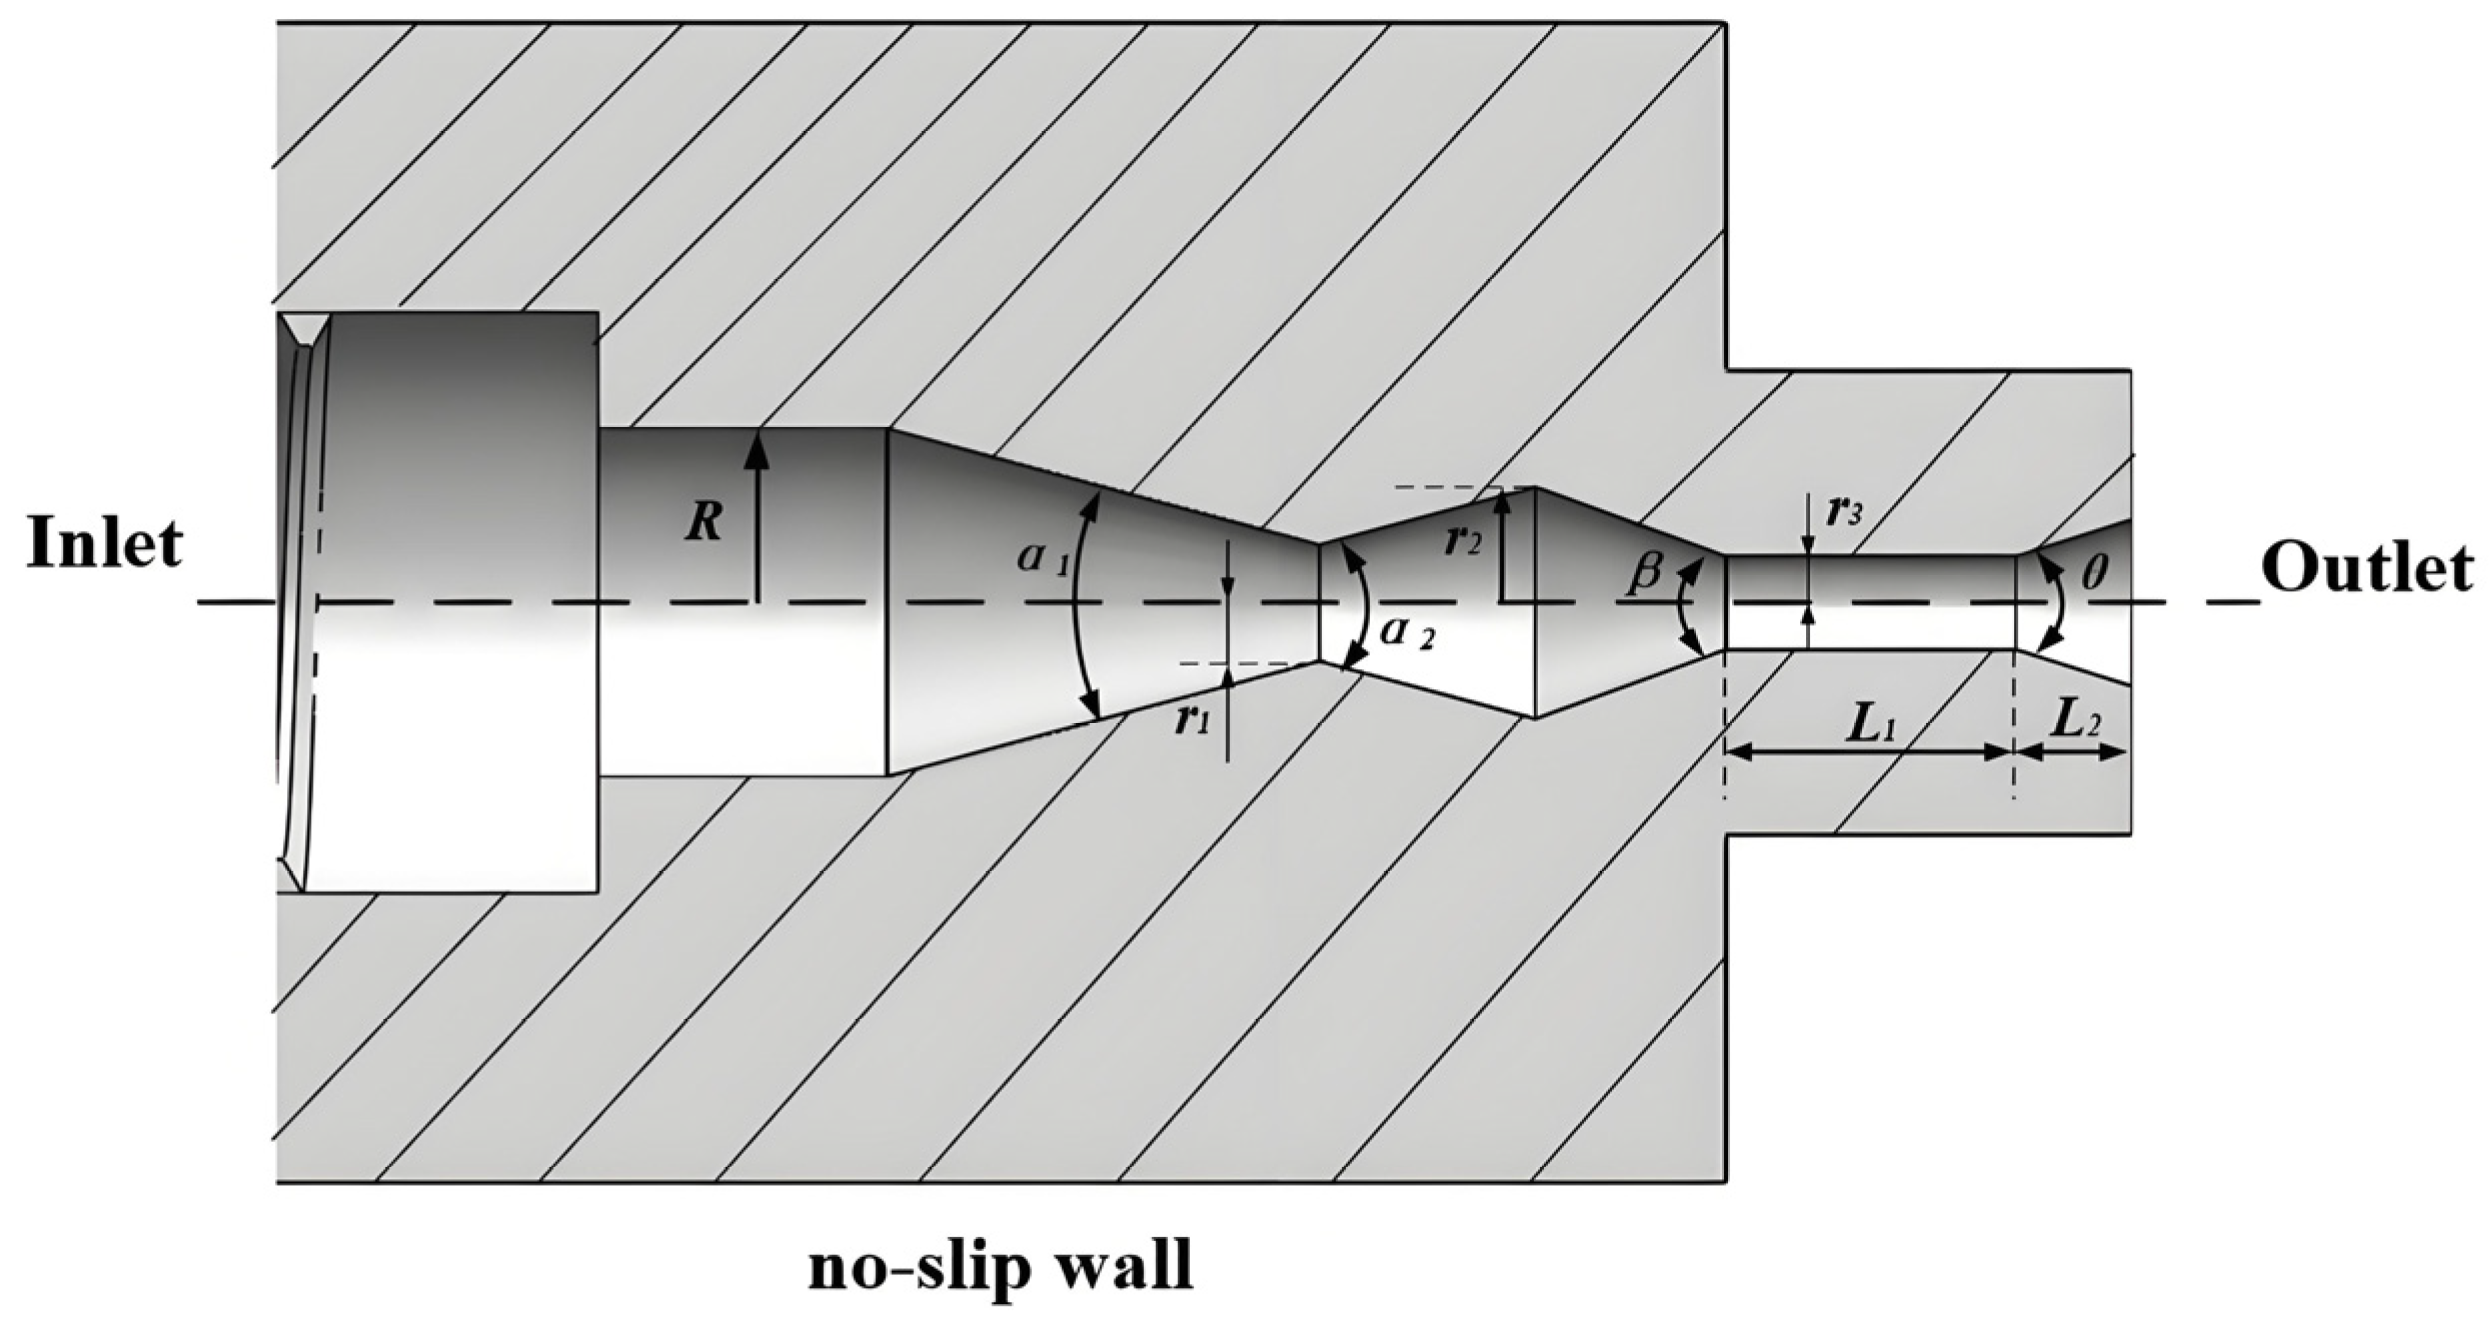
The effectiveness of existing foreign net cage cleaning devices in Chinese coastal waters remains unsatisfactory. Most domestic devices are still in the research-and-testing phase. Furthermore, the high cost of cleaning equipment designed for small to medium-sized cages makes them unaffordable for many aquaculture farmers. To address these challenges, this study combines the technical requirements for cleaning with the principles of cavitation jet technology. We designed a cleaning device that integrates cavitation water jets and mechanical crushing, specifically tailored for small and medium-sized net cages. Using Fluent finite volume simulation software, we conducted a numerical simulation of the nozzle’s cavitation process. Based on the simulation results, we optimized the nozzle’s structural parameters and refined its operating parameters through actual cavitation tests. This research aims to enhance cleaning efficiency, reduce energy consumption, minimize labor demands, and lessen environmental impact. It also provides valuable insights for the future development of net cage cleaning equipment.

2. Materials and Methods

2.1. Mechanism of Nozzle Cavitation

“Cavitation jet” refers to the explosive growth of small bubbles caused by local low pressure during the evaporation process of a liquid jet. As shown in Figure 2, the high-speed jet formed within the nozzle experiences shear forces from the surrounding water, creating a low-pressure zone between the nozzle wall and the fluid in the throat. When the pressure in this zone drops below the saturated vapor pressure, a phase transition occurs, forming cavitation nuclei. As the high-speed jet moves through the nozzle, it interacts with the surrounding fluid to generate numerous vortices. The cavitation cores at the centers of these vortices rapidly expand into bubbles, resulting in cavitation. When these bubbles collapse near or on the surface of an object [20], the energy released during their rupture is concentrated over a small area, exerting force on the target and causing deformation.

2.2. Cleaning Device Design

Net cage cleaning operations are typically performed in the ocean, presenting challenges such as deepwater conditions and the need to cover a wide cleaning area. To enhance efficiency, the cleaning device must combine cavitation jet technology with mechanical striking. During these operations, the cleaning equipment is required to systematically clean specific areas based on the layout of the net cage.

2.2.1. Whole Machine Design

The primary structure of the net cage cleaning device is illustrated in Figure 3. It consists of key components, such as a two-stage nozzle, cleaning blades, brush blocks, a rotary joint, manifold, cleaning disk, and propeller, as shown in Figure 4. High-pressure water flows through the manifold into the guide tube, connecting to the two-stage nozzle. The nozzle and cleaning disk are positioned at a 20° angle, with cleaning blades and brushes mounted on the disk’s surface. The high-pressure water forms a high-speed cavitation jet as it exits the nozzle. The jet’s reactive force generates torque, driving the cleaning disk to rotate and create a circular cleaning path. As the cleaning disk rotates, the blades and brushes work in tandem with the cavitation water jet, which produces numerous bubbles. This combination effectively dislodges and removes fouling from the net surface. By adjusting the propeller’s voltage, the distance between the cleaning device and the net can be controlled. This adjustment also counteracts the reactive force generated by the high-pressure water.

2.2.2. Component Design

The cavitation nozzle is essential for generating cavitation water jets, enabling the formation, growth, and collapse of bubbles within the jet. The development of these bubbles is a dynamic process, with each stage involving changes in shape, velocity, and internal dynamics. To analyze these characteristics, the Rayleigh-Plesset equation is applied, offering insights into the behavior of the bubbles as they form and collapse, expressed as:
3 2 R 1 2 + R R 2 = 1 ρ p g + p v p t 2 τ R 4 μ R 1 R
In this context, R represents the vacuole’s radius, while R1 and R2 denote the velocity and acceleration of the vacuole wall, respectively. pg is the air pressure inside the bubble, and pv is the vapor pressure of the gas within the vacuole. The parameters τ and μ refer to the surface tension and viscosity coefficient of the liquid, respectively. When R1 = R2, the vacuole reaches a state of static equilibrium. From Equation (1), the critical radius R3 for gas nucleus formation can be derived, with the resulting expression shown as follows.
R 3 = R 0 3 R 0 2 τ p 0 p v + 2 τ R 0
Here, p0 and R0 represent the initial pressure and radius of the gas nucleus, respectively. When RR3, cavitation begins, leading to the formation of a vacuole. The expansion and collapse of the vacuole release significant energy, which is the primary cause of surface damage to materials. During vacuole collapse, the fluid pressure inside the vacuole can be calculated as follows.
p max p = 1 + R 0 R 3 4 4 3 4 4 3 R 0 R 3 1 1 3
When R approaches R0, Equation (3) can be simplified as:
p max p 1 6.35 R R 0 3
The equation shows that the maximum pressure of the bubble fluid varies with the bubble radius R. As the bubble size increases, the maximum pressure during collapse also increases. Based on this theoretical analysis, a two-stage nozzle, as shown in Figure 5, was designed to achieve cavitation water jet cleaning for seawater cages. The specific parameters of the nozzle are provided in Table 1.

2.3. Establishment of Simulation Model

In CFD simulation software, commonly used multiphase flow models include the Euler model, VOF model, and Mixture model [21]. The Mixture model is particularly effective when dealing with problems involving two or more phases and phase changes. It offers a significant reduction in computational resource requirements and solution time while maintaining an acceptable level of accuracy. Additionally, the stability and convergence of the model’s solution are favorable [22]. For these reasons, the Mixture model was selected for the fluid flow analysis. Common methods for simulating turbulence include direct numerical simulation (DNS), large-eddy simulation (LES), and Reynolds-averaged Navier–Stokes (RANS) equations. While DNS provides an accurate representation of turbulence phenomena, its high computational demands make it impractical for real-world engineering applications. LES reduces computational requirements, but still requires significant memory and processing power. In contrast, the RANS method is widely used in engineering due to its balance of broad applicability, low computational cost, and reasonable accuracy. Among the various RANS models, the Realizable k-ε turbulence model is particularly effective for complex geometries and flow conditions. It offers improved predictive capabilities, especially for vortex and recirculation flows, compared to the more commonly used standard k-ε model [23]. In the simulation, the default fluid is incompressible and cavitation characteristics of the nozzle were analyzed by creating a computational domain for the nozzle’s flow field. Since the nozzle has an axisymmetric structure, a two-dimensional symmetrical model was used to simplify the calculations. The grid for this model is shown in Figure 6. In addition to this, four monitoring points, A, B, C and D, are set in the nozzle computational domain model, which are located at the pipeline diameter change points on the axis of symmetry of the nozzle meshing model, to detect the nozzle jet flow rate. The simulation used the coupled solution method, the Realizable k-ε turbulence model, and the Zwart–Gerber–Belamri cavitation model within the Mixture model framework.

2.4. Bench Test

2.4.1. Test Bench Design

To examine the impact of nozzle operating parameters on the cavitation effect, a cavitation test was conducted following the optimization of the nozzle’s structural parameters. To streamline the cleaning process, a nozzle cavitation performance test bench was constructed, as shown in Figure 7. The test bench consisted of several key components: a high-pressure pump station, nozzles, push rod motors, pressure gauges, valves, water storage tanks, fixtures, and aluminum plates. The water storage tank is made of high-density polyethylene and has a capacity of 100 L. The HM3700 high-pressure cleaning machine, with a flow rate of 22 L/min and a maximum working pressure of 40 MPa, supplies high-pressure water to the nozzle. The parameters of the high-pressure pump are listed in Table 2. The test target was a 1060 aluminum plate (500 mm × 400 mm × 1 mm). Before the experiment, the aluminum plate surface was polished with sandpaper, then rinsed to remove any aluminum shavings and left to dry. During testing, the nozzle and fixture were positioned on the bench.

2.4.2. Experimental Factor Design

The distance between the nozzle and the target, as well as the angle between the nozzle and the horizontal plane, significantly affect the cleaning performance. To investigate this, a cavitation performance test was conducted with three different target spacings (10 mm, 15 mm, and 20 mm) and three nozzle angles (10°, 20°, and 30°) under constant pump pressure and flow rate. These target distances were selected to examine their impact on cavitation performance and erosion effects. In cavitation jets, target spacing influences the jet’s energy distribution, velocity, and the formation and collapse of cavitation bubbles. A smaller target distance (e.g., 10 mm) allows the jet to concentrate quickly, creating a strong impact force and localized erosion, but this effect may be limited by jet stall and diffusion. A moderate distance (e.g., 15 mm) balances concentration and diffusion, offering more effective erosion. A larger distance (e.g., 20 mm) disperses the jet energy, potentially weakening cavitation bubble stability and shock wave intensity, thereby reducing erosion. These three distances were chosen to assess cavitation characteristics at various jet distances and identify the optimal cleaning effect. Since cavitation phenomena could not be directly observed during the experiment and variations in nozzle parameters could introduce variability in the results, surface roughness (Ra) and maximum depression depth (Rv) of the target were used as indicators of cavitation performance. The experiment simulated the actual operating environment of the net cage cleaning device: place the entire test bench in the constructed water tank, control the distance between the nozzle and the target by adjusting the push rod motor, and adjust the speed of the turntable by changing the angle between the nozzle and the cleaning disk; before starting the cleaning test, align the cleaning tray with the center of the target. During the testing process, a stopwatch was used to time the experiment. The surface roughness and maximum depression depth of the cleaned target were measured using the JB-4C precision roughness step tester shown in Figure 8.

2.4.3. Evaluation of Experimental Results

Under the cleaning action of the cavitation jet, the cavitation marks on the target surface were generally distributed in a circular pattern, as shown in Figure 9. This distribution reflects the area affected by the nozzle during cavitation. These results align with findings by Yang [24]. Cavitation pits are primarily located within the nozzle’s cavitation zone, where distinct cavitation marks are visible. Small indentations, caused by the rupture of cavitation bubbles, indicate that the impact force of the fluid had a pronounced shear effect on the target surface. These observations further confirm the effectiveness of using this method to study cavitation effects.
To study the influence of target distance and angle on cavitation effect, a two-factor full-scale experiment was conducted using target distance and angle as experimental factors and target surface roughness and maximum depression depth as evaluation indicators to analyze the effect of cavitation test bench operating parameters on target cleaning. The two-factor level table of target distance and angle is shown in Table 3.

3. Results

3.1. Verification of Nozzle Independence

To minimize errors in simulation results, it is essential to determine the appropriate grid density and ensure the calculation time step is independent of the results. Based on the established computational model, four monitoring points (A, B, C, and D) along the axis were selected, with flow velocity as the monitoring parameter. Five different grid schemes were designed, as shown in Table 4, all using the same computational model and boundary conditions. The corresponding calculation results are presented in Figure 10.
When the grid count exceeded 9.5 × 10⁵, the velocity error at the four axis points remained below 1.5%. For optimal balance between accuracy and efficiency, a grid size of 0.03 mm was chosen. To ensure reliable results, the convergence criterion was set to 10⁻⁶, and the calculations were iterated until convergence at each time step. As shown in Figure 11, five sets of iterations (500, 700, 1000, 1200, and 1500 steps) were performed, with axis velocity along the symmetry axis the monitoring object. When the number of iterations exceeded 1000, the velocity distribution curve stabilized and showed minimal variation, indicating that the results had converged. Considering both accuracy and computational time, 1000 iterations was selected as the optimal iteration count.

3.2. Single Factor Simulation Test Results of Nozzle Structure

First, a single-factor simulation experiment was conducted to adjust the relevant parameters within appropriate ranges based on the pretest simulation results. The end diffusion angle was varied in increments of 10°, the second section throat radius was adjusted in 0.1 mm steps, and the second section throat contraction angle was modified in increments of 10°.

3.2.1. The Influence of End Diffusion Angle on Gas-Phase Volume Fraction

Based on a study by Cai [25], the cavitation jet effect is most effective when the end diffusion angle ranges between 20° and 50°. Therefore, the experimental conditions were set with a throat radius of 0.8 mm and a throat contraction angle of 40° for the second section. The end diffusion angle was varied between 20° and 60°. Figure 12a–c show the gas-phase volume fraction and its maximum value at different end diffusion angles. As the end diffusion angle increases, the maximum gas-phase volume fraction initially rises and then declines. The gas-phase volume fraction reaches its peak at a 40° end diffusion angle. Increasing the diffusion angle enhances liquid mobility in the vortex region, which further reduces pressure in the low-pressure zone, thereby improving the cavitation effect. However, beyond the optimal angle, the liquid’s fluidity decreases, leading to a reduction in the gas content of the liquid.

3.2.2. Influence of the Radius of the Second Throat on the Gas-Phase Volume Fraction

The experimental conditions were set at a 40° end diffusion angle and a 40° contraction angle at the second throat. The radius of the second throat was varied between 0.6 mm and 1.0 mm [26]. The gas-phase volume fraction and its maximum value were measured for different throat radii, as shown in Figure 12d–f. As the second throat radius increased, the maximum gas-phase volume fraction initially rose, then declined. From the figures, it is clear that when the second throat radius reached 0.8 mm, the maximum gas-phase volume fraction peaked at 0.9235, with the largest cavitation area. This is because a larger throat radius allows more space for cavitation bubble formation and accumulation, increasing the gas-phase volume fraction. However, when the radius exceeds the optimal value, the flow velocity inside the throat decreases, which reduces the gas content in the mixed liquid and consequently lowers the gas-phase volume fraction.

3.2.3. Influence of the Contraction Angle of the Second Throat on the Gas Phase Volume Fraction

With an end diffusion angle of 40° and a second throat radius of 0.8 mm, it is important to determine an appropriate range for the second throat’s contraction angle. According to the literature [27], the nozzle’s cavitation effect is most effective when the second throat’s contraction angle is between 20° and 60°. Figure 12g–i show how the gas-phase volume fraction and its maximum value vary with different second throat contraction angles. As the second throat contraction angle increases, the maximum gas-phase volume fraction first rises and then decreases. The gas-phase volume fraction reaches its peak at a 40° contraction angle. This indicates that the second throat contraction angle can be optimized within a specific range to maximize the gas-phase volume fraction, which aligns with the findings of Yang [28]. An increase in the contraction angle facilitates the formation of bubbles at the jet boundary. These bubbles then diffuse toward the jet core, resulting in a higher gas-phase volume fraction.

3.3. Multifactor Simulation Test Results of Nozzle Structure

Based on the results of the single-factor experiment, it can be concluded that the structural parameters of the nozzle have varying degrees of influence on the cavitation effect. In order to study the effects of these factors and their interactions on the gas-phase volume fraction and determine the optimal parameters for the two-stage nozzle, a quadratic regression orthogonal experiment was conducted.

3.3.1. Experimental Design and Result Analysis

A three-factor, three-level orthogonal combination experiment was conducted, with the end diffusion angle, second throat radius, and second throat contraction angle as experimental factors. Based on the results of the single-factor experiment, the levels of each factor were determined as shown in Table 5. The central experiment was repeated five times, and the experimental plan and results are shown in Table 6.
To further assess the influence of different experimental factors and their interactions on the results, regression analysis was performed using Design Expert. A regression model was developed to establish the relationship between the experimental indicators and the various factors. The results of the significance tests are presented in Table 7.
According to Table 7, the misfit term for the variance in the gas-phase volume fraction is 0.1706, which is greater than 0.05 and therefore not significant. This indicates that the model accurately represents the influence of the various factors on the gas-phase volume fraction. The regression equation relating the gas-phase volume fraction (y) to the influencing factors is as follows.
y = 0.9404 0.0012 A 0.0023 B 0.0033 C 0.0037 A B 0.0027 A C + 0.0047 B C 0.0068 A 2 0.0057 B 2 0.0153 C 2
In the equation, the absolute value of the factor coefficient represents the degree to which the gas-phase volume fraction is affected by the factor. The contraction angle of the second throat has the greatest impact on the gas-phase volume fraction, followed by the radius of the second throat. The diffusion angle at the end has the smallest impact on the gas-phase volume fraction. The gas-phase volume fraction is significantly affected by the interaction between the end diffusion angle and the radius of the second throat (AB), as well as the end diffusion angle and the contraction angle of the second throat (AC). The gas-phase volume fraction is significantly affected by the interaction between the radius of the second throat and the contraction angle of the second throat (BC).

3.3.2. Response Surface Analysis

To more intuitively analyze the influence of the interaction of various factors on the gas-phase volume fraction, a response surface graph was drawn using Design Expert, as shown in Figure 13.
When the contraction angle of the second throat is 40°, the response surface of the end diffusion angle and the radius of the second throat to the gas-phase volume fraction are as shown in Figure 13a. When the end diffusion angle is constant, the gas-phase volume fraction shows a trend of first increasing and then decreasing with the increase in the radius of the second throat. The decreasing trend is not obvious, and has a relatively small impact on the overall gas-phase volume fraction. When the radius of the second throat remains constant, the gas-phase volume fraction first increases and then decreases with the increase in the end diffusion angle.
When the radius of the second throat is 0.8 mm, the response curves of the end diffusion angle and the contraction angle of the second throat to the gas-phase volume fraction are as shown in Figure 13b. As shown in the figure, the interaction between the end diffusion angle and the contraction angle of the second throat has the most significant effect on the gas-phase volume fraction. With the increase in the end diffusion angle and the contraction angle of the second throat, the gas-phase volume fraction shows a trend of first increasing and then decreasing.
When the end diffusion angle is 40°, the interaction effect between the radius of the second throat and the contraction angle of the second throat on the gas-phase volume fraction is more significant. The response surfaces of the radius of the second throat and the contraction angle of the second throat to the gas-phase volume fraction are shown in Figure 13c. The gas-phase volume integral number shows a trend of first increasing and then decreasing with the increase in the radius of the second throat, and also shows a trend of first increasing and then decreasing with the increase in the contraction angle of the second throat.

3.3.3. Optimization

To find the optimal combination of various factor parameters for nozzle cavitation performance, the objective function is used to achieve the highest gas-phase volume fraction, and the established regression model is optimized and solved with the end diffusion angle, second throat radius, and second throat contraction angle as constraints. The specific objective function and constraints are shown in Equation (5).
max   y A , B , C s . t . 30 ° A 50 ° 0.7   mm B 0.9   mm 30 ° C 50 °
Through optimization with Design Expert software, it was determined that the cavitation effect of the nozzle is most efficient when the end diffusion angle is 35.495°, the second throat radius is 0.834 mm, and the second throat contraction angle is 41.047°, with a gas-phase volume fraction of 0.941. Under these conditions, the liquid–gas content exceeds 90%, which surpasses the performance of the nozzle design developed by Yuan [29] and meets the cleaning requirements for aquaculture net cages. Based on this optimal configuration, a two-stage nozzle was fabricated for prototype testing, providing a foundation for further evaluation of its cavitation performance under real-world production conditions.

3.4. Bench Test Results

The nozzle cavitation jet was operated for 25 min, and the resulting target effect image, shown in Figure 14, reveals distinct cavitation rings on each target. Small impact marks on the target surface were observed through an optical microscope. Surface roughness and maximum depression depth were measured using a precision roughness step tester, and the results are presented in Table 8. Figure 15 illustrates the effects of different target distances and angles on surface roughness and maximum depression depth. As shown in Figure 15a, both surface roughness and maximum depression depth initially increase with target distance, then decrease. This trend occurs because as the target distance increases, more cavitation bubbles form and collapse on the surface, enhancing the cavitation effect. However, when the target is too far from the nozzle cavitation zone, only a small portion of the shock wave from the jet divergence impacts the target, leading to reduced surface roughness and shallower indentation. Figure 15b shows that at a 20° angle, the maximum surface depression is deeper, indicating that the shear effect of the high-speed water flow on the target is optimal. Based on the experimental analysis, the nozzle configuration with a target distance of 15 mm and an angle of 20° produces the best cavitation effect on the target.

4. Conclusions

(1)
This paper introduces a cleaning device for small and medium-sized aquaculture nets, combining a cavitation nozzle with cleaning blades and brush blocks. The device effectively removes surface fouling from the net using the cavitation effect. An overview of the device’s operating principle and its workflow is provided in this paper.
(2)
A finite volume model of the nozzle was developed using Fluent software to simulate its cavitation performance. Single-factor experiments were conducted to assess the impact of various structural parameters on the gas-phase volume fraction. Through quadratic regression orthogonal experiments, the optimal nozzle parameters were identified: an end diffusion angle of 35.495°, a second throat radius of 0.834 mm, and a second throat contraction angle of 41.047°. Under these conditions, the gas-phase volume fraction reached 0.941.
(3)
To optimize the operating parameters of the cleaning device’s nozzle and simplify the cleaning process, a cavitation performance test bench was constructed. Surface roughness and the maximum depth of surface depression were used as indicators of the nozzle’s cavitation effect. The test results showed that when the target distance is 15 mm and the nozzle angle is 20°, the surface roughness and maximum depression depth reached their highest values—6.215 μm and 22.030 μm, respectively. Under these conditions, the cavitation performance and cleaning effect were optimal.

Author Contributions

Conceptualization, H.Z.; methodology, H.Z. and Y.X.; software, Q.X. and K.L.; writing—original draft preparation, Y.X.; writing—review and editing, H.Z.; supervision, Z.L.; project administration, L.B. and Z.F. All authors have read and agreed to the published version of the manuscript.

Funding

This research was funded by a Liaoning Provincial Department of Education project (LJKMZ20221112); Key Laboratory of Environment Controlled Aquaculture (Dalian Ocean University) Ministry of Education (202212); Liaoning Provincial Science and Technology Tackling Program Item (2024JH2/102600069); and Liaoning Province Science and Technology Plan Joint Program Technical Key Project “Research and Application of Key Technologies and Equipment for Liquid Coupling Cleaning of Liaoning Coastal Aquaculture Cage Machine”.

Data Availability Statement

All data that support the findings of this study are included within the article.

Conflicts of Interest

The authors declare no conflicts of interest.

References

  1. Madin, J.; Chong, V.C.; Hartstein, N.D. Effects of water flow velocity and fish culture on net biofouling in fish cages. Aquac. Res. 2010, 41, 602–617. [Google Scholar] [CrossRef]
  2. Zheng, Y.L. Ecological Study on Fouling Organisms in the Net Cage Aquaculture Area of Tong’an Bay. Master’s Thesis, Xiamen University, Xiamen, China, 2006. [Google Scholar]
  3. Bannister, J.; Sievers, M.; Bush, F. Biofouling in marine aquaculture: A review of recent research and developments. Biofouling 2019, 35, 631–648. [Google Scholar] [CrossRef] [PubMed]
  4. Cabre, L.M.; Hosegood, P.; Attrill, M.J. Offshore longline mussel farms: A review of oceanographic and ecological interactions to inform future research needs policy and management. Rev. Aquac. 2021, 13, 1864–1887. [Google Scholar] [CrossRef]
  5. Huang, G.F.; Zheng, G.F.; Wei, G.Y.; Ding, L.; Dai, T.Y. Polluting organisms in the deep-water net cage aquaculture area of Weitou Sea in Fujian Province. J. Oceanogr. 2007, 29, 98–104. [Google Scholar]
  6. Song, X.F.; Sun, Y.; He, J.; Chu, Y.C.; Sun, Z.L. Research progress on deep water net cage cleaning technology and equipment. Fish. Mod. 2021, 48, 1–9. [Google Scholar]
  7. Liu, S.Y.; Huang, L.Q.; Fan, G.B.; Zhu, T.K.; Chen, B.H. Research status and application of net cage cleaning technology. Clean. World 2021, 37, 28–29. [Google Scholar]
  8. Dahms, H.U.; Dobretsov, S. Antifouling compounds from marine macroalgae. Mar. Drugs 2017, 15, 265. [Google Scholar] [CrossRef]
  9. MacKenzie, A.F.; Basque, K.; Maltby, E.A.; Hodgson, M.; Nicholson, A.; Wilson, E.; Stuart, R.; Smith-Palmer, T.; Wyeth, R.C. Effectiveness of several commercial non-toxic antifouling technologies for aquaculture netting at reducing mussel biofouling. Aquaculture 2021, 543, 736968. [Google Scholar] [CrossRef]
  10. Liu, S.Y.; Huang, L.Q.; Zhu, T.K.; Chen, B.H.; Yu, G.Y. Design and application of deep water net cage cleaning robot based on cavitation jet. Mech. Res. Appl. 2021, 34, 66–71. [Google Scholar]
  11. Aurora Marine. ROV Aquaculture Net Cleaning [DB/OL]. [2017-04-15]. Available online: http://www.auroramarine.co.uk (accessed on 1 June 2024).
  12. Multi Pump Innovation. Jet Master. 2021-06-28. Available online: https://www.akvagroup.com/net-cleaning/akva-fnc8-category/ (accessed on 1 June 2024).
  13. Plesset, M.S.; Chapman, R.B. Collapse of an initially spherical vapour cavity in the neighbourhood of a solid boundary. J. Fluid Mech. 1971, 47, 283–290. [Google Scholar] [CrossRef]
  14. Zhong, X.; Dong, J.; Liu, M.; Meng, R.; Li, S.; Pan, X. Experimental study on ship fouling cleaning by ultrasonic-enhanced submerged cavitation jet: A preliminary study. Ocean. Eng. 2022, 258, 111844. [Google Scholar] [CrossRef]
  15. Hu, S.G.; Zhu, M.Z. Research status and application of cavitation water jet. J. East China Univ. Technol. 1996, 18, 1–8. [Google Scholar]
  16. Martin, B.; Romuald, S. 3D flow simulation of a circular leading edge hydrofoil and assessment of cavitation erosion by the statistical evaluation of void collapses and cavitation structures. Wear 2019, 428–429, 457–469. [Google Scholar]
  17. Guha, A.; Barron, R.M.; Balachandar, R. An experimental and numerical study of water jet cleaning process. J. Mater. Process. Technol. 2011, 211, 610–618. [Google Scholar] [CrossRef]
  18. Liu, H.S.; Xu, Y.; Wang, Z.C.; Zhang, J.L.; Wang, J.X. Experimental and numerical simulations to examine the mechanism of nozzle geometry affecting cavitation water jets. Geoenergy Sci. Eng. 2024, 233, 212–235. [Google Scholar] [CrossRef]
  19. Yuan, G.; Ni, B.; Wu, Q.; Lu, W.; Xue, Y. Experimental study on ice breaking by a cavitating water jet in a Venturi structure. Appl. Therm. Eng. 2024, 239, 122–135. [Google Scholar] [CrossRef]
  20. Sun, Y.; Du, Y.; Yao, Z.; Zhong, Q.; Geng, S.; Wang, F. The Effect of Surface Geometry of Solid Wall on the Collapse of a Cavitation Bubble. J. Fluids Eng. 2022, 144, 227–240. [Google Scholar] [CrossRef]
  21. Su, Z.; Li, Z.; Wang, K.; Kuang, Y.; Wang, H.; Yang, J. Investigation of improved VOF method in CFD simulation of sodium heat pipes using a multi-zone modeling method. Int. Commun. Heat Mass Transf. 2024, 175, 107669. [Google Scholar] [CrossRef]
  22. Zhang, W.Q. Optimization Design of High-Pressure Jet Cavitation Nozzle and Mechanism of Shear Bubble Formation. Master’s Thesis, Jiangsu University, Zhenjiang, China, 2019. [Google Scholar]
  23. Hand, R.J.; Field, J.E.; Townsend, D. The use of liquid jets to simulate angled drop impact. J. Appl. Phys. 1991, 70, 7111–7118. [Google Scholar] [CrossRef]
  24. Yang, Y.F. Research on the Mechanism of Submerged High Pressure Water Cavitation Jet and the Enhancement of Metal Properties by Bubble Shock Wave. Ph.D. Thesis, Jiangsu University, Zhenjiang, China, 2020. [Google Scholar]
  25. Cai, T.F.; Pan, Y.; Ma, F. Effects of nozzle lip geometry on the cavitation erosion characteristics of self-excited cavitating waterjet. Exp. Therm. Fluid Sci. 2020, 117, 110137. [Google Scholar] [CrossRef]
  26. Zhang, B.; Zhu, C.C.; Li, J.X.; Wang, H.; Liu, X.L.; Wang, K. Optimization Study on Nozzle Selection Based on the Influence of Nozzle Parameters on Jet Flow Field Structure. Appl. Sci. 2024, 14, 9098. [Google Scholar] [CrossRef]
  27. Dieter, K.H.; David, H.H. MODERN ENGINEERING FOR DESIGN OF LIQUID-PROPELLANT ROCKET ENGINES; American Institute of Aeronautics and Astronautics: Washington, DC, USA, 1992; pp. 75–76. [Google Scholar]
  28. Yang, M.G.; Xiao, S.N.; Kang, C.; Wang, Y. Effect of Geometrical Parameters on Submerged Cavitation Jet Discharged from Profiled Central-body Nozzle. Chin. J. Mech. Eng. 2013, 26, 476–482. [Google Scholar] [CrossRef]
  29. Yuan, T.P.; Huang, X.H.; Hu, Y.; Wang, S.M.; Tao, Q.Y.; Pang, G.L. Aquaculture net cleaning with cavitation improves biofouling removal. Ocean Eng. 2023, 285, 115241. [Google Scholar] [CrossRef]
Figure 1. Current situation of net cage aquaculture: (a) HDPE cage structure; (b) net attachment.
Water 17 00589 g001
Figure 2. Schematic diagram of cavitation process inside the nozzle.
Water 17 00589 g002
Figure 3. Structure diagram of cleaning device: (a) front view; (b) top view.
Water 17 00589 g003
Figure 4. Key component structure diagram: (a) two-stage nozzle; (b) cleaning blade; (c) brush block.
Water 17 00589 g004
Figure 5. Structural diagram of two-stage nozzle.
Water 17 00589 g005
Figure 6. Mesh generation of nozzle model.
Water 17 00589 g006
Figure 7. Nozzle cavitation performance test bench: (a) schematic diagram of cavitation performance test bench; (b) photograph of cavitation performance test bench.
Water 17 00589 g007
Figure 8. Surface roughness measurement process.
Water 17 00589 g008
Figure 9. Cavitation target and microscopic image at 500× magnification.
Water 17 00589 g009
Figure 10. The influence of grid size on flow velocity at monitoring points.
Water 17 00589 g010
Figure 11. The influence of iteration times on axial flow velocity.
Water 17 00589 g011
Figure 12. Single-factor simulation test results (a) Cloud map of gas-phase volume fraction at 30° end diffusion angle; (b) influence of end diffusion angle on gas-phase volume fraction; (c) comparison of maximum gas-phase volume fraction at different end diffusion angles; (d) 0.8 mm second section throat radius gas-phase volume fraction cloud map; (e) influence of the radius of the second throat on the gas-phase volume fraction; (f) Comparison of maximum gas phase volume fraction of different second throat radius; (g) cloud map of gas-phase volume integral for 40° second section throat contraction angle; (h) influence of the contraction angle of the second throat on the gas-phase volume fraction; (i) Comparison of maximum gas-phase volume fraction at different second throat contraction angles.
Water 17 00589 g012aWater 17 00589 g012b
Figure 13. Response surface diagram of nozzle cavitation simulation: (a) interaction between radius and diffusion angle; (b) interaction between contraction angle and diffusion angle; (c) interaction between contraction angle and diffusion angle.
Water 17 00589 g013
Figure 14. Cavitation effect diagram of target with different parameters.
Water 17 00589 g014
Figure 15. Bench test results: (a) influence of angle and target on surface roughness; (b) influence of angle and target on maximum depression depth.
Water 17 00589 g015
Table 1. Nozzle structure and performance parameters.
Structural Performance ParametersValue
Nozzle inlet radius (R)2 mm
First section throat radius (r1)1 mm
First section of throat contraction angle (α1)30°
First section of throat diffusion angle (α2)30°
First section of throat outlet radius (r2)2 mm
Second section throat contraction angle (β)30°
Second section throat outlet radius (r3)0.8 mm
Length of throat at end of nozzle (L1)5 mm
Nozzle end diffusion angle (θ)40°
Length of diffusion tube at end of nozzle (L2)2 mm
Table 2. Performance parameters of high-pressure pump.
Performance ParameterWorking Pressure
Pin/MPa
Rated Power P/kwFlow Rate Q/(L/min)Size/cm
value0~402022100 × 60 × 120
Table 3. Two factor level table.
LevelTarget Distance (mm)Included Angle (°)
11010
21520
32030
Table 4. Grid computing solution.
SchemeMesh Size/mmNumber of GridsNodes
10.1116,128117,040
20.05464,332446,150
30.03950,400947,814
40.0251,114,7341,118,315
50.021,791,8541,794,563
Table 5. Horizontal factor coding table.
CodeEnd Diffusion AngleSecond Section Throat RadiusSecond Section Throat Contraction Angle
A (°)B (mm)C (°)
−1300.730
0400.840
1400.950
Table 6. Experimental plan and results.
CodeEnd Diffusion AngleSecond Section Throat RadiusSecond Section Throat Contraction AngleGas-Phase Volume Fraction
A (°)B (mm)C (°)y
1300.8300.92017
2400.8400.94021
3400.8400.93998
4400.7500.91337
5400.8400.94088
6500.8500.91101
7300.9400.93088
8400.8400.94002
9500.8300.92199
10400.9300.91595
11400.9500.91792
12400.7300.93018
13400.8400.94086
14500.7400.93223
15300.7400.92798
16500.9400.92021
17300.8500.91989
Table 7. Analysis of variance.
Source of VarianceSum of SquaresFreedomMean SquareFp
Model0.001890.0002549.99<0.0001
A0.000010.000063.83<0.0001
B0.000010.0000124.16<0.0001
C0.000110.0001239.30<0.0001
AB0.000110.0001156.40<0.0001
AC0.000010.000080.44<0.0001
BC0.000110.0001247.790.0093
A20.000210.0002551.58<0.0001
B20.000110.0001389.52<0.0001
C20.001010.00102769.03<0.0001
residual2.491 × 10−673.558 × 10⁻⁷
lack of it1.692 × 10−635.642 × 10−72.830.1706
error7.984 × 10−741.996 × 10⁻⁷
Table 8. Test results of erosion.
GroupTarget Distance (mm)Included Angle (°)Surface Roughness (μm)Maximum Depression Depth (μm)
110102.2199.386
215105.27217.315
320104.53616.094
410205.31117.898
515206.21522.030
620203.71412.758
710304.16315.407
815305.50218.742
920303.88313.165
Disclaimer/Publisher’s Note: The statements, opinions and data contained in all publications are solely those of the individual author(s) and contributor(s) and not of MDPI and/or the editor(s). MDPI and/or the editor(s) disclaim responsibility for any injury to people or property resulting from any ideas, methods, instructions or products referred to in the content.

