Abstract
Seaweed plays a critical role in marine carbon sequestration due to its high release rate of organic matter. However, the impacts of Porphyra cultivation on the concentration and composition of dissolved, particulate and sedimentary organic matter (DOM, POM and SOM) in coastal cultivation zones remain unclear. Herein, we investigated the optical properties of DOM, POM and SOM along a transect from the subtropical Chi River to the adjacent Porphyra cultivation zone in Dayu Bay (southeast China) during the late cultivation stage. The results revealed that all types of organic matter in coastal cultivation zones were predominantly characterized by highly autochthonous sources, contrasting sharply with the allochthonous, terrestrial sources observed at freshwater sites. The estuarine mixing model and principal component analysis further indicated that the organic matter dynamics in the coastal zone are primarily controlled by Porphyra cultivation, with relatively limited contributions from riverine inputs, coastal sediment and porewater sources. Porphyra cultivation leads to significant additions of protein-like components in the coastal water and sediment. Microbial degradation incubations of DOM and POM further demonstrated that Porphyra cultivation promotes the in situ production of humic-like components (peak M) in coastal water. DOM exhibited a higher microbial transformation efficiency into refractory components than POM, suggesting a more substantial role of DOM in coastal carbon sequestration. Our findings underscore the potential of Porphyra cultivation to enhance the carbon sequestration of coastal ecosystems.
1. Introduction
Seaweed cultivation contributes significantly to coastal carbon sequestration during its growth period, garnering global attention as a potential strategy to mitigate climate change [1,2]. Duarte et al. [3] reported that the primary production of global seaweeds is comparable to that of the Amazon forest. Over the past two decades, global seaweed cultivation has grown at an annual rate of 6.4%, reaching a production volume of 35 million tons in 2020 [4]. Approximately 43% of seaweed biomass is released into the water column as dissolved and particulate organic matter (DOM and POM). For instance, Liu et al. [5] reported a significant increase in dissolved organic carbon (DOC) concentrations in Sanggou Bay driven by kelp cultivation, while Wada and Hama [6] estimated that kelp-derived DOM accounted for 20% of the total DOC in Oura Bay, Japan. Li et al. [7] documented similar variations in POM caused by Ulva prolifera blooms, leading to a 46.4% increase in particulate organic carbon (POC) concentrations compared to non-Ulva prolifera zones. These seaweed-derived DOM and POM are rich in bio-labile components, which are subject to mineralization and only partially long-term stored in the ocean [2]. More than 90% of seaweed-derived POM settles in sediments within cultivation zones or adjacent continental shelves, significantly altering the biogeochemical cycling of sedimentary organic matter (SOM) [1,8]. Coastal organic matter cycling is also shaped by other biogeochemical processes, including riverine inputs, primary production, microbial activity, photodegradation and sediment resuspension [9,10]. Therefore, understanding the eventual impacts of seaweed cultivation on coastal organic matter pools is critical for assessing its carbon sequestration potential.
Although extensive research through incubation experiments and field investigations has advanced our understanding of seaweed carbon cycling [6,11,12], most studies have predominantly focused on kelp species. This is limiting the scope for comprehensive assessments of other widely cultivated seaweeds. Porphyra is among the most important and high-yielding seaweeds, with a carbon content of 42% (dry weight), which is higher than that of kelp, Undaria pinnatifida and Gracilaria [13]. Chen [14] reported that Porphyra exhibits significantly higher DOC and POC release rates compared to these species, making it a critical contributor to carbon sequestration in seaweed cultivation. Therefore, understanding how Porphyra cultivation influences the concentration and composition of DOM, POM and SOM in coastal cultivation zones is essential. Additionally, evaluating the bioavailability of DOM and POM could provide valuable insights into the broader impacts of Porphyra cultivation on coastal organic matter cycling.
Optical measurements of absorbance and fluorescence are widely used to characterize the sources, composition and processing of DOM (i.e., CDOM and FDOM) due to their low cost and operation advantages [15]. For instance, specific ultraviolet absorbance at 254 nm (SUVA254) and spectral slopes from 275–295 nm (S275–295) are commonly linked to DOM aromaticity and relative molecular weight, respectively [16,17]. The application of the fluorescence excitation–emission matrix (EEM) allows quantification of humic-like and protein-like components from diverse sources [15]. Moreover, the introduction of alkaline extraction methods provides new opportunities to gain insights into organic matter pools from POM and SOM [18,19]
Herein, we conducted a comprehensive investigation of DOM, POM and SOM along a subtropical river to its adjacent coastal Porphyra cultivation zone (Chi River-Dayu Bay) during the late cultivation period. Our objectives were to (1) investigate the impacts of Porphyra cultivation on the spatial distribution of DOM, POM and SOM optical properties and (2) elucidate the bioavailability and transformation processes of DOM and POM to refractory DOM (RDOM). Our study aims to provide new insights about the characteristics and mechanisms driving organic matter cycling in coastal Porphyra cultivation zones.
2. Materials and Methodology
2.1. Study Area
Dayu Bay (120°03′–120°05′ E, 27°03′–27°04′ N) is located in southeastern Zhejiang Province, China, and is one of the largest Porphyra (Haitanensis) cultivation zones in the country (Figure 1). The cultivation area spans approximately 57,300 acres, accounting for about 15% of China’s total Porphyra production [20]. The cultivation period of Porphyra typically extends from late October to April of the following year. Dayu Bay is a semi-enclosed bay with an average water depth of 5 m. Its western region receives freshwater input from the Chi River, which has a small watershed area of 70 km2. The freshwater discharge into Dayu Bay is limited, with an annual flux of approximately 3.8 × 10⁷ m3. Dayu Bay supports extensive Porphyra activities, making it a critical area for exploring the impacts of seaweed cultivation on coastal carbon cycling.
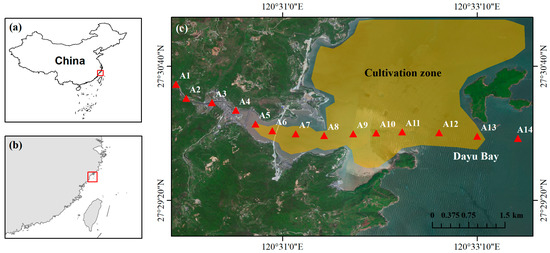
Figure 1.
Study area (a–c) and sampling sites.
2.2. Sample Collection and Pre-Treatment
To better capture the seaweed-derived organic matter signal, field sampling was conducted at the aging stage of Porphyra (April 2023). Fourteen surface water samples (0.5 m depth) were collected using Niskin bottles along the river (A1–A4) and the coastal cultivation zone (A5–A14) at equal spatial intervals (Figure 1). Sediment samples were collected from 12 stations along the continuum (A3–A14). No sediments were collected from A1 and A2 due to the construction of anthropogenic impoundments.
After returning to the laboratory, water samples were immediately filtered through a pre-combusted (500 °C, 5 h) 0.7 μm GF/F filter for DOC and DOM optical parameter analysis. Retained particles on the filters were used for POC and POM optical parameter analysis. Sediment samples were freeze-dried, ground and sieved through 80 mesh for soil organic carbon (SOC) and SOM optical parameter analysis. In situ water temperature, salinity (Sal), dissolved oxygen (DO), turbidity (NTU) and chlorophyll (Chl a) were measured using a calibrated and integrated EXO2 sonde (YSI, Greene, OH, USA). All sensors were calibrated using the two-point method prior to the sampling campaign.
2.3. Incubation Experiment of DOM and POM
To assess the bioavailability of DOM and POM along the Chi River to Dayu Bay, two experimental groups were established: the BDOM group (DOM only) and the BTOM group (DOM and POM). We collected 500 mL filtered and unfiltered water samples in pre-combusted (500 °C, 5 h) brown glass bottles for the BDOM and BTOM groups, respectively. Samples were incubated in the dark at room temperature for 28 days, with daily shaking of BTOM bottles to avoid particulate settling. All samples were prepared and analyzed in triplicate.
2.4. Measurement of DOC, POC and SOC
DOC concentration was measured using a TOC-L (Shimadzu, Kyoto, Japan) by the high-temperature catalytic oxidation method. POC and SOC were measured using an elemental analyzer (Elementar, Frankfurt, Germany). POC and SOC samples were acidified with HCl to remove inorganic carbon before analysis.
2.5. Optical Analysis of DOM, POM and SOM
POM filters and SOM samples were extracted with 0.1 mol/L NaOH in the dark at 4 °C for 24 h. The extracts were neutralized with HCl to a pH of approximately 7.5 and filtered through 0.2 μm polycarbonate filters. The optical parameters (A) of POM were corrected using the initial filtered volume (V1) and the extraction solution volume (V2) using the following formula:
The absorption spectra and EEMs of DOM, POM and SOM were analyzed using an Aqualog fluorescence spectrometer (Horiba, Kyoto, Japan). The absorption spectrum was scanned over 200–700 nm with a 1 nm interval. EEMs were measured with excitation wavelengths (Ex) from 240 to 450 nm (5 nm intervals) and emission wavelengths (Em) from 240 to 600 nm (1 nm intervals), with an integration time of 1 s.
Peaks C, M and T were identified according to Fellman et al. [21]. Peak C represents terrestrial humic-like substances (Ex/Em ≤ 260 nm/448–480 nm). Peak M represents microbial-derived humic-like substances (Ex/Em = 290–325 nm/370–430 nm). Peak T represents autochthonous protein-like substances (Ex/Em = 270–280 nm/330–368 nm). Fluorescence intensity for each peak was expressed in Raman Units (RU) as the maximum value within its defined region. Additional optical indices, including S275–295, SUVA254, the humification index (HIX) and the biological index (BIX) were calculated as described by Hansen et al. [15]. The S275–295 value is negatively correlated with the relative molecular weight of organic matter. Higher SUVA254 values indicate greater aromatic organic content. Similarly, a higher HIX represents a greater degree of humification, while a higher BIX reflects a larger contribution from autochthonous sources.
2.6. Estuarine Mixing Analysis of DOM and POM
To identify potential addition or removal processes of DOM and POM in the water column, a theoretical mixing line was established based on the observed concentrations between a freshwater endmember and a marine endmember. The freshwater endmember was defined as the site closest to the estuary (A4), while the marine endmember was represented by the site with the highest salinity (A14). Samples plotted above the theoretical mixing line indicated net additions of organic matter, whereas those below the line represented removal processes.
2.7. Data Analysis and Visualization
The t-test was conducted using SPSS 22.0 (IBM, Armonk, NY, USA) to determine spatial differences of all parameters at a significance level of p < 0.05. Spearman correlation was assessed using Origin 2025 (OriginLab, Northampton, MA, USA) after data standardization. All figures were generated using Origin 2025 and ArcGIS 10.2 (Esri, Redlands, CA, USA).
3. Results
3.1. Spatial Variation of Water Quality Along the Chi River to Dayu Bay
Salinity exhibited a pronounced increase from 0–0.14 at freshwater sites (A1–A4) to 25.3–27.5 in coastal sites (A5–A14) (Figure 2). This sharp gradient reflects limited freshwater inflows into Dayu Bay, likely attributed to the relatively small watershed area of the Chi River. COD concentrations ranged from 0.66 to 1.22 mg/L, showing a gradual increase from A1 to A3, followed by fluctuations at the coastal sites. Chl a (0.81–22.5 μg/L) remained at low concentrations in the freshwater sites, peaked at A5–A6 and gradually declined toward offshore sites. Turbidity (9.3–232 NTU) exhibited an overall increasing trend from freshwater to coastal zones, with notably high values recorded at sites A4 and A10.
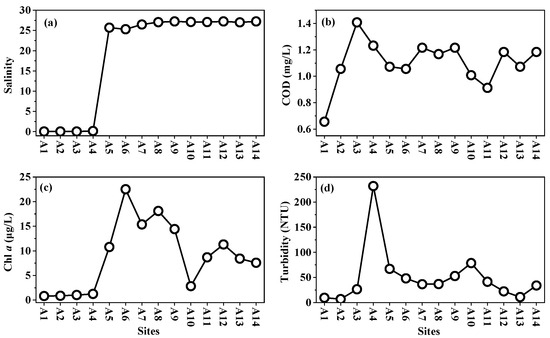
Figure 2.
Distribution pattern of water quality from Chi River to Dayu Bay. (a) salinity; (b) COD; (c) Chl a; (d) Turbidity.
3.2. Spatial Variation of DOM Along the Chi River to Dayu Bay
DOC concentrations ranged from 0.84 to 1.92 mg/L (Figure 3), with no significant differences observed between freshwater sites and the cultivation zones (p > 0.05). Humic-like peak Cd (21.3–40.8%) and peak Md (21.3–40.8%) were positively correlated with DOC (r = 0.66–0.76) and thus exhibited similar spatial distribution patterns. In contrast, the protein-like peak Td (27.8–62.4%) showed a negative correlation with DOC (r = −0.78) and displayed an increasing trend from the freshwater to the coastal cultivation zone. HIXd significantly declined from freshwater sites to the cultivation zones (0.6–0.95; p < 0.05), whereas the BIXd showed a significant increasing trend (0.73–1.0; p < 0.05). S275–295d (0.0114–0.0262) and SUVA254d (1.59–5.16 L−1 mg C m−1) both exhibited significantly higher values in the freshwater sites than in the cultivation zones (p < 0.05).
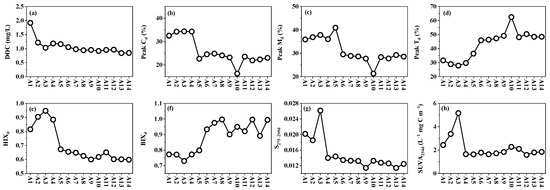
Figure 3.
Spatial distribution pattern of DOM from Chi River to Dayu Bay. (a) DOC; (b) Peak Cd; (c) Peak Md; (d) Peak Td; (e) HIXd; (f) BIXd; (g) S275-295d; (h) SUVA254d.
3.3. Spatial Variation of POM Along the Chi River to Dayu Bay
POC, peak Cp, peak Mp and peak Tp ranged from 0.74 to 3.26 mg/L, 10.3–30.9%, 23–52.5% and 24.4–60%, respectively (Figure 4). POC increased from site A2 to A9 and then gradually declined toward A14. Humic-like peak Cp showed a decreasing trend from A3 to A6, with a notable peak at A10. The relative abundance of humic-like peak Mp was significantly higher in the cultivation zone compared to freshwater sites (p < 0.05). The protein-like peak Tp fluctuated from the Chi River to Dayu Bay, with no significant differences (p > 0.05) observed between freshwater and coastal cultivation zones. HIXp (0.27–0.73) and BIXp (0.58–1.18) both decreased from A2 to A5 before exhibiting fluctuating increases toward offshore sites. S275–295p gradually decreased from the Chi River to Dayu Bay. SUVA254p (0.62–2.47) exhibited patchy high values at A4–A5 and A10.
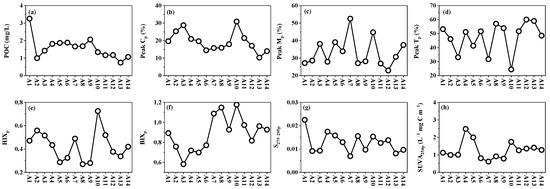
Figure 4.
Spatial distribution pattern of POM from Chi River to Dayu Bay. (a) POC; (b) Peak Cp; (c) Peak Mp; (d) Peak Tp; (e) HIXp; (f) BIXp; (g) S275-295p; (h) SUVA254p.
3.4. Spatial Variation of SOM Along the Chi River to Dayu Bay
SOC concentrations ranged from 5.72 to 8.35 g/kg and showed a decreasing trend from the Chi River to Dayu Bay (Figure 5). Humic-like peak Cs, Ms and protein-like peak Ts were positively correlated with SOC (r = 0.81–0.90), exhibiting similar spatial distributions. HIXs (0.63–0.78) increased from freshwater sites (A3–A4) to coastal cultivation zones (A5–A9) and then gradually declined offshore. BIXs (0.63–0.90) displayed fluctuating increases from freshwater sites to the cultivation zones. S275–295s (0.0114–0.0261) and SUVA254s (0.51–1.13 × 10⁻³ L−1 mg C m−1) both decreased sharply from freshwater to cultivation zones.
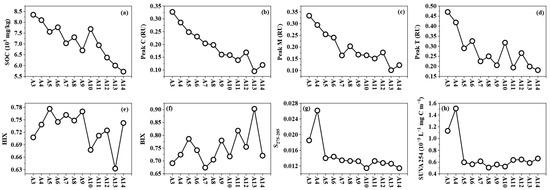
Figure 5.
Distribution pattern of SOM parameters from Chi River to Dayu Bay. (a) SOC; (b) Peak Cs; (c) Peak Ms; (d) Peak Ts; (e) HIXs; (f) BIXs; (g) S275-295s; (h) SUVA254s.
3.5. Principal Component Analysis for DOM, POM and SOM
To reveal the dynamics of Porphyra cultivation on the organic matter in the coastal zone, three principal component analysis (PCA) models were performed to trace the sources of DOM, POM and SOM, respectively (Figure 6). The first two principal components (PC1 and PC2) of the models explained 73.7%, 51.3% and 66.4% of the total spatial variability, respectively. In all three models, PC1 primarily reflected the river-to-sea gradient of organic matter. Terrestrial humic-like peak C, HIX and SUVA254 exhibited high loadings on the positive axis of PC1, clustering with freshwater samples. In contrast, salinity, protein-like peak T and BIX showed higher loadings on the negative axis of PC1, corresponding to higher scores for samples from the cultivation zones. PC2 captured spatial variations in organic matter within the river and cultivation zones. For DOM and SOM, PC2 contributed only a limited additional explanation of this variation. In contrast, for POM, PC2 accounted for 22.7% of the variability, comparable to PC1 (28.6%). Notably, BIX and HIX displayed high loadings on the negative axis of PC2, where POM samples from the cultivation zones were clustered.
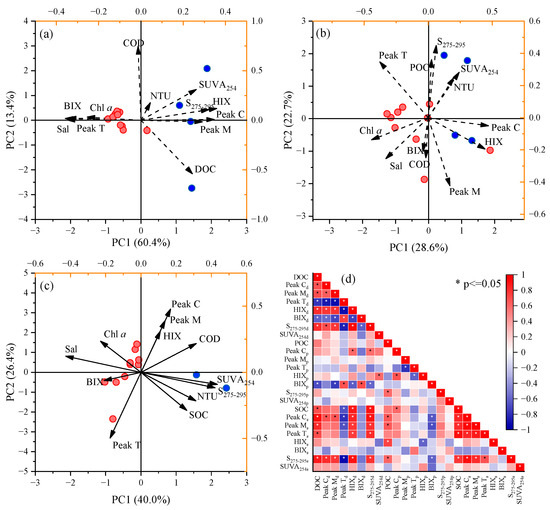
Figure 6.
PCA analysis and Spearman correlation based on water quality and organic matter parameters. (a) DOM model; (b) POM model; (c) SOM model; (d) Spearman correlation matrix.
4. Discussion
4.1. Effects of Porphyra Cultivation on the Coastal DOM, POM and SOM
The optical characteristics of DOM, POM and SOM exhibited notable spatial variation from the Chi River to Dayu Bay (Figure 3, Figure 4 and Figure 5). In freshwater sites, all three types of organic matter clustered along the positive PC1 axis in PCA models, where carbon concentrations and peak C showed higher loadings (Figure 6). This suggests that terrestrial inputs dominate organic matter composition in the river zones, as the Chi River watershed is primarily forested [22]. The flushing effect of riparian soil could provide abundant highly humified and aromatic DOM and POM [23]. This is supported by the elevated HIX and SUVA254 values observed in freshwater sites [15]. Furthermore, the construction of anthropogenic impoundments in the Chi River slows water flow, accelerating the deposition of terrestrial POM and increasing SOC concentration in the river zones. The positive correlation between SOC and peak Cp (r = 0.59) corroborates this hypothesis.
In the coastal cultivation zone, decreases in DOC and peak Cd with increasing salinity reflect reduced contributions of terrestrial DOM, driven by limited freshwater inputs from the Chi River and dilution by offshore seawater [24]. However, higher DOC and FDOM components than the theoretical mixing line indicate substantial estuarine additions from multiple sources in the cultivation zone (Figure 7a–d). Similar patterns were also observed for POC and FPOM, with pronounced additions inferred (Figure 7e–h). Together with the increased POC concentration from freshwater sites to coastal water, we infer that the addition of POM in Porphyra cultivation zones may be more significant than DOM.
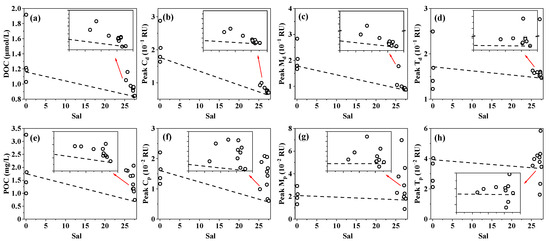
Figure 7.
Estuarine mixing processes of DOM and POM parameters. (a) DOC; (b) Peak Cd; (c) Peak Md; (d) Peak Td; (e) POC; (f) Peak Cp; (g) Peak Mp; (h) Peak Tp.
Moreover, DOM and POM in the cultivation zone were both clustered to the negative PC1 axis and were characterized by high protein-like peak T, BIX and Chl a, indicating a predominance of autochthonous bio-labile organic matter [25]. This is consistent with the significant additions of both protein-like peak Td and peak Tp. Both Porphyra cultivation and algal blooms could serve as key sources of autochthonous bio-labile organic matter in the cultivation zone. Zhang et al. [26] reported that seaweed could competitively consume excess nutrients and inhibit microalgae growth. Furthermore, the relatively cold water temperatures during the investigation period (16.5 ± 0.3 °C) favor Porphyra growth over microalgae [27]. Therefore, the high bio-labile protein-like DOM and POM in the cultivation zone are likely primarily derived from Porphyra sources. Given the susceptibility of Porphyra-derived organic matter to microbial degradation, in situ microbial transformation could further enhance the accumulation of peak Md and Mp in the cultivation zone [11,28]. Evidence from estuarine mixing models supports the significant addition of this bio-refractory DOM, underscoring the contribution of Porphyra cultivation to coastal carbon sequestration (further discussed in Section 4.2). The higher peaks Cd and Cp than the theoretical mixing line in the cultivation zone suggest there are additional contributions of refractory DOM from other pathways. The additional Peak Cd could be attributed to sediment porewater inputs, while peak Cp is possibly sourced from sediment resuspension driven by tidal exchange [29,30].
SOM in the coastal cultivation zone could be influenced by multiple sources, whereby the terrestrial input and deposition of Porphyra detritus are among the two most important pathways [8,31,32]. The PCA results indicate that SOM in cultivation zones is characterized by high peak Ts and BIXs, distinguishing it from freshwater sites (Figure 6c). This suggests that SOM in cultivation zones is primarily derived from settling Porphyra-sourced POM. During the late cultivation stage (April), aging Porphyra may cease carbon fixation and release detritus due to natural decay or wave-induced damage [33]. This is consistent with the previous investigations of kelp and Gracilaria cultivation zones, where macroalgal detritus contributed approximately 16% of sedimentary organic carbon, particularly in surface sediments [8,31]. Huang et al. [12] reported that kelp cultivation could enhance the microbial carbon and nitrogen metabolism genes in the sedimentary environment of cultivation zones, facilitating biogenic organic matter degradation and transformation. We speculate this process may also occur in the Porphyra cultivation zone. This could explain the higher HIXs observed in cultivation zones compared to river zones.
4.2. Relative Contribution of DOM and POM to RDOM Production in the Porphyra Cultivation Zone
After 28 days of microbial degradation, DOC concentration and protein-like peak Td in the BDOM group decreased significantly at all sites (Figure 8), while humic-like peak Md increased. These results indicate that microbial processes produce bio-refractory DOM by utilizing bio-labile DOM components in both freshwater and coastal Porphyra zones [28]. The humic-like peak M is resistant to microbial degradation and can persist in the water column for years, making it a reliable proxy for refractory DOM (RDOM) [34]. Ligand exchange between humic-like DOM and metals on mineral surfaces may further enhance its preferential adsorption onto particles, facilitating their deposition into sedimentary carbon pools [35]. Notably, the ΔDOC and Δpeak Td in the cultivation waters were lower than those in freshwater sites, whereas the Δpeak Md was significantly higher than in the freshwater sites. This indicates that the microbial transformation rate of DOM in the Porphyra cultivation zone might be more efficient than in non-cultivation waters. This aligns with findings from Sanggou Bay, where the proportion of RDOM molecules in the kelp cultivation zones (58%) was much higher than in adjacent non-cultivation zones (33%) [28].

Figure 8.
Dynamic changes of DOM and POM in BDOM and BTOM groups. (a) change in OC; (b) change in peak M; (c) changes in peak T.
In the BTOM group, DOC and protein-like peak Td decreased in freshwater sites (A1–A3) after incubation, suggesting a similar microbial degradation of bio-labile DOM to the BDOM group. However, ΔDOC and Δpeak Td shifted to a net increase in the coastal Porphyra cultivation zone (A8 to A14). This bio-labile DOM might be derived from the microbial degradation and release of POM, which is supported by the significant decreases in POC and protein-like peak Tp. Feng et al. [11] reported that some polymer hydrolyzers (e.g., Clostridia and Bacteroidia) could secrete extracellular enzymes to degrade biogenic detritus and convert it into DOM. Such microbial degradation tends to release protein-like DOM rather than humic-like DOM [36]. Further, the significantly higher ΔPOC and Δpeak Tp in the Porphyra cultivation zone compared to freshwater sites indicates that microbial transformation of POM into bio-labile DOM is more pronounced in the Porphyra cultivation zone.
Moreover, the positive Δpeak Md observed at all sites suggests the production of the RDOM component in the BTOM group, suggesting either (1) microbial transformation of bio-labile DOM and POM-derived bio-labile DOM [11], (2) direct dissolution from Porphyra detritus [36] or (3) a combination of both. Despite 65–91% of POC being dissolved or degraded by microbial activity in the Porphyra cultivation zone, Δpeak Md in the BTOM group did not significantly exceed that in the BDOM group (Figure 8). This may reflect the underutilization of bio-labile DOM by microbial respiration due to limited incubation times, which is supported by the positive Δpeak Td. Another possible reason is the low transformation efficiency of Porphyra-derived POM into RDOM, with most POM being mineralized into CO2 [11]. For instance, only 1.27% of kelp-derived POM was transformed into RDOM after 210 days of microbial degradation [11]. Similarly, for detritus from Sargassum horneri, only 2.71% of POM was transformed into RDOM [37]. Therefore, given the similar magnitudes of DOC and POC concentration in the Porphyra cultivation zone, Porphyra-derived DOM may play a more critical role in coastal carbon sinks.
5. Conclusions
Field investigations of DOM, POM and SOM along a subtropical river and its adjacent Porphyra cultivation zone indicate that coastal organic matter is influenced by multiple sources, including riverine input, Porphyra release, sediment and porewater sources. The combined analysis of PCA and estuarine mixing models reveals that the coastal DOM, POM and SOM are predominantly regulated by autochthonous, bio-labile protein-like components derived from Porphyra cultivation, with relatively limited contributions from other sources. Incubation experiments further demonstrate that Porphyra cultivation enhances the microbial transformation of bio-labile DOM into refractory DOM (RDOM) in coastal waters. Further, DOM plays a more significant role than POM in the microbial production of RDOM, highlighting its critical function in coastal carbon sequestration. Our study emphasizes the significant impact of Porphyra cultivation on coastal organic carbon dynamics and provides key insights into its role in enhancing carbon sequestration of coastal ecosystems.
Author Contributions
Conceptualization, L.Q.; formal analysis, J.X.; investigation, J.X.; writing—original draft preparation, T.W.; writing—review and editing, L.Q.; funding acquisition, L.Q. All authors have read and agreed to the published version of the manuscript.
Funding
This work was supported by the National Natural Science Foundation of China (42406037), Open Fund of State Key Laboratory of Satellite Ocean Environment Dynamics (MED202202), Science and Technology Project of Wenzhou Science and Technology Bureau (S20240009) and Scientific Research Fund of Zhejiang Provincial Education Department (Y202456606).
Data Availability Statement
Data will be made available on reasonable request.
Conflicts of Interest
The authors declare no conflict of interest.
References
- Krause-Jensen, D.; Duarte, C.M. Substantial Role of Macroalgae in Marine Carbon Sequestration. Nat. Geosci. 2016, 9, 737–742. [Google Scholar] [CrossRef]
- Ross FW, R.; Boyd, P.W.; Filbee-Dexter, K.; Watanabe, K.; Ortega, A.; Krause-Jensen, D.; Lovelock, C.; Sondak CF, A.; Bach, L.T.; Duarte, C.M.; et al. Potential Role of Seaweeds in Climate Change Mitigation. Sci. Total Environ. 2023, 885, 163699. [Google Scholar] [CrossRef] [PubMed]
- Duarte, C.M.; Bruhn, A.; Krause-Jensen, D. A Seaweed Aquaculture Imperative to Meet Global Sustainability Targets. Nat. Sustain. 2022, 5, 185–193. [Google Scholar] [CrossRef]
- FAO. Fishery and Aquaculture Statistics-Yearbook 2020; FAO: Rome, Italy, 2023. [Google Scholar]
- Liu, Y.; Zhang, J.H.; Wu, W.G.; Zhong, Y.; Li, H.M.; Wang, X.M.; Yang, J.; Zhang, Y.Y. Effects of Shellfish and Macro-Algae Imta in North China on the Environment, Inorganic Carbon System, Organic Carbon System, and Sea-Air CO2 Fluxes. Front. Mar. Sci. 2022, 9, 864306. [Google Scholar] [CrossRef]
- Wada, S.; Hama, T. The Contribution of Macroalgae to the Coastal Dissolved Organic Matter Pool. Estuar. Coast. Shelf Sci. 2013, 129, 77–85. [Google Scholar] [CrossRef]
- Li, H.M.; Feng, X.T.; Xiong, T.Q.; Shao, W.; Wu, W.C.; Zhang, Y.Y. Particulate Organic Carbon Released during Macroalgal Growth Has Significant Carbon Sequestration Potential in the Ocean. Environ. Sci. Technol. 2023, 57, 19723–19731. [Google Scholar] [CrossRef] [PubMed]
- Wang, Y.Y.; Yang, W.F.; Cai, Y.H.; Fang, Z.M.; Zhao, X.F.; Zhang, Q.H.; Yuan, H.; Lin, N.; Zou, C.Y.; Zheng, M.F. Macroalgae Culture-Induced Carbon Sink in a Large Cultivation Area of China. Environ. Sci. Pollut. Res. 2023, 30, 107693–107702. [Google Scholar] [CrossRef] [PubMed]
- Bauer, J.E.; Bianchi, T.S. Dissolved Organic Carbon Cycling and Transformation; Academic Press: Waltham, MA, USA, 2011; pp. 7–67. [Google Scholar]
- Kim, J.; La, H.S.; Kim, J.-H.; Jo, N.; Lee, J.; Kim, B.K.; Son, W.; Kim, K.; Jang, H.-K.; Park, S.; et al. Spatio-Temporal Variations in Organic Carbon Composition Driven by Two Different Major Phytoplankton Communities in the Ross Sea, Antarctica. Sci. Total Environ. 2023, 891, 164666. [Google Scholar] [CrossRef] [PubMed]
- Feng, X.T.; Li, H.M.; Zhang, Z.H.; Xiong, T.Q.; Shi, X.Y.; He, C.; Shi, Q.; Jiao, N.Z.; Zhang, Y.Y. Microbial-Mediated Contribution of Kelp Detritus to Different Forms of Oceanic Carbon Sequestration. Ecol. Indic. 2022, 142, 109186. [Google Scholar] [CrossRef]
- Huang, H.; Zan, S.; Shao, K.; Chen, H.; Fan, J. Spatial Distribution Characteristics and Interaction Effects of Dom and Microbial Communities in Kelp Cultivation Areas. Sci. Total Environ. 2024, 920, 170511. [Google Scholar] [CrossRef]
- Li, J.; Jiang, Z.B.; Zhu, Y.L.; Du, P.; Song, D.; Xu, Y.P.; Zeng, J.N. Calculation and Potential Assessment of Removable Carbon Sink of Mariculture Shellfish and Macroalgae in China Coastal Waters. J. Appl. Oceanogr. 2023. (In Chinese). Available online: https://link.cnki.net/urlid/35.1319.P.20231109.1724.002 (accessed on 13 February 2025).
- Chen, S.W. Production of Organic Matter by Cultivated Macroalgae and Effects on Phytoplankton. Master’s thesis, Jimei University, Xiamen, China, 2020. [Google Scholar]
- Hansen, A.M.; Kraus TE, C.; Pellerin, B.A.; Fleck, J.A.; Downing, B.D.; Bergamaschi, B.A. Optical Properties of Dissolved Organic Matter (DOM): Effects of Biological and Photolytic Degradation. Limnol. Oceanogr. 2016, 61, 1015–1032. [Google Scholar] [CrossRef]
- Weishaar, J.L.; Aiken, G.R.; Bergamaschi, B.A.; Fram, M.S.; Fujii, R.; Mopper, K. Evaluation of Specific Ultraviolet Absorbance as an Indicator of the Chemical Composition and Reactivity of Dissolved Organic Carbon. Environ. Sci. Technol. 2003, 37, 4702–4708. [Google Scholar] [CrossRef] [PubMed]
- Helms, J.R.; Stubbins, A.; Ritchie, J.D.; Minor, E.C.; Kieber, D.J.; Mopper, K. Absorption Spectral Slopes and Slope Ratios as Indicators of Molecular Weight, Source, and Photobleaching of Chromophoric Dissolved Organic Matter. Limnol. Oceanogr. 2008, 53, 955–969. [Google Scholar] [CrossRef]
- Hur, J.; Lee, B.M.; Shin, K.H. Spectroscopic Characterization of Dissolved Organic Matter Isolates from Sediments and the Association with Phenanthrene Binding Affinity. Chemosphere 2014, 111, 450–457. [Google Scholar] [CrossRef] [PubMed]
- Osburn, C.L.; Handsel, L.T.; Mikan, M.P.; Paerl, H.W.; Montgomery, M.T. Fluorescence Tracking of Dissolved and Particulate Organic Matter Quality in a River-Dominated Estuary. Environ. Sci. Technol. 2012, 46, 8628–8636. [Google Scholar] [CrossRef] [PubMed]
- Zheng, Y.H. Remote Sensing Monitoring of Macroalgae Farming Area and Environmental Benefits Assessment. Master’s thesis, Zhejiang University, Hangzhou, China, 2018. [Google Scholar]
- Fellman, J.B.; Hood, E.; Spencer RG, M. Fluorescence Spectroscopy Opens New Windows into Dissolved Organic Matter Dynamics in Freshwater Ecosystems: A Review. Limnol. Oceanogr. 2010, 55, 2452–2462. [Google Scholar] [CrossRef]
- Gu, S.Y.; Wang, K.; Ruan, M.Q.; Song, F.H.; Xu, M.L. Land Use Cover and Flow Condition Affect the Spatial Distribution Characteristics of Fluorescent Dissolved Organic Matter in the Yongding River. Water 2024, 16, 2391. [Google Scholar] [CrossRef]
- Wagner, S.; Fair, J.H.; Matt, S.; Hosen, J.D.; Raymond, P.; Saiers, J.; Shanley, J.B.; Dittmar, T.; Stubbins, A. Molecular Hysteresis: Hydrologically Driven Changes in Riverine Dissolved Organic Matter Chemistry During a Storm Event. J. Geophys. Res.-Biogeosci. 2019, 124, 759–774. [Google Scholar] [CrossRef]
- Markager, S.; Stedmon, C.A.; Sondergaard, M. Seasonal Dynamics and Conservative Mixing of Dissolved Organic Matter in the Temperate Eutrophic Estuary Horsens Fjord. Estuar. Coast. Shelf Sci. 2011, 92, 376–388. [Google Scholar] [CrossRef]
- Shields, M.R.; Bianchi, T.S.; Osburn, C.L.; Kinsey, J.D.; Ziervogel, K.; Schnetzer, A.; Corradino, G. Linking Chromophoric Organic Matter Transformation with Biomarker Indices in a Marine Phytoplankton Growth and Degradation Experiment. Mar. Chem. 2019, 214, 103665. [Google Scholar] [CrossRef]
- Zhang, A.H.; Wen, X.; Yan, H.Y.; He, X.F.; Su, H.; Tang, H.Q.; Jordan, R.W.; Wang, Y.; Jiang, S.J. Response of Microalgae to Large-Seaweed Cultivation as Revealed by Particulate Organic Matter from an Integrated Aquaculture Off Nan’ao Island, South China. Mar. Pollut. Bull. 2018, 133, 137–143. [Google Scholar] [CrossRef] [PubMed]
- Wang, Y.; Feng, L.; Hou, X.J. Algal Blooms in Lakes in China over the Past Two Decades: Patterns, Trends, and Drivers. Water Resour. Res. 2023, 59, e2022WR033340. [Google Scholar] [CrossRef]
- Li, H.M.; Zhang, Z.H.; Xiong, T.Q.; Tang, K.X.; He, C.; Shi, Q.; Jiao, N.Z.; Zhang, Y.Y. Carbon Sequestration in the Form of Recalcitrant Dissolved Organic Carbon in a Seaweed (Kelp) Farming Environment. Environ. Sci. Technol. 2022, 56, 9112–9122. [Google Scholar] [CrossRef] [PubMed]
- Zhou, Y.P.; Zhao, C.; He, C.; Li, P.H.; Wang, Y.T.; Pang, Y.; Shi, Q.; He, D. Characterization of Dissolved Organic Matter Processing between Surface Sediment Porewater and Overlying Bottom Water in the Yangtze River Estuary. Water Res. 2022, 215, 118260. [Google Scholar] [CrossRef] [PubMed]
- Qu, L.Y.; Jiao, T.; Guo, W.D.; Dahlgren, R.A.; Ling, N.; Feng, B.Y. Hydro-Biogeochemical Alterations to Optical Properties of Particulate Organic Matter in the Changjiang Estuary and Adjacent Shelf Area. Ecol. Indic. 2021, 128, 107837. [Google Scholar] [CrossRef]
- Wang, Y.Y.; Yang, W.F.; Zhao, X.F.; Zhang, Q.H.; Chen, H.S.; Fang, Z.M.; Zheng, M.F. Changes in the Carbon Source and Storage in a Cultivation Area of Macro-Algae in Southeast China. Mar. Pollut. Bull. 2023, 188, 114680. [Google Scholar] [CrossRef] [PubMed]
- Wang, H.; Li, Z.Q.; Zhuang, W.E.; Hur, J.; Yang, L.Y.; Wang, Y.H. Spectral and Isotopic Characteristics of Particulate Organic Matter in a Subtropical Estuary under the Influences of Human Disturbance. J. Mar. Syst. 2020, 203, 103264. [Google Scholar] [CrossRef]
- Xiong, T.; Li, H.; Hu, Y.; Zhai, W.-d.; Zhang, Z.; Liu, Y.; Zhang, J.; Lu, L.; Chang, L.; Xue, L.; et al. Seaweed Farming Environments Do Not Always Function as Co2 Sink under Synergistic Influence of Macroalgae and Microorganisms. Agric. Ecosyst. Environ. 2024, 361, 108824. [Google Scholar] [CrossRef]
- Jiao, N.Z.; Cai, R.H.; Zheng, Q.; Tang, K.; Liu, J.H.; Jiao FL, E.; Wallace, D.; Chen, F.; Li, C.; Amann, R.; et al. Unveiling the Enigma of Refractory Carbon in the Ocean. Natl. Sci. Rev. 2018, 5, 459–463. [Google Scholar] [CrossRef]
- Wang, K.; Pang, Y.; Gao, C.; Chen, L.; Jiang, X.H.; Li, P.H.; He, C.; Shi, Q.; He, D. Hydrological Management Affected Dissolved Organic Matter Chemistry and Organic Carbon Burial in the Three Gorges Reservoir. Water Res. 2021, 199, 117195. [Google Scholar] [CrossRef] [PubMed]
- Lee, H.S.; Hur, J.; Shin, H.S. Photochemical and Microbial Transformation of Particulate Organic Matter Depending on Its Source and Size. Sci. Total Environ. 2023, 857, 159506. [Google Scholar] [CrossRef] [PubMed]
- Zhao, C.; Sun, J.; Shen, Y.; Xia, Z.; Hu, M.; Wu, T.; Zhuang, M.; Li, Y.; Tong, Y.; Yang, J.; et al. Removable Carbon and Storage Carbon of Golden Tides. Mar. Pollut. Bull. 2023, 191, 114974. [Google Scholar] [CrossRef] [PubMed]
Disclaimer/Publisher’s Note: The statements, opinions and data contained in all publications are solely those of the individual author(s) and contributor(s) and not of MDPI and/or the editor(s). MDPI and/or the editor(s) disclaim responsibility for any injury to people or property resulting from any ideas, methods, instructions or products referred to in the content. |
© 2025 by the authors. Licensee MDPI, Basel, Switzerland. This article is an open access article distributed under the terms and conditions of the Creative Commons Attribution (CC BY) license (https://creativecommons.org/licenses/by/4.0/).