Article

Spatial and Temporal Variations in Rainfall Seasonality and Underlying Climatic Causes in the Eastern China Monsoon Region

1
Key Laboratory of Environment Change and Resources Use in Beibu Gulf, Ministry of Education, Nanning Normal University, Nanning 530001, China
2
School of Geography and Planning, Nanning Normal University, Nanning 530001, China
3
School of Geography and Information Engineering, China University of Geosciences, Wuhan 430074, China
4
School of Management Science and Engineering, Guangxi University of Finance and Economics, Nanning 530003, China
*
Author to whom correspondence should be addressed.
These authors contributed equally to this work.
Water 2025, 17(4), 522; https://doi.org/10.3390/w17040522
Submission received: 15 January 2025 / Revised: 6 February 2025 / Accepted: 11 February 2025 / Published: 12 February 2025
(This article belongs to the Section Water and Climate Change)

Abstract

:
The regularity of rainfall seasonality is very important for vegetation growth, the livelihood of the population, agricultural production, and ecosystem sustainability. Changes in precipitation and its extremes have been widely reported; however, the spatial and temporal variations in rainfall seasonality and their underlying mechanisms are less understood. Here, we analyzed the changes in rainfall seasonality and possible teleconnection mechanisms in the eastern China monsoon region during 1981–2022, with a special focus on the El Niño-Southern Oscillation (ENSO), El Niño Modoki (ENSO_M), and Indian Ocean Dipole (IOD). Our results show that due to the changes in rainfall concentration, rainfall magnitude, or both, rainfall seasonality has developed in the northern China (NC, 0.15 × 10⁻³ yr−1) and central China (CC, 0.07 × 10⁻³ yr−1) monsoon regions, and weakened in the northeastern China (NEC, −0.08 × 10⁻³ yr−1) and southern China (SC, −0.15 × 10⁻³ yr−1) monsoon regions during the recent decades. The large-scale circulation and SST anomalies induced by cold or warm phases of the IOD, ENSO_M, and (or) ENSO can explain the enhanced seasonality in the NC and CC monsoon regions and weakened seasonality in the NEC and SC monsoon regions. The wavelet coherence analysis further shows that the dominated climatic factors for rainfall seasonality changes are different in the CC, NC, SC, and NEC monsoon regions, and that rainfall seasonality is also affected by the coupling of the IOD, ENSO_M, and ENSO. Our results highlight that the IOD, ENSO_M, and ENSO are important climatic causes for rainfall seasonality changes in the eastern China monsoon region.

1. Introduction

Global warming not only increases the frequency and intensity of extreme rainfall events, but also changes other characteristics of rainfall patterns, such as rainfall seasonality [1]. Previous studies suggest that rainfall seasonality and the seasonal distribution of rainfall are key factors controlling the occurrence and intensity of precipitation extremes [2], such as floods and droughts [3,4]. Changes in rainfall seasonality also have significant impacts on vegetation growth [5,6,7,8], sustainable water resource management [6,9,10,11], agricultural production [12], and ecosystem diversity and stability [5,13]. Therefore, it is necessary to analyze the spatial and temporal variations in rainfall seasonality and underlying mechanisms for sustainable water resource management.
Rainfall seasonality is closely related to rainfall magnitude and rainfall concentration [14,15,16]. Traditionally, the characteristics of rainfall seasonality were quantified by relative rainfall intensity, rainfall in dry and wet seasons, and the timing of 25–75% of total rainfall [17]. However, traditional seasonality indices make it difficult to consider rainfall’s differences and its temporal distribution [18]. To better understand the changing patterns of rainfall seasonality, Feng et al. [1] proposed several novel seasonality indices, including seasonality index, rainfall magnitude, and rainfall concentration, based on the information theory, to quantitively describe the aspects of rainfall seasonality in a unified framework. Many previous studies have investigated rainfall seasonality changes based on seasonality indices proposed by Feng et al. [1], and found that rainfall seasonality has changed significantly in many parts of world [1,12], for example, the increases in the interannual variability of seasonality over many parts of the dry tropics [1] and Southeast China [19]. Significant decreasing trends in rainfall seasonality were also observed over the Indo-Gangetic plains, and parts of central India and the Western Ghats [18]. Although the changes in rainfall seasonality have been widely reported in much of the world, the possible mechanisms behind the changes in rainfall seasonality at the reginal scale, such as in the eastern China monsoon region, are still largely unclear.
The possible mechanisms of monsoon rainfall are extremely complex, and global climate events are the key driving factors. Global climate events originate from sea surface temperature (SST) or atmospheric pressure variations from seasonal to interdecadal timescales in specific areas, such as the El Niño-Southern Oscillation (ENSO), El Niño Modoki (ENSO_M), and Indian Ocean Dipole (IOD) [20]. The ENSO is the largest source of global ocean–atmosphere interannual variability [21,22], and the most important factor affecting rainfall anomalies in most parts of the world [23,24]. The ENSO has been deemed the most dominant interannual signal of climate variability and has exerted a significant influence on precipitation variability in the eastern China monsoon region [25,26,27]. The ENSO_M is characterized by increased SST in the central Pacific and anomalous cooling in the eastern and western Pacific [28]. Unlike the ENSO, the maximum SST anomaly persists in the central Pacific from boreal summer to winter during ENSO_M events. Previous studies have suggested that the influences of the ENSO and ENSO_M on seasonal precipitation [29] and meteorological drought [30] are quite different in many parts of the world. However, it is unclear whether the impacts of the ENSO and ENSO_M on rainfall seasonality are different within the specific region.
The IOD, characterized by large-scale sea surface temperature anomaly patterns in the tropical Indian Ocean, is an important factor driving interannual variability in rainfall across monsoon regions [31]. Previous studies have suggested that the IOD is associated with high land temperature and rainfall anomalies over countries west of the Indian Ocean and enhanced rainfall over the China monsoon regions [32]. Previous studies have also shown that global climate events such as the ENSO and IOD have a great impact on seasonal rainfall amounts in China [33,34,35,36,37]. Although the ENSO and IOD originate from SST anomalies in different sea areas, there is a close coupling between them [38]. In addition, the ENSO is usually coupled with the ENSO_M, and regional climates in many parts of the world are much more likely to be affected by these coupling effects [28]. However, the coupled impacts of these global climate events on regional rainfall seasonality changes still remain largely unclear.
Many previous studies have reported the impacts of global climate events on the changes in rainfall seasonality, precipitation amount, and extreme precipitation using traditional statistical methods, such as multiple linear regression and Pearson’s correlation coefficient [26,39,40,41,42,43,44]. However, these studies do not consider the coupled links among multiple global climate events. The multivariate wavelet coherence (MWC) method is a powerful tool that can be used to analyze the coupling and consistency of multiple time series in both the time and frequency domains [45]. The MWC method was used to examine the coupled influences of multiple global climate events on precipitation amount, meteorological drought, and groundwater drought [46,47,48,49].
In the eastern China monsoon region, rainfall experiences latitudinal fluctuations driven by the monsoon climate system, and has regional differences and phase characteristics [7,50]. Particularly, the eastern China monsoon region is home to the main agricultural production areas, economically developed areas, and population concentration areas of China, which are highly affected by rainfall seasonality changes [51]. However, the spatial and temporal variations in rainfall seasonality and especially underlying climatic causes are still less understood. Therefore, the objectives of this study are to analyze the spatial and temporal variations in rainfall seasonality from 1981 to 2022 based on the novel seasonality indices proposed by Feng et al. [1], and to investigate possible teleconnection mechanisms in the eastern China monsoon region, with a special focus on the ENSO, ENSO_M, and IOD. Our study also provides a new perspective on analyzing the individual and coupled influences of global climate events on rainfall seasonality changes at regional scales. This paper is organized as follows: Section 2 discusses the datasets and seasonality indices used for the analysis. The results and discussion are given in Section 3 and Section 4, respectively. Section 5 summarizes the main findings.

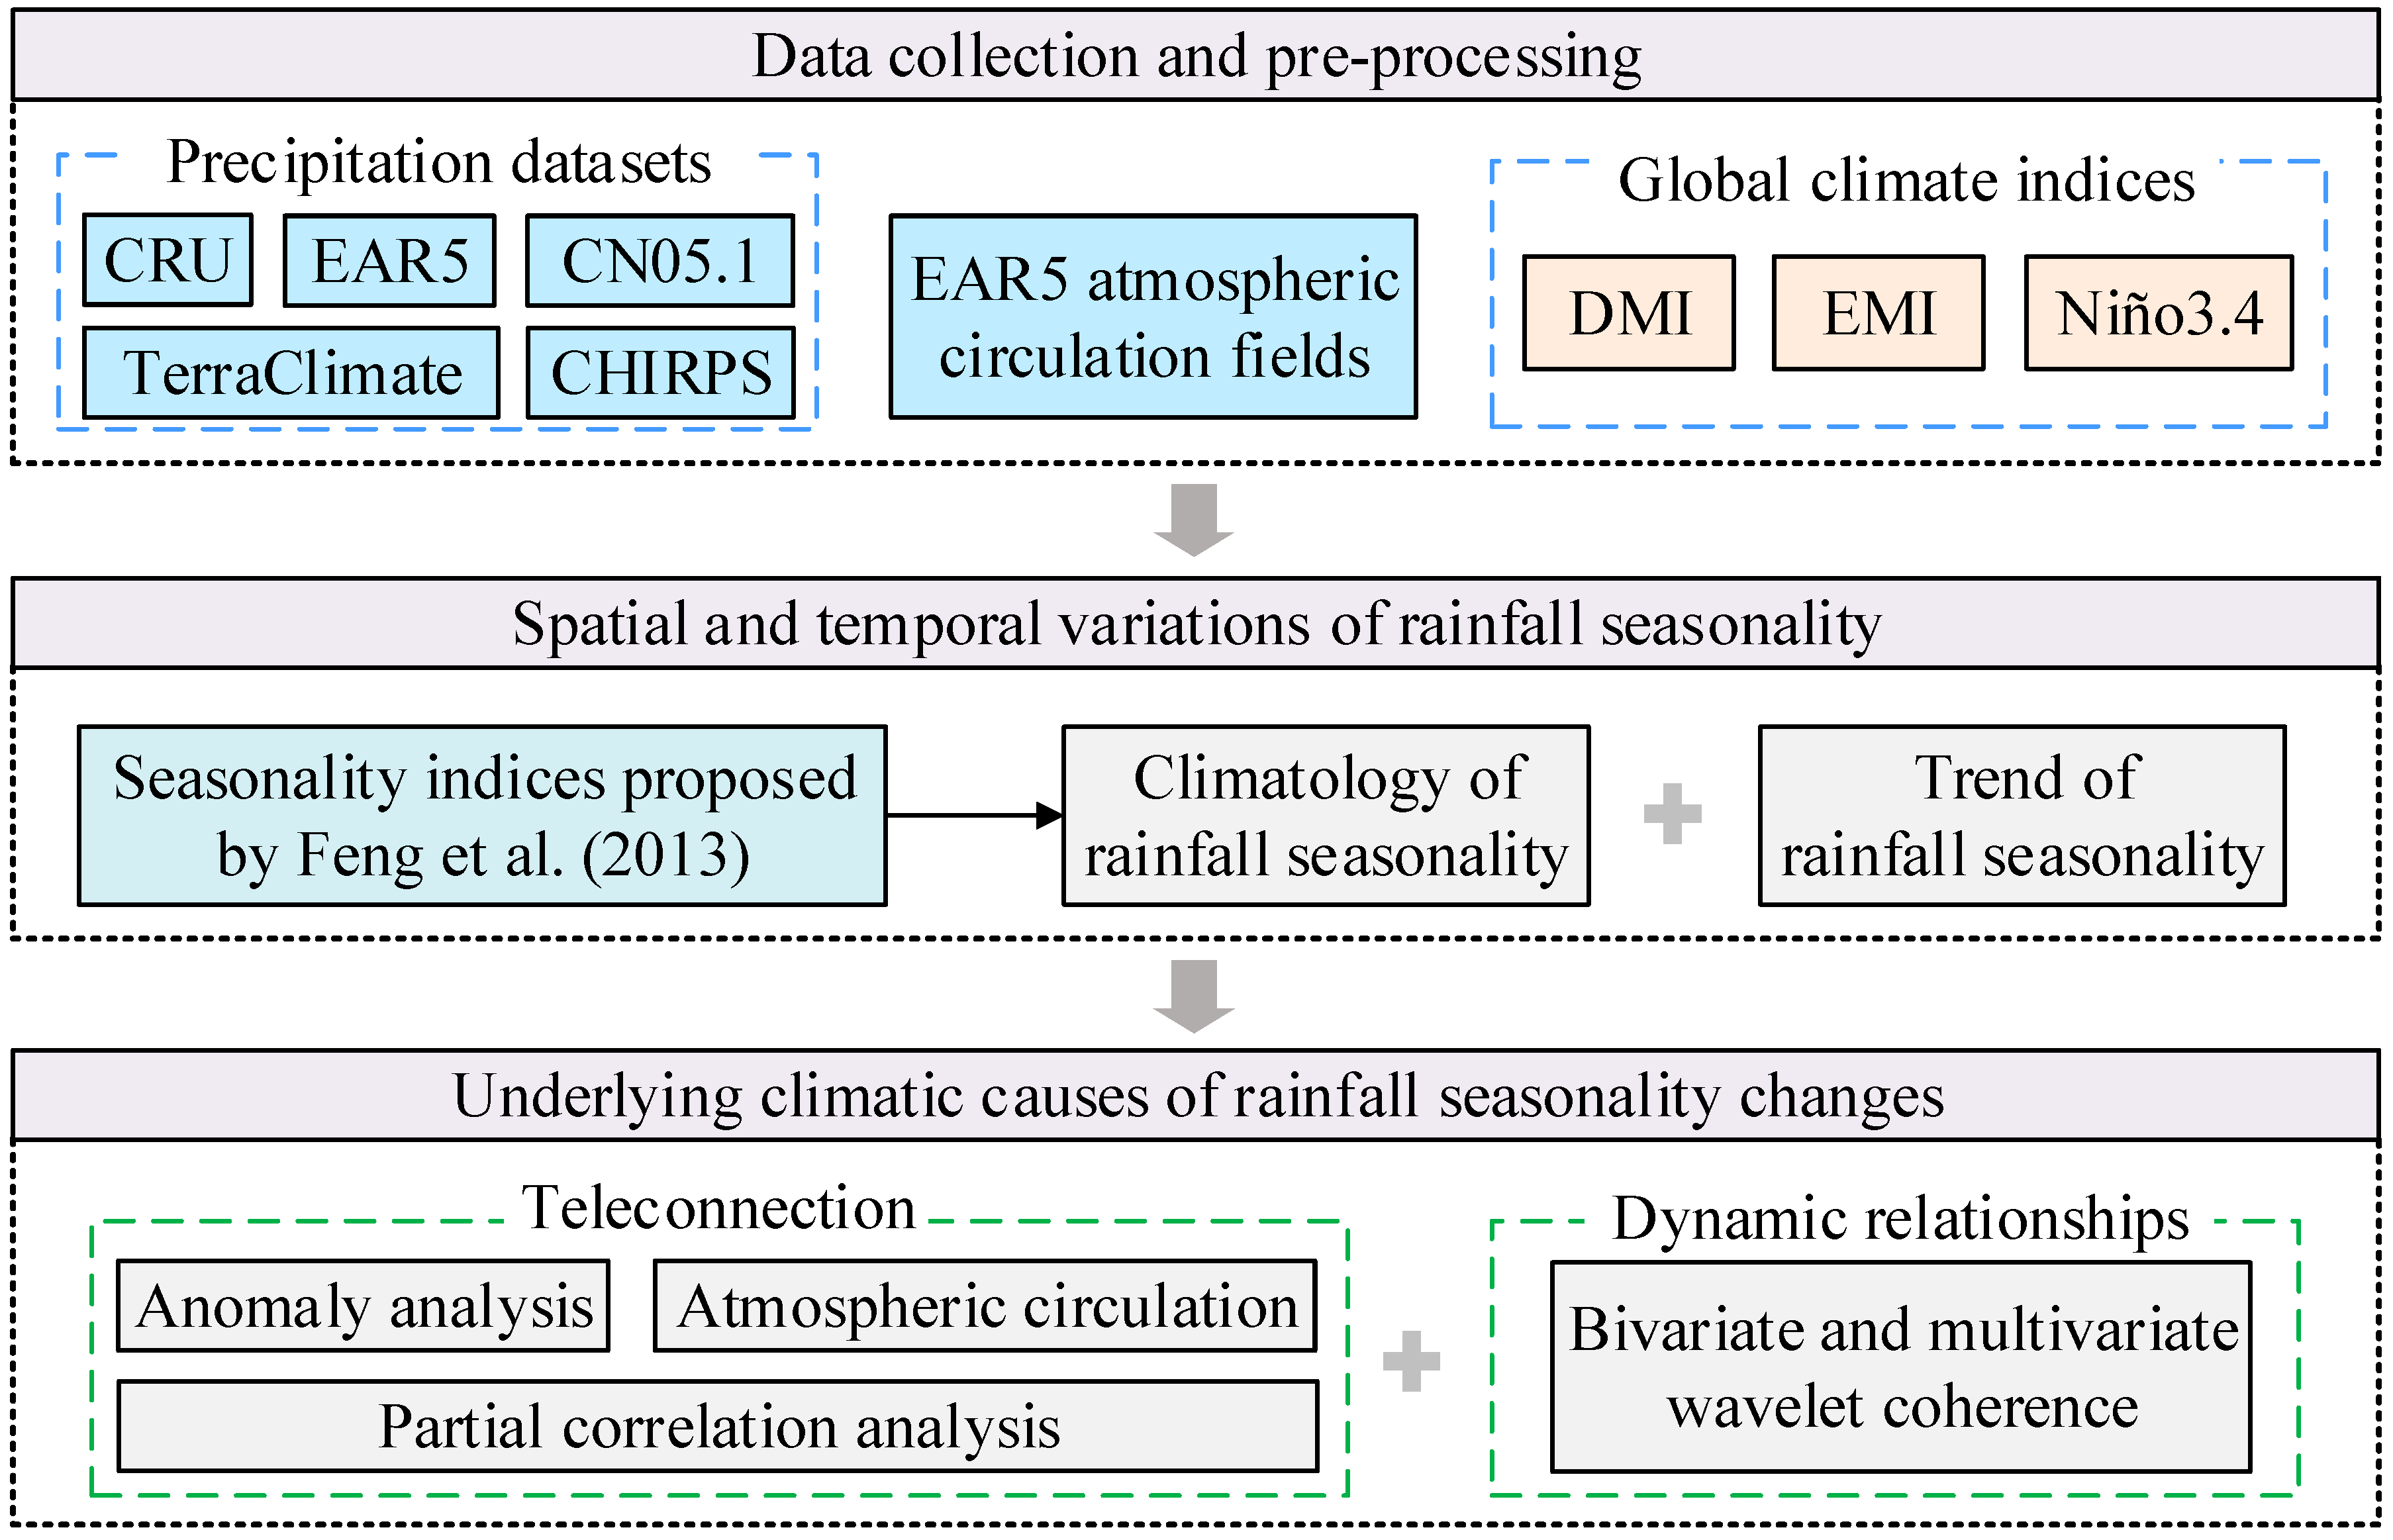
2. Material and Methods

2.1. Study Area

The eastern China monsoon region (Figure 1) is located to the east of 105° E, and the topography is dominated by plains and mainly situated on the third terrace. The eastern China monsoon region is defined as the area where the local summer (May to September) minus winter (November to March) rainfall rate exceeds 2.0 mm day−1 and the local summer rainfall exceeds 55% of the annual total rainfall. The annual mean surface air temperature decreases from above 20 °C in South China to about 0 °C in Northeastern China. The eastern China monsoon region is also a region of relatively high rainfall in China, with an average annual rainfall of more than 400 mm and abundant rainfall, but with obvious differences between the north and the south and distinct dry and wet seasons. According to topographic and climatic conditions, the eastern China monsoon region is divided into the (semi-) humid cold-temperate northeastern China (NEC), semi-humid warm-temperate northern China (NC), humid subtropical central China (CC), and humid tropical southern China (SC) monsoon regions [52].

2.2. Datasets

In this work, we utilized monthly precipitation from five different observational and quasi-observational gridded datasets. The Climatic Research Unit (CRU) [53], European Center for Medium-Range Weather Forecasts Reanalysis (EAR5) [54], and Terra Climate [55] measured data from more than 2400 meteorological stations in China (CN05.1) [56], and Climate Hazards Group InfraRed Precipitation with Station data (CHIRPS) [57] were collected over the period from 1981 to 2022. The mean of these precipitation datasets was finally used and resampled to a 0.25° spatial resolution.
The atmospheric circulation fields associated with monthly precipitation changes derived from the latest ERA5 atmospheric reanalysis (1981–2022), including wind fields, total column water vapor, and divergence of vertically integrated moisture fluxes, were further used to reveal the atmospheric circulation mechanisms behind rainfall seasonality changes.
Global climate indices, including the DMI [58], Niño3.4 [59], and EMI [60] were used to indicate the IOD, ENSO, and ENSO_M events, respectively. The impacts of the global climate events on regional climate usually have a certain lag time [61], and thus 3 months lag time was also considered in this work.

2.3. Methods

The flowchart of research methods in this study is given in Figure 2. In this work, all data processing and analysis were performed using MATLAB R2022a software.

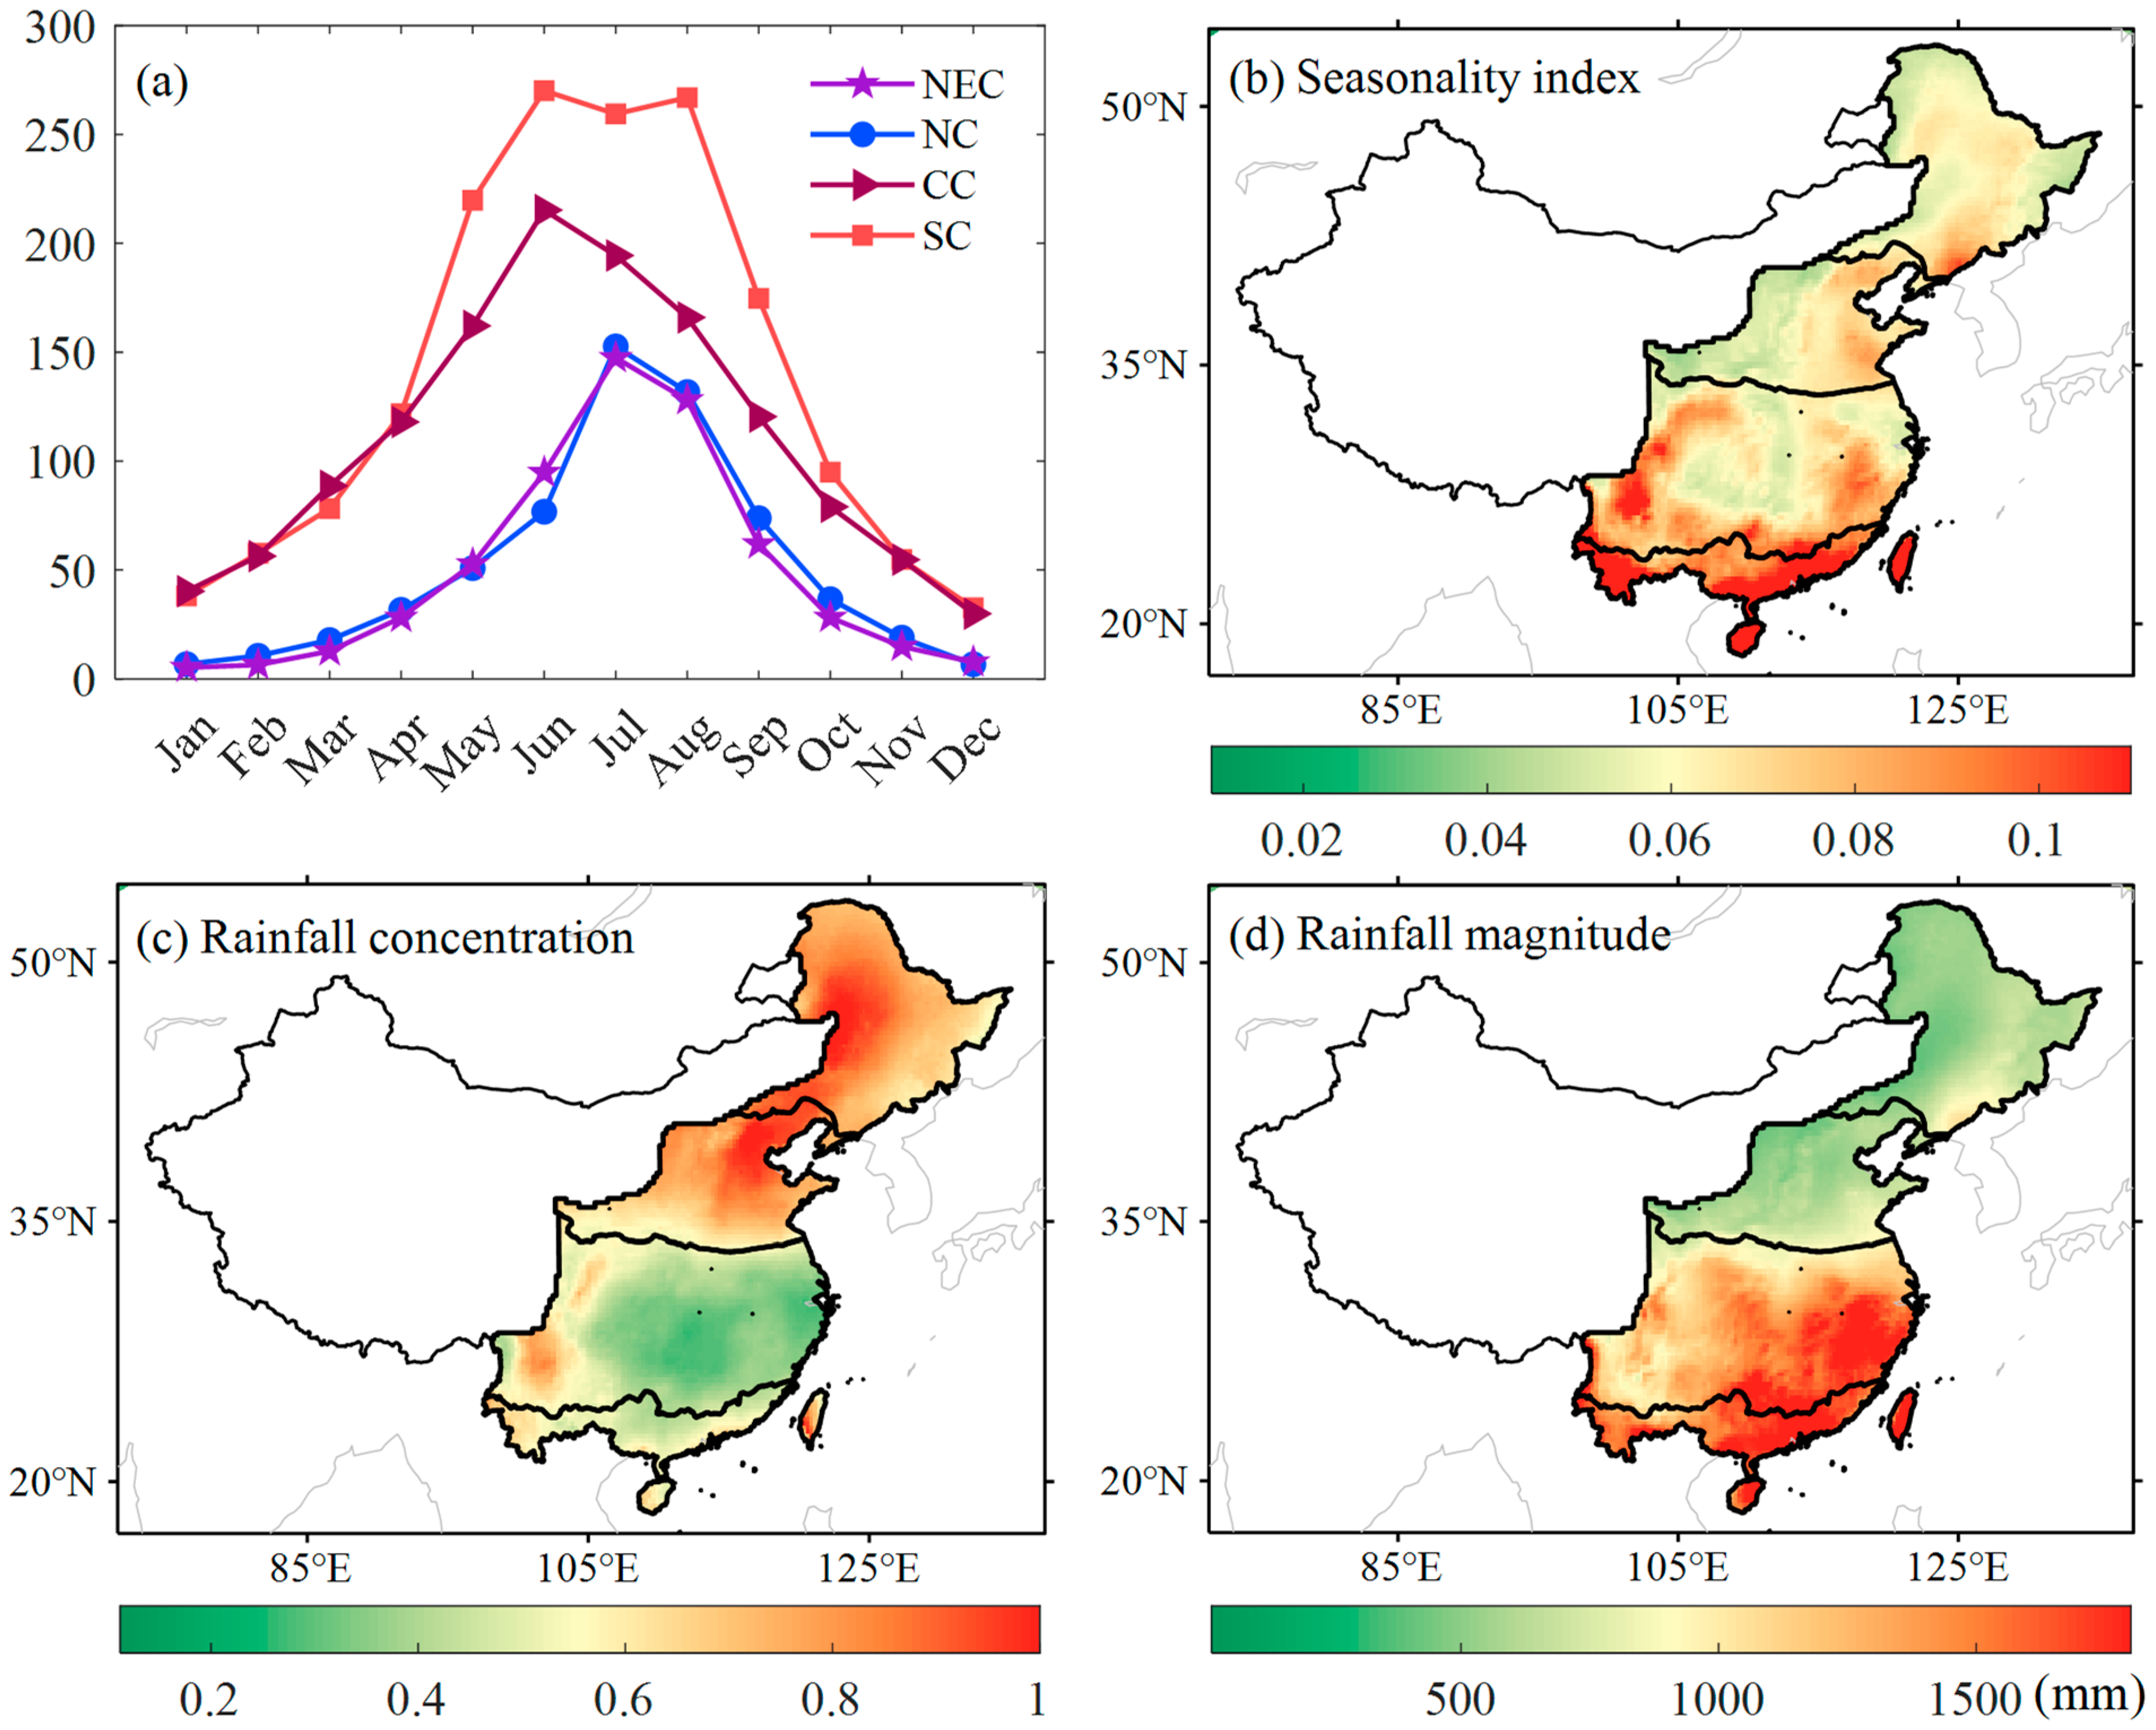
2.3.1. Seasonality Indices

To describe rainfall seasonality, we used seasonality indices proposed by Feng et al. [1], including relative entropy, magnitude, and dimensionless seasonality index. Seasonality indices facilitate meaningful comparisons across regions [62,63,64,65], and have been more widely used in recent decades [66]. The months in year k are indexed using m 1 ,   12 . Annual rainfall is expressed as R k = m = 1 12 r k , m and the associated distribution is p k , m = r k , m / R k , where r k , m is the monthly rainfall for each year k. Relative entropy is expressed as D k = m = 1 12 p k , m log 2 ( p k , m q m ) , where q m indicates the uniform distribution with a value of 1/12 for each month. The dimensionless seasonality index is finally defined as S k = D k · R k R m a x , where R ¯ m a x is the maximum annual rainfall in the entire eastern China monsoon region during 1981–2022.

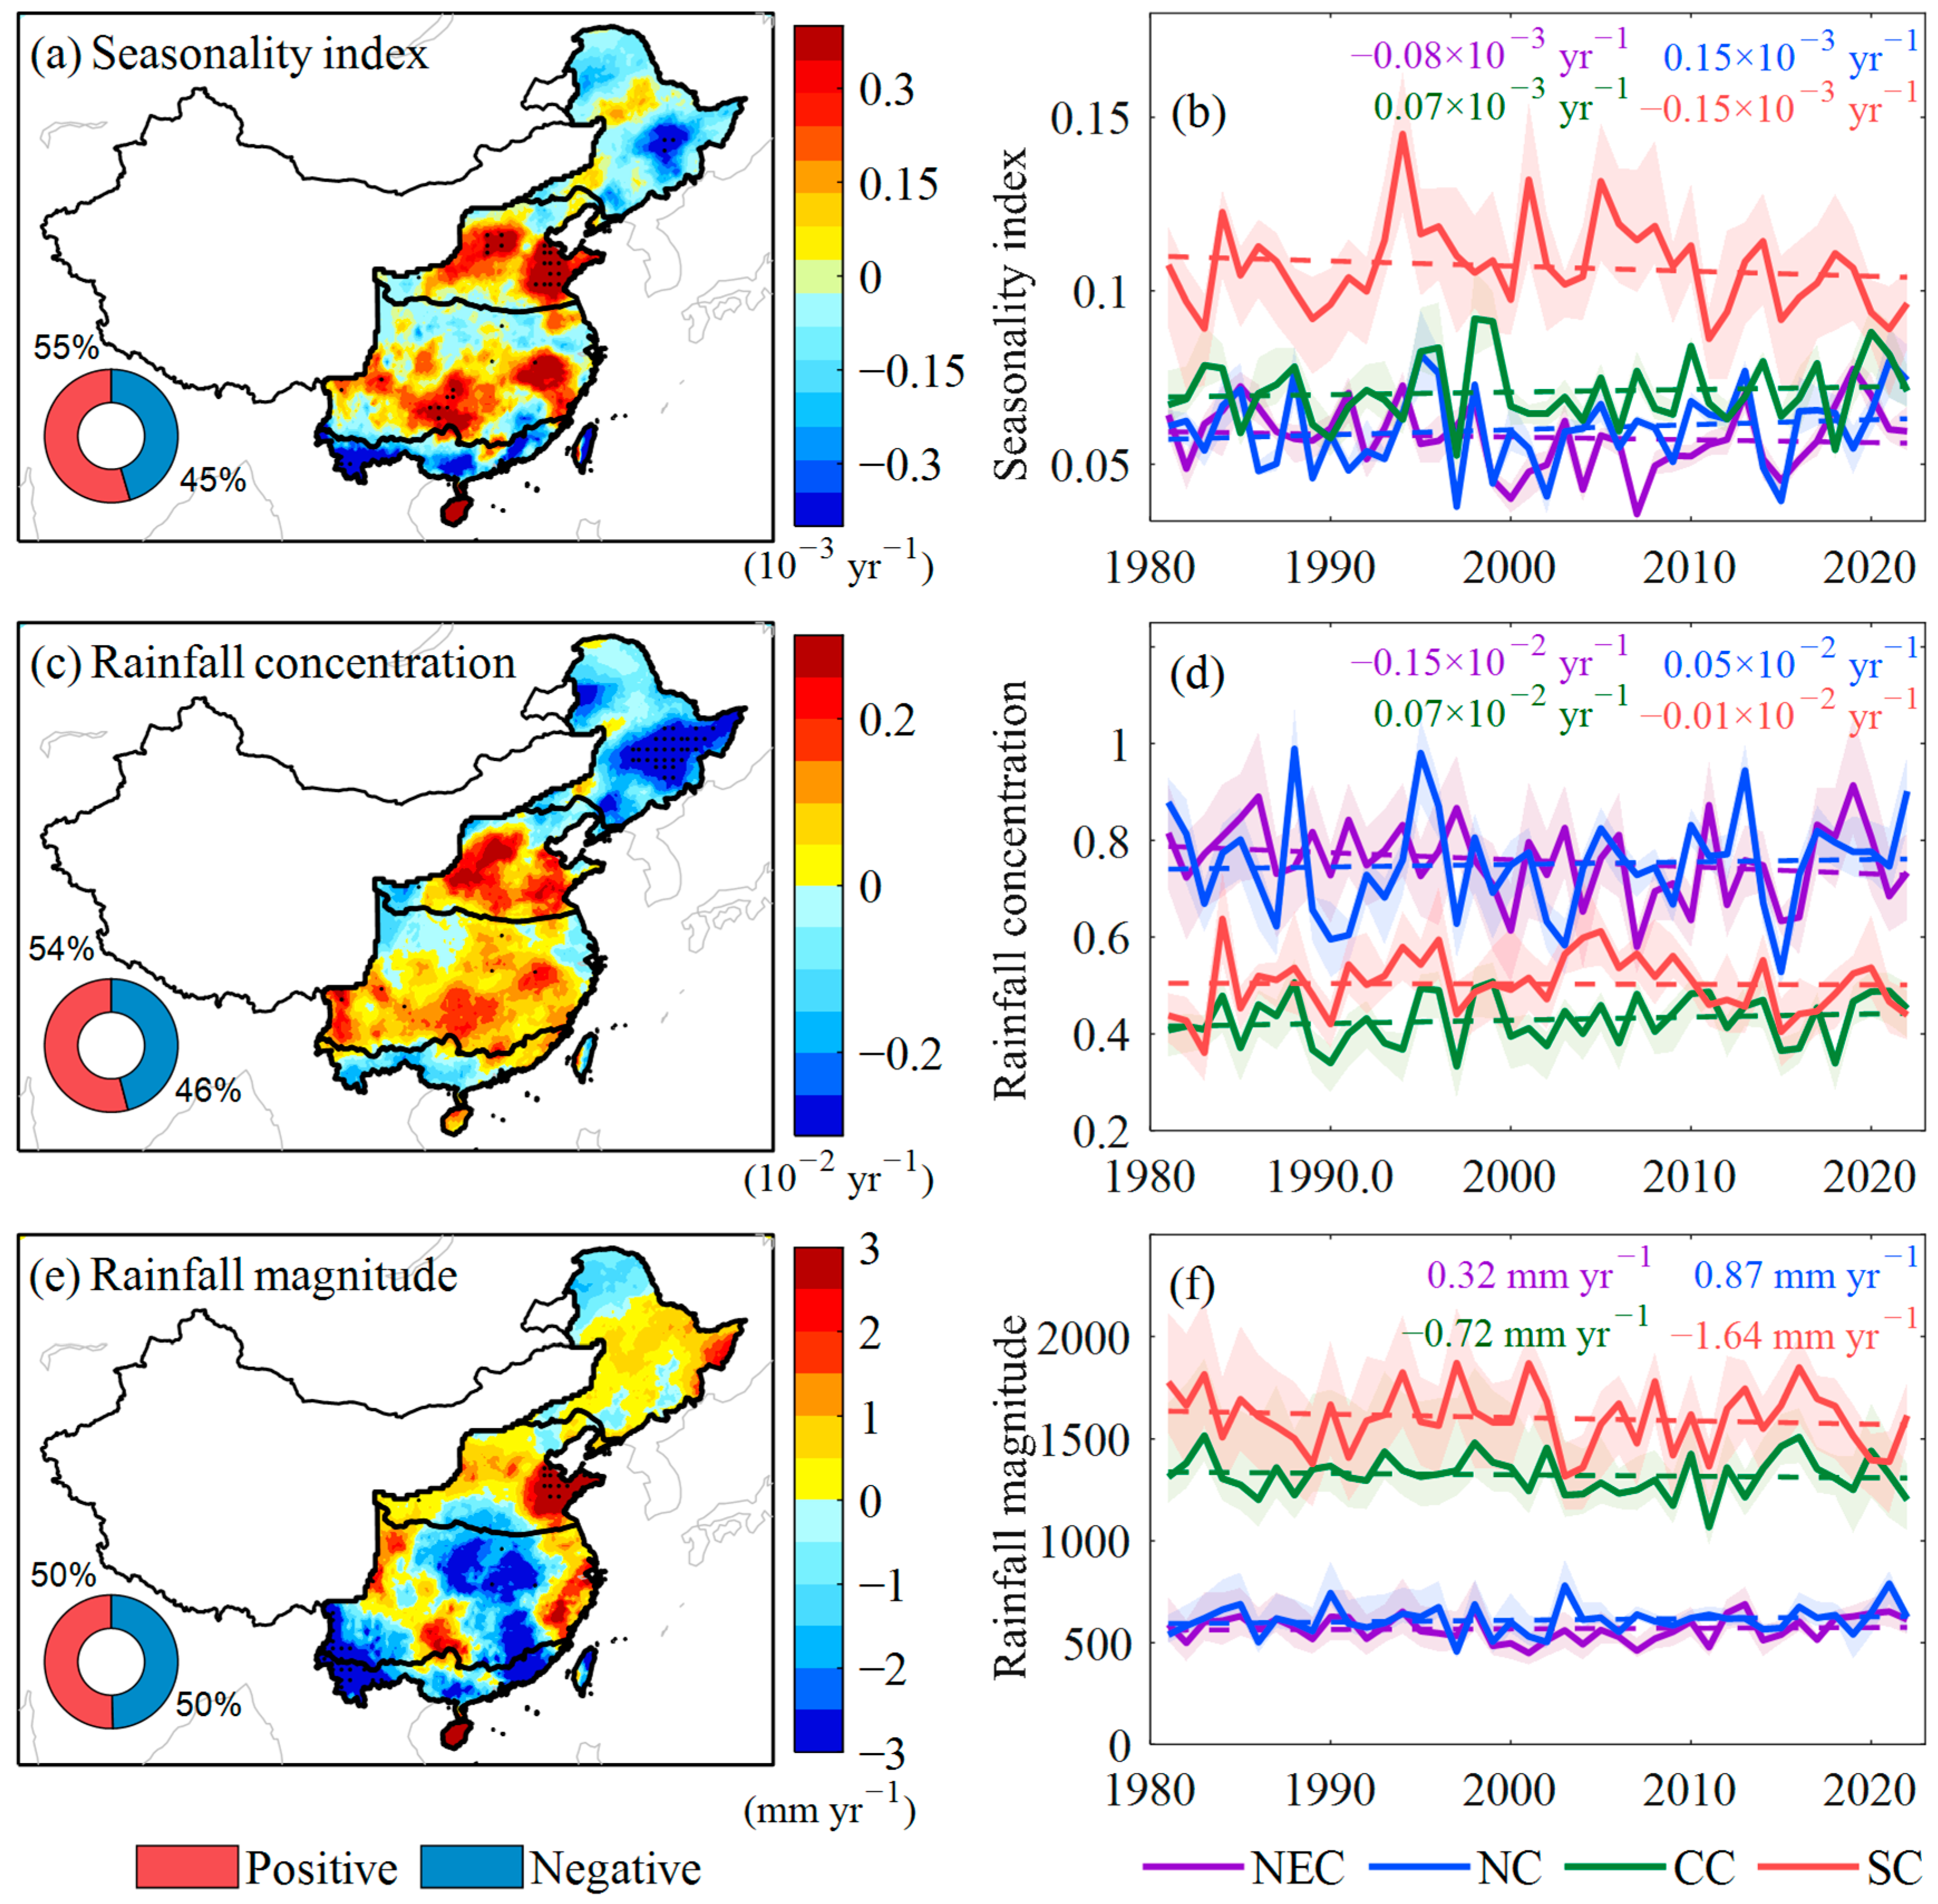
2.3.2. Time Series Analysis

The modified Mann–Kendall (MMK) method can avoid interference from outliers and remove autocorrelated components in time series [67]. The Sen’s slope [68] and Mann–Kendall methods are usually applied together and have been widely utilized in many climate analysis studies [69,70,71,72]. Therefore, Sen’s slope and MMK were used to analyze the interannual trend of rainfall seasonality in the eastern China monsoon region. The trend significance was set at the 0.05 level [73].

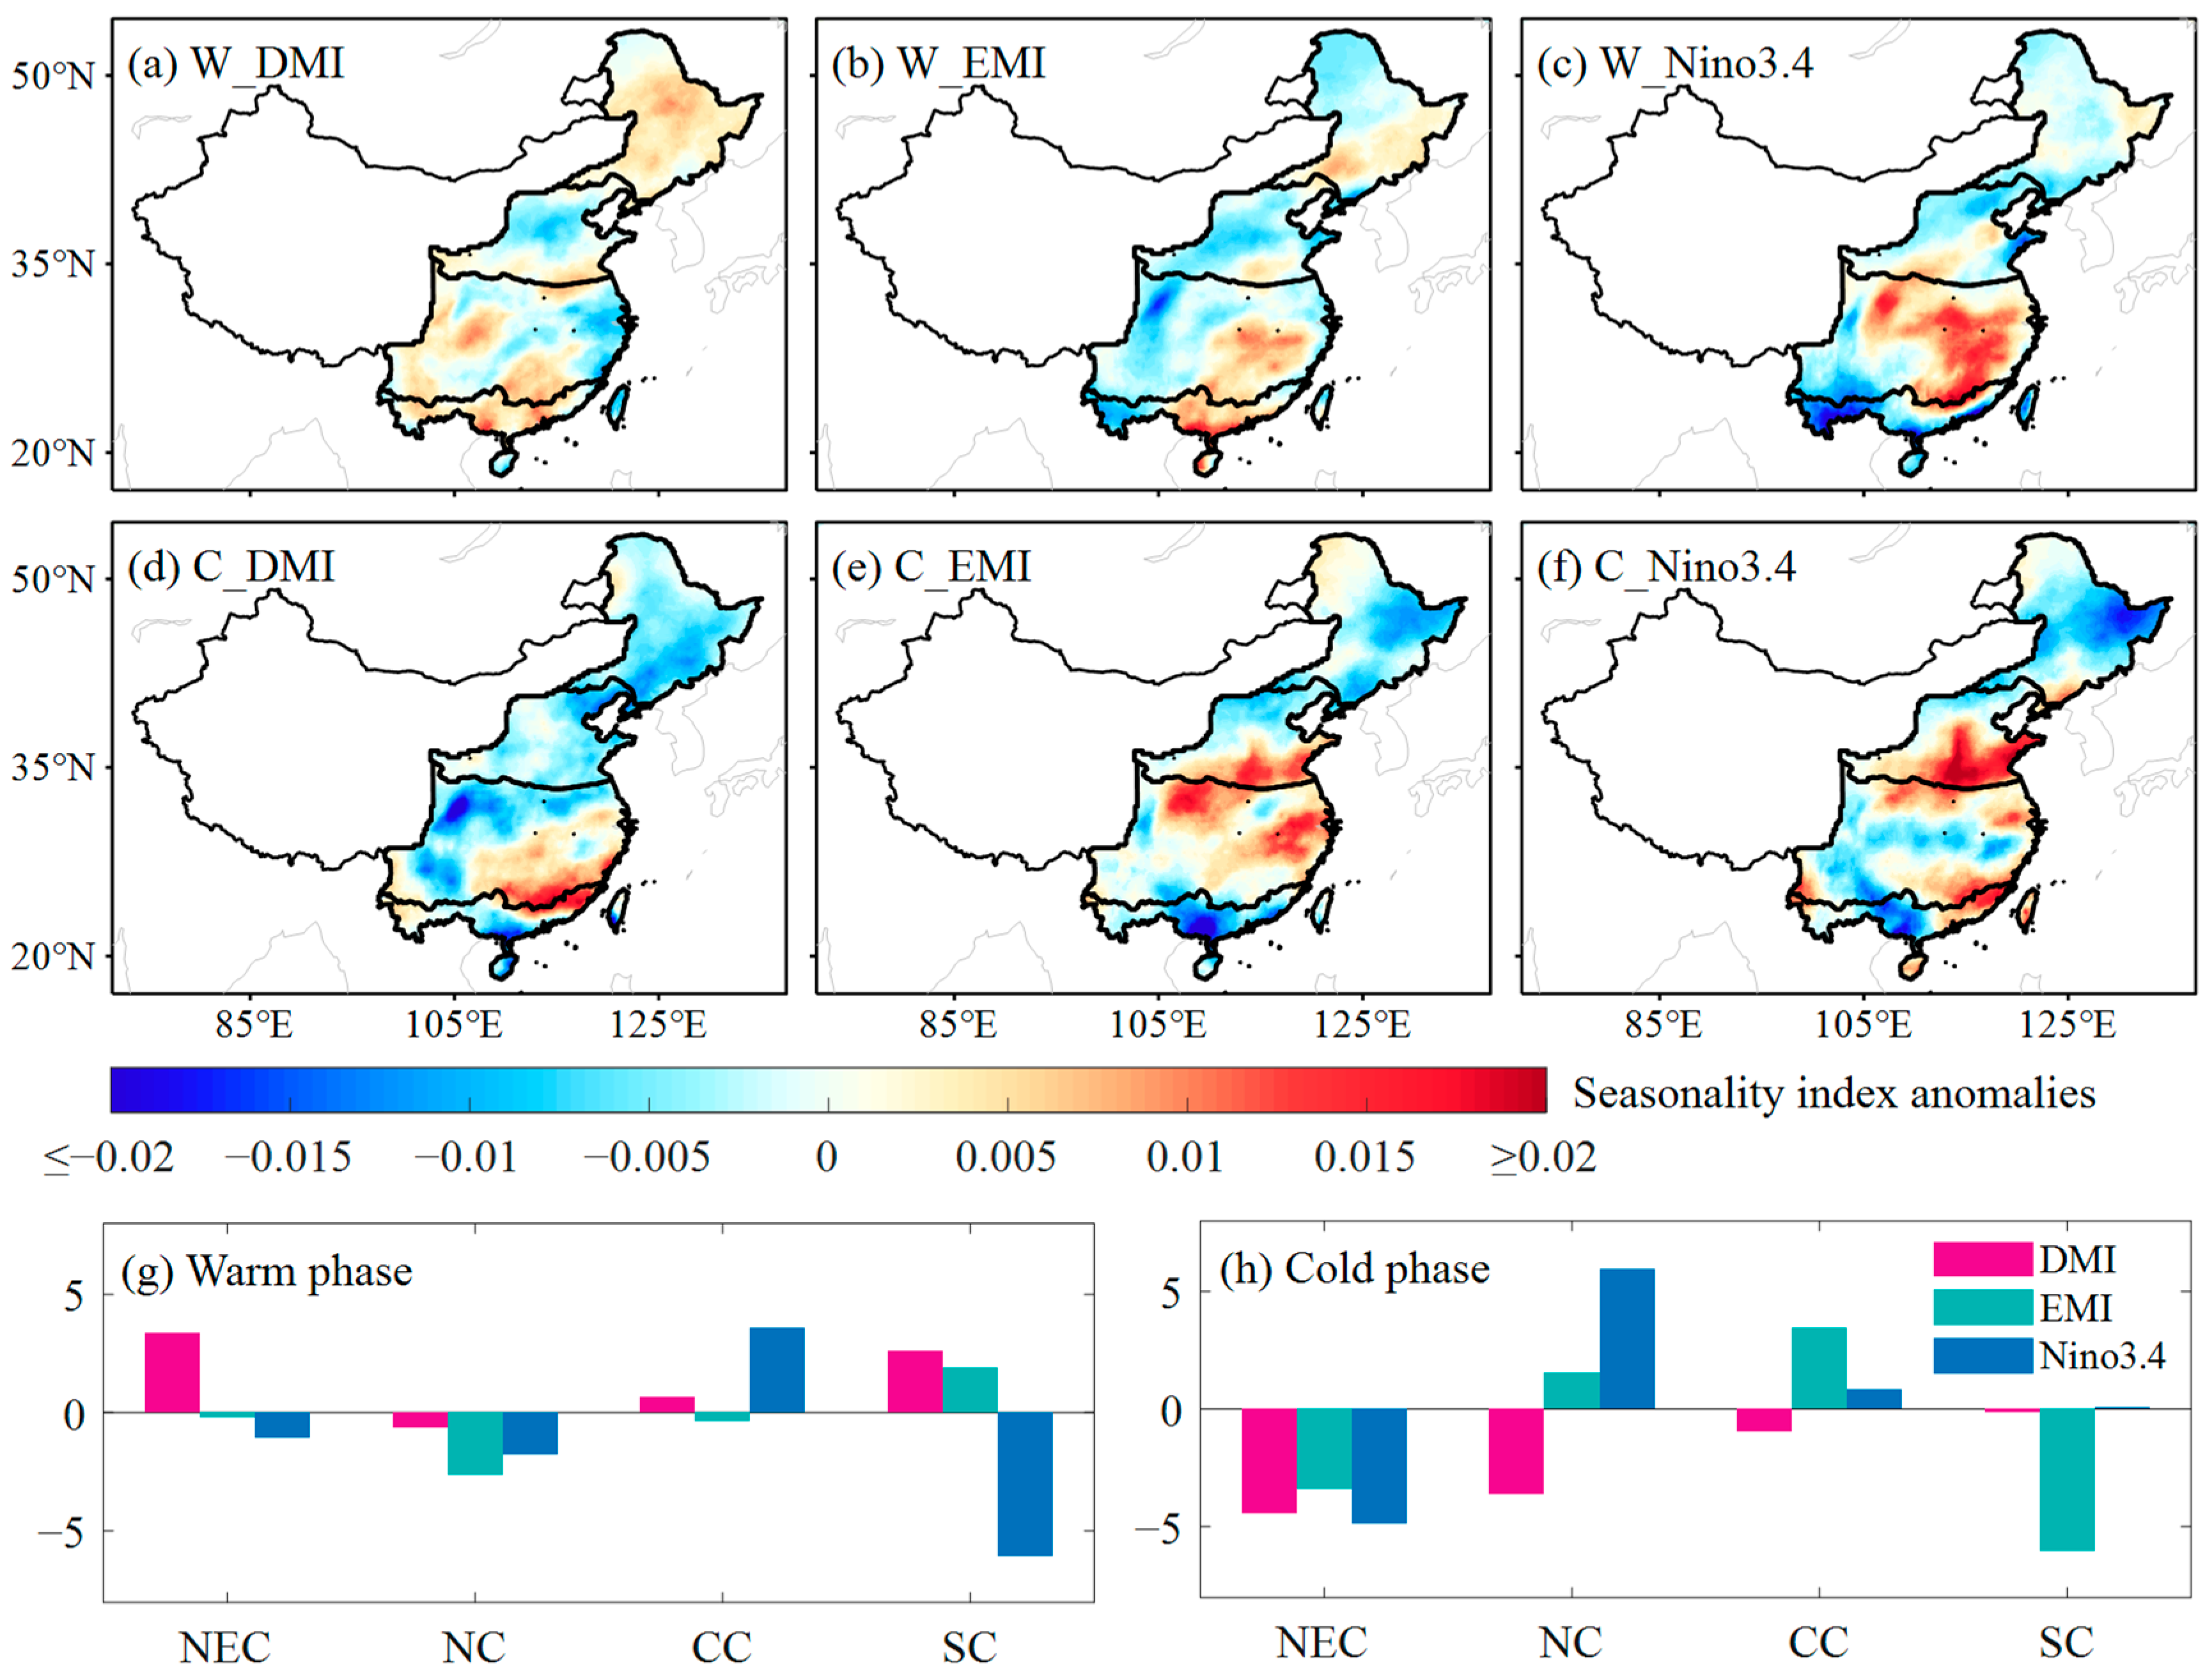
2.3.3. Anomalies of Seasonality Indices and Water Vapor Flux During the Negative and Positive Phases of Global Climate Events

Following Tedeschi et al. [74], the negative (La Niña) and positive (El Niño) phases or years of the ENSO (hereafter abbreviated as C_Niño3.4 and W_Niño3.4, respectively) were defined as 0.7 standard deviations below/above annual the averaged Niño3.4 during 1981 to 2022. The negative (hereafter abbreviated as C_DMI and C_EMI, respectively) and positive (hereafter abbreviated as W_DMI and W_EMI, respectively) phases or years of the IOD and ENSO_M were also defined in the same way. Finally, the seasonality index anomalies during the negative (positive) phases of global climate events were defined as the averaged seasonality indices in negative (positive) years minus the corresponding average seasonality indices in normal years. The temporal distributions of the negative and positive phases of these global climate events are given in Supplementary Figure S1.
Since it is difficult to directly analyze the possible atmospheric circulation behind changes in rainfall seasonality, we also tried to use monthly water vapor flux anomalies (March to October) during negative and positive episodes of each global climate event to explain the possible influences of these global climate events on rainfall seasonality in the eastern China monsoon region.

2.3.4. Partial Correlation Analysis

Partial correlation analysis is a statistical method used to measure the correlation between two variables, while controlling for the effect of one or more other variables. Partial correlation analysis can be used to analyze the correlation coefficient of two target variables by eliminating the interference of other variables [75]. To determine whether a direct linear relationship exists between two variables while controlling for the influence of other variables, the partial correlation can be calculated using the following formula:
r x y z = r x y r x z r y z ( 1 r x z 2 ) ( 1 r y z 2 )
Included among these, r x y   is the correlation coefficient between x and y , r x z   is the correlation coefficient between x and z , and r y z   is the correlation coefficient between y and z .

2.3.5. Wavelet Analysis

The cross wavelet transform (XWT) method is a powerful tool that can be used to analyze the coupling and consistency between two time series and their correlation in both the time and frequency domains [76]. In this work, bivariate wavelet coherence (BWC) and multivariate wavelet coherence (MWC) [77] methods were used to analyze the possible relationships between rainfall seasonality changes and global climate events in the eastern China monsoon region. The power spectra of two time series, P k X , and   P k Y , are calculated using the following formula:
D = w n X s W n Y × s σ X σ Y < p = Z V ( p ) v P k X P k Y
The average wavelet coherence (AWC) was applied to represent the mean coherence in the region, denoted by the thick black solid line, and the percent area of significant coherence (PASC) was used to indicate the area within the thick solid black line. Larger values of the AWC and PASC indicate that rainfall seasonality is more closely correlated with the global climate events. Although an additional global climate index may increase the value of the AWC, the increase in the PASC by at least 5% should be detected before considering that the additional global climate index has practical significance [45].

3. Results and Discussion

3.1. Spatial and Temporal Variations in Rainfall Seasonality in the Eastern China Monsoon Region

To understand the spatial and temporal variations in rainfall seasonality in the eastern China monsoon region, we firstly analyzed the climatology of monthly rainfall and seasonality indices in the eastern China monsoon region from 1981 to 2022, which are shown in Figure 3. Generally, monthly rainfall is characterized by unimodal distribution in a year, and rainfall is mainly concentrated from April to October in each eastern China monsoon region (Figure 3a). Moreover, a larger seasonality index (exceeding 0.08) is observed in most parts of the eastern China monsoon region (Figure 3b), which can be attributed to the higher rainfall magnitude (exceeding 1000 mm) in the SC and CC monsoon regions and the higher rainfall concentration (exceeding 0.8) in the NEC and NC monsoon regions.
Figure 4 shows spatial trends and time series of seasonality indices in the eastern China monsoon region during 1981–2022. The seasonality index presents a prominent increasing trend in 55% of the eastern China monsoon region, particularly in the NC (0.15 × 10⁻³ yr−1) and CC (0.07 × 10⁻³ yr−1) monsoon regions (Figure 4a). The increased seasonality index can be explained by the increases in both rainfall concentration and rainfall magnitude in the NC monsoon region, and can be mainly attributed to the increases in rainfall concentration in the CC monsoon region. Due to the decreases in rainfall concentration, rainfall magnitude, or both, the seasonality index shows a downward trend in the NEC (−0.08 × 10⁻³ yr−1) and SC (−0.15 × 10⁻³ yr−1) monsoon regions. In summary, due to the changes in rainfall concentration, rainfall magnitude, or both, rainfall seasonality has been enhanced in the NC and CC monsoon regions and weakened in the NEC and SC monsoon regions during recent decades.

3.2. Possible Teleconnections Between Rainfall Seasonality and Global Climate Events

3.2.1. Seasonality Index Anomalies During the Negative and Positive Phases

To investigate the possible climatic causes behind rainfall seasonality changes in the eastern China monsoon region, we firstly analyzed seasonality index anomalies during the cold and warm phases of the IOD, ENSO, and ENSO_M from 1981 to 2022. Figure 5 shows the spatial distributions of seasonality index anomalies in the eastern China monsoon region during the cold and warm phases of global climate events. Supplementary Figures S4 and S5 and Figure 6 show the monthly atmospheric circulation anomalies (March to October) during the cold and warm phases of the IOD, ENSO_M, and ENSO using ERA5 datasets, respectively. Due to positive anomalies in rainfall concentration and rainfall magnitude (Supplementary Figures S2 and S3), the seasonality index shows positive seasonality index anomalies in the NC monsoon region during the cold phase of the ENSO and ENSO_M, and particularly evident during the cold phase of the ENSO_M. We also find that the total column water vapor flux increases and converges from July to October, but diverges from April to June across the NC monsoon region during the cold phase of the ENSO (Figure 6), which may increase rainfall magnitude and mainly concentrate from July to October, and thus increases seasonality index. Under the influence of the warm phase of the ENSO and the cold phase of the ENSO_M, the seasonality index shows positive anomalies across the CC monsoon region. The total column water vapor flux divergence increases significantly and converges from July to September in the CC monsoon region during the cold phase of the ENSO_M and the warm phase of the ENSO (Supplementary Figure S4 and Figure 6), which dominates the positive rainfall concentration anomalies (Supplementary Figure S2) and finally increases the seasonality index.
In the NEC monsoon region, due to negative anomalies in rainfall concentration and rainfall magnitude (Supplementary Figures S2 and S3), the seasonality index shows a significantly negative anomaly under the cold phase of the IOD, ENSO, and ENSO_M. We further find that the total column water vapor diverges in almost all months across the NEC monsoon region, which may decrease both rainfall magnitude and rainfall concentration, and thus decreases the seasonality index slightly during the cold phase of the IOD, ENSO, and ENSO_M. Under the influence of the cold phase of the ENSO_M and the warm phase of the ENSO, negative seasonality index anomalies are observed in the SC monsoon region. Total column water vapor converges (diverges) in most months during the warm (cold) phase of the ENSO (ENSO_M), which may decrease rainfall concentration and increase (decrease) rainfall magnitude during the warm (cold) phase of the ENSO (ENSO_M) (Supplementary Figures S2 and S3), and finally weaken rainfall seasonality in the SC monsoon region.

3.2.2. Possible Correlation with SST Anomalies

To investigate the possible linear relationships between SST anomalies and seasonality indices in the eastern China monsoon region, we further analyzed the correlations between SST anomalies in the IOD, ENSO, and ENSO_M regions and seasonality indices using partial correlation analysis. Figure 7 shows the spatial distributions of partial correlations between seasonality indices and global climate events in the eastern China monsoon region. The results show that the seasonality index exhibits a positive correlation with the DMI and EMI, and shows a significantly negative correlation with Niño3.4 in the NC monsoon region. The seasonality index is obviously positively correlated with the DMI and Niño3.4, but is significantly negatively correlated with EMI in the CC monsoon region. Positive correlations between seasonality index and global climate events were detected in the NEC monsoon region. In the SC monsoon region, seasonality index is obviously positively correlated with EMI, but is significantly negatively correlated with DMI and Niño3.4. These results coincide with the results of the seasonality index anomalies during the cold or warm phases of the IOD, ENSO and ENSO_M (Figure 5). In this way, the IOD, ENSO_M, and ENSO may influence rainfall seasonality by altering rainfall and its extremes in the eastern China monsoon region.

3.3. Dynamic Relationships Between Rainfall Seasonality and Global Climate Events

3.3.1. Bivariate Wavelet Coherence Analysis

Global climatic events have a great impact on rainfall seasonality changes in the eastern China monsoon region, but the correlations between rainfall seasonality and global climate events in the time and frequency domains remain unclear. We firstly analyzed the correlations between global climate events and seasonality indices using the BWC analysis method in different eastern China monsoon regions, which is shown in Figure 8. In wavelet analysis, the average wavelet coherence (AWC) was applied to represent the mean coherence in the region denoted by the thick black solid line, and the percent area of significant coherence (PASC) was used to indicate the area within the thick solid black line. Larger values of the AWC and PASC indicate that rainfall seasonality is more closely correlated with global climate events [45]. The values of the AWC and PASC of the BWC analysis are shown in Figure 9. The increased seasonality index and EMI (PASC 27.69% and AWC 0.49) are significantly positively correlated (Figure 9), and the PASC and AWC are higher than that of the DMI and Niño3.4 in the NC monsoon region. There have different significant resonance periods of DMI, EMI, and Niño3.4, mainly significant in certain years during whole study period. In the CC monsoon region, we find that the enhanced rainfall seasonality is positively correlated with Niño3.4 (PASC 60.14% and AWC 0.71), and that the PASC is higher than that of the DMI and EMI. The positive correlations between the seasonality index and Niño3.4 are significant at 0–5 years during 1993–2010 and 5–16 years during the whole study period. In the NEC monsoon region, there are significantly positive correlations between the decreased seasonality index and the DMI (PASC 12.52% and AWC 0.41) at a scale of approximately 5–6 years during 1981–1988, 2–4 years during 1991–1997, and 10–16 years during the whole study period, and the PASC and AWC are higher than that of the DMI and Niño3.4. The decreased seasonality index and EMI (PASC 22.04% and AWC 0.44) are significantly positively correlated, and the PASC and AWC are higher than that of the DMI and Niño3.4 in the SC monsoon region. There have also been different significant resonance periods between the seasonality index and EMI, including 4–7 years during 2006–2022 and 10–16 years during the whole study period.

3.3.2. Multivariate Wavelet Coherence Analysis

Due to global climate events potentially occurring at the same time in a climate system, we further analyzed the coupled influences of global climate events on rainfall seasonality in the eastern China monsoon region using MWC techniques, which is shown in Figure 10. The values of the AWC and PASC of the MWC analysis are shown in Figure 9. Although an additional global climate index may increase the value of the AWC, the increase in the PASC by at least 5% should be detected before considering that the additional global climate index has practical significance [45]. Generally, the AWC and PASC values increase along with the increase in the number of global climate events in all the different eastern China monsoon regions, indicating that rainfall seasonality changes are affected by multiple global climate events simultaneously. For example, the coupled influences of the DMI and Niño3.4 (PASC 11.90% and AWC 0.65) on the reduced seasonality index are significant at approximately 10–16 years during 2002–2022, and most of the significant regions are outside the cone of influence (COI) in the NEC monsoon region. The coupled influences of the EMI and Niño3.4 on rainfall seasonality show significant coherence at 2–10 years during 1990–2008 and 10–12 years during the whole period in the SC monsoon region (PASC 32.18% and AWC 0.73). Compared with the individual EMI (PASC 25.58%), the change degree of the PASC is significant and higher than 5% in this region. In the NC monsoon region, the coupled influences of the DMI and Niño3.4 (PASC 31.63% and AWC 0.80) on the increased seasonality index are significant at 3–7 years during 1981–2004 and 0–6 years during 2010–2022. The coupled influences of the EMI and Niño3.4 on the seasonality index show significant coherence at 10–14 years during the whole period in the CC monsoon region (PASC 52.79% and AWC 0.85).
In summary, these results are consistent with the results presented in Figure 7. We proved that the ENSO_M is the key driving factor affecting the enhanced and decreased rainfall seasonality in the CC and SC monsoon regions, respectively. The increased rainfall seasonality can be mainly attributed to the impacts of the ENSO in the CC monsoon region. The IOD is the key driving factor affecting the enhanced rainfall seasonality in the NEC monsoon region. Moreover, the changes in rainfall seasonality are also affected by the coupled IOD, ENSO_M, and ENSO, with certain resonance periods in different eastern China monsoon regions.

4. Discussion

In recent years, increases in precipitation and extreme precipitation have been widely reported in the eastern China monsoon region [51,78]; however, the spatial and temporal variations in rainfall seasonality are less understood. Using five different observational and quasi-observational gridded monthly precipitation datasets, the spatial and temporal variations in rainfall seasonality and possible teleconnection mechanisms were analyzed in the eastern China monsoon region during 1981–2022. We find that a larger seasonality index is observed in most parts of the eastern China monsoon region, which is consistent with the regionalization of the climate and wet/dry distributions in China [79]. Rainfall seasonality is enhanced in the NC and CC monsoon regions and weakened in the NEC and SC monsoon regions, which can be explained by the changes in rainfall concentration and rainfall magnitude, or both. Previous studies have suggested that the frequency and intensity of extreme precipitation increase in Southeast China, which may indirectly cause the increases in rainfall concentration [80,81]. Previous studies have also suggested that rainfall magnitude decreases in many parts of China, especially in Southeast China [82,83]. Moreover, the decreased rainfall seasonality can be attributed to the decreases in both frequency and the amount of rainfall in the NEC monsoon region [84]. These previous results coincide with our results.
The underlying climatic causes of rainfall seasonality changes are extremely complex. We find that the large-scale circulation and SST anomalies associated with the cold or warm phases of the IOD, ENSO_M, and (or) ENSO largely contribute to the enhanced seasonality observed in the NC and CC monsoon regions, and the converse reduction in seasonality in the NEC and SC monsoon regions. Previous studies have suggested that water vapor flux is more abundant during the warm phase of the ENSO than its cold phase in spring and summer, and leads to the increases in precipitation in spring and summer across the Huai River basin, China [29]. The different characteristics of the anomalous anticyclone around the South China Sea are responsible for the different responses in seasonal precipitation to the IOD and ENSO in eastern China [85], which may weaken or enhance rainfall seasonality in these regions. The warm phases of the ENSO mainly lead to lower-level southwesterly winds being deflected from the southeast coast of China [86], which decreases rainfall and weakens rainfall seasonality in most parts of southern China [34]. Moreover, the cold phases of the ENSO enhance the amplitude of negative precipitation anomalies in East and North China, and change the frequency of the precipitation variability [87]. These findings may further explain why rainfall seasonality decreases in the NEC and SC monsoon regions. We also find that the changes in rainfall seasonality in the CC, NC, SC, and NEC monsoon regions can be mainly attributed to different global climate events, and are also affected by the coupling of the IOD, ENSO, and ENSO_M.
Here, we focus only on the teleconnection mechanisms between rainfall seasonality and the IOD, ENSO, and ENSO_M. However, there are many other global climate events, such as North Atlantic Oscillation (NAO), Pacific decadal oscillation (PDO), and Atlantic multidecadal oscillation (AMO), which may affect rainfall seasonality changes in the eastern China monsoon region [19]. In future studies, we will consider more global climate events and deeply explore their individual and coupled effects on rainfall seasonality changes in the eastern China monsoon region.

5. Conclusions

In this work, we investigated the spatial and temporal variations in rainfall seasonality and the underlying climatic causes in the eastern China monsoon region. Observations show that rainfall seasonality was enhanced in the NC and CC monsoon regions and weakened in the NEC and SC monsoon regions from 1981 to 2022. The changes in rainfall seasonality can be attributed to the changes in rainfall concentration, rainfall magnitude, or both in the different eastern China monsoon regions. Significant positive seasonality index anomalies are observed in the NC and CC monsoon regions, and significant negative seasonality index anomalies are detected in the NEC and SC monsoon regions during the cold or warm phases of the IOD, ENSO_M, and (or) ENSO. These anomalies can be explained by large-scale circulation and SST anomalies, and may further explain and contribute to the trends of seasonality indices in the different eastern China monsoon regions. The wavelet coherence analysis shows that the enhanced rainfall seasonality in the CC and NC monsoon regions can be mainly attributed to the EMI and Niño3.4, respectively. The EMI and DMI are the key driving factors affecting the weakened rainfall seasonality in the SC and NEC monsoon regions, respectively. These rainfall seasonality changes are also affected by the coupling of the DMI, EMI, and Niño3.4 in the different eastern China monsoon regions. These findings provide valuable implications for various sectors, including agriculture, water resource management, urban planning, and ecological conservation, to tackle the issues associated with rainfall seasonality changes in the eastern China monsoon region in the future.

Supplementary Materials

The following supporting information can be downloaded at: https://www.mdpi.com/article/10.3390/w17040522/s1, Figure S1. Temporal distributions of (a) DMI, (b) EMI and (c) Niño3.4 from 1981 to 2022. Figure S2. Spatial distribution of rainfall concentration anomalies in eastern China monsoon region during the warm phase and cold phase of global climate events. Figure S3. Spatial distribution of rainfall magnitude anomalies in eastern China monsoon region during the warm phase and cold phase of global climate events. Figure S4. Monthly anomaly of the vertical divergence in cold and warm phase of IOD during 1981 to 2022. The vector arrows and direction indicate water vapor flux anomalies. The negative (positive) divergence values indicate moisture convergence (divergence). Figure S5. Monthly anomaly of the vertical divergence in cold and warm phase of ENSO_M during 1981 to 2022. The vector arrows and direction indicate water vapor flux anomalies. The negative (positive) divergence values indicate moisture convergence (divergence).

Author Contributions

M.L. wrote the paper. X.S. performed the data analysis. S.D. wrote the paper and contributed ideas to the data analysis. N.Y. designed the research. W.W. contributed data curation. All authors contributed to the interpretation of the results and to the text. All authors have read and agreed to the published version of the manuscript.

Funding

This work was supported by the National Natural Science Foundations of China (grant no. 42101047), Guangxi Natural Science Foundation Program (grant no. 2021GXNSFBA220061), and the Innovation Project of Guangxi Graduate Education (grant no. YCSW2024480). This work was supported by the Construction project of the Natural Resources Digital Industry College, and was also supported by the Guangxi First-class Discipline Statistics Construction Project Fund.

Data Availability Statement

Monthly precipitation observation datasets are available from the Climatic Research Unit (CRU, https://crudata.uea.ac.uk/cru/data/hrg/, accessed on 5 October 2024), European Center for Medium-Range Weather Forecasts Reanalysis v5 (EAR5, https://cds.climate.copernicus.eu/datasets/reanalysis-era5-single-levels-monthly-means?tab=download, accessed on 20 October 2024), TerraClimate (https://climatedataguide.ucar.edu/climate-data/terraclimate-global-high-resolution-gridded-temperature-precipitation-and-other-water, accessed on 8 November 2024), Measured station data (CN05.1, https://ccrc.iap.ac.cn/resource/detail?id=228, accessed on 15 July 2024), and Climate Hazards Group InfraRed Precipitation with Station data (CHIRPS, https://data.chc.ucsb.edu/products/CHIRPS-2.0/global_daily/netcdf/p05/, accessed on 9 November 2024). The Global climate indices can be obtained from the APEC Climate Center (APCC, https://www.apcc21.org/#grap1, accessed on 1 December 2024).

Conflicts of Interest

The authors declare no competing financial or non-financial interests.

References

  1. Feng, X.; Porporato, A.; Rodriguez-Iturbe, I. Changes in rainfall seasonality in the tropics. Nat. Clim. Chang. 2013, 3, 811–815. [Google Scholar] [CrossRef]
  2. Chen, Z.; Wang, W.; Fu, J. Vegetation response to precipitation anomalies under different climatic and biogeographical conditions in China. Sci. Rep. 2020, 10, 830. [Google Scholar] [CrossRef]
  3. Brönnimann, S.; Rajczak, J.; Fischer, E.M.; Raible, C.C.; Rohrer, M.; Schär, C. Changing seasonality of moderate and extreme precipitation events in the Alps. Nat. Hazards 2018, 18, 2047–2056. [Google Scholar] [CrossRef]
  4. Tao, Y.; Wang, W.; Song, S.; Ma, J. Spatial and temporal variations of precipitation extremes and seasonality over China from 1961–2013. Water 2018, 10, 719. [Google Scholar] [CrossRef]
  5. Dubois, N.; Oppo, D.W.; Galy, V.V.; Mohtadi, M.; van der Kaars, S.; Tierney, J.E.; Rosenthal, Y.; Eglinton, T.I.; Lückge, A.; Linsley, B.K. Indonesian vegetation response to changes in rainfall seasonality over the past 25,000 years. Nat. Geosci. 2014, 7, 513–517. [Google Scholar] [CrossRef]
  6. Piao, S.; Ciais, P.; Huang, Y.; Shen, Z.; Peng, S.; Li, J.; Zhou, L.; Liu, H.; Ma, Y.; Ding, Y.; et al. The impacts of climate change on water resources and agriculture in China. Nature 2010, 467, 43–51. [Google Scholar] [CrossRef]
  7. Yan, D.; Zhang, X.; Yu, Y.; Guo, W.; Hanan, N.P. Characterizing land surface phenology and responses to rainfall in the Sahara desert. J. Geophys. Res. Biogeosci. 2016, 121, 2243–2260. [Google Scholar] [CrossRef]
  8. Zhang, J.; Zhang, Y.; Qin, S.; Wu, B.; Wu, X.; Zhu, Y.; Shao, Y.; Gao, Y.; Jin, Q.; Lai, Z.; et al. Effects of seasonal variability of climatic factors on vegetation coverage across drylands in northern China. Land Degrad. 2018, 29, 1782–1791. [Google Scholar] [CrossRef]
  9. Feng, X.; Vico, G.; Porporato, A. On the effects of seasonality on soil water balance and plant growth. Water Resour. Res. 2012, 48. [Google Scholar] [CrossRef]
  10. Hong, J.; Kim, J. Impact of the Asian monsoon climate on ecosystem carbon and water exchanges: A wavelet analysis and its ecosystem modeling implications. Glob. Chang. Biol. 2011, 17, 1900–1916. [Google Scholar] [CrossRef]
  11. Villarreal, S.; Vargas, R.; Yepez, E.A.; Acosta, J.S.; Castro, A.; Escoto-Rodriguez, M.; Lopez, E.; Martínez-Osuna, J.; Rodriguez, J.C.; Smith, S.V. Contrasting precipitation seasonality influences evapotranspiration dynamics in water-limited shrublands. J. Geophys. Res. Biogeosci. 2016, 121, 494–508. [Google Scholar] [CrossRef]
  12. Pascale, S.; Lucarini, V.; Feng, X.; Porporato, A.; ul Hasson, S. Projected changes of rainfall seasonality and dry spells in a high greenhouse gas emissions scenario. Clim. Dyn. 2016, 46, 1331–1350. [Google Scholar] [CrossRef]
  13. Peng, S.; Piao, S.; Shen, Z.; Ciais, P.; Sun, Z.; Chen, S.; Bacour, C.; Peylin, P.; Chen, A.; Meteorology, F. Precipitation amount, seasonality and frequency regulate carbon cycling of a semi-arid grassland ecosystem in Inner Mongolia, China: A modeling analysis. Agricultural 2013, 178, 46–55. [Google Scholar] [CrossRef]
  14. Seth, A.; Rauscher, S.A.; Biasutti, M.; Giannini, A.; Camargo, S.J.; Rojas, M. CMIP5 projected changes in the annual cycle of precipitation in monsoon regions. J. Clim. 2013, 26, 7328–7351. [Google Scholar] [CrossRef]
  15. Sperber, K.; Annamalai, H.; Kang, I.-S.; Kitoh, A.; Moise, A.; Turner, A.; Wang, B.; Zhou, T. The Asian summer monsoon: An intercomparison of CMIP5 vs. CMIP3 simulations of the late 20th century. Clim. Dyn. 2013, 41, 2711–2744. [Google Scholar] [CrossRef]
  16. Huang, P.; Xie, S.-P.; Hu, K.; Huang, G.; Huang, R. Patterns of the seasonal response of tropical rainfall to global warming. Nat. Geosci. 2013, 6, 357–361. [Google Scholar] [CrossRef]
  17. Livada, I.; Asimakopoulos, D.N. Individual seasonality index of rainfall regimes in Greece. Clim. Res. 2005, 28, 155–161. [Google Scholar] [CrossRef]
  18. Sahany, S.; Mishra, S.K.; Pathak, R.; Rajagopalan, B. Spatiotemporal variability of seasonality of rainfall over India. Geophys. Res. Lett. 2018, 45, 7140–7147. [Google Scholar] [CrossRef]
  19. Deng, S.; Yang, N.; Li, M.; Cheng, L.; Chen, Z.; Chen, Y.; Chen, T.; Liu, X. Rainfall seasonality changes and its possible teleconnections with global climate events in China. Clim. Dyn. 2019, 53, 3529–3546. [Google Scholar] [CrossRef]
  20. Moron, V.; Vautard, R.; Ghil, M. Trends, interdecadal and interannual oscillations in global sea-surface temperatures. Clim. Dyn. 1998, 14, 545–569. [Google Scholar] [CrossRef]
  21. Rasmusson, E.M.; Carpenter, T.H. Variations in tropical sea surface temperature and surface wind fields associated with the Southern Oscillation/El Niño. Mon. Weather Rev. 1982, 110, 354–384. [Google Scholar] [CrossRef]
  22. Rajagopalan, B.; Lall, U.; Cane, M.A. Anomalous ENSO occurrences: An alternate view. J. Clim. 1997, 10, 2351–2357. [Google Scholar] [CrossRef]
  23. Ni, S.; Chen, J.; Wilson, C.R.; Li, J.; Hu, X.; Fu, R. Global terrestrial water storage changes and connections to ENSO events. Surv. Geophys. 2018, 39, 1–22. [Google Scholar] [CrossRef]
  24. Pokhrel, Y.; Felfelani, F.; Satoh, Y.; Boulange, J.; Burek, P.; Gädeke, A.; Gerten, D.; Gosling, S.N.; Grillakis, M.; Gudmundsson, L. Global terrestrial water storage and drought severity under climate change. Nat. Clim. Chang. 2021, 11, 226–233. [Google Scholar] [CrossRef]
  25. Tian, Q.; Prange, M.; Merkel, U. Precipitation and temperature changes in the major Chinese river basins during 1957–2013 and links to sea surface temperature. J. Hydrol. 2016, 536, 208–221. [Google Scholar] [CrossRef]
  26. Zhang, R.; Sumi, A.; Kimoto, M. A diagnostic study of the impact of El Niño on the precipitation in China. Adv. Atmos. Sci. 1999, 16, 229–241. [Google Scholar] [CrossRef]
  27. Zhang, R.; Min, Q.; Su, J. Impact of El Nino on atmospheric circulations over East Asia and rainfall in China: Role of the anomalous western North Pacific anticyclone. Sci. China Earth Sci. 2017, 60, 1124–1132. [Google Scholar] [CrossRef]
  28. Ashok, K.; Tam, C.Y.; Lee, W.J. ENSO Modoki impact on the Southern Hemisphere storm track activity during extended austral winter. Geophys. Res. Lett. 2009, 36. [Google Scholar] [CrossRef]
  29. Zhang, Q.; Wang, Y.; Singh, V.P.; Gu, X.; Kong, D.; Xiao, M. Impacts of ENSO and ENSO Modoki+ A regimes on seasonal precipitation variations and possible underlying causes in the Huai River basin, China. J. Hydrol. 2016, 533, 308–319. [Google Scholar] [CrossRef]
  30. Deng, S.; Chen, T.; Yang, N.; Qu, L.; Li, M.; Chen, D. Spatial and temporal distribution of rainfall and drought characteristics across the Pearl River basin. Sci. Total Environ. 2018, 619, 28–41. [Google Scholar] [CrossRef] [PubMed]
  31. Meyers, G.; McIntosh, P.; Pigot, L.; Pook, M. The years of El Niño, La Niña, and interactions with the tropical Indian Ocean. J. Clim. 2007, 20, 2872–2880. [Google Scholar] [CrossRef]
  32. Chang, X.; Wang, B.; Yan, Y.; Hao, Y.; Zhang, M. Characterizing effects of monsoons and climate teleconnections on precipitation in China using wavelet coherence and global coherence. Clim. Dyn. 2019, 52, 5213–5228. [Google Scholar] [CrossRef]
  33. Jia, X.; Ge, J. Interdecadal changes in the relationship between ENSO, EAWM, and the wintertime precipitation over China at the end of the twentieth century. J. Clim. 2017, 30, 1923–1937. [Google Scholar] [CrossRef]
  34. Ouyang, R.; Liu, W.; Fu, G.; Liu, C.; Hu, L.; Wang, H. Linkages between ENSO/PDO signals and precipitation, streamflow in China during the last 100 years. Hydrology 2014, 18, 3651–3661. [Google Scholar] [CrossRef]
  35. Ye, H.; Lu, R. Subseasonal variation in ENSO-related East Asian rainfall anomalies during summer and its role in weakening the relationship between the ENSO and summer rainfall in eastern China since the late 1970s. J. Clim. 2011, 24, 2271–2284. [Google Scholar] [CrossRef]
  36. Xiao, M.; Zhang, Q.; Singh, V.P. Influences of ENSO, NAO, IOD and PDO on seasonal precipitation regimes in the Yangtze River basin, China. Int. J. Climatol. 2015, 35, 3556–3567. [Google Scholar] [CrossRef]
  37. Qiu, Y.; Cai, W.; Guo, X.; Ng, B. The asymmetric influence of the positive and negative IOD events on China’s rainfall. Sci. Rep. 2014, 4, 4943. [Google Scholar] [CrossRef] [PubMed]
  38. Ham, Y.-G.; Choi, J.-Y.; Kug, J.-S. The weakening of the ENSO–Indian Ocean Dipole (IOD) coupling strength in recent decades. Clim. Dyn. 2017, 49, 249–261. [Google Scholar] [CrossRef]
  39. Dong, L.; Leung, L.R.; Lu, J.; Gao, Y. Contributions of extreme and non-extreme precipitation to California precipitation seasonality changes under warming. Geophys. Res. Lett. 2019, 46, 13470–13478. [Google Scholar] [CrossRef]
  40. Hu, S.; Zhou, T.; Wu, B. Impact of developing ENSO on Tibetan Plateau summer rainfall. J. Clim. 2021, 34, 3385–3400. [Google Scholar] [CrossRef]
  41. Lu, B.; Li, H.; Wu, J.; Zhang, T.; Liu, J.; Liu, B.; Chen, Y.; Baishan, J. Impact of El Niño and Southern Oscillation on the summer precipitation over Northwest China. Atmos. Sci. Lett. 2019, 20, e928. [Google Scholar] [CrossRef]
  42. Lv, A.; Qu, B.; Jia, S.; Zhu, W. Influence of three phases of El Niño–Southern Oscillation on daily precipitation regimes in China. Hydrology 2019, 23, 883–896. [Google Scholar] [CrossRef]
  43. Ma, F.; Ye, A.; You, J.; Duan, Q. 2015–2016 floods and droughts in China, and its response to the strong El Niño. Sci. Total Environ. 2018, 627, 1473–1484. [Google Scholar] [CrossRef] [PubMed]
  44. Sun, Q.; Miao, C.; Duan, Q. Changes in the spatial heterogeneity and annual distribution of observed precipitation across China. J. Clim. 2017, 30, 9399–9416. [Google Scholar] [CrossRef]
  45. Gu, X.; Jamshidi, S.; Sun, H.; Niyogi, D. Identifying multivariate controls of soil moisture variations using multiple wavelet coherence in the US Midwest. J. Hydrol. 2021, 602, 126755. [Google Scholar] [CrossRef]
  46. Hu, W.; Si, B.C.; Biswas, A.; Chau, H.W. Temporally stable patterns but seasonal dependent controls of soil water content: Evidence from wavelet analyses. Hydrol. Process. 2017, 31, 3697–3707. [Google Scholar] [CrossRef]
  47. Zhao, R.; Biswas, A.; Zhou, Y.; Zhou, Y.; Shi, Z.; Li, H. Identifying localized and scale-specific multivariate controls of soil organic matter variations using multiple wavelet coherence. Sci. Total Environ. 2018, 643, 548–558. [Google Scholar] [CrossRef]
  48. Nalley, D.; Adamowski, J.; Biswas, A.; Gharabaghi, B.; Hu, W. A multiscale and multivariate analysis of precipitation and streamflow variability in relation to ENSO, NAO and PDO. J. Hydrol. 2019, 574, 288–307. [Google Scholar] [CrossRef]
  49. Song, X.; Chen, H.; Chen, T.; Qin, Z.; Chen, S.; Yang, N.; Deng, S. GRACE-based groundwater drought in the Indochina Peninsula during 1979–2020: Changing properties and possible teleconnection mechanisms. Sci. Total Environ. 2024, 908, 168423. [Google Scholar] [CrossRef] [PubMed]
  50. Yihui, D.; Zunya, W.; Physics, A. A study of rainy seasons in China. Meteorology 2008, 100, 121–138. [Google Scholar] [CrossRef]
  51. Zhang, R. Changes in East Asian summer monsoon and summer rainfall over eastern China during recent decades. Sci. Bull. 2015, 60, 1222–1224. [Google Scholar] [CrossRef]
  52. Dong, J.; Wu, L.; Zeng, W.; Xiao, X.; He, J. Analysis of spatial-temporal trends and causes of vapor pressure deficit in China from 1961 to 2020. Atmos. Res. 2024, 299, 107199. [Google Scholar] [CrossRef]
  53. Harris, I.; Osborn, T.J.; Jones, P.; Lister, D. Version 4 of the CRU TS monthly high-resolution gridded multivariate climate dataset. Sci. Data 2020, 7, 109. [Google Scholar] [CrossRef] [PubMed]
  54. Hersbach, H.; Bell, B.; Berrisford, P.; Hirahara, S.; Horányi, A.; Muñoz-Sabater, J.; Nicolas, J.; Peubey, C.; Radu, R.; Schepers, D. The ERA5 global reanalysis. Q. J. R. Meteorol. Soc. 2020, 146, 1999–2049. [Google Scholar] [CrossRef]
  55. Abatzoglou, J.T.; Dobrowski, S.Z.; Parks, S.A.; Hegewisch, K.C. TerraClimate, a high-resolution global dataset of monthly climate and climatic water balance from 1958–2015. Sci. Data 2018, 5, 170191. [Google Scholar] [CrossRef] [PubMed]
  56. Wu, J.; Gao, X.; Giorgi, F.; Chen, D. Changes of effective temperature and cold/hot days in late decades over China based on a high resolution gridded observation dataset. Int. J. Climatol. 2017, 37, 788–800. [Google Scholar] [CrossRef]
  57. Funk, C.; Peterson, P.; Landsfeld, M.; Pedreros, D.; Verdin, J.; Shukla, S.; Husak, G.; Rowland, J.; Harrison, L.; Hoell, A. The climate hazards infrared precipitation with stations—A new environmental record for monitoring extremes. Sci. Data 2015, 2, 150066. [Google Scholar] [CrossRef] [PubMed]
  58. Saji, N.; Goswami, B.N.; Vinayachandran, P.; Yamagata, T. A dipole mode in the tropical Indian Ocean. Nature 1999, 401, 360–363. [Google Scholar] [CrossRef]
  59. Wang, H.; He, S. Weakening relationship between East Asian winter monsoon and ENSO after mid-1970s. Chin. Sci. Bull. 2012, 57, 3535–3540. [Google Scholar] [CrossRef]
  60. Ashok, K.; Yamagata, T. The El Niño with a difference. Nature 2009, 461, 481–484. [Google Scholar] [CrossRef]
  61. Chen, X.; Wang, S.; Hu, Z.; Zhou, Q.; Hu, Q. Spatiotemporal characteristics of seasonal precipitation and their relationships with ENSO in Central Asia during 1901–2013. J. Geogr. Sci. 2018, 28, 1341–1368. [Google Scholar] [CrossRef]
  62. Beck, H.E.; Van Dijk, A.I.; Miralles, D.G.; De Jeu, R.A.; Bruijnzeel, L.; McVicar, T.R.; Schellekens, J. Global patterns in base flow index and recession based on streamflow observations from 3394 catchments. Water Resour. Res. 2013, 49, 7843–7863. [Google Scholar] [CrossRef]
  63. Fatichi, S.; Ivanov, V.Y.; Caporali, E. Investigating interannual variability of precipitation at the global scale: Is there a connection with seasonality? J. Clim. 2012, 25, 5512–5523. [Google Scholar] [CrossRef]
  64. Fu, J.; Wang, W. On the lower bound of Budyko curve: The influence of precipitation seasonality. J. Hydrol. 2019, 570, 292–303. [Google Scholar] [CrossRef]
  65. Tan, X.; Wu, Y.; Liu, B.; Chen, S. Inconsistent changes in global precipitation seasonality in seven precipitation datasets. Clim. Dyn. 2020, 54, 3091–3108. [Google Scholar] [CrossRef]
  66. Pascale, S.; Lucarini, V.; Feng, X.; Porporato, A.; Hasson, S.U. Analysis of rainfall seasonality from observations and climate models. Clim. Dyn. 2015, 44, 3281–3301. [Google Scholar] [CrossRef]
  67. Huang, S.; Huang, Q.; Chang, J.; Zhu, Y.; Leng, G.; Xing, L. Drought structure based on a nonparametric multivariate standardized drought index across the Yellow River basin, China. J. Hydrol. 2015, 530, 127–136. [Google Scholar] [CrossRef]
  68. Sen, P.K. Estimates of the regression coefficient based on Kendall’s tau. J. Am. Stat. Assoc. 1968, 63, 1379–1389. [Google Scholar] [CrossRef]
  69. Basso, B.; Martinez-Feria, R.A.; Rill, L.; Ritchie, J.T. Contrasting long-term temperature trends reveal minor changes in projected potential evapotranspiration in the US Midwest. Nat. Commun. 2021, 12, 1476. [Google Scholar] [CrossRef] [PubMed]
  70. Berner, L.T.; Massey, R.; Jantz, P.; Forbes, B.C.; Macias-Fauria, M.; Myers-Smith, I.; Kumpula, T.; Gauthier, G.; Andreu-Hayles, L.; Gaglioti, B.V. Summer warming explains widespread but not uniform greening in the Arctic tundra biome. Nat. Commun. 2020, 11, 4621. [Google Scholar] [CrossRef] [PubMed]
  71. Perkins-Kirkpatrick, S.; Lewis, S. Increasing trends in regional heatwaves. Nat. Commun. 2020, 11, 3357. [Google Scholar] [CrossRef] [PubMed]
  72. Jiang, S.; Wang, K.; Mao, Y. Rapid local urbanization around most meteorological stations explains the observed daily asymmetric warming rates across China from 1985 to 2017. J. Clim. 2020, 33, 9045–9061. [Google Scholar] [CrossRef]
  73. Mann, H.B. Nonparametric tests against trend. Econom. J. Econom. Soc. 1945, 13, 245–259. [Google Scholar] [CrossRef]
  74. Tedeschi, R.G.; Cavalcanti, I.F.; Grimm, A.M. Influences of two types of ENSO on South American precipitation. Int. J. Climatol. 2013, 33, 1382–1400. [Google Scholar] [CrossRef]
  75. Li, Y.; Qin, Y.; Ma, L.; Pan, Z. Climate change: Vegetation and phenological phase dynamics. Int. J. Clim. Chang. Strateg. Manag. 2020, 12, 495–509. [Google Scholar] [CrossRef]
  76. Grinsted, A.; Moore, J.C.; Jevrejeva, S. Application of the cross wavelet transform and wavelet coherence to geophysical time series. Nonlinear Process. Geophys. 2004, 11, 561–566. [Google Scholar] [CrossRef]
  77. Hu, W.; Si, B.C. Multiple wavelet coherence for untangling scale-specific and localized multivariate relationships in geosciences. Hydrology 2016, 20, 3183–3191. [Google Scholar] [CrossRef]
  78. Gao, T.; Wang, H.J.; Zhou, T. Changes of extreme precipitation and nonlinear influence of climate variables over monsoon region in China. Atmos. Res. 2017, 197, 379–389. [Google Scholar] [CrossRef]
  79. Zheng, J.; Bian, J.J.; Ge, Q.; Hao, Z.; Yin, Y.; Liao, Y. The climate regionalization in China for 1981–2010. Chin. Sci. Bull. 2013, 58, 3088–3099. [Google Scholar]
  80. Ren, Z.; Zhang, M.; Wang, S.; Qiang, F.; Zhu, X.; Dong, L. Changes in daily extreme precipitation events in South China from 1961 to 2011. J. Geogr. Sci. 2015, 25, 58–68. [Google Scholar] [CrossRef]
  81. Zhang, A.; Zhao, X. Changes of precipitation pattern in China: 1961–2010. Theoretical 2022, 148, 1005–1019. [Google Scholar] [CrossRef]
  82. Wang, W.; Shao, Q.; Peng, S.; Zhang, Z.; Xing, W.; An, G.; Yong, B. Spatial and temporal characteristics of changes in precipitation during 1957–2007 in the Haihe River basin, China. Stoch. Environ. Res. Risk Assess. 2011, 25, 881–895. [Google Scholar] [CrossRef]
  83. Li FengPing, L.F.; Zhang GuangXin, Z.G.; Xu, Y. Spatiotemporal variability of climate and streamflow in the Songhua River Basin, northeast China. J. Hydrol. 2014, 514, 53–64. [Google Scholar]
  84. Duan, W.; Zou, S.; Christidis, N.; Schaller, N.; Chen, Y.; Sahu, N.; Li, Z.; Fang, G.; Zhou, B. Changes in temporal inequality of precipitation extremes over China due to anthropogenic forcings. npj Clim. Atmos. Sci. 2022, 5, 33. [Google Scholar] [CrossRef]
  85. Zhang, Y.; Zhou, W.; Wang, X.; Wang, X.; Zhang, R.; Li, Y.; Gan, J. IOD, ENSO, and seasonal precipitation variation over Eastern China. Atmos. Res. 2022, 270, 106042. [Google Scholar] [CrossRef]
  86. Zhou, L.T.; Wu, R. Respective impacts of the East Asian winter monsoon and ENSO on winter rainfall in China. J. Geophys. Res. Atmos. 2010, 115. [Google Scholar] [CrossRef]
  87. Liu, J.; Wang, H.; Lu, E.; Kumar, A. Decadal modulation of East China winter precipitation by ENSO. Clim. Dyn. 2019, 52, 7209–7223. [Google Scholar] [CrossRef]
Figure 1. Sketch of the study area.
Water 17 00522 g001
Figure 2. The technical flowchart of research methods [1].
Water 17 00522 g002
Figure 3. The climatology of monthly rainfall (a) and seasonality indices (bd) in eastern China monsoon region during 1981 to 2022.
Water 17 00522 g003
Figure 4. Spatial trends and time series of seasonality index (a,b), rainfall concentration (c,d), and rainfall magnitude (e,f) in eastern China monsoon region during 1981–2022. Stippling areas indicate trend significant at 95% confidence level. Pie charts show the proportions of areas with positive and negative trends in whole eastern China monsoon region. The gray, purple, blue, violet–red, and red numbers indicate the trends of seasonality indices in different eastern China monsoon regions. The shadings represent the 5–95% range from the observation datasets.
Water 17 00522 g004
Figure 5. Spatial distributions of seasonality index anomalies in eastern China monsoon region during warm (ac) and cold (df) phases of global climate events. (g) and (h) show seasonality index anomalies (×10−3) in different eastern China monsoon regions.
Water 17 00522 g005
Figure 6. Monthly anomaly of the vertical divergence in cold and warm phase of ENSO from 1981 to 2022. The vector arrows and direction indicate water vapor flux anomalies. The negative (positive) divergence values indicate moisture convergence (divergence).
Water 17 00522 g006
Figure 7. Spatial distributions of partial correlations between (ac) DMI, Niño3.4, and EMI and seasonality index in eastern China monsoon region. (d) presents the spatial average correlation coefficients in different eastern China monsoon regions.
Water 17 00522 g007
Figure 8. The bivariate wavelet coherence of the global climate events and seasonality index in NEC (ac), NC (df), CC (gi), and SC (jl) monsoon regions.
Water 17 00522 g008
Figure 9. Consistency between global climate events and seasonality index in four different eastern China monsoon regions.
Water 17 00522 g009
Figure 10. Multivariate wavelet coherence between global climate events and seasonality index in NEC (ad), NC (eh), CC (il), and SC (mp) monsoon regions.
Water 17 00522 g010
Disclaimer/Publisher’s Note: The statements, opinions and data contained in all publications are solely those of the individual author(s) and contributor(s) and not of MDPI and/or the editor(s). MDPI and/or the editor(s) disclaim responsibility for any injury to people or property resulting from any ideas, methods, instructions or products referred to in the content.

