Article

Hydrological Response of the Irrawaddy River Under Climate Change Based on CV-LSTM Model

1
Asian International Rivers Centre, Yunnan University, Kunming 650091, China
2
Huaneng Lancang River Hydropower Inc., Kunming 650500, China
3
Yunnan Key Laboratory of International Rivers and Transboundary Eco-Security, Kunming 650500, China
*
Author to whom correspondence should be addressed.
These authors contributed equally to this work.
Water 2025, 17(4), 479; https://doi.org/10.3390/w17040479
Submission received: 20 December 2024 / Revised: 27 January 2025 / Accepted: 7 February 2025 / Published: 8 February 2025
(This article belongs to the Special Issue Impact of Climate Change on Water and Soil Erosion)

Abstract

:
Climate change is impacting hydrological conditions in the Dulongjiang-Irrawaddy River basin. This study employs a CV-LSTM model to evaluate the hydrological responses of precipitation, temperature, and runoff under various climate change scenarios. The findings indicate the following: (1) The CV-LSTM model performed excellently in simulating hydrological processes at the Pyay station. (2) From 2025 to 2100, precipitation in the Dulongjiang-Irrawaddy River basin is projected to increase, becoming more concentrated during the rainy season, with a more uneven annual distribution compared to the baseline period (1996–2010). The average temperature is also expected to rise, with an increase of 1.57 °C under the SSP245 scenario and 2.26 °C under the SSP585 scenario compared to the baseline period (1996–2010). (3) Multi-year average flow projections from three GCM models indicate changes of −1.1% to 20.6% under SSP245 and 7.8% to 31.5% under SSP585, relative to the baseline period (1996–2010). (4) Runoff will become more concentrated during the flood season, with greater annual variability, increasing the risks of flooding and drought.

1. Introduction

Global climate change is one of the greatest challenges facing this century, and active international cooperation to address climate change has become a global consensus [1]. Relative to the 1986–2005 period, the global mean surface temperature is projected to increase by 0.3–0.7 °C (medium confidence) during the 2016–2035 period, whereas extreme precipitation and heatwaves over the tropical and mid-latitudes are projected to be more severe and frequent [2]. As global climate change intensifies, transboundary water resource management has emerged as a pressing issue for the international community. This challenge is particularly acute in developing countries, where climate change may amplify competition and conflicts over water resources, posing significant risks to global water security. Hydrological modeling, which enables the identification and prediction of water resource changes under various climate change scenarios, is a crucial tool for advancing effective global water resource management.
According to the Global Climate Risk Index (CRI), Myanmar is one of the countries with the highest risk of meteorological disasters in the world [3]. As the largest river in Myanmar, the Dulongjiang-Irrawaddy River basin covers about 60% of Myanmar’s territory, and most of the important city clusters in Myanmar are distributed within the basin. Changes in Dulongjiang-Irrawaddy River basin hydrological processes driven by climate change may have an impact on sustainable socioeconomic development in Myanmar [2]. In addition, the Dulongjiang-Irrawaddy River basin is an important agricultural planting area in Southeast Asia, especially its delta area; the rice planting area accounts for about 50% of the national rice planting area in Myanmar. However, limited by Myanmar’s socioeconomic level, the development of water resources in the basin is low, and the agricultural production in this area is basically based on rain-fed agriculture [4]. Climate change is closely related to water resource utilization and agricultural development in the region. However, there are few studies on hydrological response to climate change in the Dulongjiang-Irrawaddy River basin so far.
In addition, for large cross-border river basins such as the Dulongjiang-Irrawaddy River basin, climate change will aggravate the risk of water security of international rivers to a certain extent, and the prediction of hydrological process changes under climate change has gradually become an important prerequisite for scientific regulation of cross-border water resources in the future [5]. Under the increasingly prominent trend of climate change, the hydrological process of cross-border basins presents variability and vulnerability, and quantifications of hydrological processes and their responses to global changes are essential for maintaining global water security. However, international rivers break through the rigid constraints of national borders, resulting in extremely sensitive cross-border water issues. At the same time, due to the scarcity and confidentiality of international river observation data, it is extremely difficult to analyze the hydrological process changes in cross-border basins with existing observation data.
Within this context, the simulation of hydrological processes based on open-source information has gradually become an important approach to characterize changes to hydrological processes in cross-border basins. Binh et al. [6] utilized the SWAT model to quantify the impacts of anthropogenic and natural driving factors on future changes in water flow and sediment in the tropical Sai Gon-Dong Nai River basin; their study effectively identified future variations in water flow and sediment resulting from the combined effects of climate change and reservoir operations. However, process-driven hydrological models have a complex model structure and strict input data requirements, thereby complicating the integration of open-source data into these models and leading to a large number of model parameters requiring calibration during model construction. In contrast, data-driven models usually achieve higher performance for regions with relatively scarce measurement data, although they do not provide detailed descriptions of physical processes [7,8,9]. Deng et al. [10] developed four LSTM-based models to evaluate the hydrological responses of the Ganjiang River basin under future climate change across four shared socioeconomic pathways. The results indicated greater seasonal uncertainty in the basin’s future hydrological conditions and an increased likelihood of extreme events. Madhavi et al. [11] proposed an enhanced deep learning approach using remote sensing data to predict climate change; this method evaluated various climate variables, such as temperature, precipitation, and CO levels, achieving high accuracy, and the study highlighted the potential of advanced deep learning techniques in improving the accuracy of climate change predictions. Kedam et al. [12] applied a set of machine learning models to simulate runoff in the Narmada River basin; their findings underscored the critical role that machine learning can play in enhancing hydrological forecasting to support sustainable basin management. Although traditional data-driven hydrological models can utilize more diverse open-source data for runoff simulation, it is difficult to fully consider the heterogeneity of spatial information in large cross-border basins, which may limit the improvement of simulation accuracy.
Compared to traditional data-driven models, the CV-LSTM model is a novel approach that combines computer vision technology with a long short-term memory (LSTM) neural network to analyze the spatial distribution of input data for hydrological simulations. Yuan et al. [13] compared the simulation accuracy of the CV-LSTM model with traditional hydrological models, such as CNN and LSTM, in simulating runoff in the Mekong River basin. The results demonstrated that the CV-LSTM model outperformed the other two models. This method is considered to have promising application potential in transboundary river basins with limited observational data. Therefore, this study employs the CV-LSTM model to predict the daily hydrological processes of the Dulongjiang-Irrawaddy River basin under future climate change scenarios, examining its future climate characteristics and hydrological responses. The focus is on climate-driven interannual variations, intra-annual changes, and extreme runoff fluctuations, providing a foundation for water resource management. The findings of this study offer valuable insights for integrated water resource management, rice cultivation, and water security monitoring under climate change within the Dulongjiang-Irrawaddy River basin.

2. Materials and Methods
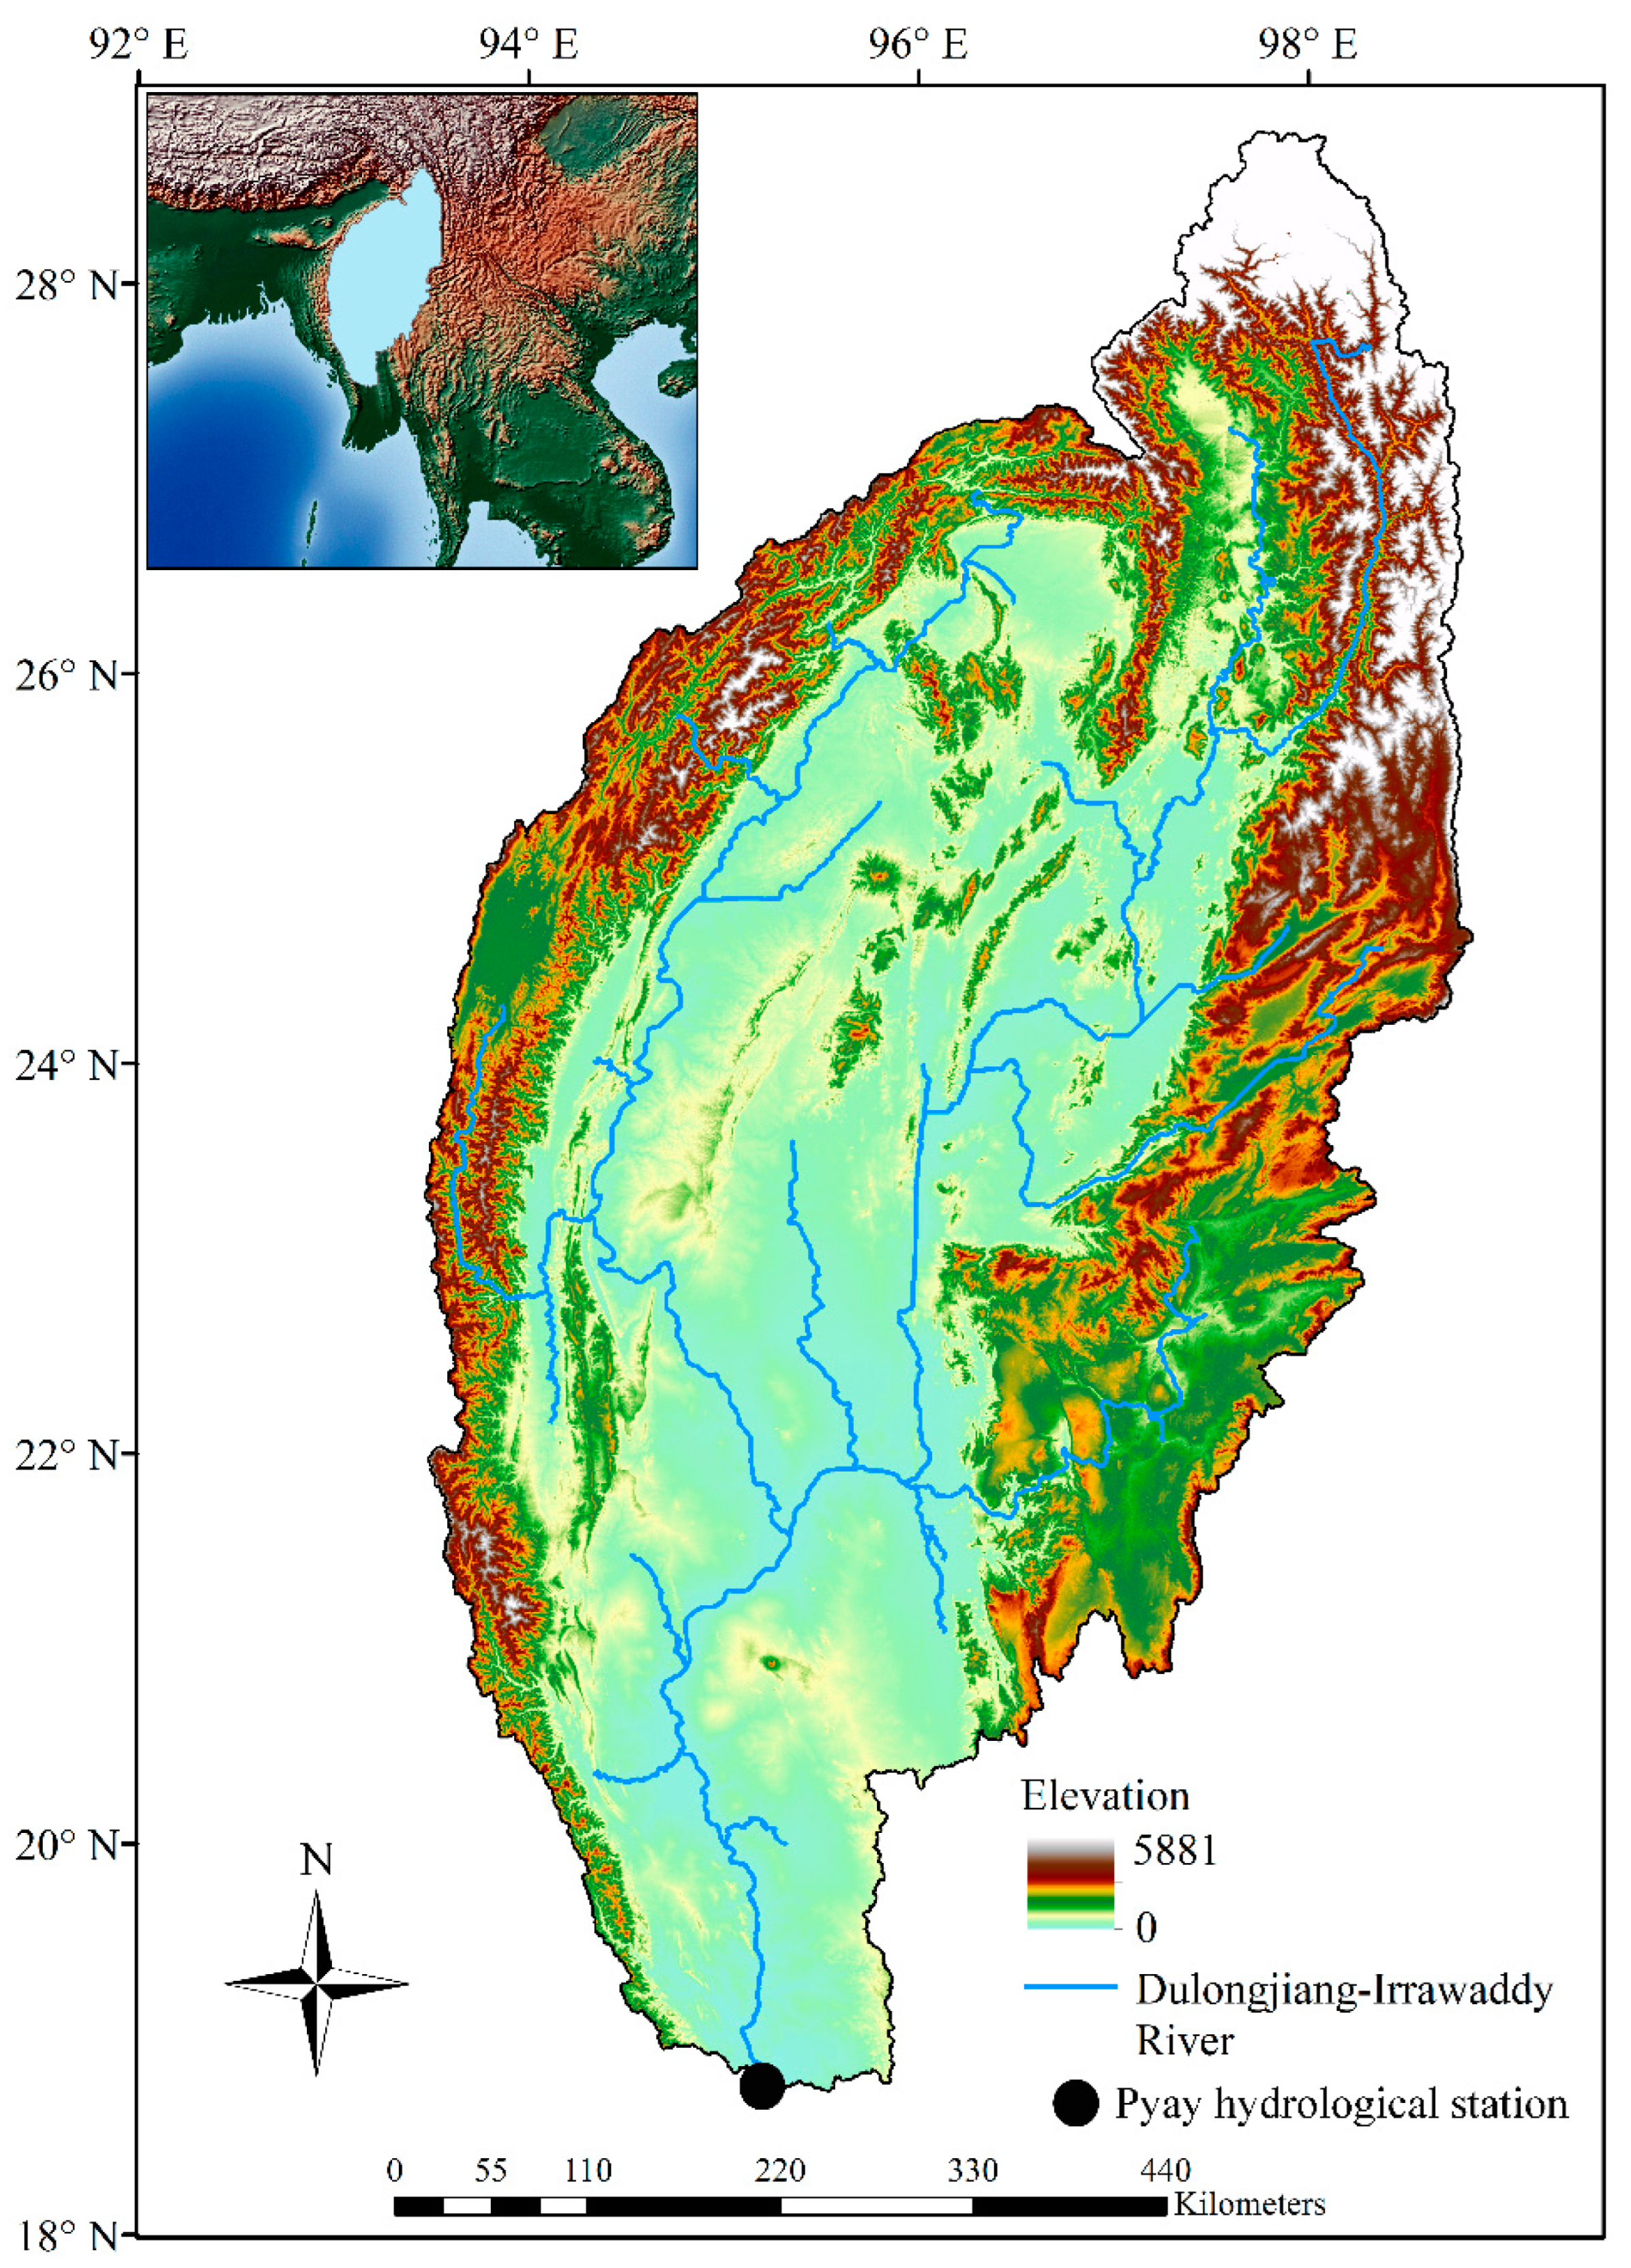
2.1. Study Area

The Dulongjiang-Irrawaddy River (Figure 1), which flows through China, Myanmar, and India, is a typical international river and one of the major tropical river systems in the world [14]. The mainstream spans a length of 2714 km and the total catchment area of the basin is 431,000 km2. The mean annual runoff of the Dulongjiang-Irrawaddy River basin is 4.8 × 10¹¹ m3. The Dulongjiang-Irrawaddy River basin has a variety of topographic and geomorphic features, with great relief changes. The north, east, and west of the basin are all mountains and plateaus, while the central and southern parts of the basin are dominated by plains. The Dulongjiang-Irrawaddy River basin belongs to the subtropical and tropical rainforest climate zone. The average annual temperature in the basin ranges from 19 °C to 31 °C, with the lowest temperature in January and the highest temperature in April. There is abundant precipitation in the basin, with the annual average precipitation changing sharply from 500 mm to 4000 mm, showing the spatial distribution characteristics of more precipitation in the northern mountains and southern coastal areas, and less precipitation in the plateau area in the middle of the basin.

2.2. Data Collection

In this study, the daily streamflow time series of the Pyay hydrological station covering 1984–2016 were obtained from the Global Runoff Data Centre (GRDC) (https://portal.grdc.bafg.de) (accessed on 7 January 2024). The meteorological and ecological data including precipitation, average temperature, and leaf area index were obtained from open-source remote sensing data products (Table 1).
In this study, the GCMs output data of CMIP6 were used to investigate climate change scenarios in the Dulongjiang-Irrawaddy River basin. CMIP6 is a global climate coupling model established by the World Climate Research Program (WCRP) Working Group on Coupled Modelling (WGCM) (https://esgf-node.llnl.gov/search/cmip6) (accessed on 7 January 2024). By referring to the accuracy evaluation of CMIP6 model in Southeast Asia by Supharatid et al. [15] and Zafar et al. [16], three models, EC-Earth3, MPI-ESM1-2-LR, and NorESM2-LM, which have good reliability in the Dulongjiang-Irrawaddy River basin, were selected for climate change scenario construction (Table 2).
Additionally, as a developing country, Myanmar is assumed to adopt moderate climate policies and economic growth measures under the SSP245 scenario, which may more accurately reflect future socioeconomic trends by striking a balance between economic development and climate action. In contrast, the SSP585 scenario assumes that, while economic development continues, insufficient climate change mitigation efforts lead to a sharp increase in greenhouse gas emissions, particularly in the absence of effective climate management. The selection of these two pathways provides a comprehensive basis for assessing the potential climate change impacts Myanmar may face under different socioeconomic scenarios, offering valuable insights for future climate adaptation policies and regional planning. To establish climate change scenarios from 2025 to 2100, this study uses three types of forecast data—precipitation, average temperature, and leaf area index—corresponding to the SSP245 (middle-of-the-road development) and SSP585 (fossil fuel-driven development) socioeconomic development pathways, which are commonly used in the aforementioned models.

2.3. Methods

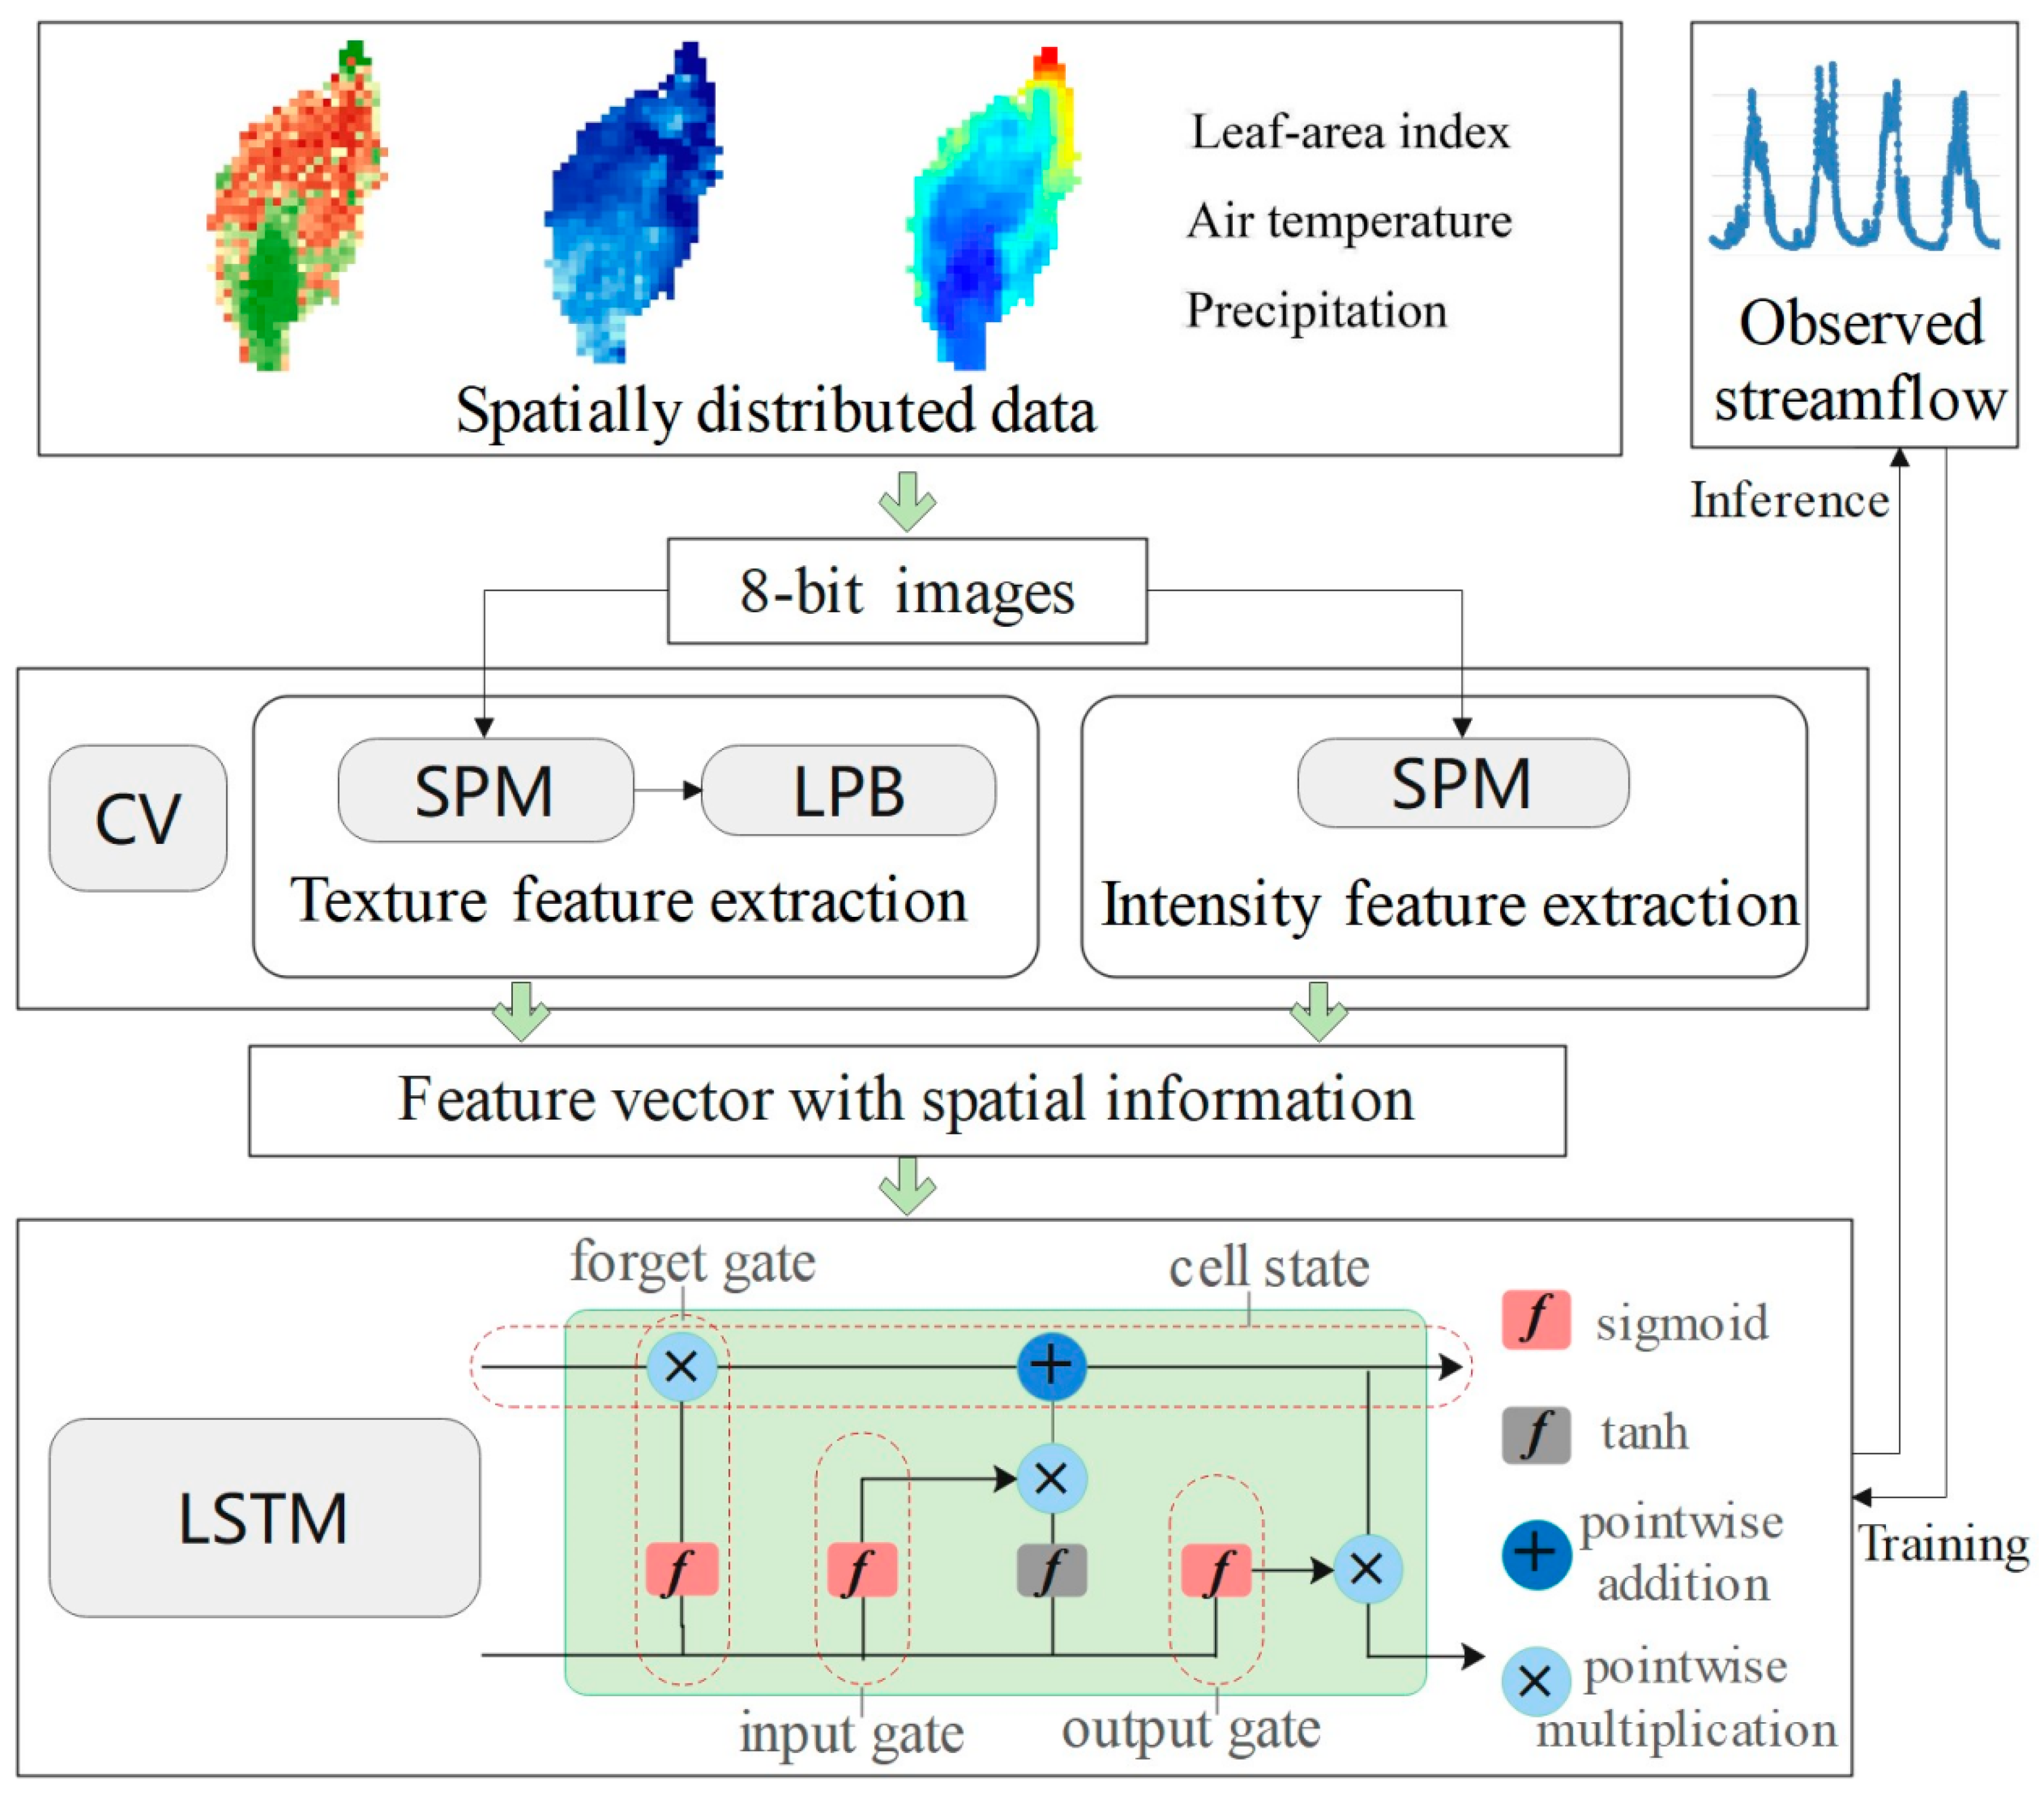
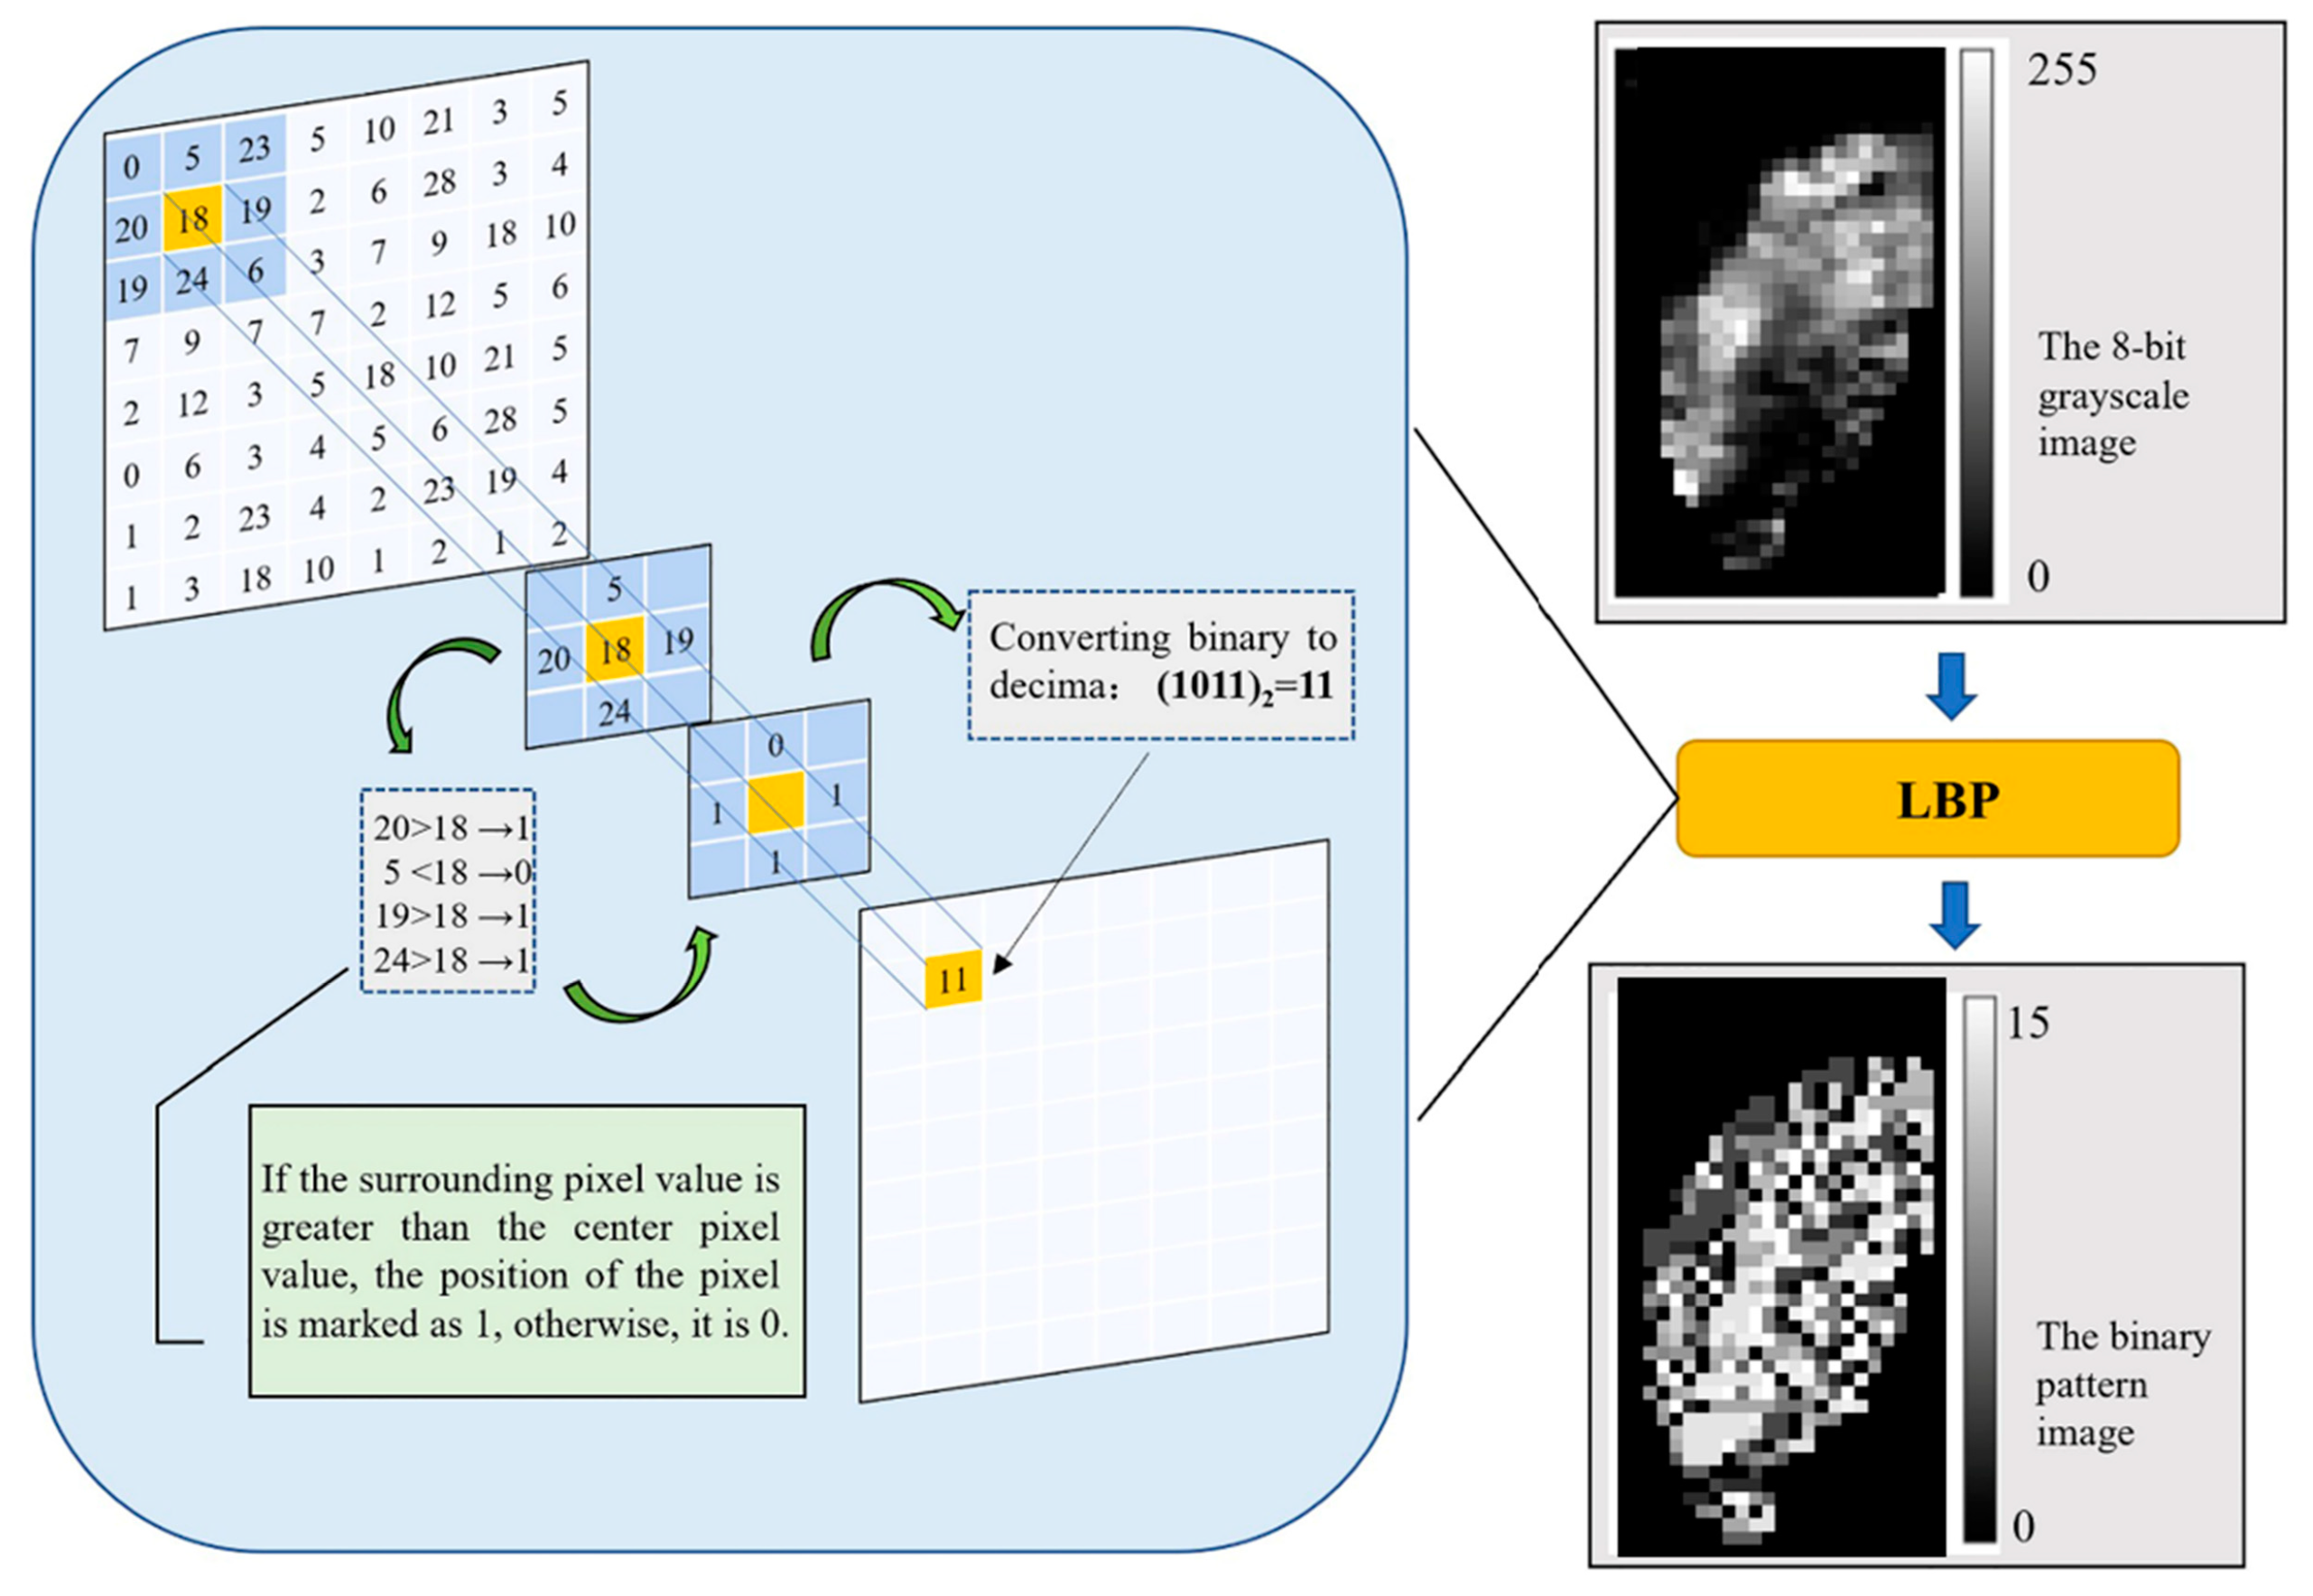
2.3.1. The CV-LSTM Model

In this study, the CV-LSTM model was constructed to simulate the daily streamflow of the Dulongjiang-Irrawaddy River basin and was used to predict the runoff response under climate change. CV-LSTM is a grid-based data-driven hydrological model that combines computer vision (CV) with an LSTM neural network, as illustrated in Figure 2. In the computer vision module, two image extraction methods, the spatial pyramid matching strategy (SPM) and local binary pattern (LBP), are used to extract and describe the spatial distribution characteristics of input data. The LSTM module is used to train the model.
In the CV-LSTM model framework, all open-source remote sensing data products were converted into grayscale images (8-bit) to improve the efficiency of model operation. Under the processing of the CV module of CV-LSTM, the grayscale images of various meteorological ecological data are extracted to texture features and intensity features, which can make the LSTM network better understand the spatial distribution characteristics of hydrological processes in the basin [13]. After extraction by the CV module, the future vector with spatially distributed data were transformed into feature vectors with spatial information. Then, these feature vectors, along with the observed streamflow time series, were loaded into the LSTM for training. The trained CV-LSTM can be used to predict changes in hydrological processes under future climate change.
Computer vision is an artificial intelligence technique that enables machines to understand images by analyzing the various features contained in digital signals. In data-driven hydrological simulation, intensity features (grayscale images signal intensity) are usually used to reflect the value of input data in each sub-region of the basin, and texture features are usually used to reflect the spatial distribution of signal intensity between different sub-regions. In this study, SPM and LBP are used for feature extraction. The intensity feature is extracted by SPM directly, while the texture feature is extracted by coupling SPM and LBP.
In the field of computer vision recognition, the SPM strategy is an important method of image feature extraction. The main idea of the SPM strategy is to divide the image into several sub-regions at different pyramid levels, and then extract the features of each sub-region; finally, the features of all sub-regions are joined together to form a complete feature (Figure 3). In terms of the details of the blocks, the higher the level, the more sub-regions, showing a hierarchical pyramid structure. That is, at the pyramid level ℓ (ℓ = 0, 1, …), the image is evenly divided into 22ℓ sub-regions. These extracted features of sub-regions can be represented by scalars or feature histograms. For example, in this study, the texture and intensity features were extracted from precipitation, temperature, and leaf area index remote sensing data; the intensity features were represented by the average statistical scale; and the texture features were captured using texture histograms generated by the LBP method. These spatially enriched data were then input into the LSTM module for further processing.
In the field of computer vision, LBP is one of the most popular operators for describing local texture features of images. The extraction of features using LBP involves two main steps: first, transform the original grayscale image into a binary pattern image (LBP image), and then extract the feature histogram from the LBP image. Figure 4 illustrates the transformation from an 8-bit image of the spatially distributed data in the study watershed into a binary pattern image. (1) For each pixel in the image, consider a 3 × 3 window centered on that pixel (for example, in the figure, the center pixel is colored yellow and the window is colored blue). (2) The gray values of four adjacent pixels are compared with the center pixel of the window. If the value of the surrounding pixel is greater than that of the center pixel, the position of the pixel is marked as 1, otherwise, it is 0. Starting with the middle-left pixel and moving in a clockwise direction, a 4-bit binary number (1011) can be generated. (3) By converting the binary number to a decimal number, the LBP value of the center pixel of the window can be obtained (1011→11). (4) Apply all of the above steps to each pixel in the image. An LBP image with 16 decimal values ranging from 0(0000) to 15(1111) is obtained. After completing the above processing, the number of decimal values in the generated LBP image is counted to generate the feature histogram. In practice, LBP also incorporates a “uniform pattern” to reduce vector length. The uniform pattern refers to an LBP containing up to two 1–0 and 0–1 transitions [9,17]. For example, in this study, only two 4-bit binary numbers, 0101 and 1010, are nonuniform. Finally, the nonuniform patterns (0101 and 1010) are combined into a single bin. Thus, this study derived only 15 bins in the feature histogram.
In the process of intensity feature extraction, we divided the gray image into two layers of pyramid, which are level 0 and level 1. In the above two levels, the original image is divided into a “pyramid” with 1 sub-regions and 4 sub-regions, respectively. This configuration results in intensity feature vector lengths of 5 (=(1 + 4) × 1) (where the value “1 + 4” refers to the number of sub-regions, and the value “1” refers to the feature dimension under the condition that intensity features are represented by the average statistical scale). In the process of texture feature extraction, we divide the images into three layers (total 1 + 4 + 16 sub-regions), with the texture feature vector lengths of 315 (=(1 + 4 + 16) × 15) (where the value “15” refers to the feature dimension under the condition that texture features are represented by the texture histogram). Therefore, the dimension of the vector of each driving forces data field is 320 (=5 + 315).
LSTM is a type of recurrent neural network, where the core mechanism involves the update and transfer of cell states. The cell structure consists of a “forget gate”, “input gate”, and “output gate”. These gates control the flow of information, allowing LSTM to effectively mitigate issues like vanishing and exploding gradients [18,19]. Moreover, the memory cells in LSTM are analogous to state vectors in physical process models, which makes LSTM a promising tool for simulating dynamic systems like river basins [20].

2.3.2. Model Performance Evaluation

This study evaluates the simulation accuracy using three coefficients recommended by the hydrological model evaluation guidelines [21]—Nash–Sutcliffe efficiency (Ens), percentage bias (PBIAS), and RMSE-observations standard deviation ratio (RSR)—along with the Pearson correlation coefficient (r).
r = i = 1 n ( Q o b s , i Q ¯ o b s ) ( Q s i m , i Q ¯ s i m ) i = 1 n ( Q o b s , i Q ¯ o b s ) 2 i = 1 n ( Q s i m , i Q ¯ s i m ) 2
E n s = 1 i = 1 n ( Q o b s , i Q s i m , i ) 2 i = 1 n ( Q o b s , i Q ¯ o b s ) 2
P B I A S = i = 1 n ( Q o b s . i Q s i m , i ) ( 100 ) i = 1 n ( Q o b s , i )
R S R = R M S E S T D E V o b s = i = 1 n ( Q o b s , i Q s i m , i ) 2 i = 1 n ( Q o b s , i Q ¯ o b s ) 2
where Qobs,i and Qsim,i represent the observed and simulated streamflow, respectively; Qobs is the average daily observed streamflow; and Qsim is the average daily simulated streamflow.

2.3.3. Climate Change Scenario Development Methods

A scenario refers to a description of the future development trends of a particular phenomenon. Scenario analysis differs from traditional forecasting in that its goal is not merely to predict the future, but to gain a better understanding of the uncertainties within the entire system. This approach facilitates a broad discussion of various potential situations and outcomes that may occur in the future [22]. Due to the significant uncertainty associated with climate change [22], designing and exploring climate change trends and their potential impacts based on different future change scenarios is crucial.
In constructing climate change scenarios and analyzing their hydrological responses, systematic errors are present in GCM model outputs due to differences in initial conditions, boundary conditions, and model structures across various models; this is especially pronounced at large regional scales [23]. Therefore, when constructing climate change scenarios for different basins, it is necessary to incorporate basin-specific observational data for calibration [24]. To improve the accuracy of GCM outputs at the regional scale and eliminate systematic errors, this study applies the Delta method to calibrate the predicted data for precipitation, mean temperature, and LAI. The Delta method is a straightforward approach that adjusts climate model outputs by comparing them with historical observational data. Specifically, it calculates the difference (or change) between the GCM’s historical scenario data and observed data during a baseline period. This difference is then used to correct the model’s future projections, ensuring that they are more consistent with local conditions. By doing so, the method enhances the reliability of predicted data and enables its application to regional-scale studies. The Delta method is the most commonly used technique for calibrating future climate change data [25]. In this study, the historical data period used for calibration is from 1996 to 2010. The definition of this method is as follows:
(1)
Continuous variable calibration method:
T i = ( T ¯ i T ¯ i ) + T i
where T i represents the calibrated future scenario data for the continuous variable; T ¯ i is the mean value of the historical continuous variable data; T ¯ i is the mean value of the GCM historical continuous variable data. T i denotes the GCM future scenario data for the continuous variable.
(2)
Discrete variable calibration method:
P i = P i × ( P ¯ i P ¯ i )
where P i represents the calibrated future scenario data for the discrete variable; P ¯ i is the mean value of the historical discrete variable data; P ¯ i is the mean value of the GCM historical discrete variable data. P i denotes the GCM future scenario data for the discrete variable.

2.3.4. Coefficient of Variation (Cv) and the Complete Regulation Coefficient of Runoff Distribution (Cr)

To visually represent the intra-annual distribution characteristics of runoff under climate change, this study employs the coefficient of variation (Cv) and the complete regulation coefficient of runoff distribution (Cr) for quantitative assessment. The calculation formulas are as follows:
The coefficient of variation (Cv) for intra-annual runoff distribution:
C V = σ R ¯ = 1 12 i = 1 12 ( R i R ¯ ) 2 1 12 i = 1 12 R i
The complete regulation coefficient of runoff distribution (Cr):
C r = i = 1 12 Φ i ( R i R ¯ ) i = 1 12 R i
Φ i = 0 , R i < R ¯ 1 , R i R ¯
where Ri represents the standard deviation of the monthly runoff values, and R ¯ denotes the mean monthly runoff over the year.

3. Results and Discussion

3.1. Hydrological Model Calibration and Validation

The parameters that need to be calibrated in the CV-LSTM model can be divided into three categories: computer vision parameters, neural network hyperparameters, and the input data time window.
The computer vision parameters control the intensity and texture feature extraction process, determining the overall dimensionality of the input data. These parameters include the total number of SPM layers for intensity features, the total number of SPM layers for texture features, the number of neighborhood pixels for LBP, and the extraction radius. The SPM-related parameters can be determined based on the size of the basin (the number of original pixels in the dataset) as well as the complexity of the basin’s meteorological and environmental conditions. For larger basins with more pronounced spatial differentiation in meteorology and environmental features, more detailed local feature extraction is required; thus, a higher number of SPM layers should be set. Similarly, the number of LBP neighborhood pixels and extraction radius should be adjusted according to the basic characteristics of the basin, such as size and shape. If too many SPM layers or neighborhood pixels are selected, the extracted feature dimensions may become unnecessarily redundant, whereas too few may lead to insufficient texture feature extraction. As the data resolution used in this study is 0.25° × 0.25°, the number of original data pixels within each basin is limited. Therefore, it is not advisable to set too high a total number of SPM layers or neighborhood pixel counts. Based on the parameter-setting principles mentioned above, combined with multiple numerical experiments, the optimal computer vision feature extraction parameters were determined.
For the Dulongjiang-Irrawaddy River basin, the key neural network hyperparameters involved in this study include the learning rate, the number of epochs to reduce the learning rate, the learning rate reduction factor, and the total number of training epochs. The calibration of these hyperparameters was carried out through manual tuning and supervised learning, where repeated numerical experiments were conducted, and the changes in the learning curve were observed during training to determine the optimal combination of hyperparameters. When training data-driven hydrological models for the Dulongjiang-Irrawaddy River basin, the size of the time window (the temporal span of the driving data) is a critical consideration. In large basins, there is often a lag between when precipitation enters the basin and when it contributes to runoff at the basin outlet. Therefore, when simulating runoff for a particular day, it is necessary to account for meteorological factors from several previous days, or even weeks, as model inputs. However, simply extending the input time span does not always improve simulation accuracy, as an overly long time window can introduce unnecessary data redundancy. Hence, time window calibration is needed. This calibration is especially important for rapidly changing data, such as precipitation and temperature, which have a significant impact on runoff processes. For datasets with slower changes, such as the leaf area index, the influence of the time window can be disregarded. The time window calibration process involves inputting driving data with different time spans into the neural network model and determining the optimal time window based on the final simulation error and model performance.
The hydrological model was parameterized and calibrated at the Pyay hydrological station in the Dulongjiang-Irrawaddy River basin. After calibration and validation, the accuracy parameters of the CV-LSTM model were obtained. Figure 5 and Table 3 show the daily hydrological process simulation results at the Pyay station in the Dulongjiang-Irrawaddy River basin, based on the CV-LSTM model. In terms of model fit, the simulated and observed flow hydrographs at the Pyay station are largely consistent, with the simulated flow adequately capturing the actual runoff process.

3.2. Future Climate Change Trends in the Dulongjiang-Irrawaddy River Basin

In this study, using 1996–2010 as the baseline period, we explore the future climate change trends (2025–2100) in the Dulongjiang-Irrawaddy River basin based on the calibrated EC-Earth3, MPI-ESM1-2-LR, and NorESM2-LM GCM climate models. This investigation focuses on the overall changes in precipitation and mean temperature under the SSP2-4.5 scenario (moderate-forcing scenario) and SSP5-8.5 scenario (high-forcing scenario).

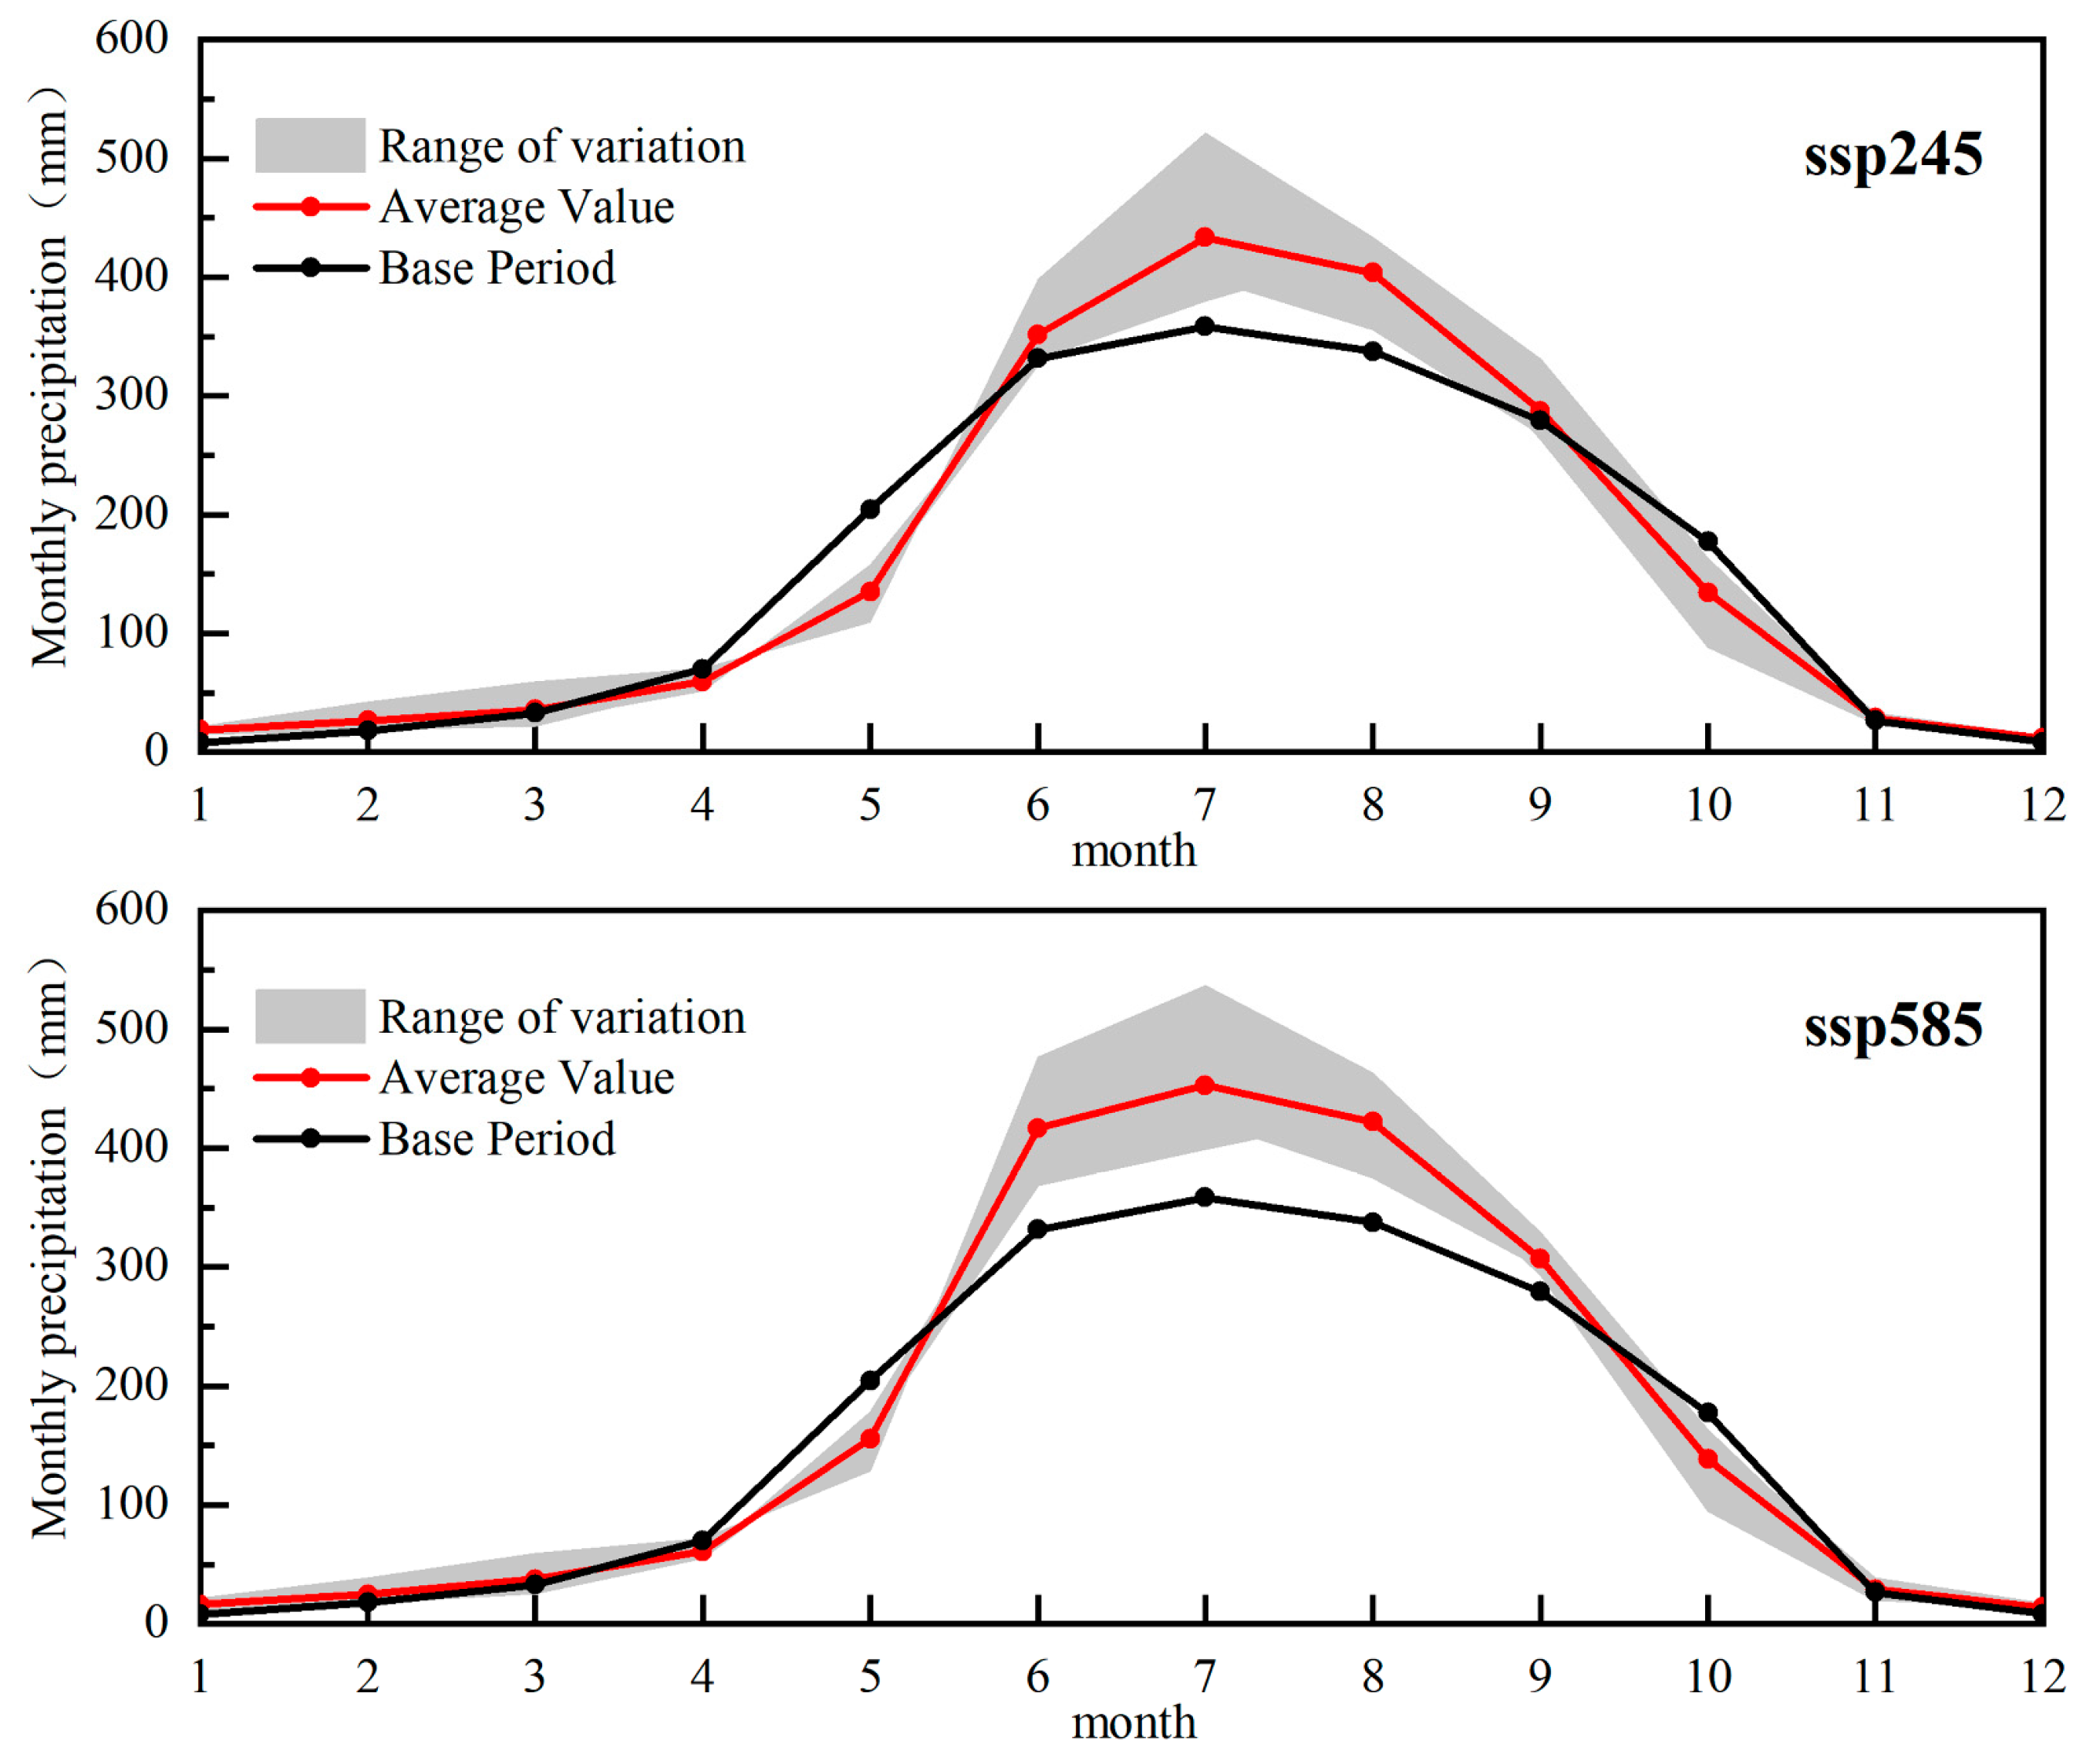
3.2.1. Future Precipitation Change Trends

Figure 6 and Table 4 show the changes in annual precipitation from 2025 to 2100 relative to the baseline period (1996–2010). Under both the SSP2-4.5 and SSP5-8.5 scenarios, precipitation in the Dulongjiang-Irrawaddy River basin is projected to exhibit a fluctuating upward trend. The moderate-forcing scenario (SSP2-4.5) shows a more gradual increase in annual precipitation, while the high-forcing scenario (SSP5-8.5) indicates a more pronounced upward trend.
Under the SSP2-4.5 scenario, the average annual precipitation in the Dulongjiang-Irrawaddy River basin is projected to increase by 5.5% compared to the baseline period (1996–2010). In contrast, under the SSP5-8.5 scenario, the increase is projected to be 12%. By the end of the 21st century (2076–2100), it is anticipated that the multi-year average precipitation in the basin will see the greatest increase under the SSP5-8.5 scenario, with a rise of 25.6%, while under the SSP2-4.5 scenario, the increase is expected to be 6.7% compared to the baseline period (1996–2010).
The intra-annual variation characteristics of precipitation in the Dulongjiang-Irrawaddy River basin for the baseline period (1996–2010) and future climate change scenarios are shown in Figure 7 and Table 5. Under the SSP2-4.5 scenario, future GCM models predict an increase in precipitation from November to March and from June to September compared to the baseline period (1996–2010), with more notable increases in July and August. Specifically, precipitation in July and August is expected to rise by 20.9% (+74.88 mm/month) and 19.6% (+66.26 mm/month), respectively. In contrast, precipitation in April, May, and October is projected to decrease compared to the baseline period (1996–2010), with May and October showing more pronounced reductions, at 34% (−69.63 mm/month) and 24.1% (−42.70 mm/month), respectively.
Under the SSP5-8.5 scenario, the patterns of increased and decreased precipitation months are generally consistent with the SSP2-4.5 scenario, but the increases are more pronounced in some months. Notably, June, July, and August show the most significant increases, with precipitation rising by 25.8% (+85.47 mm/month), 26.4% (+94.50 mm/month), and 25% (+84.49 mm/month), respectively. Conversely, reductions in precipitation in May and October are less severe compared to the SSP2-4.5 scenario, with decreases of 24% (−49.08 mm/month) and 21% (−38.91 mm/month), respectively.
Figure 7 indicates that under both future climate scenarios, the intra-annual distribution of precipitation in the Dulongjiang-Irrawaddy River basin exhibits a more “narrow and high” characteristic compared to the baseline period (1996–2010). This suggests that precipitation will become more concentrated in the rainy season and the intra-annual distribution of precipitation will become more uneven from 2025 to 2100. The uneven distribution is more pronounced under the high-forcing scenario (SSP5-8.5) compared to the moderate-forcing scenario (SSP2-4.5).
In addition, the shaded areas in Figure 6 and Figure 7 (representing the range of GCM model variations) illustrate the differences in future precipitation predictions among the three GCM climate models for the Dulongjiang-Irrawaddy River basin. These shaded regions reflect the uncertainty in climate model predictions, with larger shaded areas indicating greater model discrepancies and higher uncertainty.
From Figure 7, it is evident that there is substantial variability among climate models during the rainy season (June to August) under both SSP2-4.5 and SSP5-8.5 scenarios, reflecting relatively high uncertainty. However, Figure 6, which shows the interannual variation, does not reveal a clear temporal trend in model uncertainty over time.

3.2.2. Future Temperature Change Trends

From 2025 to 2100, the annual average temperature in the Dulongjiang-Irrawaddy River basin is expected to increase significantly under both SSP2-4.5 and SSP5-8.5 scenarios (Figure 8 and Table 6). Compared to the baseline period (1996–2010) with a multi-year average temperature of 21.13 °C, the future average temperature in the Dulongjiang-Irrawaddy River basin is projected to rise to 22.7 °C (an increase of approximately 1.57 °C) under the SSP2-4.5 scenario, and to 23.39 °C (an increase of approximately 2.26 °C) under the SSP5-8.5 scenario. Sustained warming of over 2.0 °C is expected to occur earlier under the SSP5-8.5 scenario, around 2060, compared to the SSP2-4.5 scenario, which is projected to experience such warming around 2074. By the end of the 21st century (2076–2100), temperatures in the Dulongjiang-Irrawaddy River basin are anticipated to reach the highest levels of the century, with multi-year average temperatures increasing by 2.51 °C under the SSP2-4.5 scenario and by 3.82 °C under the SSP5-8.5 scenario compared to the baseline period (1996–2010).
In addition, Figure 8 indicates that there is uncertainty in future temperature changes among the three GCM climate models for the Dulongjiang-Irrawaddy River basin. The range of GCM model variations in the figure shows that, under the SSP5-8.5 scenario, the uncertainty in temperature data remains relatively stable over time. In contrast, under the SSP2-4.5 scenario, the uncertainty increases gradually as time progresses.
Figure 9 and Table 7 show the intra-annual temperature variation characteristics under the climate change scenarios for the Dulongjiang-Irrawaddy River basin. Under the SSP2-4.5 scenario, future temperatures are expected to increase significantly from April to November, with the largest increases occurring in May and June, which are projected to rise by 2.90 °C and 2.37 °C, respectively, compared to the baseline period (1996–2010). In contrast, the winter months (December to March) will experience only slight increases, with average monthly temperatures rising by less than 0.6 °C. With higher radiative forcing, the SSP5-8.5 scenario shows even more pronounced warming across all months. From April to November, the average temperature is projected to increase by more than 2 °C compared to the baseline period (1996–2010), while other months will see increases exceeding 1 °C. Similar to the SSP2-4.5 scenario, May and June under the SSP5-8.5 scenario are expected to have the greatest warming, with increases of 3.48 °C and 2.96 °C, respectively.

3.3. Hydrological Response Under the Climate Change Scenarios in the Dulongjiang-Irrawaddy River Basin

To better capture the runoff response to climate change during different future periods, this section divides the study period (2025–2100) into three distinct phases: near-term (2025–2050), mid-term (2051–2075), and long-term (2076–2100). This division aims to explore the runoff characteristics and changes in the Dulongjiang-Irrawaddy River basin during each of these future timeframes.

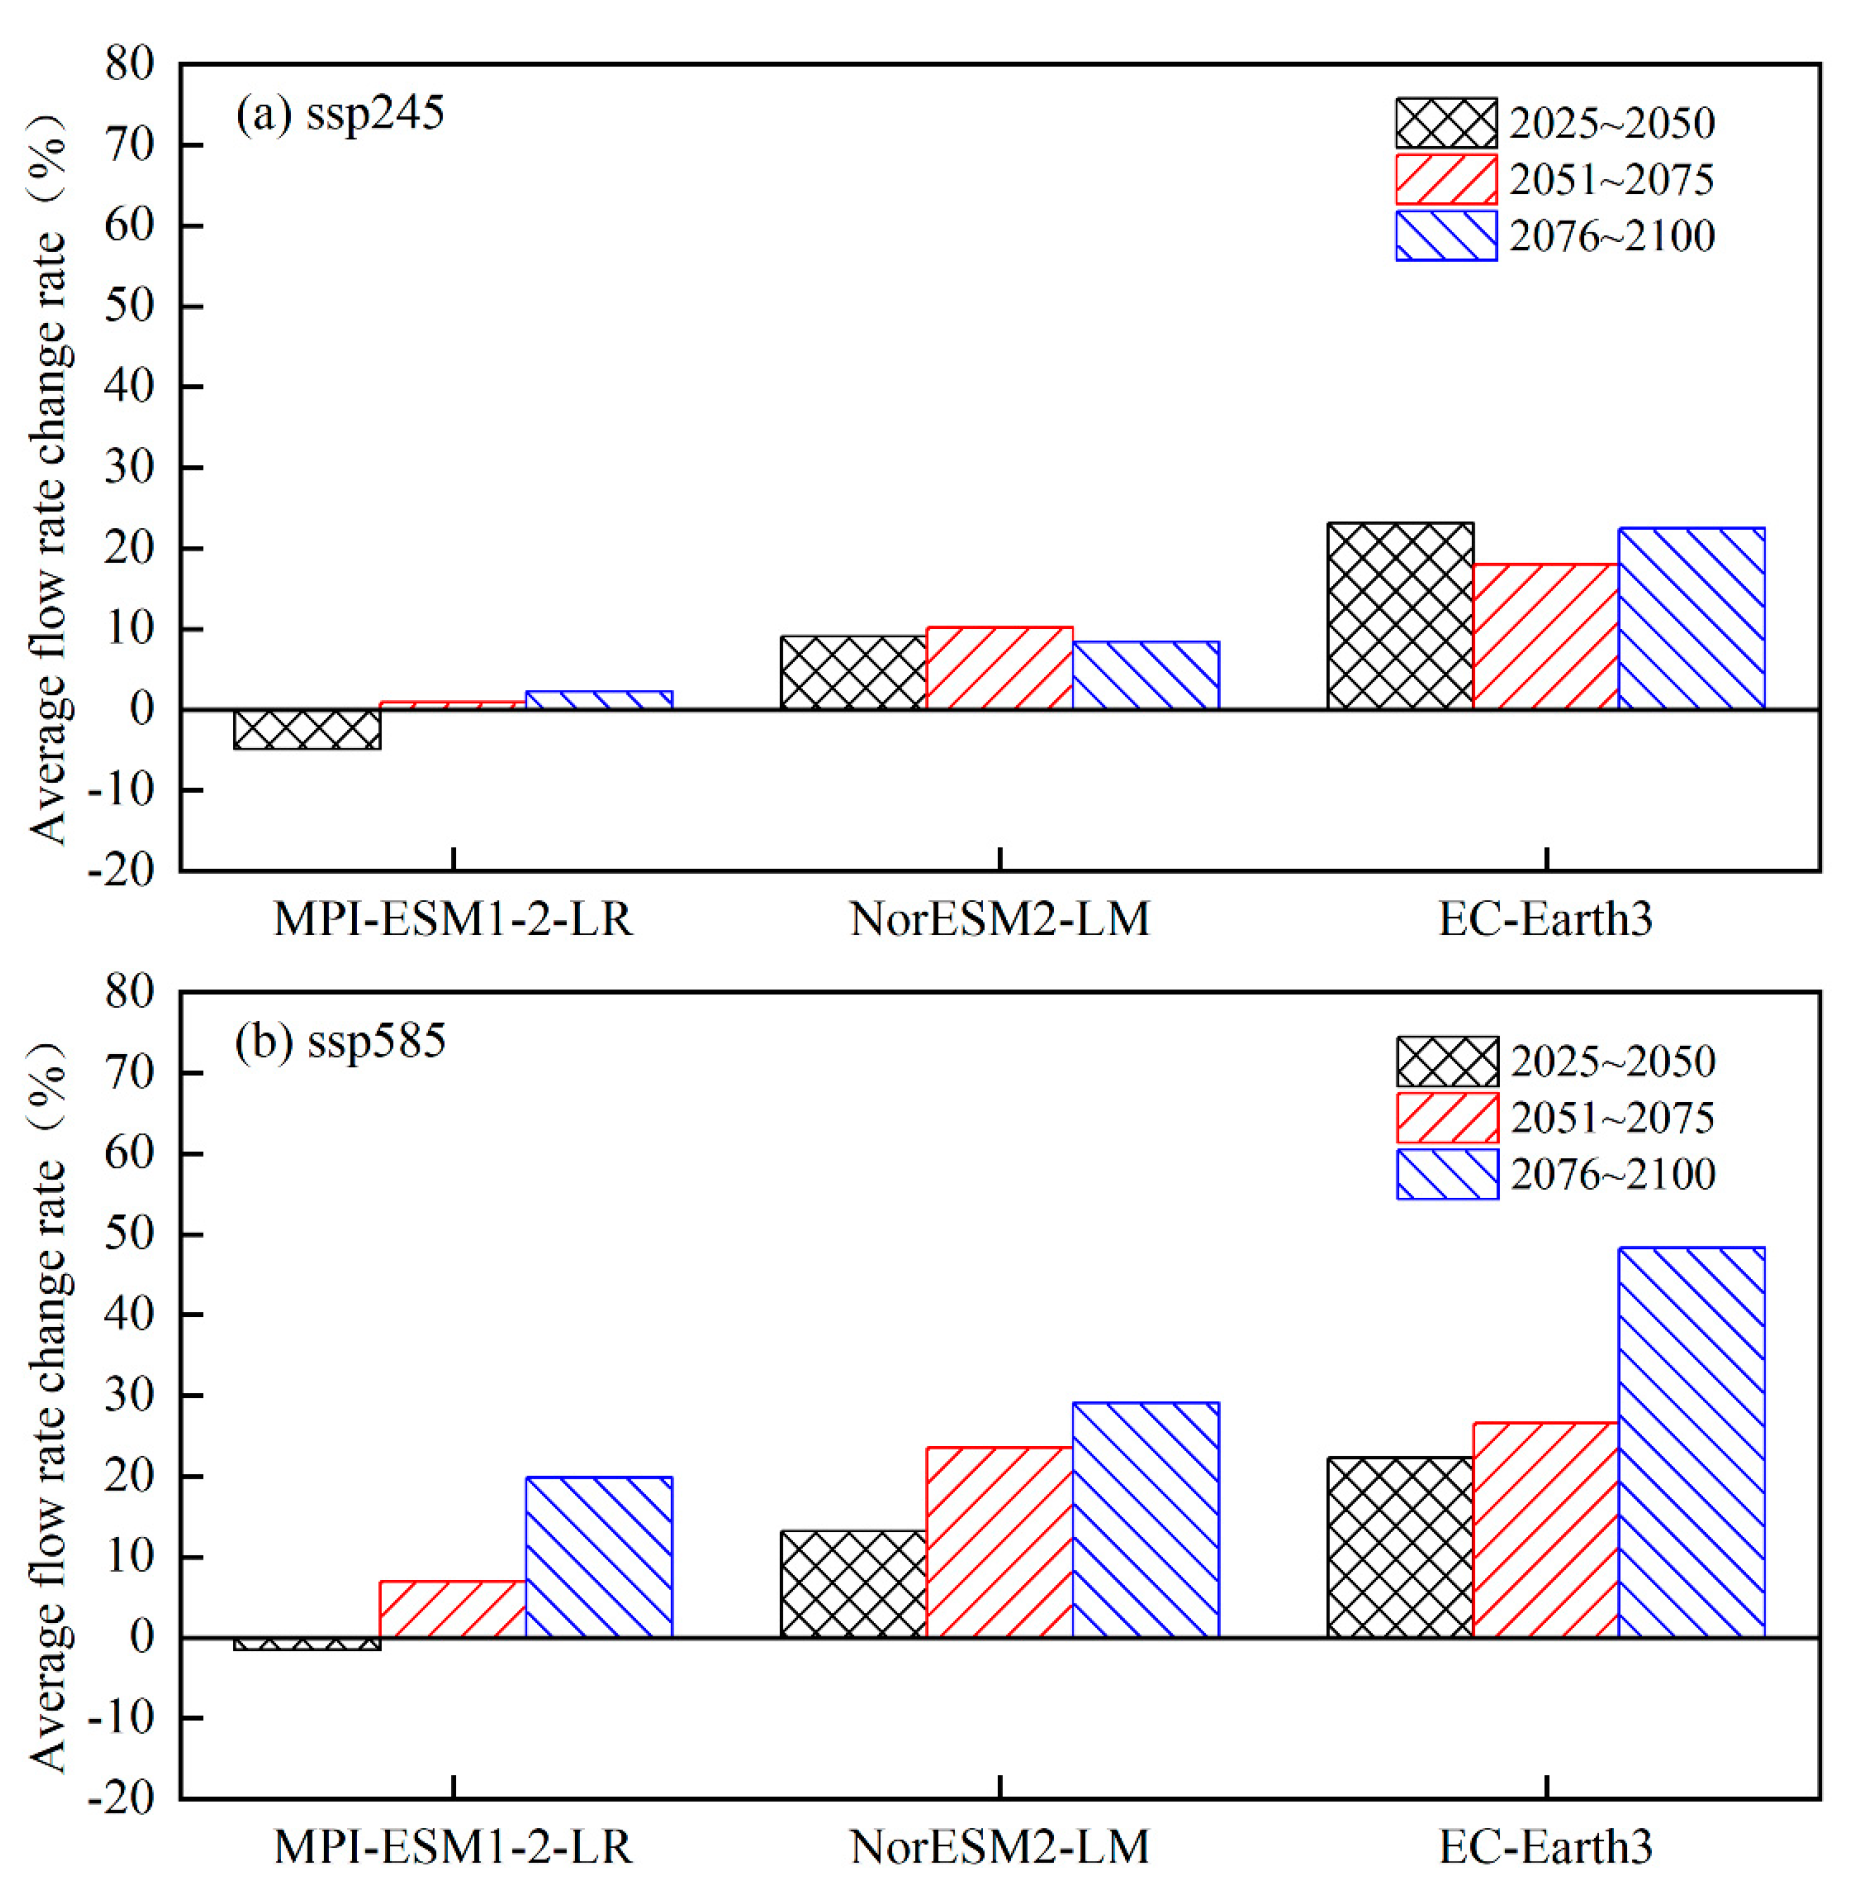
3.3.1. Interannual Runoff Variations

The future flow simulation results for the Pyay hydrological station in the Dulongjiang-Irrawaddy River basin, based on the EC-Earth3, MPI-ESM1-2-LR, and NorESM2-LM GCM climate models, indicate that the projected changes in multi-year average flow from 2025 to 2100, compared to the baseline period (1996–2010), range between −1.1% and 20.6% under the SSP2-4.5 scenario, and between 7.8% and 31.5% under the SSP5-8.5 scenario. Overall, the annual average runoff is expected to increase, with a more pronounced rise under the high-forcing scenario (SSP5-8.5).
From the analysis of interannual variations in the annual average flow at the Pyay hydrological station in the Dulongjiang-Irrawaddy River basin under future climate change scenarios (Figure 10), the SSP5-8.5 scenario shows a noticeable trend of fluctuating increases in average flow over time. However, under the SSP2-4.5 scenario, this upward fluctuation trend is only evident in the MPI-ESM1-2-LR and NorESM2-LM models, and the trend is less pronounced compared to the SSP5-8.5 scenario. In additionally, as indicated by the differences between the flow curves under the SSP2-4.5 and SSP5-8.5 scenarios in Figure 10, there is little difference in future runoff between the two forcing scenarios in the near term (2025–2050). However, as time progresses, the differences gradually widen, with the SSP5-8.5 scenario projecting significantly higher flow than the SSP2-4.5 scenario by the long term (2076–2100).
Figure 11 indicates, from the analysis of the rate of change in average flow for each time period compared to the baseline period (1996–2010), that, except for the slight decrease in the flow simulated by the MPI-ESM1-2-LR model for the near term (2025–2050), the annual average flows for the other models and periods under both the SSP2-4.5 and SSP5-8.5 scenarios are generally higher than the baseline period (1996–2010). Notably, during the long term (2076–2100), under the SSP5-8.5 scenario, all models show the largest increase in flow compared to the baseline period (1996–2010), with the growth rates ranging from 19.9% to 48.3%.
The reason for the lower average flow of the MPI-ESM1-2-LR model in the 2025–2050 period is that the projected precipitation for this period is slightly below the baseline period (1996–2010) average, while average temperatures are higher than the baseline period (1996–2010). This results in less water entering the basin in the form of precipitation and more water escaping the basin through evaporation, leading to a reduction in runoff in this period for this model. In contrast, for the other models and periods, both precipitation and average temperatures are higher than the baseline period (1996–2010), and the increase in water from precipitation outweighs the loss from evaporation, leading to an overall increase in runoff in the basin.
Based on the three GCM climate models, the overall trend at the Pyay hydrological station in the Dulongjiang-Irrawaddy River basin shows an increase in runoff, with a larger increase under the SSP5-8.5 scenario. This conclusion aligns with the findings of Sirisena et al. [2], who evaluated the runoff changes in the Dulongjiang-Irrawaddy River basin under low- and high-forcing scenarios using three CMIP5 models: CSIRO-Mk3.6, HadGEM2-AO, and HadGEM2-ES. Their study showed that, except for the CSIRO-Mk3.6 model, which predicted slightly lower runoff values than the historical average during the 2046–2065 period, all other models and time periods indicated an increase in runoff to some extent, with a larger increase under the high-forcing scenario. Specifically, under the high-forcing scenario, the runoff is projected to increase by 9% to 45% during the 2081–2100 period.
Although the overall trends in this study are consistent with those of Sirisena et al. [2], there are some numerical differences in the future projections. These discrepancies arise from the differences in meteorological prediction data between CMIP5 and CMIP6 models. According to previous research, the CMIP6 models used in this study offer lower uncertainty in precipitation predictions for the Dulongjiang-Irrawaddy River basin compared to CMIP5 [26].

3.3.2. Intra-Annual Variations in Runoff

Figure 12 illustrates the intra-annual variation characteristics of runoff at the Pyay hydrological station in the Dulongjiang-Irrawaddy River basin under both the baseline period (1996–2010) and future climate change scenarios. Under the SSP2-4.5 scenario, the average runoff from the GCM models across different periods (near-term, mid-term, and long-term) shows a clear increasing trend during the rainy season from June to October compared to the baseline period (1996–2010). May experiences a slight increase, although it is not pronounced. In contrast, the dry season from November to January shows a moderate decrease in flow, while the average flow from February to April is very similar to that of the baseline period (1996–2010). Furthermore, the intra-annual runoff characteristics under the SSP2-4.5 scenario are relatively consistent across the different time periods in the GCM models.
Under the SSP5-8.5 scenario, the months of increased and decreased flow are generally consistent with those in the SSP2-4.5 scenario. However, certain months, particularly from June to August, show significantly higher increases in precipitation compared to the SSP2-4.5 scenario. The intra-annual runoff characteristics among the GCM models under the SSP5-8.5 scenario exhibit notable differences across the near-term, mid-term, and long-term periods. In the near term, the average flow for June to August increases by between 7.9% and 33.9% compared to the baseline period (1996–2010), while in the long term, this increase rises to between 29.8% and 53.9%. Furthermore, as illustrated in Figure 12, the impact of different forcing intensities on the intra-annual runoff characteristics varies for the same period. The runoff increase during June to August in the Dulongjiang-Irrawaddy River basin under the high-forcing scenario (SSP5-8.5) is significantly greater than that under the medium-forcing scenario (SSP2-4.5).
The calculation results for CV and Cr at the Pyay hydrological station in the Dulongjiang-Irrawaddy River basin under different climate change scenarios are presented in Table 8 and Table 9. The coefficients CV and Cr are characteristic indicators used to measure the degree of intra-annual runoff unevenness. CV represents the overall degree of unevenness in the time series, while Cr focuses on runoff levels above the monthly average, reflecting the concentration of runoff. A larger CV or Cr indicates a more pronounced difference in the distribution of river runoff throughout the year.
Overall, the CV and Cr values under the SSP2-4.5 and SSP5-8.5 scenarios for different decades (near-term, mid-term, and long-term) are all greater than those for the baseline period (1996–2010, CV = 0.85, Cr = 0.28). This indicates that, driven by climate change from 2025 to 2100, runoff in the Dulongjiang-Irrawaddy River basin will become more concentrated during the flood season, leading to a more uneven distribution of runoff throughout the year compared to the baseline period (1996–2010). Furthermore, the uneven characteristics are more pronounced under the high-forcing scenario (SSP5-8.5) compared to the medium-forcing scenario (SSP2-4.5).

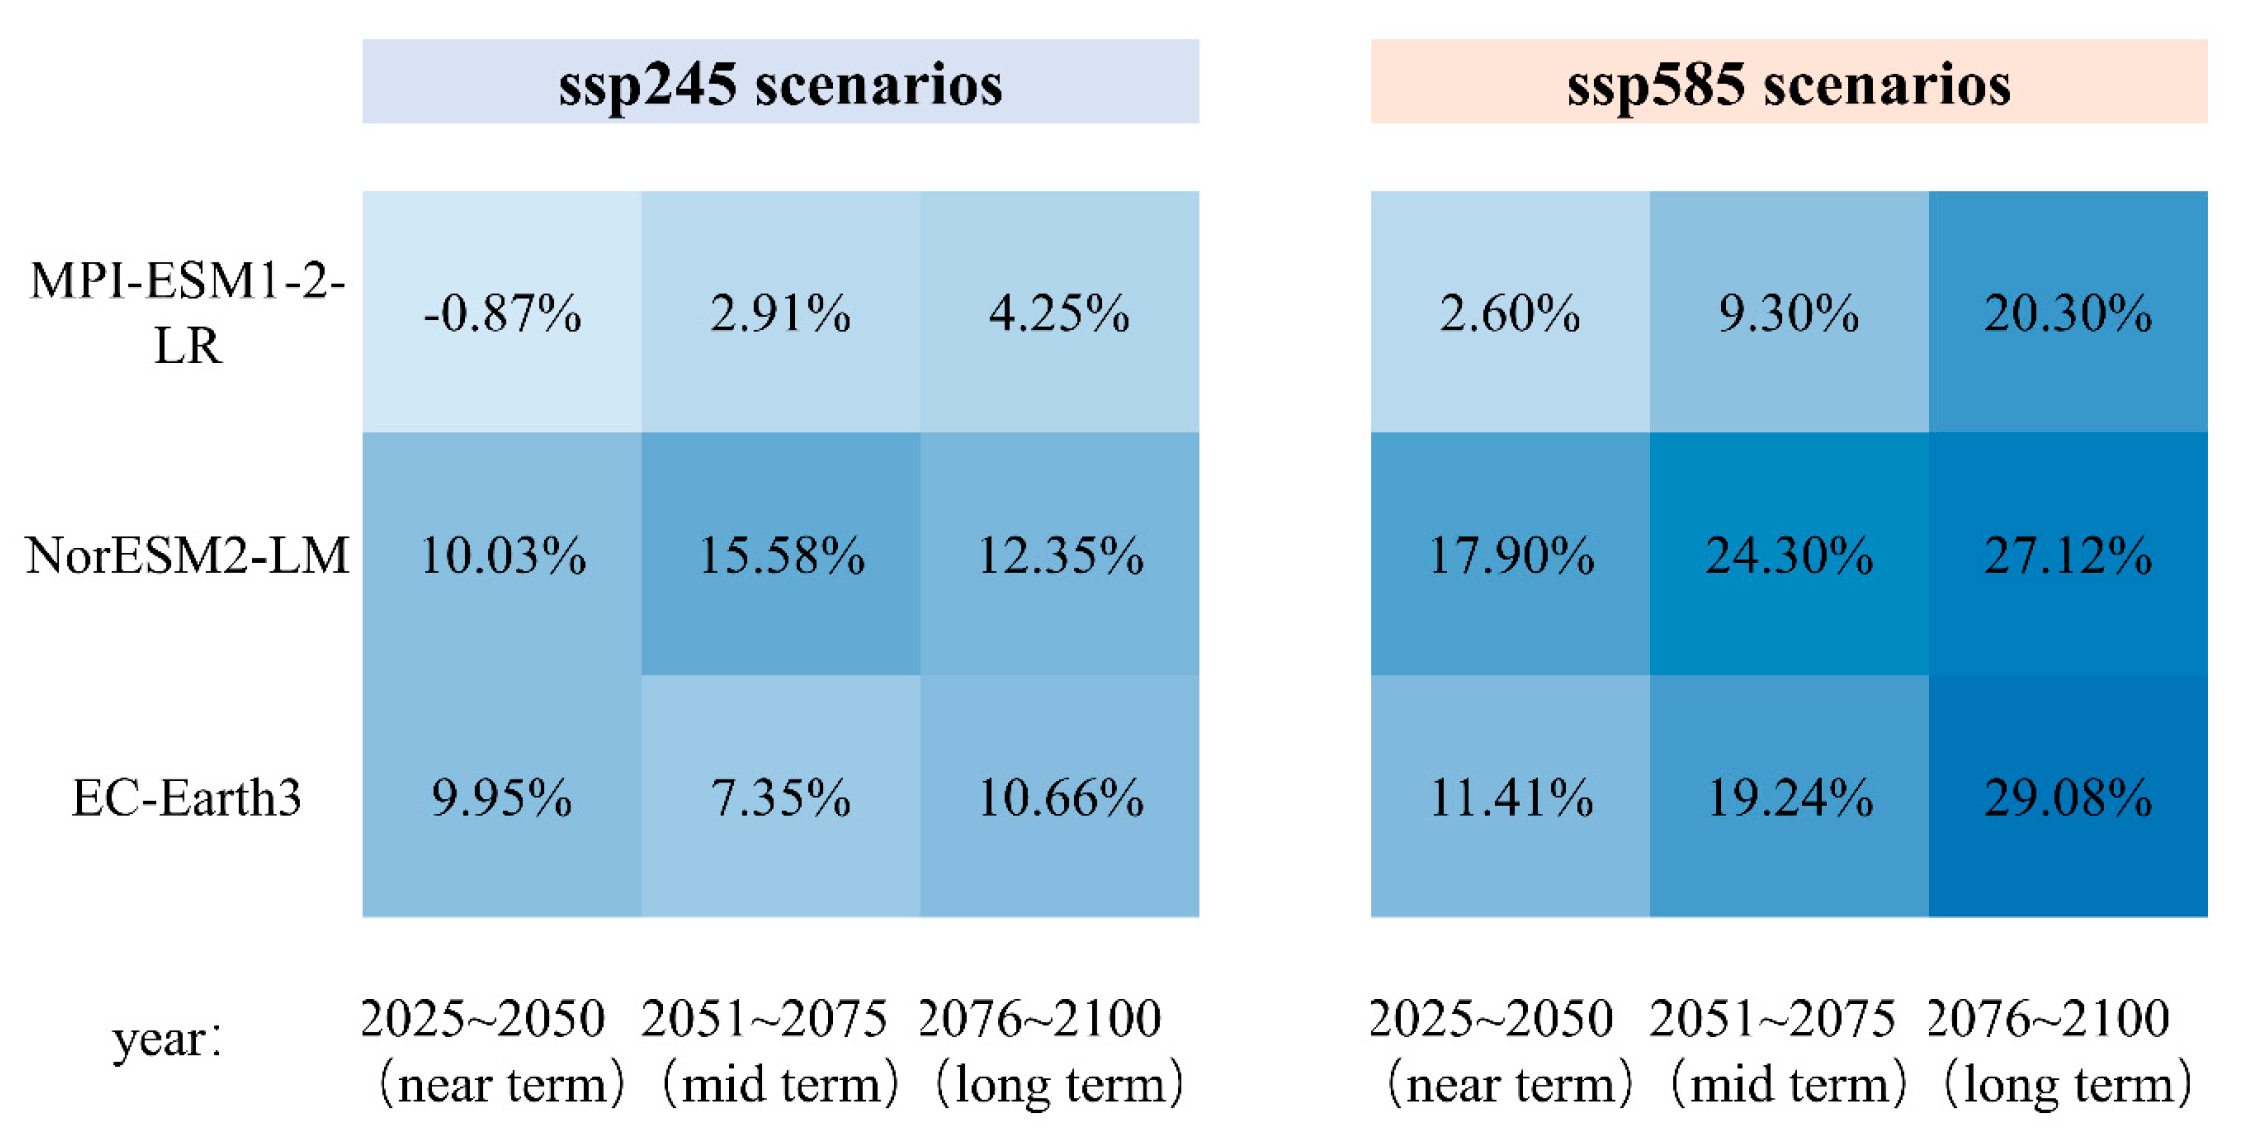
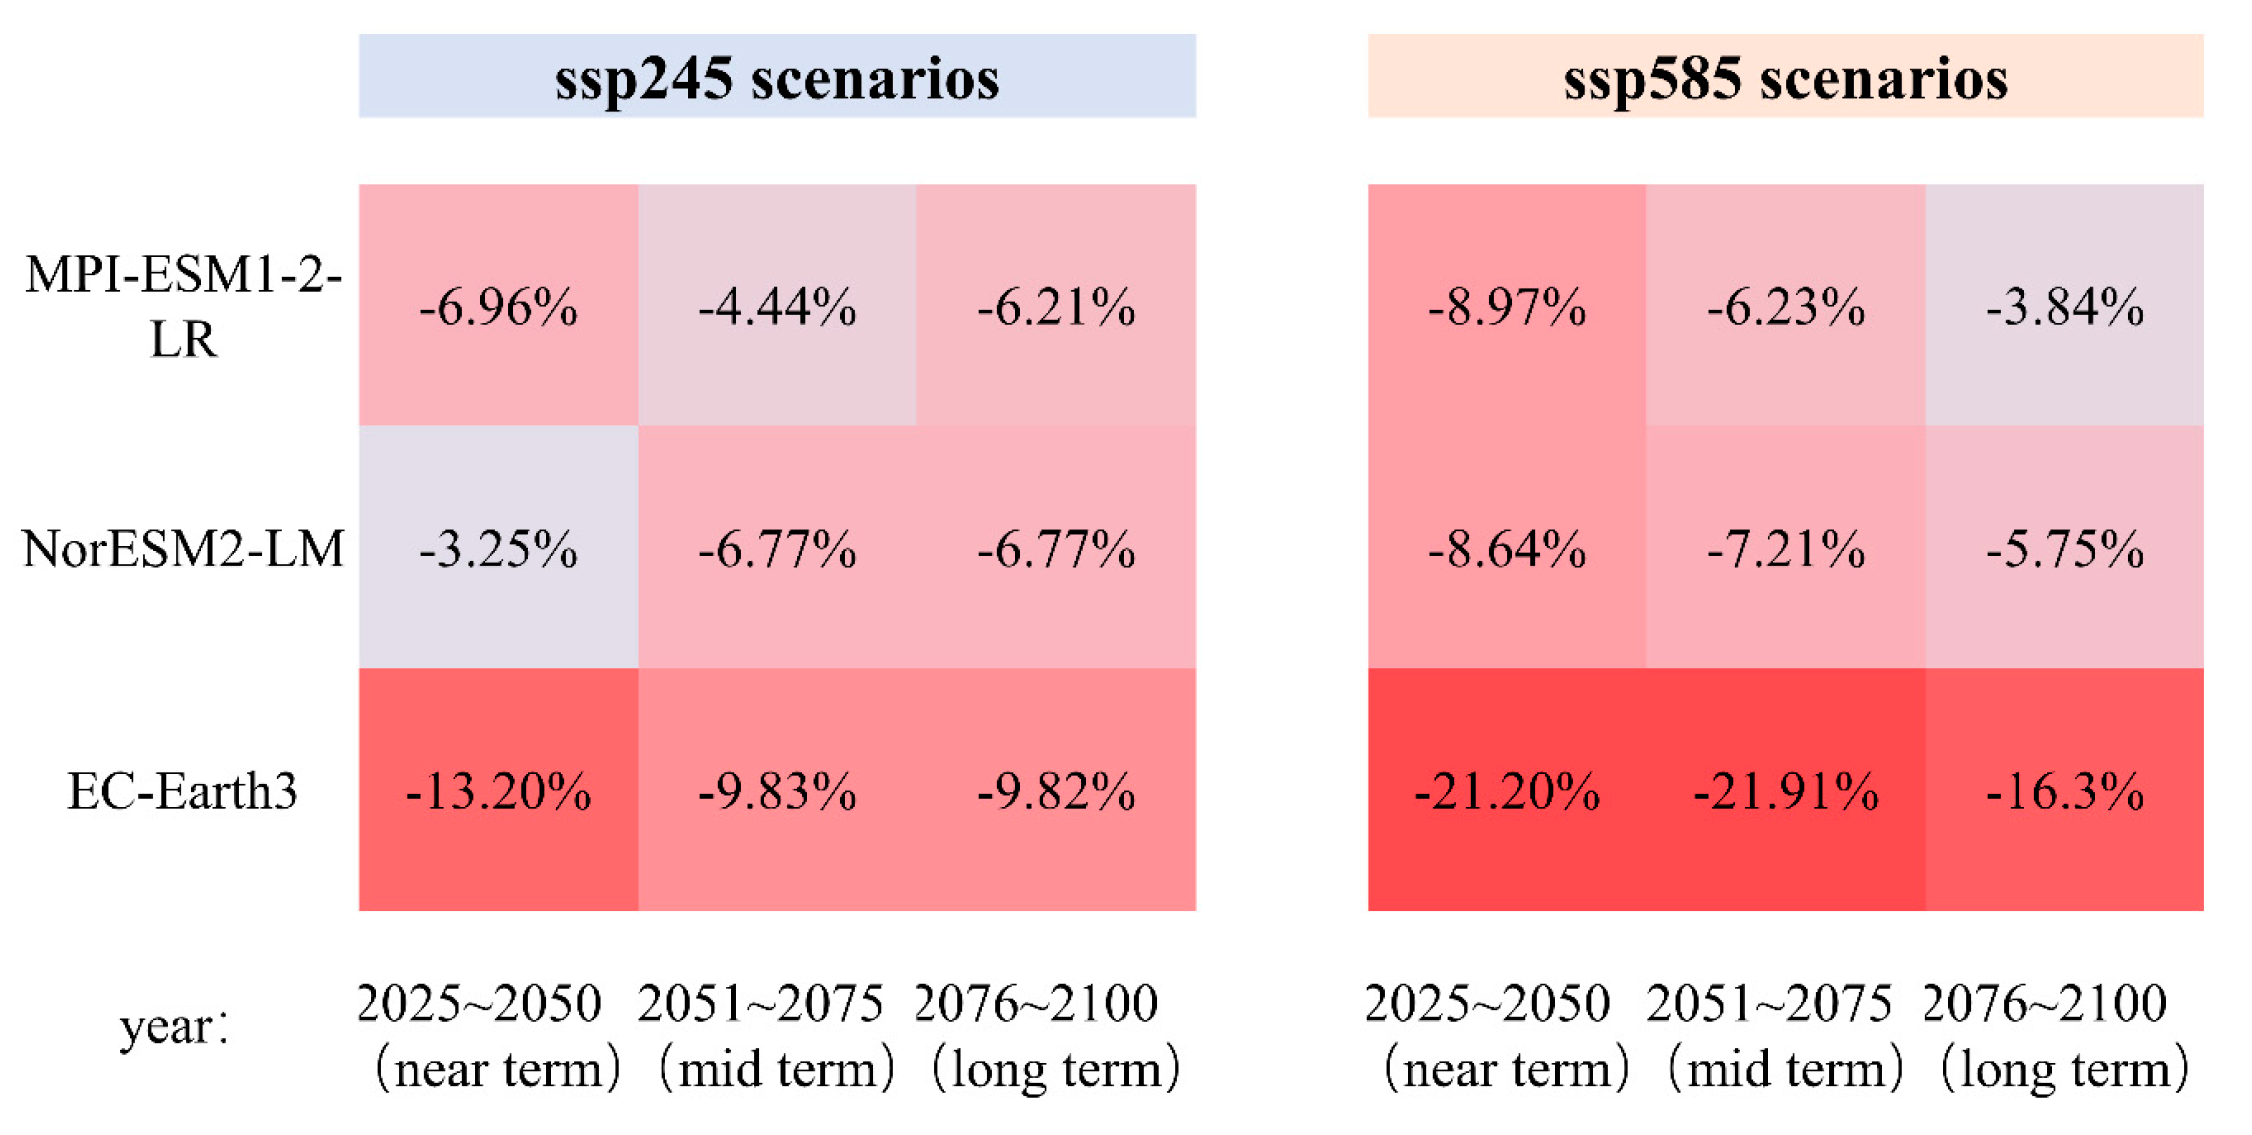
3.3.3. Extreme Runoff Changes

Compared to average runoff, extreme runoff changes often have more severe impacts on society, the economy, and regional ecosystems. Therefore, this study explores the changes in extreme runoff at the Pyay hydrological station in the Dulongjiang-Irrawaddy River basin under future climate change scenarios from 2025 to 2100, relative to the baseline period (1996–2010).
This study uses the 95th percentile and 5th percentile of runoff to represent the flood extreme runoff and drought extreme runoff of the basin, denoted as Q95 and Q5, respectively. Q95 refers to the runoff value below which 95% of the monthly time series runoff falls, while Q5 indicates the value below which only 5% of the runoff is observed.
Figure 13 shows the change rates of Q95 flood extreme runoff in the Dulongjiang-Irrawaddy River basin under three GCM climate models—EC-Earth3, MPI-ESM1-2-LR, and NorESM2-LM—during the near term (2025–2050), mid-term (2051–2075), and long term (2076–2100) compared to the baseline period (1996–2010). The results indicate that under the future SSP2-4.5 and SSP5-8.5 scenarios, the Q95 flood extreme runoff in the Dulongjiang-Irrawaddy River basin is expected to increase overall, with the largest increment observed in the long term under the SSP585 scenario, where all three models show increases exceeding 20%. This suggests that the flood risk in the Dulongjiang-Irrawaddy River basin will rise to a certain extent compared to the baseline period (1996–2010), particularly in the long term under the high-forcing scenario, where the flood risk is highest.
Figure 14 illustrates the changes in Q5 drought extreme runoff in the Dulongjiang-Irrawaddy River basin across different future time periods under the three GCM climate models, relative to the baseline period (1996–2010). The results indicate that under both future climate change scenarios, the Q5 runoff is expected to decrease to varying degrees compared to the baseline period (1996–2010). This suggests that the drought risk in the Dulongjiang-Irrawaddy River basin will increase relative to the baseline period (1996–2010) under future climate scenarios.

4. Conclusions

This study utilizes output data from three GCM models (EC-Earth3, MPI-ESM1-2-LR, and NorESM2-LM) under the CMIP6 framework, employing the CV-LSTM model to predict daily hydrological processes in the Dulongjiang-Irrawaddy River basin for future climate scenarios SSP2-4.5 and SSP5-8.5. The study discusses the characteristics of future climate change in the Dulongjiang-Irrawaddy River basin and its hydrological responses, with a focus on the interannual variability, intra-annual variability, and extreme runoff changes driven by climate change. The main conclusions are as follows:
The model performance evaluation, based on the Pearson correlation coefficient, Nash–Sutcliffe efficiency, percentage bias, and RMSE-observations standard deviation ratio, indicates an excellent fit between the simulated and observed streamflow at the Pyay station. These results validate the CV-LSTM model’s capability to accurately capture the hydrological processes in the Dulongjiang-Irrawaddy River basin.
Future precipitation in the Dulongjiang-Irrawaddy River basin from 2025 to 2100 shows an increasing trend, with an average increase of 5.5% under the SSP245 scenario and 12% under the SSP585 scenario compared to the baseline period (1996–2010). Precipitation during the rainy season is expected to become more concentrated, resulting in a more uneven distribution throughout the year compared to the baseline period (1996–2010). Similarly, the average temperature in the basin is projected to rise, with an increase of 1.57 °C under the SSP245 scenario and an estimated increase of 2.26 °C under the SSP585 scenario, relative to the baseline period (1996–2010).
Under the SSP245 and SSP585 climate change scenarios, the multi-year average flow projections based on three GCM climate models show a range of changes relative to the baseline period (1996–2010), with variations ranging from −1.1% to 20.6% under SSP245, and 7.8% to 31.5% under SSP585. Overall, there is a general increasing trend compared to the baseline period (1996–2010), with a more pronounced increase under the higher-forcing scenario (SSP585). In both scenarios, the monthly average flow exhibits a clear increasing trend from June to October during the rainy season, while a slight decrease is observed from November to January during the dry season.
The coefficients of variation (CV) and the complete regulation coefficient (Cr) for runoff are both greater than the baseline period (1996–2010), suggesting that from 2025 to 2100, runoff in the Dulongjiang-Irrawaddy River basin will be more concentrated during the flood season, with a tendency for a more uneven distribution throughout the year compared to the baseline period (1996–2010). Additionally, under the SSP245 and SSP585 climate change scenarios, Q95 flood extreme runoff will increase compared to the baseline period (1996–2010), while Q5 drought extreme runoff will decrease to varying degrees. This indicates that the risks of flooding and drought in the Dulongjiang-Irrawaddy River basin will increase under future climate change scenarios compared to the baseline period (1996–2010).
This study employed a combined data-driven modeling approach to assess hydrological responses under future climate change scenarios, providing valuable insights for the rational utilization and coordinated management of water resources in the Dulongjiang-Irrawaddy River basin. However, further research is needed to evaluate the cascading effects of future climate change on precipitation and runoff within the basin. Based on these findings, the Myanmar government can optimize water resource management policies, particularly in areas such as water resource allocation and irrigation technology improvements. Establishing a more robust water resource monitoring system is crucial to timely respond to changes and ensure water security. Given the transboundary nature of the Irrawaddy River basin, this study advocates for enhanced cooperation between Myanmar and its neighboring countries to develop a transboundary water-resource-sharing mechanism. Through joint monitoring, sharing climate data, and hydrological forecasts, countries can more effectively collaborate to address water shortages and extreme climate events, reducing the risk of conflicts arising from competition over water resources. It is also recommended that countries establish joint emergency response mechanisms and strengthen disaster early warning systems to improve the basin’s disaster resilience. As the impacts of climate change continue to intensify, future research should further focus on the practical aspects of transboundary basin water resource management and climate adaptation measures, particularly exploring how cooperation can address transboundary water resources and climate disaster management. This will provide more comprehensive theoretical and data-driven support for regional water resource governance. Additionally, as the model training is currently based on the black-box nature of LSTM, future studies should aim to improve transparency and interpretability in this aspect.

Author Contributions

Conceptualization, X.L., X.Y. and Z.G.; data curation, X.Y. and Z.G.; formal analysis, X.L. and X.Y.; investigation, Y.L.; methodology, X.Y.; software, X.Y.; writing—original draft preparation, X.L. and X.Y.; supervision, Y.L., L.P. and C.L.; funding acquisition, Y.L. All authors have read and agreed to the published version of the manuscript.

Funding

This study was jointly funded by the National Key Research and Development Program of China (no. 2022YFF 1302405), China Huaneng Group Youth Science Fund (HNKJ24LC119), the Youth Support Program of Yunnan (YNWRQNBJ2018166), and the National Science Fund of China (no. 32060831).

Data Availability Statement

Data will be made available on request.

Conflicts of Interest

Authors Xu Yuan and Li Peng were employed by the company Huaneng Lancang River Hydropower Inc. The remaining authors declare that the research was conducted in the absence of any commercial or financial relationships that could be construed as a potential conflict of interest.

References

  1. Lewandowsky, S. Future Global Change and Cognition. Top. Cogn. Sci. 2016, 8, 7–18. [Google Scholar] [CrossRef] [PubMed]
  2. Sirisena, T.a.J.G.; Maskey, S.; Bamunawala, J.; Ranasinghe, R. Climate Change and Reservoir Impacts on 21st-Century Streamflow and Fluvial Sediment Loads in the Irrawaddy River, Myanmar. Front. Earth Sci. 2021, 9, 644527. [Google Scholar] [CrossRef]
  3. Kreft, S.; Eckstein, D.; Dorsch, L.; Fischer, L. Global Climate Risk Index 2016; Germanwatch e.V.: Bonn, Germany, 2016. [Google Scholar]
  4. Schneider, P.; Asch, F. Rice Production and Food Security in Asian Mega Deltas-A Review on Characteristics, Vulnerabilities and Agricultural Adaptation Options to Cope with Climate Change. J. Agron. Crop Sci. 2020, 206, 491–503. [Google Scholar] [CrossRef]
  5. Dey, P.; Mishra, A. Separating the Impacts of Climate Change and Human Activities on Streamflow: A Review of Methodologies and Critical Assumptions. J. Hydrol. 2017, 548, 278–290. [Google Scholar] [CrossRef]
  6. Nguyen, B.Q.; Van Binh, D.; Tran, T.-N.-D.; Kantoush, S.A.; Sumi, T. Response of Streamflow and Sediment Variability to Cascade Dam Development and Climate Change in the Sai Gon Dong Nai River Basin. Clim. Dyn. 2024, 62, 7997–8017. [Google Scholar] [CrossRef]
  7. Yan, J.; Jia, S.; Lv, A.; Zhu, W. Water Resources Assessment of China’s Transboundary River Basins Using a Machine Learning Approach. Water Resour. Res. 2019, 55, 632–655. [Google Scholar] [CrossRef]
  8. Zhang, Z.; Zhang, Q.; Singh, V.P.; Shi, P. River Flow Modelling: Comparison of Performance and Evaluation of Uncertainty Using Data-Driven Models and Conceptual Hydrological Model. Stoch. Environ. Res. Risk Assess. 2018, 32, 2667–2682. [Google Scholar] [CrossRef]
  9. Jiang, S.; Zheng, Y.; Babovic, V.; Tian, Y.; Han, F. A Computer Vision-Based Approach to Fusing Spatiotemporal Data for Hydrological Modeling. J. Hydrol. 2018, 567, 25–40. [Google Scholar] [CrossRef]
  10. Deng, C.; Yin, X.; Zou, J.; Wang, M.; Hou, Y. Assessment of the Impact of Climate Change on Streamflow of Ganjiang River Catchment via LSTM-Based Models. J. Hydrol. Reg. Stud. 2024, 52, 101716. [Google Scholar] [CrossRef]
  11. Madhavi, M.; Kolikipogu, R.; Prabakar, S.; Banerjee, S.; Maguluri, L.P.; Raj, G.B.; Balaram, A. Experimental Evaluation of Remote Sensing–Based Climate Change Prediction Using Enhanced Deep Learning Strategy. Remote Sens. Earth Syst. Sci. 2024, 7, 642–656. [Google Scholar] [CrossRef]
  12. Kedam, N.; Tiwari, D.K.; Kumar, V.; Khedher, K.M.; Salem, M.A. River Stream Flow Prediction through Advanced Machine Learning Models for Enhanced Accuracy. Results Eng. 2024, 22, 102215. [Google Scholar] [CrossRef]
  13. Yuan, X.; Wang, J.; He, D.; Lu, Y.; Sun, J.; Li, Y.; Guo, Z.; Zhang, K.; Li, F. Influence of Cascade Reservoir Operation in the Upper Mekong River on the General Hydrological Regime: A Combined Data-Driven Modeling Approach. J. Environ. Manag. 2022, 324, 116339. [Google Scholar] [CrossRef]
  14. Chen, D.; Li, X.; Saito, Y.; Liu, J.P.; Duan, Y.; Liu, S.; Zhang, L. Recent Evolution of the Irrawaddy (Ayeyarwady) Delta and the Impacts of Anthropogenic Activities: A Review and Remote Sensing Survey. Geomorphology 2020, 365, 107231. [Google Scholar] [CrossRef]
  15. Supharatid, S.; Nafung, J.; Aribarg, T. Projected Changes in Temperature and Precipitation over Mainland Southeast Asia by CMIP6 Models. J. Water Clim. Chang. 2022, 13, 337–356. [Google Scholar] [CrossRef]
  16. Iqbal, Z.; Shahid, S.; Ahmed, K.; Ismail, T.; Ziarh, G.F.; Chung, E.-S.; Wang, X. Evaluation of CMIP6 GCM Rainfall in Mainland Southeast Asia. Atmos. Res. 2021, 254, 105525. [Google Scholar] [CrossRef]
  17. Ojala, T.; Pietikäinen, M.; Mäenpää, T. Multiresolution Gray-Scale and Rotation Invariant Texture Classification with Local Binary Patterns. IEEE Trans. Pattern Anal. Mach. Intell. 2002, 24, 971–987. [Google Scholar] [CrossRef]
  18. Hochreiter, S.; Schmidhuber, J. Bridging Long Time Lags by Weight Guessing and “long Short Term Memory”. In Proceedings of the Spatiotemporal Models In Biological And Artificial Systems; Silva, F.L., Principe, J.C., Almeida, L.B., Eds.; IOS Press: Amsterdam, The Netherlands, 1997; Volume 37, pp. 65–72. [Google Scholar]
  19. Qiu, R.; Wang, Y.; Rhoads, B.; Wang, D.; Qiu, W.; Tao, Y.; Wu, J. River Water Temperature Forecasting Using a Deep Learning Method. J. Hydrol. 2021, 595, 126016. [Google Scholar] [CrossRef]
  20. Kratzert, F.; Klotz, D.; Shalev, G.; Klambauer, G.; Hochreiter, S.; Nearing, G. Towards Learning Universal, Regional, and Local Hydrological Behaviors via Machine Learning Applied to Large-Sample Datasets. Hydrol. Earth Syst. Sci. 2019, 23, 5089–5110. [Google Scholar] [CrossRef]
  21. Moriasi, D.N.; Arnold, J.G.; Van Liew, M.W.; Bingner, R.L.; Harmel, R.D.; Veith, T.L. Model Evaluation Guidelines for Systematic Quantification of Accuracy in Watershed Simulations. Trans. ASABE 2007, 50, 885–900. [Google Scholar] [CrossRef]
  22. Moss, R.H.; Edmonds, J.A.; Hibbard, K.A.; Manning, M.R.; Rose, S.K.; van Vuuren, D.P.; Carter, T.R.; Emori, S.; Kainuma, M.; Kram, T.; et al. The next Generation of Scenarios for Climate Change Research and Assessment. Nature 2010, 463, 747–756. [Google Scholar] [CrossRef] [PubMed]
  23. Xu, Z.; Han, Y.; Tam, C.-Y.; Yang, Z.-L.; Fu, C. Bias-Corrected CMIP6 Global Dataset for Dynamical Downscaling of the Historical and Future Climate (1979–2100). Sci. Data 2021, 8, 293. [Google Scholar] [CrossRef] [PubMed]
  24. Supharatid, S.; Aribarg, T.; Nafung, J. Bias-Corrected CMIP6 Climate Model Projection over Southeast Asia. Theor. Appl. Climatol. 2022, 147, 669–690. [Google Scholar] [CrossRef]
  25. Yang, Y.; Bai, L.; Wang, B.; Wu, J.; Fu, S. Reliability of the Global Climate Models during 1961-1999 in Arid and Semiarid Regions of China. Sci. Total Environ. 2019, 667, 271–286. [Google Scholar] [CrossRef] [PubMed]
  26. Hamed, M.M.; Nashwan, M.S.; Shahid, S.; bin Ismail, T.; Wang, X.; Dewan, A.; Asaduzzaman, M. Inconsistency in Historical Simulations and Future Projections of Temperature and Rainfall: A Comparison of CMIP5 and CMIP6 Models over Southeast Asia. Atmos. Res. 2022, 265, 105927. [Google Scholar] [CrossRef]
Figure 1. The Dulongjiang-Irrawaddy River basin with the Pyay hydrological station.
Water 17 00479 g001
Figure 2. CV-LSTM model framework and its data input. All input remote sensing data products were converted into 8-bit grayscale images. Texture and intensity features were extracted in the CV module using the spatial pyramid matching (SPM) strategy and local binary pattern (LBP). Finally, the feature vectors containing spatial information, along with runoff data, were input into the LSTM model for runoff simulation.
Water 17 00479 g002
Figure 3. Dividing a complete remote sensing image into sub-regions according to the pyramid partitioning strategy.
Water 17 00479 g003
Figure 4. A diagram illustrating the conversion of remote sensing data from an 8-bit image to a binary mode image.
Water 17 00479 g004
Figure 5. The flow curves of daily runoff simulations at the Pyay station during the training period (1996–2005) and testing period (2006–2010).
Water 17 00479 g005
Figure 6. Interannual variability characteristics of precipitation in the Dulongjiang-Irrawaddy River basin under the baseline period (1996–2010) and future climate change scenarios (2025–2100). The black line represents the annual precipitation during the baseline period (1996–2010), the red line represents the annual precipitation under the GCM model, and the shaded area indicates the uncertainty of the model predictions, with larger areas indicating higher uncertainty.
Water 17 00479 g006
Figure 7. Characteristics of monthly precipitation distribution in the Dulongjiang-Irrawaddy River basin under the baseline period (1996–2010) and future climate change scenarios (2025–2100). The black line represents the monthly precipitation during the baseline period (1996–2010), the red line represents the monthly precipitation under the GCM model, and the shaded area indicates the uncertainty of the model predictions, with larger areas indicating higher uncertainty.
Water 17 00479 g007
Figure 8. Interannual variation characteristics of temperature in the Dulongjiang-Irrawaddy River basin under the baseline period (1996–2010) and future climate change scenarios (2025–2100). The black line represents the annual average temperature during the baseline period (1996–2010), the red line represents the annual average temperature under the GCM model, and the shaded area indicates the uncertainty of the model predictions, with larger areas indicating higher uncertainty.
Water 17 00479 g008
Figure 9. Characteristics of intra-annual temperature variation in the Dulongjiang-Irrawaddy River basin under the baseline period (1996–2010) and future climate change scenarios (2025–2100). The black line represents the monthly average temperature during the baseline period (1996–2010), the red line represents the monthly average temperature under the GCM model, and the shaded area indicates the uncertainty of the model predictions, with larger areas indicating higher uncertainty.
Water 17 00479 g009
Figure 10. Interannual variation trends of runoff at the Pyay Hydrological Station in the Dulongjiang-Irrawaddy River basin under future climate change scenarios. The red line represents the streamflow under the SSP245 scenario, while the blue line represents the streamflow under the SSP585 scenario, the red and blue dashed lines represent the overall flow change trends under their respective climate change scenarios.
Water 17 00479 g010
Figure 11. Change rate of average flow at the Pyay Hydrological Station in the Dulongjiang-Irrawaddy River basin compared to the baseline period (1996–2010) under future climate change scenarios. Black represents the near-term (2025–2050), red represents the mid-term (2051–2075), and blue represents the long-term (2076–2100).
Water 17 00479 g011
Figure 12. Annual distribution characteristics of flow at the Pyay Hydrological Station in the Dulongjiang-Irrawaddy River basin under future climate change scenarios. The black line represents the monthly average temperature under the GCM model, the red line represents the baseline period (1996–2010) monthly average runoff, and the shaded area indicates the uncertainty in the model’s predictions. The larger the area, the higher the uncertainty.
Water 17 00479 g012
Figure 13. Percentage change rate of the Q95 flood flow extremes at the Pyay hydrological station in the Dulongjiang-Irrawaddy River basin compared to the baseline period (1996–2010). The degree of change is represented by the depth of the color, with darker colors indicating a larger magnitude of change.
Water 17 00479 g013
Figure 14. Percentage change rate of the Q5 drought flow extremes at the Pyay hydrological station in the Dulongjiang-Irrawaddy River basin compared to the baseline period (1996–2010). The degree of change is represented by the depth of the color, with darker colors indicating a larger magnitude of change.
Water 17 00479 g014
Table 1. Multi-source data for building the CV-LSTM.
Data TypeData FeatureTime StepProductsData Source
StreamflowHydrological stationdailyObservationhttps://portal.grdc.bafg.de (accessed on 7 January 2024)
Precipitation0.25° × 0.25°dailyCHIRPS-2.0https://data.chc.ucsb.edu (accessed on 7 January 2024)
Air temperature0.1° × 0.1°hourlyERA5https://cds.climate.copernicus.eu (accessed on 7 January 2024)
Leaf area index0.05° × 0.05°8 daysGLASShttp://www.glass.umd.edu (accessed on 7 January 2024)
Table 2. Characteristics of GCMs climate model data of CMIP6.
GCMsData FeatureResearch Center
NorESM2-LM 0.7031° × 0.7017°Norwegian Meteorological Institute
MPI-ESM1-2-LR1.875° × 1.875°Max Planck Institute for Meteorology, Germany
EC-Earth30.7031° × 0.7017°EC-Earth Consortium
Table 3. Results of hyperparameter evaluation for the model.
Training Period (1996–2005)Testing Period (2006–2010)
rRSREnsPBIAS (%)rRSREnsPBIAS (%)Evaluation Grade
0.990.090.990.710.950.310.90−3.0Excellent
Table 4. Trends and magnitudes of changes in average precipitation from 2025 to 2100 under SSP245 and SSP585 scenarios compared to the average precipitation from 1996 to 2010.
ScenarioTime Period (Year)Precipitation Change (%)
SSP2-4.52025–2100+5.5%
2076–2100+12%
SSP5-8.52025–2100+6.7%
2076–2100+25.6%
Table 5. Trends and magnitudes of changes in precipitation from 2025 to 2100 under SSP245 and SSP585 scenarios compared to precipitation from 1996 to 2010.
ScenarioTime Period (Month)Precipitation Change (%)Precipitation Change (Absolute Value, mm/Month)
SSP2-4.5534%−69.63 mm
720.9%74.88 mm
819.6%66.26 mm
1024.1%−42.70 mm
SSP5-8.55−24%−49.08 mm
625.8%85.47 mm
726.4%94.50 mm
825%84.49 mm
10−21%−38.91 mm
Table 6. The trend and magnitude of the change in average temperature from 2025 to 2100 compared to the average temperature from 1996 to 2010 under the SSP245 and SSP585 scenarios, as well as the time point when the average temperature increase exceeds 2 °C.
ScenarioTime
Period (Year)
Annual
Average Temperature (°C)
Temperature Change Range (°C)The Time Point When the
Temperature Reaches +2.0 °C
End-Of-Century
Annual Average Temperature (°C)
End-Of-Century
Temperature Increase (°C)
SSP2-4.52025–210022.7+1.57207423.64+2.51
SSP5-8.52025–210023.39+2.26206024.95+3.82
Table 7. The trend and magnitude of the temperature change from 2025 to 2100 compared to the temperature from 1996 to 2010 under the SSP245 and SSP585 scenarios.
ScenarioTime Period (Month)Temperature Change Range (°C)
SSP2-4.55+2.90
6+2.37
SSP5-8.55+3.84
6+2.96
Table 8. CV of annual runoff distribution at the Pyay hydrological station in the Dulongjiang-Irrawaddy River basin under climate change scenarios.
GCM Climate ModelsSSP2-4.5 Different Time Periods SSP5-8.5 Different Time
Periods
Near-TermMid-TermLong-TermAverage PeriodNear-TermMid-TermLong-TermAverage Period
NorESM2-LM 0.910.910.900.910.940.950.910.93
MPI-ESM1-2-LR0.980.970.970.970.990.980.990.99
EC-Earth30.910.930.940.930.960.950.960.96
Table 9. Cr of the Pyay hydrological station in the Dulongjiang-Irrawaddy River basin under climate change scenarios.
GCM Climate ModelsSSP2-4.5 Different Time Periods SSP5-8.5 Different Time Periods
Near-TermMid-TermLong-TermAverage PeriodNear-TermMid-TermLong-TermAverage Period
NorESM2-LM 0.310.300.320.310.310.310.320.31
MPI-ESM1-2-LR0.300.310.310.310.310.310.320.31
EC-Earth30.320.320.310.320.340.330.320.33
Near-term (2025–2050); mid-term (2051–2075); long-term (2076–2100).
Disclaimer/Publisher’s Note: The statements, opinions and data contained in all publications are solely those of the individual author(s) and contributor(s) and not of MDPI and/or the editor(s). MDPI and/or the editor(s) disclaim responsibility for any injury to people or property resulting from any ideas, methods, instructions or products referred to in the content.

