Abstract
Unsaturated saline soils are widely present in engineering, and their matric suction is crucial for engineering design and stability analysis. To explore the factors influencing matric suction characteristics, the filter-paper method was used to measure the matric suction of unsaturated saline soils under different compaction degrees and salt contents. The results show that matric suction decreases with increasing water content, and the change is more obvious in the absorbed film regime (water content = 14–22%). The increase in compaction degrees leads to an increase in matric suction, but the impact is relatively minor in the low suction regime. The increase in salt content indirectly changes the thickness of the bound water film, causing the matric suction to decrease first and then increase; the threshold value of the salt content is 1.2%. In addition, the applicability of traditional soil–water characteristic curve models is limited in saline soils. However, the modified Gardner model considering the bound water content can more accurately describe the soil–water relationship of saline soils. These research findings provide a key foundation for the in-depth comprehension of the engineering properties of saline soils and their effective application in practical engineering.
1. Introduction
Saline soil, which is dominated by carbonate, is widely distributed in western Jilin, China. Moreover, western Jilin belongs to the temperate continental monsoon climate zone, which is in the transition zone between semi-humid and semi-arid climates, and the climate changes significantly in the four seasons [1]. The water and salt content of saline soil is constantly changing in response to changes in external climate conditions, which leads to changes in the engineering properties (such as collapsibility, salty swell corrosivity, etc.) of saline soil. For example, although the precipitation in summer is low but more concentrated, the soil will produce seasonal desalination. Spring and autumn are relatively dry, the precipitation decreases, and the evaporation increases, which leads to the accumulation of soil salt. In some severely cold areas in winter, part of the pore water in the soil freezes and can also cause salt migration from the soil center. Due to water evaporation and plant transpiration, most of the saline soil encountered in the current project was in an unsaturated state, and its engineering properties differed greatly compared with those of ordinary soil, which is greatly affected by soluble salts. Suction is an important parameter to characterize the properties of unsaturated soil, and it can be used to evaluate the water-holding characteristics of soil. Based on the change in matric suction of carbonate saline soils with different compaction degrees and salt contents, this paper discusses the water-holding characteristics and matric suction change mechanism of carbonate saline soil under different conditions to provide theoretical references for the design, construction, and safe operation of projects in saline–alkali areas.
The soil–water characteristic curve is an important index for obtaining the relationship between matric suction and soil water content [2,3,4]. There are many existing studies on soil–water characteristic curves of saline soils, and most of them focus on the research of matric suction. Therefore, on this basis, this paper would like to further analyze and discuss the mechanism of matric suction variation and water-holding characteristics. At present, the use of the filter-paper method is a relatively mature measurement method for measuring not only the matric suction but also the total suction of soil samples [5,6]. The filter-paper technology was initially applied in the fields of agriculture and soil science [7]. Subsequently, many scholars at home and abroad have discussed and analyzed the test methods for measuring matric suction by contact filter-paper technology [8,9,10]. Matric suction is derived from the combined effect of capillary action and short-range adsorption, so the contact filter-paper technology indirectly obtains the matric suction by measuring the amount of pore water transfer into a soil sample controlled by capillary action and adsorption on the soil particle surface [11].
Since the western part of Jilin, China, belongs to the seasonal permafrost region, the salt migration in the saline soil due to the effect of alternating heat and cold, as well as precipitation, leads to changes in the salt content and also some changes in the saturation of pore water inside the soil, and salinity is a critical factor in meeting the environmental challenges in saline areas [12,13]. The change in soil sample compaction degree can reflect the variation in pore water saturation; this is because, with the same conditions, the higher the compaction degree of the soil, the smaller the porosity ratio and the higher its saturation. Therefore, this paper used the filter-paper method test standard specified by the American Society for Testing and Materials [14] to explore the influence of salt contents and compaction degrees on matric suction. The results will be discussed and analyzed later in the paper.
Soil–water characteristic curves can be obtained not only by direct measuring methods but also by fitting them according to traditional models. The Brooks–Corey model is the earliest proposed model for the soil–water characteristic curve, which is more suitable for coarse-grained soils with a small variation range of matric suction, as it is not very representative when the matric suction is large [15]. The Gardner model is widely applied to fit the soil–water characteristic curve due to its simple form with fewer and more easily determined parameters, which can quickly and accurately estimate the soil–water characteristics of saline soils, but many scholars argue that it cannot fit the soil–water characteristic curve in the full suction range [16]. Therefore, in this paper, this model is used to verify whether it can fit the soil–water characteristic curve in the local suction range. Ref. [17] proposed a mathematical model containing three fitting parameters (a, m, and n) in 1980 to fit the soil–water characteristic curve with high accuracy. The Fredlund–Xing model is analogous to the Van Genuchten model; it can fit the soil–water characteristic curve over the entire suction range [18].
In this paper, the Gardner model was selected to fit the soil–water characteristic curve of saline soil in the study area and determine the fitting parameters to verify whether the Gardner model can accurately fit the soil–water characteristic curve in the local suction range and to analyze the causes of the errors.
2. Materials and Methods
2.1. Sampling Area and Soil Properties
The soil samples for this study were taken from Qian’an County in western Jilin, China (N 45°02′25.490″, E 123°47′1.148″). Qian’an County is located in the northwest of Jilin Province and belongs to the border area between Baicheng City and Songyuan City. The saline soil at the sampling site is widely distributed, with little vegetation, and the surface contains a large amount of gray-white soluble salt crystals (Figure 1).
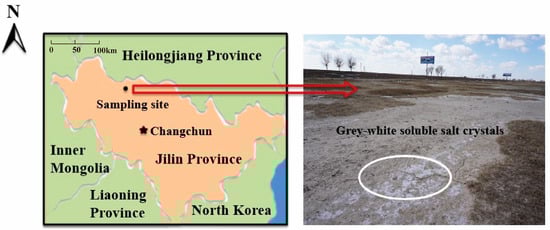
Figure 1.
Geographical location of the study area.
The gentle terrain of the sampling area and the high content of clay particles in the soil lead to poor groundwater drainage, so the water is mainly discharged in the form of evaporation. The salt in the surface and groundwater constantly collects towards the center of the plain. After evaporation, salt accumulation occurs, which is one of the reasons for the occurrence of saline soil in this area.
The groundwater in the sampling area is shallowly buried, and the rising height of capillary water occupies a larger proportion of the soil layer thickness, so the salt in the groundwater gathers in the upper layer of the soil with the help of upward migration of capillary water under the strong evaporation and freezing effect, which is the main reason for the occurrence of saline soil in this area.
The depth of the soil samples selected in this study was 0.4 m below the surface because this depth is a certain distance from the surface and is not easily disturbed. Previous studies have shown that salt is most likely to accumulate at this depth, and the migration of salt is the most significant factor [19]. This is due to the upward migration of groundwater caused by the evaporation and freezing effect of the surface layer, and it accumulates at 0.4 m below the surface. Meanwhile, the total amount of soluble salt is largest at this depth, which is of great research significance, so this layer was chosen in this study.
The particle size composition of the soil samples was obtained by the laser particle size analyzer (BT-9300L, Baite Instrument Co., Ltd., Dandong, China). The principle of this method is to utilize the scattering effect of particles on a parallel beam [20]; the parallel light from the laser is irradiated to the soil particles, followed by the scattering phenomenon, and then, based on the principle that the scattering angle is inversely proportional to the particle diameter, the photoelectric signals received by the receiver are converted into the particle size composition of the sample. The results obtained are shown in Figure 2. The clay content (particle size <0.005 mm) in the soil can be calculated from the particle size distribution curve in Figure 2 as 41.64%; the silt (0.005–0.075 mm) content is 49.62%, and the sand (>0.075 mm) content is 8.74%.
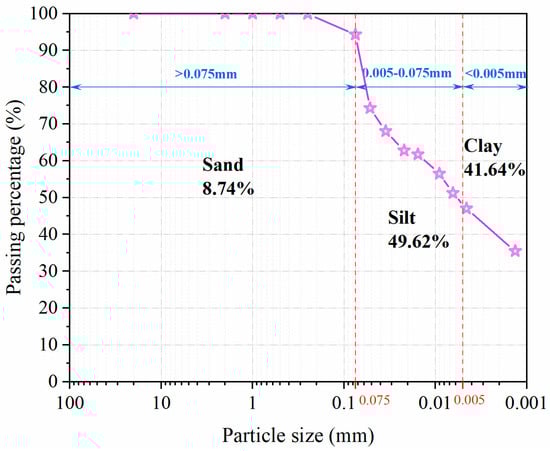
Figure 2.
Particle size distribution of original saline soil.
The dispersion of the geotechnical test data is relatively high [21], and to eliminate the deviation of each test group, the physical indexes of the soil samples were obtained by using multiple sets of tests. Some physical indexes of this layer of soil are shown in Table 1. Among the indexes in Table 1, the natural water content is the initial water content of the soil in its original state measured at the sampling site. The liquid limit is less than 50%, the plasticity index is greater than 7 and greater than , and the soil sample is named as low liquid limit clay (CL) according to the USCS classification standard [22].

Table 1.
List of some physical indexes of the original soil sample.
The total salt content in the soil samples was measured using water-bath evaporation as 0.71%, which exceeded 0.3, so it belonged to saline soil. As can be seen in Table 2, the anions and cations in the soil were mainly HCO3− (0.237%) and Na+ (0.074%), so the soil samples from the study area belonged to carbonate saline soil.
Table 2.
Soluble salt contents of original saline soil.
2.2. Sample Preparation
Compaction degrees and salt contents were selected to explore the patterns of their effects on the water-holding characteristics of the saline soil in western Jilin, China. The compaction degree is the proportion of the dry density to the maximum dry density of soil samples; the dry density refers to the density of the soil when the pores are completely free of water, that is, the mass per unit volume of soil; and the maximum dry density is the dry density corresponding to the peak point on the curve of the dry density versus the water content obtained from the compaction test [23]. Therefore, the greater the compaction degree, the closer the soil particles are arranged and the better the overall performance of the soil. In saline soil foundations, pavements, slopes, etc., the compaction degree is mostly around 90%; to ensure the stability and bearing capacity of a foundation, the compaction degree of the fill foundation of clay soil should not be less than 0.93, and the compaction degree of the fill foundation of silt and sand soil should not be less than 0.95. Additionally, according to the technical code for building in saline soil regions [24], the compaction degree is taken to be around 90% (85%, 90%, or 95%). The salt content is the total mass of soluble salts in the soil as a percentage of the total mass of dry soil. Due to the large salt content in saline soil areas, the salt will dissolve or crystallize with the change in water and salt content, resulting in a change in the internal structure of the soil. The soil sample contained mostly Na+ among the cations and mostly HCO3- among the anions (Table 2), so NaHCO3 was selected as the experimental variable. To cover and exceed the range of the natural salt content of saline soils in the study area, the content of NaHCO3 was selected to be 0–2%, and pre-experiments were conducted. It was found that when the content of NaHCO3 varied in the range of 1–1.5%, there existed a threshold value that minimized the matric suction of the soil samples; therefore, a 1.2% NaHCO3 content was added. The final contents of NaHCO3 were taken to be 0, 0.5%, 1.0%, 1.2%, 1.5%, and 2.0%.
Before preparing the samples, in order to exclude the interference of other types of soluble salts in this test, the soil samples were first washed. The soil samples were mixed with distilled water at a soil–water ratio of 1:5, stirred thoroughly, and left to stand. The water was changed every 48 h and part of the supernatant was extracted to determine the soluble salt content in it, and the steps were repeated until the total amount of soluble salt no longer varied with the time of soil washing. After washing the soil, the saline soil was air-dried, crushed, and passed through a 2 mm sieve.
When preparing the samples, a certain mass of NaHCO3− powder was first weighed according to different salt contents and added to the soil samples, the samples were mixed evenly, then a certain volume of distilled water was measured according to the different water contents, sprayed on the dry soil and mixed well with it, and the mixtures were put it into plastic bags. The soil samples, which were not yet completely prepared, were then placed in a constant-temperature chamber at 26 ± 1 °C for 24 h to allow the water and salt to be evenly distributed in the soil. Finally, the soil samples were taken out of the constant-temperature chamber, certain masses of soil samples were weighed according to the different compaction degrees, then each sample of weighed soil was put into a mold (61.8 mm in diameter and 20 mm in height) using a drop hammer to solidify the soil sample, so that the height of the soil sample met the height of the mold, and subsequently the soil sample was taken out. At this time, the samples were completely prepared and ready for the suction test.
2.3. Test Principle
The test used Shuangquan No. 203 slow-speed quantitative filter paper (Hangzhou, China) to measure the matrix suction of soil samples with different salt contents and compaction degrees by contact filter-paper technology. Matric suction consists of short-range adsorption and capillary action within the soil. So, during the test, the filter paper is placed in the middle of two samples, and the constant temperature is maintained at 26 ± 1 °C. When the equilibrium state is reached, the matric suction can be indirectly obtained by measurement of the amount of water being transferred to the filter paper controlled by capillary action and short-range adsorption. The matric suction can be calculated according to the following equations (Equation (1)) for calibration curves [25].
where μa is the pore air pressure, μω is the pore water pressure, (μa − μω) is the matric suction, and ωf is the water content of the filter paper.
2.4. Test Procedure
Before the test, the filter paper should be placed in an oven at 105 °C, dried to a constant weight, and then cooled to room temperature. A sealed container should be taken out and two soil samples with the same characteristics (water content, compaction degree, and salt content) should be placed in it, then the filter papers should be placed between the two cutting-ring samples prepared above (Figure 3).
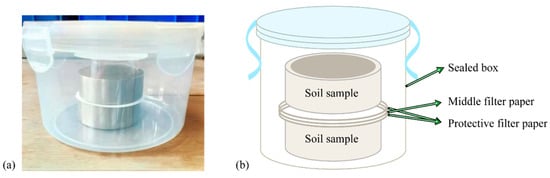
Figure 3.
(a) Picture of contact filter-paper technology for the measurement of matric suction. (b) Schematic diagram of contact filter-paper technology for the measurement of matric suction.
To ensure the accuracy of the test, three filter papers are usually stacked together to protect the middle filter paper from contamination by the soil sample [26,27,28,29]. Then, the samples are placed in a constant-temperature chamber at 26 ± 1 °C and kept for 10 days to ensure that the amount of water transferred from the soil sample to the filter paper reaches an equilibrium state. After the test, the middle filter paper should be weighed quickly with an electronic balance to avoid water loss. After drying the filter paper again, its mass should be weighed to calculate the water content of the equilibrated filter paper, and the matrix suction should be calculated using Equation (1).
3. Results and Discussion
3.1. Change in Matric Suction Behavior with Water Content
Instead of setting up multiple groups of tests first, only a single salt content and compaction degree were selected. The natural water content within 160 cm below the surface of the sampling area varied from 13.31% to 21.58%, so soil samples with six different water contents (14%, 16%, 18%, 20%, 22%, and 24%), which were within the range of natural water contents, were subjected to matric suction measurement using contact filter-paper technology under the condition of a 0.71% salt content (natural salt content) and a 90% compaction degree, and the soil–water characteristic curve in conventional semi-logarithmic coordinates was drawn (Figure 4).
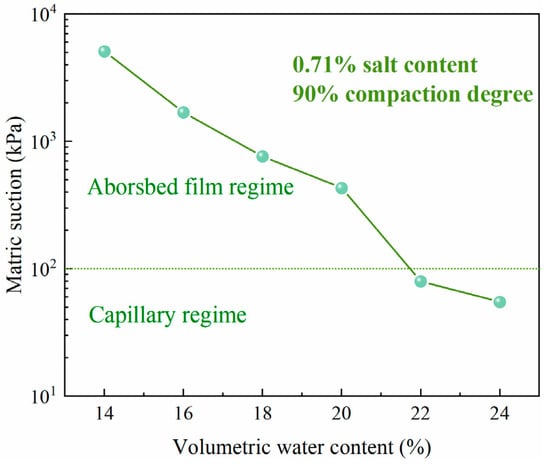
Figure 4.
The soil–water characteristic curve of saline soil in the study area.
As can be seen in Figure 4, the matric suction obtained in this test ranged from 104 to 10 kPa, and, according to the general conceptual model of the soil–water characteristic curve given in the book Unsaturated Soil Mechanics, all the soil–water characteristic curves in the full suction range can be divided into three parts [11]. The tightly adsorbed regime with suction between 106 and 104 kPa is called the high suction regime; the adsorbed film regime with suction between 104 and 102 kPa is called the middle suction regime; and the capillary regime with suction between 102 and 0 kPa is known as the low suction regime. So, only the adsorbed film regime and the capillary regime exist in the soil–water characteristic curve of this test. Throughout the process of moisture absorption, the matric suction decreases with the gradual increase in water content. In the soil–water characteristic curve (Figure 4), it can be seen that in the adsorbed film regime, the matric suction decreases rapidly with increasing water content, whereas it decreases more slowly in the capillary regime. This shows that when the water content varies within the absorbed film regime, it has a greater effect on the matric suction.
The pore water in the adsorbed film regime is mainly attached to the soil particles as weakly bound water, and the matric suction is affected by short-range adsorption, which is mainly generated by the ionic electrostatic attraction and van der Waals force near the solid–liquid interface. The two forces mentioned above are related to the distance between soil particles and water molecules. The net negative charge on the surface of the clay mineral makes the electrostatic attractive field form around it, and its field strength decreases with the increasing distance from the surface of the soil particles. The polar water molecules close to the surface of the soil particles are polarized and inactive and are arranged closely and directionally on the surface of the soil particles, forming a strongly bound water film. As the water content increases, the water molecules move farther and farther away from the surface of the soil particles, the effect of electrostatic attraction becomes smaller and smaller, the arrangement becomes looser, and the strongly bound water film gradually transits to the weakly bound water film; as the water content increases further, the effect of electrostatic attraction becomes negligible, and the water molecules remain free to move. At this time, the occurrence state of pore water is gradually transformed from transitional capillary water to free water (Figure 5).
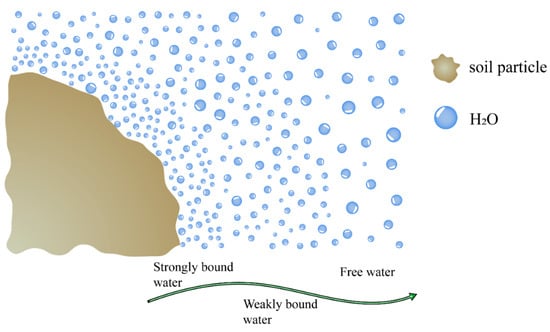
Figure 5.
The arrangement of water molecules around a soil particle.
Therefore, as the content of water increases, the distance between the water molecules and the surface of the soil particles increases and the effect of electrostatic attraction decreases, resulting in less and less matric suction.
In summary, with increasing water content, electrostatic attraction and van der Waals forces become less and less effective, then the short-range adsorption gradually weakens, so the matric suction gradually decreases. This explains the downward trend of the adsorbed film regime in the soil–water characteristic curve.
In the capillary regime, the weakly bound water film reaches a saturated thickness that is beyond the range of short-range adsorption. The pore water gradually transits to the capillary water, so the matric suction is mainly affected by the capillary action. Due to the surface tension of water, the air–water interface is curved inside the soil (Figure 6), which can be obtained from the Young–Laplace equation (Equation (2)) as follows.
where Ts is the surface tension of water, r1 and r2 are the radii of curvature of the air–water interface, and α is the contact angle.
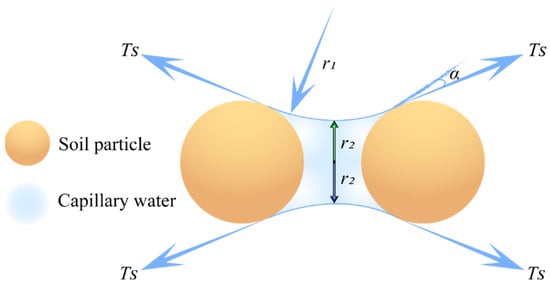
Figure 6.
Geometry and force diagram of solid–liquid interface in unsaturated soil.
With increasing water content, the radius of curvature increases and the curvature decreases; then, according to Equation (2), the matric suction decreases. At present, most scholars believe that the contact angle (α) is an inherent property of any two contacting material phases, but some scholars argue that α is not a constant value and that it grows with the increasing water content during the moisture absorption process, so that the matric suction decreases accordingly [30].
In summary, the matric suction gradually decreases with the increasing water content under the combined effect of the contact angle and the radius of curvature. This explains the phenomenon that the soil–water characteristic curve shows a downward trend in the capillary regime.
The soil–water characteristic curves of the saline soils used in the experiment are almost the same as the conventional soil–water characteristic curves. The matric suction decreases to a greater extent in the adsorbed film regime, but the change in water content is small, indicating that the water-holding capacity is better at this stage. The decrease in matric suction in the capillary regime is small, but the change in water content is large, indicating that the water-holding capacity is relatively poor at this stage. This is because the weakly bound water film has a stronger adsorption capacity and the capillary water is relatively free (Figure 6), leading to a greater effect of short-range adsorption on the matric suction than that of capillary action.
3.2. Influence of Compaction Degree on Matric Suction
To explore the effect of compaction degree on the matric suction of the saline soil in the study area, only the compaction degree was considered as a single variable. Therefore, the three previously mentioned compaction degrees of 85%, 90%, and 95% were selected to determine the soil–water characteristic curves under the conditions that the salt content was 0.71% (natural salt content) and the water contents were 14%, 16%, 18%, 20%, 22%, and 24% (Figure 7).
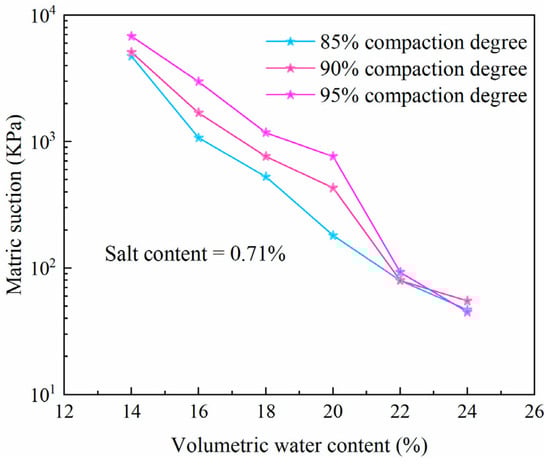
Figure 7.
Soil–water characteristic curves at different compaction degrees.
The measured results showed the following: (1) When the water content varies between 14% and 22%, the matrix suction varies between 100 kPa and 10,000 kPa, indicating that this stage is in the adsorbed film regime (water content = 14% to 22%); when the water content varies between 22% and 24%, the matrix suction varies between 10 kPa and 100 kPa, indicating that this stage is in the capillary regime. (2) In the adsorbed film regime, the greater the degree of compaction, the larger the water content corresponding to the same matric suction, indicating that the water-holding capacity of the soil increases with the increase in compaction degree at this stage. Moreover, the greater the degree of compaction, the greater the rate of decline of the curves. That is to say, within this range, the compaction degree has a significant effect on the variation in water content and matric suction. (3) In the capillary regime (water content = 22%~24%), the soil samples of different compaction degrees tend to be saturated as the water content gradually increases. When the water content is near 23%, soil–water characteristic curves of high-compaction degree soil and low-compaction degree soil are crossed and the law shown after the cross point is exactly opposite to that of the adsorbed film regime. This is because, as the compaction degree increases, the pores inside the soil become smaller and the saturated water content of the soil decreases. Therefore, at this stage, the greater the compaction degree, the smaller the water content that corresponds to the same matric suction and the weaker the water-holding capacity.
Therefore, in the absorbed regime of this test, the compaction degree has a greater effect on the matric suction, and as the compaction degree increases, the water-holding capacity of the soil improves; 23% is the limited water content of this test. When the water content is in the range of 22%~24%, the soil–water characteristic curves enter the low suction regime; this stage is in the capillary regime section (but it is not all capillary regime), and the impact of the compaction degree on the matric suction is minimal and the impact on the water-holding capacity is not significant.
To illustrate the effect of compaction degree on matric suction from a microscopic point of view, SEM images (2000×) of soil samples with different compaction degrees were obtained, as shown in Figure 8.
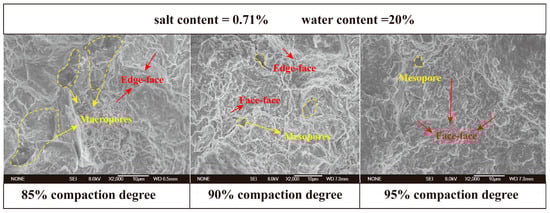
Figure 8.
SEM images (2000×) of soil samples at different compaction degrees.
As shown in Figure 8, when the compaction degree is 85%, the contact relationship between the soil particles is mainly edge–face contact, and the contact area is relatively small; when the compaction degree is 90%, the contact relationship between the soil particles is both edge–face contact and face–face contact; when the degree of compaction is increased to 95%, the contact area between the soil particles also increases, and face–face contact is predominant. Moreover, with the increase in compaction degree, the number and volume of pores in the soil gradually decrease and the soil structure gradually becomes dense, which is in keeping with the conclusions of many scholars [31,32].
Therefore, the greater the compaction degree, the denser the soil, the smaller the pores within the soil, and the stronger the capillary effect; meanwhile, as the internal pores of the soil decrease with the increase in the compaction degree, the internal space of the soil shrinks and the short-range adsorption becomes more obvious. Under the combined effect of both factors, the saline soil within the adsorbed film regime has better water-holding capacity with the increase in the compaction degree.
3.3. Influence of Salt Content on Matric Suction
Most of the existing studies focused on the influence of salt content on osmotic suction, but the influence of salt content on matric suction should not be neglected.
Based on the long-term monitoring of the sampling area, it was found that the soluble salt content of the saline soil in this area is almost below 1.42%. Therefore, seven NaHCO3 contents of 0, 0.5%, and 0.71% (natural salt contents) and 1.0%, 1.2%, 1.5%, and 2.0% were selected to determine their soil–water characteristic curves under the conditions of a 90% compaction degree and water contents of 14%, 16%, 18%, 20%, 22%, and 24% (Figure 9).
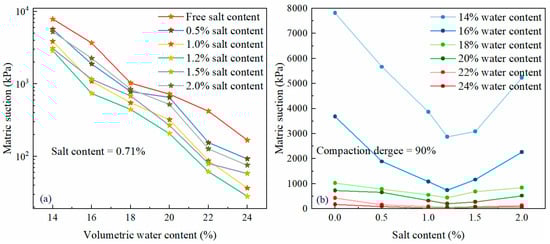
Figure 9.
(a) Soil–water characteristic curves at different salt contents. (b) Salt content–matric suction curves.
From the soil–water characteristic curves in Figure 9a, the following can be seen: (1) In the middle suction regime, the matric suction changed more obviously with the change in salt content. In the low suction regime, the six soil–water characteristic curves decreased slowly. This suggests that salt content has a greater effect on the matric suction in the middle suction regime, while in the low suction regime, the salt content has a lesser effect on matric suction. (2) In the middle suction regime, the soil–water characteristic curve of the salt-free soil decreases significantly faster than those of the other saline soils, which indicates that the existence of salt will significantly reduce the matric suction of the soil and weaken its water-holding capacity. (3) The soil–water characteristic curve of the salt-free soil (saline soil when the salt content is 0) is slower than those of the other saline soils, while the soil–water characteristic curves of the other saline soils are below the soil–water characteristic curve of the salt-free soil, indicating that there are certain effects of salt content on matric suction.
Figure 9b shows that at the same water content, the matric suction first tends to decrease with increasing salt content and then gradually increase as the salt content approaches 1.2%.
The soil sample had a high content of primary minerals in its mineral composition, and secondary minerals were mainly dominated by clay minerals, with a content of 12% (Table 3), while the illite and montmorillonite mixed layer accounted for 57% of the total. For clays with a high content of montmorillonite, the addition of salt decreases the Atterberg limit, which in turn reduces the saturated thickness of the bound water film [33,34]; this results in a lower percentage of bound water in the pore water. In the high suction regime, the occurrence form of pore water is mainly strongly bound water; in the middle suction regime, the occurrence form of pore water is mainly weakly bound water; and the occurrence form of pore water in the low suction regime is mainly capillary water. Thus, salt additions mainly affect the matric suction in both the high and middle suction regimes, while having little effect on the low suction regime, which is consistent with the conclusions of Zhao et al. [35]. Moreover, the addition of salt may lead to different occurrence forms of pore water in salt-free soil and other saline soils with the same water content, which indicates that the change in matric suction caused by the addition of salt is mainly due to the change in the occurrence form of pore water caused by the salt. Huang et al. [36] also concluded that salinity can change the soil porosity, which in turn affects the water-holding capacity of saline soil.
Table 3.
Mineral composition of the soil sample.
To make the impact of salt content on matric suction more obvious, three compaction degrees of 85%, 90%, and 95% were used to determine the relationship curves between salt content and matric suction at a water content of 20%. The results are shown in Figure 10.
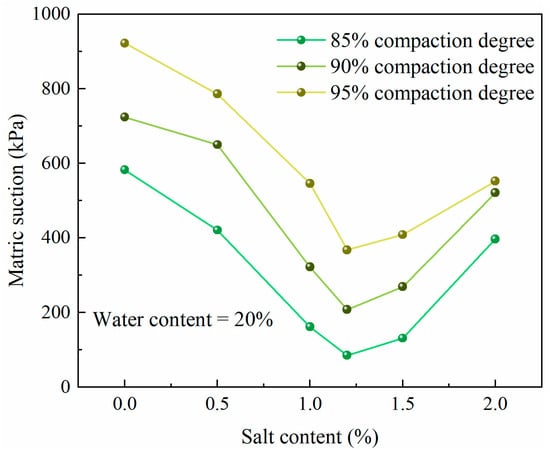
Figure 10.
Salt content–matric suction curves at different compaction degrees.
It is obvious from Figure 10 that under any compaction degree, as the salt content increases, the matric suction first shows a decreasing trend, then, when the salt content is near 1.2%, the matric suction starts to increase gradually.
Due to the presence of a large number of charges on the surface of soil particles, the charges adsorb polar water molecules in the water, thus forming a diffuse double electric layer. According to the clay electric double-layer theory, the thinner the diffusion layer, the greater the matric suction; conversely, the thicker the diffusion layer, the lesser the matric suction [37]. As shown in Figure 11, when the salt content increases from 0 to 1.2%, counterions (ions with the opposite sign of charge to the surface of the clay particles) in the solution of pore water, that is, Na+, gradually increase and fill the diffusion layer, making the diffusion layer thicker and the matric suction decrease. However, the continuous increase in Na+ can lead to an enhanced cation exchange capacity, increasing the number of charges carried on the surface of the soil particles. Thus, when the salt content continues to increase from 1.2%, the concentration of Na+ also continues to increase. At this time, Na+ have a repulsive effect on the existing counterions in the diffusion layer, so that the counterions in the diffusion layer gradually enter the fixed layer, and the diffusion layer thus becomes thinner and the matric suction gradually increases.
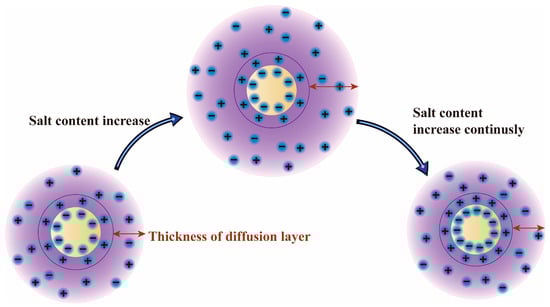
Figure 11.
Schematic diagram of the diffusion layer under different salt contents.
The matric suction shows a tendency to decrease and then increase with increasing salt content for all three different compaction degrees, so the effect of compaction degree on this trend is not significant.
However, the influence of compaction degree on the variation range of matric suction is more obvious.
To illustrate the influence of compaction degree on matric suction from a microscopic point of view, SEM images (800×) of soil samples with different salt contents were obtained, as shown in Figure 12.
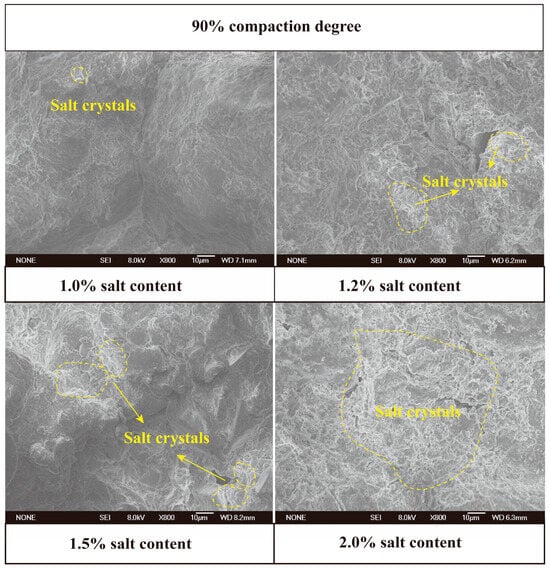
Figure 12.
SEM images (800×) of soil samples with different salt contents.
As can be seen from Figure 12, there are fewer salt crystals between the soil aggregates when the salt content is 1.0%, but there is a significant increase in the number of salt crystals when the salt content is 1.2%, and more and more salt crystals can be observed as the salt content continues to increase; the precipitated salt crystals attach to and fill the spaces between soil particles, resulting in a decrease in the amount of Na+ in the diffusion layer. Therefore, the crystallization of salt is also a reason for the decrease in the matric suction.
In summary, the amount and concentration of counterions (Na+) mainly determine the thickness of the diffusion layer, which in turn dominates the variation in the matric suction. When the amount of counterions added increases, the diffusion layer becomes thicker and the matric suction decreases; when the amount of added counterions reaches a certain limit, their repulsive effect on the existing counterions in the diffusion layer is obvious, and the existing counterions are repelled into the fixed layer. At the same time, the salt reaches saturation, prompting salt crystallization. Thus, the diffusion layer becomes thinner and the matric suction increases gradually. It can be concluded that salt ions change the saturated thickness of the bound water film by changing the thickness of the diffusion layer, which makes the matric suction change correspondingly according to the occurrence form of the pore water.
4. Fitting the Modified Gardner Model of the Soil–Water Characteristic Curve
The Gardner model is relatively simple in form and highly used. However, when calculating with this model, all the water in the soil is regarded as free water, and the effect of bound water is ignored. Saline soils have a higher salt content compared to other soils, and salt ions can indirectly change the film thickness of the bound water; and when the content of water is relatively high, the proportion of bound water to all the water in the soil is relatively small, such that the influence of bound water can be neglected, but when the content of water is relatively low, the proportion of bound water to all water in the soil is large, such that the influence of bound water cannot be neglected. Therefore, the bound water content is taken into account in the model to propose a modified Gardner model suitable for saline soils (Equation (3)).
where θ is the volumetric water content of the soil sample, θ′ is the volumetric bound water content of the soil sample, and a and b are fitting parameters.
Equation (3) was used to fit the soil–water characteristic curves of the saline soil samples from Qian’an County in western Jilin, China, which had the same compaction degree and different salt contents, and the fitted values were compared with the measured values (Figure 13).
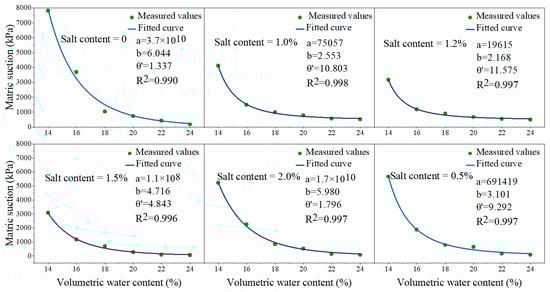
Figure 13.
Fitted curves of the modified Gardner model with the variation in salt contents.
As can be intuitively seen in Figure 13, the modified Gardner model considering the effect of bound water content fits well. The R2 values are all greater than 0.99. When the salt content was 0, the value of was 1.34%, and when the salt content increased to 0.5%, the value of rapidly increased to 9.29%, which shows that the salt ions had a great impact on the bound water film. With the gradual increase in the salt content, the value of rose to 11.57% and reached its peak when the salt content was 1.2%; the subsequent value of decreased with the increase in the salt content. This is consistent with the conclusions obtained before: with the gradual increase in the salt content, the salt ions first entered the diffusion layer, which thickened the bound water film; when the salt ions reached saturation in the diffusion layer, they entered the fixed layer and the bound water film became thinner. Thus, the effect of the salt content on the matric suction of saline soil is essential.
In general, as the salt content of saline soils is above 0.3%, which indirectly has some impact on the matric suction, the traditional empirical models of soil–water characteristic curves are not always suitable for saline soils. In this paper, the factor of bound water content was taken into account, and the results show that the modified Gardner model is more suitable for fitting the soil–water characteristic curves of saline soils compared with the original Gardner model.
5. Conclusions
This paper investigated the behaviors of unsaturated saline soils’ matric suction concerning water content, compaction degree, and salt content by the filter-paper method and analyzed the influence mechanism by SEM. This study can provide a more comprehensive understanding of the mechanisms by which compaction degree and salt content affect matric suction in unsaturated saline soils from a microscopic perspective. In addition, the Gardner model was modified to further verify the influence of salt content on matric suction. The conclusions obtained are as follows:
- When the water content varies from 14 to 22%, the matric suction of unsaturated saline soil is in the absorbed film regime, while when the water content varies from 22 to 24%, the matric suction is in the capillary regime. The water content has a greater impact on the matric suction in the absorbed film regime. Similarly, the water-holding capacity of unsaturated saline soil in the absorbed film regime is better than that in the capillary regime.
- The compaction degree increases the matric suction and water-holding capacity of unsaturated saline soil by shrinking the pores within the soil and changing the contact relationship between soil particles. When the compaction degree varies from 85 to 95%, the greater the compaction degree, the higher the matric suction and the water-holding capacity. When the soil sample is close to saturation, the law is opposite to the previous one.
- The presence of salt will significantly reduce the matric suction of soil, and as the salt content increases from 0 to 1.2%, the matric suction and water-holding capacity of the soil show, first, a weakening trend, then, as the salt content constantly increases from 1.2 to 2.0%, the matric suction and water-holding capacity begin to increase.
- A modified Gardner model with bound water content has been proposed, which fitted the soil–water characteristic curves of the soil samples with high accuracy. According to the fitting results, the bound water content shows a trend of first increasing and then decreasing with the increase in salt content, with a variation range of 1.34%~11.57%, which shows that in saline soils, the effect of salt content on matrix suction cannot be neglected.
In conclusion, this paper quantitatively analyzed the influencing factors of matrix suction and water-holding capacity of unsaturated saline soils and can thus provide some theoretical references for ensuring the stability and safety of foundations, slopes, and other constructions. The modified Gardner model can also be used in groundwater management, slope stability analysis, and soil improvement. Additionally, the results of this study could provide a reference for researchers in geotechnical engineering to explore more complex soil–water behaviors or develop new models for soil analysis. However, this study still has some limitations; the salt content and the compaction degree are not the only factors affecting matric suction, and the magnitude of matric suction ultimately depends on the thickness of the pore water film. Therefore, in the field of saline soil improvement and agricultural irrigation, soil type, region, temperature, freeze–thaw cycling, and other factors may affect the matric suction of soil in the actual environment. In future research, more attention will be paid to the strength, deformation, and other properties of saline soils to grasp the mechanical properties of saline soils more comprehensively and apply them to the field of saline soil improvement and improve its significance in practical engineering.
Author Contributions
Conceptualization, X.S. and H.C.; methodology, X.S. and H.C.; software, X.S.; validation, X.S., H.C., Q.Y. and Q.W.; formal analysis, X.S.; investigation, B.M.; resources, B.M.; data curation, X.S., H.C., Q.Y. and Z.W.; writing—original draft preparation, X.S.; writing—review and editing, X.S.; visualization, X.S.; supervision, H.C. and Q.W.; project administration, H.C. and Q.W.; funding acquisition, Q.W. and Q.Y. All authors have read and agreed to the published version of the manuscript.
Funding
This research was funded by the National Natural Science Foundation of China (Grant No. 42330708) and the National Natural Science Foundation of China (Grant No. 42302329).
Data Availability Statement
The data used and/or analyzed during the current study are available from the corresponding author on reasonable request.
Acknowledgments
We sincerely thank the editors and all anonymous reviewers for their constructive reviews which helped to improve the paper.
Conflicts of Interest
Bing Ma was employed by Yellow River Engineering Consulting Co., Ltd. The remaining authors declare that the research was conducted in the absence of any commercial or financial relationships that could be construed as a potential conflict of interest.
References
- Ma, B. Physico-Mechanical Properties and Mechanism Analysis of Lime-Solidified Saline Soil Under Freezing-Thawing Cycle Conditions. Ph.D. Thesis, Jilin University, Jilin, China, 2018. [Google Scholar]
- Eyo, E.U.; Ng’ambi, S.; Abbey, S.J. An overview of soil–water characteristic curves of stabilised soils and their influential factors. J. King Saud Univ.-Eng. Sci. 2022, 34, 31–45. [Google Scholar] [CrossRef]
- Li, A.G.; Tham, L.G.; Yue, Z.Q.; Lee, C.F.; Law, K.T. Comparison of Field and Laboratory Soil–Water Characteristic Curves. J. Geotech. Geoenviron. Eng. 2005, 131, 1176–1180. [Google Scholar] [CrossRef]
- Zheng, X.; Zhao, F.; Sun, S. Study on the Tests of Soil-Water Characteristic Curves of Unsaturated Soil. Appl. Mech. Mater. 2013, 353–356, 16–19. [Google Scholar] [CrossRef]
- Houston, S.; Houston, W.; Wagner, A.-M. Laboratory Filter Paper Suction Measurements. Geotech. Test. J. 1994, 17, 185–194. [Google Scholar] [CrossRef]
- Ridley, A.M.; Dineen, K.; Burland, J.B.; Vaughan, P.R. Soil matrix suction: Some examples of its measurement and application in geotechnical engineering. Geotechnique 2003, 53, 241–253. [Google Scholar] [CrossRef]
- Buckingham, E. Studies on the Movement of Soil Moisture; Bureau of Soils No. 38; US Department of Agriculture: Washington, DC, USA, 1907. [Google Scholar]
- Suits, L.; Sheahan, T.C.; Leong, E.; He, L.; Rahardjo, H. Factors Affecting the Filter Paper Method for Total and Matric Suction Measurements. Geotech. Test. J. 2002, 25, 322–333. [Google Scholar] [CrossRef]
- Thyagaraj, T.; Rao Sudhakar, M. Influence of Osmotic Suction on the Soil-Water Characteristic Curves of Compacted Expansive Clay. J. Geotech. Geoenviron. Eng. 2010, 136, 1695–1702. [Google Scholar] [CrossRef]
- Miller, D.J.; Nelson, J.D. Osmotic Suction in Unsaturated Soil Mechanics. In Unsaturated Soils 2006; ASCE: Reston, VA, USA, 2012; pp. 1382–1393. [Google Scholar] [CrossRef]
- Lu, N. Unsaturated Soil Mechanics; Wiley: New York, NY, USA, 2004. [Google Scholar]
- Zhang, X.; Zuo, Y.T.; Wang, T.J.; Han, Q. Salinity Effects on Soil Structure and Hydraulic Properties: Implications for Pedotransfer Functions in Coastal Areas. Land 2024, 13, 2077. [Google Scholar] [CrossRef]
- Tan, Q.K.; Huo, S.Y.; Wang, D.; Wen, M.; Xing, M.T.; Lu, M.Y. Hysteresis of Water Retention Curve of the Capillarimetric Diapason in Saline Soils. Eurasian Soil Sci. 2024, 57, 1217–1230. [Google Scholar] [CrossRef]
- ASTM D5298-16; Standard Test Method for Measurement of Soil Potential (Suction) Using Filter Paper. ASTM International: West Conshohocken, PA, USA, 2016.
- Brooks, R.H.; Corey, A.T. Hydraulic Properties of Porous Media. Hydrol. Pap. 1964, 3, 1–27. [Google Scholar]
- Gardner, W.R. Some steady-state solutions of the unsaturated moisture flow equation with application to evaporation from a water table. Soil Sci. 1958, 85, 228–232. [Google Scholar] [CrossRef]
- van Genuchten, M.T. A Closed-form Equation for Predicting the Hydraulic Conductivity of Unsaturated Soils. Soil Sci. Soc. Am. J. 1980, 44, 892–898. [Google Scholar] [CrossRef]
- Fredlund, D.; Xing, A.; Huang, S. Predicting the permeability function for unsaturated soils using the soil-water characteristic curve. Can. Geotech. J. 1994, 31, 533–546. [Google Scholar] [CrossRef]
- Sun, D. Study on Mechanical Properties and Mechanism of Unsaturated Saline Soil and Solidified Soil with Lime in Zhenlai Under Freeze-Thaw Cycles. Ph.D. Thesis, Jilin University, Jilin, China, 2017. [Google Scholar]
- Han, M.; Peng, W.; Ma, B.; Yu, Q.; Kasama, K.; Furukawa, Z.; Niu, C.; Wang, Q. Micro–composition evolution of the undisturbed saline soil undergoing different freeze–thaw cycles. Cold Reg. Sci. Technol. 2023, 210, 103825. [Google Scholar] [CrossRef]
- Li, T.; Zhao, W.; Liu, R.; Han, J.; Jia, P.; Cheng, C. Visualized direct shear test of the interface between gravelly sand and concrete pipe. Can. Geotech. J. 2023, 61, 361–374. [Google Scholar] [CrossRef]
- ASTM D2487-17; Standard Practice for Classification of Soils for Engineering Purposes (Unified Soil Classification System). ASTM International West: Conshohocken, PA, USA, 2017.
- GB/T 50123-2019; MOHURD. Standard for Geotechnical Testing Method. China Planning Press: Beijing, China, 2019.
- GB/T 50942-2014; MOHURD. Technical Code for Building in Saline Soil Regions. China Planning Press: Beijing, China, 2014.
- Cao, B.; Tian, Y.; Gui, R.; Liu, Y. Experimental Study on the Effect of Key Factors on the Soil–Water Characteristic Curves of Fine-Grained Tailings. Front. Environ. Sci. 2021, 9, 710986. [Google Scholar] [CrossRef]
- Bulut, R.; Lytton, R.L.; Wray, W.K. Soil Suction Measurements by Filter Paper. In Expansive Clay Soils and Vegetative Influence on Shallow Foundations; ASCE: Reston, VA, USA, 2012; pp. 243–261. [Google Scholar] [CrossRef]
- Fawcett, R.G.; Collis-george, N. A filter-paper method for determining the moisture characteristics of soil. Aust. J. Exp. Agric. 1967, 7, 162–167. [Google Scholar] [CrossRef]
- Hamblin, A.P. Filter-paper method for routine measurement of field water potential. J. Hydrol. 1981, 53, 355–360. [Google Scholar] [CrossRef]
- Zhao, W.F.; Li, L.; Xiao, Y.H. Experimental Research of Matrix Suction of the Unsaturated Red Clay. Adv. Mater. Res. 2014, 919–921, 835–838. [Google Scholar] [CrossRef]
- Fu, Y.P.; Liao, H.J.; Chai, X.Q.; Li, Y.; Lv, L.L. A Hysteretic Model Considering Contact Angle Hysteresis for Fitting Soil-Water Characteristic Curves. Water Resour. Res. 2021, 57, e2019WR026889. [Google Scholar] [CrossRef]
- Shen, J.; Wang, Q.; Chen, Y.; Han, Y.; Zhang, X.; Liu, Y. Evolution process of the microstructure of saline soil with different compaction degrees during freeze-thaw cycles. Eng. Geol. 2022, 304, 106699. [Google Scholar] [CrossRef]
- Xiao, Z.; Lai, Y.; Zhang, M. Study on the freezing temperature of saline soil. Acta Geotech. 2018, 13, 195–205. [Google Scholar] [CrossRef]
- Chen, H.; Li, J.; Yuan, X.; Shi, B.; Shan, W. Influence of water and salt on suction characteristics of unsaturated clay: Variation, mechanism, and fitting. Bull. Eng. Geol. Environ. 2021, 80, 8535–8551. [Google Scholar] [CrossRef]
- Chen, R.; Lin, Y.; Liu, Q.; Dou, H.; Robledo, L.F.; Jian, W. Prediction of Matrix Suction of Unsaturated Granite Residual Soil Slope Based on Electrical Conductivity. Front. Earth Sci. 2022, 10, 840506. [Google Scholar] [CrossRef]
- Zhao, T.Y.; Li, L.J.; Zhang, H.Y.; An, L.; Liu, W.M.; Wang, Y.C. Study on the Effect of Soil Type and Salinity on Water-Soil Characteristic Curves of Saline Soils Based on the Vapor Balance Technique. Adv. Civ. Eng. 2024, 2024, 7983008. [Google Scholar] [CrossRef]
- Huang, C.H.; Xue, X.; Wang, T.; De Mascellis, R.; Mele, G.; You, Q.G.; Peng, F.; Tedeschi, A. Effects of saline water irrigation on soil properties in northwest China. Environ. Earth Sci. 2011, 63, 701–708. [Google Scholar] [CrossRef]
- Tang, D.; Liu, Y.; Zhang, W.; Wang, Q. Engineering Geotechnicals; Geological Press: Beijing, China, 1999. [Google Scholar]
Disclaimer/Publisher’s Note: The statements, opinions and data contained in all publications are solely those of the individual author(s) and contributor(s) and not of MDPI and/or the editor(s). MDPI and/or the editor(s) disclaim responsibility for any injury to people or property resulting from any ideas, methods, instructions or products referred to in the content. |
© 2025 by the authors. Licensee MDPI, Basel, Switzerland. This article is an open access article distributed under the terms and conditions of the Creative Commons Attribution (CC BY) license (https://creativecommons.org/licenses/by/4.0/).