Abstract
This study applies panel techniques with macro variables to analyze the connection between date palms production and water management in GCC countries using the Bayesian random and mixed effects models. Also, this study utilizes panel-corrected standard error (PCSE) and feasibly generalized least squares (FGLSs) methods to test the robustness and verify the Bayesian results. By utilizing a Bayesian longitudinal model, this study not only fills in a critical research gap but also provides a fresh perspective on the dynamics of water management practices and their impact on date palm cultivation over time. The results of this study confirm that the posterior means for coefficients of the water efficiencies for all purposes are positive with a magnitude of 11%, 28%, and 125%, respectively, for agriculture, services, and industrial purposes, determining that the Bayesian inference is efficient and reasonable. This result indicates the fit of the model, the validation of the results, and the knowledge that decision-making can suggest water management strategies for date palm cultivation. The findings from the PCSE and FGLSs models confirm that efficient water use in services (β = −0.329, significant at 1%) and agriculture (β = −2.834, significant at 1%) can lead to increased competition for limited water resources, reducing water availability for palm cultivation. Water use efficiency for industrial purposes (β = 0.503, significant at 1%) shows a positive relationship. Industrial water efficiency practices, such as water recycling, can help preserve water resources, managing more water available for agricultural activities. In addition, industrial water efficiency initiatives often involve technological innovations that can be applied to agriculture, improving water management practices in palm production. Developing and implementing comprehensive strategies, such as Integrated Water Resource Management (IWRM), that consider water needs for all purposes and establish coordinated water distribution plans to ensure sustainable water use practices across various sectors are highly recommended for policymakers and stakeholders. Also, further research must be performed to investigate the implications of climate change on water resources and date production to develop adaptation strategies that enhance the resilience of date palm cultivation. This will help the development of sustainable agricultural practices that balance water conservation with agrarian productivity.
JEL Classifications:
C11; C51; Q12; Q25
1. Introduction
Date palm, scientifically known as Phoenix dactylifera, is a staple crop in the arid regions of Gulf Cooperation Council (GCC) countries due to its ability to thrive in hot climates with low water requirements [1]. Date palm is a cash crop in several Asian countries as well. Date palm production in Gulf countries is of significant social and economic importance. It is a vital sector of the agricultural economy in Gulf countries, contributing to local consumption and export markets. Date palm production in GCC countries is a thriving industry that sustains local economies and preserves the region’s rich agricultural traditions and heritage [2]. Date palm plays a vital role in the cultural heritage of GCC countries, with the date being an integral part of traditional celebrations, food, various medicines, and official occasions; moreover, the date palm tree itself is highly honored in GCC countries’ societies for its longevity and the multiple uses of its by-products [3]. Likewise, the date palm crop has a long history of cultivating and harvesting dates [4]; it presents a vital part of the local diet and a key export commodity in GCC countries.
The production of date palm crops in the GCC region involves precise farming practices, including proper irrigation systems, soil management, pest control, and date palm preservation [5]. Farmers in GCC countries often apply modern agricultural techniques to increase yields and guarantee the quality of the date palm produced.
When comparing the key facts between GCC countries, significant variations emerge. It is notable from Table 1 that Saudi Arabia stands out for its large area, covering 2,149,690 square kilometers, while Bahrain is the smallest in terms of area, with 760 square kilometers. Regarding agricultural land, it is noticeable that Saudi Arabia occupies the largest agricultural land (173,637.417 thousand hectares); in contrast, Bahrain has the smallest amount of agricultural land (8.1 thousand hectares). In 2023, the most populated country was Saudi Arabia (33,264.292 people), while the least populated country was Bahrain (1569.666 people). Saudi Arabia is the leader in date palm production among the listed countries. Concerning water use efficiency, Qatar tops regarding agriculture water use efficiency at 1.4051 USDm-3, while Oman marks at 1.0030 USDm-3. Kuwait leads in service water use efficiency at 158.967 USDm-3, with the United Arab Emirates at the limit at 47.340 USDm-3. What is remarkable is that the United Arab Emirates’ industrial water use efficiency is at a high of 4,870.273 USDm-3, while Oman reports a negative value, implying inefficiency in this sector. These comparisons underscore the diverse landscape of GCC countries across various key indicators.

Table 1.
Comparisons of the key facts and figures of the studied variables of GCC countries in 2022.
Conversely, date palm production in GCC countries faces several challenges that influence cultivation and production. These challenges involve climate changes, high soil salinity, market competition, and water scarcity [7]. Water scarcity is a significant issue in the arid climate of GCC countries. GCC countries have limited renewable water resources due to the scarcity of rainfall [8]. Exploring the impact of water use efficiency on date production in GCC countries not only addresses water scarcity challenges but also has consequences for sustainable agriculture, cost-effectiveness, climate resilience, and regulatory compliance. This contributes towards creating a more effective and environmentally conscious agricultural industry. Enhancing water efficiency can increase date palm production, improve profitability, and boost the overall economic impact of date palm farming.
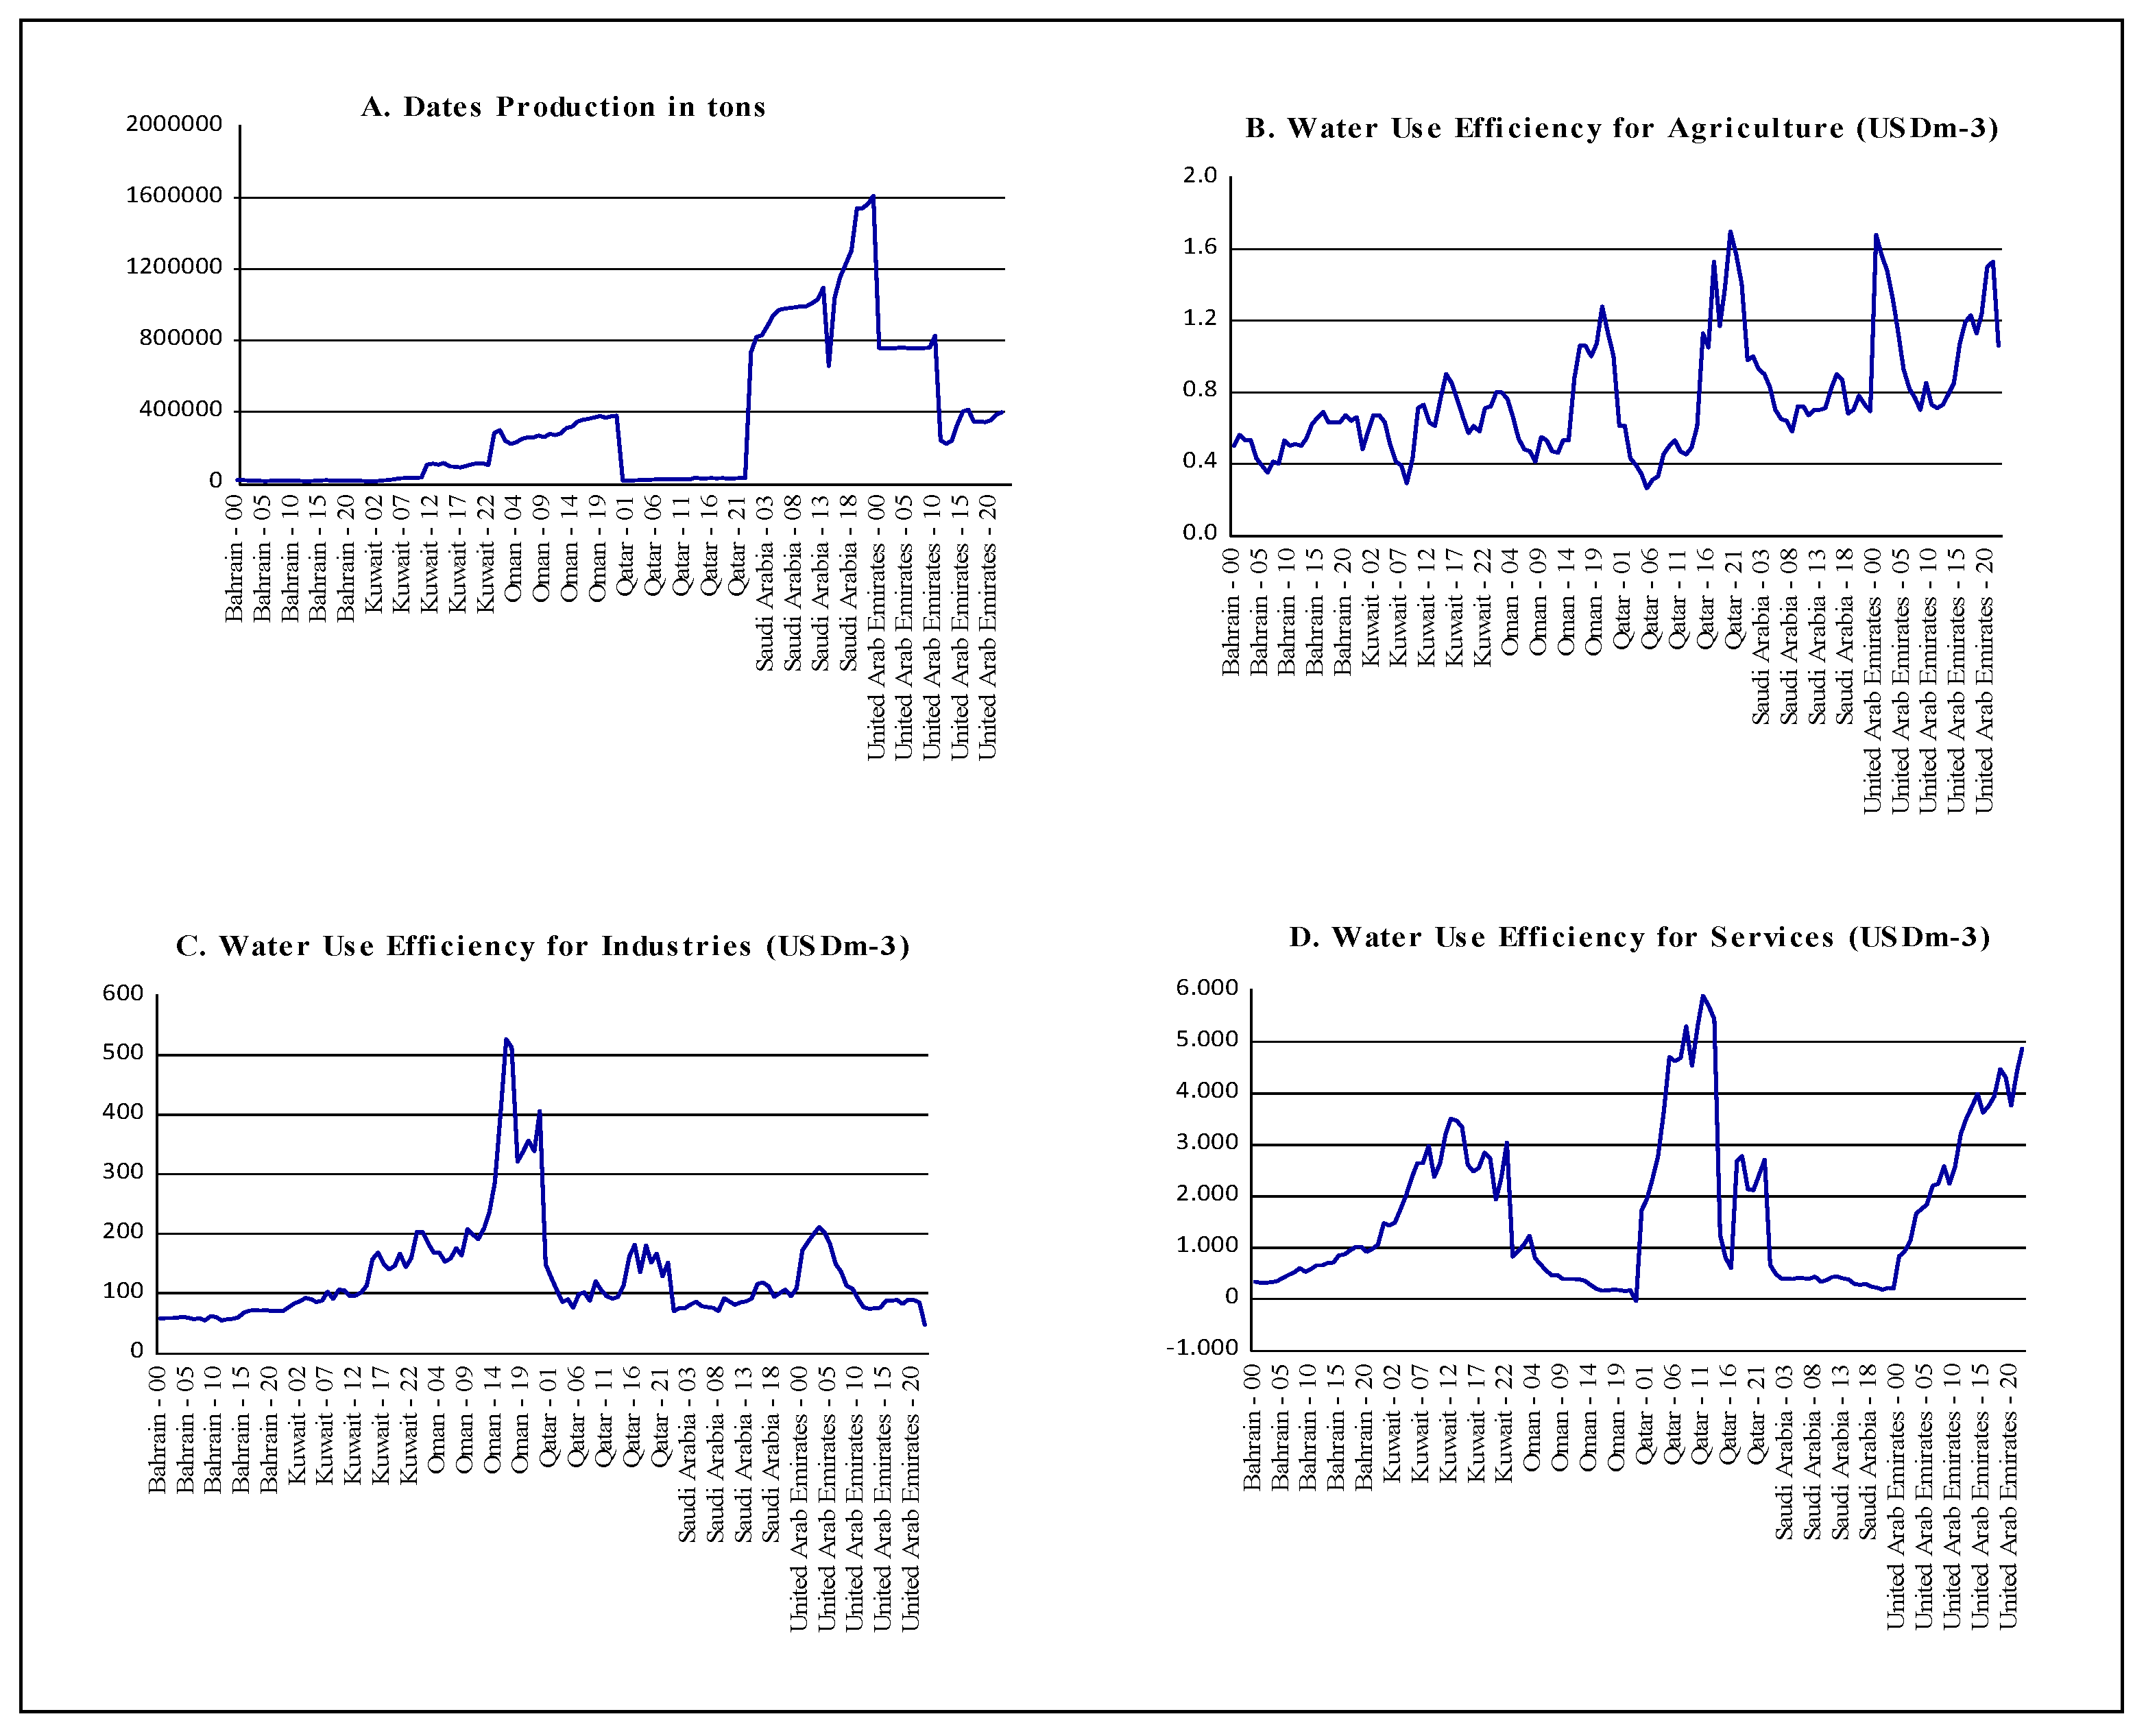
The evolution of date palm production and water use efficiency for GCC countries from 2000 to 2022 is depicted in Figure 1. As discussed later, Saudi Arabia is the leading producer of date palm among GCC countries; at the same time, Oman and Qatar have negligible date production compared to other GCC countries (Figure 1A). Oman and the United Arab Emirates have managed water efficiency well for agricultural and industrial purposes (Figure 1B,C). Bahrain, Oman, and Saudi Arabia exhibited very low values for water use efficiency in services during the period 2008–2019 (Figure 1D).
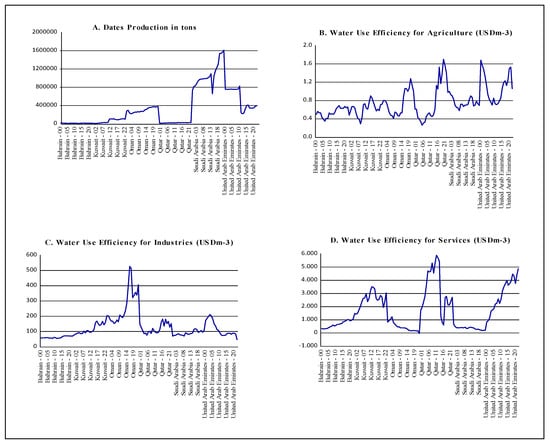
Figure 1.
Date palm production and water use efficiency in GCC countries (2000–2022). Source: [9] and author’s design (2024).
The justification for the examination carried out in this study is that date palm is the crop that consumes the most water for irrigation [10]. Studying the connection between date palm production and water efficiency benefits GCC countries. It has far-reaching implications for the global economy by enhancing food security, promoting sustainability and innovation, technology transfers, and stimulating trade, investment, and economic collaboration.
The current study aims to examine the variation in water use efficiency on date palm production in GCC countries using the Bayesian model. We also aim to determine the key sector (agriculture, services, or industry) that employs the most substantial impact on date palm production through the analysis of water use efficiency. By studying the variation in water use efficiency on date palm production through a Bayesian model, we aim to provide valuable insights into the complex interactions between water management practices, efficiency of water usage, and date yield, with the predominant goal of promoting sustainable and efficient date palm cultivation practices. Also, identifying the sector with the highest impact on date palm production can help focus our efforts on improving water management strategies in that specific sector to enhance date palm productivity, direct investment decisions, and water resource distributions for maximum economic benefits.
The subsequent sections of this study are structured as follows: Section 2 reviews the appropriate literature. Section 3 defines the data used and the empirical methods applied. Section 4 presents the results with interpretations and discussions. Section 5 concludes with the main results, policy implications, and recommendations.
2. Literature Review
Several types of research have been conducted worldwide on date palm production, employing various analytical models to address a wide range of the connections between water issues and date palm production [11,12,13]. Among these studies, most of the research focuses on the effects of water irrigation on date palm production. This study examined the impact of controlled deficit irrigation using two modern micro-irrigation systems on the quality of date palms and found that the yield of date palms did not differ significantly between the control and subsurface irrigation systems [14]. The maximum date fruit yield was observed when 100% irrigation water was used in the subsurface drip irrigation system [5]. This study aims to explore the impacts of utilizing water of three distinct qualities—freshwater, reclaimed wastewater, and well water. The findings specify that implementing inadequate irrigation on date palm trees cultivated in arid areas can enhance fruit quality while adversely impacting yield [15].
Concentrating on GCC countries, this research assessed how different irrigation water quantities influenced both date palm productivity and water use efficiency across various irrigation systems in Oman and Saudi Arabia, utilizing the partial budgeting method. The findings implied that employing the surface drip system in date palm cultivation can lead to enhanced water economic profitability [4].
The fruit of the date palm presents a significant opportunity to enhance human health and food security, owing to its abundant nutritional content [16]. A study was conducted in Saudi Arabia to estimate how the loss of date palms can affect food security in Saudi Arabia using a partial adjustment model. The findings indicated that date palms are viewed as both a self-sustaining crop and an export commodity, with the state opting to export excess produce rather than storing it for domestic consumption [17]. A similar study conducted in Saudi Arabia that used simple descriptive analysis and estimated the nutrient indices revealed that the connection between date palm consumption and body mass index (BMI) was low [18].
Date palm production is harshly affected by climate changes directly and indirectly, with the impact affecting water use. Using a statistical downscaling model (SDSM), this research projected future climate factors affecting the irrigation water requirement for date palm farming. This study proved that climate change has notably increased the irrigation water needed for date palm production [19]
This study used parametric and nonparametric approaches to optimize the date palm production process by minimizing the amount of energy consumption; the result points out that 10% of input energy can be stored by boosting the efficiency of date palm production [20].
Several studies used the Bayesian model to examine water sustainability, scarcity, distribution, efficiency, utilities, irrigation, and water poverty [21,22,23,24]. This study combines Bayesian theory and water footprint (WF) to construct a Bayesian network (BN) for examining agricultural water sustainability in China; the results specified that the agricultural scale is increasing with rapid economic development, but the unsustainability of agricultural water use is increasing [21].
This study employs a machine learning method via the hybrid Bayesian network model to create a structure for simulating and assessing agricultural water distribution systems. The results indicated the ability to simulate any operating systems in the irrigation [25]. This study was conducted to compare the efficiency of private water utilities and concessionary water utilities in Chile using Bayesian stochastic frontier analysis (SFA) techniques. The results denoted that both types of water utilities presented considerable cost inefficiency [26].
A few studies reported in the literature have employed Bayesian models to investigate the relationship between date palms and water. One study applied joint Complementary System Dynamics modeling and the Bayesian network to evaluate the probability of water scarcity risks under various scenarios including climate change, economic, and groundwater policies. The results revealed that water availability is influenced by climate change, and low irrigation efficiency has a stronger effect on water scarcity [27].
Another study utilized a dynamic Bayesian network (DBN) to evaluate crop water productivity and enhance crop planting in China during restricted water resource allocation. The findings showed that integrating the DBN enhances model accuracy for dynamic forecasting, especially in short-term predictions [28]. This study utilized a feasible generalized least squares (FGLSs) model to conduct linear and nonlinear panel regression analyses on vegetation cover and the water poverty index. The findings confirmed that vegetation cover significantly influences water poverty [29].
However, recent research [30] applied the Bayesian-optimized neural network and Bayesian-optimized boosted Regression Trees to investigate the date palm frond waste biomass-derived producer gas and algal biodiesel as sustainable diesel engine fuels, confirming that the Bayesian-optimized boosted regression trees-based models were more robust for this study.
We concluded that this literature reviews show several estimations of the relations between date palms and water globally [31] and in GCC countries [32,33], handling various issues of water; however, no research considers the relations between date palm production and water use efficiency for several purposes (for agriculture, industries, and services). In this study, the novelty of integrating the Bayesian technique into an investigation on water use efficiency and date palm production lies in its ability to provide a probabilistic framework and to help incorporate strategies and tools into decision-making processes that can support adaptive management practices, enabling effective responses to dynamic conditions, optimizing resource utilization, and enhancing the sustainability of water management and agricultural systems. Moreover, applying the panel-corrected standard error (PCSE) and FGLSs models in this study to test the robustness and verify that water use efficiency significantly affects date palm production is another novelty. This study offers valuable insights for policymakers and stakeholders in the agricultural sector, emphasizing the need for sustainable water management strategies to optimize date palm production
3. Methodology
3.1. Data Sources and Descriptive Analysis
To achieve this study’s objectives, appropriate data were collected, and preliminary econometric estimations were performed. This study also utilized Bayesian random and mixed effects models and robust tests by examining the PCSE and FGLSs estimators.
The dataset for this study includes information on cross-country panel data encompassing six GCC countries, Bahrain, Kuwait, Oman, Qatar, Saudi Arabia, and the United Arab Emirates, over the period spanning from 2000 to 2022. The key variables focus on macroeconomic information, such as date palm production (DAP) measured in metric tons as the dependent variable and water management as a proxy for water use efficiency for agriculture (WEA), industries (WEI), and services (WES), measured in USDm-3 as independent variables. All variables are extracted from the FAO database [9] and summarized in Table 2.
Table 2.
Statistical summary of the original panel variables across different countries.
The DAP variable was chosen because date palms are a staple food in the region and contribute to food security. Consuming about seven date fruits can supply roughly 13%, 20%, and 25% of the suggested daily intake for energy, dietary fiber, and potassium for adults [1]. Increased local production can reduce reliance on imports and ensure a stable food supply for the population. This increase could serve as part of the economic diversification efforts in GCC countries, reducing dependence on oil revenues and creating a more sustainable economic base. I chose water use efficiency for various purposes as the predictor of date production because it can help reduce the impact on the environment, such as groundwater depletion or soil salinity, promoting sustainable agricultural practices, and GCC countries can thus better manage their water resources, which are often scarce in arid GCC regions. Table 2 details two-dimensional descriptive statistics: the ‘within’ (cross-sectional) and ‘between’ (time series) dynamics of each variable.
During the study period, the average date palm production was 337,215.4 metric tons. Saudi Arabia achieved the highest production in 2022 at 1,610,731 metric tons, while Bahrain had the lowest output in 2021, estimated at 8696 metric tons. Regarding the water use efficiency for agricultural purposes, the collective average is 0.755 USDm-3. Qatar registered the highest value (1.7 USDm-3) in 2020, while the United Arab Emirates registered the lowest value in 2007. The lowest negative value of water use efficiency (−40.07792 USDm-3) for the services was observed in Oman in 2022, with the highest value (5898.34 USDm-3) noted in Qatar in 2011. Finally, it was observed that water use efficiency was highly valued in 2016 in Oman (526.49 USDm-3), with the minimum value reported in the United Arab Emirates (47.3403 USDm-3) across 2022, with an overall mean estimated as 128.6177 USDm-3. Also, it was observed that the between-variation exceeds the within-variation for the DAP (SD = 418104.1) and WEI (SD = 70.934) variables, confirming the assumption of notable heterogeneity. In contrast, the opposite is observed for the WEA and WES variables, suggesting a certain degree of homogeneity.
3.2. Econometric Estimations
Before estimating the Bayesian models, I tested the matrix correlation, normality, cross-sectional dependence (CD), homogeneity, unit roots, and panel cointegration tests. Several studies have remarked that panel data exhibit challenging cross-sectional dependence problems stemming from cross-border shockwaves due to economic globalization and shared risk factors [34,35,36].
The slope of homogeneity and the existence of cross-sectional dependence were examined by referring to the test in [37]. Confirming the existence of cross-sectional dependence, panel unit root checks were achieved by applying the Levin–Lin–Chu [38] test.
Several studies have applied unit root tests followed by panel cointegration tests [39,40,41]. Two methods of panel cointegration tests were utilized to determine the presence of a long-term equilibrium relationship among the series. In this study, I implemented the panel cointegration tests of Pedroni [42] and Westerlund [43] with an Error Correction Model (ECM).
Pedroni [42] introduced seven test statistics that test the null hypothesis of no cointegration in nonstationary panels with two sets of cointegration statistics: (1) within-dimension approach, comprising four famous statistics: panel v-static, Panel rho (ρ) statistic, Panel PP-Statistic, and Panel ADF-statistic. These statistics aggregate the autoregressive coefficients from various GCC countries for conducting unit root tests on the estimated residuals. (2) The group mean panel cointegration statistics that average the results of individual country test statistics, following the between-dimension approach, consist of three statistics: nonparametric (ρ and t) Group rho (ρ) statistic, Group PP-statistic, and parametric augmented Dickey–Fuller (ADF), and the (v) test statistics are within both groups. These statistics are derived from the averages of individual autoregressive coefficients related to the unit root tests of the residuals for each country within the panel.
Westerlund [43] proposes four cointegration tests for panel data based on pooling the information regarding the ECM along the cross-sectional dimension of the panel. Categories of group mean statistics are denoted as Gt (Equation (1)) and Gα (Equation (2)); the panel statistics are denoted as Pt (Equation (3)) and Pα (Equation (4)).
The equations of the four Westerlund cointegration models are as follows:
where is the standard error of , where t =1, ..., T and i =1, ..., N.
To account for small sample sizes, the group mean coefficient statistic could be normalized using the cross-sectional average of the effective number of observations per individual (N) instead of T [43]. The tests represented by Gt and Gα assume that the entire panel is cointegrated, while Pα and Pa are formulated under the assumption that as a minimum, one factor within the panel is cointegrated. In each case, the null hypothesis states no cointegration. This study employs model measurements with DAP as the dependent variable to compute these statistics.
In contrast, ref. [42] offers a pooled Phillips and Perron-type test [44], where the null hypothesis () indicates no cointegration. On the other hand, the Westerlund test also considers as no cointegration, but the alternative hypothesis () differs, indicating that certain panels are cointegrated. Westerlund [45] utilizes the bootstrap method to mitigate cross-sectional dependency effects in these tests.
By exploring the cointegration between date palm production and water use efficiency, investigators can gain a comprehensive understanding of the long-term connection between these variables and their implications for water management, agricultural sustainability, and economic development in GCC countries where date palm cultivation is the prevalent crop.
3.3. Bayesian Model
I apply the Bayesian statistics model relying on a simple rule of probability, Bayes’ rule [46], which provides a formalism for combining prior information with evidence from the data given. The Bayes rule forms the so-called posterior distribution of the model parameters. This posterior distribution captures updated beliefs derived from observed evidence. Utilizing this distribution, Bayesian analysis computes multiple statistics for model parameters like posterior means, medians, percentiles, Monte Carlo Standard Error (MCSE), and credible intervals. Additionally, all statistical tests concerning model parameters are framed as probability statements based on the estimated posterior distribution.
The simple form of Bayesian takes as a ratio formula the following:
where y is the data, whereas in this study, it can be DAP, WEA, WES, or WSEI. θs represents unknown parameters. Pr(y|θ) is the likelihood function, which is the probability of y assuming θ. Pr(θ) is the prior distribution of θ. Pr(y) is the marginal distribution of y, and Pr(θ|y) is the posterior distribution, which is the probability of θ provided y.
Lemoine [47] recommends using the normal distribution of N (0, 1) for the observed variables and the distribution of gamma (0.01, 0.01) for the variances (σ2) in the model. The a priori distribution can be rewritten as follows: ~(0, 1) and σ2~(0.01, 0.01).
I follow [48] for the applied Bayesian random effect (RE) normal regression using Metropolis-Hastings and Gibbs sampling with the simulation of Markov chain Monte Carlo (MCMC) iterations. Its likelihood is assumed to be normal before variance is defined {sigma2}. The Bayesian random effect for this study can be labeled as follows:
whereas LnDAP denotes date palms production; LnWUS represents water use efficiency for various purposes, which are LnWEA, LnWES, and LnWEI. Default priors are used for model parameters (coefficients) and assumed inverse gamma priors for the variance parameters.
The Bayesian analysis begins with the definition of a posterior model [49]. The posterior distribution has two elements: a likelihood reflecting information on model parameters from observed data and a prior and hyperprior that incorporates pre-existing information on the model parameters before the data observation [50].
According to STAT software version number (17), the likelihood, prior, and hyperprior take the formulation of
lndap ~ normal(xb_lndap,{sigma2})
Priors:
{lndp1:lnWEA lnWES lnWEI _cons} ~ normal(0,10000)
{U[ID]} ~ normal(0,{var_U})
{sigma2} ~ igamma(0.01,0.01)
Hyperprior:
{var_U} ~ igamma(,)
where _cons serves as a proxy for the mean of the random effects; ID is individuals; Var (σ2) is a proxy for the error variance; σ2 U is a proxy for the variance of random effects; and varies from 100 to 1000 for checking robustness. Where all the model parameters are normally distributed with the zero mean and the same variance of 10,000, the overall variance (sigma2) has an igamma (0.01, 0.01) prior.
Roy [51] suggests that Markov chains must support convergence to ensure robust Bayes analysis. To ensure that Bayesian inference based on the MCMC sample simulation is a reasonable method with the Gibbs sampler to estimate the posterior distribution, I use the convergence diagnostic of MCMC chains for the DAP model. When MCMC chains converge, Bayesian inference is robust. The testing of the convergence of MCMC chains is performed through trace plots, histograms, autocorrelation, and Gelman–Rubin convergence estimation.
The justification for using the Bayesian analysis is that this study can not only evaluate the strength of the relationships between water use efficiency and date palm production but also quantify uncertainties associated with these relationships. This approach provides a framework for making more informed decisions by considering the full range of possibilities and their respective probabilities of date palm production.
3.4. PCSE and FGLSs Tests
As the autocorrelation and heteroskedasticity have been noticed in this study’s data, the PCSE and FGLSs estimators are examined as robust tests, [48,52] confirming that these methods have been shown to give robust and efficient outcomes. Also, these methods are suitable in this case as they are applicable whenever the temporal parameters are smaller than a given number of cross-sections (N < T), as in Table 2 (T = 23 > N = 6). Beck and Katz [53] proposed the PCSE method; this method could correct the first-order autocorrelation with the transformation matrix proposed by [54]. The simple equation of PCSE takes the following form:
The FGLSs estimator was used to estimate panels with heteroskedasticity and the contemporaneously correlated error matrix proposed by [55,56]. Likewise, the simple equation of FGLSs takes the following form:
is the natural logarithm of date palm production measured in metric tons as a dependent variable, subscript i stands for the selected six GCC countries, and t specifies the time from 2000 to 2022. α is a fixed term (is the intercept term); β1, β2, and β3 are the slope coefficients of the respective water use efficiency for agriculture, services, and industrial purposes in the model; and denotes the model’s error stochastic term (idiosyncratic error term). i = 1, …, N; t = 1, …, T.
The FGLSs model assumes that E [57].
Thus, with this hypothesis, the data support T sets of residuals to estimate the contemporaneous covariance. There is also typical components E along the block diagonal.
4. Empirical Findings
This section displays the findings obtained and compares the results with those of related studies.
4.1. Preliminary Results
Before initiating the Bayesian models, preliminary panel data tests were conducted. Table 3 shows that water use efficiency for agricultural purposes is significantly and positively correlated with date production. However, water use efficiency for service purposes is negatively correlated with date palm production and confirms date palm production, particularly in GCC countries as arid regions where date palm is commonly grown, which can have environmental consequences such as water depletion and soil degradation. These impacts can indirectly affect water efficiency for services by influencing the overall water availability and quality in GCC countries. This study is consistent with [58], which confirmed that adopting modern irrigation techniques is essential to increase water use efficiency and date palm productivity.
Table 3.
Pairwise matrix correlation.
Table 4 shows that the statistical parameters for skewness, kurtosis, and the Jarque–Bera test coefficients reject the null hypothesis at both the 1% and 10% significance levels, indicating that the selected variables do not follow a normal distribution and exhibit significant skewness. To homogenize the variable series, all the data were transformed into natural logarithm (Ln) forms.
Table 4.
Normality results.
As reported in Table 5, the empirical results for the slope homogeneity test support the rejection of the null hypothesis and acceptance of the alternative hypothesis of heterogeneity in the panel at the 1% significance level. This outcome is consistent with the findings in [59].
Table 5.
Results of testing for slope homogeneity.
Table 6 provides the results of a cross-sectional dependence test for four selected variables. In this context, LnWEA and LnWEI show significant cross-sectional dependence based on their CD-test values and low p-values at a 1% significant level compared to LnDAP and LnWES. The existence of a cross-section dependency means that there is an assumption that a macroeconomic shock occurring in any country under-investigated would affect the others [60].
Table 6.
The cross-sectional dependence of the test outcomes.
4.1.1. Unit Root Results
While stationarity is not a strict requirement in Bayesian analysis, it is still important to consider the characteristics of the data and the underlying assumptions of the model being used. In cases where nonstationarity is present, the Bayesian method can still be applied to consider the implications of nonstationarity on the model and the interpretation of the results [61]. Table 7 reflects the outcomes at I(0) and I(1) for the LLC unit root check. The results of the LLC test show that the selected variables are stationary when considering intercept and time trends at both level and first differences. This implies accepting the alternative hypothesis of stationarity and confirming that all the selected variables are stationary.
Table 7.
Results of LLC panel unit root test statistics options.
4.1.2. Cointegration Results
Table 8 and Table 9 present the cointegration test results performed by using the Pedroni [42] and Westerlund [43] tests accompanied by two sets of p-values derived from bootstrapping critical values. Table 8 demonstrates the results of the Pedroni cointegration test, showing that statistics for the Augmented Dickey–Fuller (ADF) test (within and between dimensions) accept the alternative hypothesis of cointegration at the 1% significance level.
Table 8.
Results of Pedroni residual cointegration test for the panel.
Table 9.
Results of Pedroni residual cointegration test across countries.
To compare the results of the Phillips–Perron test for cointegration for each country, tests such as the AR(1) coefficient, variance, HAC values, bandwidth, and the number of observations were examined (Table 9). The Phillips–Perron (PP) and Augmented Dickey–Fuller (ADF) test results indicate that Bahrain has a small positive AR(1) coefficient (0.007 in both tests), revealing a weak positive autocorrelation in its time series data. Qatar has the largest positive AR (1) coefficient (0.315 in both tests), indicating strong positive autocorrelation in its time series data. This indicated persistence in the data, suggesting that past values influence future values. Saudi Arabia’s negative autocorrelation (−0.095 in both tests) implies a tendency for the series to reverse its direction over time.
Also, it is observed that lower values of heteroscedasticity and autocorrelation consistent standard errors (HAC) for all countries suggest more precise estimations. The low variance values for all countries suggest that the data points are closer to the mean or the fitted values, i.e., the time series are tightly clustered around the fitted values. In this context, when investigating the impact of water use efficiency on date palms, positive autocorrelation might imply that past water use efficiency levels have persistent effects on current or future date palm production. Therefore, for these variation results, the Bayesian longitudinal model was adopted.
The findings in Table 10 confirm the presence of a long relationship between the analyzed variables. The robust p-values reinforce the rejection of the null hypothesis of no cointegration, backing the alternative hypothesis of a persistent relationship among the series. This indicates a long-term panel connection among the studied variables.
Table 10.
Results of the Westerlund ECM panel cointegration tests.
4.2. Results of the Bayesian Random Effect Model
The posterior summaries of the random effects model are reported in Table 11. The similarities between the means and medians of all variables suggest that the date palm model exhibits symmetric posterior distributions. Likewise, the small standard deviations of all variable parameters further support this conclusion. Notably, the 95% credible intervals of the variables exclude the value zero, allowing us to confidently verify that water use efficiency significantly affects date palm production.
Table 11.
Bayesian random effect normal regression for LnDAP.
Furthermore, the posterior means for the coefficients of the water efficiencies for all purposes are positive, with magnitudes of 11%, 28%, and 125%, respectively, for agriculture, services, and industrial purposes. This demonstrates that water use efficiencies positively impact date palm production. This result is approved by [63,64].
Moreover, as the MCSE value estimates of the posterior means decrease, the precision of the mean estimates of the model parameters improves, with the coefficients’ MCSE estimates consistently below one decimal. In this context, the MCMC algorithm employed in this study shows signs of convergence. This indicates that the MCMC algorithm is effectively exploring the relationship between date palm production and water use efficiency, indicating that the outcomes obtained from the analysis are more likely to be valid and reliable. Also, when the MCSE value decreases, the precision of the coefficient parameter estimation increases. Likewise, the medians of the WEA (0.111202) and WES (0.2822955) variables are close to each other, suggesting that the posterior distributions for WEA and WES may be symmetric. Furthermore, the acceptance rate is (0.838), and efficiency values ranging from 0.43% to 84.0% are reasonable for an MCMC algorithm (Table 11).
For identifying an effective sampling algorithm and checking the convergence of the algorithm to the optimal posterior distribution, the diagnostics of the Bayesian estimation were performed.
Furthermore, the Bayesian mixed-effect model is estimated (which is famous as the hierarchical model). This model typically combines both fixed effects and random effects. The results from Table 12 show that the model is robust to the result in Table 11. In comparing this study with other related ones, several studies used the Bayesian random effect for crop investigation and confirmed that this method is robust for their examination [65,66,67].
Table 12.
Result of Bayesian mixed effects model for Ln DAP.
4.3. Diagnostics of Bayesian Estimation for Date Palm Production
The diagnosis of convergence of MCMC is carried out to ensure that MCMC-based Bayesian inference is reasonable [68]. The MCMC method for simulating the Bayesian model is tested graphically and estimated by the Gelman–Rubin convergence statistic using multiple chains (five chains) with default priors.
4.3.1. Visual Diagnostics for MCMC Convergence
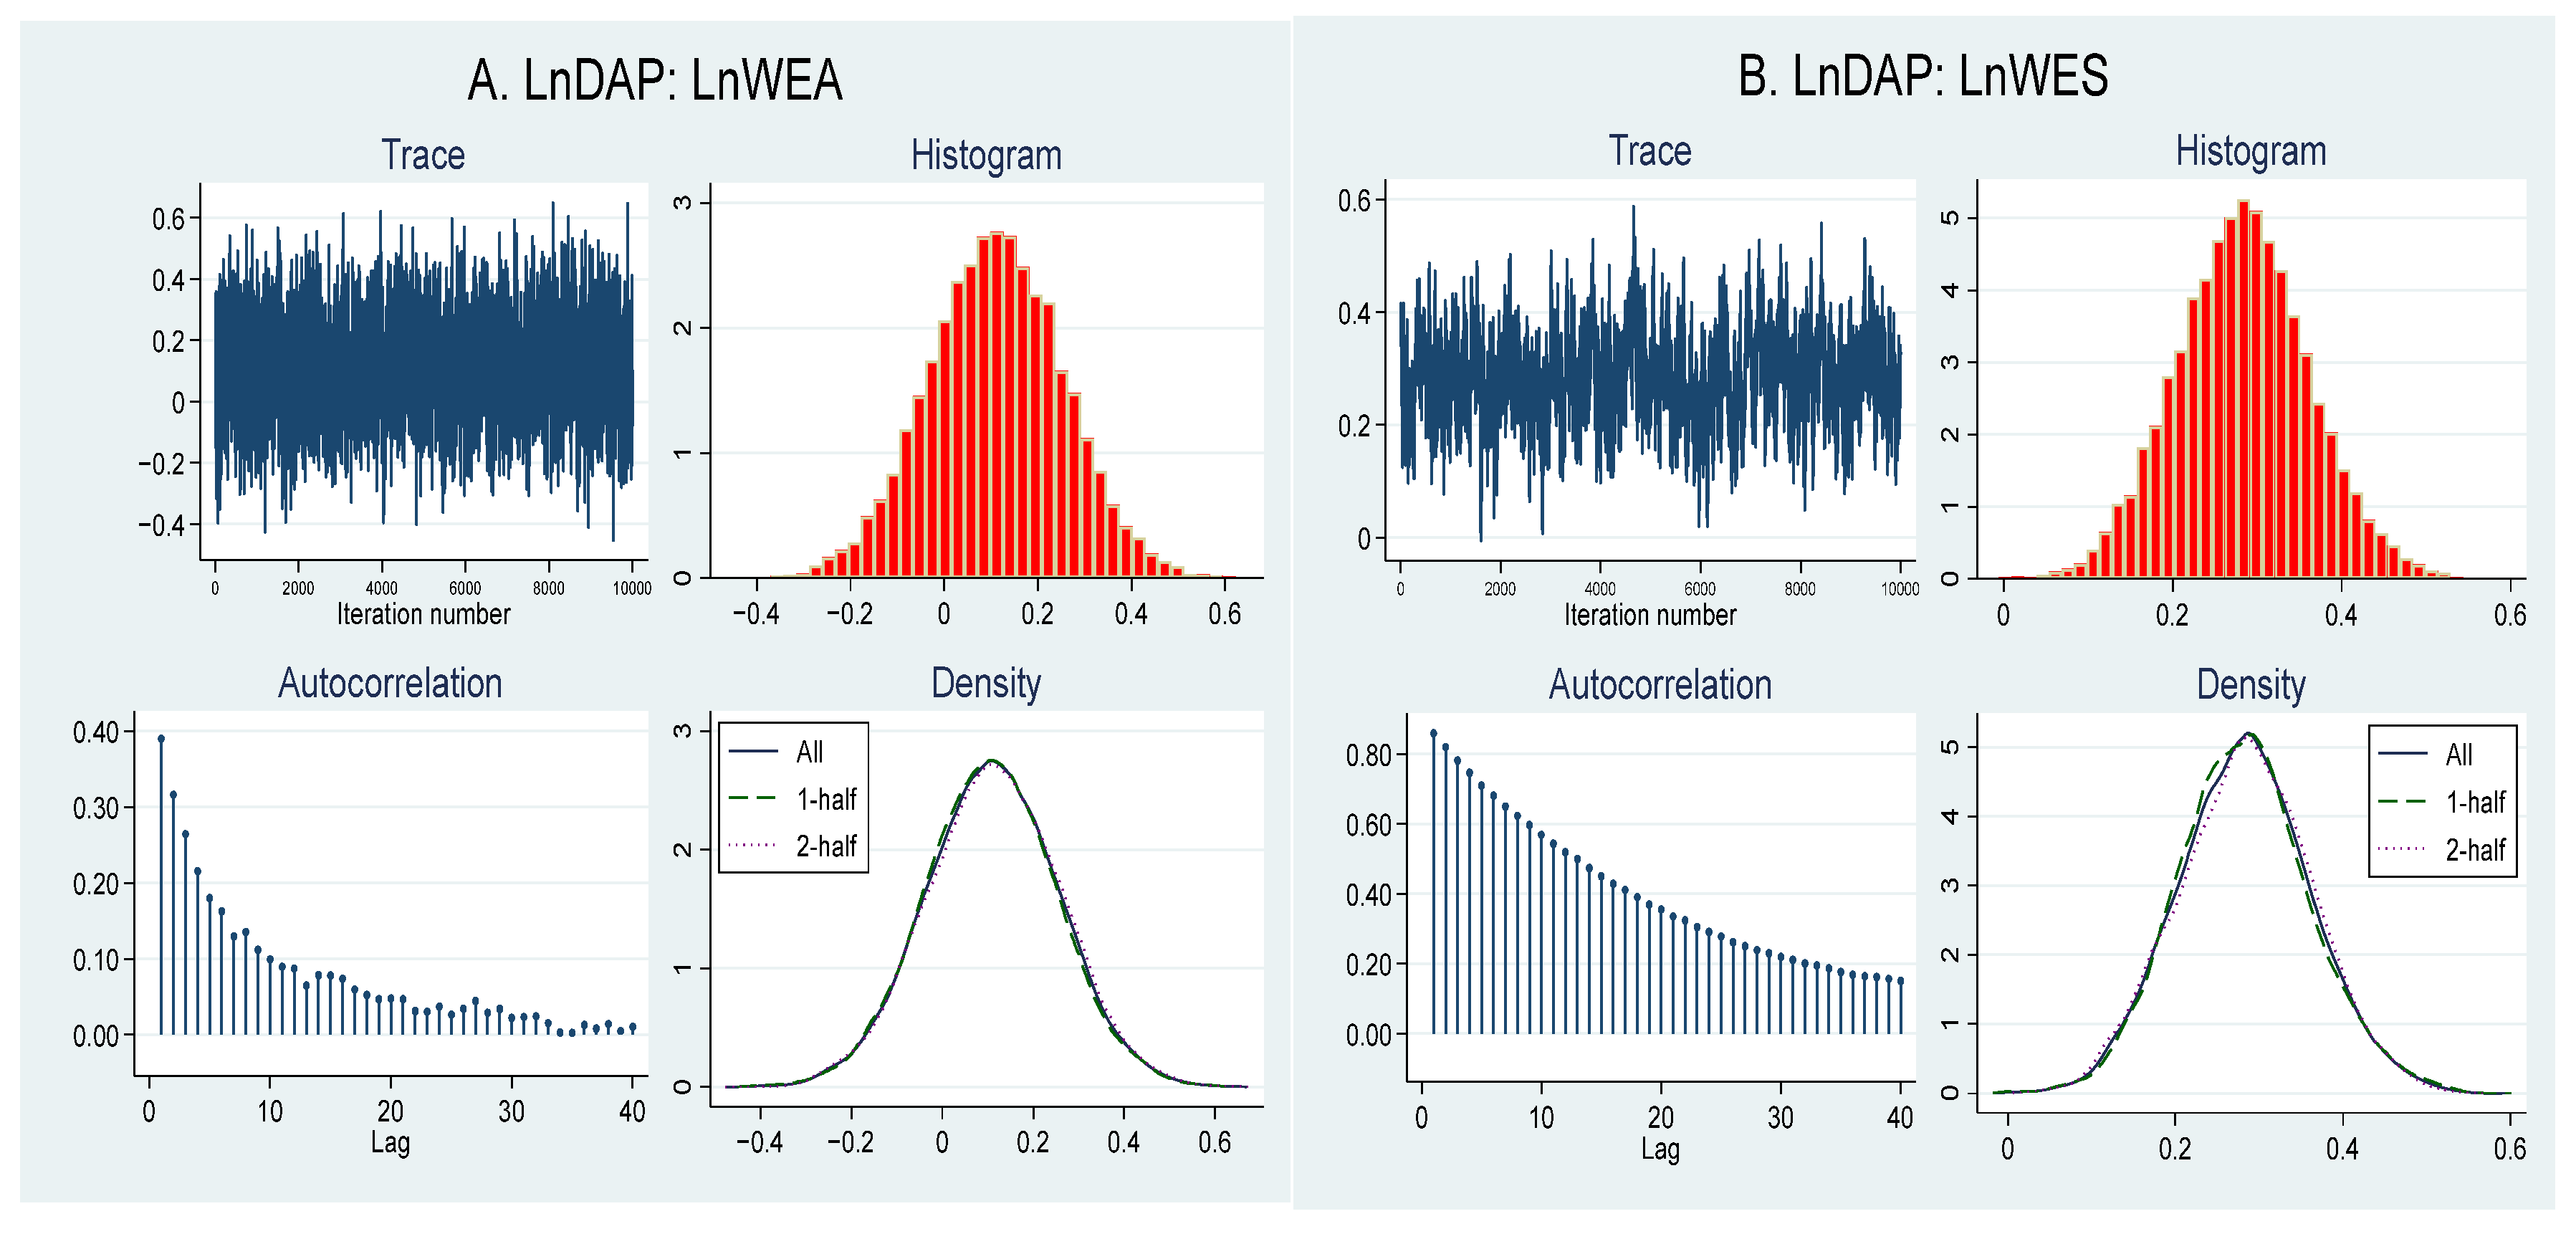
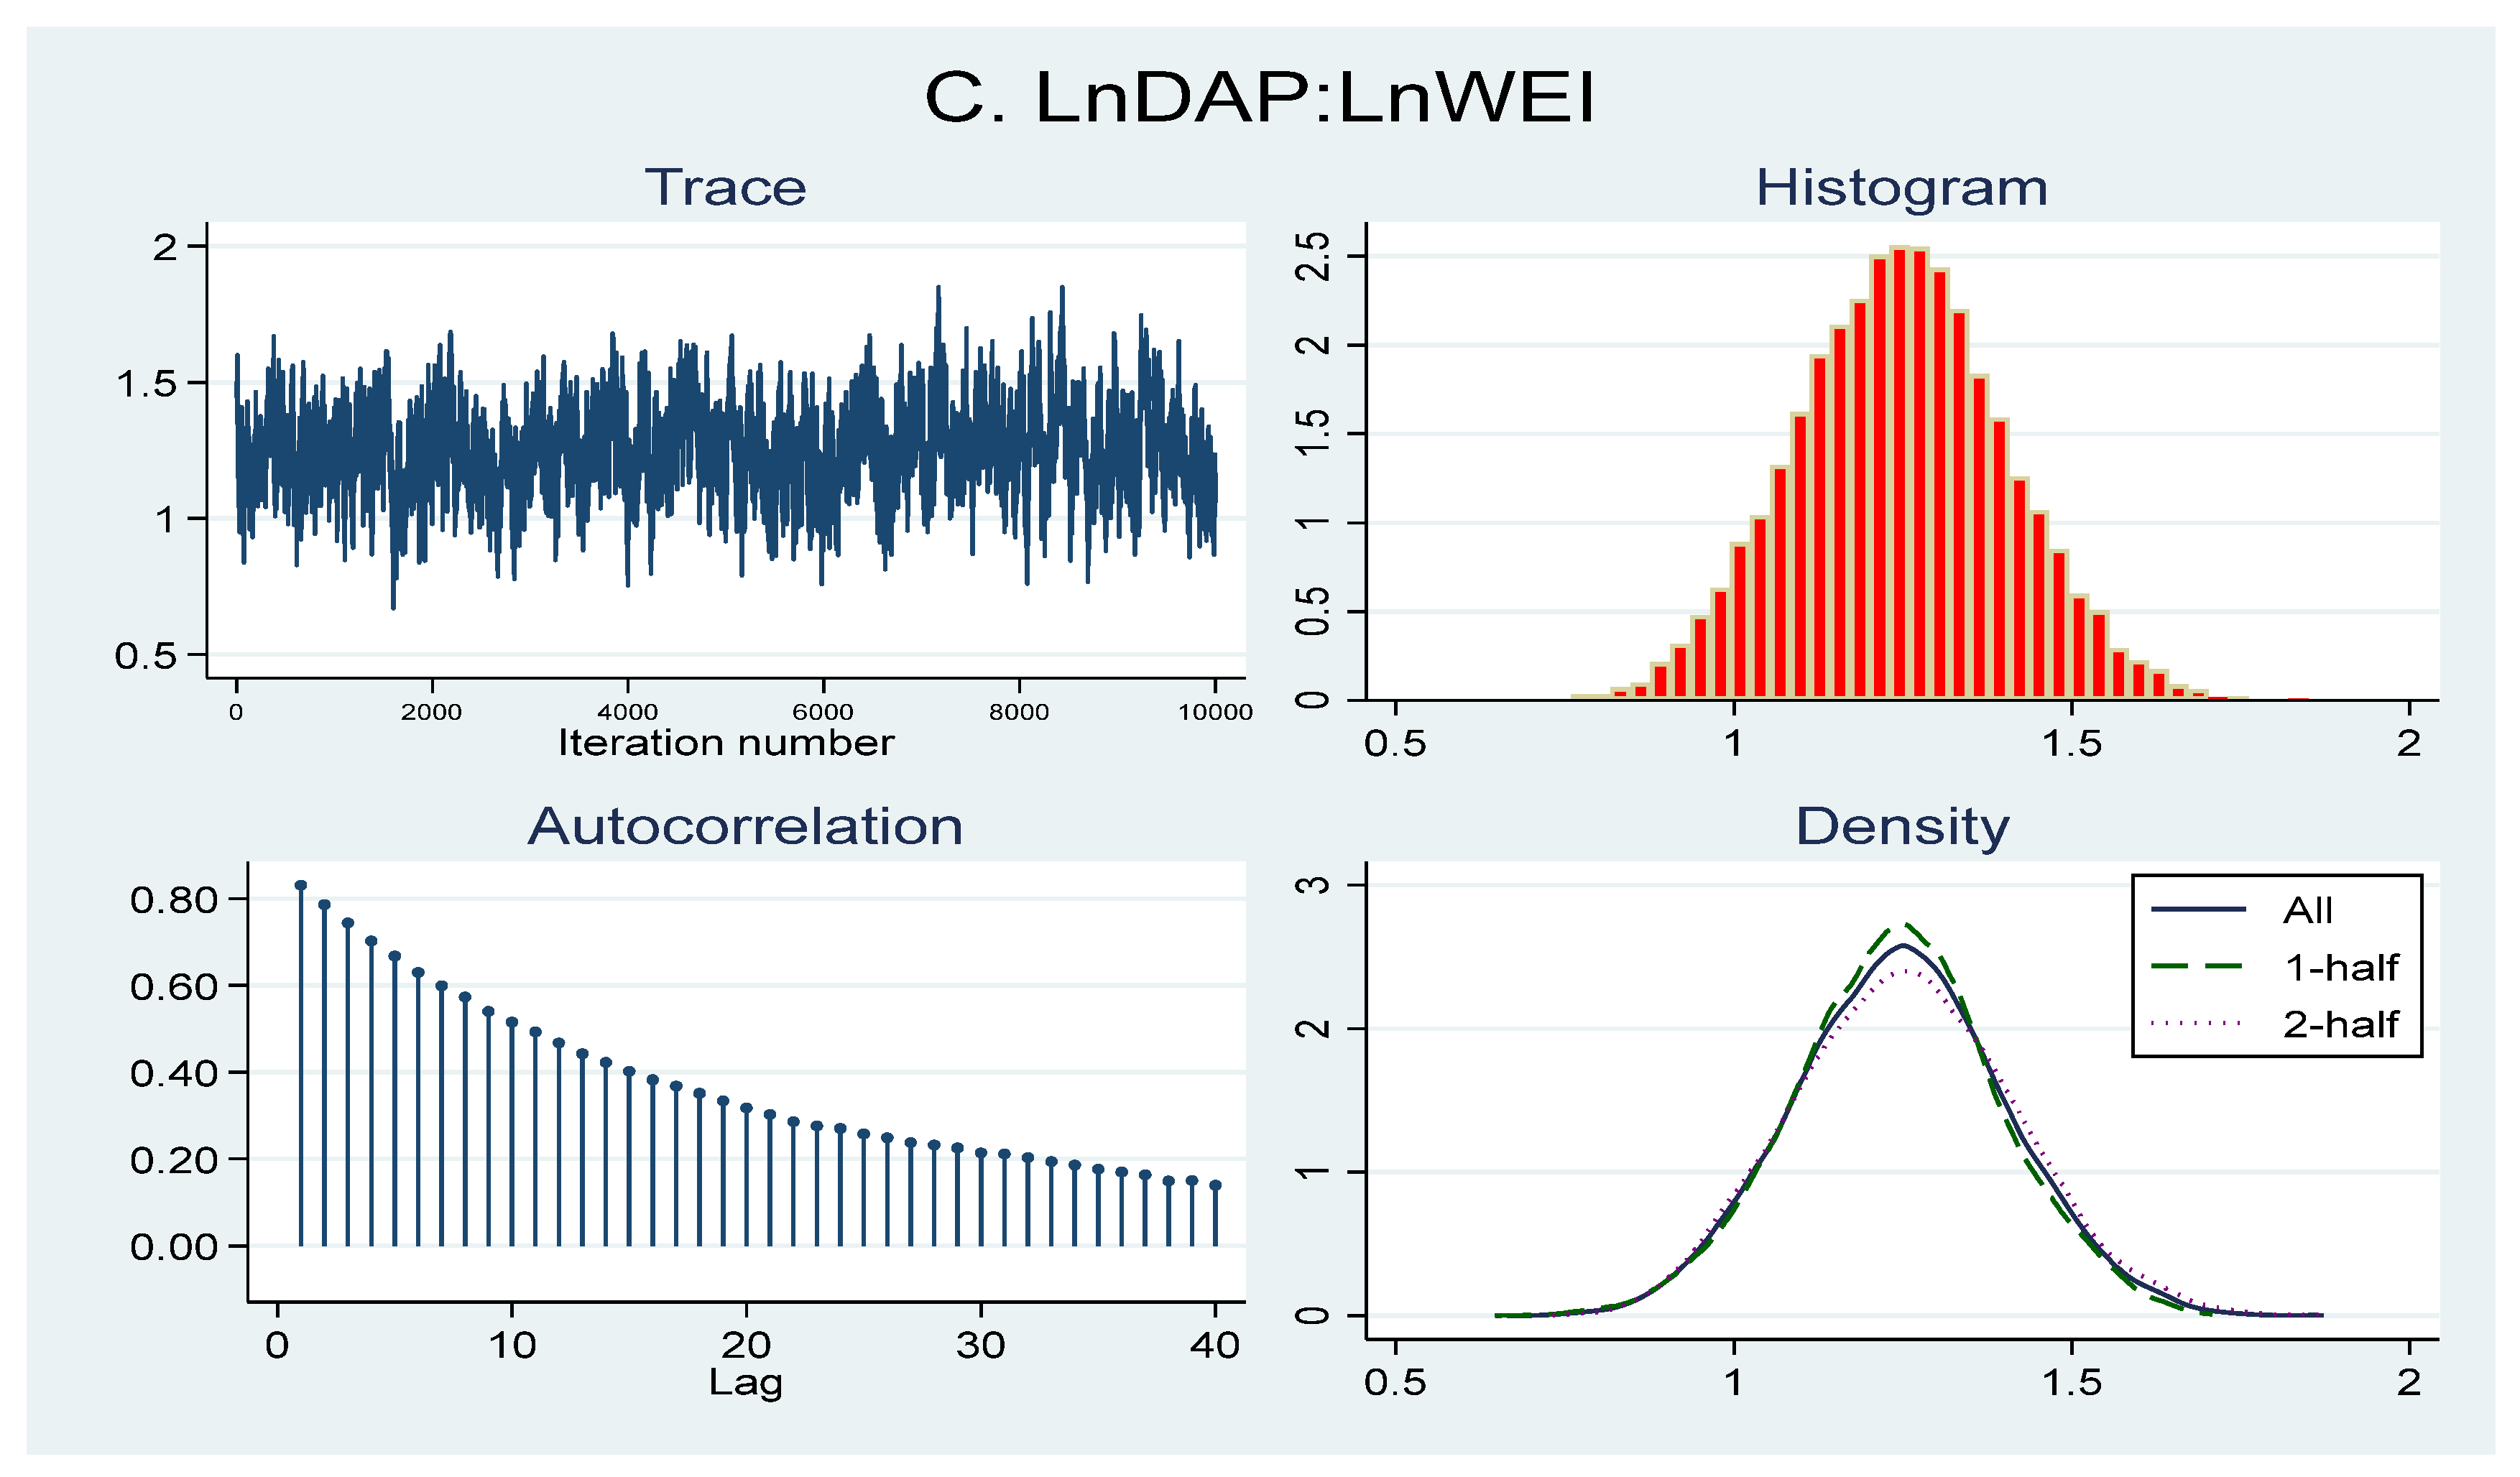
MCMC is achieved through plots of trace, histogram, autocorrelation, and kernel density (density plot). Figure 2 reveals that there is no apparent trend in the trace plots, the traces run quickly through the distribution, thus indicating the convergence of MCMC. Autocorrelation decreases with time (falls quickly), indicating that successive samples in the (MCMC) process are less correlated., i.e., it does not have a judgment to suspect the non-convergence of water use efficiency, but it is crucial to rigorously verify the convergence of all model parameters to ensure the reliability of the Bayesian analysis results. In addition, the histograms for the coefficients of WUA, WUS, and WUI are found to be in good agreement with the precise normal distribution, i.e., homogeneous. The Kernel density plots reveal that coefficients of WUA, WUS, and WUI density curves are closely aligned, suggesting that the MCMC samples have effectively converged and mixed. It is concluded that the Bayesian inference is efficient and reasonable.
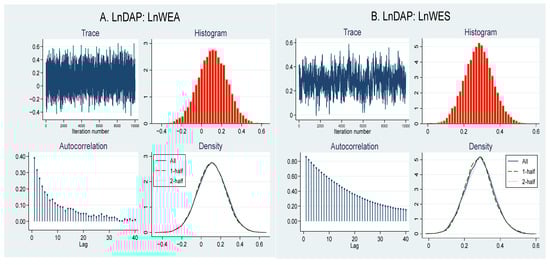
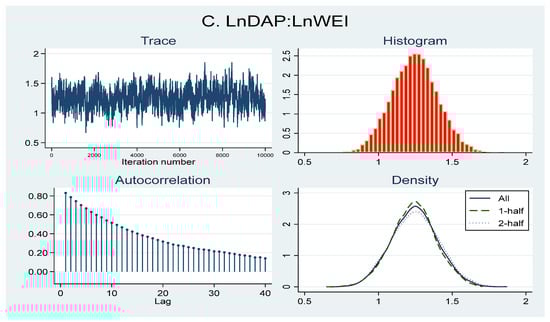
Figure 2.
Graphical diagnostics for MCMC convergence of date palm production. Note: Trace plots illustrate the values of a parameter over MCMC iterations; histograms expose the distribution of sampled values for a parameter, autocorrelation plots show the correlation of a parameter with its lagged values, and density plots depict the estimated posterior distribution of a parameter (“all” indicates that the plot represents the entire dataset, “1 half” means that the plot represents half of the data, and “2 half” suggests that the density plot displays two halves of the data separately). Source: Author’s computation (2024).
4.3.2. Gelman–Rubin Convergence Diagnostic
The Gelman–Rubin convergence diagnostic (RC) considers MCMC convergence by examining differences between numerous Markov chains [69,70]. The results of the RC statistics for the model parameters are reported in Table 13. Based on the maximum RC, the convergence diagnostics for all model parameters are below 1.1. This implies that all chains have converged (therefore, the converged MCMC signifies that chain values represent the posterior distribution). This study concluded that the five simulated Markov chains properly check the convergence of the model parameters; adding these outcomes exhibits that the posterior simulation satisfies the conditions of the Bayesian analysis.
Table 13.
Gelman–Rubin convergence diagnostic results.
Confirming that the conditions of the Bayesian analysis are satisfied in the obtained outcomes implies that this study’s conclusions and assumptions regarding the impact of water use efficiency on date palms are more likely to be robust and reliable. This helps decision-makers recognize the consequences of water management decisions and model long-term planning efforts conveyed to agricultural practices and water resource management.
4.3.3. Posterior Distributions of Panel Effects
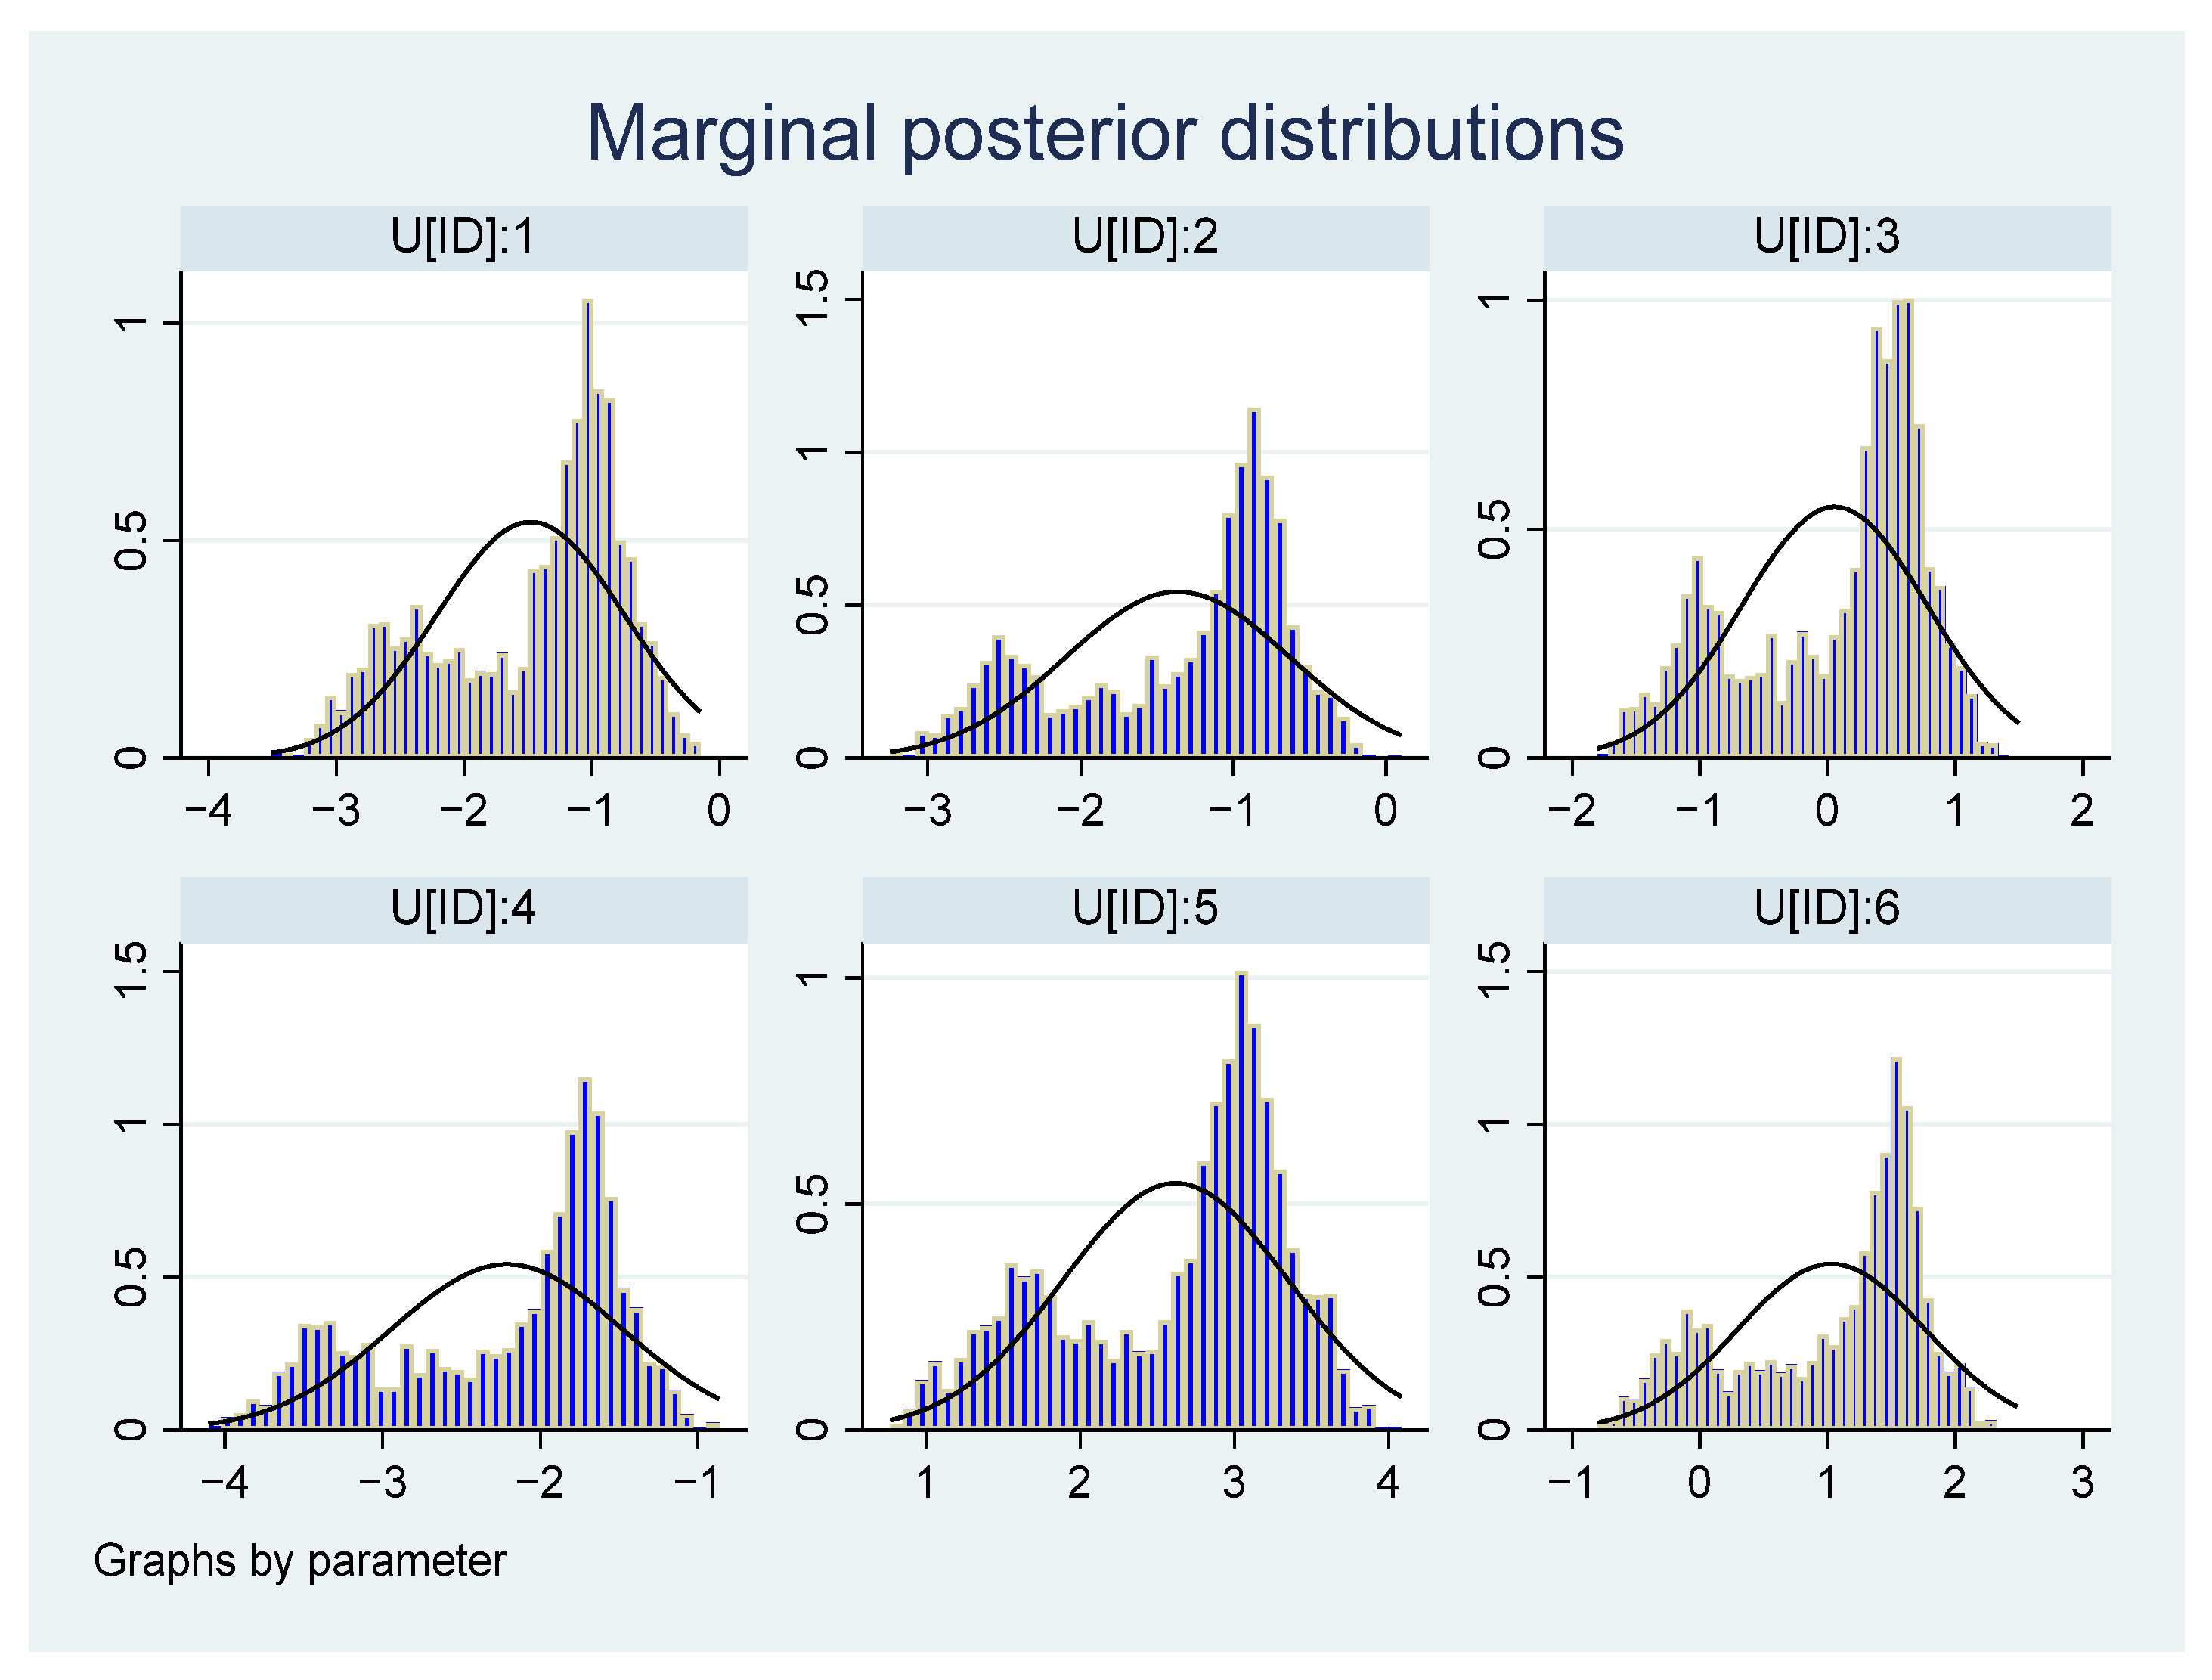
In Bayesian investigation, understanding and working with marginal distributions are essential for performing various analyses, such as calculating posterior probabilities, making predictions, and assessing the uncertainty associated with specific variables of interest [71]. The posterior distributions for the first six individual effects were plotted. Figure 3 shows that country effects denote shifts or offsets from the average date palm production (LnDAP). This result indicates that the fit of the model, the validation of the results, and the knowledge of the decision-making can suggest water management strategies for date palm cultivation.
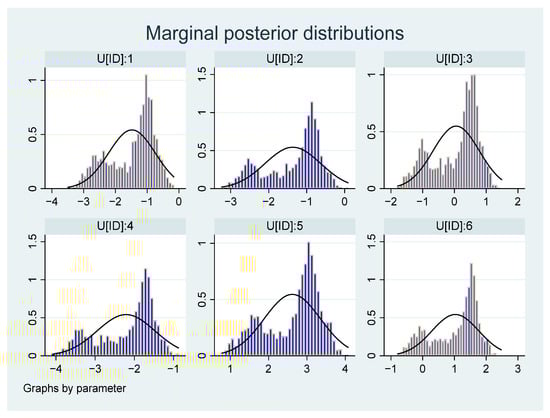
Figure 3.
Marginal posterior distributions of date production. Note: 1. The black lines in the figure represent normal distribution curves covered on histograms showing the marginal posterior distributions for different parameters in Bayesian analysis 2. The blue color (histograms) represents the actual data points collected for each parameter.
4.4. Bayesian Posterior Predictions
This study applies forecast horizons h = 0, 1, ..., 10. It is clear from Table 14 that the predicted posterior means are closely aligned with the observed values, which indicates that the Bayesian model used to predict the impact of water use efficiency on date production is performing well in terms of its accuracy, concluding that the model is effectively capturing the relationship between water use efficiency and date palm production. This result agrees with [28], where it was confirmed that the dynamic Bayesian model can be used for water and crop prediction. This is crucial for making informed decisions considering irrigation practices or agricultural management strategies for date palm cultivation.
Table 14.
Bayesian posterior.
To ensure that the Bayesian model fits properly, the check of the posterior predictive model was tested by computing the posterior predictive p-values (PPPs).
The PPP for the minimum, 0.0.0353, is not close to 0 or 1, so the model fits well concerning this statistic. However, the PPP for the maximum, 0.0.9611, is close to 1, thus suggesting a poor fit for this statistic (Table 15).
Table 15.
Posterior predictive summary.
4.5. Robustness Checks
The findings from the PCSE model confirm that water use efficiency has a significant impact on date palm production (Table 16). Water use efficiency for agriculture (β = −2.834, significant at 1%) and services (β = −0.329, significant at 1%) has a negative relationship, whereas water use efficiency for industrial purposes (β = 0.503, significant at 1%) shows a positive relationship with date production.
Table 16.
Results of PCSE and FGLSs estimators for date palm production.
These results might be due to competition for water resources, i.e., efficient water use in services and agriculture can lead to increased competition for limited water resources, reducing the availability of water for palm cultivation, as well as services and agriculture, that typically have high water demands, which can rinse water supplies and lead to water scarcity for palm production. Industrial water efficiency practices, such as water recycling, can help preserve water resources, making more water available for agricultural activities. This result agrees with [72]. In addition, industrial water efficiency initiatives often involve technological innovations that can be applied to agriculture, improving water management practices in palm production.
These results indicate that the efficiency of water use efficiency plays a critical role in determining the level of date palm production. This suggests that in agricultural and service sectors, higher water use efficiency is associated with lower levels of date palm production, possibly due to different resource allocation priorities or environmental constraints. On the other hand, in industrial settings, greater water use efficiency appears to be linked to increased date production, implying that industrial processes might benefit from optimized water usage practices that enhance output. Overall, these findings emphasize the complicated nature of water use efficiency’s impact on date production, highlighting the need for adapted strategies to maximize productivity while ensuring sustainable resource management. In comparing the study results with [73], I found a positive impact on water use efficiency and enhancement of date palm production based on the irrigation method of palm trees. Also, Ref. [74] stated that inefficient water use negatively affects date palm farms.
The fitness and accuracy of the PCSE model are further tested using the FGLSs procedure. The overall results of the PCSE are consistent with those presented with the FGLSs model (Table 16).
5. Conclusions and Policy Implications
Date palm production in GCC countries faces several challenges that influence the farming and production of date palm. These challenges involve climate changes, high soil salinity, market competition, and water scarcity. GCC countries have limited renewable water resources due to the scarcity of rainfall. Therefore, this study aims to provide new empirical evidence on the impact of water use efficiency for various purposes involving agriculture, services, and industrial purposes on date palm production for GCC countries over the period 2000–2022 by adopting annual panel macro data. The data analysis relies on the Bayesian random and mixed effect techniques and its diagnosis environment. Before estimating the Bayesian model, the matrix correlation, normality, cross-sectional dependence, homogeneity, unit roots, and panel cointegration tests of Pedroni and Westerlund with an Error Correction Model (ECM) were tested. In addition, the robustness checks were achieved by examining the PCSE and FGLSs estimators. To homogenize the variable series, all the data were transformed into natural logarithm (Ln) forms. The existence of heterogeneity and a cross-section dependency are observed. The results of the LLC test show that the selected variables are stationary when considering intercept and time trends at both level and first differences.
The cointegration tests confirmed the existence of a long relationship between the studied water use efficiency and date palm production.
The results of Bayesian random and mixed effects indicate that the MCMC algorithm is effectively exploring the relationship between date palm production and water use efficiency, signifying that the outcomes obtained from the analysis are more likely to be valid and reliable. Furthermore, the shape of the histogram stimulating the shape of the probability distributions is consistent. Therefore, it can be assumed that the Bayesian inference is stable. Additionally, the posterior simulation satisfies the conditions of the Bayesian analysis. This result indicates the fit of the model, the validation of the results, and the knowledge that decision-making can suggest water management strategies for date palm cultivation.
The findings from the PCSE and FGLSs models confirm that water use efficiency has a significant impact on date palm production. Higher water use efficiency for industry purposes appears to be linked to increased date production, implying that industrial processes might benefit from optimized water usage practices that enhance output.
Given the significant impact of water use efficiency on date production in GCC countries, this study recommended the regular monitoring and evaluation of water usage in date palm farms. This study also recommends supporting the development of drought-resistant date palm varieties and resilient agricultural systems to enhance the sector’s resilience to water scarcity challenges. Also, providing incentives or subsidies for farmers to adopt water-saving technologies and practices that have been proven effective in improving water use efficiency is highly recommended. By integrating these recommendations into policy frameworks and decision-making processes, policymakers can promote sustainable water use practices in date palm cultivation, enhance agricultural productivity, and contribute to the sector’s long-term viability while safeguarding water resources for future generations. Developing and implementing comprehensive strategies, such as Integrated Water Resource Management (IWRM), that consider the needs of all water users, including agriculture, services, and industry, as well as establishing coordinated water distribution plans to ensure sustainable water use practices across various sectors, are highly recommended for policymakers and stakeholders.
Based on this conclusion, this study acknowledges the need for further research to explore the impacts of climate change on water resources and date production to develop adaptation strategies that enhance the resilience of date palm cultivation. This will help the development of sustainable agricultural practices that balance water conservation with agrarian productivity.
When conducting a study on the impact of water use efficiency on date production, several limitations may arise that could affect the interpretation and generalizability of the findings. The limited availability of data on water use efficiency may restrict the depth and accuracy of the analysis. Furthermore, the findings obtained from this study may be limited to the specific geographic location where this research was conducted, making it challenging to generalize the results to other regions with other environmental characteristics. Also, this study is limited considering contextual variables such as annual precipitation, Standardized Precipitation Index (SPI), technology investments, and palm varieties, as these were not extensively incorporated into the analysis. It is recommended that future studies address this limitation by incorporating these contextual variables to better understand the factors influencing water use efficiency and enhance the robustness of the analysis.
Funding
This research was funded by the Deanship of Scientific Research, King Faisal University, Al-Ahsa, Saudi Arabia, through financial support under the Ambitious Researcher Track, grant No. KFU242717.
Data Availability Statement
The datasets used in the current study have been derived from the public domain open access resources’ repository FAOSTAT for free online from https://www.fao.org/faostat/en/#data (accessed on 19 January 2025).
Conflicts of Interest
The author declares no conflicts of interest.
References
- Al-Mssallem, M.Q.; Al-Khayri, J.M.; Alghamdi, B.A.; Alotaibi, N.M.; Alotaibi, M.O.; Al-Qthanin, R.N.; Al-Shalan, H.Z. Role of Date Palm to Food and Nutritional Security in Saudi Arabia. In Food and Nutrition Security in the Kingdom of Saudi Arabia; Springer International Publishing: Cham, Switzerland, 2024; Volume 2, pp. 337–358. [Google Scholar]
- Dhehibi, B.; Ben Salah, M.; Frija, A. Date Palm Value Chain Analysis and Marketing Opportunities for the Gulf Cooperation Council (GCC) Countries. In Agricultural Economics—Current Issues; IntechOpen: London, UK, 2019. [Google Scholar]
- Sudhersan, C.; Sudhersan, J.; Ashkanani, J.; Al-Sabah, L. Date Palm Status and Perspective in Kuwait. In Date Palm Genetic Resources and Utilization; Springer: Dordrecht, The Netherlands, 2015; pp. 299–321. [Google Scholar]
- Dhehibi, B.; Makhlouf, M.; Nejatian, A.; Niane, A.A.; Hilali, M.E.-D.; Al-Abri, N.; Al-Amri, M.; Al-Ghabshi, A.; Al-Khanjari, H.; Alkhamisi, S.A. Date Value Chain Analysis, Development, and Competitiveness of Date Palm Products in the Sultanate of Oman. J. Oasis Agric. Sustain. Dev. 2022, 4, 91–103. [Google Scholar] [CrossRef]
- Alnaim, M.A.; Mohamed, M.S.; Mohammed, M.; Munir, M. Effects of Automated Irrigation Systems and Water Regimes on Soil Properties, Water Productivity, Yield and Fruit Quality of Date Palm. Agriculture 2022, 12, 343. [Google Scholar] [CrossRef]
- FAO. FAOSTAT; Food and Agriculture Organization of the United Nations: Rome, Italy, 2025. [Google Scholar]
- Kordrostami, M.; Mafakheri, M.; Al-Khayri, J.M. Date Palm (Phoenix dactylifera L.) Genetic Improvement via Biotechnological Approaches. Tree Genet. Genomes 2022, 18, 26. [Google Scholar] [CrossRef]
- Sherif, M.; Liaqat, M.U.; Baig, F.; Al-Rashed, M. Water Resources Availability, Sustainability and Challenges in the GCC Countries: An Overview. Heliyon 2023, 9, e20543. [Google Scholar] [CrossRef] [PubMed]
- FAO. FAOSTAT. World Food and Agriculture. 2024. Available online: https://www.fao.org/faostat/en/#data/QCL (accessed on 19 January 2025).
- Al-Mulla, Y.; Al-Gheilani, H.M. Increasing Water Productivity Enhances Water Saving for Date Palm Cultivation in Oman. J. Agric. Mar. Sci. 2018, 22, 87–91. [Google Scholar] [CrossRef]
- Tripler, E.; Shani, U.; Mualem, Y.; Ben-Gal, A. Long-Term Growth, Water Consumption and Yield of Date Palm as a Function of Salinity. Agric. Water Manag. 2011, 99, 128–134. [Google Scholar] [CrossRef]
- Bazrafshan, O.; Zamani, H.; Ramezani Etedali, H.; Gerkaninezhad Moshizi, Z.; Shamili, M.; Ismaelpour, Y.; Gholami, H. Improving Water Management in Date Palms Using Economic Value of Water Footprint and Virtual Water Trade Concepts in Iran. Agric. Water Manag. 2020, 229, 105941. [Google Scholar] [CrossRef]
- Dhaouadi, L.; Besser, H.; Karbout, N.; Al-Omran, A.; Wassar, F.; Wahba, M.S.; Yaohu, K.; Hamed, Y. Irrigation Water Management for Sustainable Cultivation of Date Palm. Appl. Water Sci. 2021, 11, 171. [Google Scholar] [CrossRef]
- Mohammed, M.; Sallam, A.; Munir, M.; Ali-Dinar, H. Effects of Deficit Irrigation Scheduling on Water Use, Gas Exchange, Yield, and Fruit Quality of Date Palm. Agronomy 2021, 11, 2256. [Google Scholar] [CrossRef]
- Mattar, M.A.; Soliman, S.S.; Al-Obeed, R.S. Effects of Various Quantities of Three Irrigation Water Types on Yield and Fruit Quality of ‘Succary’ Date Palm. Agronomy 2021, 11, 796. [Google Scholar] [CrossRef]
- Soomro, A.H.; Marri, A.; Shaikh, N. Date Palm (Phoenix dactylifera): A Review of Economic Potential, Industrial Valorization, Nutritional and Health Significance. In Neglected Plant Foods of South Asia; Springer International Publishing: Cham, Switzerland, 2023; pp. 319–350. [Google Scholar]
- Alhamdan, A.; Alamri, Y.; Aljuhaim, F.; Kotb, A.; Aljohani, E.; Alaagib, S.; Elamshity, M. Economic Analysis of the Impact of Waste on the Production and Consumption of Dates in Saudi Arabia. Sustainability 2024, 16, 9588. [Google Scholar] [CrossRef]
- Al-Mssallem, M.Q.; Elmulthum, N.A.; Elzaki, R.M. Nutritional Security of Date Palm Fruit: An Empirical Analysis for Al-Ahsa Region in Saudi Arabia. Sci. J. King Faisal Univ. 2019, 20, 47–54. [Google Scholar]
- Haj-Amor, Z.; Kumar Acharjee, T.; Dhaouadi, L.; Bouri, S. Impacts of Climate Change on Irrigation Water Requirement of Date Palms under Future Salinity Trend in Coastal Aquifer of Tunisian Oasis. Agric. Water Manag. 2020, 228, 105843. [Google Scholar] [CrossRef]
- Hesampour, R.; Hassani, M.; Hanafiah, M.M.; Heidarbeigi, K. Technical Efficiency, Sensitivity Analysis and Economic Assessment Applying Data Envelopment Analysis Approach: A Case Study of Date Production in Khuzestan State of Iran. J. Saudi Soc. Agric. Sci. 2022, 21, 197–207. [Google Scholar] [CrossRef]
- Zhang, P.; Jia, M.; Wei, X. Sustainable Water–Ecosystem Management Using the Bayesian Network and Variable Relationship Analysis. Water Supply 2024, 24, 1999–2008. [Google Scholar] [CrossRef]
- Shi, Y.; Liu, S.; Shi, H. Analysis of the Water-Food-Energy Nexus and Water Competition Based on a Bayesian Network. Water Resour. Manag. 2022, 36, 3349–3366. [Google Scholar] [CrossRef]
- Candelieri, A.; Ponti, A.; Giordani, I.; Archetti, F. Lost in Optimization of Water Distribution Systems: Better Call Bayes. Water 2022, 14, 800. [Google Scholar] [CrossRef]
- Bertone, E.; Sahin, O.; Stewart, R.A.; Zou, P.X.W.; Alam, M.; Hampson, K.; Blair, E. Role of Financial Mechanisms for Accelerating the Rate of Water and Energy Efficiency Retrofits in Australian Public Buildings: Hybrid Bayesian Network and System Dynamics Modelling Approach. Appl. Energy 2018, 210, 409–419. [Google Scholar] [CrossRef]
- Kaghazchi, A.; Hashemy Shahdany, S.M.; Roozbahani, A. Simulation and Evaluation of Agricultural Water Distribution and Delivery Systems with a Hybrid Bayesian Network Model. Agric. Water Manag. 2021, 245, 106578. [Google Scholar] [CrossRef]
- Maziotis, A.; Molinos-Senante, M. Comparative Efficiency of Chilean Water Utilities: A Bayesian Stochastic Frontier Approach. Urban. Water J. 2024, 21, 965–975. [Google Scholar] [CrossRef]
- Dehghani, S.; Massah Bavani, A.; Roozbahani, A.; Sahin, O. Assessment of Climate Change-Induced Water Scarcity Risk by Using a Coupled System Dynamics and Bayesian Network Modeling Approaches. Water Resour. Manag. 2024, 38, 3853–3874. [Google Scholar] [CrossRef]
- Ma, Y.; Xue, J.; Feng, X.; Zhao, J.; Tang, J.; Sun, H.; Chang, J.; Yan, L. Crop Water Productivity Assessment and Planting Structure Optimization in Typical Arid Irrigation District Using Dynamic Bayesian Network. Sci. Rep. 2024, 14, 17695. [Google Scholar] [CrossRef]
- Shen, J.; Zhang, H.; Zhao, Y.; Song, J. An Examination of the Mitigation Effect of Vegetation Restoration on Regional Water Poverty: Based on Panel Data Analysis of 9 Provinces in the Yellow River Basin of China from 1999 to 2019. Ecol. Indic. 2023, 146, 109860. [Google Scholar] [CrossRef]
- Alruqi, M. Optimizing the Model-Prediction of Date Palm Fronds-Derived Producer Gas and Third Generation Biodiesel Powered Dual-Fuel Engine by Employing Bayesian-Optimized Boosted Regression Trees for Enhanced Prognostics. Process Saf. Environ. Prot. 2024, 187, 1338–1353. [Google Scholar] [CrossRef]
- Ortiz-Uribe, N.; Salomón-Torres, R.; Krueger, R. Date Palm Status and Perspective in Mexico. Agriculture 2019, 9, 46. [Google Scholar] [CrossRef]
- Al-Muaini, A.; Green, S.; Dakheel, A.; Abdullah, A.-H.; Abou Dahr, W.A.; Dixon, S.; Kemp, P.; Clothier, B. Irrigation Management with Saline Groundwater of a Date Palm Cultivar in the Hyper-Arid United Arab Emirates. Agric. Water Manag. 2019, 211, 123–131. [Google Scholar] [CrossRef]
- Zhen, J.; Lazarovitch, N.; Tripler, E. Effects of Fruit Load Intensity and Irrigation Level on Fruit Quality, Water Productivity and Net Profits of Date Palms. Agric. Water Manag. 2020, 241, 106385. [Google Scholar] [CrossRef]
- Semykina, A.; Wooldridge, J.M. Estimation of Dynamic Panel Data Models with Sample Selection. J. Appl. Econom. 2013, 28, 47–61. [Google Scholar] [CrossRef]
- Latif, Z.; Yang, M.; Danish; Latif, S.; Liu, X.; Pathan, Z.H.; Salam, S.; Zeng, J. The Dynamics of ICT, Foreign Direct Investment, Globalization and Economic Growth: Panel Estimation Robust to Heterogeneity and Cross-Sectional Dependence. Telemat. Inform. 2018, 35, 318–328. [Google Scholar] [CrossRef]
- Bhattarai, K. Application of Panel Data Models for Empirical Economic Analysis. In Panel Data Econometrics; Elsevier: Amsterdam, The Netherlands, 2019; pp. 665–708. [Google Scholar]
- Hashem Pesaran, M.; Yamagata, T. Testing Slope Homogeneity in Large Panels. J. Econ. 2008, 142, 50–93. [Google Scholar] [CrossRef]
- Levin, A.; Lin, C.-F.; James Chu, C.-S. Unit Root Tests in Panel Data: Asymptotic and Finite-Sample Properties. J. Econ. 2002, 108, 1–24. [Google Scholar] [CrossRef]
- Dogan, E.; Seker, F. An Investigation on the Determinants of Carbon Emissions for OECD Countries: Empirical Evidence from Panel Models Robust to Heterogeneity and Cross-Sectional Dependence. Environ. Sci. Pollut. Res. 2016, 23, 14646–14655. [Google Scholar] [CrossRef]
- Pedroni, P. Panel Cointegration Techniques and Open Challenges. In Panel Data Econometrics; Elsevier: Amsterdam, The Netherlands, 2019; pp. 251–287. [Google Scholar]
- Elzaki, R.M. Does Fish Production Influence the GDP and Food Security in Gulf Cooperation Council Countries? Evidence from the Dynamic Panel Data Analysis. Aquaculture 2024, 578, 740058. [Google Scholar] [CrossRef]
- Pedroni, P. Panel cointegration: Asymptotic and finite sample properties of pooled time series tests with an application to the PPP hypothesis. Econ. Theory 2004, 20, 597–625. [Google Scholar] [CrossRef]
- Westerlund, J. New Simple Tests for Panel Cointegration. Econ. Rev. 2005, 24, 297–316. [Google Scholar] [CrossRef]
- Phillips, P.C.B.; Perron, P. Testing for a Unit Root in Time Series Regression. Biometrika 1988, 75, 335–346. [Google Scholar] [CrossRef]
- Westerlund, J. Heteroscedasticity Robust Panel Unit Root Tests. J. Bus. Econ. Stat. 2014, 32, 112–135. [Google Scholar] [CrossRef]
- Bayes, R.T. Bayes’ Theorem. An Essay towards Solving a Problem in the Doctrine of Chances. Philos. Trans. R. Soc. 1953, 53, 370–418. [Google Scholar]
- Lemoine, N.P. Moving beyond Noninformative Priors: Why and How to Choose Weakly Informative Priors in Bayesian Analyses. Oikos 2019, 128, 912–928. [Google Scholar] [CrossRef]
- Tien, L.T.; Duc, N.C.; Kieu, V.T.T. The Effect of Exchange Rate Volatility on FDI Inflows: A Bayesian Random-Effect Panel Data Model. In Financial Econometrics: Bayesian Analysis, Quantum Uncertainty, and Related Topics, Proceedings of the International Econometric Conference of Vietnam, Ho Chi Minh City, Vietnam, 10–12 January 2022; Springer International Publishing: Cham, Switzerland, 2022; pp. 483–499. [Google Scholar]
- Tram, B.L.; Nguyen, V.T.; Ngo, V.T.; Nguyen, T.L. IMF—Measured Stock Market Development and Firms’ Use of Debt: Evidence from Developing Countries. In Financial Econometrics: Bayesian Analysis, Quantum Uncertainty, and Related Topics, Proceedings of the International Econometric Conference of Vietnam, Ho Chi Minh City, Vietnam, 10–12 January 2022; Springer International Publishing: Cham, Switzerland, 2022; pp. 547–564. [Google Scholar]
- Lin, J.; Gamalo-Siebers, M.; Tiwari, R. Ensuring Exchangeability in data-based Priors for a Bayesian Analysis of Clinical Trials. Pharm. Stat. 2022, 21, 327–344. [Google Scholar] [CrossRef]
- Roy, V. Convergence Diagnostics for Markov Chain Monte Carlo. Annu. Rev. Stat. Appl. 2020, 7, 387–412. [Google Scholar] [CrossRef]
- Abbas, M.; Yang, L.; Lahr, M.L. Globalization’s Effects on South Asia’s Carbon Emissions, 1996–2019: A Multidimensional Panel Data Perspective via FGLS. Humanit. Soc. Sci. Commun. 2024, 11, 1171. [Google Scholar] [CrossRef]
- Beck, N.; Katz, J.N. Nuisance vs. Substance: Specifying and Estimating Time-Series-Cross-Section Models. Political Anal. 1996, 6, 1–36. [Google Scholar] [CrossRef]
- Prais, S.J.; Winsten, C.B. Trend Estimators and Serial Correlation. Cowles Comm. Discuss. Pap. 1954, 383, 1–26. [Google Scholar]
- Parks, R.W. Efficient Estimation of a System of Regression Equations When Disturbances Are Both Serially and Contemporaneously Correlated. J. Am. Stat. Assoc. 1967, 62, 500–509. [Google Scholar] [CrossRef]
- Kmenta, J. Elements of Econometrics; Macmillan: New York, NY, USA, 1986. [Google Scholar]
- Mumuni, S.; Mwimba, T. Modeling the Impact of Green Energy Consumption and Natural Resources Rents on Economic Growth in Africa: An Analysis of Dynamic Panel ARDL and the Feasible Generalized Least Squares Estimators. Cogent Econ. Financ. 2023, 11, 2161774. [Google Scholar] [CrossRef]
- Dhehibi, B.; Ben Salah, M.; Frija, A.; Aw-Hassan, A.; Al Wahaibi, H.; Al Raisi, Y.; Dewidar, A.Z.; Al Fuhaid, Y.; Nejatian, A.; Niane, A.A. Economic and Environmental Evaluation of Different Irrigation Systems for Date Palm Production in the GCC Countries: The Case of Oman and Saudi Arabia. Desalination Water Treat. 2022, 263, 116–124. [Google Scholar] [CrossRef]
- Addai, K.; Serener, B.; Kirikkaleli, D. Can Environmental Sustainability Be Decoupled from Economic Growth? Empirical Evidence from Eastern Europe Using the Common Correlated Effect Mean Group Test. Reg. Sustain. 2023, 4, 68–80. [Google Scholar] [CrossRef]
- Charfeddine, L.; Kahia, M. Impact of Renewable Energy Consumption and Financial Development on CO2 Emissions and Economic Growth in the MENA Region: A Panel Vector Autoregressive (PVAR) Analysis. Renew. Energy 2019, 139, 198–213. [Google Scholar] [CrossRef]
- Mehmood, A.; Jia, S.; Mahmood, R.; Yan, J.; Ahsan, M. Non-Stationary Bayesian Modeling of Annual Maximum Floods in a Changing Environment and Implications for Flood Management in the Kabul River Basin, Pakistan. Water 2019, 11, 1246. [Google Scholar] [CrossRef]
- Rice, J. Bandwidth Choice for Nonparametric Regression. Ann. Stat. 1984, 12, 1215–1230. [Google Scholar] [CrossRef]
- Sekhri, L.; Razi, S.; Merdaci, S. Water Productivity and Date Palm Production: A Field Study in Biskra Region. South Fla. J. Dev. 2024, 5, e4539. [Google Scholar] [CrossRef]
- Alikhani-Koupaei, M.; Fatahi, R.; Zamani, Z.; Salimi, S. Effects of Deficit Irrigation on Some Physiological Traits, Production and Fruit Quality of ‘Mazafati’ Date Palm and the Fruit Wilting and Dropping Disorder. Agric. Water Manag. 2018, 209, 219–227. [Google Scholar] [CrossRef]
- Viswanathan, M.; Scheidegger, A.; Streck, T.; Gayler, S.; Weber, T.K.D. Bayesian Multi-Level Calibration of a Process-Based Maize Phenology Model. Ecol. Model. 2022, 474, 110154. [Google Scholar] [CrossRef]
- Wang, H.; Snapp, S.S.; Fisher, M.; Viens, F. A Bayesian Analysis of Longitudinal Farm Surveys in Central Malawi Reveals Yield Determinants and Site-Specific Management Strategies. PLoS ONE 2019, 14, e0219296. [Google Scholar] [CrossRef]
- Huang, X.; Huang, G.; Yu, C.; Ni, S.; Yu, L. A Multiple Crop Model Ensemble for Improving Broad-Scale Yield Prediction Using Bayesian Model Averaging. Field Crops Res. 2017, 211, 114–124. [Google Scholar] [CrossRef]
- Cowles, M.K.; Carlin, B.P. Markov Chain Monte Carlo Convergence Diagnostics: A Comparative Review. J. Am. Stat. Assoc. 1996, 91, 883–904. [Google Scholar] [CrossRef]
- Gelman, A.; Rubin, D.B. Inference from Iterative Simulation Using Multiple Sequences. Stat. Sci. 1992, 7, 457–472. [Google Scholar] [CrossRef]
- Balov, N. Gelman–Rubin Convergence Diagnostic Using Multiple Chains. The Stata Blog: Not Elsewhere Classified. 2016. Available online: https://blog.stata.com/2016/05/26/gelman-rubin-convergence-diagnostic-using-multiple-chains/ (accessed on 19 January 2025).
- van de Schoot, R.; Depaoli, S.; King, R.; Kramer, B.; Märtens, K.; Tadesse, M.G.; Vannucci, M.; Gelman, A.; Veen, D.; Willemsen, J.; et al. Bayesian Statistics and Modelling. Nat. Rev. Methods Primers 2021, 1, 1. [Google Scholar] [CrossRef]
- Chen, L.; Chen, Z.; Liu, Y.; Lichtfouse, E.; Jiang, Y.; Hua, J.; Osman, A.I.; Farghali, M.; Huang, L.; Zhang, Y.; et al. Benefits and Limitations of Recycled Water Systems in the Building Sector: A Review. Environ. Chem. Lett. 2024, 22, 785–814. [Google Scholar] [CrossRef]
- Saad Eddin, M.R.; Hassan, A.M.; Hegazi, A.A.; Eid, S.F.M.; Mokhtar, A. Effects of Root Watering System on Yield, Water Use Efficiency and Fruit Quality of Date Palm (c.v. Siwi): A Case Study in the Arid Climate, Egypt. Irrig. Sci. 2023, 41, 589–601. [Google Scholar] [CrossRef]
- Ahmed Mohammed, M.E.; Refdan Alhajhoj, M.; Ali-Dinar, H.M.; Munir, M. Impact of a Novel Water-Saving Subsurface Irrigation System on Water Productivity, Photosynthetic Characteristics, Yield, and Fruit Quality of Date Palm under Arid Conditions. Agronomy 2020, 10, 1265. [Google Scholar] [CrossRef]
Disclaimer/Publisher’s Note: The statements, opinions and data contained in all publications are solely those of the individual author(s) and contributor(s) and not of MDPI and/or the editor(s). MDPI and/or the editor(s) disclaim responsibility for any injury to people or property resulting from any ideas, methods, instructions or products referred to in the content. |
© 2025 by the author. Licensee MDPI, Basel, Switzerland. This article is an open access article distributed under the terms and conditions of the Creative Commons Attribution (CC BY) license (https://creativecommons.org/licenses/by/4.0/).