Article

Quantitative Integration of Audio-Magnetotelluric Sounding and Resistivity Well Logs for Groundwater Studies

1
Department of Geosciences, Faculty of Sciences, Universidad Nacional de Colombia, Bogotá Headquarters, Bogotá 111321, Colombia
2
Department of Civil and Agricultural Engineering, Faculty of Engineering, Universidad Nacional de Colombia, Bogotá Headquarters, Bogotá 111321, Colombia
3
Hydrodynamics of the Natural Media HYDS Research Group, Bogotá 111321, Colombia
*
Author to whom correspondence should be addressed.
Water 2025, 17(23), 3389; https://doi.org/10.3390/w17233389 (registering DOI)
Submission received: 20 October 2025 / Revised: 21 November 2025 / Accepted: 22 November 2025 / Published: 28 November 2025
(This article belongs to the Special Issue Hydrogeophysical Methods and Hydrogeological Models)

Abstract

In this study, we develop a methodology to quantitatively integrate well resistivity logs and audio-magnetotelluric (AMT) sounding in the context of groundwater investigations. The experiments were conducted in a complex Quaternary depositional environment within a region of intensive groundwater use. A synthetic resistivity model was constructed from well resistivity log data and used for forward modelling to generate synthetic AMT responses, which were then inverted using Occam’s algorithm. The AMT-derived resistivity model was subsequently compared with the model obtained from the inversion of the field AMT sounding using the Pearson correlation coefficient (r) and the root mean square error (RMSE). A scalar shift factor (k) was introduced to optimize the match between both models. The comparison between the AMT-derived resistivity model and the well resistivity logs yielded a Pearson correlation coefficient of 0.669 and an RMSE of 0.1911. The optimal scalar shift factor was k = 1.1854, with a 95% confidence interval of [1.1470, 1.2246], indicating only a minor discrepancy. These results demonstrate that AMT can successfully recover a resistivity structure consistent with well resistivity logs. The proposed quantitative integration and validation workflow provides a robust framework to reduce the inherent ambiguity in AMT interpretation and highlights its potential as a direct hydrogeophysical tool for groundwater studies.

1. Introduction

The application of geophysical methods in groundwater and engineering investigations has steadily increased over the past decades, driven by improved instrumentation, data processing, and inversion algorithms [1,2,3,4,5,6,7,8,9,10,11,12,13,14,15,16,17,18]. Among the various geophysical techniques, electrical and electromagnetic methods are particularly attractive because electrical resistivity (ρ) is highly sensitive to lithology, pore structure, and groundwater salinity. In situ characterization of resistivity can be achieved through direct methods, such as well logging, and indirect methods, such as magnetotelluric (MT), AMT, radio-magnetotelluric (RMT), and controlled-source variants [18]. These indirect techniques provide valuable complementary information to borehole cuttings and have been successfully applied to aquifer characterization, groundwater salinization problems, and groundwater–surface water interactions, often in combination with hydrochemical or hydraulic data [6,7,8,19,20,21,22,23]. Case studies in heterogeneous sedimentary environments show that these methods can resolve the thickness and geometry of conductive and resistive units hosting groundwater, especially when combined with well log information and other geophysical techniques [15,22,23,24,25]. The electrical resistivity (ρ) of rocks can span an extremely wide range, from approximately 10−2 to 1015 Ω·m. However, sedimentary rocks tend to fall within a more limited interval, typically between 10−2 and 105 Ω·m, because their resistivity strongly depends on factors such as fluid saturation, pore-water salinity, and the presence of metallic minerals [26,27,28].
Despite these developments, several limitations remain in how AMT/MT models are integrated with well log resistivity logs. First, in many exploration studies [25,29,30,31,32,33,34,35,36,37,38,39,40,41,42,43,44,45,46,47,48,49], well logs are used predominantly as qualitative guides or as constraints during inversion, rather than as the basis for an explicit, direct quantitative comparison between downhole resistivity and AMT/MT-derived resistivity models [25,29,30]. Second, when quantitative measures are employed, they often rely on global misfit or model smoothness criteria, without systematically evaluating correlation, scaling, and uncertainty in the relationship between the two models. Third, although regional studies demonstrate that AMT responses can be consistent with well log at the scale of major lithostratigraphic units [25], there is still a need for simple, transferable workflows that operate at the site scale, explicitly quantify discrepancies between models, and provide uncertainty bounds on key parameters such as static-shift factors.
Moreover, resistivity-based characterization is subject to significant uncertainty, particularly during data processing, inversion, and interpretation [25,29,30,35,38,39,40,50]. Thus, quantifying uncertainty in MT resistivity models remains a key challenge [1], particularly when defining interpreted boundaries such as depth-to-basement or stratigraphic layering. This difficulty arises from the inherent non-uniqueness of the inverse problem, the differential resolution of conductive versus resistive interfaces, and the effects of inversion regularization [48]. Additional complications for direct model-to-log comparisons include: (i) 1D or quasi-1D modelling may not fully capture lateral heterogeneities (e.g., facies changes, grain-size variations, gently dipping structures), even when dimensionality indicators suggest predominantly 1D behaviour; (ii) smooth (Occam-type) regularization tends to smear thin layers and sharp contrasts; (iii) the investigation volumes of well logs (centimetre scale) and MT/AMT soundings (tens to hundreds of metres) differ by orders of magnitude; and (iv) static-shift corrections are commonly approximated by a single scalar factor, implying depth-independent distortion in settings that may be strongly heterogeneous [51,52,53,54,55,56]. These issues are generic to many MT/AMT–log integration problems and motivate the development of transparent, quantitative evaluation frameworks.
As a part of the Multiscale Integrated Water Management Model Project (MEGIA), a groundwater monitoring well nest was established in Barranca-Lebrija and an investigation well was constructed to support its well design (screened intervals), borehole-scale resistivity surveys and AMT sounding were conducted at the well site.
In this contribution, we use the monitoring site—where AMT data and borehole resistivity logs are co-located—to demonstrate and evaluate a quantitative integration workflow that links surface electromagnetic soundings with downhole resistivity measurements in a complex Quaternary depositional environment subjected to intensive groundwater use.
The research methodology adopted in this study consists of three main steps. First, we construct a family of synthetic 1D resistivity models from a well resistivity log and derive a reference model (RM) that balances geological representativeness and parameterization complexity. Second, we invert the AMT sounding using Occam-type 1D algorithms under different discretization schemes and select an optimal layered inversion model (LIM) based on data misfit and model smoothness. Third, we quantitatively compare RM and LIM using root mean square error (RMSE), Pearson’s correlation coefficient, and an optimally estimated scalar shift factor with confidence intervals. In contrast to most previous MT/AMT–well integration studies, the proposed workflow explicitly combines these quantitative metrics to assess the degree of agreement between models. Although the workflow is demonstrated at a single groundwater monitoring site, the methodology is general and can be readily applied to other MT/AMT–well log datasets to systematically evaluate and improve resistivity-based hydrogeophysical interpretations.

2. Materials and Methods

2.1. Study Area

The study area (Figure 1) is located in the north-central sector of the MMV, an intramontane basin bounded by the western flank of the Eastern Cordillera, the eastern flank of the Central Cordillera, and the Serranía de San Lucas, within the Northern Andes Block [57,58,59,60,61]. Specifically, it encompasses the rural settlement of Barranca de Lebrija, in the municipality of Aguachica, Cesar, Colombia.
The rural settlement is situated within the lower hydrological basin of the Lebrija River [62]. The Lebrija River is characterized by a high sediment load [63]. Based on sedimentation rates reported for analogous wetland systems in the MMV [57,64,65], sediment accumulation in the Musanda floodplain lake is estimated to range between 0.5 and 3 cm per year, with an average sedimentation rate between 0.810 and 0.934 cm/year, resulting in the development of thick sedimentary sequences [64,66,67].
A groundwater monitoring nest was established in the study area: a borehole drilled to a depth of 337 m was where geophysical well logging was performed (BL01). Subsequently, a groundwater investigation well was constructed and finally AMT sounding data was acquired at 160 m distance from the well. In addition, twenty AMT/MT soundings were acquired across the study area, enabling the characterization of the regional resistivity structure and supporting the hydrogeological interpretation.

2.2. Geological and Hydrogeologycal Background

The Middle Magdalena Basin (MMB) is a structurally complex sedimentary basin formed through multiple geological events. Its evolution spans from a Jurassic rift basin, developed during extensional tectonics associated with the separation of the northwestern margin of South America from the North American block to a Neogene foreland basin. The study area lies within the Andean systems of the Serranía de San Lucas and the Eastern Cordillera, which form the boundaries of the MMB to the west and east, respectively [57,58,59,60,68,69,70].
The lithostratigraphic sequence of the MMB begins with a crystalline igneous–metamorphic basement at its base, overlain by a thick succession of sediments that culminates with Neogene–Quaternary deposits. These sedimentary rocks can be subdivided into four major groups according to their age and the tectonic events that controlled their deposition [58,59,70,71,72,73,74]. A summary of the main events that led to the formation of the basin is presented in Table 1.
From groundwater conceptualization, the most relevant units of MMB are the Neogene Real Group (N1r) and the Quaternary deposits [75]. The Real Group is composed of sandy mudstones, conglomeratic sandstones, and localized conglomerates, with interbedded claystones. In some sectors, tuffaceous sandstones and pyroclastic material are also present [57,74,75,76,77].
The Quaternary deposits are divided into two main types: floodplain (Qfal) and fluviolacustrine (Qfl). These deposits are laterally interdigitated and, in some areas, overlain by wetlands sediments. The fluviolacustrine deposits are rich in organic matter and exhibit grain sizes ranging from clays to fine sands, whereas the floodplain deposits are slightly coarser, from silts to sands, with paleochannels containing gravels and cobbles [76].
The Real Group and the Quaternary deposits both constitute the regional multilayer aquifer systems. The Quaternary deposits behave as an unconfined granular aquifer with high permeability, whereas the Real Group corresponds to a consolidated sedimentary unit with comparatively lower productivity. Nevertheless, due to its large lateral extent and stratigraphic continuity, the Real Group represents the most hydrogeologically significant aquifer in the region [75,78,79,80,81].
Electromagnetic geophysics studies of the MMB have been correlated with lithology with theoretical resistivity values [72,78,82] and can be summarized as follows: (i) Quaternary deposits composed of clays, silts, and loose sands exhibit resistivities ranging from 1 to 50 Ω·m, while formations with higher clay content are restricted to a narrower range of 1 to 20 Ω·m. (ii) Sandy formations with potential aquifers present resistivities between 20 and 200 Ω·m, whereas limestones and other carbonate rocks display a wide range of 50 to >5000 Ω·m. (iii) Sandstones containing hydrocarbons show values greater than 100 Ω·m, reaching up to the order of 1000 Ω·m. (iv) The deep basement presents resistivities ranging from 100 to >10,000 Ω·m.

2.3. Geophysical Methods

2.3.1. Magnetotelluric Method

The MT method is a passive geophysical technique for estimating subsurface resistivity. It relies on the measurement of natural variations in the electromagnetic field originating from external sources, over a wide frequency range (10−4 to 104 Hz), using electrodes and induction coils. Assuming a plane-wave approximation, the phenomenon is described by Maxwell’s equations. In the frequency domain, these are reduced to the Helmholtz equation for the magnetic field (H) [83].
2H = κ2H
where κ is the wave number, which is defined as:
κ = (iωμ/ρ)1/2
Here, μ is the magnetic permeability of the rocks, which is usually assumed to be μ ≈ μ0, ω angular frequency, and ρ is the resistivity. From this relationship, the attenuation factor or skin depth zs can be estimated using the frequency function (f) as [84]:
zs ≈ 503 (ρ/f)1/2
Measurements of the electric (E) and magnetic (H) fields are typically made in two orthogonal directions. These fields are related in the frequency domain by the MT impedance (Z) tensor [85]:
E(ω) = Z(ω) H(ω)
Subsurface resistivity distribution is classified according to its spatial variability into 1D, 2D, and 3D models. This is determined through analysis of the MT impedance tensor and is a concept known as geoelectric dimensionality.
In a one-dimensional medium, resistivity is a function of depth only. The impedance tensor in this case has zeros along the diagonal and equal magnitudes with opposite signs in the off-diagonal elements [83]:
Z1D = [0  Z]
    [−Z 0]
The Occam algorithm is widely used as an efficient and robust approach for 1D inversion of MT data. The algorithm seeks the simplest and smoothest model that adequately fits the observed data, following Occam’s razor principle. The objective function balances data misfit with model smoothness through a regularization parameter.
For the discrete case, the smoothness constraint is defined as [86]:
R1 = Σi=2N (mi − mi−1)2
where mi is layer resistivity i and N is the number of layers. The inverse problem is solved by minimizing R1 (i.e., obtaining the smoothest possible model) subject to an acceptable fit to the data. Using the method of Lagrange multipliers, the functional to be minimized is:
X2 = R1 + λ Σj=1M (dj − [Fj(m)])2/(qj2)
where λ is the Lagrange multiplier, dj is the observed data, Fj(m) is the model response, M is the number of data points, and qj is the estimated error of the j-th datum. Finally, the Occam inversion can provide a robust and stable solutions in one dimension, representing resistivity variations with depth while reducing overfitting caused by noise.

2.3.2. Well Log Resistivity

Well log resistivity is based on Ohm’s law, which establishes the relationship between the applied electric field and the conductive response of the medium. In continuous media, this law is expressed by the equation J = E/ρ, where J is the current density vector (A/m2), E is the electric field intensity vector (V/m), and ρ is the resistivity (Ω·m).
For a point electrode injecting an electric current I into a homogeneous and isotropic medium with resistivity ρ, the electric potential V at a distance r from the electrode is expressed as [87]
V(r) = (ρ·I)/(2πr)
A typical configuration for well log resistivity measurements is the normal resistivity array type AMNB. This array consists of four electrodes: two current electrodes (A and B) and two potential electrodes (M and N). The potential difference (ΔVMN) measured between M and N, resulting from a current I injected between A and B, is described by the principle of superposition:
ΔV = (ρ·I) (1/AM − 1/AN − 1/BM + 1/BN)/2π
where AM, AN, BM, and BN represent the distances between the respective electrodes. From this relationship, the apparent resistivity (ρa) of the medium is defined as:
ρa = K (ΔV/I)
Geometric factor of the array (K) is calculated as:
K = 2π (1/AM − 1/AN − 1/BM + 1/BN)−1.
In well logging acquisition, electrode (B) is usually placed at the surface, at a distance significantly greater than the other electrode separations. Under this condition, the contributions of the terms 1/BM and 1/BN become negligible, simplifying the equations. Thus, K can be approximated as K ≈ 2π(1/AM − 1/AN)−1.
Therefore, K defines the investigation radius of the measurement. A greater separation between electrodes increases the lateral depth of current penetration into the formation.
Although apparent resistivity (ρa) does not directly represent the true formation resistivity (ρt) as it is influenced by factors such as array geometry, borehole diameter, and mud invasion, it nevertheless provides the closest practical approximation to the formation resistivity.

2.3.3. Magnetotelluric Data Acquisition

Magnetotelluric data were acquired using Phoenix MTU-5C equipment, (manufactured by Phoenix Geophysics Ltd., Toronto, ON, Canada), composed of: (i) an MTU-5C recording unit, (ii) three MTC-150 magnetic coils, and (iii) five non-polarizable electrodes.
The electrodes were deployed in a cross-shaped configuration to record the electric field components Ex and Ey, with a dipole length of 40 m. The electrodes were buried at shallow depth, and the surrounding soil was moistened to ensure good electrical contact.
The recording lasted 4 h and 3 min, covering both the AMT (1 Hz to 10 kHz; depth of investigation between 1 and 2 km) and MT (0.00001 Hz to 1 Hz) frequency ranges. Data was sampled at 24 bits with a rate of 24,000 samples/s, equivalent to approximately 0.1 GB of storage per hour [88].
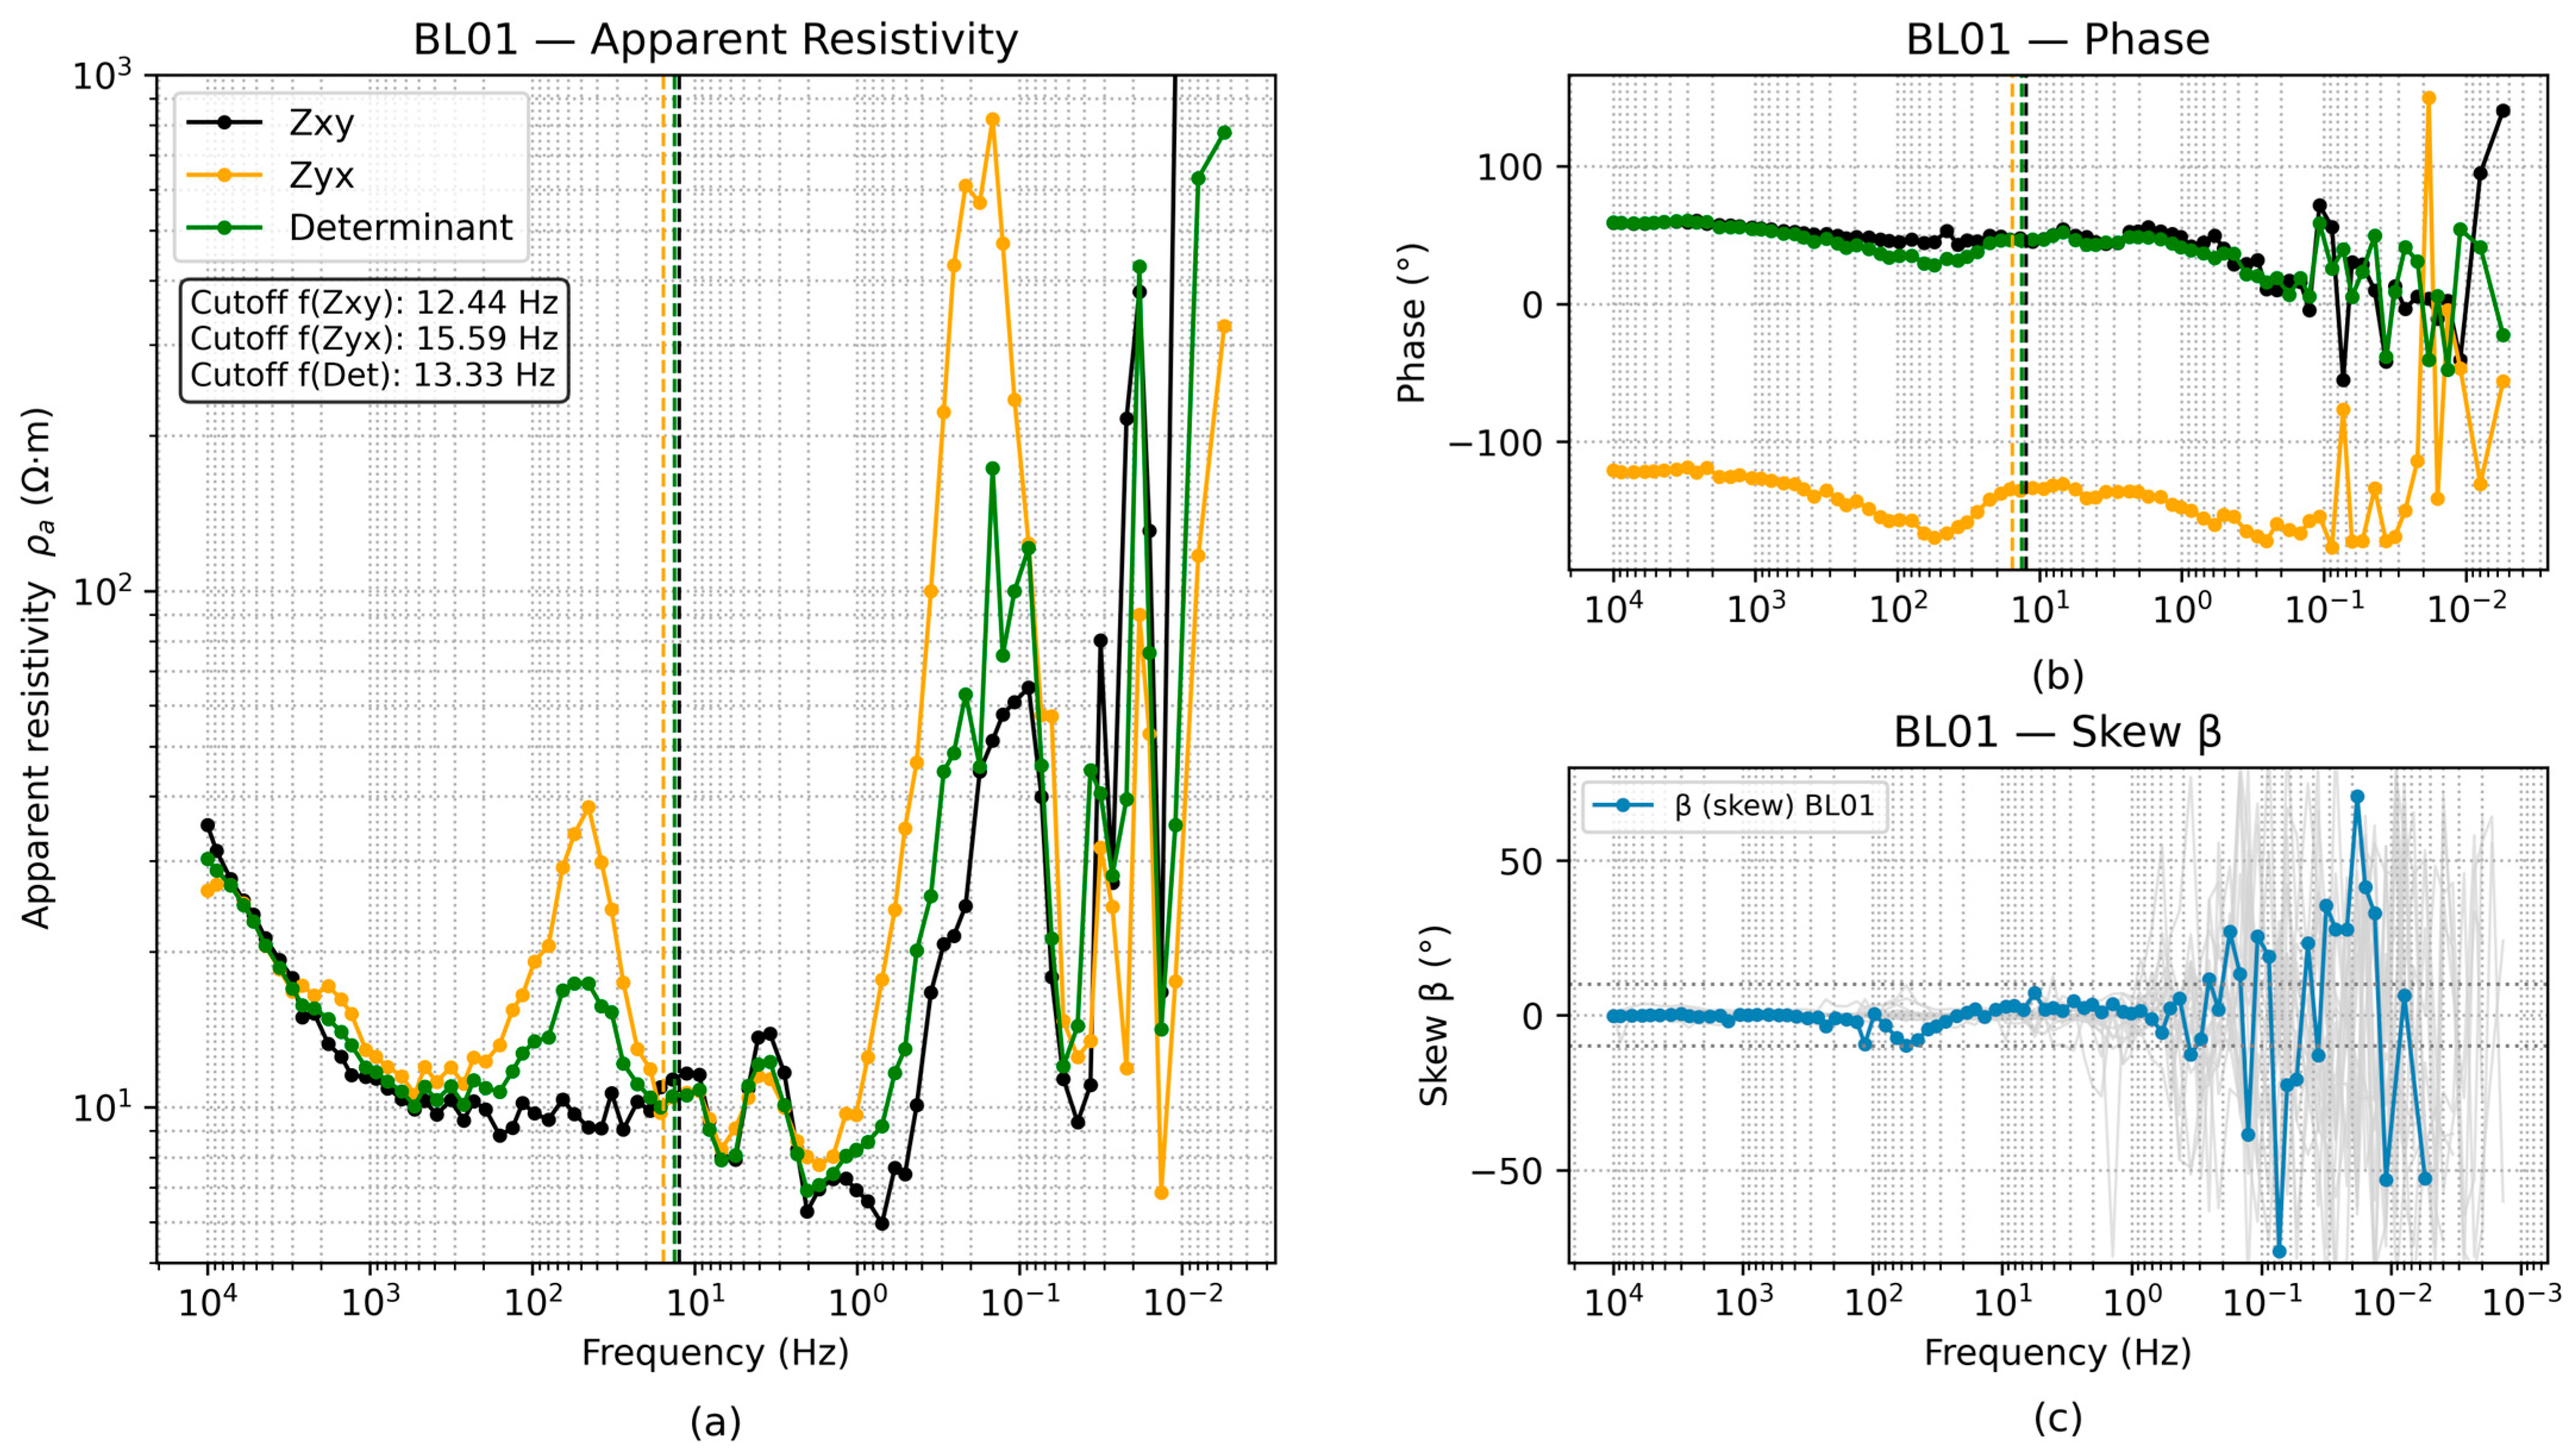
Processing of the sampled data shows that the apparent resistivity and phase components (Figure 2) exhibit approximately parallel behavior. Within the AMT frequency range, resistivity values are below 40 Ω·m, while above 0.5 Hz, they exceed 1000 Ω·m. The skew variability remains below 10° at frequencies much lower than those corresponding to the target depth, supporting the assumption of a predominantly one-dimensional (1D) geoelectric structure in the study area. In Figure 2c, the distribution of skew values for all soundings (shown in gray) exhibits low variability up to frequencies of approximately 1 Hz, with skew consistently below 10°, further reinforcing the interpretation of a mainly 1D subsurface. Additionally, skin depth of 500 m frequency was calculated for each component, yielding 12.44 Hz for Zxy, 15.59 Hz for Zyx, and 13.33 Hz for the determinant.
The discrepancy observed in the 20–200 Hz range between the YX (TM mode) and XY (TE mode) components is explained by the greater sensitivity of the TM mode to lateral variations in resistivity. This component responds more strongly to lateral heterogeneities and subtle 2D effects, even in environments that overall exhibit near-1D behavior. In contrast, the TM mode is typically more sensitive to this type of variation [52,89].

2.4. Well Log Data Acquisition

Resistivity well log data acquisition was carried out using a QL40-ELOG Normal Resistivity probe (manufactured by Advanced Logic Technology (ALT), Echternach, Luxembourg) [90]. This instrument allows configurations with different electrode spacings (8, 16, 32, and 64 inches) [91].
The logging was performed in the borehole previously filled with drilling mud. The probe was moved continuously from the bottom of the well (337 m depth) to the surface, keeping a uniform speed and constant cable tension to ensure signal quality. The spatial resolution of the measurements is 10 cm.
The apparent resistivity curves obtained (Figure 3a). The comparison between the 8″ (short) and 64″ (long) logs allowed for discrimination between the influence of drilling mud in the invaded zone and the electrical response of the unaltered formation [92].
Comparing the resistivity curves with the drill cuttings (Figure 3c) collected during the drilling process revealed marked lithological contrasts. High resistivity values were associated with sand layers and sandy-gravel units saturated, whereas low values correlated with mud intervals or gravels with a significant clay matrix. From a hydrogeological perspective, these resistivity peaks were used to define the placement of the screen grids (Figure 3b), which coincide with stratigraphic segments characterized by coarse-grained materials, particularly in the interval between 110 and 120 m depth.

2.5. Synthetic Model

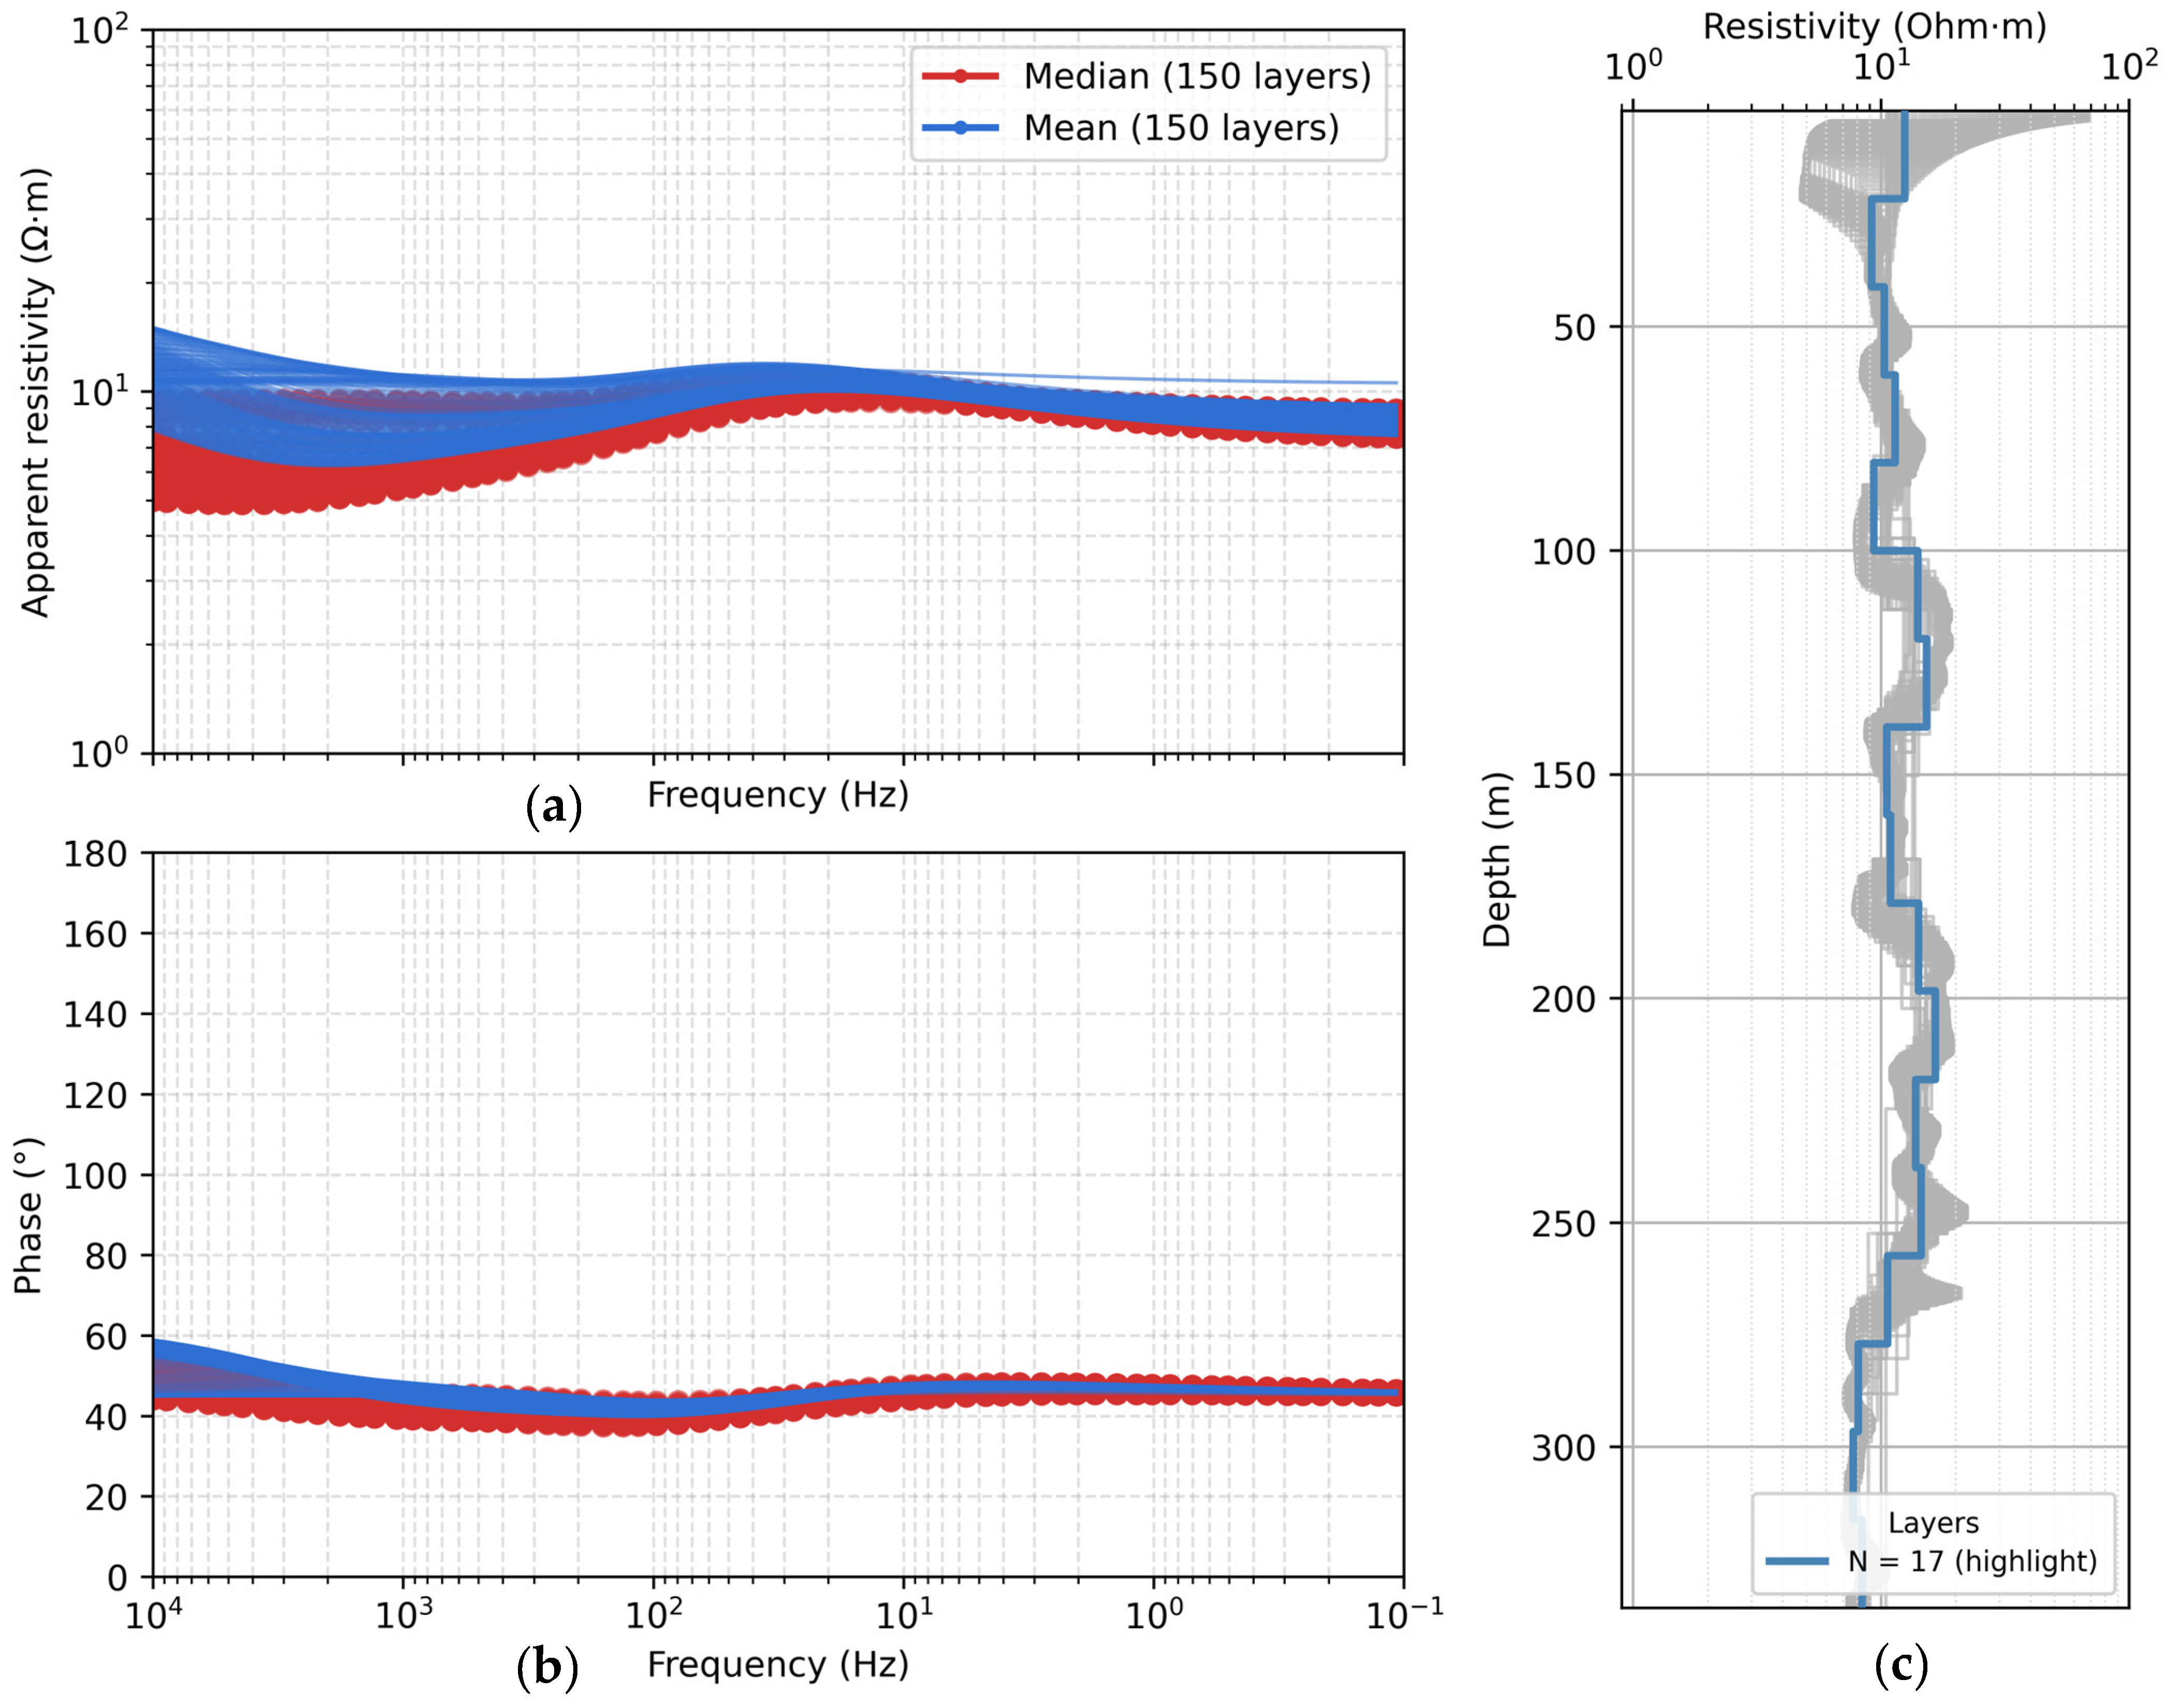
Synthetic magnetotelluric models were constructed from the resistivity well log with a 64-inch electrode spacing (R64). The resistivity assignment for each layer was carried out using two statistical approaches: the arithmetic mean and the median of the R64 log values within the interval of each layer. A discretization ranging from 3 to 150 layers was implemented in a forward modelling using Occam type 1D smoothness constrained inversion (algorithms available in MTpy (v2.0.12) and SimPEG (v0.24.0)) [86,93,94], resulting in a total of 148 synthetic models.
The apparent resistivity, phase, and depth values of each model were compared for both the mean- and median-based approaches (Figure 4). A similar behavior was observed between the apparent resistivity and phase values as the number of layers increased. This trend is consistent with the fact that the R64 log data distribution does not present outliers, confirming that the mean is a robust and representative statistic in this specific case.
We found that the model which best represents resistivity without incurring overfitting from an excessive number of layers is a 17-layer model based on the mean distribution, which we refer to as the “Reference Model -RM” for the results presented below.
RM was compared with the AMT sounding components using Root Mean Square (RMS) for frequencies greater than 1 Hz considering that the skin depth is within the same frequency range as the AMT data.
From the AMT sounding, a skew value below 10° confirms a predominantly one-dimensional environment in the study area. Validation of the RM was performed through direct comparison with the xy and yx components as well as the determinant.

2.6. AMT Inversion Model and Upscaling

AMT inversion data was carried out using the Occam 1D smoothness-constrained inversion MTpy v2.0.12 and SimPEG v0.24.0 [86,93,94] algorithms. Inversion models were computed with discretization ranging from 5 to 30 layers, down to a maximum depth of 500 m. The initial model consisted of a homogeneous medium with a resistivity of 40 Ω·m for all layers, applying a geometric growth factor of 1.08 for layer thickness.
In evaluating the AMT inversions, the final layered model named AMT Layer Inversion Model (LIM) was selected based on two main criteria: (1) it exhibited a smooth and geologically realistic variation in resistivity, avoiding drastic oscillations, and (2) it achieved a good fit to the observed data without requiring an excessive number of layers.
The RM and LIM were compared in two stages: (i) by calculating static shift in the logarithmic domain, and (ii) by using the RMSE associated with the shape of the curves.
The static shift was calculated as an optimal multiplicative factor k, which vertically aligns the layered models of the AMT XY component with the borehole log profile without altering their shape. This factor was determined in the logarithmic domain as: bopt = mean(log10well) − log10AMT_XY)) and k = 10 bopt,, where ρwell and ρAMT_XY are the resistivity values from the borehole log and the AMT xy-mode model, respectively. The factor k represents the multiplicative static-shift correction for the xy mode.
The discrepancy in their shape was quantified using the Root Mean Square Error (RMSE). This metric was calculated as RMSE = (mean (log10AMT_XY*k) − log10well))2)1/2 [95,96,97].
Hydrogeological interpretation was performed based on the correlation between lithology and resistivity, considering that the electrical resistivity of rocks spans a very broad range. In general, ρ can vary from approximately 10−2 to 1015 Ω·m; however, sedimentary rocks typically fall within a narrower interval (10−2 to 105 Ω·m) because their resistivity is strongly controlled by fluid saturation, pore-water salinity, and the presence of metallic minerals [26,27,28].
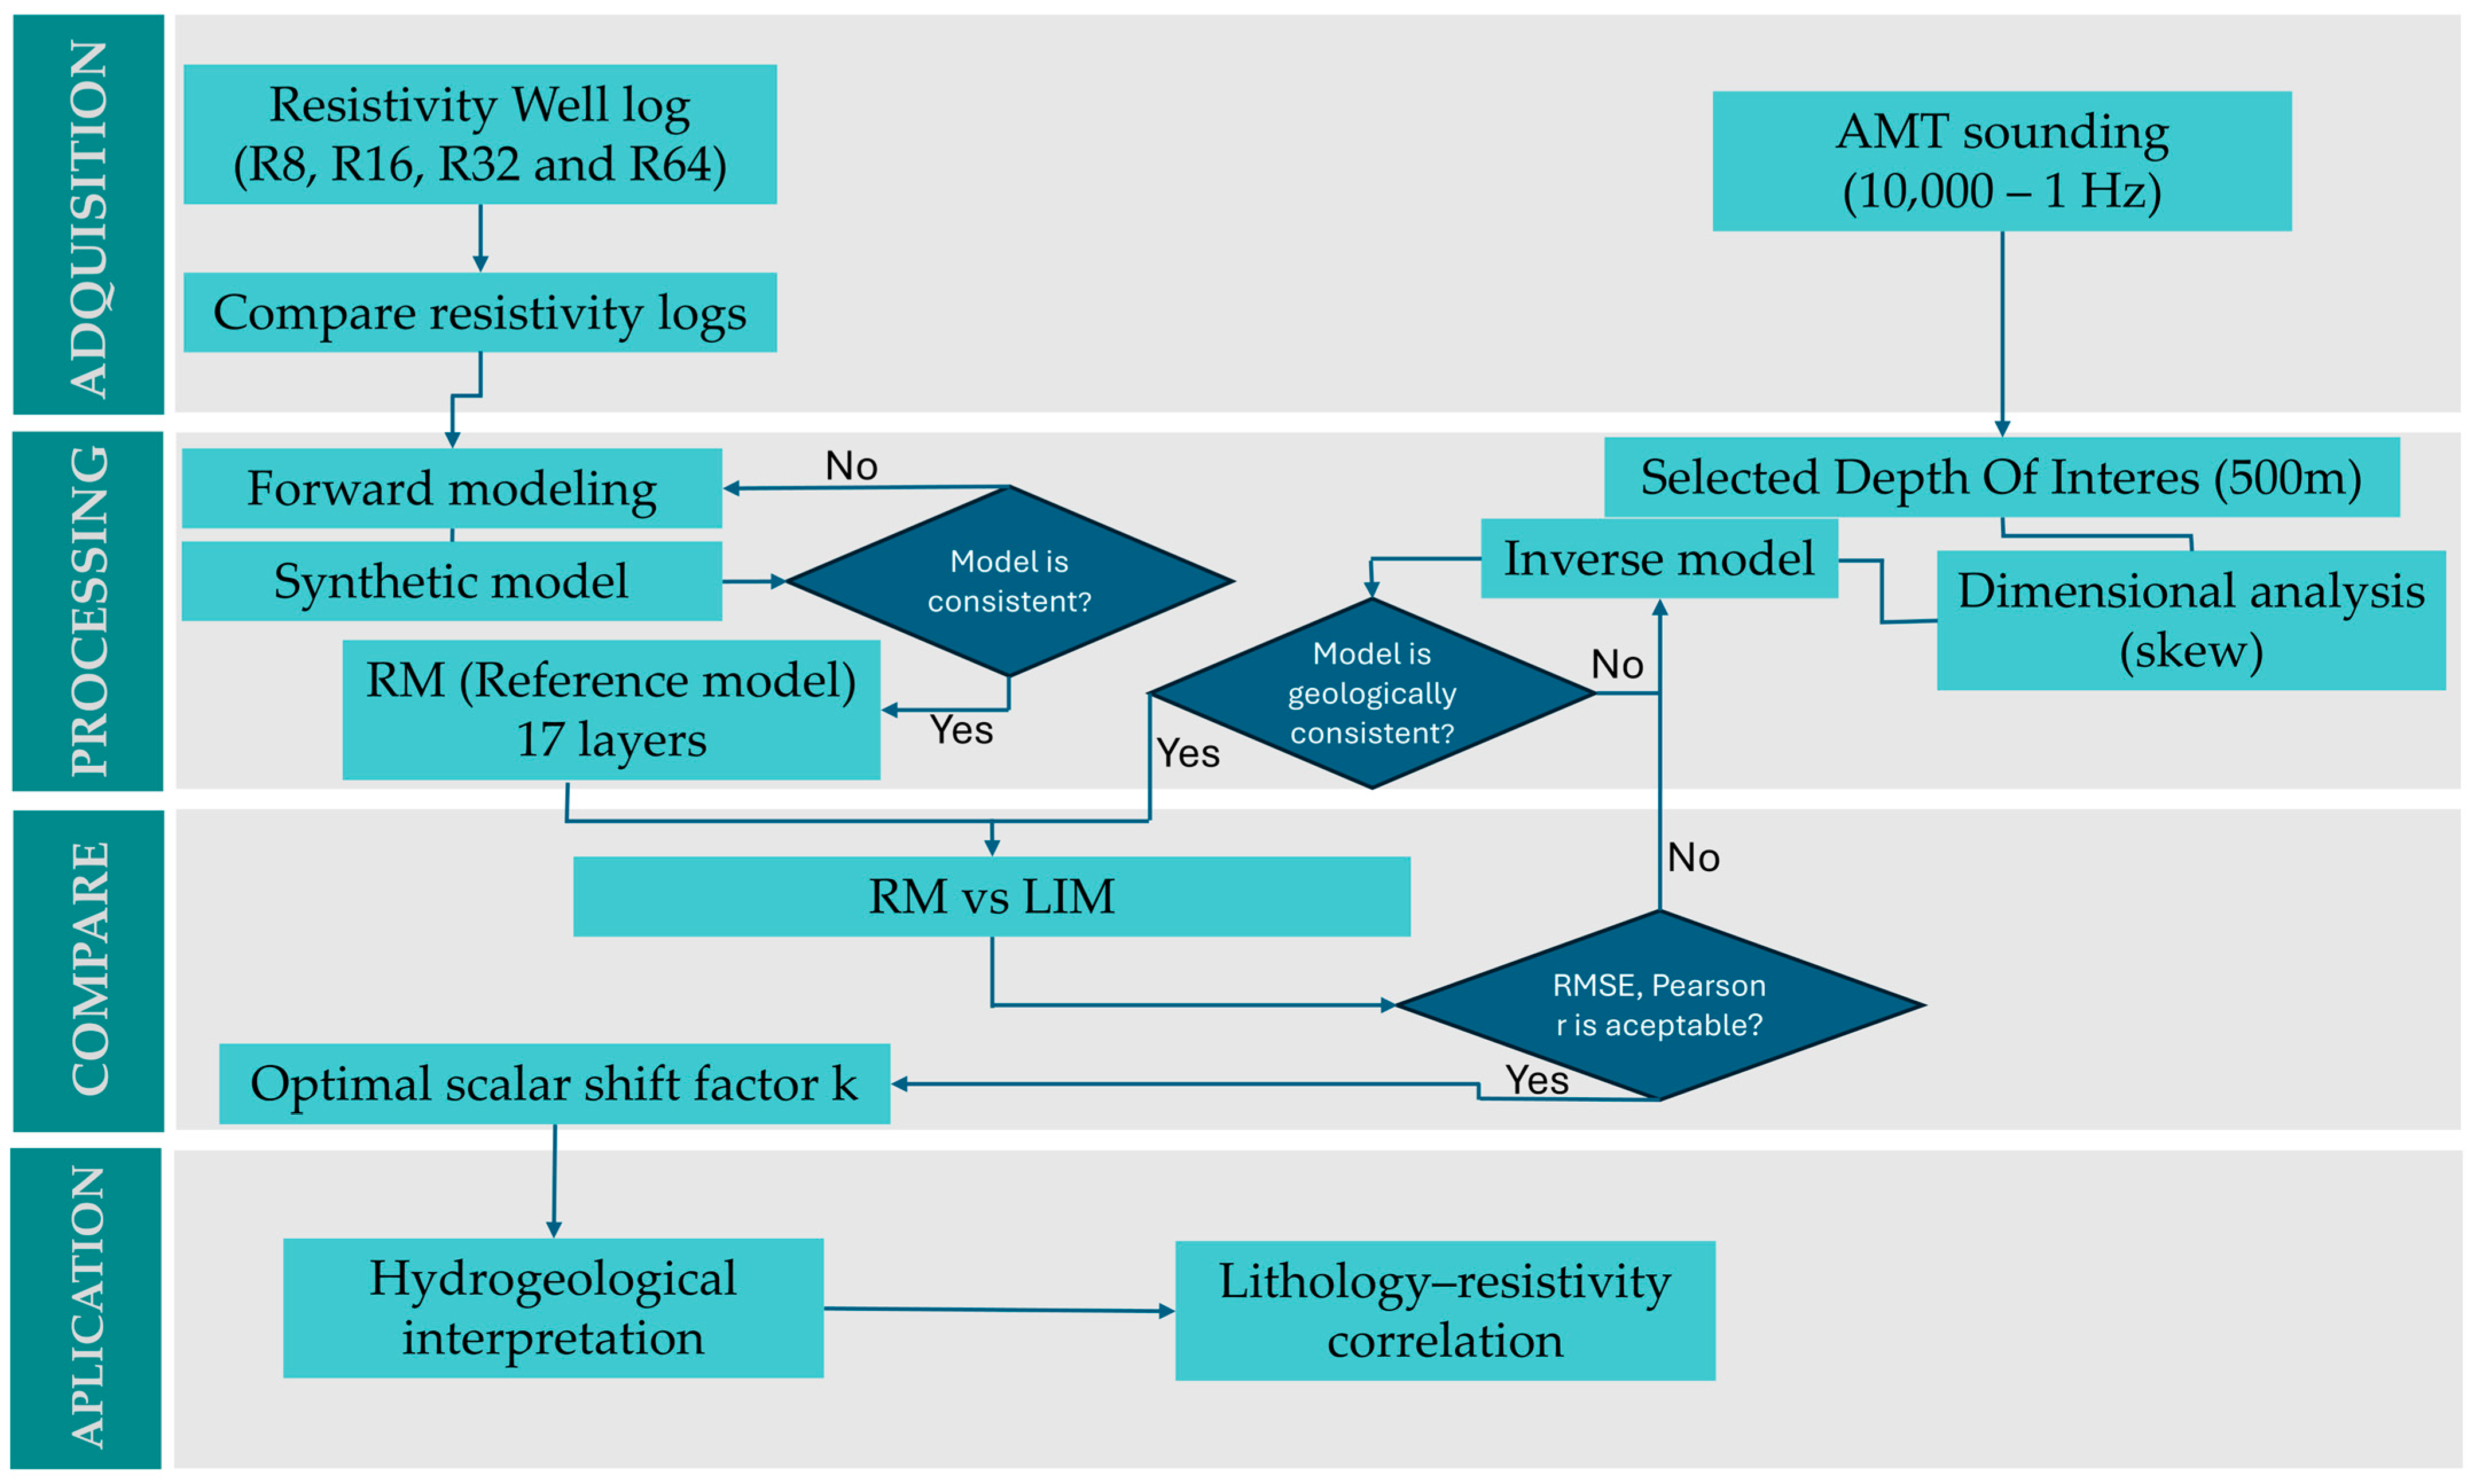
Finally methodology workflow summarizing (Figure 5) involved four main stages: (i) data acquisition, combining borehole resistivity logs (R8, R16, R32, and R64) with AMT soundings (10,000–1 Hz); (ii) data processing, including resistivity log comparison, forward modeling, RM construction (17 layers), dimensionality analysis (skew), and estimation of the frequency at the depth of investigation (500 m); (iii) analysis, through direct comparison of AMT components with the reference model; and (iv) analysis of results, encompassing the coherence evaluation of the AMT LIM and the subsequent upscaling procedure and (v) lithological correlation.

3. Results

3.1. Validation of the Synthetic 1D Model

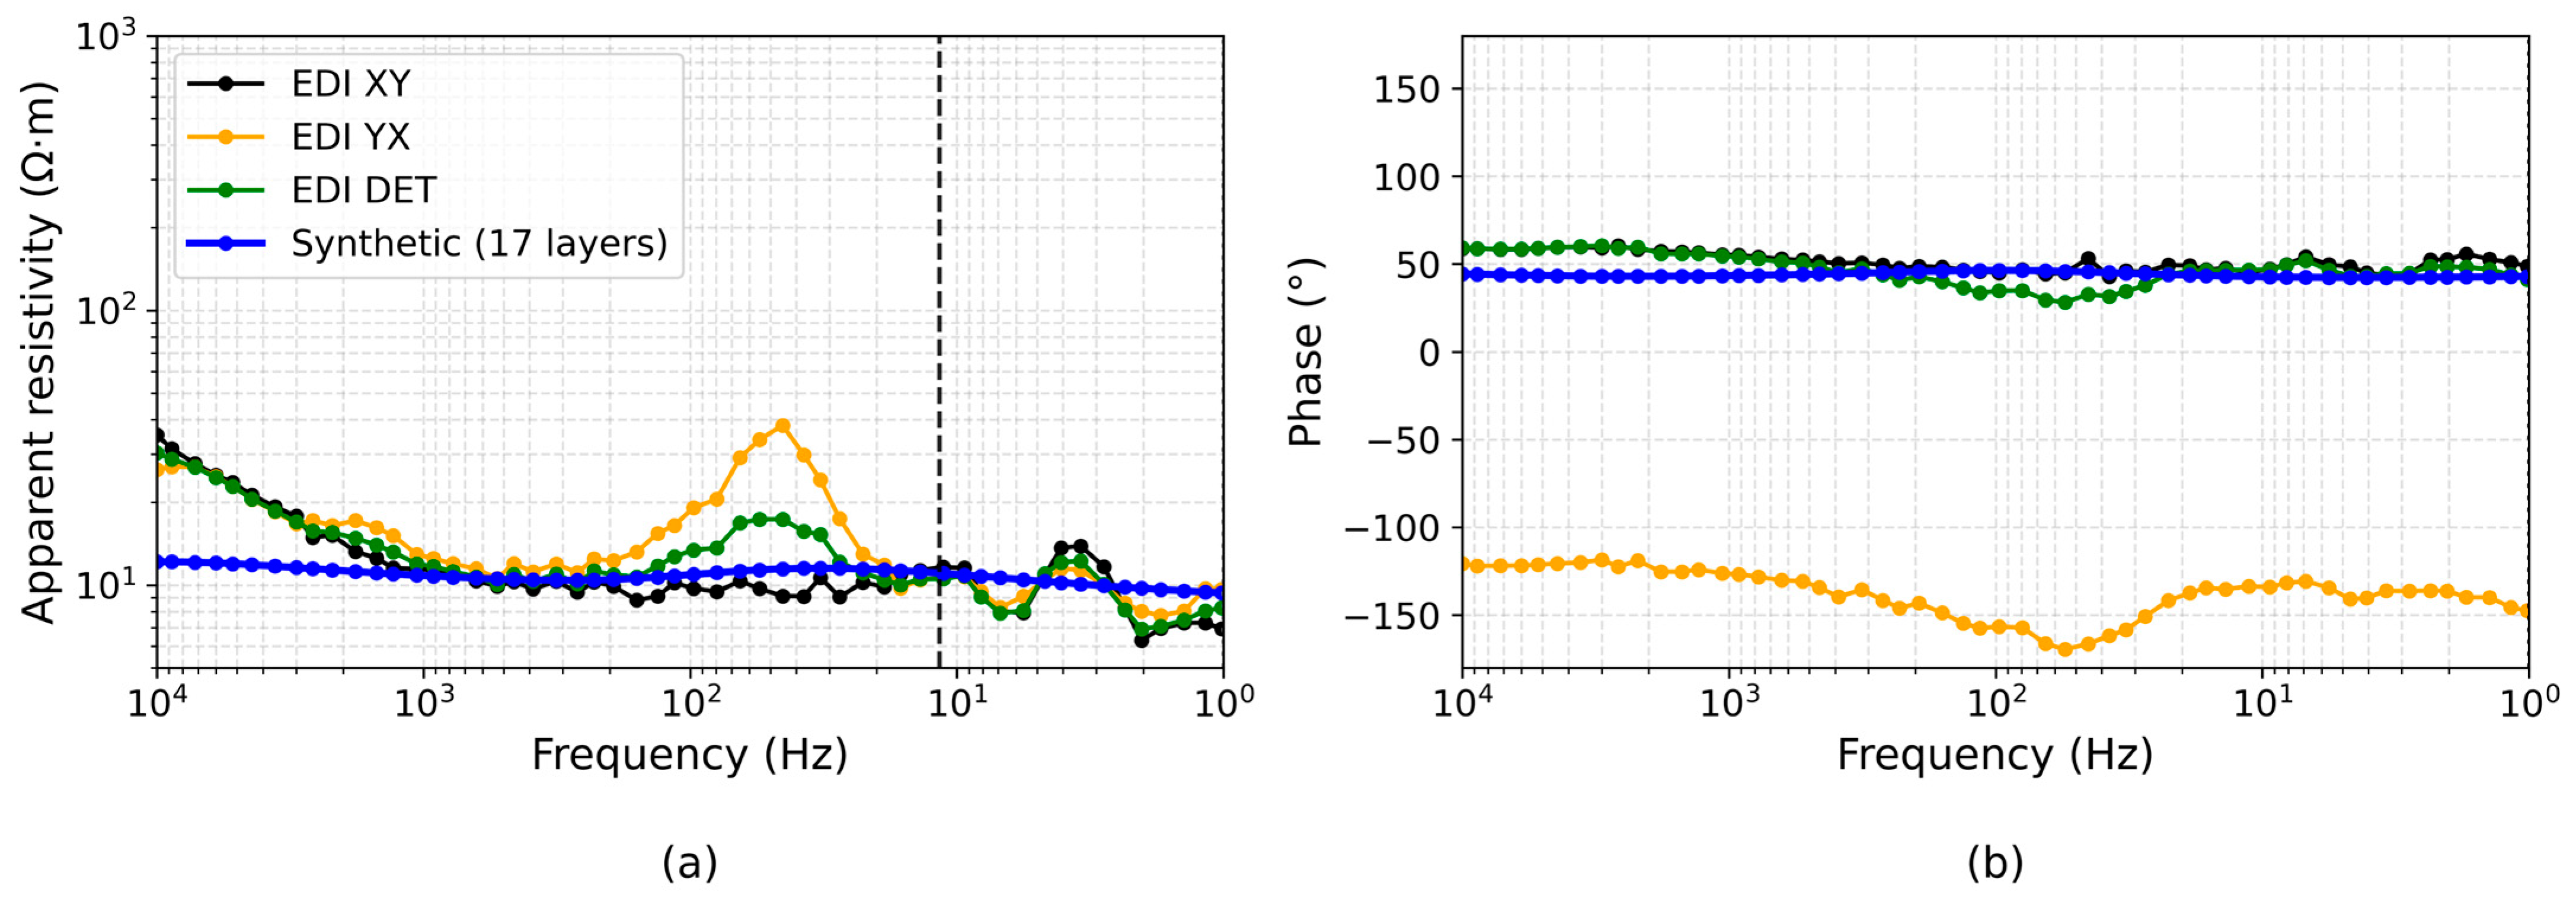
Comparison of the apparent resistivity and phase curves for the XY and YX components and the determinant component with RM is shown in Figure 6. Although the well log used to construct the synthetic model reached a depth of 337 m, the reference model depth of investigation (DOI) was extended to 500 m to ensure that the last layer acts as a half-space and that the response of the overlying layers is directly comparable to the depth investigated by the borehole.
The differences observed between the synthetic response derived from the well log and the AMT/MT field data arise primarily from the fundamental difference in the investigation scale of both methods. The resistivity log characterizes an extremely small volume (centimeters to decimeters) and therefore captures high-resolution local variations. In contrast, the MT method integrates the electromagnetic response over much larger volumes (tens to hundreds of meters), producing an inherent smoothing in the estimated apparent resistivity [51,52]. This difference in resolution explains why, although high-frequency oscillations may appear significant in Figure 6, the numerical discrepancy remains moderate: AMT values do not exceed ~35 Ω·m, whereas the synthetic model remains around 12 Ω·m.
The most notable discrepancies are concentrated in two specific frequency bands. At frequencies above ~2000 Hz, the XY component shows a visible departure from the synthetic model. This range samples the uppermost meters of the subsurface, a zone strongly influenced by near-surface heterogeneities, anthropogenic fill, variable moisture conditions, and cultural noise. Since the R64 log does not include this altered layer because the borehole measurements begin below it, the AMT response is expected to exhibit larger oscillations in this shallow interval while the synthetic model remains comparatively stable.
In the frequency range between ~20 and 200 Hz, the greatest mismatch is observed, particularly in the YX component (TM mode). This behavior is consistent with the well-established fact that the TM mode is more sensitive to lateral heterogeneities, variations in layer geometry, and mild two-dimensional effects, even when the subsurface exhibits a predominantly 1D character [52,89]. Additionally, the horizontal separation between the AMT site and the borehole (160 m) may introduce lateral lithological variations (such as paleochannels, sandy lenses, or granulometric changes) that influence the TM mode more strongly than the TE mode.
Despite these expected differences, the discrepancies do not exceed a meaningful scaling factor and remain within reasonable limits. This confirms that the AMT response adequately reproduces the general resistivity structure of the subsurface, and that the observed variations are primarily explained by the physical limitations of each method rather than methodological inconsistencies.
Comprehensively quantify the fit across the frequency spectrum of interest, the RMS was calculated for apparent resistivity at frequencies above 1 Hz, yielding a value of 0.145. Similarly, the RMS for the phase was 9.376°. These error values indicate good consistency between the synthetic model response and the field magnetotelluric data.

3.2. Data Inversion AMT

AMT inversions were carried out using a range of discretizations between 5 and 30 layers to evaluate the stability of the solution. Inversions with fewer than 10 layers showed limited ability to fit the data, with misfit errors exceeding 15%. In contrast, those with more than 16 layers produced models with abrupt and unrealistic resistivity variations. These models were rejected as they represented unstable or overparameterized solutions.
Models with a discretization between 10 and 16 layers produced the best results, characterized by low misfit and a smooth, geologically plausible variation in resistivity with depth. From this set, the 12-layer model (Figure 7) was selected as the optimal solution, as it represents the best balance between data fit and model simplicity, thereby avoiding overfitting.
The selected 12-LIM shows an excellent fit with the observed data, as confirmed by its statistics: for apparent resistivity (ρa), the RMSE (log10) was 0.05652, the relative RMSE was 12.10%, and the multiplicative scatter was approximately ±13.90% were obtained; while for phase, the RMSE was 2.35° with a normalized RMSE of ≈1.31%. These notably low values demonstrate the robustness and reliability of the proposed model.

3.3. Reference Model vs. AMT Layer-Inverted Model (LIM)

The comparison between the 12-layer LIM and the 17-layer RM (Figure 8) show a remarkable correlation in the overall shape of the geoelectric profile, demonstrating the representative capability of the inversion model to characterize the main subsurface structure. The upscaling analysis yielded a factor of k = 1.1854, with a 95% confidence interval of [1.1470, 1.2246].
ρopt = k·ρ
The direct comparison between both models showed a robust and statistically significant correlation (Pearson correlation coefficient r = 0.669, p-value = 0.0005) and an RMSE of 0.1911, validating the consistency between the two datasets and models results.
The specific discrepancies can be explained by three factors: (i) Investigation volume: the well log records the formation at high resolution, whereas the AMT method averages resistivity over a much larger rock volume (hundreds of cubic meters), smoothing heterogeneities; (ii) Vertical resolution: AMT integrates thin layers or abrupt features (e.g., fractures) producing a homogenized version of the subsurface otherwise that the borehole log resolves in detail; and (iii) Spatial separation: Distance between the AMT sounding and the borehole introduces uncertainty due to potential lateral lithological variations; however, the strong overall correlation indicates that, despite this, the AMT captured the resistive signature.

4. Discussion

The scaling factor k enabled a direct comparison between the resistivities obtained from the borehole and those derived from the MT models. The residual differences observed between the MT inversion model and the borehole resistivity log (RMS of 0.145 for ρa) are attributed to the inherent physical limitations in the resolution of each method, showing a similar behavior to previous studies [29,30]. Furthermore, the shift factor k = 1.1854, being close to unity, confirms that static distortions in the area are minimal. This demonstrates that AMT results can be directly correlated with borehole resistivity logs once simplified, requiring only a single multiplicative correction factor (k), suggesting the feasibility of applying this scaling to other soundings acquired under comparable lithological and geological environmental conditions.
The MT inversion model showed a high degree of representativeness (log10 RMSE of 0.056 for ρa), both in the configuration of the resistive layers (overall structure) and in the range of absolute resistivity values. A similar comparison process between MT and borehole data was reported in [98]. However, the acquired MT sounding omitted the AMT frequency range (>300 Hz). In this sense, we consider our approach to be innovative, as it integrates different scales of investigation and explicitly incorporates AMT frequencies into the analysis, thereby enhancing the hydrogeological interpretation of shallow aquifer systems.
In the case study, AMT allowed the quantitative identification and delineation of geological units, establishing a correlation between lithologies and resistivity values (Table 2). The upper sequence, characterized by low and relatively homogeneous resistivities (<20 Ω·m), is interpreted as Quaternary floodplain deposits. In contrast, the transition to resistivities > 30 Ω·m marks the contact with the Real Group [72,78,82]. In the MT sounding, this contact was identified at approximately 392 m depth, evidencing a lithological change toward more competent and consolidated units.
In the study area, the thickness of Quaternary deposits values has been reported with no definitive consensus estimated a thickness of 130.62 m based on seismic data [78] while Geological chart number 85 of the Colombian Geological Survey [76] does not provide an explicit value, though the profile suggests thicknesses of less than 100 m. The Aguachica Land Use Plan (2001–2010) [99] documents thicknesses of ~200 m for alluvial fan cones and terraces, and ~150 m for floodplains and terraces, reaching up to 350 m in some sectors [100]. Our results, based on resistivity interpretation, indicate even greater thickness, up to 392 m, supporting the idea of a significant accumulation of sediments in the region.
Thickness Quaternary sequences that exceed 390 m correlate with the high sedimentation rates reported for the area. An average rate of ~0.934 cm/year [66], reflecting a significant sedimentary input. This high-sedimentation regime is associated with the development and evolution of large-scale alluvial fan systems, whose apex reach thicknesses of 250 to 300 m.
The lithological interpretation suggests the presence of a multilayer aquifer system. These sandy layers are represented in sectors with resistive characteristics between 14–20 Ω·m, at depth intervals of 102.5–137.5 m and 181.4–236.4 m, despite subtle lithological variations. This interpretation is consistent with the drill cuttings record and refines the local hydrogeological framework.
Thus, the methodology presented here for integrating direct and indirect records confirms that AMT is a reliable tool for reducing uncertainty in the exploration of shallow aquifers and in well drilling and design while also offering a significant economic advantage over exploratory drilling costs. Moreover, the high degree of lithological homogeneity in the study area, with only minor variations, enables the application of this scaling approach to other AMT soundings in the region.
This study presents several limitations that must be taken into account. (i) It relies on a 1D model, whose main restriction lies in the potential presence of lateral heterogeneities (such as facies changes, paleochannels, or lithological variations) that may not be reflected in a skew value below 10%. Although the dimensionality analysis suggests a predominantly 1D behavior, subtle 2D variations may still occur and remain uncaptured by the model; this represents an aspect to be explored in future research.
(ii) The smooth regularization used in the Occam-type inversion produces models with gradual resistivity transitions, which are consistent with the general geology of the area but tend to smooth thin interfaces and do not guarantee their accurate resolution. Likewise, the fundamental difference between the investigation volumes of the borehole log (centimeter scale) and the AMT sounding (tens to hundreds of meters) inherently leads to discrepancies since the magnetotelluric method cannot reproduce the fine-scale variability captured by the borehole measurements. Nevertheless, the good correlation obtained despite the 160 m separation between the borehole and the AMT station suggests an absence of abrupt lateral changes in the study area.
(iii) Furthermore, applying a single scaling factor to correct static shift assumes that this effect is uniform with depth, a condition that may not hold in environments with strong electrical heterogeneity, although it is adequate for the geological context analyzed here. Finally, the hydrogeological interpretation remains semiquantitative, as it is based exclusively on a single physical property (resistivity) and does not include a direct translation into hydrogeological parameters such as transmissivity, hydraulic connectivity, or storage properties.
We consider that future academic research should incorporate two- or three-dimensional models to better represent lateral heterogeneities and validate this comparative strategy. Moreover, calculating scaling factors in different zones would enable the identification of similarities and differences according to the geological context, thereby establishing generalized reliability thresholds for the application of AMT in hydrogeological and environmental studies. As a next step, we propose applying the methodology of MT inversion constrained by borehole logs [29,50] to 2D modeling and extending the scaling strategy to the 20 boreholes available in the area, with the ultimate goal of developing an integrated 3D geophysics model that can be integrated with hydrogeological numerical modelling.

Supplementary Materials

The following supporting information can be downloaded at: https://www.mdpi.com/article/10.3390/w17233389/s1, Well log file: Barranca de Lebrija-1.LAS; AMT sounding file: BL01.edi.

Author Contributions

Conceptualization, H.A., J.P., J.L., A.P. and L.D.D.; data collection, H.A. and J.L.; methodology, H.A. and J.P.; numerical modeling, H.A.; validation, A.P. and L.D.D.; formal analysis, H.A., J.P., L.D.D. and A.P.; writing—original draft preparation, H.A. and J.P.; writing—review and editing, H.A., J.P., A.P. and L.D.D.; visualization, H.A., J.P. and J.L.; supervision, A.P. and L.D.D. All authors have read and agreed to the published version of the manuscript.

Funding

This study was funded by the MEGIA Research Project Contingent Recovery Contract FP44842-157-2018, which was funded by Minciencias and the Agencia Nacional de Hidrocarburos (ANH).

Data Availability Statement

The original contributions presented in this study are included in the article/Supplementary Material. Further inquiries can be directed to the corresponding author.

Acknowledgments

The researchers thank the residents of Barranca-Lebrija for consistently supporting the monitoring network’s construction.

Conflicts of Interest

The authors declare no conflicts of interest.

Abbreviations

The following abbreviations are used in this manuscript:
AMTAudio-magnetotelluric
MTMagnetotelluric
RMTRadio Magnetotelluric
MEGIAMultiscale Integrated Water Management Model Project (from its Spanish acronym Modelo Multiescala de Gestión Integral del Agua)
MMVMiddle Magdalena Valley
RMSRoot Mean Square
RMSERoot Mean Square Error
RMReference model
LIMLayer inversion model
MMBMiddle Magdalena Basin
QfalFloodplain deposits
QflFluviolacustrine deposits
N1rReal Group
DOIDepth of investigation

References

  1. Ren, Z.; Kalscheuer, T. Uncertainty and Resolution Analysis of 2D and 3D Inversion Models Computed from Geophysical Electromagnetic Data. Surv. Geophys. 2020, 41, 47–112. [Google Scholar] [CrossRef]
  2. Sonkamble, S.; Sahya, A.; Mondal, N.C.; Harinarayana, T. Electrical Resistivity and Hydrochemical Indicators Distinguishing Chemical Characteristics of Subsurface Pollution at Cuddalore Coast, Tamil Nadu. J. Geol. Soc. India 2014, 83, 535–548. [Google Scholar] [CrossRef]
  3. Goebel, M.; Pidlisecky, A.; Knight, R. Resistivity imaging reveals complex pattern of saltwater intrusion along Monterey coast. J. Hydrol. 2017, 551, 746–755. [Google Scholar] [CrossRef]
  4. Gottschalk, I.; Knight, R.; Asch, T.; Abraham, J.; Cannia, J. Using anAirborne Electromagnetic Method to Map Saltwater Intrusion in the Northern Salinas Valley, California. Geophysics 2020, 85, B119–B1131. [Google Scholar] [CrossRef]
  5. Golshan, A.; Sadeghi, M.; Sadeghi, M. Assessing Aquifer Salinization with Multiple Techniques along the Southern Caspian Sea Shore (Iran). Water 2018, 10, 348. [Google Scholar] [CrossRef]
  6. McLachlan, P.J.; Chambers, J.E.; Uhlemann, S.S.; Binley, A. Geophysical Characteriation of the Groundwater–Surface Water Interface. Adv. Water Resour. 2017, 109, 302–319. [Google Scholar] [CrossRef]
  7. Ali, N.; Chappuies, J.; Sloan, G.; Rouland, G.; Rai, A.; Dong, Y. A Global Perspective on Electrical Resistivity Tomography, Electromagnetic and Ground Penetration Radar Methods for Estimating Groundwater Recharge Zones. Front. Water 2025, 7, 1636613. [Google Scholar] [CrossRef]
  8. Baloyi, L.; Kanyerere, T.; Muchingami, I.; Pienaar, H. Application of Hydrogeophysical Techniques in Delineating Aquifers to Enhancing Recharge Potential Areas in Groundwater-Dependent Systems, Northern Cape, South Africa. Water 2024, 16, 2652. [Google Scholar] [CrossRef]
  9. de Oliveira, R.A.; Santos, E.; Medeiros, W.E.; Dourado, J.C. Hydrogeophysical Characterization of Groundwater Conductors Using Integrated Audio-Magnetotelluric and Electrical Resistivity Data in the Sienito Coreaçu Region, Brazil. In Proceedings of the 16th International Congress of the Brazilian Geophysical Society and Expogef, Rio de Janeiro, Brazil, 19–22 August 2019; pp. 1–6. [Google Scholar]
  10. Krivochieva, S.; Chouteau, M. Integrating TDEM and Magnetotelluric Methods for Characterization and Delineation of the Santa Catarina Aquifer (Chalco Sub-Basin, Mexico). J. Appl. Geophy. 2003, 52, 23–43. [Google Scholar] [CrossRef]
  11. Ritz, M.; Descloitres, M.; Robineau, B.; Courteaud, M. Audiomagnetotelluric Prospecting for Groundwater in the Baril Coastal Area, Piton de La Fournaise Volcano, Réunion Island. Geophysics 1997, 62, 758–762. [Google Scholar] [CrossRef]
  12. Falgàs, E.; Ledo, J.; Marcuello, A.; Queralt, P. Monitoring Freshwater–Seawater Interface Dynamics with Audiomagnetotelluric Data. Near Surf. Geophys. 2009, 7, 391–400. [Google Scholar] [CrossRef]
  13. Ullah, S.; Saibi, H.; Akhtar, M.; Abueladas, A.; Al-Ruwaili, K. Audio-Magnetotelluric Survey for Groundwater Investigation in the Al-Jaww Plain, in Eastern Abu Dhabi, Al-Ain, United Arab Emirates. Earth Space Sci. 2023, 10, e2023EA003181. [Google Scholar] [CrossRef]
  14. Saibi, H.; Cherkose, B.A.; Ismail, F.; Alhashmi, K.; Safiuddin, R.; Alzeyoudi, A.; Almaramah, L.; Al Senani, S.; Alkaabi, M.; Shion, N.; et al. Groundwater study using Audio-Magnetotelluric Data at Falaj Mazyad in the eastern Abu Dhabi Emirate, Al-Ain region, UAE. In Proceedings of the International Conference on Engineering Geophysics (ICEG), Al Ain, United Arab Emirates, 16–19 October 2023. [Google Scholar]
  15. Falade, A.O.; Bewaji, S.; Olagunju, B.D. Electrical Resistivity and Magnetotelluric Integration for Groundwater Exploration at the Proposed Central Library in Achievers University Owo, Nigeria. Appl. Geophys. 2025, 3, 99. [Google Scholar] [CrossRef]
  16. Gomo, M. Use of Electric Potential Difference in Audio Magnetotelluric (AMT) Geophysics for Groundwater Exploration. Groundw. Sustain. Dev. 2023, 20, 100864. [Google Scholar] [CrossRef]
  17. Hoversten, G.M.; Morrison, H.F.; Constable, S.C. Marine Magnetotellurics for Petroleum Exploration, Part II: Numerical Analysis of Subsalt Resolution. Geophysics 1998, 63, 826–840. [Google Scholar] [CrossRef]
  18. Tang, J.-T.; Liu, Z.-J.; Liu, F.-Y.; Xie, Y. The Denoising of the Audio Magnetotelluric Data Set with Strong Interferences. Chin. J. Geophys. 2015, 58, 4636–4647. [Google Scholar] [CrossRef]
  19. Hossain, A.M. Development of a Model to Estimate Groundwater Recharge. J. Groundw. Sci. Eng. 2025, 13, 406–422. [Google Scholar] [CrossRef]
  20. Goebel, M.; Knight, R.; Halkjær, M. Mapping Saltwater Intrusion with an Airborne Electromagnetic Method in the Offshore Coastal Environment, Monterey Bay, California. J. Hydrol. Reg. Stud. 2019, 23, 100602. [Google Scholar] [CrossRef]
  21. Sonkamble, S.; Sahya, A.; Jampani, M.; Ahmed, S.; Amerasinghe, P. Hydro-Geophysical Characterization and Performance Evaluation of Natural Wetlands in a Semi-Arid Wastewater Irrigated Landscape. Water Res. 2019, 148, 176–187. [Google Scholar] [CrossRef] [PubMed]
  22. Vouillamoz, J.-M.; Descloitres, M.; Bernard, J.; Fourcassier, P.; Romagny, L. Application of Integrated Magnetic Resonance Sounding and Resistivity Methods for Borehole Implementation: A Case Study in Cambodia. J. Appl. Geophy. 2002, 50, 67–81. [Google Scholar] [CrossRef]
  23. Ismail, N.; Schwarz, G.; Pedersen, L.B. Investigation of Groundwater Resources Using Controlled-Source Radio Magnetotellurics (CSRMT) in Glacial Deposits in Heby, Sweden. J. Appl. Geophy. 2011, 73, 74–83. [Google Scholar] [CrossRef]
  24. de Oliveira, T.P.; La Terra, E.F.; Panetto, L.P.; Fontes, S.L.; Maurya, V.P.; Nacional, O. Hydrogeophysical Characterization of Groundwater Conductors and Storage Geological Structures Through Audiomagnetotelluric and Electrical Resistivity Tomography Methods; SBGf: Rio de Janeiro, Brazil, 2019. [Google Scholar]
  25. Jiang, W.; Roach, I.C.; Doublier, M.P.; Duan, J.; Schofield, A.; Clark, A.; Brodie, R.C. Application of Audio-Frequency Magnetotelluric Data to Cover Characterisation—Validation against Borehole Petrophysics in the East Tennant Region, Northern Australia. Explor. Geophys. 2023, 55, 466–485. [Google Scholar] [CrossRef]
  26. Best, M.E. Electromagnetic (EM) Methods. In Shear Wave Velocity Measurement Guidelines for Canadian Seismic Site Characterization in Soil and Rock; Hunter, J.A., Crow, H.L., Eds.; General Information Product 110e; Geological Survey of Canada, Earth Science Sector: Ottawa, ON, Canada, 2015; pp. 170–180. [Google Scholar]
  27. Carmichael, R.S. Practical Handbook of Physical Properties of Rocks and Minerals, 1st ed.; CRC Press: Boca Raton, FL, USA, 1989. [Google Scholar]
  28. Telford, W.M.; Geldart, L.P.; Sheriff, R.E. Applied Geophysics, 2nd ed.; Cambridge University Press: Cambridge, UK, 1990. [Google Scholar]
  29. Yan, P. Inversion of Magnetotelluric Data Constrained by Borehole Logs and Reflection Seismic Sections. Ph.D. Thesis, Uppsala University, Uppsala, Sweden, 2016. [Google Scholar]
  30. Simpson, J.M.; Heinson, G. Synthetic Modelling of Downhole Resistivity Data to Improve Interpretation of Basin Morphology from Magnetotelluric Inversion. Earth Planets Space 2020, 72, 69. [Google Scholar] [CrossRef]
  31. He, Z.; Hu, Z.; Luo, W.; Wang, C. Mapping Reservoirs Based on Resistivity and Induced Polarization Derived from Continuous 3D Magnetotelluric Profiling: Case Study from Qaidam Basin, China. Geophysics 2010, 75, B25–B36. [Google Scholar] [CrossRef]
  32. Xiao, W.; Unsworth, M. Structural Imaging in the Rocky Mountain Foothills (Alberta) Using Magnetotelluric Exploration. Am. Assoc. Pet. Geol. Bull. 2006, 90, 321–333. [Google Scholar] [CrossRef]
  33. Rasmussen, T.M. Magnetotelluric Investigation of the Tønder Area, Denmark ALTKUL Project Report Part 2; GEUS Geological Survey Denmark and Greenland Danish Ministry of Climate, Energy and Building: Copenhagen, Denmark, 2012. [Google Scholar] [CrossRef]
  34. Beamish, D.; Travassos, J.M. Magnetotelluric Imaging of Basalt-Covered Sediments. First Break 1992, 10, 345–357. [Google Scholar] [CrossRef]
  35. Ogaya, X.; Alcalde, J.; Marzán, I.; Ledo, J.; Queralt, P.; Marcuello, A.; Martí, D.; Saura, E.; Carbonell, R.; Benjumea, B. Joint Interpretation of Magnetotelluric, Seismic, and Well-Log Data in Hontomín (Spain). Solid Earth 2016, 7, 943–958. [Google Scholar] [CrossRef]
  36. Harinarayana, T.; Patro, B.P.K.; Veeraswamy, K.; Manoj, C.; Naganjaneyulu, K.; Murthy, D.N.; Virupakshi, G. Regional Geoelectric Structure Beneath Deccan Volcanic Province of the Indian Subcontinent using Magnetotellurics. Tectonophysics 2007, 445, 66–80. [Google Scholar] [CrossRef]
  37. Jones, A.G. Static Shift of Magnetotelluric Data and Its Removal in a Sedimentary Basin Environment. Geophysics 1988, 53, 967–978. [Google Scholar] [CrossRef]
  38. Santos, H.S.; Flexor, J.M. Geoelectric Directionality of a Magnetotelluric (MT) Survey in the Parecis Basin, Brazil. Rev. Bras. Geofísica 2012, 30, 81–92. [Google Scholar] [CrossRef]
  39. Fontes, S.L.; Pinto, V.R.; Ulugergerli, E.U. Electromagnetic Imaging of the Santos Basin Constrained by Well Log Induction Data. In Proceedings of the SEG Technical Program Expanded Abstracts, Houston, TX, USA, 25 October 2009; pp. 785–789. [Google Scholar]
  40. Pinto, V.R.; Fontes, S.L.; Ulugergerli, E.U. Magnetotelluric Signature and Well Log Data Interpretation of the Santos Basin, Brazil. In Proceedings of the 11th International Congress of the Brazilian Geophysical Society, Salvador, Brazil, 24–28 August 2009. [Google Scholar]
  41. Beamish, D.; Travassos, J.M. Magnetotelluric Studies from Two Contrasting Brazilian Basins. Phys. Earth Planet. Inter. 1993, 81, 261–276. [Google Scholar] [CrossRef]
  42. Muñoz, G.; Ritter, O.; Moeck, I. A Target-Oriented Magnetotelluric Inversion Approach for Characterizing the Low Enthalpy Groß Schönebeck Geothermal Reservoir. Geophys. J. Int. 2010, 183, 1199–1215. [Google Scholar] [CrossRef]
  43. Raguenel, M.; Driesner, T.; Bonneau, F. Numerical Modeling of the Geothermal Hydrology of the Volcanic Island of Basse-Terre, Guadeloupe. Geotherm. Energy 2019, 7, 28. [Google Scholar] [CrossRef]
  44. Di Paolo, F.; Ledo, J.; Ślęzak, K.; Martínez van Dorth, D.; Cabrera-Pérez, I.; Pérez, N.M. La Palma Island (Spain) Geothermal System Revealed by 3D Magnetotelluric Data Inversion. Sci. Rep. 2020, 10, 18181. [Google Scholar] [CrossRef]
  45. Di Giuseppe, M.; Isaia, R.; Troiano, A. Three-dimensional Magnetotelluric modelingof Vulcano Island (Eolie, Italy) and its implications for understanding recent volcanic unrest. Sci. Rep. 2023, 13, 16458. [Google Scholar] [CrossRef]
  46. Lee, T.J.; Kim, H.; Song, J.S. Magnetotelluric Survey Applied to Geothermal Exploration: An Example at Seokmo Island, Korea. Explor. Geophys. 2010, 41, 61–68. [Google Scholar] [CrossRef]
  47. Dawes, G.J.K.; Lagios, E. A Magnetotelluric Survey of the Nisyros Geothermal Field, Greece. J. Volcanol. Geotherm. Res. 1991, 20, 225–235. [Google Scholar] [CrossRef]
  48. Unsworth, M.; Soyer, W.; Tuncer, V. Magnetotelluric Measurements for Determining the Subsurface Salinity and Porosity Structure of Amchitka Island, Alaska; Amchitka Island MT Study—Draft Report, June 28 2005; Consortium for Risk Evaluation with Stakeholder Participation (CRESP): Alberta, Canada, 2005; Available online: https://www.cresp.org/Amchitka/HASP_docs/Unsworth_April_28_2005.pdf (accessed on 25 October 2025).
  49. Unsworth, M.; Soyer, W.; Tuncer, V.; Wagner, A.; Barnes, D. Hydrogeologic Assessment of the Amchitka Island nuclear test site (Alaska) withMagnetotellurics. Geophysics 2007, 72, B47–B57. [Google Scholar] [CrossRef]
  50. Yan, P.; Garcia Juanatey, M.A.; Kalscheuer, T.; Juhlin, C.; Hedin, P.; Savvaidis, A.; Lorenz, H.; Kück, J. A Magnetotelluric Investigation of the Scandinavian Caledonides in Western Jämtland, Sweden, Using the COSC Borehole Logs as Prior Information. Geophys. J. Int. 2017, 208, 1465–1489. [Google Scholar] [CrossRef]
  51. Berdichevsky, M.N. Marginal Notes on Magnetotellurics. Surv. Geophys. 1999, 20, 341–375. [Google Scholar] [CrossRef]
  52. Chave, A.D.; Jones, A.G. The Magnetotelluric Method: Theory and Practice; Cambridge University Press: Cambridge, UK, 2012; ISBN 9780521819275. [Google Scholar]
  53. Spies, B.R. Depth of Investigation in Electromagnetic Sounding Methods. Geophysics 1989, 54, 872–888. [Google Scholar] [CrossRef]
  54. Berdichevsky, M.N.; Dmitriev, V.I. Models and Methods of Magnetotellurics; Springer: Berlin/Heidelberg, Germany, 2008. [Google Scholar] [CrossRef]
  55. Hoversten, G.M.; Cassassuce, F.; Gasperikova, E.; Newman, G.A.; Chen, J.; Rubin, Y.; Hou, Z.; Vasco, D. Direct Reservoir Parameter Estimation Using Joint Inversion of marine seismic AVA and CSEM data. Geophysics 2006, 71, O53–O62. [Google Scholar] [CrossRef]
  56. Linde, N.; Chen, J.; Kowalsky, M.B.; Hubbard, S. Hydrogeophysical Parameter Estimation Approaches for Field Scale Characterization. Appl. Hydrogeophysics 2006, 71, 9–44. [Google Scholar] [CrossRef]
  57. Cooper, M.A.; Addison, F.T.; Alvarez, R.; Coral, M.; Graham, R.H.; Hayward, A.B.; Howe, S.; Martinez, J.; Naar, J.; Peñas, R.; et al. Basin Development and Tectonic History of the Eastern Cordillera, Llanos Basin and Middle Magdalena Valley, Colombia. Am. Assoc. Pet. Geol. Bull. 1995, 79, 1421–1443. [Google Scholar]
  58. Franco, R.; Mojica, J. Estructura y Evolución Tectónica Del Valle Medio y Superior Del Magdalena, Colombia. Rev. Geol. 1990, 17, 41–64. [Google Scholar]
  59. Sánchez, J.; Horton, B.K.; Tesón, E.; Mora, A.; Ketcham, R.A.; Stockli, D.F. Kinematic Evolution of Andean Fold-Thrust Structures along the Boundary between the Eastern Cordillera and Middle Magdalena Valley Basin, Colombia. Tectonics 2012, 31, TC3008. [Google Scholar] [CrossRef]
  60. Sarmiento-Rojas, L.F.; Van Wess, J.D.; Cloetingh, S. Mesozoic Transtensional Basin History of the Eastern Cordillera, Colombian Andes: Inferences from Tectonic Models. J. S. Am. Earth Sci. 2006, 21, 383–411. [Google Scholar] [CrossRef]
  61. Sarmiento-Rojas, L.F. Middle Magdanela Basin-Vol. 11 Petroleum Geology of Colombia. Agencia Nac. Hidrocarb. ANH 2011, 11, 193. [Google Scholar]
  62. CDMB. Plan de Ordenamiento y Manejo de Cuencas Hidrográficas (POMCA) Rio Lebrija Medio; Corporación Autónoma Regional para la Defensa de la Meseta de Bucaramanga (CDMB): Bucaramanga, Colombia, 2019.
  63. Restrepo, J.D.; Kjerfve, B. Magdalena River: Interannual Variability (1975–1995) and Revised Water Discharge and Sediment Load Estimates. J. Hydrol. 2000, 235, 137–149. [Google Scholar] [CrossRef]
  64. Moreno, C. Análisis de Los Sedimentos de La Ciénaga de Zapatosa, Cesar. In Diversidad Biótica XIII: Complejo Cenagoso Zapatosa y Ciénagas del Sur del Cesar. Biodiversidad, Conservación y Manejo; Rangel-Churio, J.O., Ed.; Instituto de Ciencias Naturales, Universidad Nacional de Colombia: Bogotá, Colombia, 2013; pp. 1–17. [Google Scholar]
  65. Restrepo, J.D.; Kjerfve, B.; Hermelin, M.; Restrepo, J.C. Factors Controlling Sediment Yield in a Major South American Drainage Basin: The Magdalena River, Colombia. J. Hydrol. 2006, 316, 213–232. [Google Scholar] [CrossRef]
  66. Jaramillo, A.; Villamizar-M, V.; Calvo, J.; Rangel-Ch, J.O.; Parra, L.N. Los Sedimentos de Las Ciénagas El Congo, Musanda, Doña María, El Sordo, Juncal, Baquero, Morales y Costilla. In Diversidad Biótica XIII: Complejo Cenagoso Zapatosa y Ciénagas del sur del Cesar. Biodiversidad, Conservación y Manejo; Rangel-Ch, J.O., Ed.; Instituto de Ciencias Naturales, Universidad Nacional de Colombia: Bogotá, Colombia, 2013; pp. 55–84. [Google Scholar]
  67. García-M, Y.; Rangel-Ch, J.O.; Rodríguez, P. Cambios En La Vegetación y El Clima Durante Los Últimos 200 Años En Ciénagas Del Sur Del Departamento Del Cesar. In Diversidad Biótica XIII: Complejo Cenagoso Zapatosa y Ciénagas del sur del Cesar. Biodiversidad, Conservación y Manejo; Rangel-Ch, J.O., Ed.; Instituto de Ciencias Naturales, Universidad Nacional de Colombia: Bogotá, Colombia, 2013; pp. 133–163. [Google Scholar]
  68. Cediel, F.; Shaw, R.P.; Cáceres, C. Tectonic Assembly of the Northern Andean Block. In The Circum-Gulf of Mexico and the Caribbean: Hydrocarbon Habitats, Basin Formation, and Plate Tectonics; Bartolini, C., Buffler, R.T., Blickwede, J., Eds.; AAPG Memoir 79; AAPG: Tulsa, OK, USA, 2003; pp. 815–848. [Google Scholar]
  69. Villamil, T. Campanian-Miocene Tectonostratigraphy, Depocenter Evolution and Basin Development of Colombia and Western Venezuela. Palaeogeogr. Palaeoclim. Palaeoecol. 1999, 153, 239–275. [Google Scholar] [CrossRef]
  70. Julivert, M. Las Estructuras Del Valle Medio Del Magdalena y Su Significación. Rev. Boletín Geol. 1961, 33–52. Available online: https://revistas.uis.edu.co/index.php/revistaboletindegeologia/article/view/4257 (accessed on 25 October 2025).
  71. Cortés, M.; Angelier, J.; Colletta, B. Paleostress Evolution of the Northern Andes (Eastern Cordillera of Colombia): Implications on Plate Kinematics of the South Caribbean Region. Tectonics 2005, 24, TC1008. [Google Scholar] [CrossRef]
  72. Gómez, E.; Jordan, T.; Allmendinger, R.; Hegarty, K.; Kelley, S. Syntectonic Cenozoic Sedimentation in the Northern Middle Magdalena Valley Basin of Colombia and Implications for Exhumation of the Northern Andes. Geol. Soc. Am. Bull. 2005, 117, 547–569. [Google Scholar] [CrossRef]
  73. Parra, M.; Mora, A.; Jaramillo, C.; Strecker, M.; Sobel, E.; Quiroz, L.; Rueda, M.; Torres, V. Orogenic Wedge Advance in the Northern Andes: Evidence from the Oligocene-Miocene Sedimentary Record of the Medina Basin, Eastern Cordillera, Colombia. Geol. Soc. Am. Bull. 2009, 121, 780–800. [Google Scholar] [CrossRef]
  74. Caballero, V. Evolucion Tectono-Sedimentaria Del Synclinal de Nuevo Mundo, Cuenca Sedimentaria Valle Medio Del Magdalena Colombia, Durante El Oligoceno-Mioceno; Universidad Industrial de Santander: Bucaramanga, Colombia, 2010. [Google Scholar]
  75. Cañas, H.d.J.; Pérez, O.; Ruíz, D.; Herrera, W.; Morales, C.J.; Alvarado, S.; Pineda, C.; Mayorga, L.; Cujabán, D.; Triana, X.; et al. Modelo Hidrogeológico Conceptual Valle Medio del Magdalena. Planchas 108 y 119. Puerto Wilches, Barrancabermeja, Sabana de Torres y San Vicente de Chucurí; Servicio Geológico Colombiano: Bogotá, Colombia, 2019.
  76. Universidad Industrial de Santander. Ingeominas Geología de La Plancha 85—Simití; Instituto Colombiano de Geología y Minería (Ingeominas): Bogotá, Colombia, 2006.
  77. Clavijo Torres, J.M. Geología de La Plancha 75—Aguachica; Instituto Colombiano de Geología y Minería (Ingeominas): Bucaramanga, Colombia, 1995.
  78. Ángel-Martínez, C.E.; Prieto, G.A.; Cristancho-Mejía, F.; Cuero, A.; Sarmiento-Orjuela, A.M.; Vargas-Quintero, J.A.; Delgado-Mateus, C.J.; Torres-Rojas, E.; Castelblanco-Ossa, C.A.; Camargo-Rache, G.L.; et al. Proyecto MEGIA: Modelo Geológico-Geofísico Del Valle Medio Del Magdalena. Producto No. 5; Universidad Nacional de Colombia: Bogotá, Colombia, 2021. [Google Scholar]
  79. Leal, J.A.; Zuñiga, J.; Cardeñosa, M.; Serrano, A.M.; Ibarra, D. Evaluación Hidrogeológica Del Grupo Real Como Unidad Productora Para Procesos de Reinyección En El Valle Medio Del Magdalena. In Proceedings of the Memorias del XVI Congreso Colombiano de Geología, Santa Marta, Colombia, 28 August–1 September 2017. [Google Scholar]
  80. Corporación Autónoma Regional del Cesar (CORPOCESAR). Informe Final Aguas Subterráneas Sur Del Cesar: Evaluación Del Potencial de Agua Subterránea En Los Municipios de Curumaní, Pailitas, Tamalameque, Pelaya, La Gloria, Gamarra, Aguachica, Rio de Oro, San Martin y San Alberto, Departamento del Cesar; Corporación Autónoma Regional del Cesar (CORPOCESAR): Valledupar, Colombia, 2015. Available online: https://www.corpocesar.gov.co/files/INFORME%20FINAL%20AGUAS%20SUBTERRANEAS%20SUR%20DEL%20CESAR.pdf (accessed on 25 October 2025).
  81. Consorcio Ruta del Sol. Estudio de Impacto Ambiental—Variante Aguachica, Proyecto Autopista Vial Ruta Del Sol, Sector 2; Consorcio Ruta del Sol: Bogotá, Colombia, 2012. [Google Scholar]
  82. Vargas, J.A. Modelamiento de La Estructura Resistiva del Valle Medio del Magdalena a Partir de la Interpretación de Estudios Magnetotelúricos. Master’s Thesis, Universidad Nacional de Colombia, Bogotá, Colombia, 2021. [Google Scholar]
  83. Simpson, F.; Bahr, K. Basic Theoretical Concepts. In Practical Magnetotellurics; Cambridge University Press: Cambridge, UK, 2005; pp. 15–36. ISBN 9780521817271. [Google Scholar]
  84. Wait, J.R. Magnetotelluric Theory ”Telluric,” from the Latin Tellurem, Meaning the Earth. In Geo-Electromagnetism; Elsevier: Amsterdam, The Netherlands, 1982; pp. 184–208. [Google Scholar] [CrossRef]
  85. Kaufman, A.A.; Alekseev, D.; Oristaglio, M. Principles of Magnetotellurics. In Methods in Geochemistry and Geophysics; Elsevier: Amsterdam, The Netherlands, 2014; Volume 45, pp. 377–415. [Google Scholar]
  86. Constable, S.C.; Parker, R.L.; Constable, C.G. Occam’s Inversion: A Practical Algorithm for Generating Smooth Models from Electromagnetic Sounding Data. Geophysics 1987, 52, 289–300. [Google Scholar] [CrossRef]
  87. Lowrie, W. Fundamentals of Geophysics, 2nd ed.; Cambridge University Press: Cambridge, UK, 2007. [Google Scholar]
  88. Phoenix Geophysics. MTU-5C Quick Start Guide for MT (DAA19). Phoenix Geophysics Ltd. 2022. Available online: https://phxgeo.ca/releases/v2.41.1/Manuals/DAA19%20-%20MTU-5C%20Quick%20Start%20Guide%20for%20MT%20-%20250310.pdf (accessed on 25 October 2025).
  89. Ogawa, Y. On Two-Dimensional Modeling of Magnetotelluric Field Data. Surv. Geophys. 2002, 23, 251–273. [Google Scholar] [CrossRef]
  90. Mount Sopris Probe QL40-ELOG Multipoint Resistivity–User Guide. Mount Sopris Instruments, Denver (CO), USA. Available online: https://www.geomatrix.co.uk/cms/resources/downloads/ql40-elogip-user-guide.pdf (accessed on 25 October 2025).
  91. Kearey, P.; Brooks, M.; Hill, I. An Introduction to Geophysical Exploration, 3rd ed.; Blackwell Science Ltd.: Oxford, UK, 2002; ISBN 978-0-632-04929-5. [Google Scholar]
  92. Khalil, M.A.; Temraz, M.G.; Joeckel, R.M.; Elnaggar, O.M.; Abuseda, H.H. Estimating Hydraulic Conductivity from Reservoir Resistivity Logs, Northern Western Desert, Egypt. Pure Appl. Geophys. 2022, 179, 4489–4501. [Google Scholar] [CrossRef]
  93. Krieger, L.; Peacock, J.; Thiel, S.; Duan, J.; Zhang, F. MTpy: A Python Toolbox for Magnetotellurics. Comput. Geosci. 2014, 67, 25–32. [Google Scholar] [CrossRef]
  94. Cockett, R.; Kang, S.; Heagy, L.J.; Pidlisecky, A.; Oldenburg, D.W. SimPEG: An Open Source Framework for Simulation and Gradient Based Parameter Estimation in Geophysical Applications. Comput. Geosci. 2015, 85, 142–154. [Google Scholar] [CrossRef]
  95. Ledo, J.; Jones, A.G. Regional Scale Electromagnetic Study of the Southern Canadian Cordillera and Its Geodynamic Implications. J. Geophys. Res. 2001, 106, 30755–30769. [Google Scholar] [CrossRef]
  96. Avdeev, D. Three-Dimensional Electromagnetic Modelling and Inversion from Theory to Application. Surv. Geophys. 2005, 26, 767–799. [Google Scholar] [CrossRef]
  97. Siripunvaraporn, W.; Egbert, G. WSINV3DMT: Vertical Magnetic Field Transfer Function Inversion and Parallel Implementation. Phys. Earth Planet. Inter. 2009, 173, 317–329. [Google Scholar] [CrossRef]
  98. Spichak, V.V.; Zakharova, O.K. Electromagnetic Resistivity Pseudo-Log as a New Instrument for Estimating Reservoir Properties beyond Boreholes. J. Appl. Geophy. 2023, 215, 105115. [Google Scholar] [CrossRef]
  99. Municipio de Aguachica. Plan de Ordenamiento Territorial Aguachica, Cesar 2001–2010: POT Aguachica Cesar 2001–2010. Alcaldía Municipal de Aguachica, Aguachica, Cesar, Colombia, 2001. Available online: https://repositoriocdim.esap.edu.co/handle/20.500.14471/10338 (accessed on 25 October 2025).
  100. Jaramillo, A.; Villamizar-M, V.; Calvo, J.; Rangel-Ch, J.O.; Parra, L.N. Origins and Territorial Analyses of the Musanda, El Congo, Doña María, El Sordo, Juncal, Baquero, Morales, and Costilla Wetlands, Southern Cesar, Colombia. In Biodiversity in Colombia XIII: Zapatosa Swamp Complex and Wetlands of Southern Cesar. Biodiversity, Conservation and Management; Rangel-Ch, J.O., Ed.; Instituto de Ciencias Naturales, Universidad Nacional de Colombia: Bogotá, Colombia, 2013; pp. 21–53. [Google Scholar]
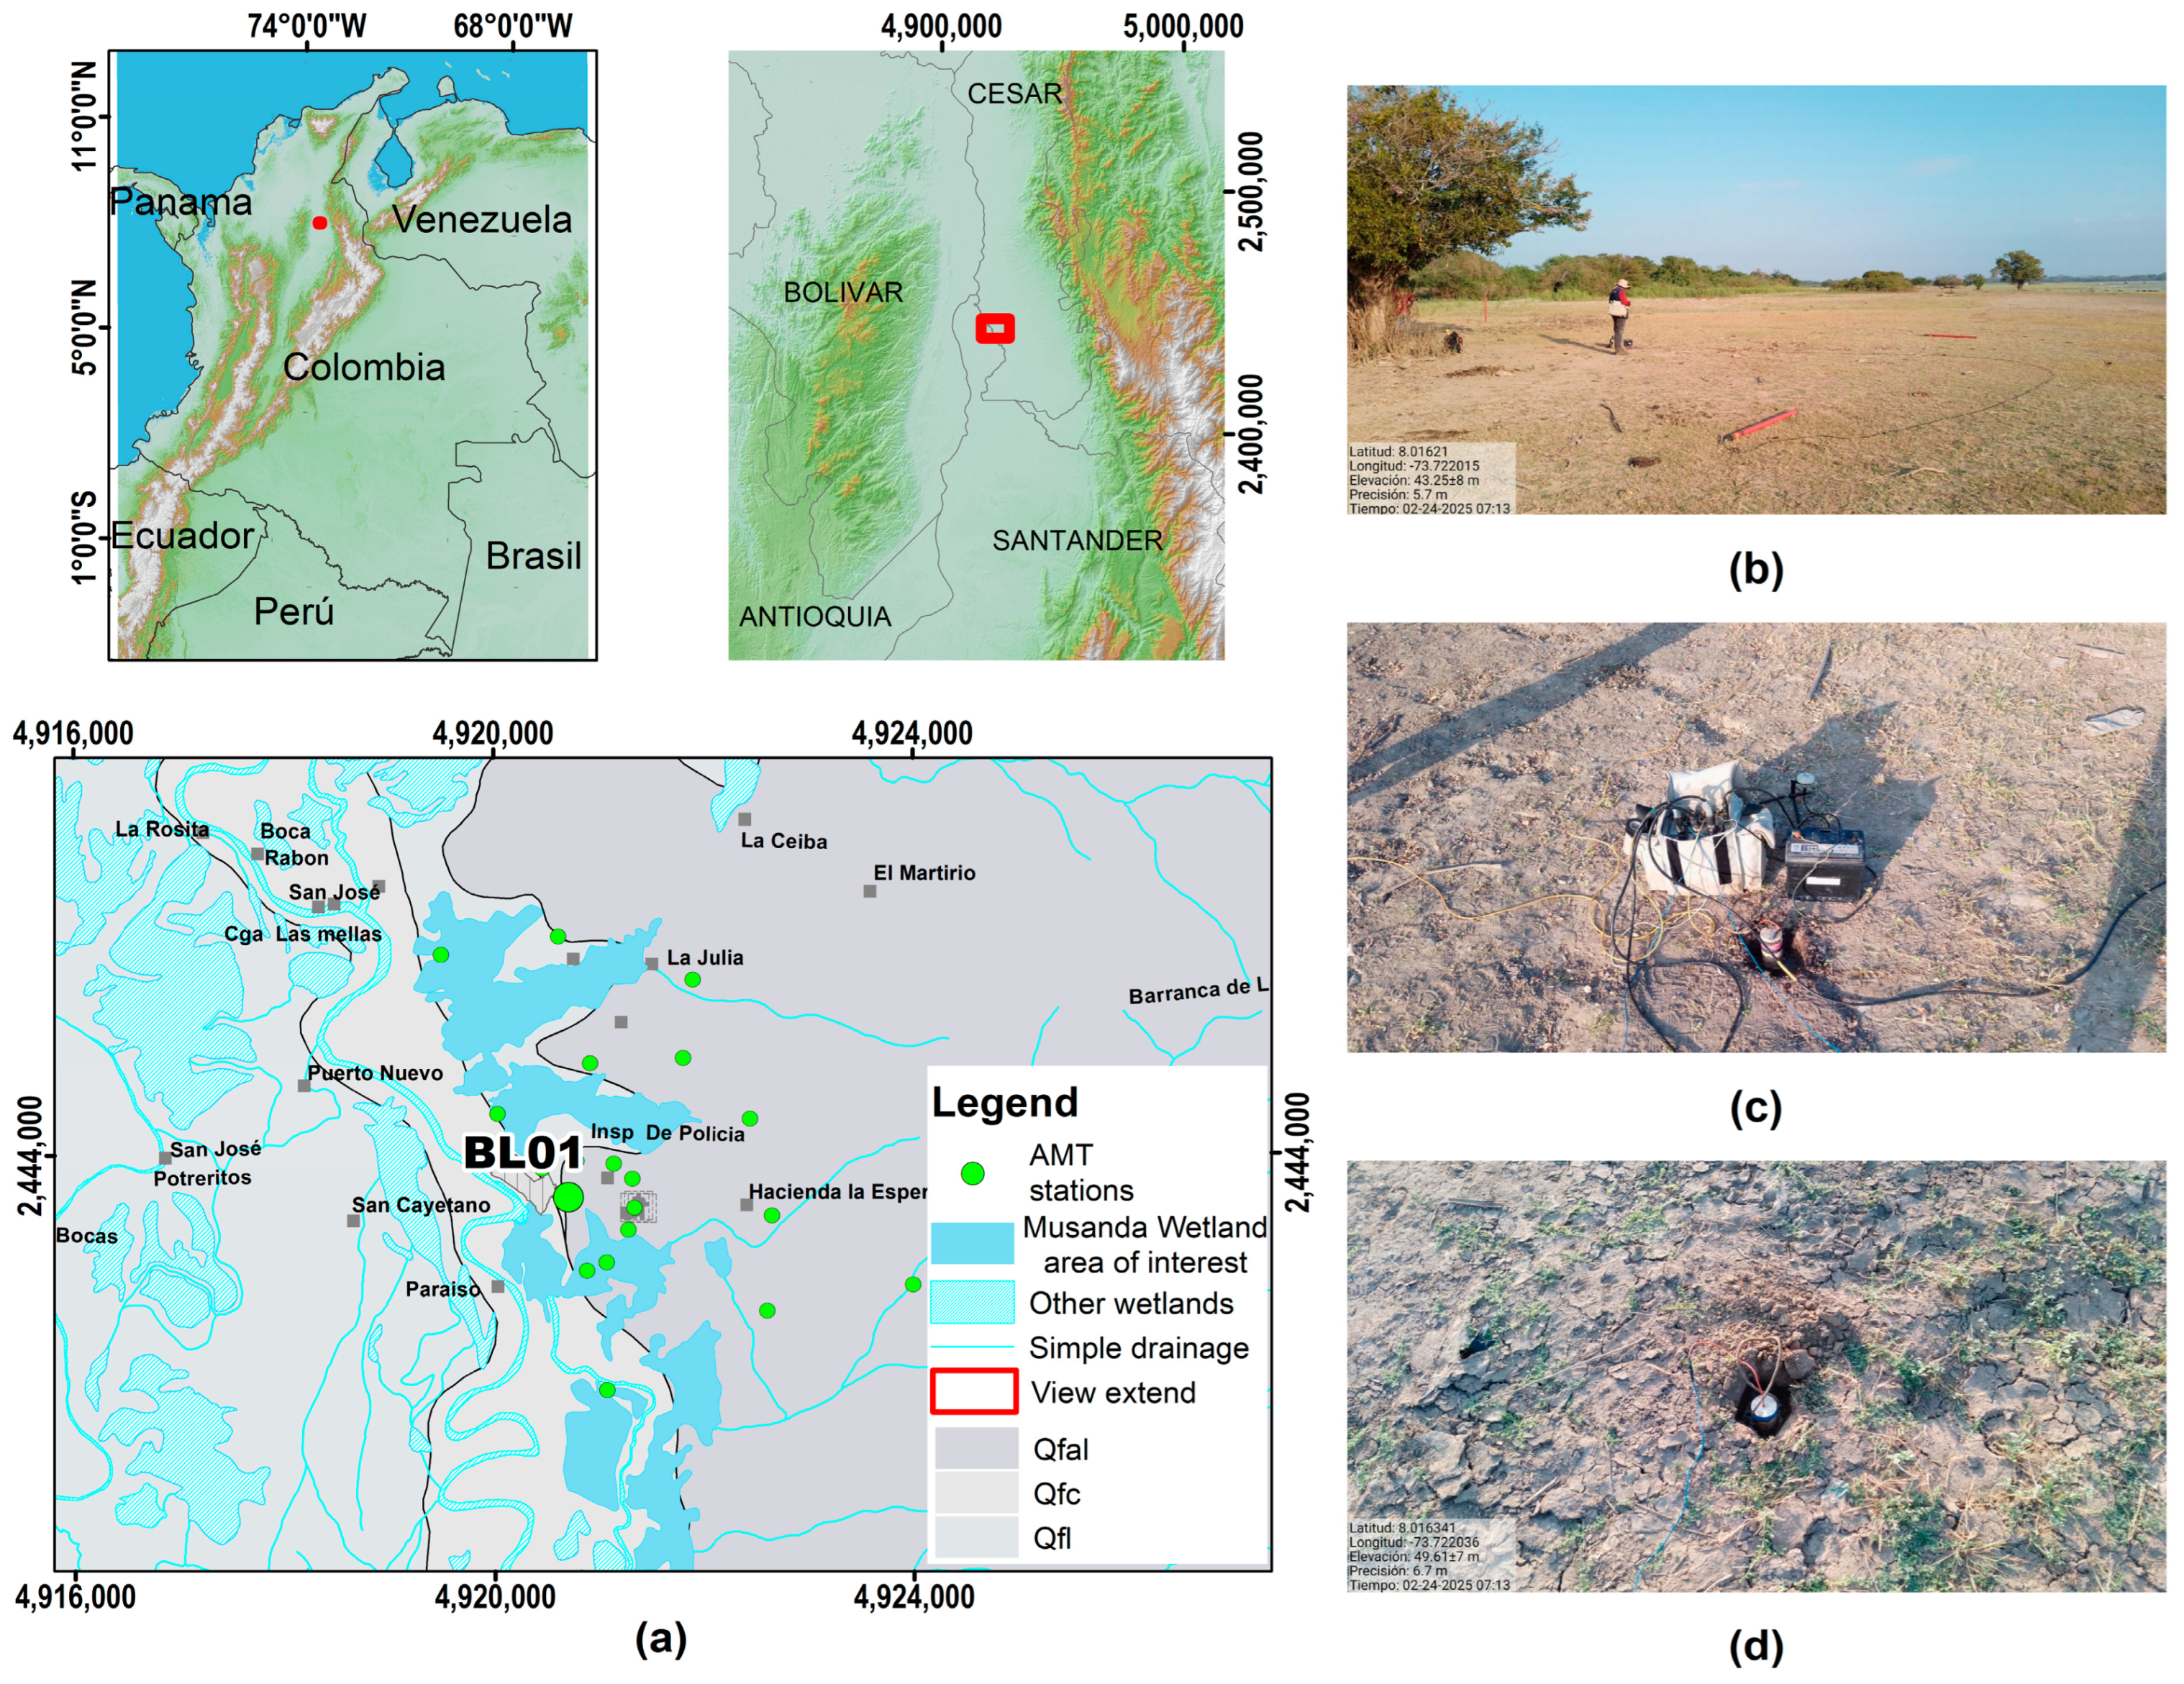
Figure 1. (a) Study area and AMT soundings location (BL01 sounding correlated with well log). (bd) Field setup during AMT data acquisition: (b) coil deployment, (c) Phoenix MTU-5C recording unit, and (d) non-polarizable electrode installation.
Water 17 03389 g001
Figure 2. (ac) Magnetotelluric (MT) sounding, the dashed lines indicate the cutoff limits used to define the depth of investigation (DOI = 500 m), and the color of each dashed line corresponds to its respective component. (a) Apparent resistivity and (b) phase shows parallel behavior, and (c) skew corresponds to the dimensionality indicator; all skew values remain below 10° for frequencies higher than 100 Hz. The BL01 sounding is shown in blue, while the skew curves from the other MT soundings in the area are shown in gray.
Water 17 03389 g002
Figure 3. (a) Resistivity well log. (b) Well design showing casing and screen intervals. (c) Stratigraphic column with photographic documentation of the main lithological variations observed during drilling; the colors in the stratigraphic column represent the matrix color of the deposit.
Water 17 03389 g003
Figure 4. Synthetic AMT from well log R64—Mean (blue) vs. Median (red). (a) Apparent resistivity. (b) Phase. (c) Layer models, the grey lines correspond to the well resistivity models discretized into 3 to 150 layers.
Water 17 03389 g004
Figure 5. Methodology workflow summary.
Water 17 03389 g005
Figure 6. Comparison of the synthetic model with the measured magnetotelluric data. (a) Apparent resistivity, the dashed line corresponds to the DOI of 500 m. (b) Phase.
Water 17 03389 g006
Figure 7. (a) AMT layered inversion model. (b) Apparent resistivity and phase of the observed data for the AMT xy component compared with the calculated (Pred) values from the 12-layer model, showing a very high correlation up to the depth of interest. (c) Residuals of apparent resistivity and phase.
Water 17 03389 g007
Figure 8. (a) AMT upscaling (blue) compared against the reference model (well data, orange), the grey lines correspond to the well resistivity models discretized into 3 to 150 layers; (b) interpreted lithology from resistivity behavior.
Water 17 03389 g008
Table 1. Geology and tectonics events in MMB.
AgeFormationsTectonic EventDepositional Environment
Triassic–JurassicBocas, Noreán, and GirónRiftContinental to marginal
Jurassic–PaleoceneCumbre, Rosablanca, Paja, Tablazo, Simití, and La Luna Thermal subsidenceFluvial, littoral, and marine
Late PaleogeneLa Paz, Esmeraldas, Mugrosa, and ColoradoCompressional—onset of structural inversionContinental
Neogene–QuaternaryReal Group and Quaternary depositsEnd of structural inversionContinental
Table 2. Correlation between resistivity ranges and lithologies in the study area.
Geological UnitLithologyResistivity Range
(Ω·m)
Depth Range
(m)
Interpretation of Characteristics
Floodplain deposits (Qfal)Muddy sands with gravels14–200–20.3
102.5–137.5
181.4–236.4
The uppermost layer exhibits resistivity values of up to 35 Ω·m; however, it is the thinnest unit and is influenced by anthropogenic fill related to settlement activities.
Fluviolacustrine deposits (Qfl)Clay with sand3–720.3–52.3
74.6–102.5
137.5–181.4
305.3–391.7
Floodplain deposits (Qfal)Sandy mud with gravels8–1352.3–74.6
236.4–305.3
Floodplain deposits are distinguished from other units by their higher proportion of fine-grained sediments
Real Group (N1r)Sandstone>30>391.7Basal group
Disclaimer/Publisher’s Note: The statements, opinions and data contained in all publications are solely those of the individual author(s) and contributor(s) and not of MDPI and/or the editor(s). MDPI and/or the editor(s) disclaim responsibility for any injury to people or property resulting from any ideas, methods, instructions or products referred to in the content.