Evaluating Agricultural Drought in the Haihe River Basin Using an Improved Crop Moisture Index
Abstract
1. Introduction
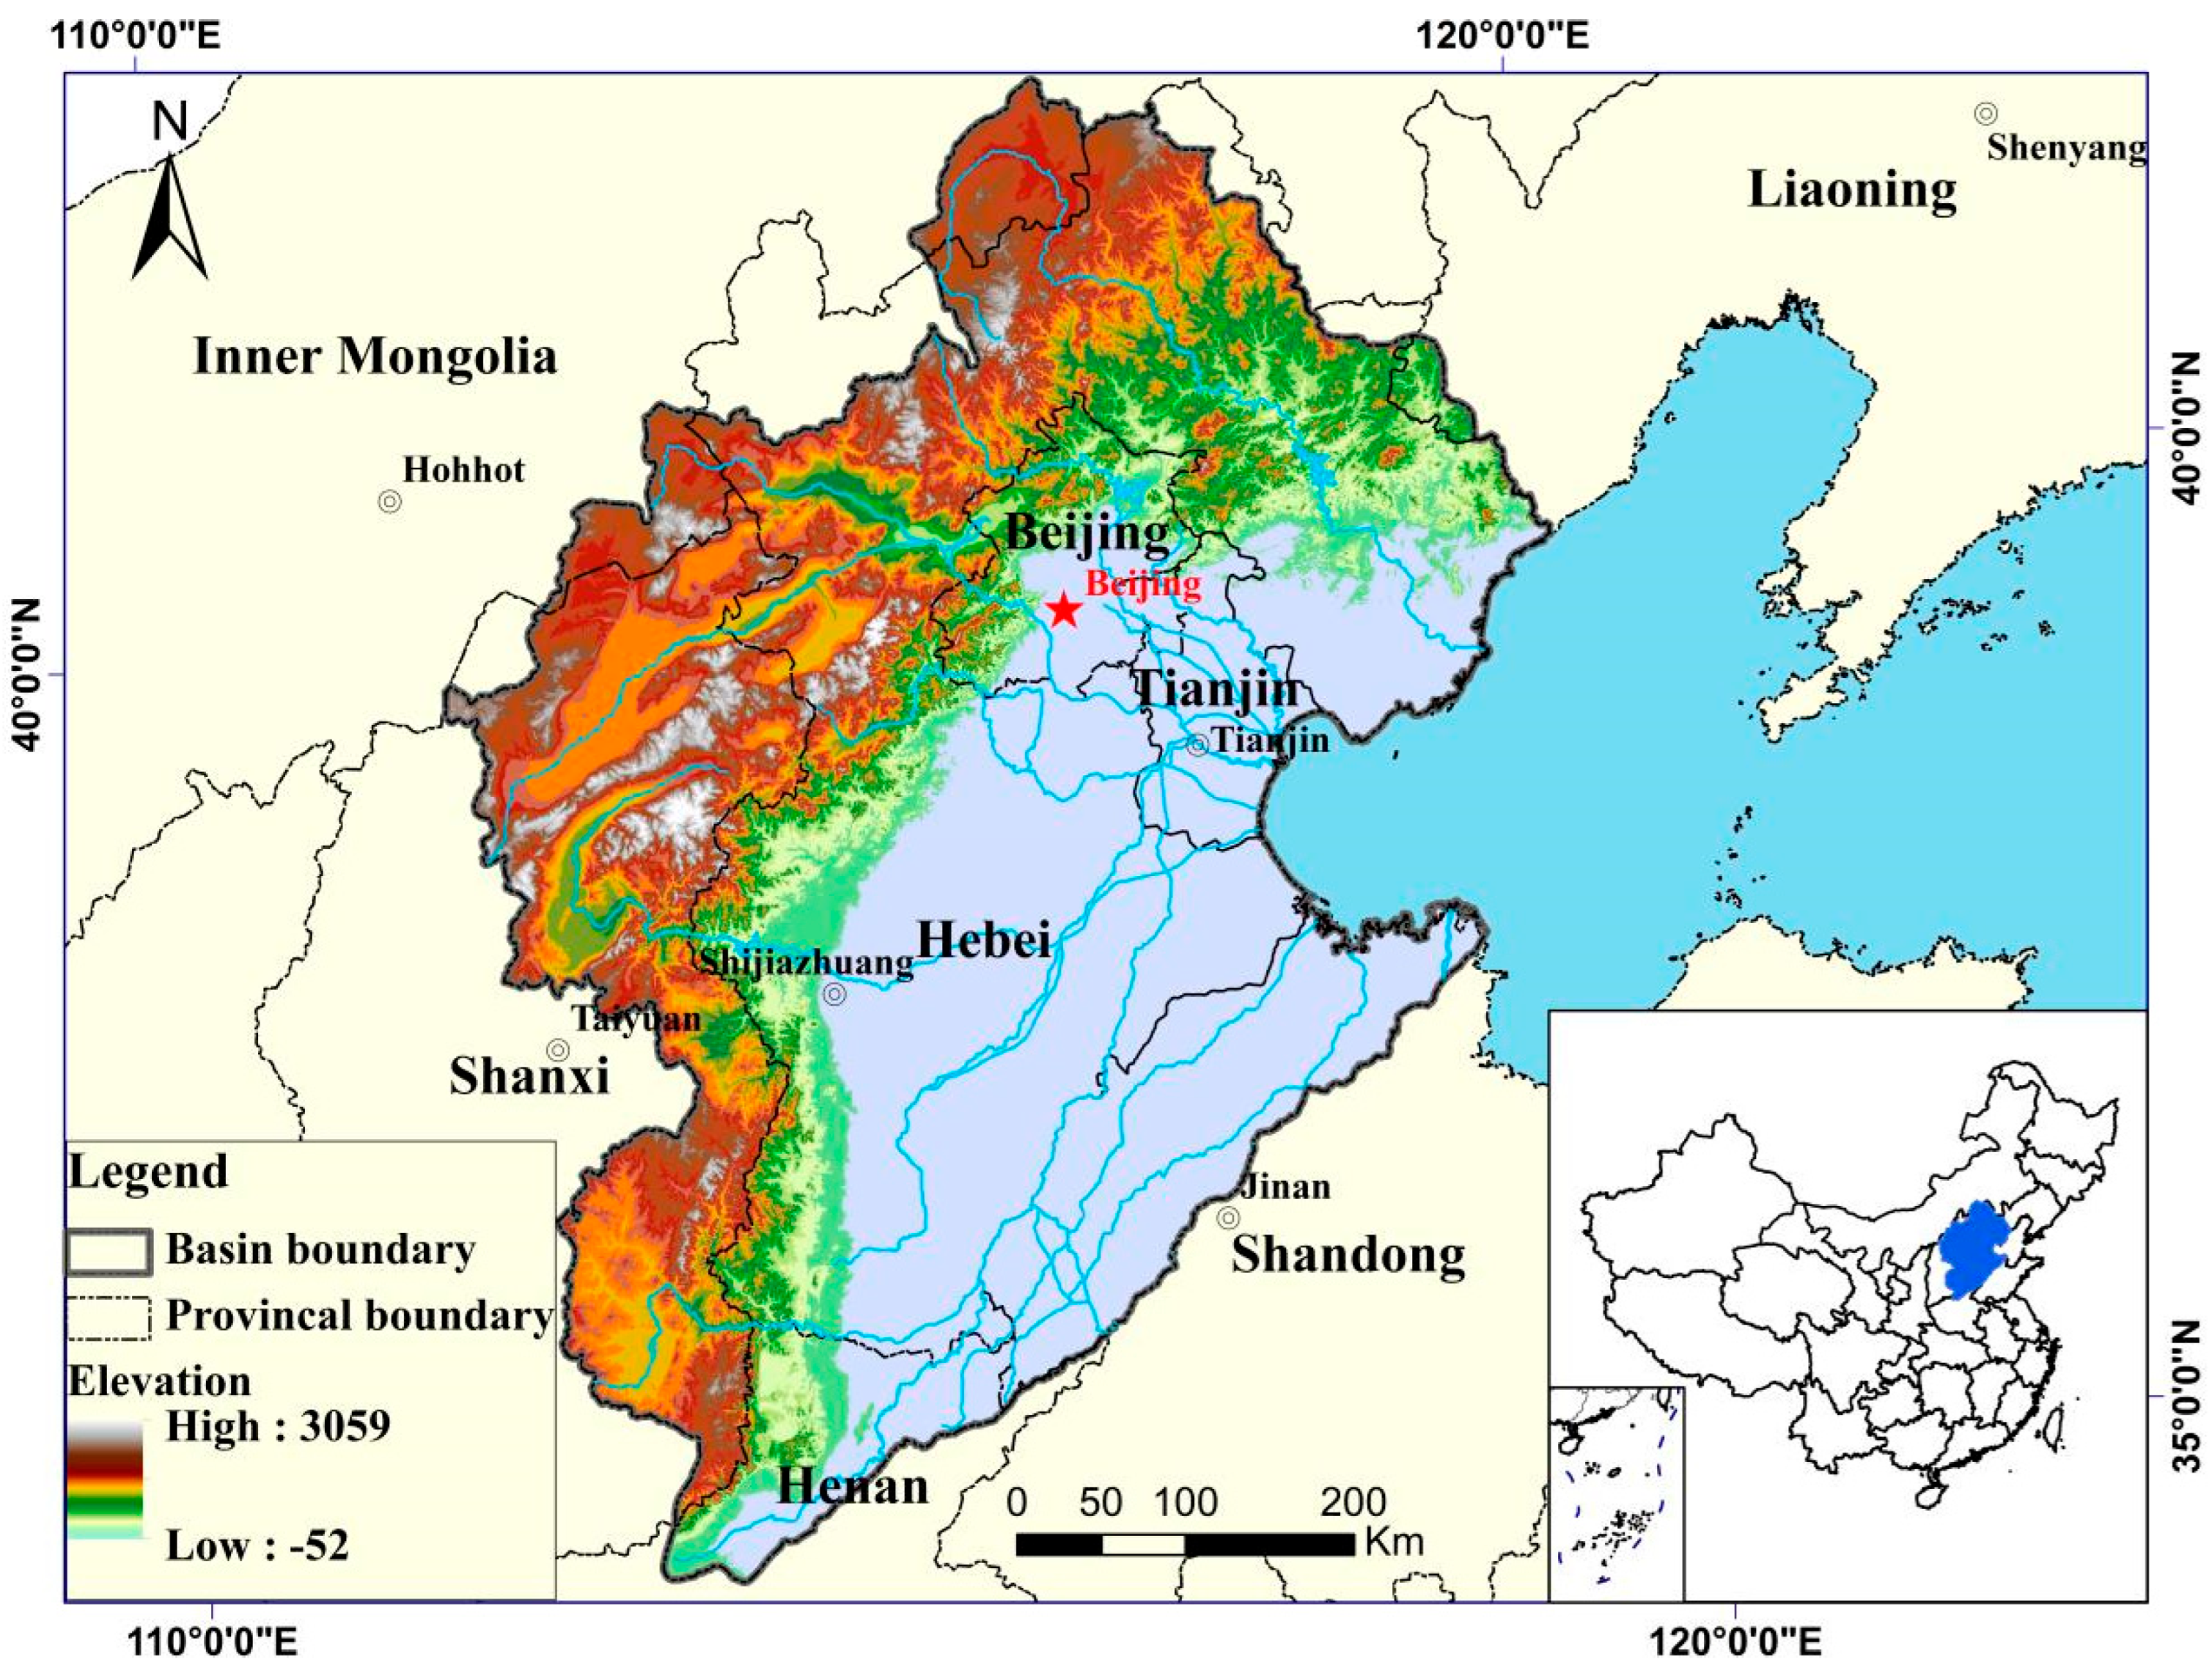
2. Description of the Study Area
3. Data and Methodology
3.1. Data Sources
- (a)
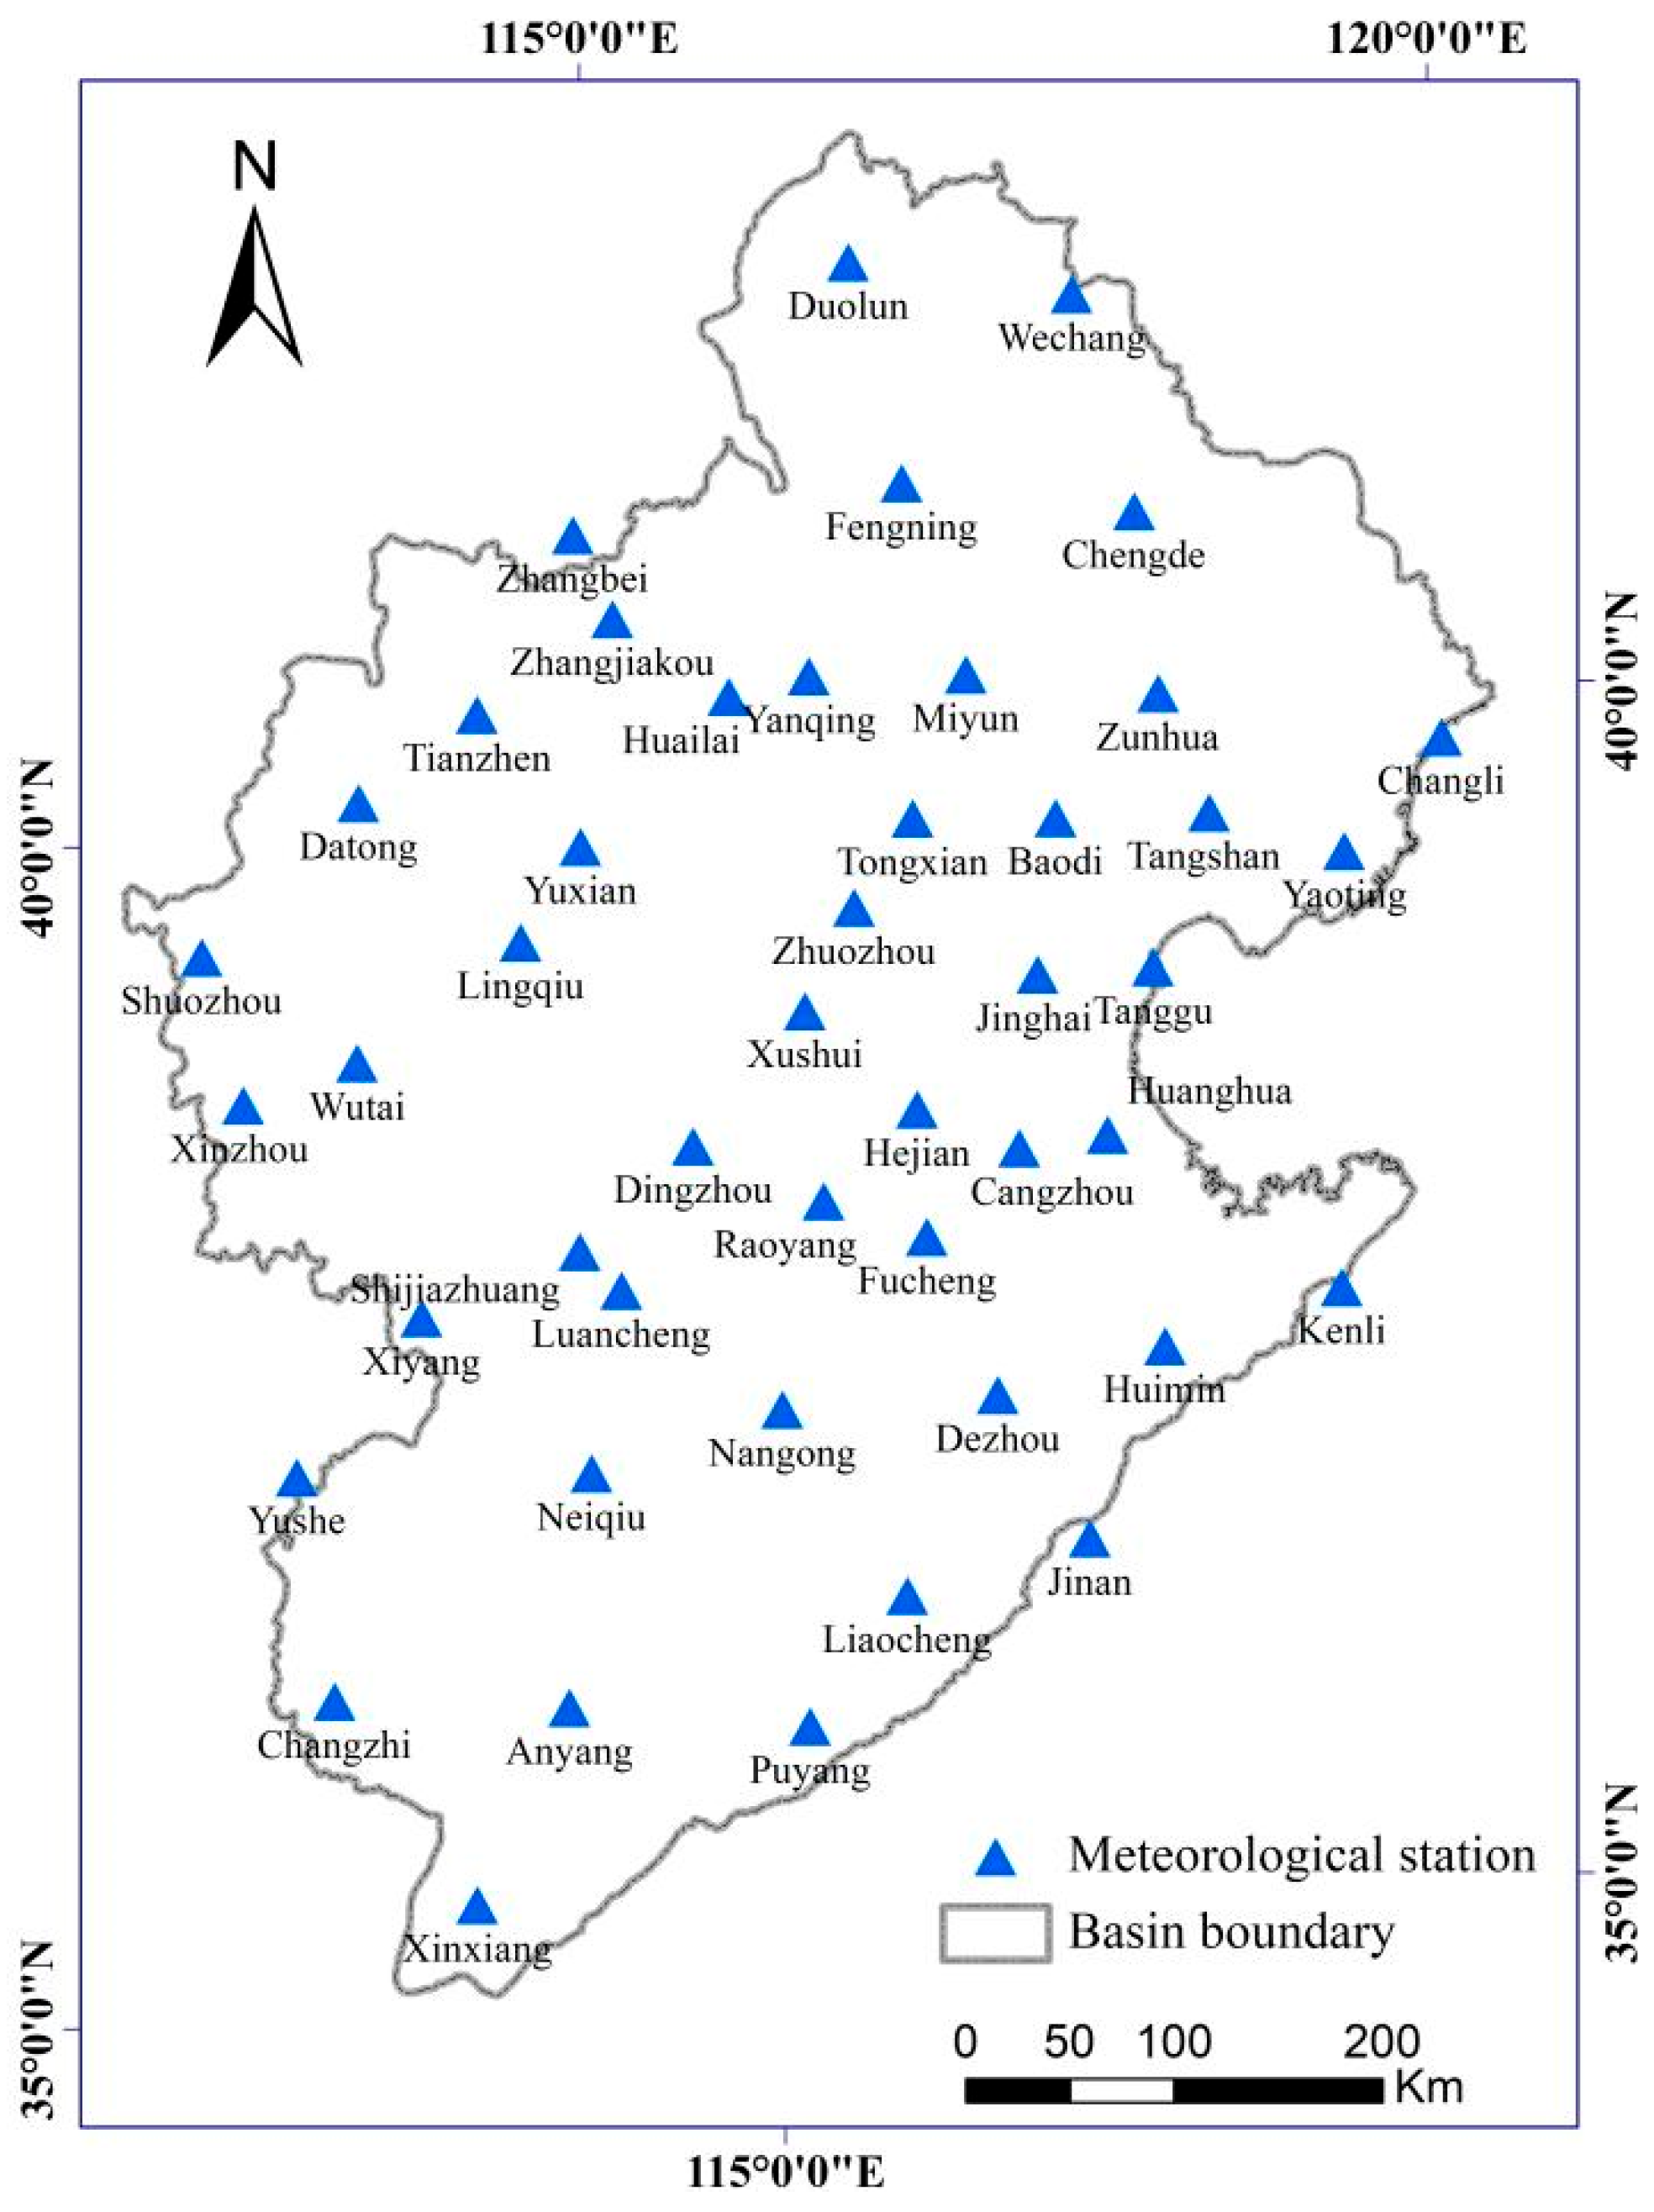
- Daily time series of precipitation, relative humidity, wind speed, sunshine duration, and minimum and maximum air temperature of 47 meteorological stations from 1985 to 2012 were used in this study (Figure 2). Data were collected from the China Meteorological Data Service Centre (http://data.cma.cn/).
- (b)
- Soil data including soil layer depth, saturated water content, field capacity, and wilting point, were provided by the China Soil Science Database (http://vdb3.soil.csdb.cn/).
- (c)
- Crop parameters, including the main crop types and their growth-stage-specific coefficients, were compiled from relevant literature (Table 1).
- (d)
- Irrigation data for the study area, including crop type, irrigation frequency, and water volume, were obtained from Yang et al. [23].
- (e)
- Soil moisture data, including soil water content within the top 1 m depth from 1992 to 2013, were obtained from Wang et al. [24]. The soil profile was divided into five layers at depths of 10, 20, 50, 70, and 100 cm. However, significant data gaps at many monitoring stations resulted in discontinuous time series. To ensure comparability, 32 stations with more complete records were selected from the original 47 meteorological stations for analysis.
| Crop Type | Growth Stage | ||||
|---|---|---|---|---|---|
| Sowing | Tillering | Jointing | Heading | Filling | |
| Winter wheat a | 0.7 | 0.4 | 0.4–1.1 | 1.1 | 1.1–0.6 |
| Summer maize a | 0.36 | 0.36 | 0.36–1.1 | 1.1 | 1.1–0.5 |
| Spring maize b | 0.5 | 0.5 | 0.85 | 1.2 | 0.95–0.6 |
3.2. Methodology
3.2.1. Crop Moisture Index
3.2.2. Improved Methods
- (1)
- Evapotranspiration Calculation
- (2)
- Irrigation calculation
3.2.3. Comparison of Measured Drought
4. Results and Analysis
4.1. Soil Moisture Comparisons
4.2. Drought Identification Accuracy Analyses
4.3. Spatial Comparisons
5. Discussion
- (1)
- First, although the improvement of the soil water balance equation effectively enhanced the simulation results of soil moisture content at the annual and monthly scales, the accuracy of the weekly scale simulation results was not high. Due to the lack of specific information on irrigation timing, actual irrigation amount, and irrigation frequency, the irrigation threshold method had to be used in the soil hydrological simulation process to estimate the above information, and errors are inevitable. If accurate irrigation information is available, the simulation results of soil moisture and the assessment results of agricultural drought will be more reliable.
- (2)
- Second, the crop coefficients used in this study are constant values set for specific growth stages of different crops in different regions. They are scientific results derived from the research on the variation patterns of crop coefficients during the growth period by institutions such as FAO and the Chinese Academy of Sciences over the years and are widely applicable. However, these static crop coefficients have large differences between different regions and may result in spatial and temporal discontinuity in large-scale continuous drought monitoring results [39]. Future research can consider introducing dynamic crop coefficients that change with the growth process to enhance the accuracy of agricultural drought monitoring.
- (3)
- Finally, consistent with the principle of the original CMI, the improved CMI is also constructed based on the principle of soil water balance and may be more suitable for the northern dry farming areas. Whether it has advantages in drought monitoring in the southern paddy areas needs further discussion. In addition, since irrigated farmland accounts for most of the arable land in the Hai River Basin, this study did not consider the scattered non-irrigated farmland, which may cause errors in some local areas.
6. Conclusions
- (1)
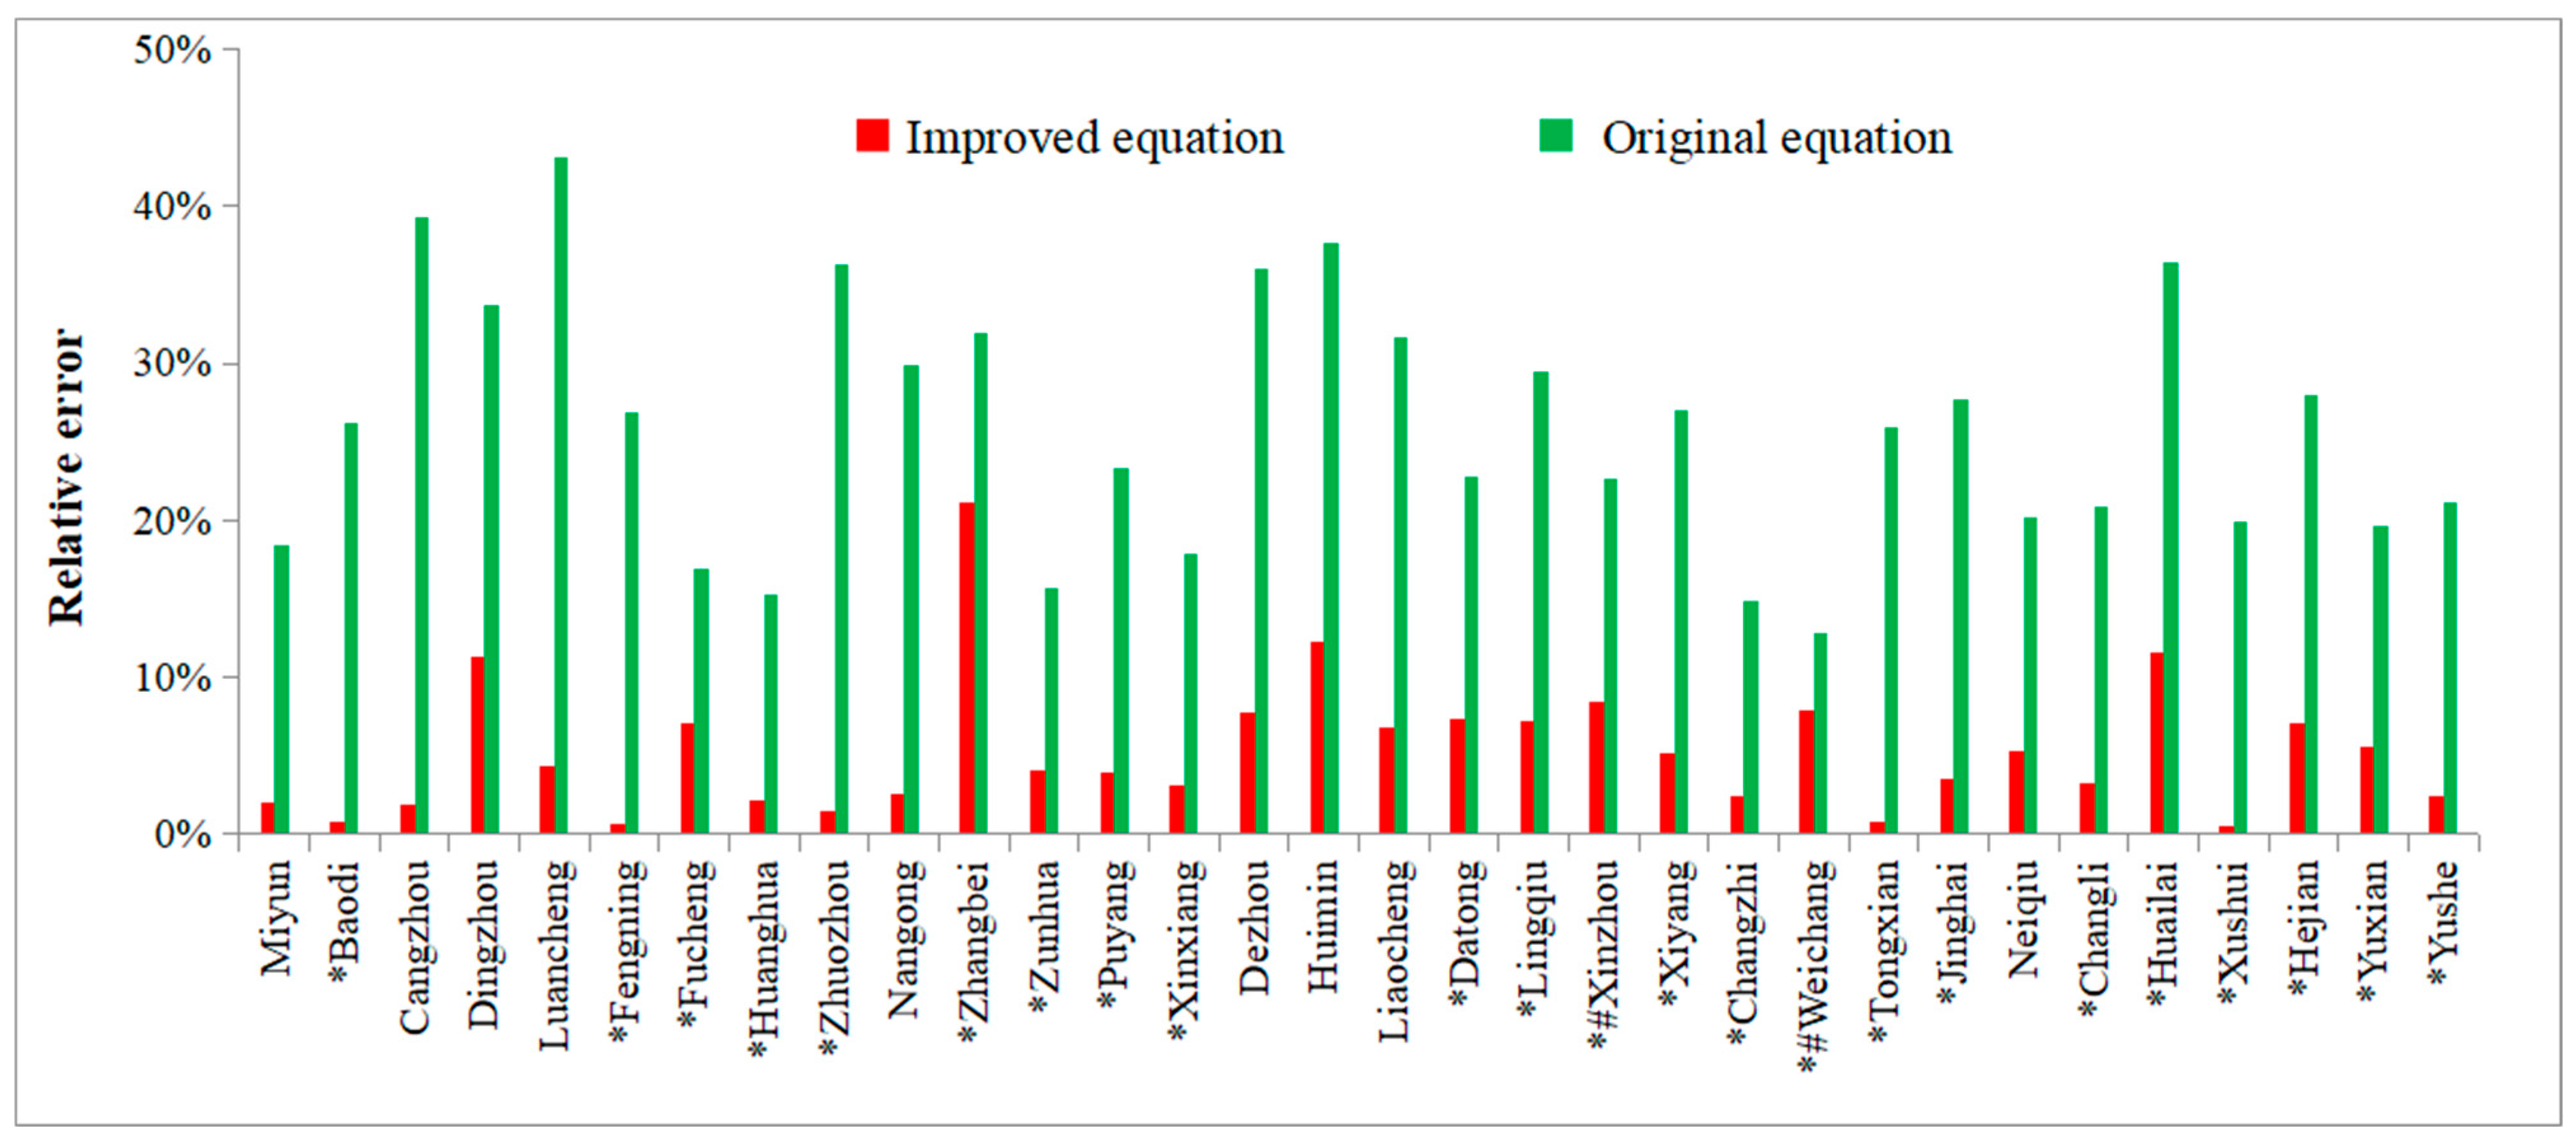
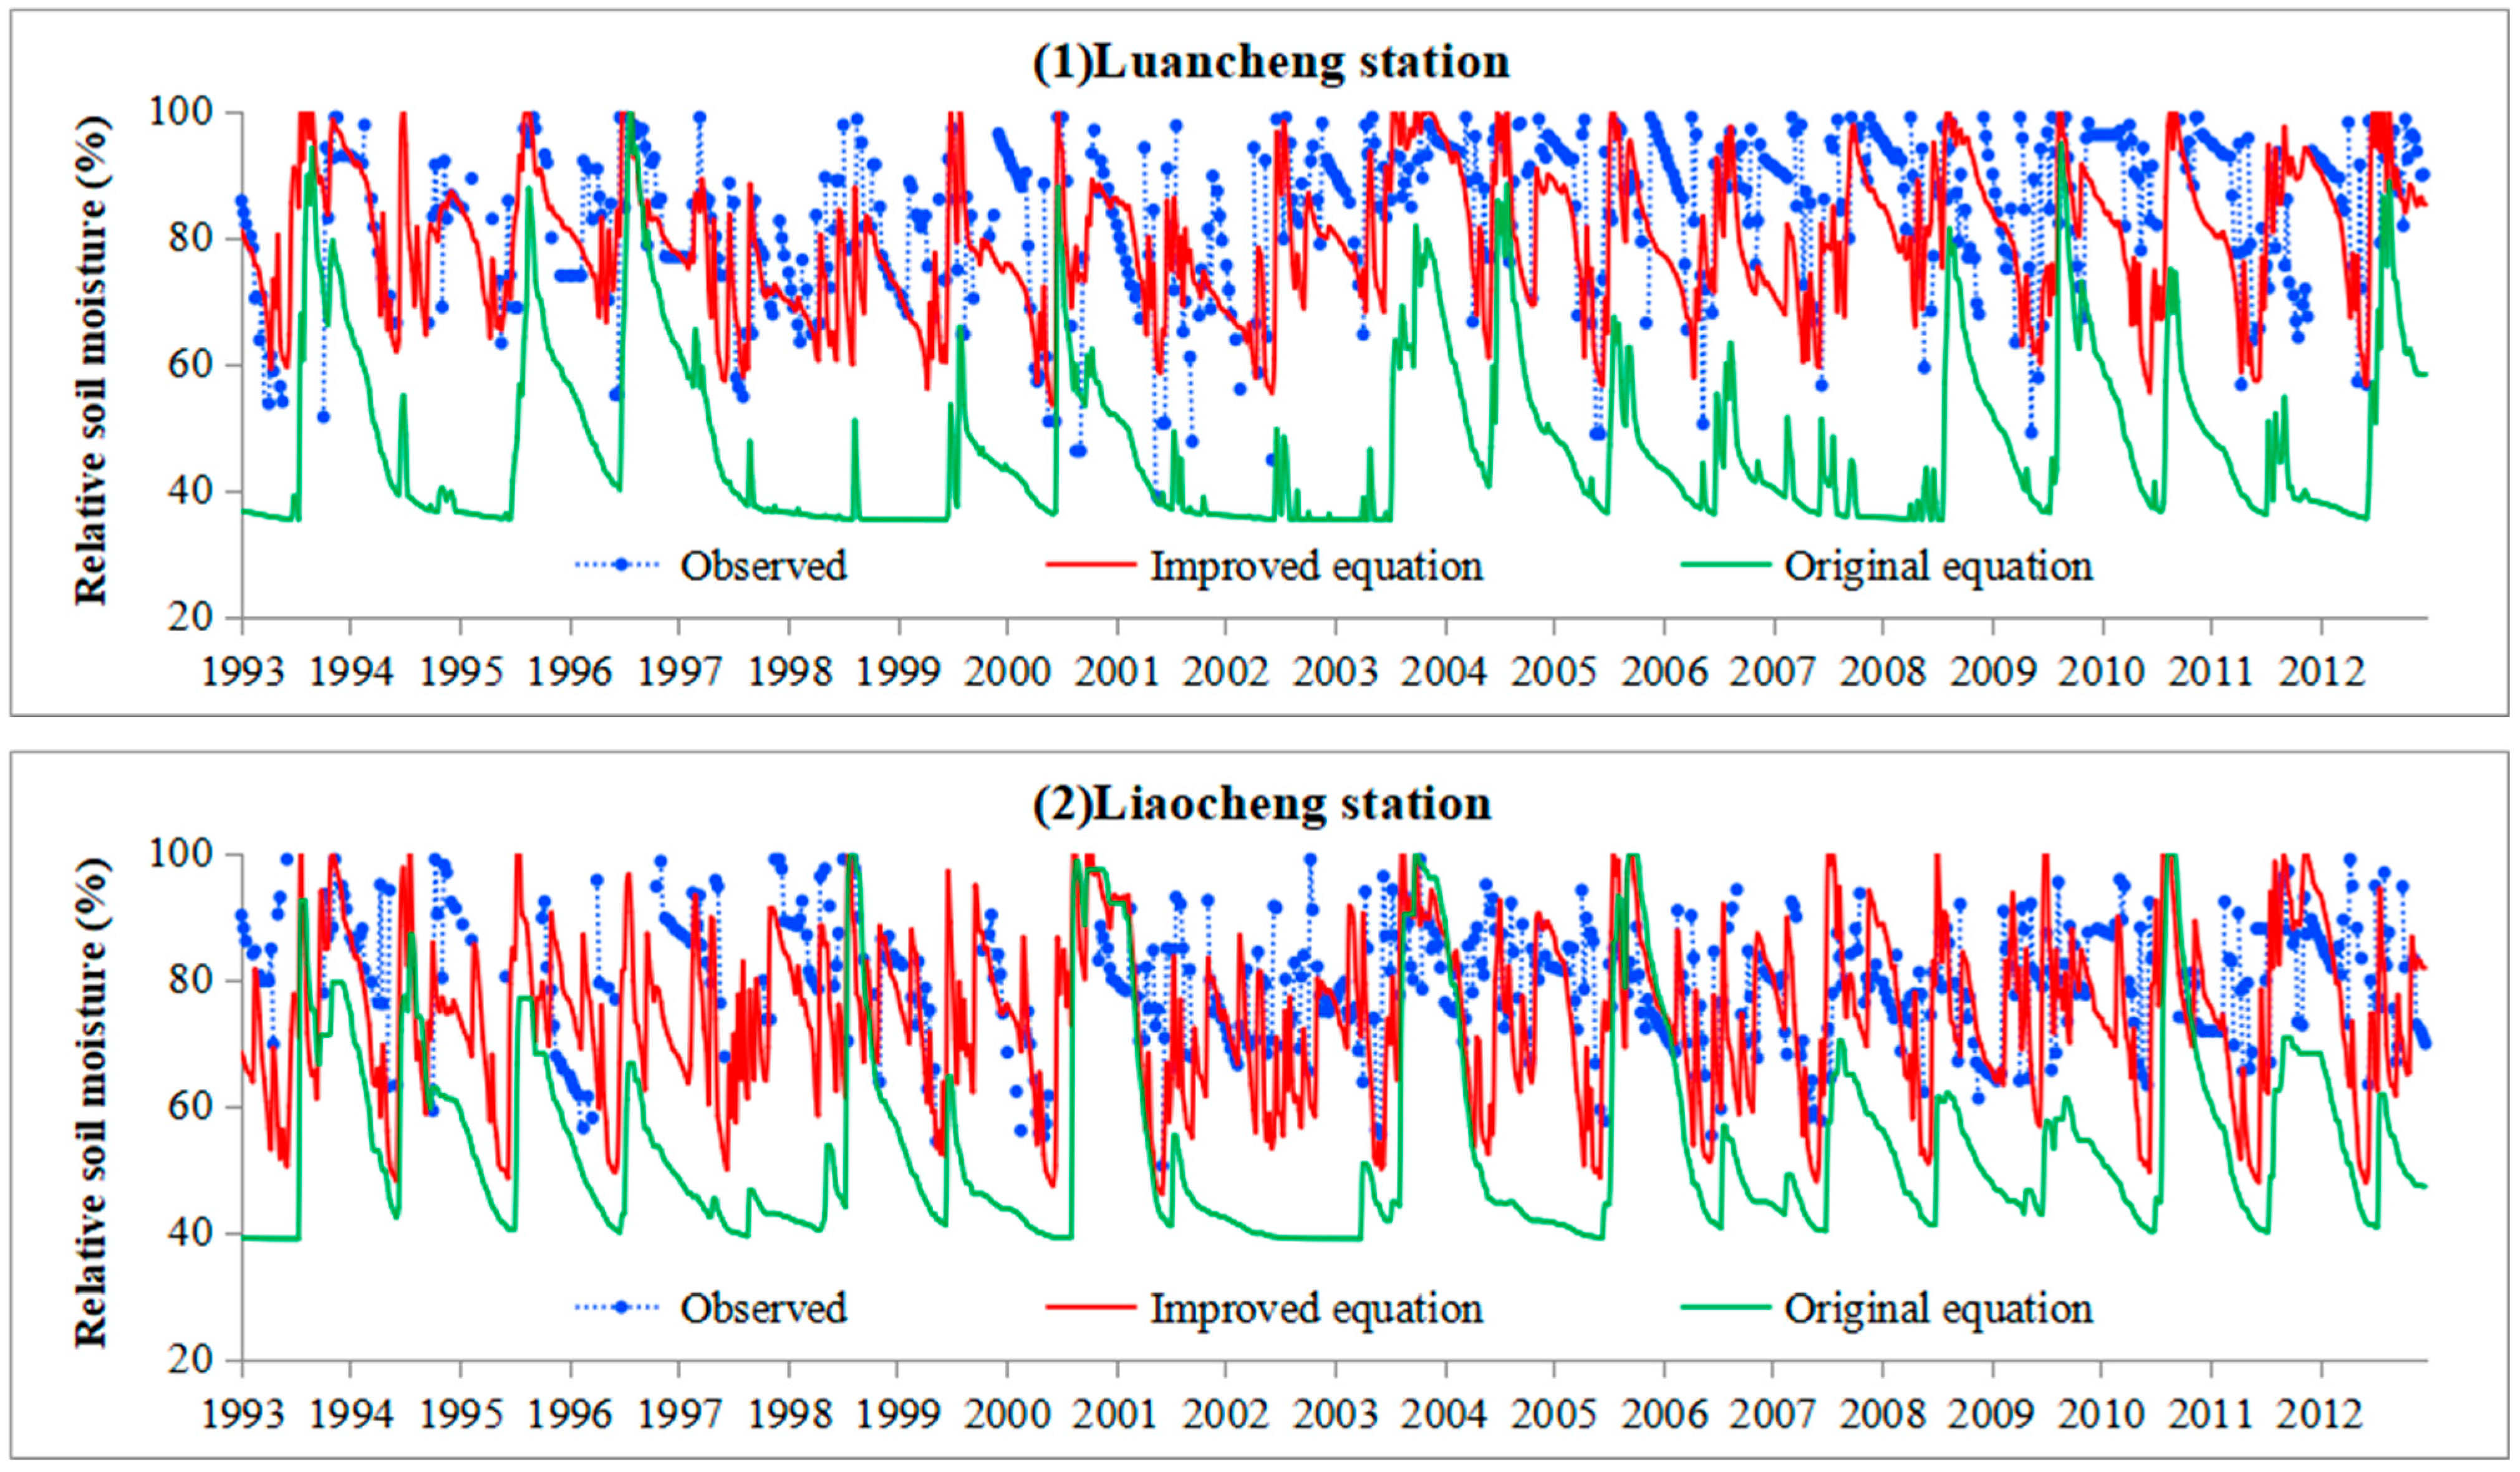
- Regarding soil moisture simulation across annual, monthly, and weekly scales, the improved soil water balance equation exhibits a multi-year average relative error of 5.1% between simulated and observed values, a significant improvement over the 26.2% error of the original equation. The monthly average relative errors of the improved equation are all below 20%, whereas those of the original equation exceed 20% in most months. Although some errors persist, the weekly soil moisture simulated by the improved equation more closely matches the observed variation trends and provides a more objective reflection of farmland soil moisture dynamics.
- (2)
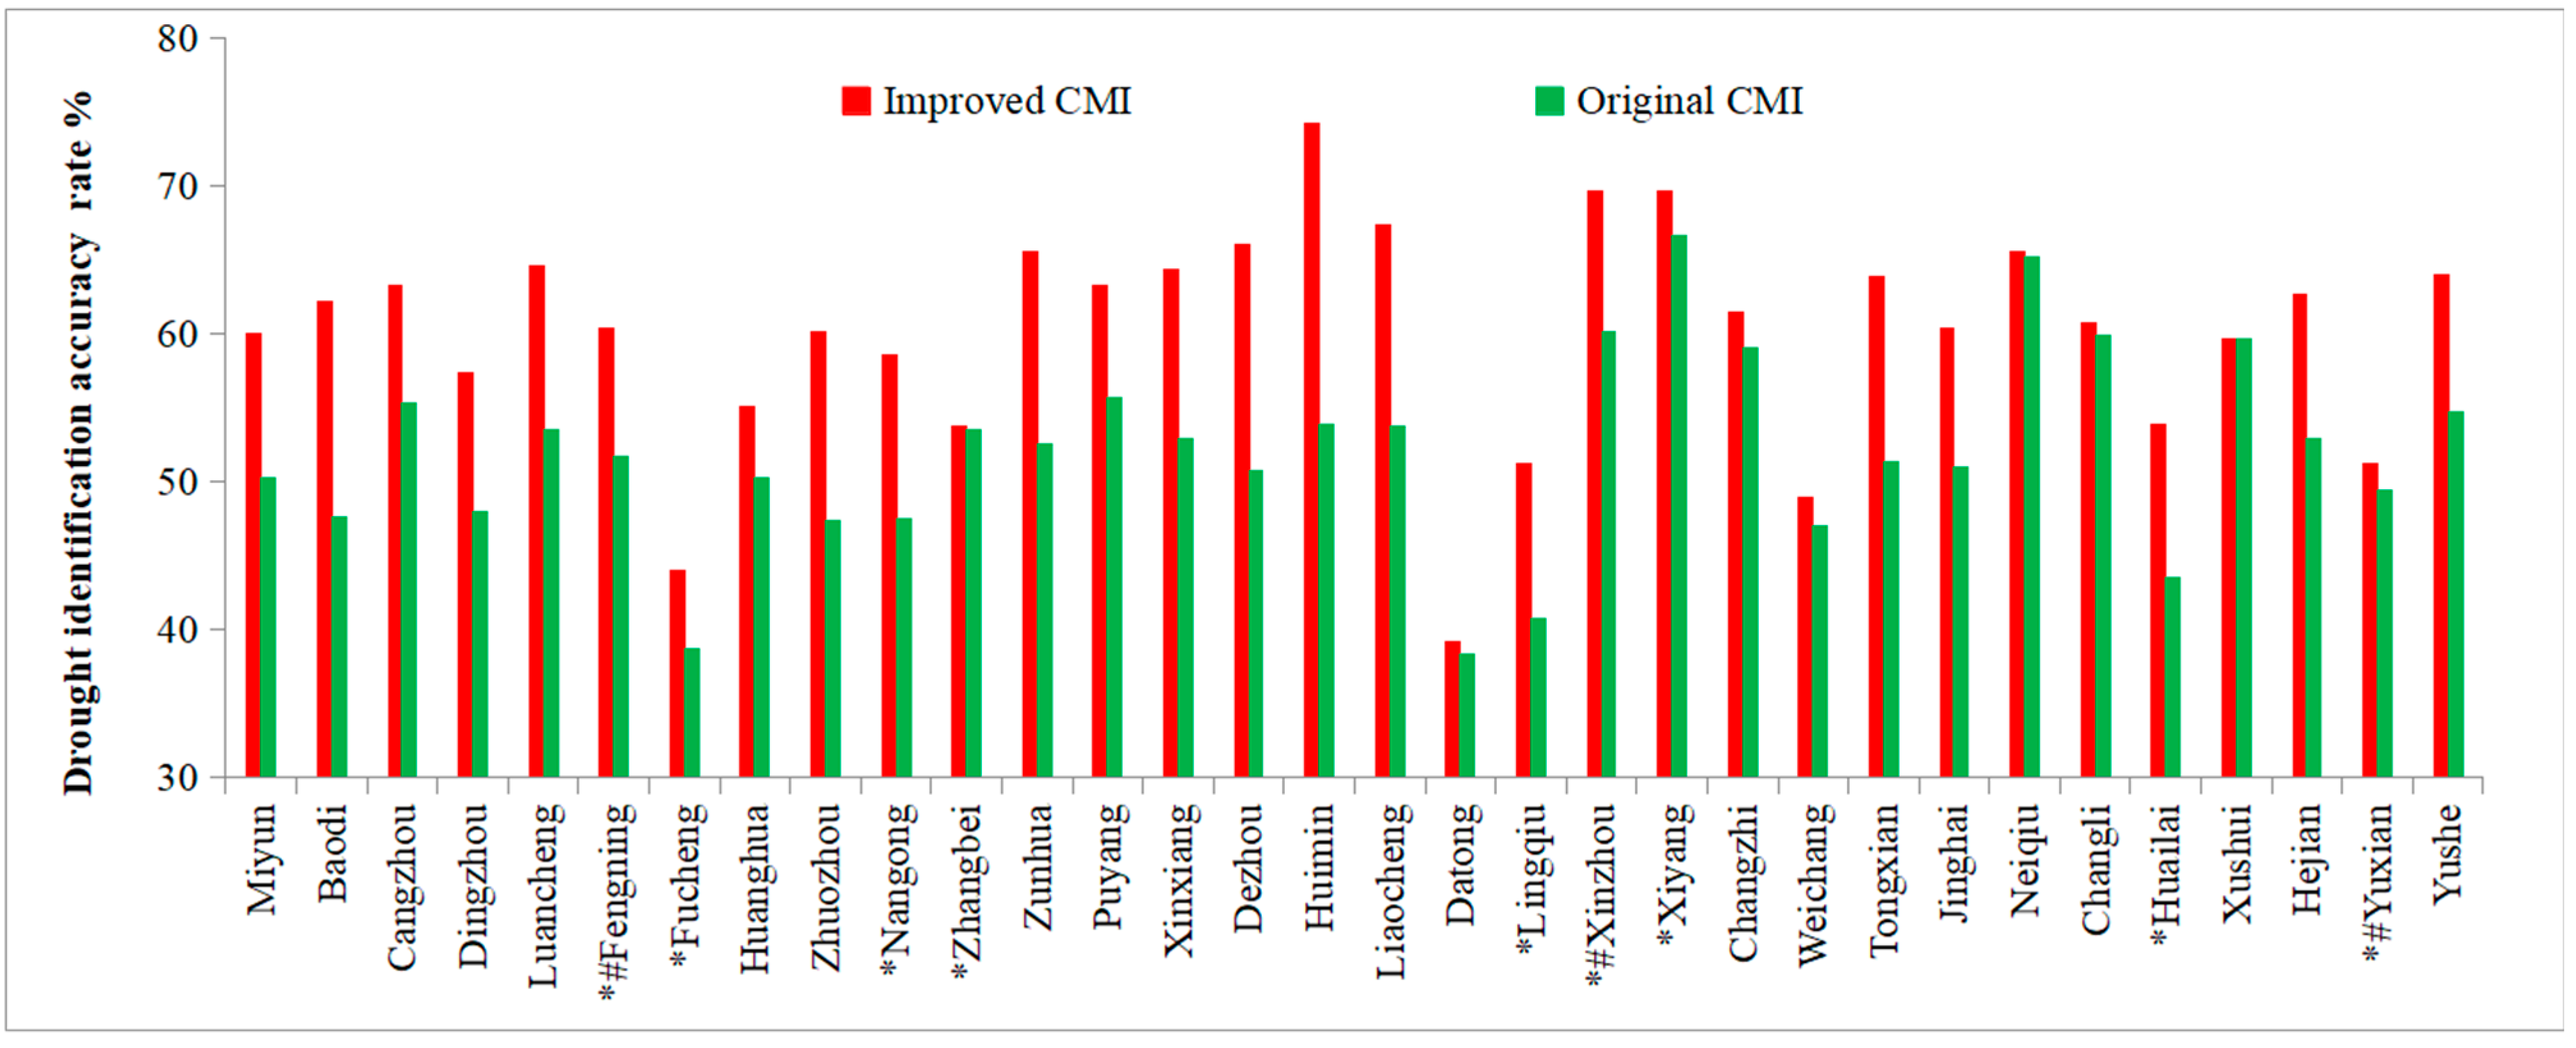
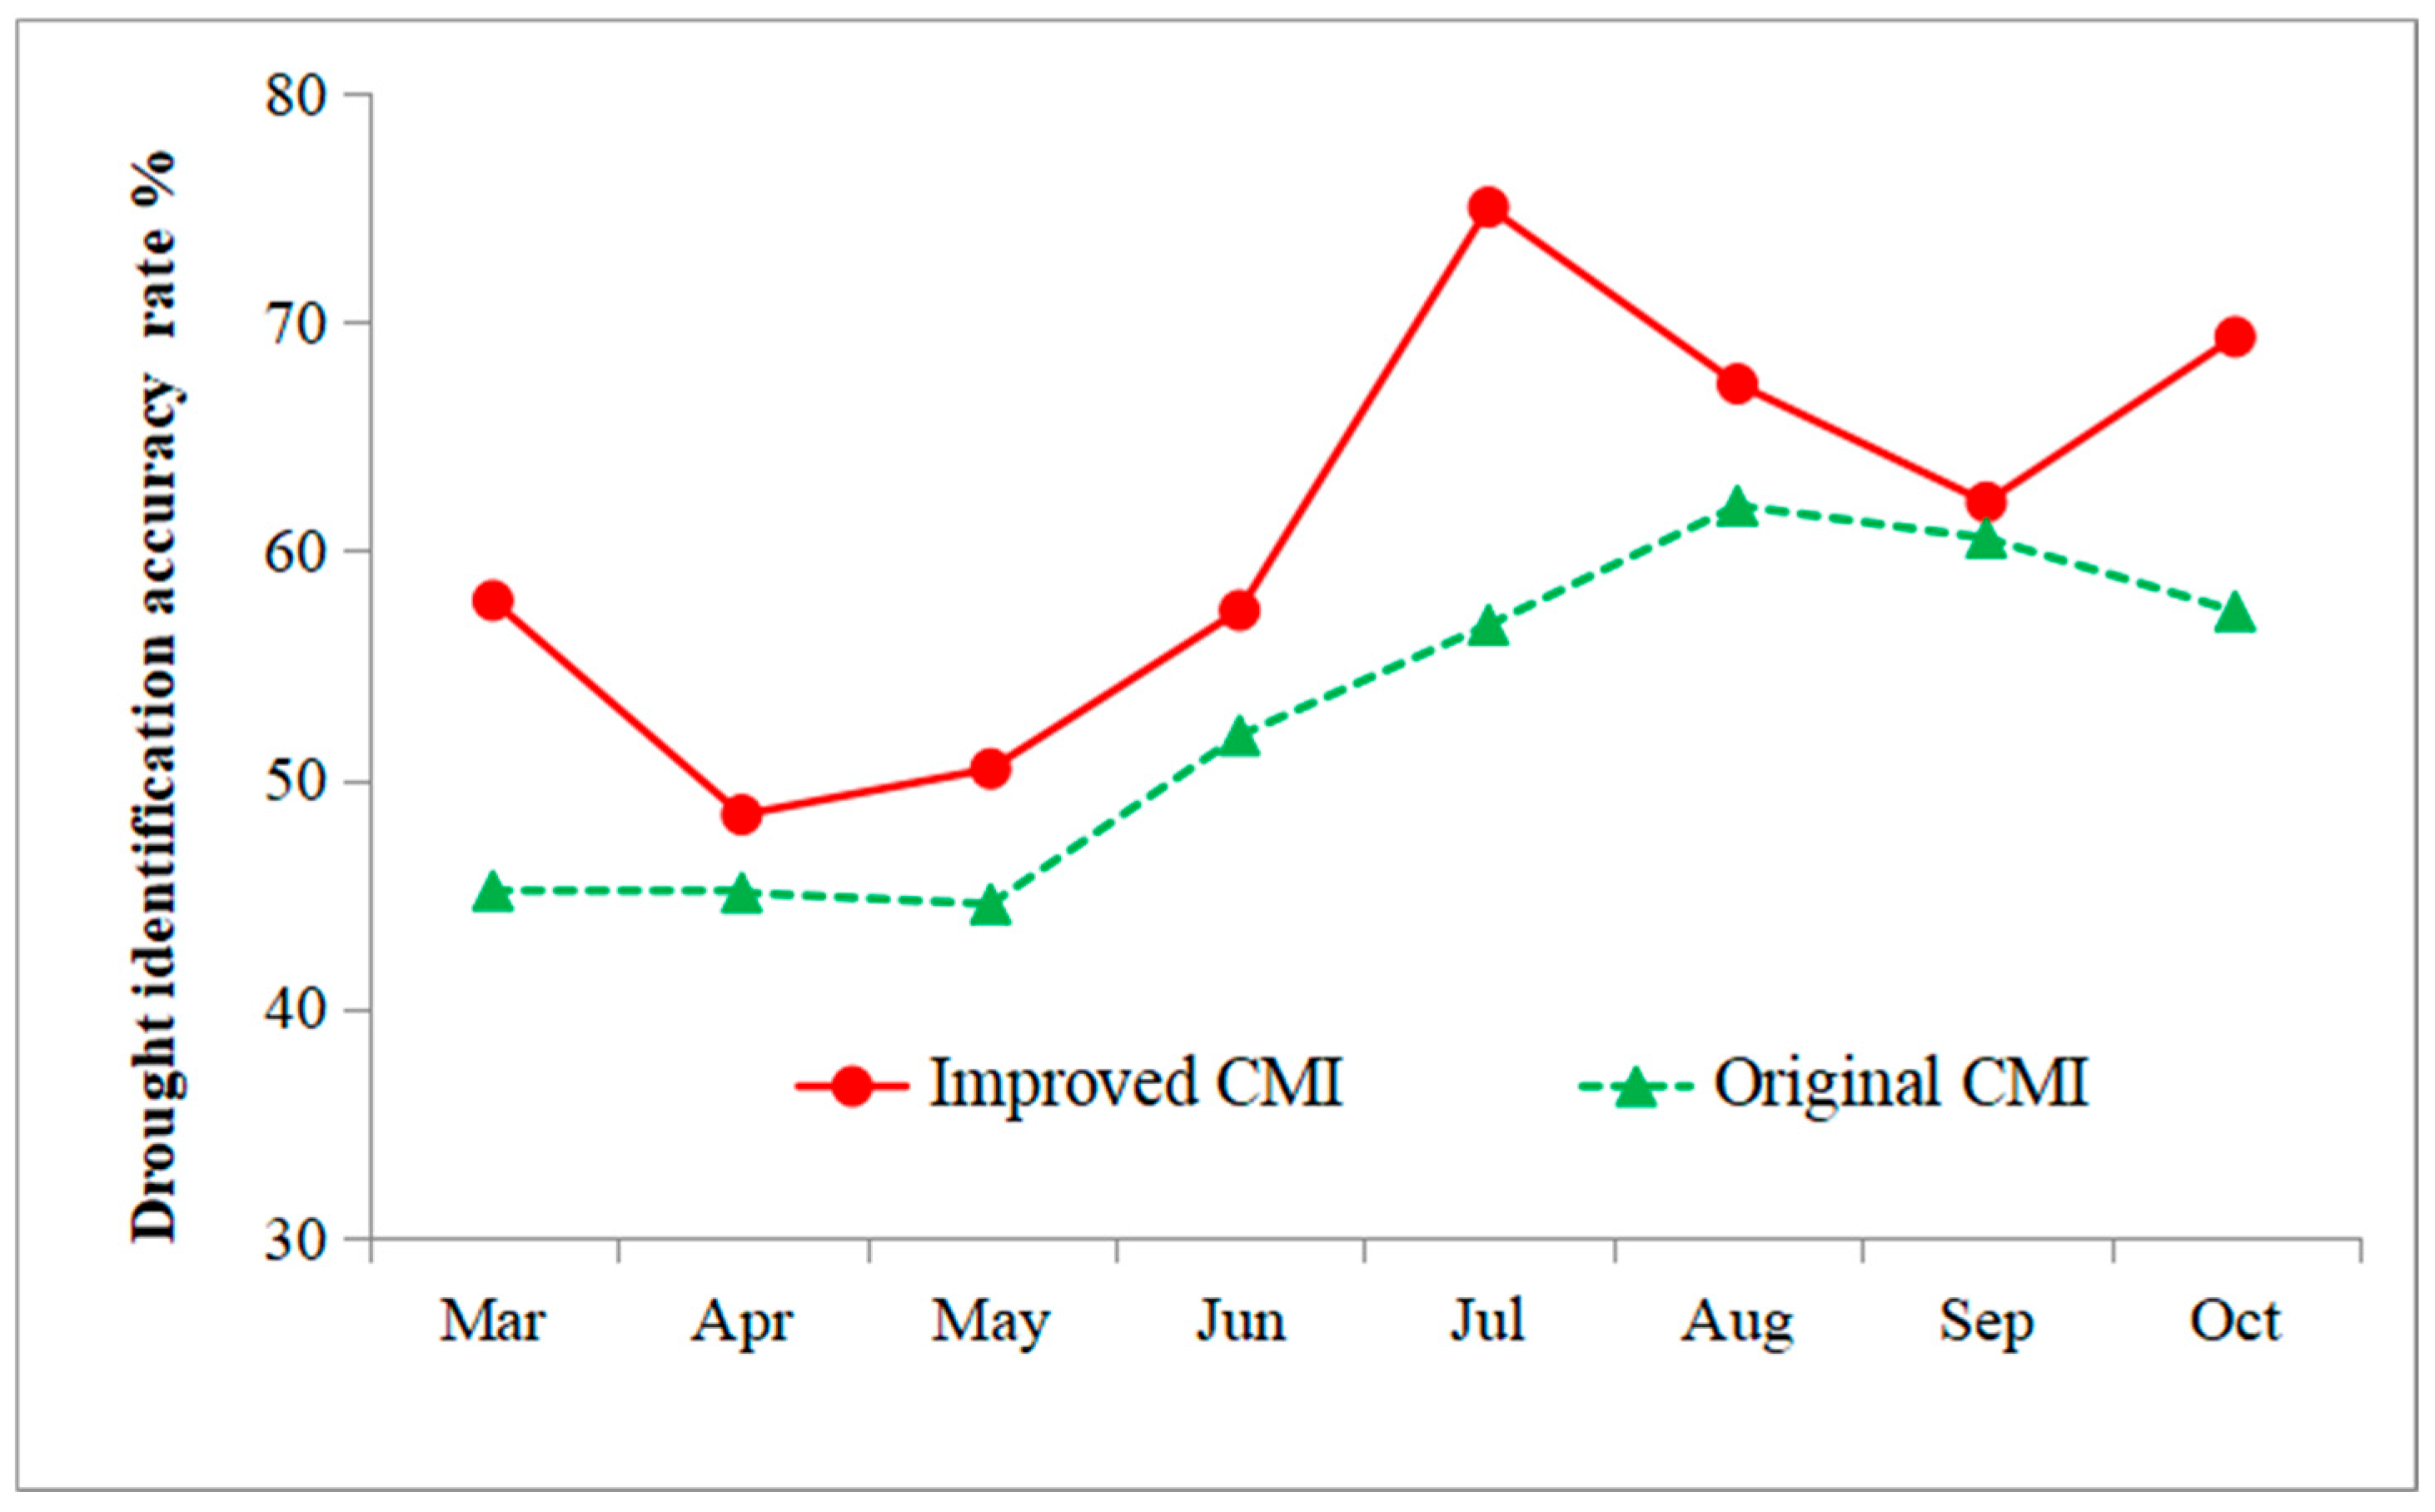
- Regarding drought identification accuracy across annual, monthly, and weekly scales, the improved CMI achieves a higher accuracy across all time scales. The annual drought identification accuracy of the original CMI is 52.2%, while the improved index reaches 61.9%, an increase of 9.7%. From July to October, the improved CMI maintains accuracy rates above 60%, whereas the original index shows high accuracy only in August and September. The original CMI yields significantly lower values than the converted RSM index annually in spring, a pattern that is inconsistent with actual conditions. In contrast, the temporal dynamics of the improved CMI align more closely with those of the converted RSM index, and its drought monitoring results correspond better with actual conditions.
- (3)
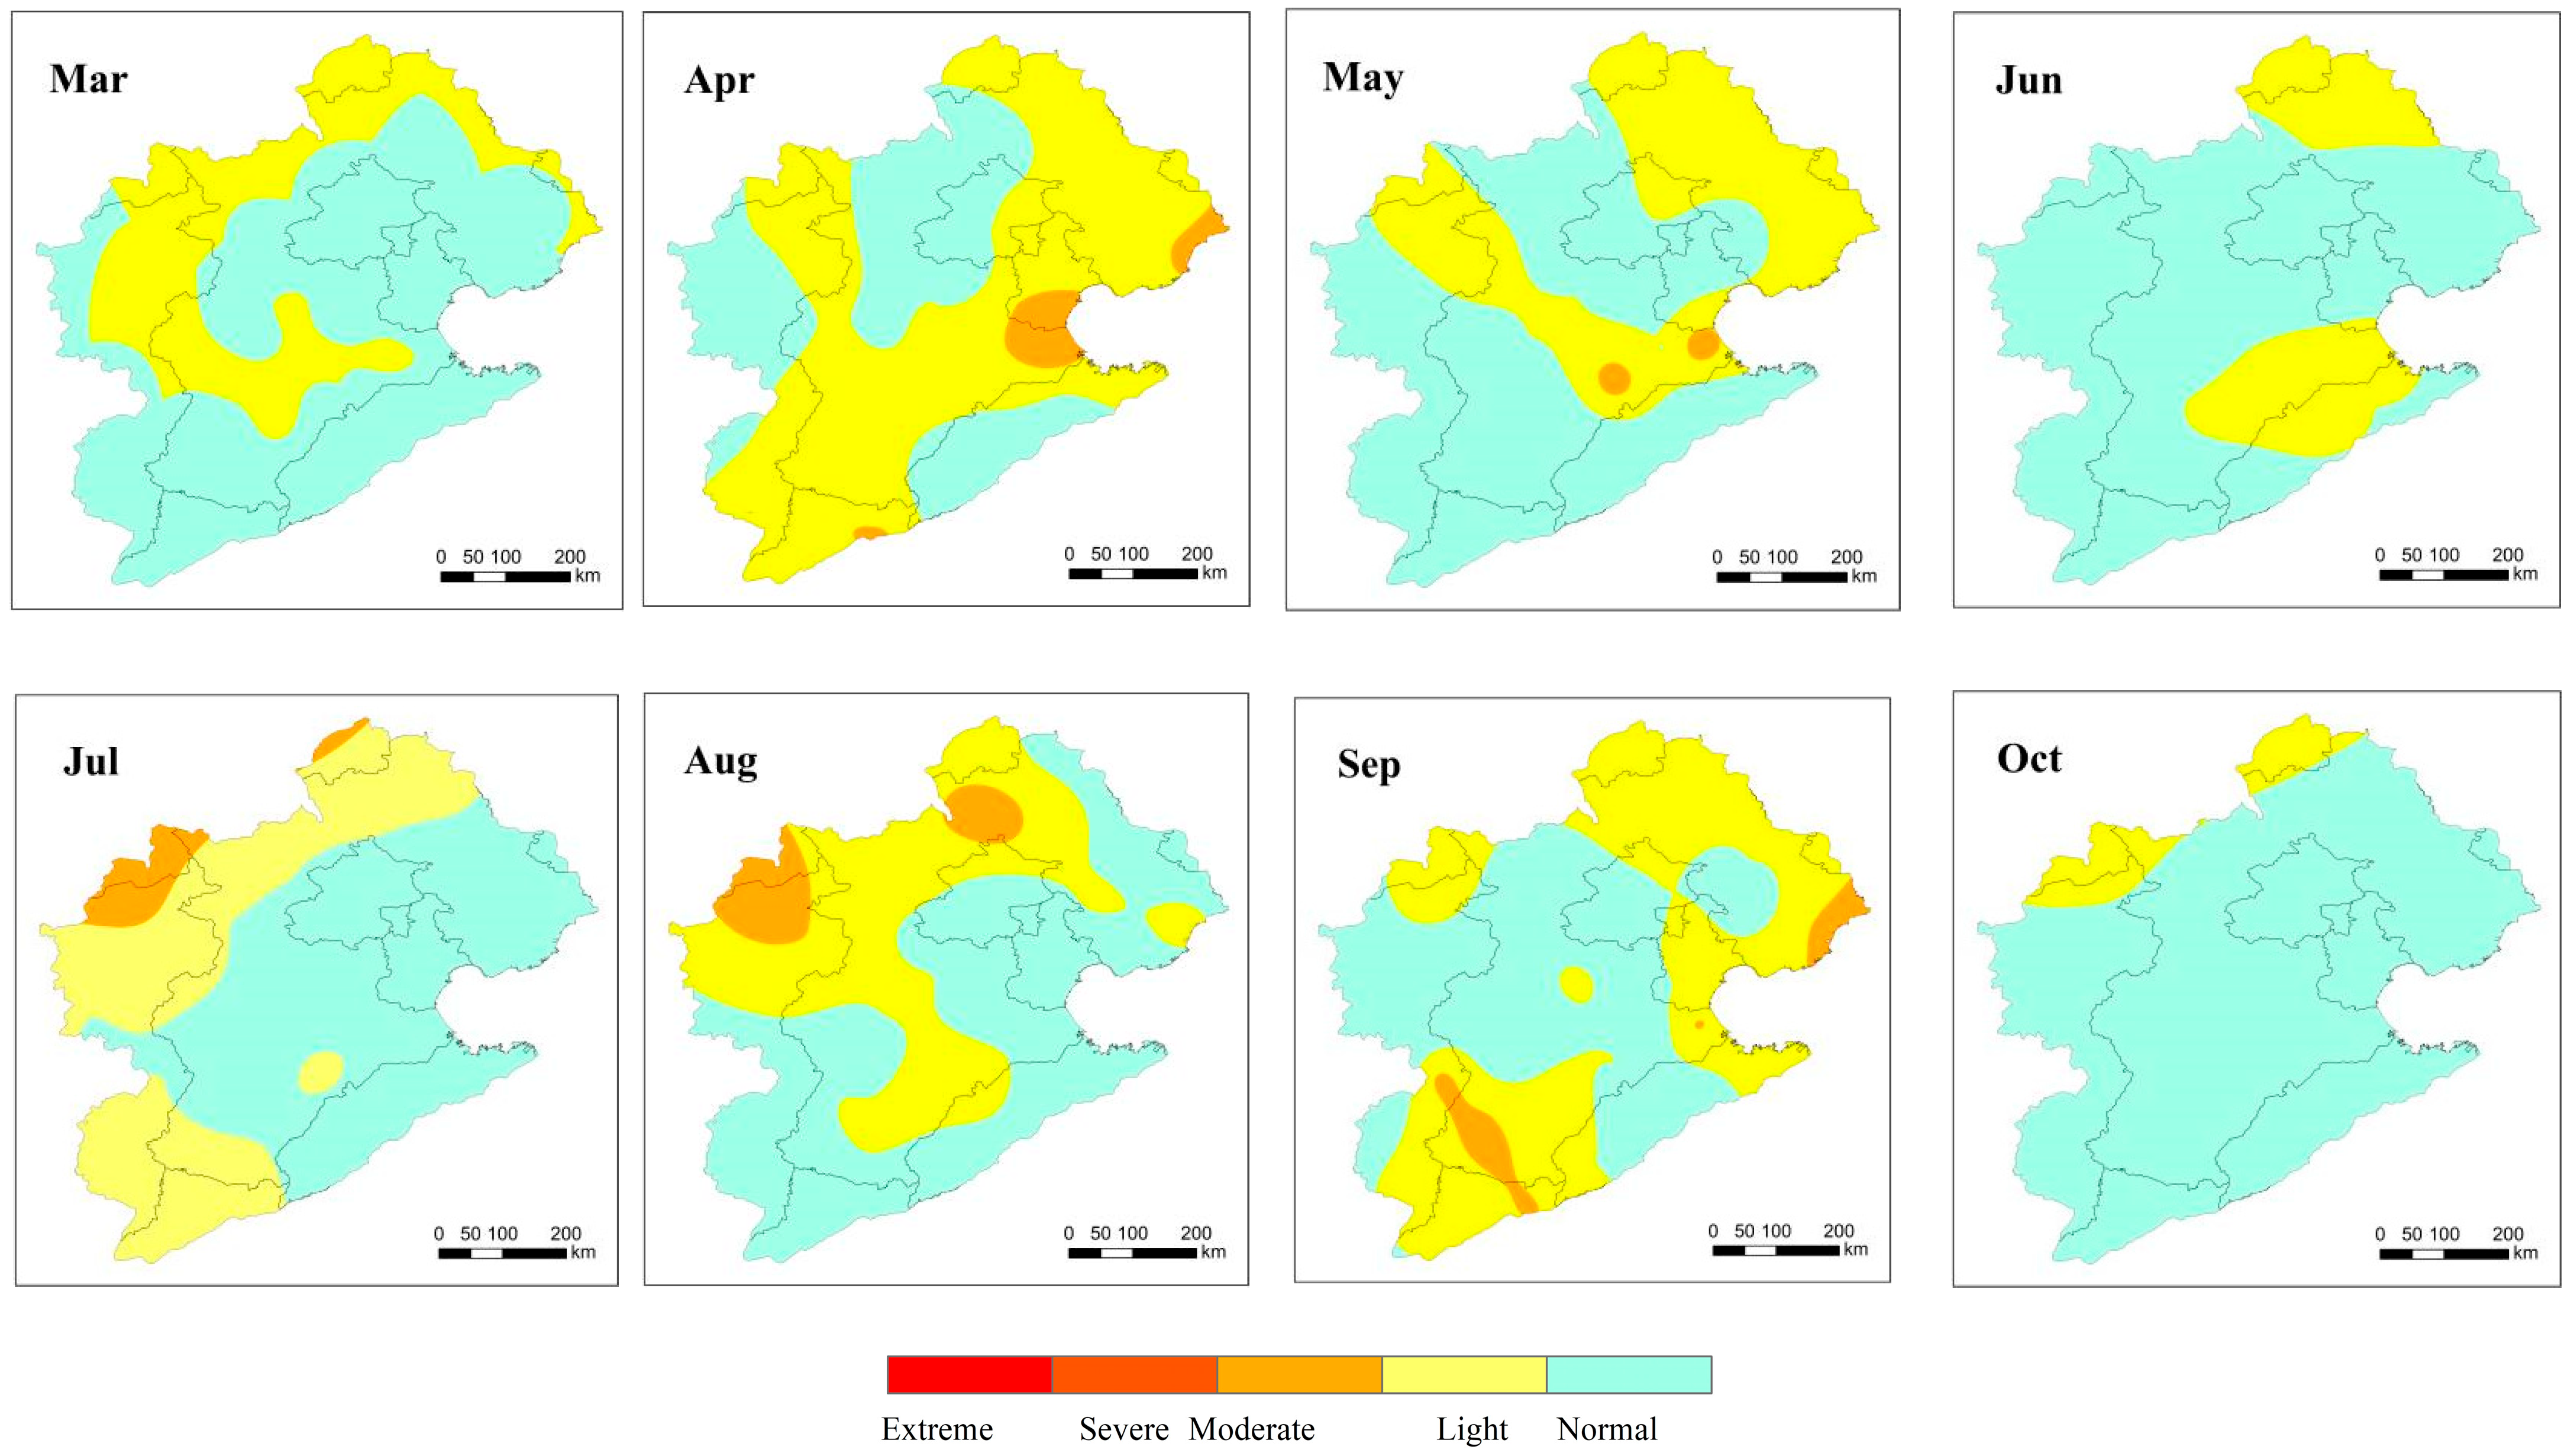
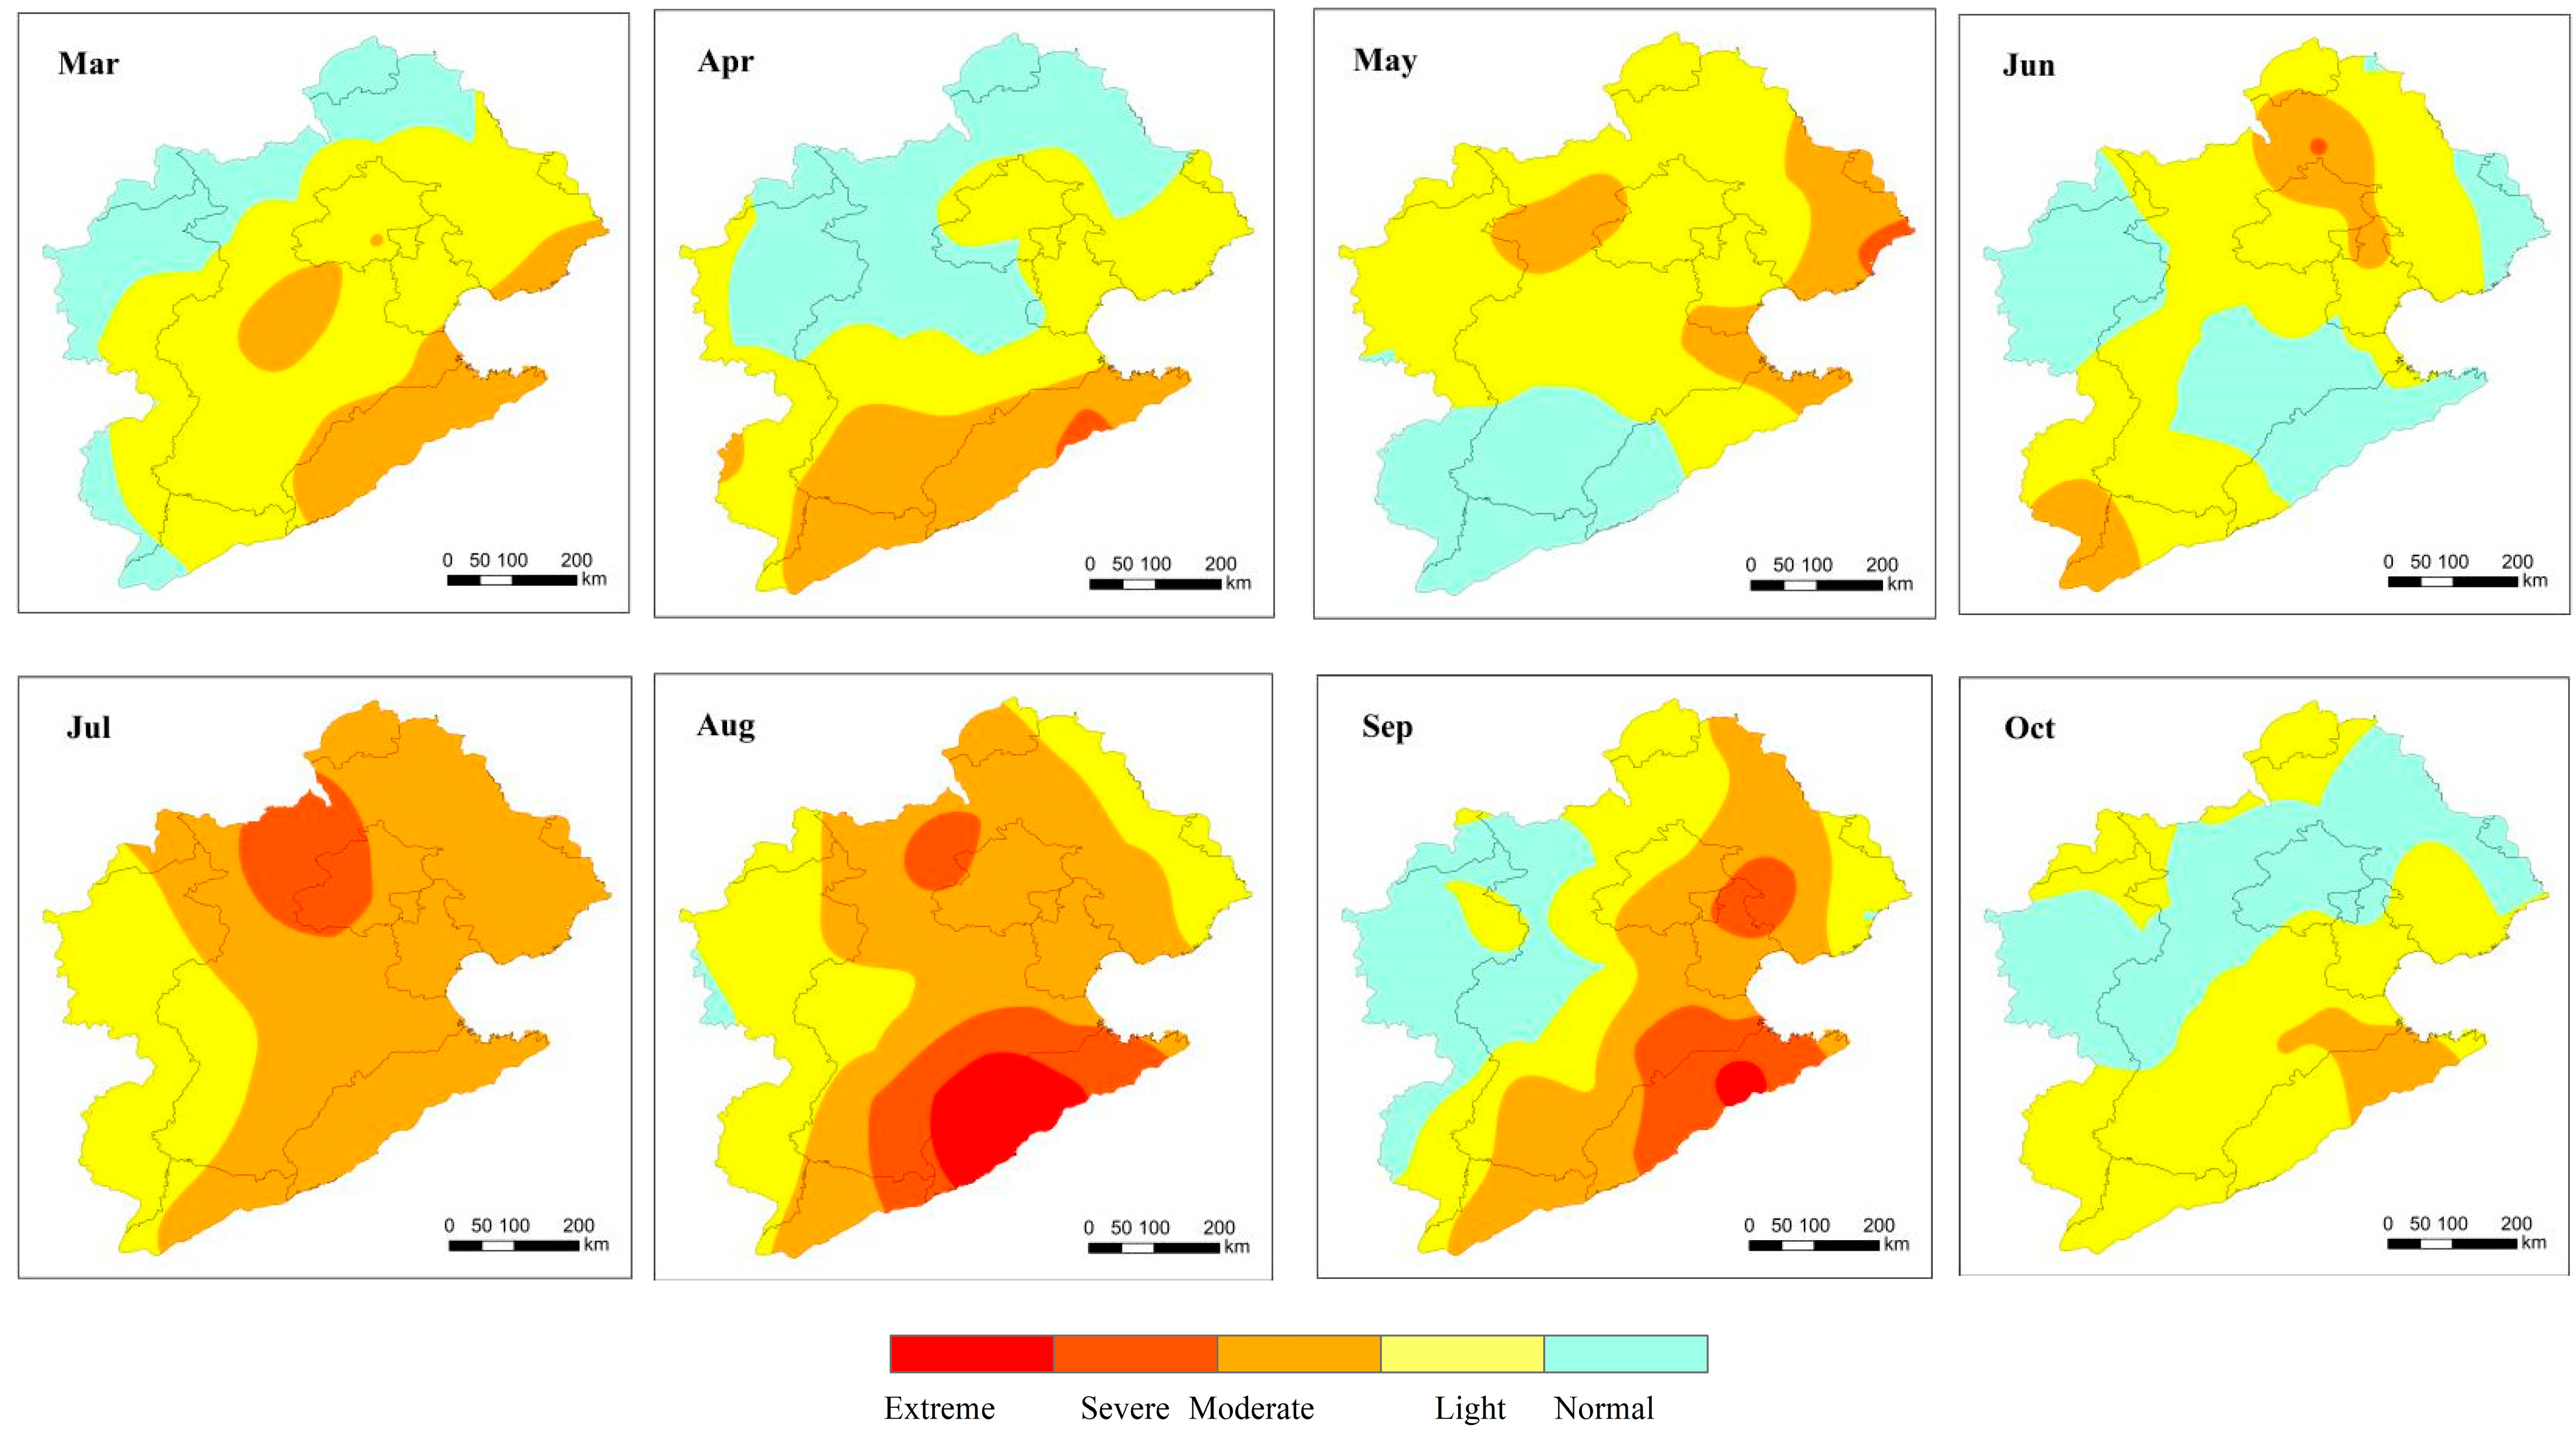
- The spatial analysis of agricultural drought revealed that the original CMI indicated large areas of moderate drought in the Hai River Basin during the spring and summer–autumn of 2002, with severe to extreme drought in the southern region—a finding that significantly deviates from observed conditions. The improved CMI offers a more accurate description of the spatial characteristics of agricultural drought and outperforms the original index by providing a more accurate characterization of agricultural drought spatial patterns.
Author Contributions
Funding
Data Availability Statement
Conflicts of Interest
References
- Ni, S.; Wang, H.; Liu, J.; Gu, Y. Characteristics and causes of agricultural drought disasters in China. Chin. Agric. Sci. Bull. 2022, 38, 106–111. (In Chinese) [Google Scholar]
- Li, Y.; Chang, J.; Fan, J.; Yu, B. Agriculaural drought evolution characteristics and driving mechanisms in the Yellow River Basin under climate and land use changes. Trans. Chin. Soc. Agric. Eng. 2021, 37, 84–93. (In Chinese) [Google Scholar]
- Zhang, Y.; Wu, Z.; Singh, V.P.; Lin, Q.; Ning, S.; Zhou, Y.; Jin, J.; Zhou, R.; Ma, Q. Agricultural drought characteristics in a typical plain region considering irrigation, crop growth, and water demand impacts. Agric. Water Manag. 2023, 282, 108266. [Google Scholar] [CrossRef]
- Li, Z.; Hao, Z.; Shi, X.; Déry, S.J.; Li, J.; Chen, S.; Li, Y. An agricultural drought index to incorporate the irrigation process and reservoir operations: A case study in the Tarim River Basin. Glob. Planet. Change 2016, 143, 10–20. [Google Scholar] [CrossRef]
- Hu, J.; Jin, M.; Shi, P. Drought vulnerability assessment of winter wheat in eastern region of Gansu Province under different irrigation levels. J. Catastrophology 2022, 37, 178–183. (In Chinese) [Google Scholar]
- Xu, J.; Ju, H.; Mei, X.; Liu, Q.; Yang, J. Simulation on potential effects of drought on winter wheat in Huang-Huai-Hai Plain from 1981 to 2010. Trans. Chin. Soc. Agric. Eng. 2015, 31, 150–158. (In Chinese) [Google Scholar]
- Lu, J.; Carbone, G.J.; Gao, P. Detrending crop yield data for spatial visualization of drought impacts in the United States, 1985–2014. Agric. For. Meteorol. 2017, 237–238, 196–208. [Google Scholar] [CrossRef]
- Li, C.; You, S.; Wu, Y.; Wang, Y. Improved crop water deficit index for monitoring drought disaster change process of spring maize in the Northeast China. Trans. Chin. Soc. Agric. Eng. (Trans. CSAE) 2019, 35, 175–185. (In Chinese) [Google Scholar]
- Wu, D. Creation of Drought Index for Winter Wheat Based on Effective Soil Moisture and Evapotranspiration on the North China Plain. Ph.D. Thesis, Nanjing University of Information Science and Technology, Nanjing, China, 2021. (In Chinese). [Google Scholar]
- Sakamoto, C.M. The Z-index as a variable for crop yield estimation. Agric. Meteorol. 1978, 19, 305–313. [Google Scholar] [CrossRef]
- Palmer, W.C. Keeping track of crop moisture conditions, nationwide: The new Crop Moisture Index. Weather Wise 1968, 21, 156–161. [Google Scholar] [CrossRef]
- Meyer, S.J.; Hubbard, K.G.; Wilhite, D.A. A Crop-Specific Drought Index for maize: I. Model Development and Validation. Agron. J. 1993, 85, 388–395. [Google Scholar] [CrossRef]
- Narasimhan, B.; Srinivasan, R. Development and evaluation of Soil Moisture Deficit Index (SMDI) and Evapotranspiration Deficit Index (ETDI) for agricultural drought monitoring. Agric. For. Meteorol. 2005, 133, 69–88. [Google Scholar] [CrossRef]
- Huang, W.; Yang, X.; Qu, H.; Feng, L.; Huang, B.; Wang, J.; Shi, S.; Wu, Y.; Zhang, X.; Xiao, X.; et al. Analysis of spatio-temporal characteristic on seasonal drought of spring maize based on crop water deficit index. Trans. Chin. Soc. Agric. Eng. (Trans. CSAE) 2009, 25, 28–34. (In Chinese) [Google Scholar]
- Hao, Z.; Aghakouchak, A. A Nonparametric Multivariate Multi-Index Drought Monitoring Framework. J. Hydrometeorol. 2014, 15, 89–101. [Google Scholar] [CrossRef]
- Shafer, B.A.; Dezman, L.E. Development of a Surface Water Supply Index (SWSI) to assess the severity of drought conditions in snowpack runoff areas. In Proceedings of the Western Snow Conference, Reno, Nevada, 19–23 April 1982; Colorado State University: Fort Collins, CO, USA, 1982; pp. 164–175. [Google Scholar]
- Kogan, F.N. Droughts of the late 1980s in the United States as derived from NOAA polar-orbiting satellite data. Bull. Am. Meteorol. Soc. 1995, 76, 655–668. [Google Scholar] [CrossRef]
- Palmer, W.C. Meteorological Drought; U.S. Department of Commerce Weather Bureau Research Paper; U.S. Department of Commerce, Weather Bureau: Washington, DC, USA, 1965.
- Ye, J.; Shen, S.; Lu, H. Application of modified palmer drought severity index in agricultural drought monitoring. Chin. J. Agro-Meteorol. 2009, 30, 257–261. (In Chinese) [Google Scholar]
- Kang, J.; Zi, X.; Wang, S.; He, L. Evaluation and Optimization of Agricultural Water Resources Carrying Capacity in Haihe River Basin, China. Water 2019, 11, 999. [Google Scholar] [CrossRef]
- Li, H.; Wang, Q.; Zuo, M.; Long, X.; Zang, X. Scale effects and driving mechanisms of flood in a multilevel sub-basin perspective—A case study of Haihe River Basin, China. Environ. Impact Assess. Rev. 2025, 115, 107984. [Google Scholar] [CrossRef]
- Zhao, A.; Zhang, W.; Zou, L.; Cao, S.; Yue, Y.; Sa, Q. Characteristics of propagation from meteorological to hydrological drought under natural conditions in the Haihe River Basin of China: Time, probability, and threshold. J. Hydrol. Reg. Stud. 2025, 59, 102359. [Google Scholar] [CrossRef]
- Yang, M.; Xiao, W.; Zhao, Y.; Li, X.; Lu, F.; Lu, C.; Chen, Y. Assessing Agricultural Drought in the Anthropocene: A Modified Palmer Drought Severity Index. Water 2017, 9, 725. [Google Scholar] [CrossRef]
- Wang, A.; Shi, X. A Multilayer Soil Moisture Dataset Based on the Gravimetric Method in China and Its Characteristics. J. Hydrometeorol. 2019, 20, 1721–1736. [Google Scholar] [CrossRef]
- Shang, S.; Mao, X.; Lei, Z.; Yang, S. Simulation Model on Soil Water Dynamics and Its Application; Science Press: Beijing, China, 2009. (In Chinese) [Google Scholar]
- Allen, R.G.; Pereira, L.S.; Raes, D.; Smith, M. Crop Evapotranspiration: Guidelines for Computing Crop Water Requirements. Irrigation and Drainage Paper No. 56; Food and Agriculture Organization of the United Nations (FAO): Rome, Italy, 1998. [Google Scholar]
- Thomas, J.; Jack, K. The Crop Moisture Index Unnatural Response to Changes in Temperature. J. Appl. Meteorol. 1978, 17, 1864–1866. [Google Scholar] [CrossRef]
- Thornthwaite, C.W. An approach toward a rational classification of climate. Geogr. Rev. 1948, 38, 55–94. [Google Scholar] [CrossRef]
- Trajkoric, S. Temperature-based approaches for estimating reference evapotranspiration. J. Irrig. Drain. Eng. 2005, 131, 316–325. [Google Scholar] [CrossRef]
- Li, Y.; Wang, W.; Wang, G.; Liu, C.; Zheng, H.; Ma, Z. The applicability of various potential evapotranspiration estimation methods in the headwater area of the Yellow River. Hydrogeol. Eng. Geol. 2021, 48, 10–19. (In Chinese) [Google Scholar]
- Liu, X.; Li, Y.; Wang, Q. Evaluation on several temperature-based methods for estimating reference crop evapotranspiration. Trans. Chin. Soc. Agric. Eng. (Trans. CSAE) 2006, 22, 12–18. (In Chinese) [Google Scholar]
- Liu, Z.; Yan, A.; Qiao, C. Research on application pf Palmer drought model in Jinghuiqi irrigation area. Agric. Res. Arid. Areas 2010, 28, 259–264. (In Chinese) [Google Scholar]
- Xiao, J.; Liu, Z.; Liu, X.; Liu, Z.; Chen, Y. Analysis and study on irrigation problem of main spring maize area in China. Water Sav. Irrig. 2010, 4, 1–7. (In Chinese) [Google Scholar]
- GB/T 32136-2015; Grade of Agricultural Drought. Standards Press of China: Beijing, China, 2015. (In Chinese)
- Zou, X.; Zhai, P.; Zhang, Q. Variations in droughts over China: 1951–2003. Geophys. Res. Lett. 2005, 32, 353–368. [Google Scholar] [CrossRef]
- Rong, Y.; Duan, L.; Xu, M. Analysis on Climatic diagnosis of Persistent drought in North China during the period from 1997 to 2002. Arid. Zone Res. 2008, 25, 842–850. (In Chinese) [Google Scholar]
- Gu, R.; Tang, Z. Analysis of the Cause of Drought in Shandong in the Summer 2002. Meteorol. Mon. 2004, 30, 22–26. (In Chinese) [Google Scholar]
- Feng, J.; Wang, Z. A review on evapotranspiration estimation models using remotely sensed data. J. Hydraul. Eng. 2012, 39, 914–925. (In Chinese) [Google Scholar]
- Zhou, L.; Wu, J.; Zhang, J. Remote sensing-based drought monitoring approach and research progress. Sci. Geogr. Sin. 2015, 35, 630–636. (In Chinese) [Google Scholar]
- Liang, X.; Wang, X.; Zhao, X.; Cao, T. Drought resistance comparison of main maize varieties in west semiarid areas of jilin province. Mol. Plant Breed. 2018, 16, 4466–4472. (In Chinese) [Google Scholar]




| Drought Grade | CMI a | RSM (%) b | ||
|---|---|---|---|---|
| Clay | Loam | Sand | ||
| Normal | ≥0.0 | ≥55 | ≥60 | ≥65 |
| Light drought | 0.0~−0.99 | 45~55 | 50~60 | 55~65 |
| Moderate drought | −1.00~−1.99 | 35~45 | 40~50 | 45~55 |
| Severe drought | −2.00~−2.99 | 25~35 | 30~40 | 35~45 |
| Extreme drought | ≤−3.00 | <25 | <30 | <35 |
Disclaimer/Publisher’s Note: The statements, opinions and data contained in all publications are solely those of the individual author(s) and contributor(s) and not of MDPI and/or the editor(s). MDPI and/or the editor(s) disclaim responsibility for any injury to people or property resulting from any ideas, methods, instructions or products referred to in the content. |
© 2025 by the authors. Licensee MDPI, Basel, Switzerland. This article is an open access article distributed under the terms and conditions of the Creative Commons Attribution (CC BY) license (https://creativecommons.org/licenses/by/4.0/).
Share and Cite
Yang, M.; Li, X.; Xu, J.; Jing, H.; Zhang, X.; Sang, L. Evaluating Agricultural Drought in the Haihe River Basin Using an Improved Crop Moisture Index. Water 2025, 17, 3372. https://doi.org/10.3390/w17233372
Yang M, Li X, Xu J, Jing H, Zhang X, Sang L. Evaluating Agricultural Drought in the Haihe River Basin Using an Improved Crop Moisture Index. Water. 2025; 17(23):3372. https://doi.org/10.3390/w17233372
Chicago/Turabian StyleYang, Mingzhi, Xinyang Li, Jijun Xu, Huan Jing, Xinyi Zhang, and Lianhai Sang. 2025. "Evaluating Agricultural Drought in the Haihe River Basin Using an Improved Crop Moisture Index" Water 17, no. 23: 3372. https://doi.org/10.3390/w17233372
APA StyleYang, M., Li, X., Xu, J., Jing, H., Zhang, X., & Sang, L. (2025). Evaluating Agricultural Drought in the Haihe River Basin Using an Improved Crop Moisture Index. Water, 17(23), 3372. https://doi.org/10.3390/w17233372


