Article

Evaluating Agricultural Drought in the Haihe River Basin Using an Improved Crop Moisture Index

1
Hubei Key Laboratory of Water Resources & Eco-Environmental Sciences, Changjiang River Scientific Research Institute, Wuhan 430010, China
2
Research Center on the Yangtze River Economic Belt Protection and Development Strategy, Wuhan 430010, China
3
School of Civil Engineering, Tianjin University, Tianjin 300354, China
4
College of Water Conservancy and Hydropower Engineering, Hohai University, Nanjing 210098, China
*
Authors to whom correspondence should be addressed.
Water 2025, 17(23), 3372; https://doi.org/10.3390/w17233372
Submission received: 4 September 2025 / Revised: 3 November 2025 / Accepted: 22 November 2025 / Published: 26 November 2025
(This article belongs to the Section Water, Agriculture and Aquaculture)

Abstract

In large irrigated agricultural regions under intensive human management, irrigation profoundly influences agricultural drought dynamics. High-frequency irrigation markedly alters natural farmland soil moisture, causing traditional drought indices to distort the actual severity of human-modified agricultural drought and leading to substantial monitoring deviations. In this work, an improved agricultural drought index based on the Crop Moisture Index (CMI) was developed to accurately characterize drought conditions, using the Haihe River Basin as a case study. The CMI’s water balance equation was revised by incorporating an auto-irrigation threshold method with crop coefficients and water stress coefficients. Furthermore, the improved CMI explicitly models irrigation by defining auto-irrigation thresholds based on the critical growth stages of the main crops. The performance of the original and improved CMI was evaluated by comparing their simulated soil moisture and drought detection accuracy against benchmark data derived from measurements across yearly, monthly, and weekly scales. The spatial evolution of a major 2002 drought in North China was also reconstructed to assess the indices’ performance. The results showed that: (1) The revised soil water balance equation achieved significantly lower relative errors than the original equation across all time scales; (2) The improved CMI consistently demonstrated higher drought identification accuracy rates than the original CMI; (3) Drought patterns monitored by the improved CMI showed superior alignment with actual conditions, confirming that it has enhanced applicability for agricultural drought assessment and demonstrates clear advantages for drought assessment in large-scale irrigated agriculture. This work provides crucial insights into the driving mechanisms of agricultural drought under intense human interventions and offers valuable guidance for drought risk management in major agricultural zones.

1. Introduction

China, situated within the Asian monsoon hydro-climatic regime, exhibits pronounced spatiotemporal heterogeneity in precipitation distribution, leading to recurrent drought extremes. This positions China among the region’s most severely impacted nations by drought-induced agricultural losses globally [1]. Statistical records indicate that during 1949–2019, China experienced 55 years with mild or worse droughts, 26 years with severe or worse droughts, and 13 years of extreme droughts. Furthermore, global warming has contributed to intensified climatic variability across China, manifesting in an observable trend of increasing frequency and intensity of extreme drought events. Research reveals that agricultural drought disasters have accounted for over 50% of total agricultural losses attributed to natural hazards in China over the past two decades [2]. Consequently, the accurate monitoring of drought onset and evolution is critical for agricultural production and food security.
Agricultural drought is defined by the balance between water supply and demand during the crop growth period, with soil moisture content typically serving as a crucial research subject to intuitively reflect the water supply status of crops [3]. Agricultural drought is closely related to meteorological conditions, soil moisture, irrigation activities, and crop growth stages, and its generation mechanism and evolution process are influenced by the combined effects of these factors [4]. Among them, farmland irrigation plays a vital role in agricultural production and has become a routine agricultural management practice to ensure China’s grain production. These irrigation practices, which involve precise timing and quantity of water application, alter the spatiotemporal patterns of soil moisture availability. This hydraulic control during critical crop growth stages fundamentally modifies the manifestation of agricultural drought, typically resulting in delayed onset, reduced intensity, and accelerated recovery. Due to the influence of agricultural irrigation on soil moisture, the evaluation results of drought indices do not necessarily reflect the actual agricultural drought disaster situation [5,6]. Lu et al. [7] found that for irrigated farmlands or areas with shallow groundwater levels, drought indices tend to overestimate the drought situation due to additional water supply. Li et al. [8] discovered a significant discrepancy between drought monitoring results and actual conditions in areas with irrigation facilities when studying the spring maize drought in the Northeast region in 2018. Wu proposed that precipitation is not the sole source of water for farmland crops, and irrigation serves as an additional water supply. If only precipitation is considered in the construction of drought indices, the intensity of agricultural drought will be overestimated [9]. Hu et al. [5] investigated the relationship between drought frequency, drought losses, and irrigation levels in winter wheat and found that irrigation can effectively reduce agricultural drought losses. Specifically, under a 75% water requirement irrigation level, an average of 1 mm of irrigation water can reduce drought losses by 0.2%.
Numerous agricultural drought indices based on soil moisture have been developed, including, but not limited to, the Palmer Z-Index [10], Crop Moisture Index (CMI) [11], Crop-Specific Drought Index (CSDI) [12], Soil Moisture Deficit Index (SMDI) [13], Crop Water Deficit Index (CWDI) [14], and Standardized Soil Moisture Index (SSMI) [15], the Surface Water Supply Index (SWSI) [16], the Vegetation Condition Index (VCI) [17].
These indices primarily rely on meteorological conditions and are capable of evaluating agricultural drought conditions caused by soil moisture deficits. However, agricultural irrigation, like precipitation and other meteorological factors, is also an extremely important factor affecting the changes in agricultural drought conditions. Most of the above indices fail to reflect the replenishment of soil moisture by agricultural irrigation and are thus prone to misjudgment of the actual drought situation [5,6].
The Crop Moisture Index (CMI) is an agricultural drought index based on average weekly temperatures and precipitation that was developed by W.C. Palmer in 1965, based on the Palmer Drought Severity Index (PDSI) [18]. The index is founded on the concept of “Climatically Appropriate for Existing Condition Precipitation” (CAFEC), which was previously proposed, and introduces the concept of “potential evapotranspiration appropriate for existing climatic conditions.” By comparing this “expected” value with the actual evapotranspiration, the resulting evapotranspiration anomaly deficit reflects the current soil moisture status. Thus, it establishes a systematic method for analyzing the severity of agricultural drought and determining the duration of drought. The CMI is underpinned by a rigorous systematic framework that comprehensively accounts for evapotranspiration, runoff, and soil moisture balance, including the influence of antecedent soil moisture conditions on drought. Derived from the soil water balance principle, the CMI has a clear physical meaning, provides a reasonable description of drought characteristics, and offers good spatiotemporal comparability. To date, the CMI has been adopted by the United States Department of Agriculture and is published in the Weather and Crop Bulletin (WWCB) as an indicator of meeting short-term crop water requirements [19].
While meteorological factors like precipitation and temperature are the primary drivers of agricultural drought, irrigation is also a critical factor influencing its dynamics. Both irrigation and precipitation need to be converted into soil water before they can be absorbed by crops. Crops obtain the water needed for growth and development by absorbing soil moisture through their root systems, which greatly affects the dynamics and transformation of soil moisture. This critical role of irrigation is not adequately captured by the traditional CMI. To improve the accuracy of agricultural drought assessment and the timeliness of agricultural drought monitoring, this study takes the Hai River Basin as the research object. Based on the basic principles of the CMI, combined with the characteristics of agricultural drought and the basic features of irrigated agriculture, the soil water balance model in the original model is modified. The crop coefficient and water stress coefficient are introduced in the evapotranspiration calculation, and the irrigation term is introduced in the soil moisture calculation process to increase the sensitivity to the dynamic changes in farmland soil moisture, so that the drought change monitoring results are more in line with reality and provide support for agricultural drought monitoring and assessment as well as drought prevention and disaster reduction in the Hai River Basin.

2. Description of the Study Area

The Haihe River Basin is located in Northern China between 112 and 120° E and 35–45° N (Figure 1), encompassing the provinces and municipalities of Beijing, Tianjin, Hebei, Henan, Shandong, and Shanxi. It covers a total area of approximately 320,600 km2, which accounts for about 3.3% of China’s total land area [20,21]. The basin is characterized by a dense population, a developed economy, and a long history of agricultural reclamation. It contains over 10 million hectares of arable land, which constitutes approximately 10% of the national total, and serves as one of China’s most important agricultural regions for grain production, particularly wheat and maize. The main cropping pattern is a double-cropping system of winter wheat and summer maize in the plains (with spring maize predominantly grown in the mountainous areas). Typically, winter wheat is sown in early October and harvested in early June of the following year; summer maize is sown in mid-to-late June and harvested in late September of the same year; spring maize is sown in mid-to-late April to early May and harvested in mid-to-late September of the same year. To achieve optimal yields, wheat typically requires 4–5 irrigation events per growing season, while maize requires 2–3, aimed at replenishing soil water deficits. The region has a continental monsoon climate, characterized by an annual precipitation of 400–900 mm [22]. This precipitation is highly variable interannually and unevenly distributed both spatially and temporally. During the spring, a critical growth period for winter wheat and spring maize, precipitation is often below 100 mm, substantially below crop water requirements, leading to frequent drought stress. Therefore, agricultural irrigation is an indispensable practice to ensure normal crop development and achieve stable grain yields.

3. Data and Methodology

3.1. Data Sources

(a)
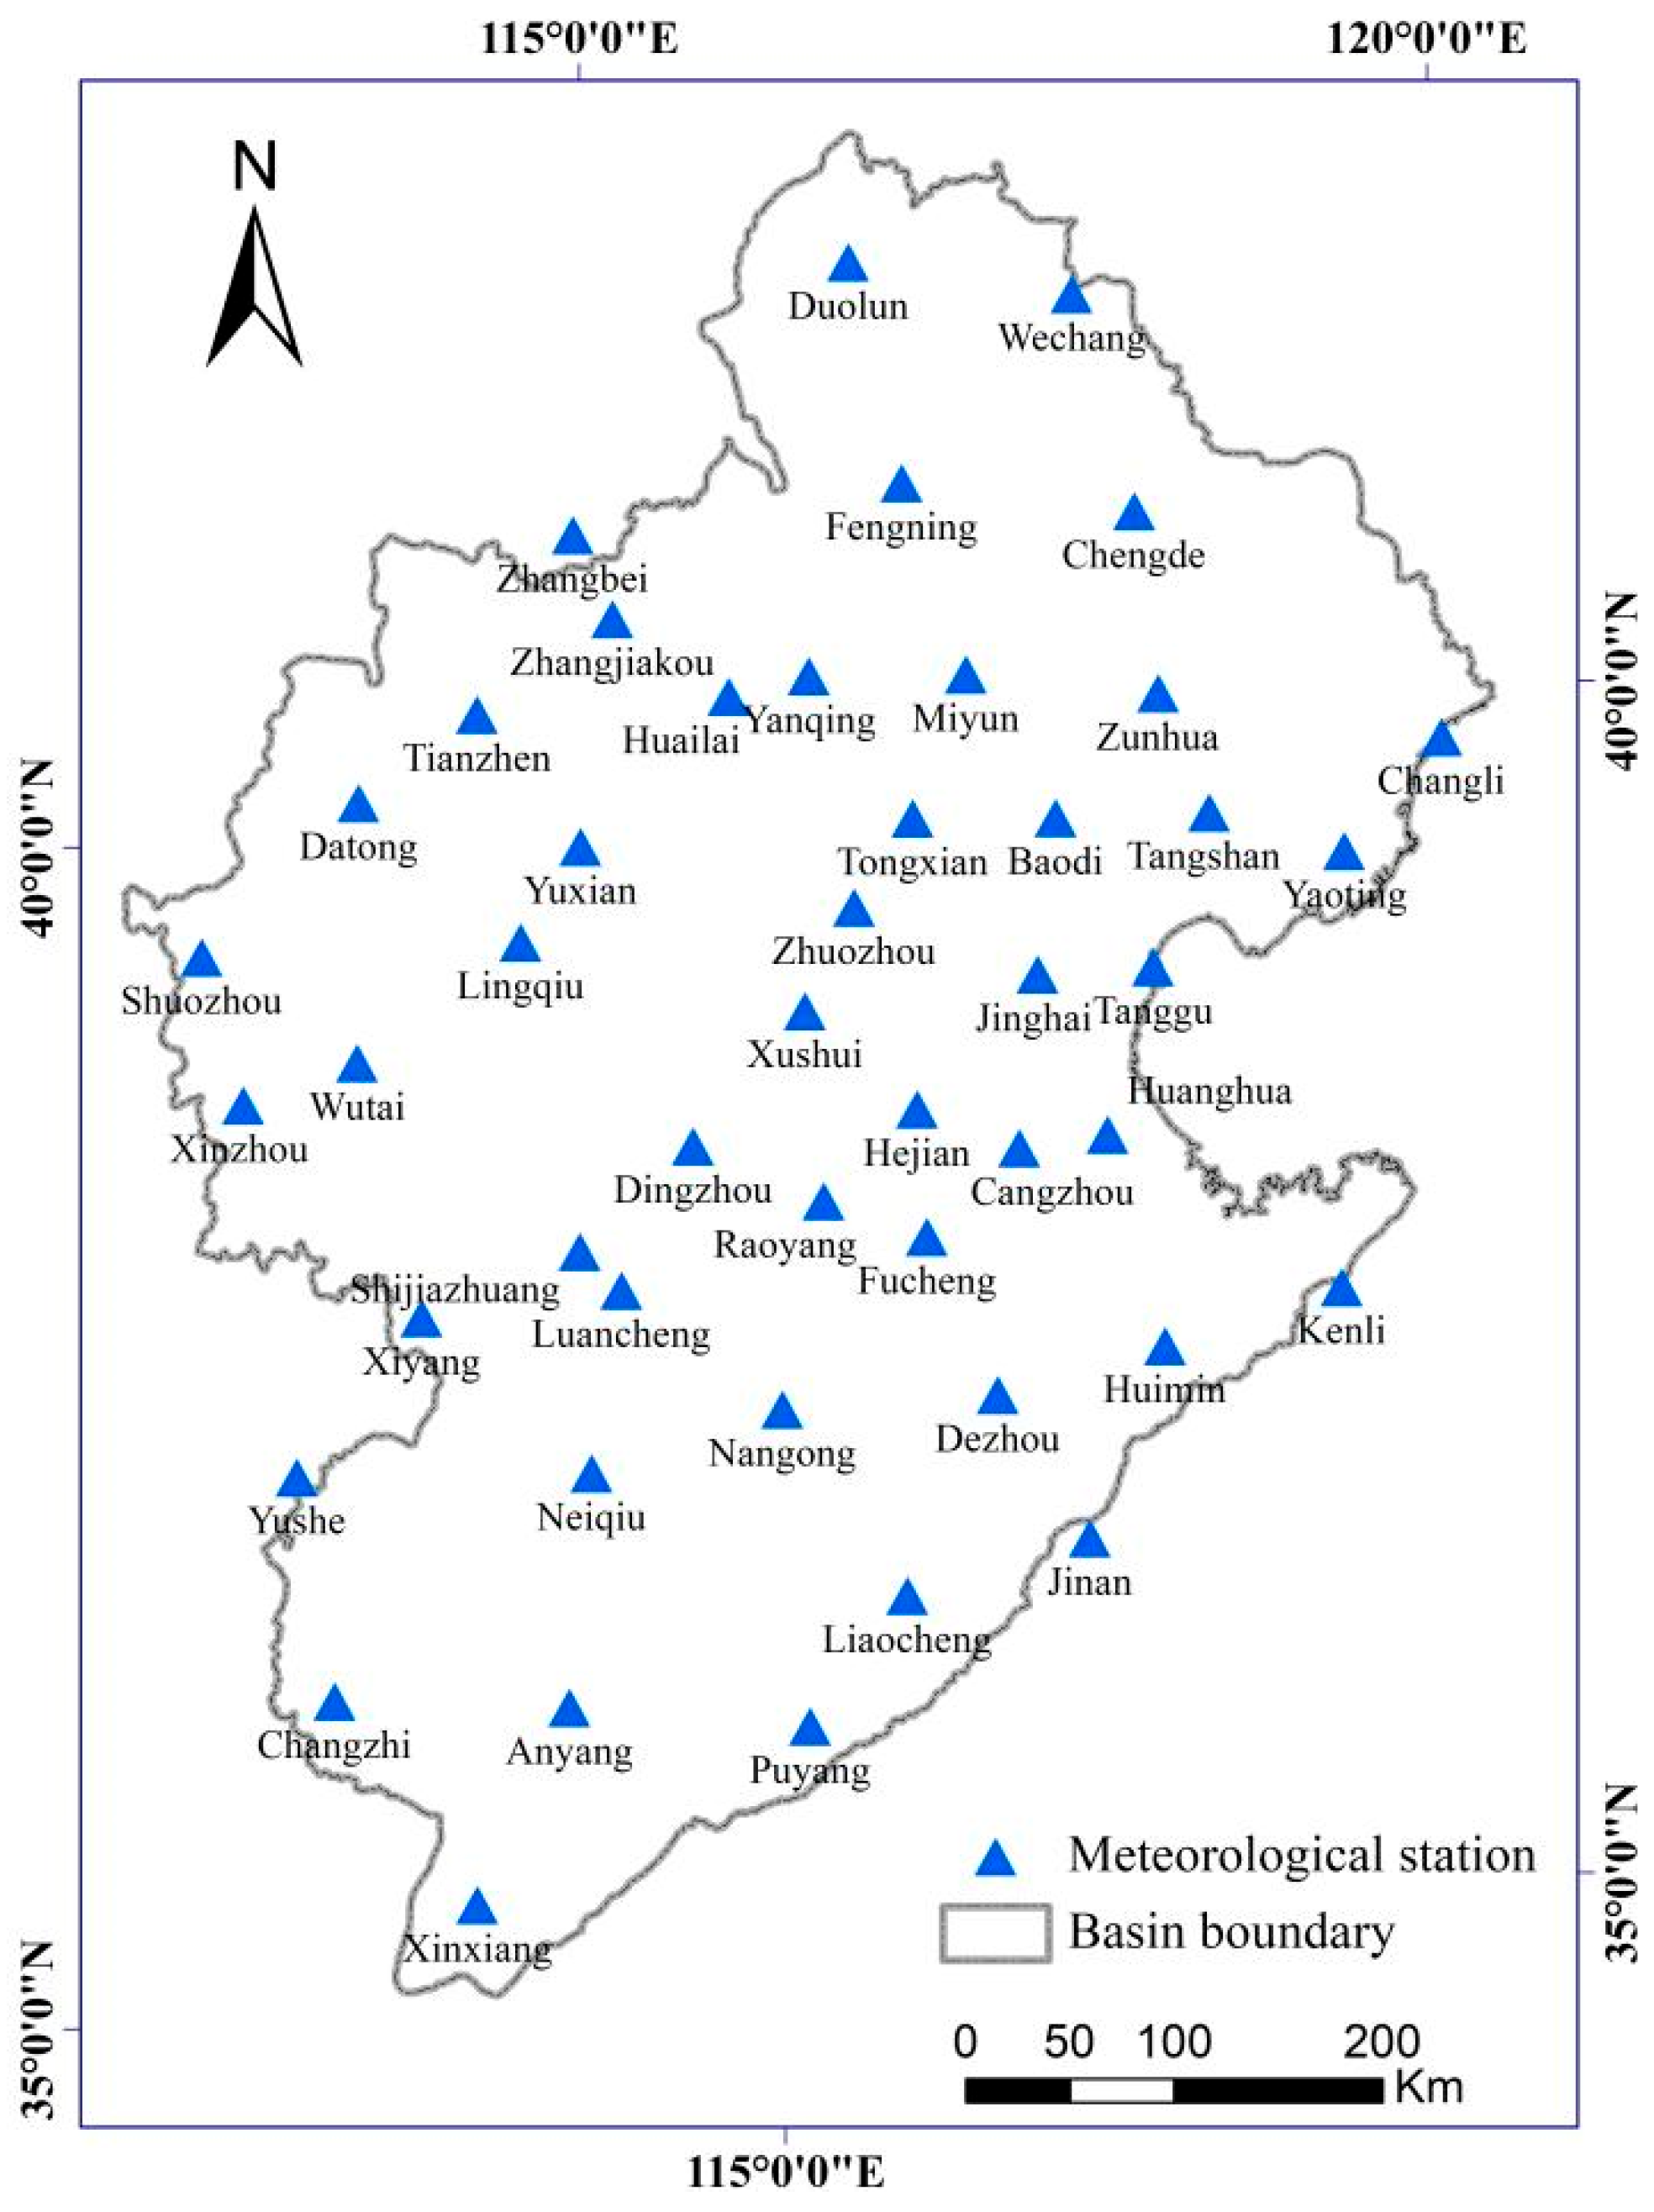
Daily time series of precipitation, relative humidity, wind speed, sunshine duration, and minimum and maximum air temperature of 47 meteorological stations from 1985 to 2012 were used in this study (Figure 2). Data were collected from the China Meteorological Data Service Centre (http://data.cma.cn/).
(b)
Soil data including soil layer depth, saturated water content, field capacity, and wilting point, were provided by the China Soil Science Database (http://vdb3.soil.csdb.cn/).
(c)
Crop parameters, including the main crop types and their growth-stage-specific coefficients, were compiled from relevant literature (Table 1).
(d)
Irrigation data for the study area, including crop type, irrigation frequency, and water volume, were obtained from Yang et al. [23].
(e)
Soil moisture data, including soil water content within the top 1 m depth from 1992 to 2013, were obtained from Wang et al. [24]. The soil profile was divided into five layers at depths of 10, 20, 50, 70, and 100 cm. However, significant data gaps at many monitoring stations resulted in discontinuous time series. To ensure comparability, 32 stations with more complete records were selected from the original 47 meteorological stations for analysis.
Table 1. Crop coefficient of main crops in Haihe River Basin.
Crop TypeGrowth Stage
SowingTillering JointingHeadingFilling
Winter wheat a0.70.40.4–1.11.11.1–0.6
Summer maize a0.360.360.36–1.11.11.1–0.5
Spring maize b0.50.50.851.20.95–0.6
Notes: a The data was obtained from Shang et al. [25]; b The data was obtained from Allen et al. [26].

3.2. Methodology

3.2.1. Crop Moisture Index

The Crop Moisture Index (CMI) was developed by W. C. Palmer based on the principles of the Palmer Drought Severity Index (PDSI), considering that crops are highly sensitive to short-term water deficits during critical growth stages. The CMI is an agricultural drought index that incorporates weekly average temperature and precipitation. It employs a two-layer soil hydrological model based on the principle of water balance to calculate weekly soil evaporation, runoff, and storage changes (i.e., water losses or gains) [18]. The basic expression of the index is as follows:
P = E T + W + R O
where P denotes rainfall (mm), a water supply term to the soil; ET represents soil evapotranspiration (mm), a water loss term to the soil; RO is the amount of field runoff yielded, mm; and ΔW is storage variable of soil moisture, mm.
A two-layer bucket-type model is applied to carry out the hydrological accounting in Palmer’s method [18]. It is assumed that moisture supply is adequate when rainfall exceeds PE. The moisture loss is assumed to take place at the potential rate and residual water enters the soil. If rainfall was less than PE and cannot satisfy the evapotranspiration demand, soil moisture was lost. When potential evapotranspiration exceeds precipitation (PEi > Pi), the actual evapotranspiration is calculated as the sum of precipitation and soil water loss. Therefore,
E T i = P E i              P E i   P i   P i + L i       P E i > P i
where PEi and ETi represent the potential evapotranspiration and actual evapotranspiration in week i, respectively (mm), Pi represents the precipitation in week i (mm).
Similarly, if P was less than PE, and was not enough to maintain evapotranspiration, soil moisture is depleted to meet the water deficit. It is assumed that moisture cannot be lost from the underlying layer until all of the available moisture is depleted from the surface layer. And water loss from the underlying layer is affected by initial soil moisture, PE, and AWC (the available water capacity). Water loss L is equal to the sum of water loss from the surface and underlying layer.
L i = 0                      P E i   P i   L s , i + L u , i       P E i > P i
L s , i = m i n ( P E i P i ,   S s , i )
L u , i = m i n [ ( P E i P i L s , i ) · S u , i / A W C ,   S u , i ]  
where Ss,i and Su,i represent the initial available moisture stored in the surface and underlying layers in week i, respectively (mm), Ii is the irrigation amount in week i (mm), Ls,i and Lu,i represent the water loss from the surface and underlying layers in week i, respectively (mm).
It is assumed that there is no recharge to the underlying layer until the surface layers have been brought to field capacity. If P exceeded PE, soil moisture was recharged. Therefore,
R i = m i n [ P i P E i ,   A W C ( S s , i + S u , i ) ]
Runoff is assumed to occur if Q is larger than PE and both layers reach field capacity.
R O i = P i E T i R i
where Ri is the recharge in week i (mm), ROi is the runoff in week i (mm).
Building upon the concept of “Climatically Appropriate for Existing Condition” (CAFEC) precipitation, Palmer introduced the concept of CAFEC evapotranspiration, which refers to the amount of evapotranspiration that is suitable for crop water use under local climatic conditions [11,18]. The expression is as follows:
C E T = P E · α
α = E T ¯ / P E ¯
where CET is the CAFEC evapotranspiration, mm; α is the evapotranspiration coefficient; E T ¯ and P E ¯ are the multi-year average of actual and potential evapotranspiration, mm, respectively.
Based on the calculations of the various fluxes in the soil hydrological processes, the weekly CMI value is calculated. The expression is as follows:
C M I i = Y i + G i
where CMI represents the Crop Moisture Index; Y is the evapotranspiration anomaly index; G is the humidity index.
The evapotranspiration anomaly index is given by the equation, characterizing the cumulative negative impact of drought [27]
Y i = 0.67 · Y i 1 + 1.8 · ( E T i C E T i ) / α i 0.5
The humidity index is always positive or zero and is used to offset the negative effects of previous water deficits. The expression is as follows:
G i = G i 1 H i + M i · R i + R O i
M i = S s , i + S u , i + L s , i + L u , i 2 / A W C
H i =    G i 1                                  G i 1 < 12.7   mm 25.4               12.7   mm < G i 1 < 25.4   mm G i 1 2                            G i 1 > 25.4   mm
where M is the effective soil moisture percentage; and H is the regression factor that prevents G from increasing cumulatively and deviating from the zero value.

3.2.2. Improved Methods

(1)
Evapotranspiration Calculation
The original CMI employs the Thornthwaite method [28,29] to calculate potential evapotranspiration (PE), which solely takes temperature into account and assumes that evapotranspiration ceases when temperatures drop below freezing. This leads to poor simulation accuracy during winter [30,31]. In this work, we utilize the Penman–Monteith equation provided by FAO-56 [26] to calculate reference evapotranspiration (ET0) and introduce the crop coefficient (Kc) and water stress coefficient (Ks) to compute actual evapotranspiration (ET). The calculation formulas are as follows:
E T c = K c · P E
E T = K s · E T c
where ET represents the actual evapotranspiration (mm), ETc represents the standard crop evapotranspiration (mm), PE is the potential evapotranspiration (mm), Kc is the crop coefficient, and Ks is the soil water stress coefficient, which is calculated using the formula recommended by FAO-56.
K s = 1                                             F C S W p · ( F C W P )   S W W P ( 1 p ) · ( F C W P )          F C S W > p · ( F C W P )
where SW represents the soil water content (mm), and it is defined as SW = WP + Ss + Su; p represents the proportion of soil water consumed in the root zone before water stress occurs relative to the total available soil water. FAO-56 provides recommended values of ptab for different crops when the evapotranspiration intensity is 5.0 mm/d and also offers a correction formula for the recommended values.
p = p t a b + 0.04 · ( 5 E T c )
where ptab represents the recommended value by FAO-56, which is generally set at 0.55 [26] for cereal crops such as wheat and maize.
(2)
Irrigation calculation
The amount of irrigation depends on the local irrigation initiation threshold, the state of soil moisture deficit, and the water requirement during the crop growth stage [32,33]. The irrigation initiation threshold is the ratio of the minimum soil moisture content required for normal crop growth to the field capacity, which is used to determine the critical condition for initiating irrigation. By continuously adjusting the irrigation initiation threshold parameter and seeking the optimal threshold based on the fitting results between the simulated and measured soil moisture values, the irrigation initiation threshold for each station can be determined. The irrigation initiation threshold is set according to the soil moisture requirements for crop growth. Irrigation is only initiated during a period when the soil moisture content falls below the threshold; otherwise, no irrigation occurs during that period. The irrigation amount for the ith week can be expressed as
I i = 0                              T i S W i / F C   m i n ( D i ,        I q )          T i > S W i / F C  
D i = m a x ( 0 ,     F C S W i P i I i )
where i represents the ith week of the crop growth stage; Ii represents the irrigation amount for the ith week (mm); Ti is the irrigation initiation threshold for the ith week (mm); SWi indicates the initial soil moisture content for the ith week (mm); FC is the field capacity of the soil (mm); Iq is the recommended irrigation amount (mm); Di represents the soil moisture deficit for the ith week (mm).
Farmland irrigation leads to changes in the soil water balance status. Therefore, it is necessary to add an irrigation term to the soil water balance equation. Correspondingly, the hydrological parameters involved in the modification include the upper soil water loss (Ls), the lower soil water loss (Lu), the soil water replenishment (R), and the surface runoff (RO). The modified calculation formulas are as follows:
L s = 0                                                   E T c   P + I   m i n ( E T c P I ,   S s ,   E T )        E T c   > P + I
L s = 0                                                                                             E T c   P + I   m i n [ ( E T c P I L s ) · S u / A W C ,   E T L s ,   S u ]          E T c > P + I
R = m i n [ P + I E T c ,   A W C ( S s + S u ) ]
R O = P + I E T R
The physical meanings of all parameters in Equations (21)–(24) are the same as those described above.

3.2.3. Comparison of Measured Drought

Agricultural drought conditions are generally determined by the soil moisture status in farmlands. The relative soil moisture in the crop root zone can directly reflect the increase or decrease in available water for crops and is an important indicator for assessing agricultural drought. The Relative Soil Moisture (RSM) is calculated as the ratio of soil moisture content in the crop root zone to the field capacity and is listed as a key reference indicator for determining the level of agricultural drought [34]. RSM is widely applicable and comparable because it accounts for the deepening of the root zone during crop growth by adjusting the considered soil depth for different stages, and it incorporates differences in water retention across soil textures (Table 2). Therefore, RSM is highly suitable for agricultural areas in northern China, where maize, wheat, and other irrigated or rain-fed crops are the main types of crops sown.
In this study, the agricultural drought grade indicated by RSM is used as a reference to comparatively analyze the monitoring accuracy of agricultural drought by the CMI before and after improvement. The formula for calculating RSM is as follows:
R S M = α · ( i = 1 n w i f c i · 100 % ) / n
where α represents the crop development stage adjustment coefficient, which is 1.1 during the seedling stage, 0.9 during the water-sensitive period (from Sowing stage to heading stage for wheat and from Sowing stage to milking stage for maize), and 1 for other growth stages; wi represents the soil moisture content of the ith soil layer (%); fci represents the field capacity of the ith soil layer (%); n represents the number of soil layers corresponding to the crop development stage (n = 2 during the sowing and early growth stages, and n = 5 for other growth stages).
To facilitate comparison with actual drought conditions, it is necessary to construct the conversion relationship between the CMI and the RSM index based on the drought classification relationship between them, the formula is as follows:
R S M = 10 · C M I + 55                     C l a y   10 · C M I + 60                     L o a m 10 · C M I + 65                     S a n d
where RSM represents the Relative Soil Moisture index; CMI represents the Crop Moisture Index.

4. Results and Analysis

4.1. Soil Moisture Comparisons

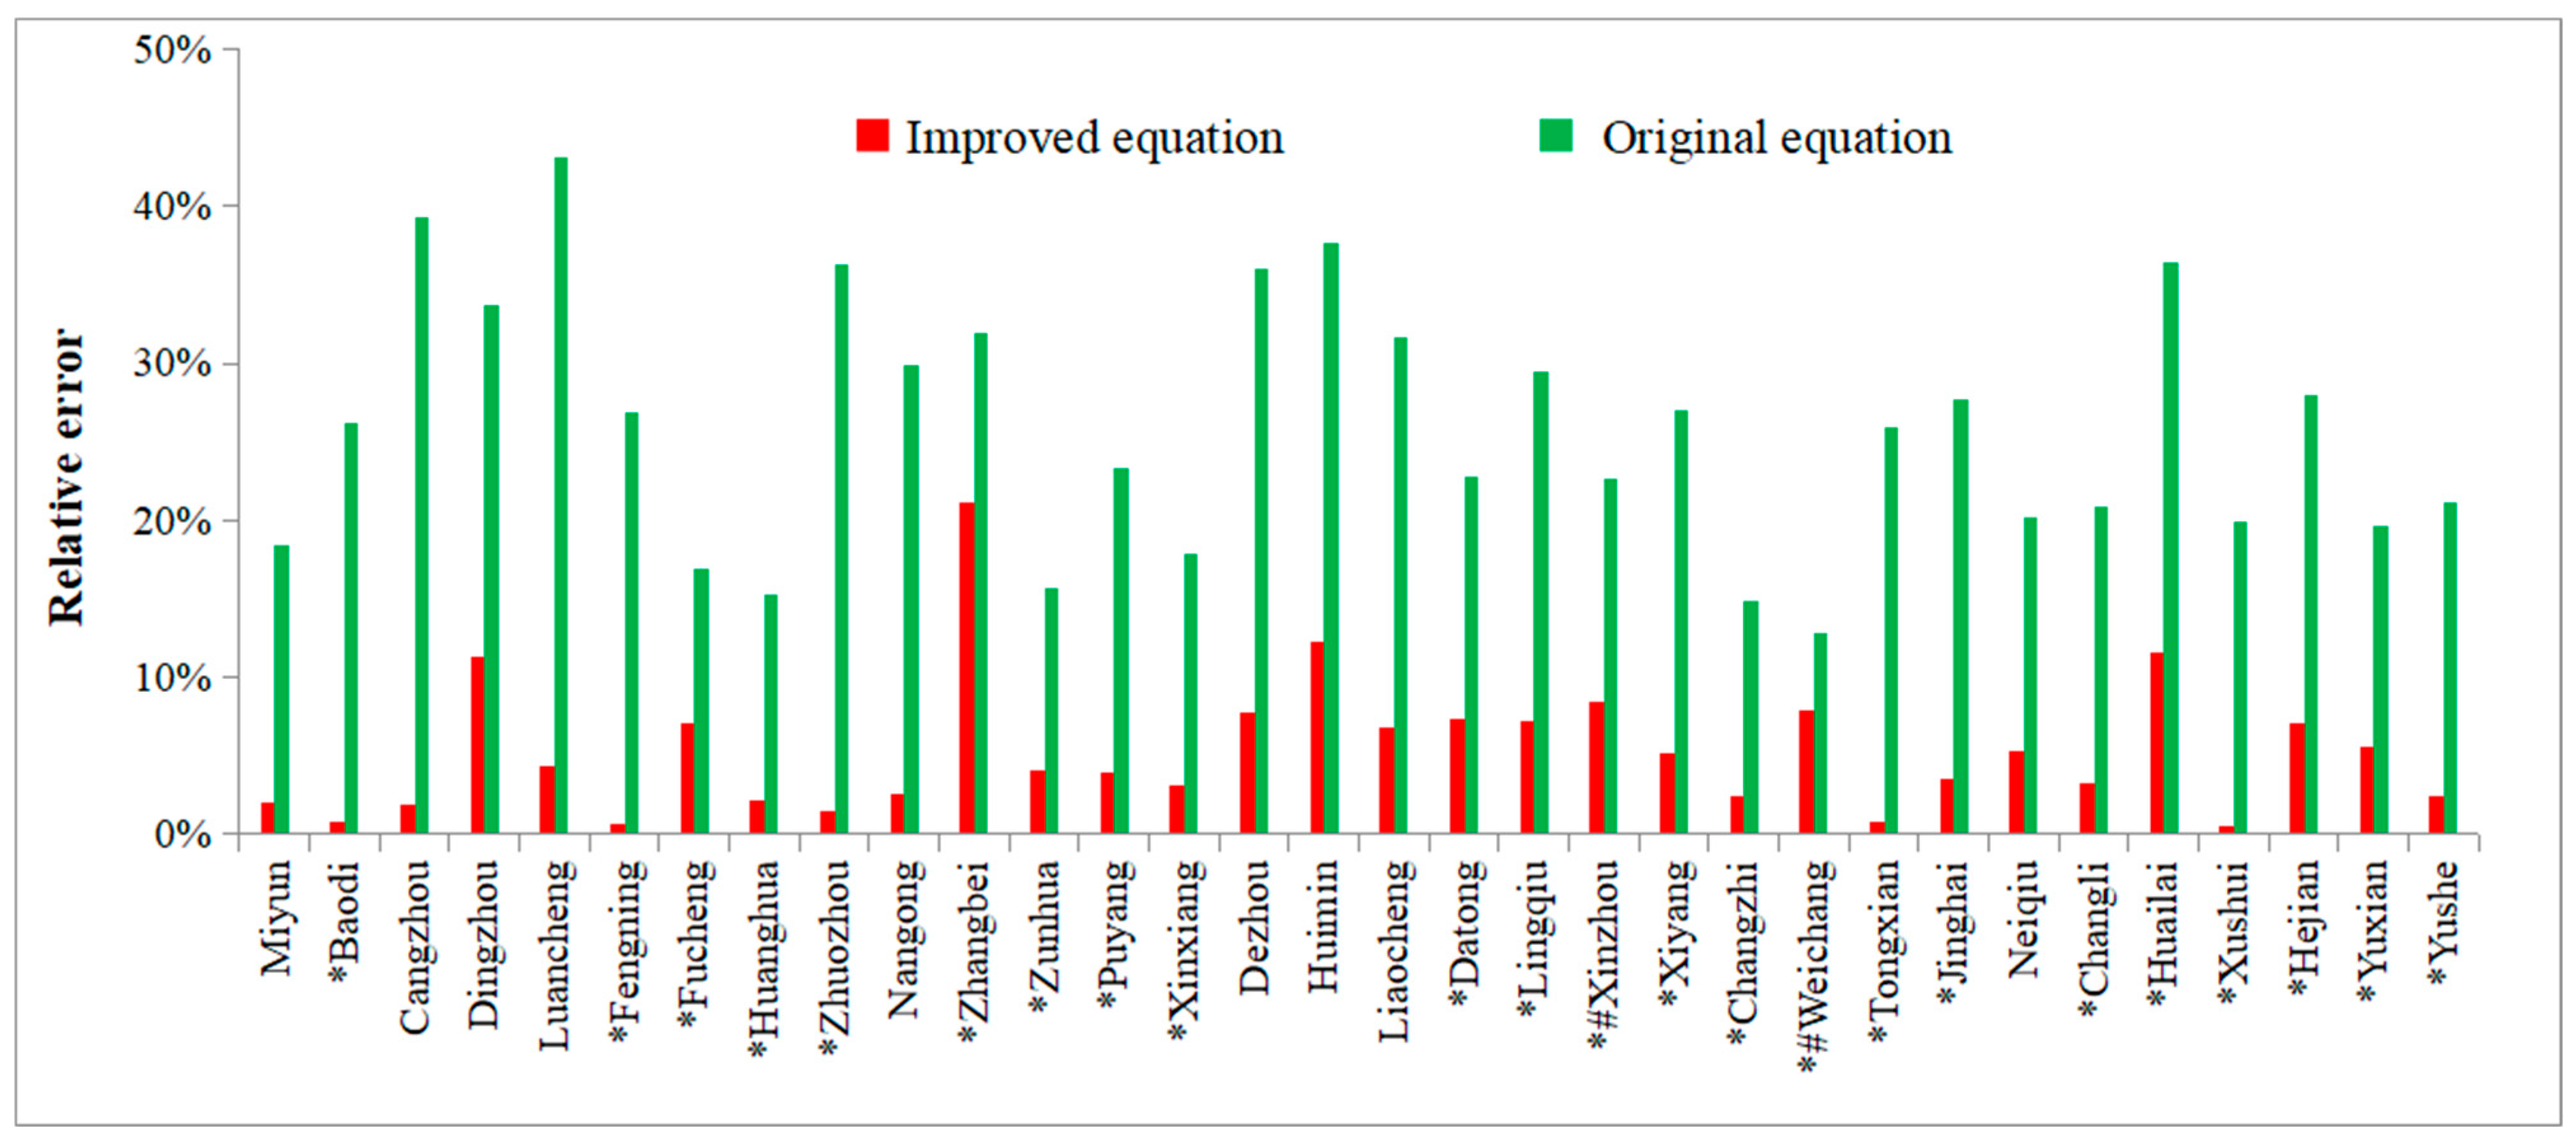
Soil moisture content was simulated using both the original and improved soil water balance equations at 32 stations in the Hai River Basin that possessed relatively complete measured soil moisture data from 1993 to 2012. The annual relative errors between the simulated and measured relative soil moisture are shown in Figure 3. The improved soil water balance equation had an average annual relative error of 5.1% between the simulated and observed values, with the largest error at Huimin station (12.4%) and the smallest at Baodi station (0.9%). Except for Fengning, Huimin, and Huailai stations, which had average annual relative errors greater than 10%, all other stations had errors less than 10%. In contrast, the original equation had an average annual relative error of 26.2% between the simulated and observed values, with the largest error at Luancheng station (43.1%) and the smallest at Baodi station (15.2%). Except for the eight stations of Miyun, Fucheng, Huanghua, Zunhua, Xinxiang, Changzhi, Weichang, and Xushui, which had average annual relative errors less than 20%, all other stations exceeded 20%. Compared with the original equation, the improved soil water balance equation had smaller average annual relative errors in the simulation of relative soil moisture.
To determine whether statistically significant differences existed, Student’s t-test and the Mann–Whitney U test were applied to compare simulated and observed soil moisture data generated by the original and improved water balance equations. The analysis utilized records from 32 stations in the Haihe River Basin from 1993 to 2012. The results demonstrated that soil moisture estimates derived from the improved water balance equation exhibited closer agreement with measured values, as indicated by p-values exceeding 0.05 for 25 of the 32 stations in the comparison. This lack of statistically significant difference suggests that the improved equation provides reliable estimates. In contrast, simulations using the original water balance equation showed significantly poorer agreement, with only 2 out of the 32 stations achieving p-values > 0.05.
Figure 4 presents the monthly average relative errors between simulated and observed values for both the original and improved soil water balance equations. Except for August and September, there were significant differences in the monthly average relative errors between the simulated and observed values of the original and improved equations. The monthly average relative errors between the simulated and observed values of the improved equation were all less than 20%, with the largest error in May (15.2%) and the smallest in June (1.8%). In contrast, the original equation had the largest monthly average relative error in May (37.2%) and the smallest in June (1.8%). Except for August to November, the monthly average relative errors exceeded 20%. Compared with the original equation, the improved soil water balance equation had smaller monthly average relative errors in the simulation of relative soil moisture.
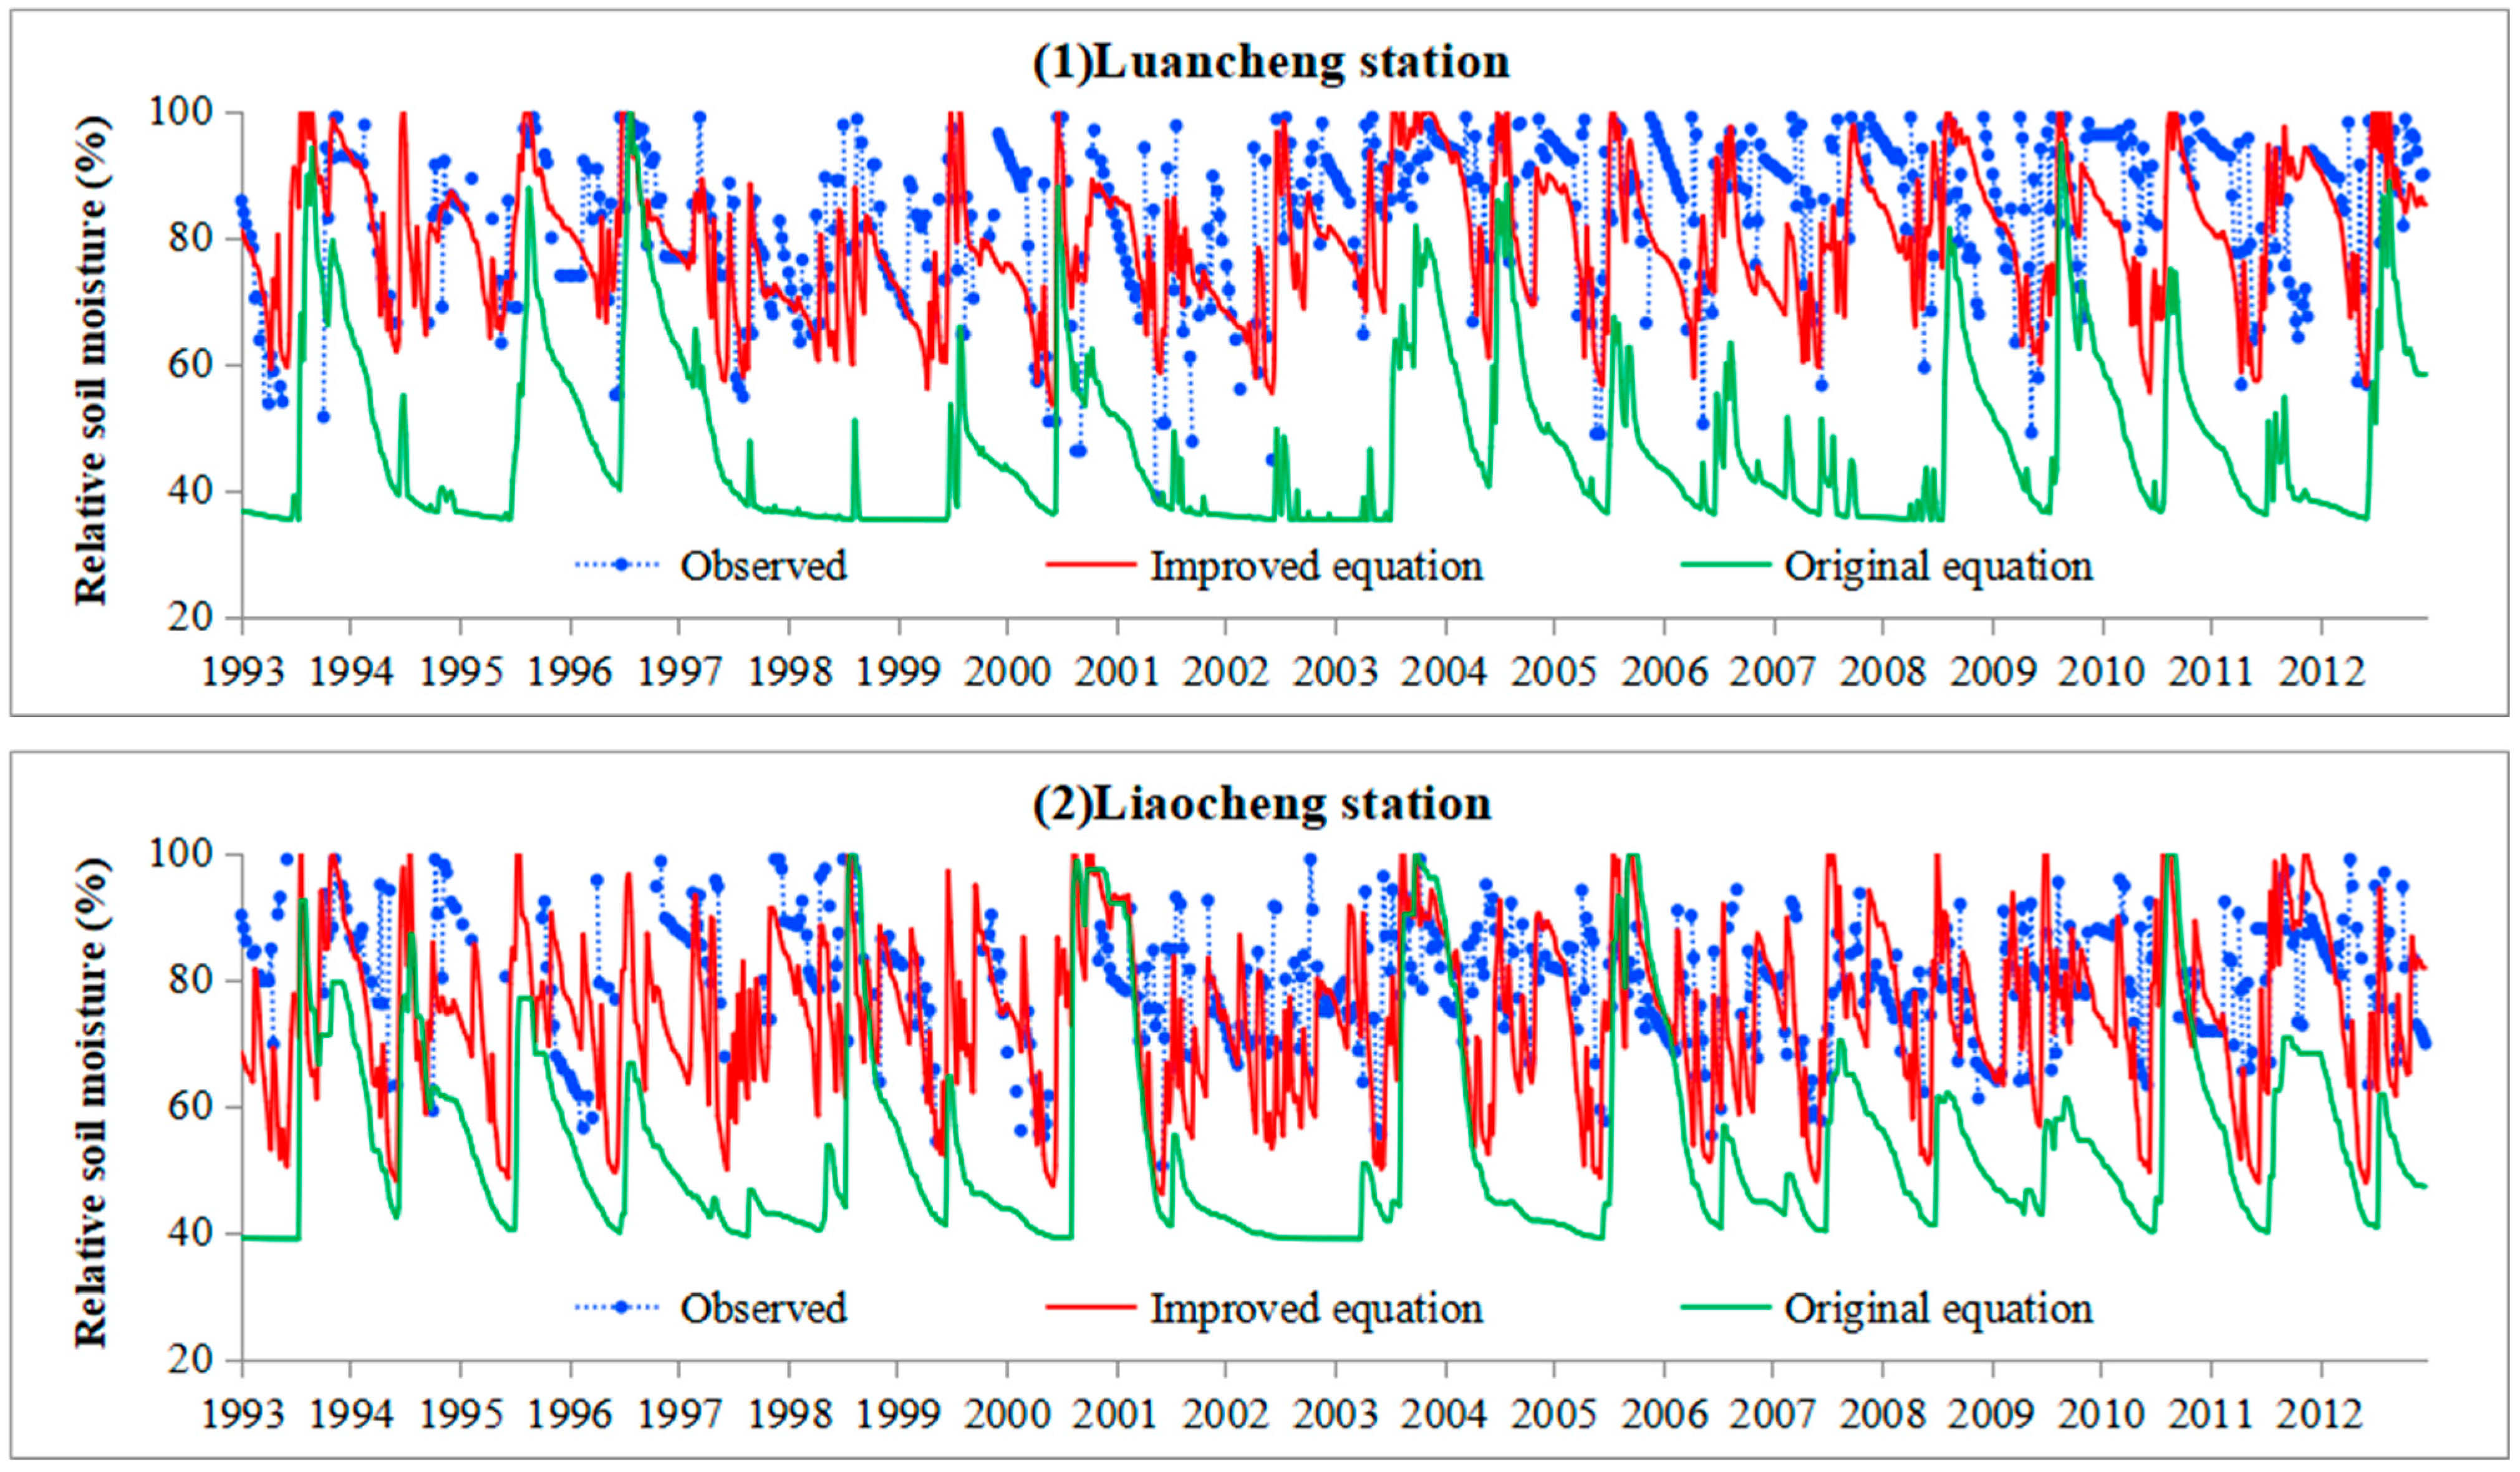
To validate the improved soil water balance equation for simulating farmland soil moisture dynamics, three representative stations, Luancheng, Liaocheng and Baodi, were selected, respectively, in the middle, south and north of the Haihe River Basin. Both the original and improved equations were applied to compute weekly root-zone soil moisture (1 m depth) during 1993–2012. The simulated weekly soil moisture dynamics were then compared against field measurements during periods with available data (Figure 5). Agricultural irrigation generally maintained soil moisture above 60% of field capacity, and the simulated variations closely followed the observed moisture patterns. However, discrepancies persisted, attributable to uncertainties in irrigation timing/amount and other unquantified factors (e.g., localized soil heterogeneity, deep percolation). Overall, the improved equation achieved significantly enhanced simulation performance compared with the original equation. Simulations using the original equation yielded significantly lower soil moisture values than observed, exhibiting a rapid decline towards the permanent wilting point. This simulated extreme aridity starkly contrasted with actual field conditions. In contrast, the improved equation demonstrated superior performance, simulating soil moisture dynamics that aligned more closely with observations and provided a more realistic representation of farmland moisture variability.
By comparing the relative errors of multi-year average, monthly, and weekly soil moisture simulation values, it is evident that the improved soil water balance equation effectively enhances the accuracy of soil moisture simulation results.

4.2. Drought Identification Accuracy Analyses

Agricultural drought grades were determined using both the original and improved CMI indices. The RSM index, calculated from decadal crop growth and farmland soil moisture data [24], served as the reference for actual drought conditions to validate the improved CMI. The RSM was computed using Equation (12), and drought identification followed the criteria in Table 2.
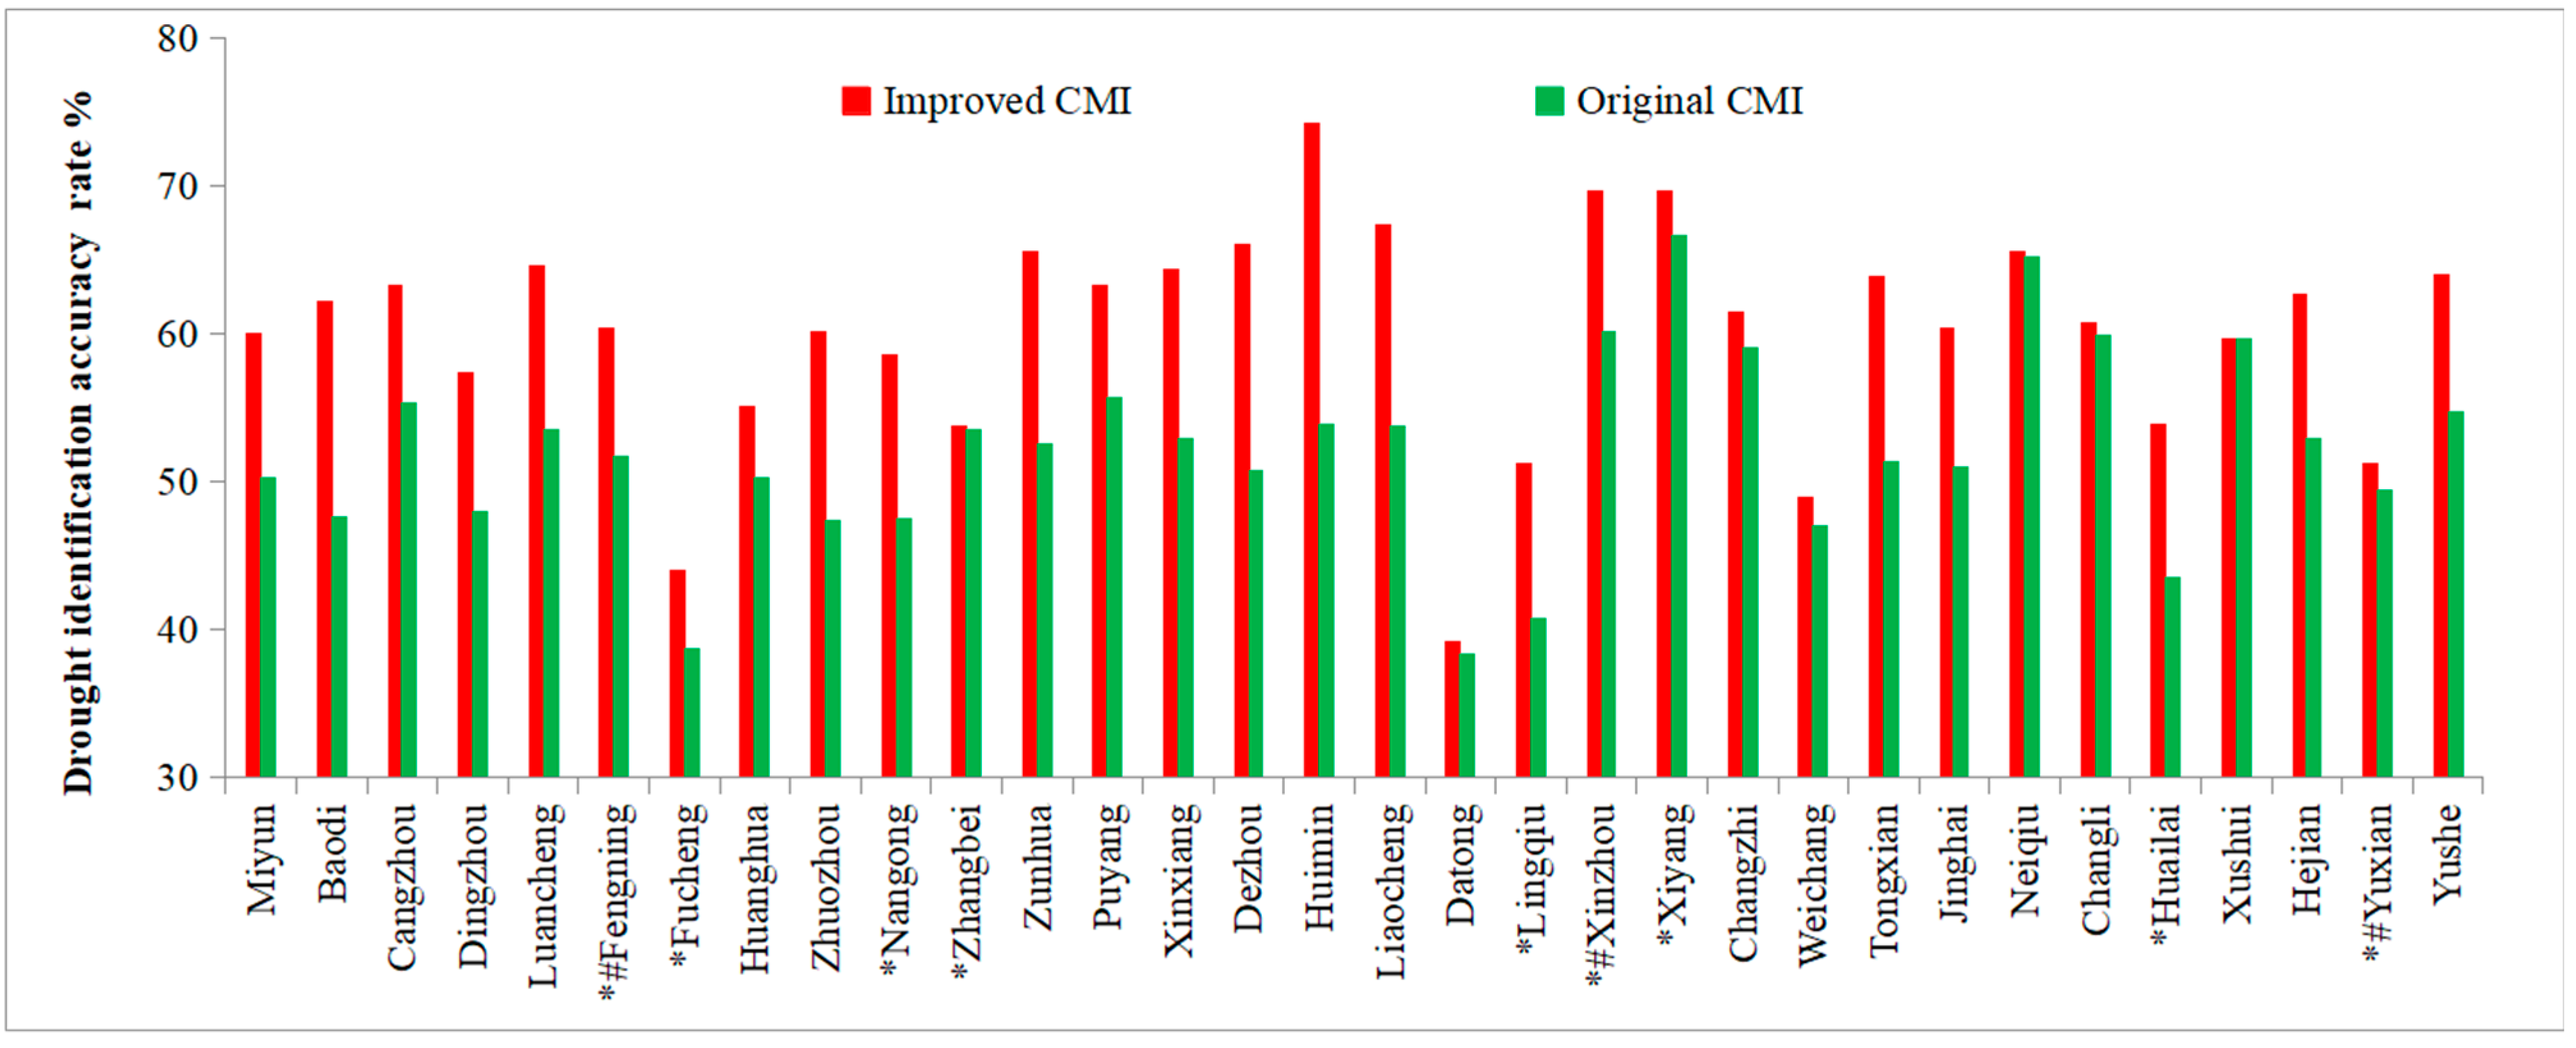
According to the statistics, the weekly drought monitoring results of the two CMIs in 32 stations of Haihe River Basin from 1993 to 2012 were obtained and compared with the drought conditions monitored by the RSM index. The drought identification accuracy rates are shown in Figure 6. The annual drought identification accuracy rate of the improved CMI was 61.9%, with the highest rate at Huimin station (74.2%) and the lowest at Baodi station (39.2%). Except for Dingzhou, Fucheng, Huanghua, Nangong, Zhangbei, Datong, Weichang, Huailai, Xushui, and Yuxian stations, which had annual drought identification accuracy rates below 60%, all other stations exceeded 60%, accounting for 69.7% of the total number of stations. In contrast, the original CMI had an annual drought identification accuracy rate of 52.2%, with the highest rate at Xi Yang station (66.7%) and the lowest at Datong station (38.3%). Only three stations (Xinzhou, Xi Yang, and Neiqiu) had annual drought identification accuracy rates above 60%, representing 9.1% of the total number of stations, while the remaining stations had rates below 60%. The improved CMI had an annual drought identification accuracy rate 9.7% higher than the original CMI, indicating that the improved CMI had higher monitoring accuracy in drought monitoring results.
To determine whether statistically significant differences existed, Student’s t-test was applied to compare simulated and observed agricultural drought grade results generated by the original and improved CMI indices. The analysis utilized records from 32 stations in the Haihe River Basin from 1993 to 2012. The results showed that agricultural drought grade estimates derived from the improved CMI exhibited closer agreement with measured values, as evidenced by p-values exceeding 0.05 at 10 of the 32 stations. In contrast, simulations using the original CMI showed poorer agreement, with only 4 out of the 32 stations showing p-values > 0.05.
It should be pointed out that spatial variability is an important factor affecting the accuracy of agricultural drought assessment. Given the diverse topography of the Haihe River Basin, disparities in specific conditions, such as crop type variations and farmland irrigation, may lead to significant p-values (p < 0.05) at 22 stations; these results likely originate from external confounding factors rather than CMI failure. Overall, the improved CMI demonstrated robust performance at approximately one-third of the monitoring stations. Crucially, statistically indistinguishable results hold greater practical significance, as they mitigate the risk of false-positive differences and ensure robust application to drought assessment.
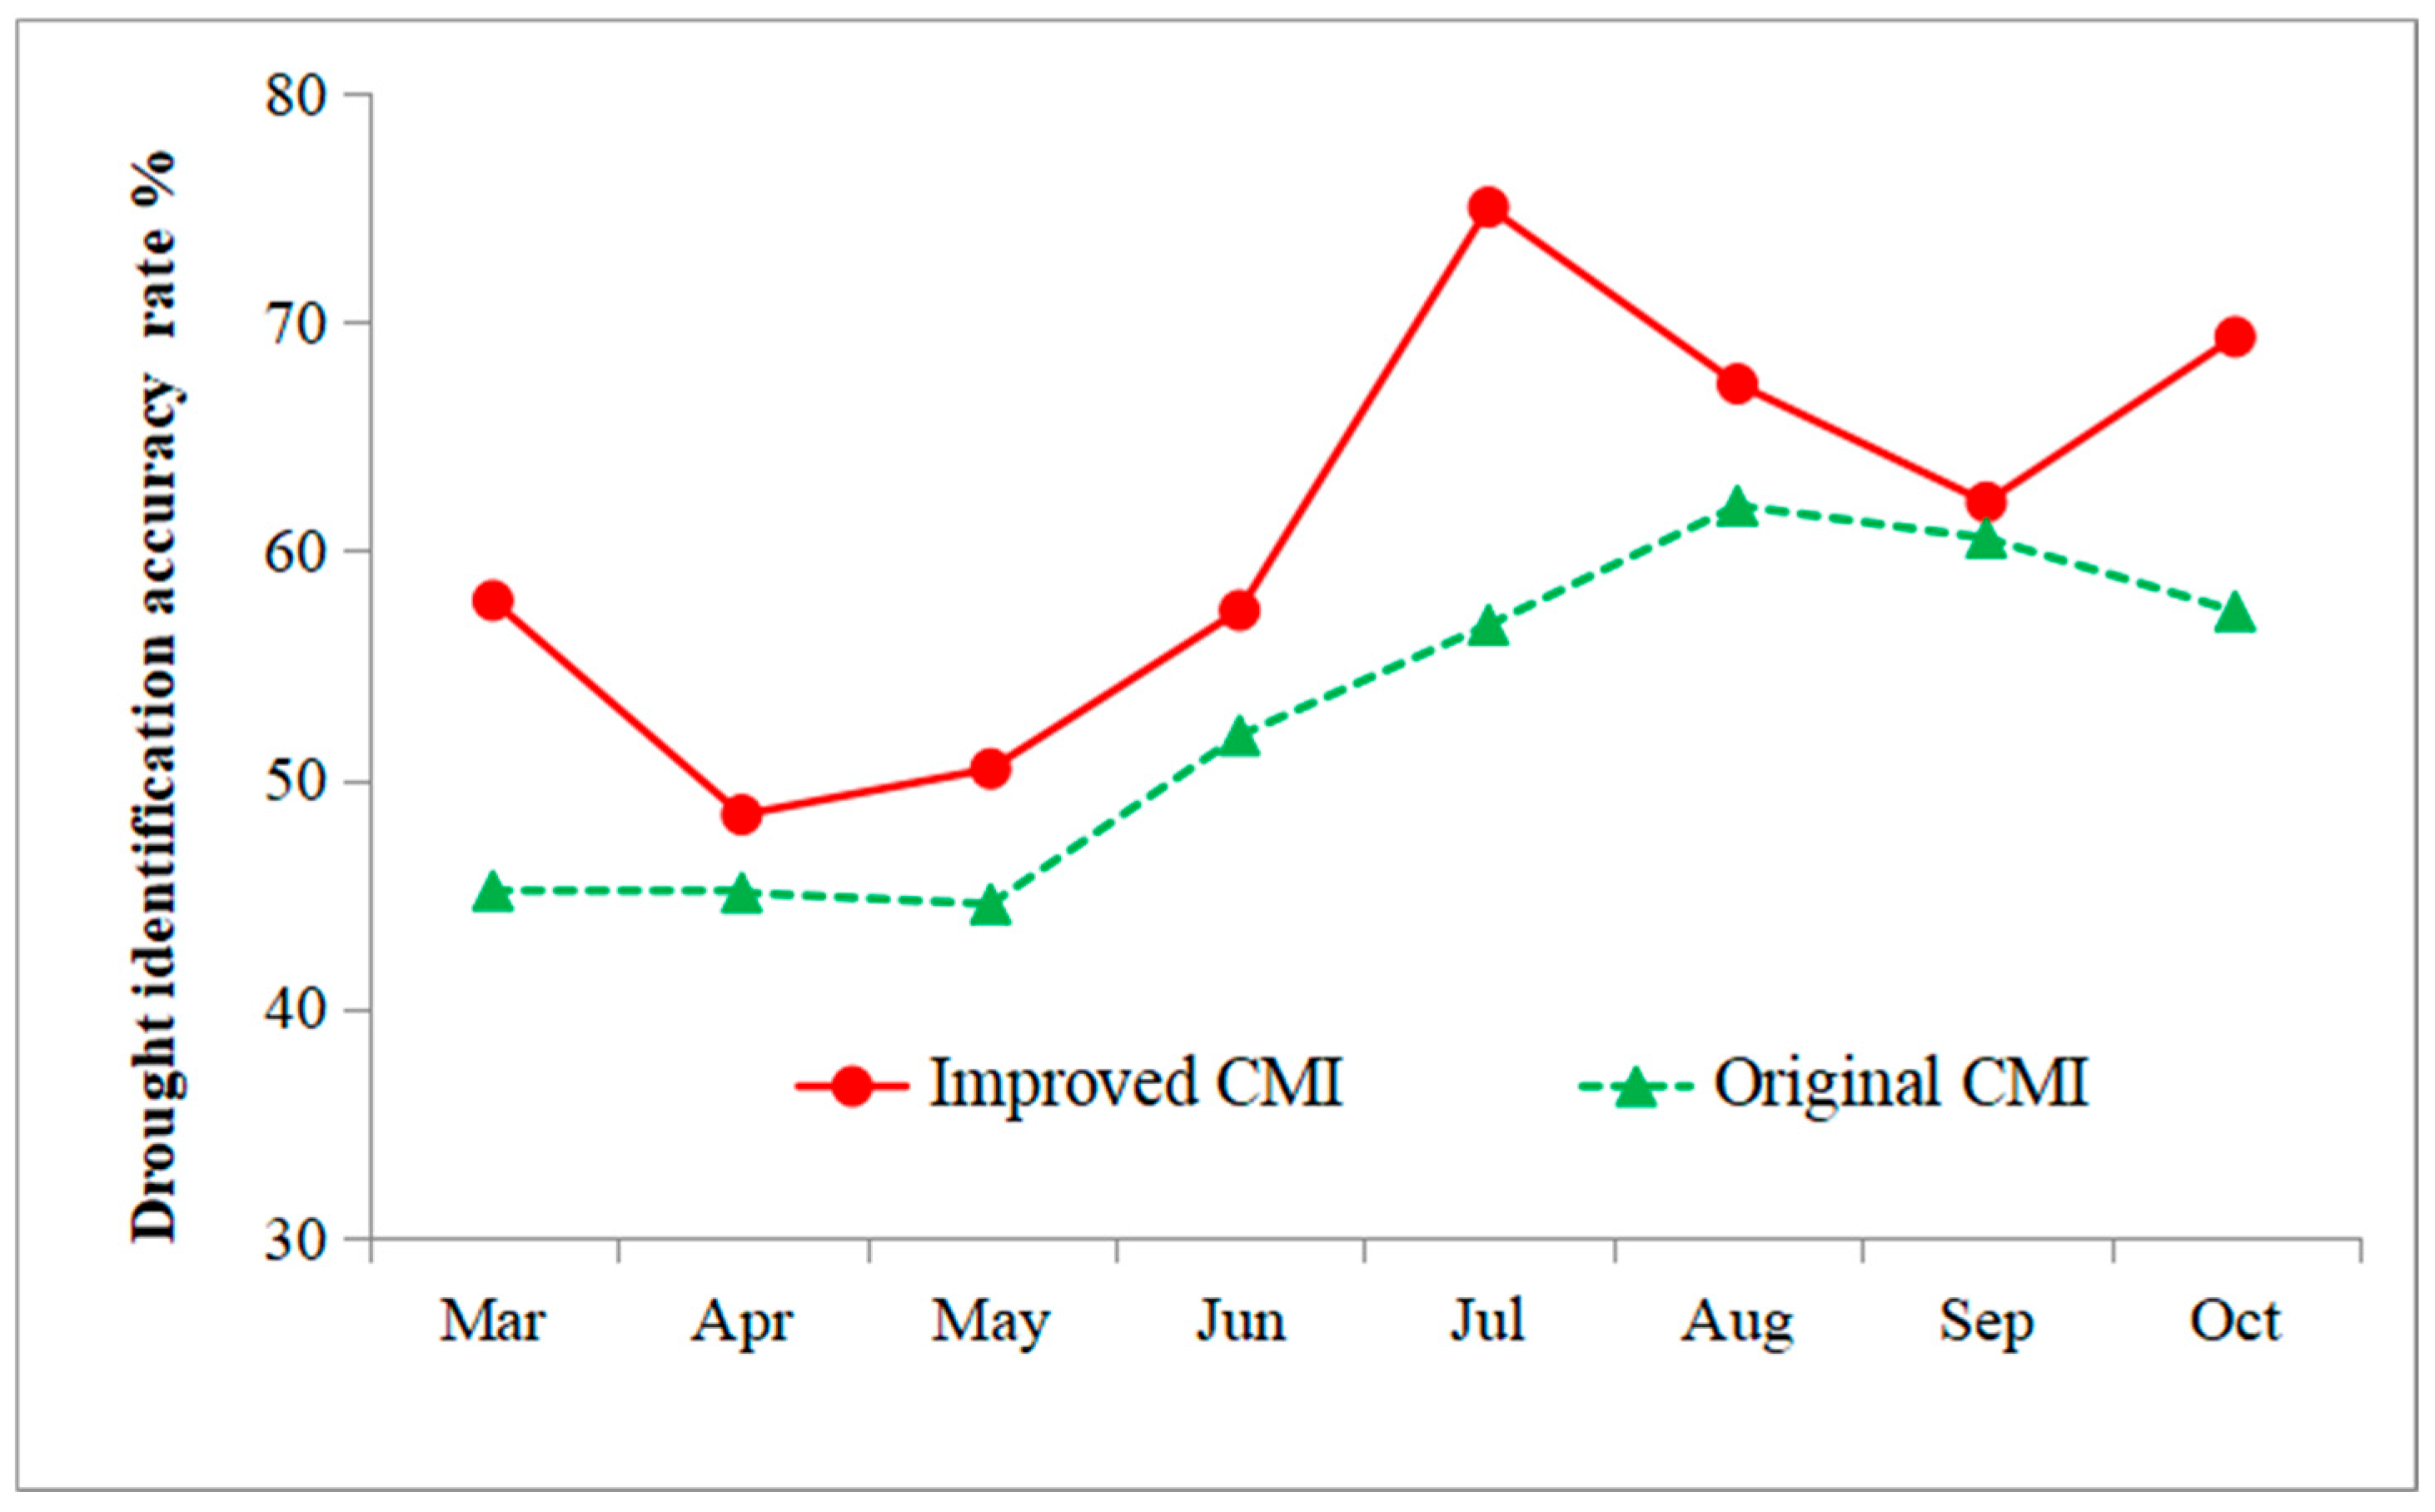
Figure 7 compares the monthly drought identification accuracy rates of the original and improved CMI indices during the crop growth period from 1993 to 2012 at 32 stations in the Hai River Basin. Compared with the original CMI, the monthly drought identification accuracy rate of the improved CMI was significantly increased, with months having accuracy rates above 60% being July to October. Among these, the highest drought identification accuracy rate was in July (75.0%), while the lowest was in April (48.4%). For the original CMI, the months with drought identification accuracy rates above 60% were August and September, with the highest rate in August (61.9%) and the lowest in May (44.6%). Overall, the improved CMI had higher monthly drought identification accuracy rates.
To validate the accuracy of the improved CMI in monitoring agricultural drought, three representative stations in the central (Luancheng), southern (Liaocheng), and northern (Baodi) parts of the Haihe River Basin. The weekly original and improved CMI were calculated for the period from 1993 to 2012. To facilitate comparison with actual drought conditions, the RSM index values were converted to CMI values based on the drought classification relationship between the CMI and RSM indices, as shown in Figure 8. The change curve of the improved CMI was close to that of the converted RSM index. In contrast, the original CMI values were significantly lower than the converted RSM index values, especially in spring each year, even indicating moderate to severe drought conditions, which did not match the actual situation. The improved CMI provided better drought monitoring results, with a change process that more closely aligned with actual conditions.
Statistical analysis of the multi-year average and monthly drought identification accuracy rates, combined with the weekly CMI time series comparison, demonstrates that the improved CMI significantly enhances the accuracy of drought monitoring results.

4.3. Spatial Comparisons

Taking the North China drought in 2002 as an example [35,36,37], the accuracy of the improved CMI in evaluating the spatial distribution of agricultural drought was verified by comparing the development and recession processes of drought monitored by the two CMI indices. Considering the limited spatial locations and numbers of the stations, Kriging interpolation was applied to the RSM index and the two CMI indices from 47 stations in the Hai River Basin to expand the comparison from point data to areal data, thereby offsetting the impacts caused by missing station data or measurement errors. Although local errors may exist in some regions due to the study area covering the Hai River Basin, the overall accuracy is controllable.
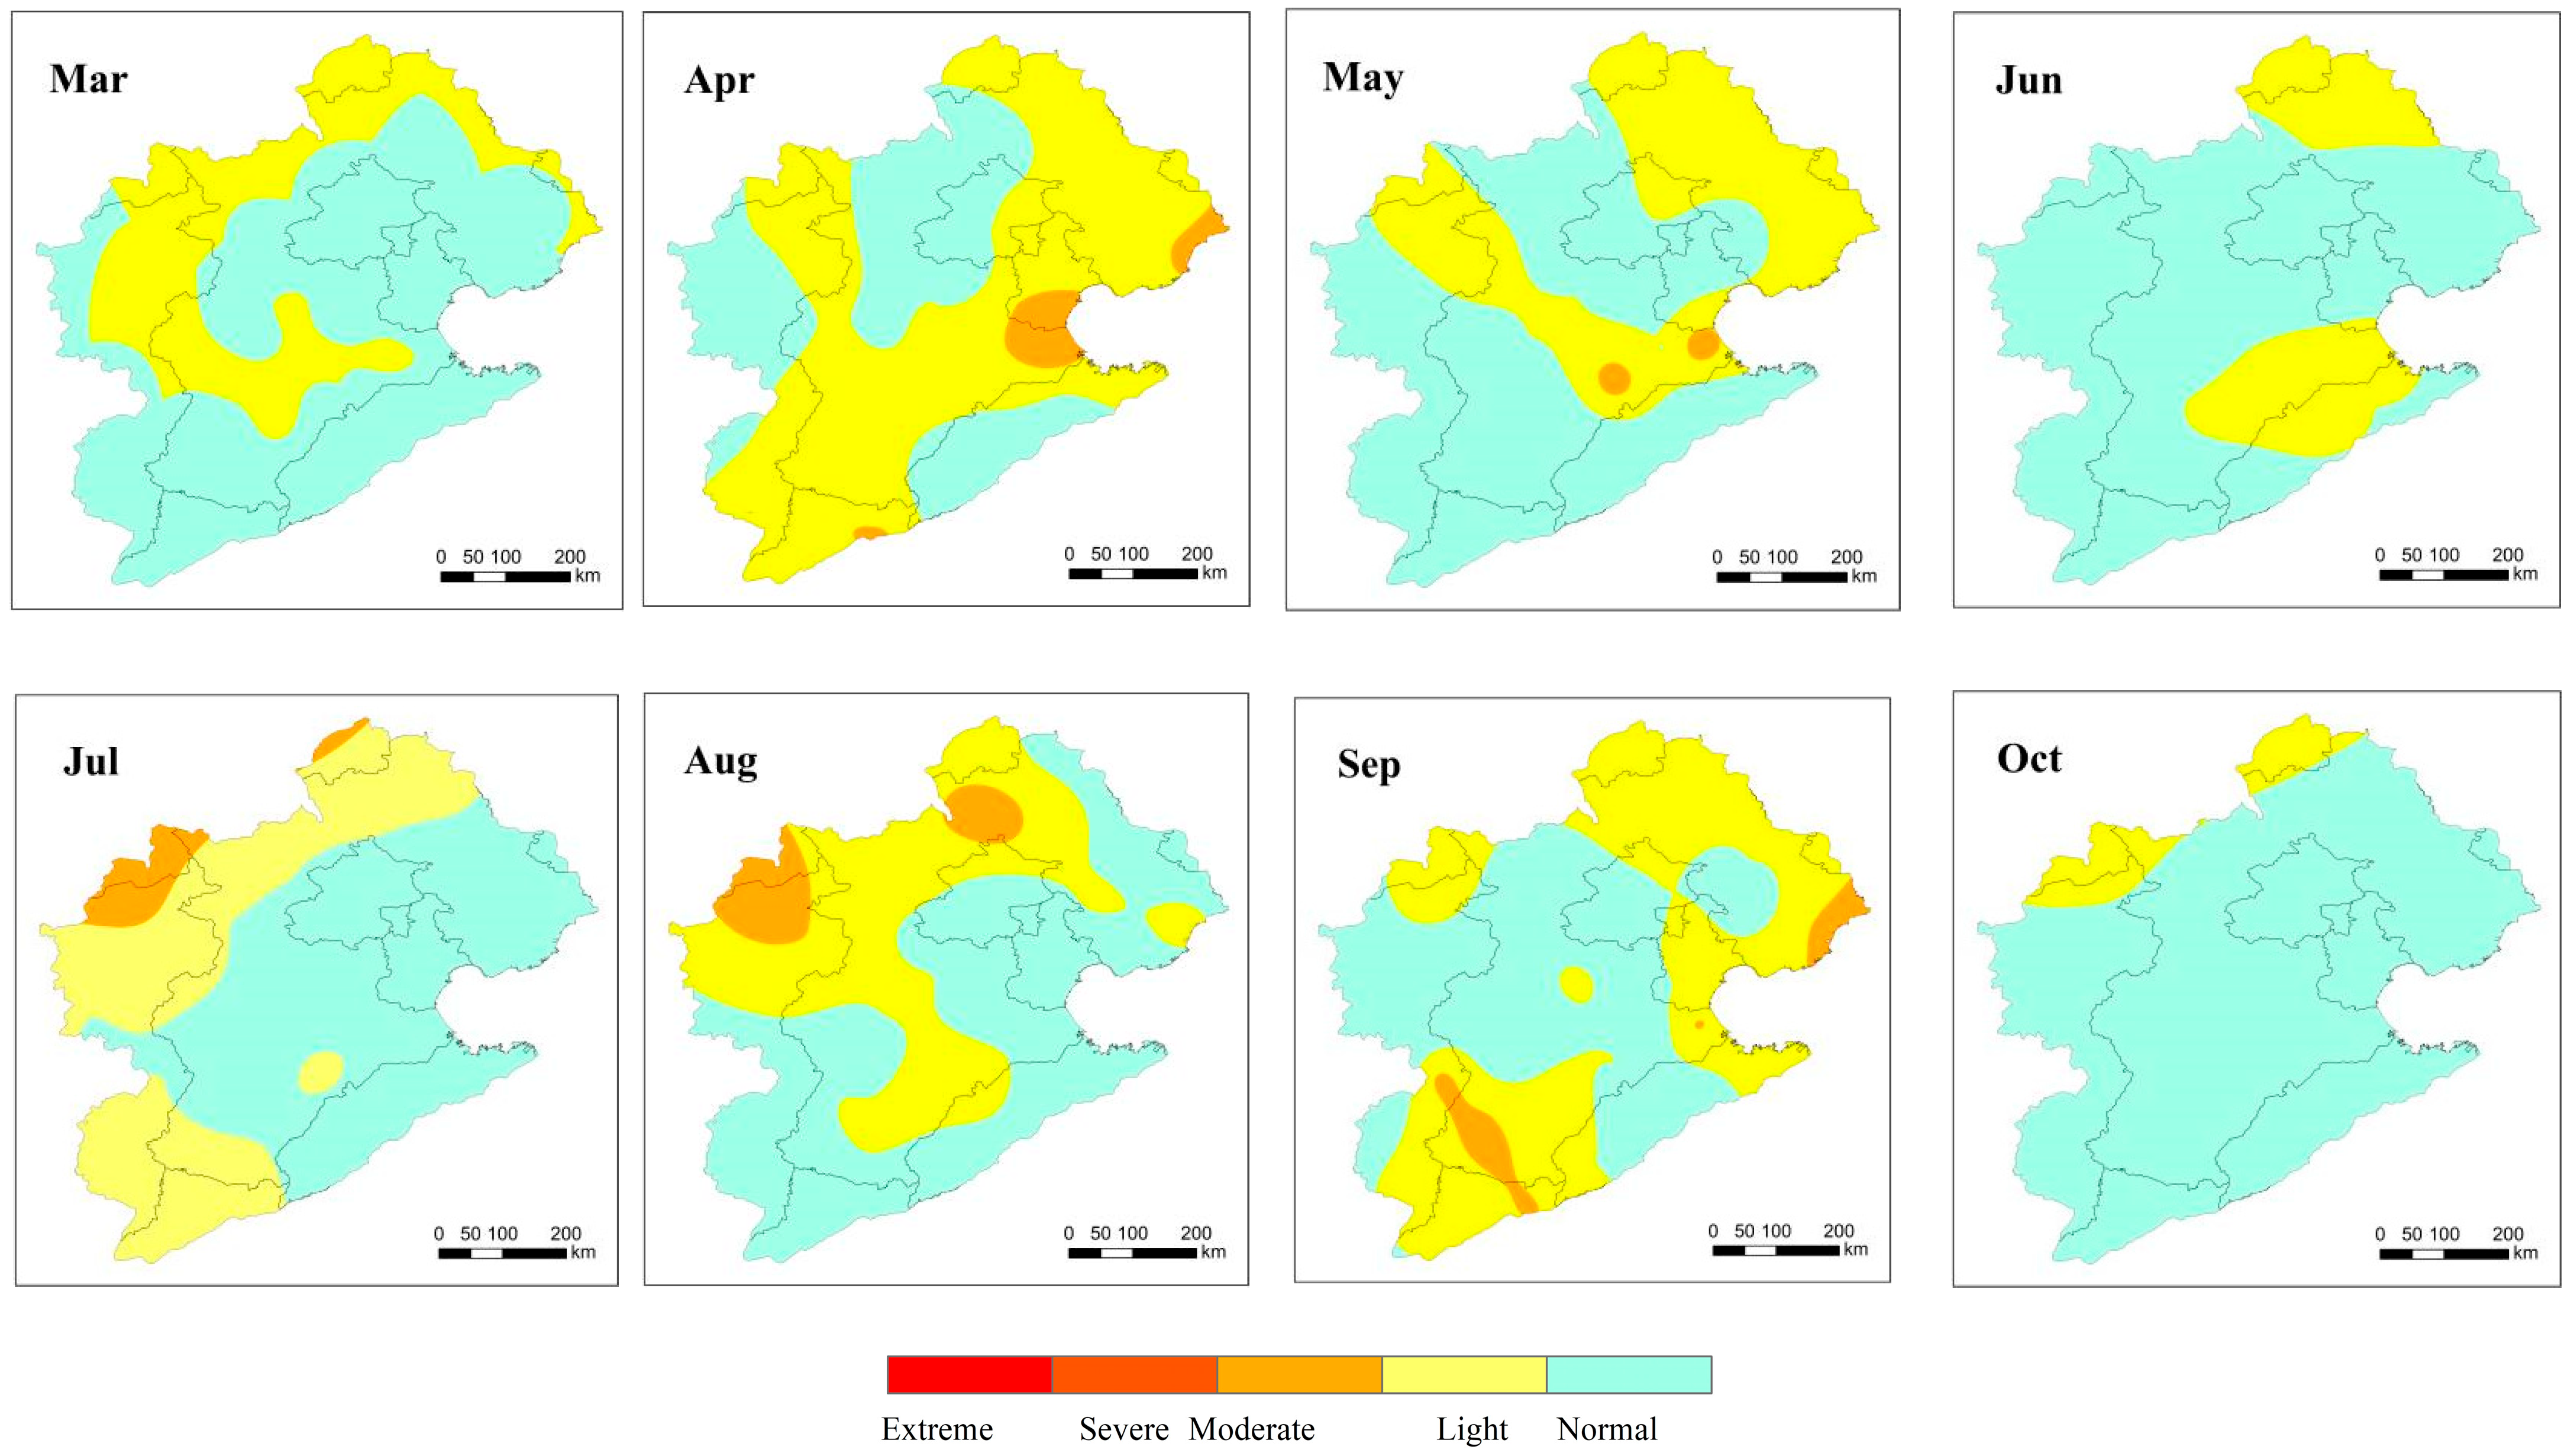
Figure 9 depicts the spatial distribution of agricultural drought in the Hai River Basin from March to October 2002, based on the RSM index. In March, relative soil moisture was below 60% (indicating light drought) in parts of northern Shanxi and central and northern Hebei. The drought area significantly expanded in April, with light drought occurring in most parts of northern Henan, Hebei, and Tianjin, and some areas of Beijing, and moderate drought in some local regions. The spring drought continued into May but weakened, with light drought remaining in parts of northern Shanxi and central and northern Hebei. In June, the drought area further decreased, with only light drought in eastern and northern Hebei. Entering the summer, due to higher temperatures and insufficient precipitation, light to moderate drought emerged in the northwestern part of the Hai River Basin and expanded into the central and southern regions of Hebei. In September, light drought was present in central and southern Hebei, northeastern Hebei, and northern Henan, with moderate drought in some local areas. By October, the drought had largely been alleviated, with only light drought remaining in a small part of the northern Hai River Basin.
Figure 10 illustrates the spatial distribution of agricultural drought in the Hai River Basin for 2002, based on the improved CMI. In March, light drought conditions were present in most parts of Hebei, as well as in Beijing and Tianjin. In April, the drought was mainly distributed in the central and southern parts of the Hai River Basin, including parts of Shanxi, southern Hebei, northern Henan, and some areas of Beijing and Tianjin, with the majority being light drought. In May, light drought occurred in central Hebei and some parts of Beijing and Tianjin, while moderate drought was present in some areas of eastern Hebei. In June, the drought area significantly decreased, with light drought in southern Shanxi, northern Henan, central and northern Hebei. In July, light to moderate drought was observed from the northern to the central part of the Hai River Basin, which expanded to most parts of Hebei in August. The drought persisted in September, with light drought mainly distributed in central and southern Hebei, northeastern Hebei, and the Beijing–Tianjin area, and moderate drought in some areas of eastern Hebei and Shandong. In October, the drought was significantly alleviated, with light drought remaining in the northern and central parts of the Hai River Basin. A monthly comparison reveals that the drought extent identified by the improved CMI is marginally overestimated compared to observations, with localized discrepancies in some areas. Nevertheless, the overall spatial patterns and intensity grades identified by the index are generally consistent with actual conditions.
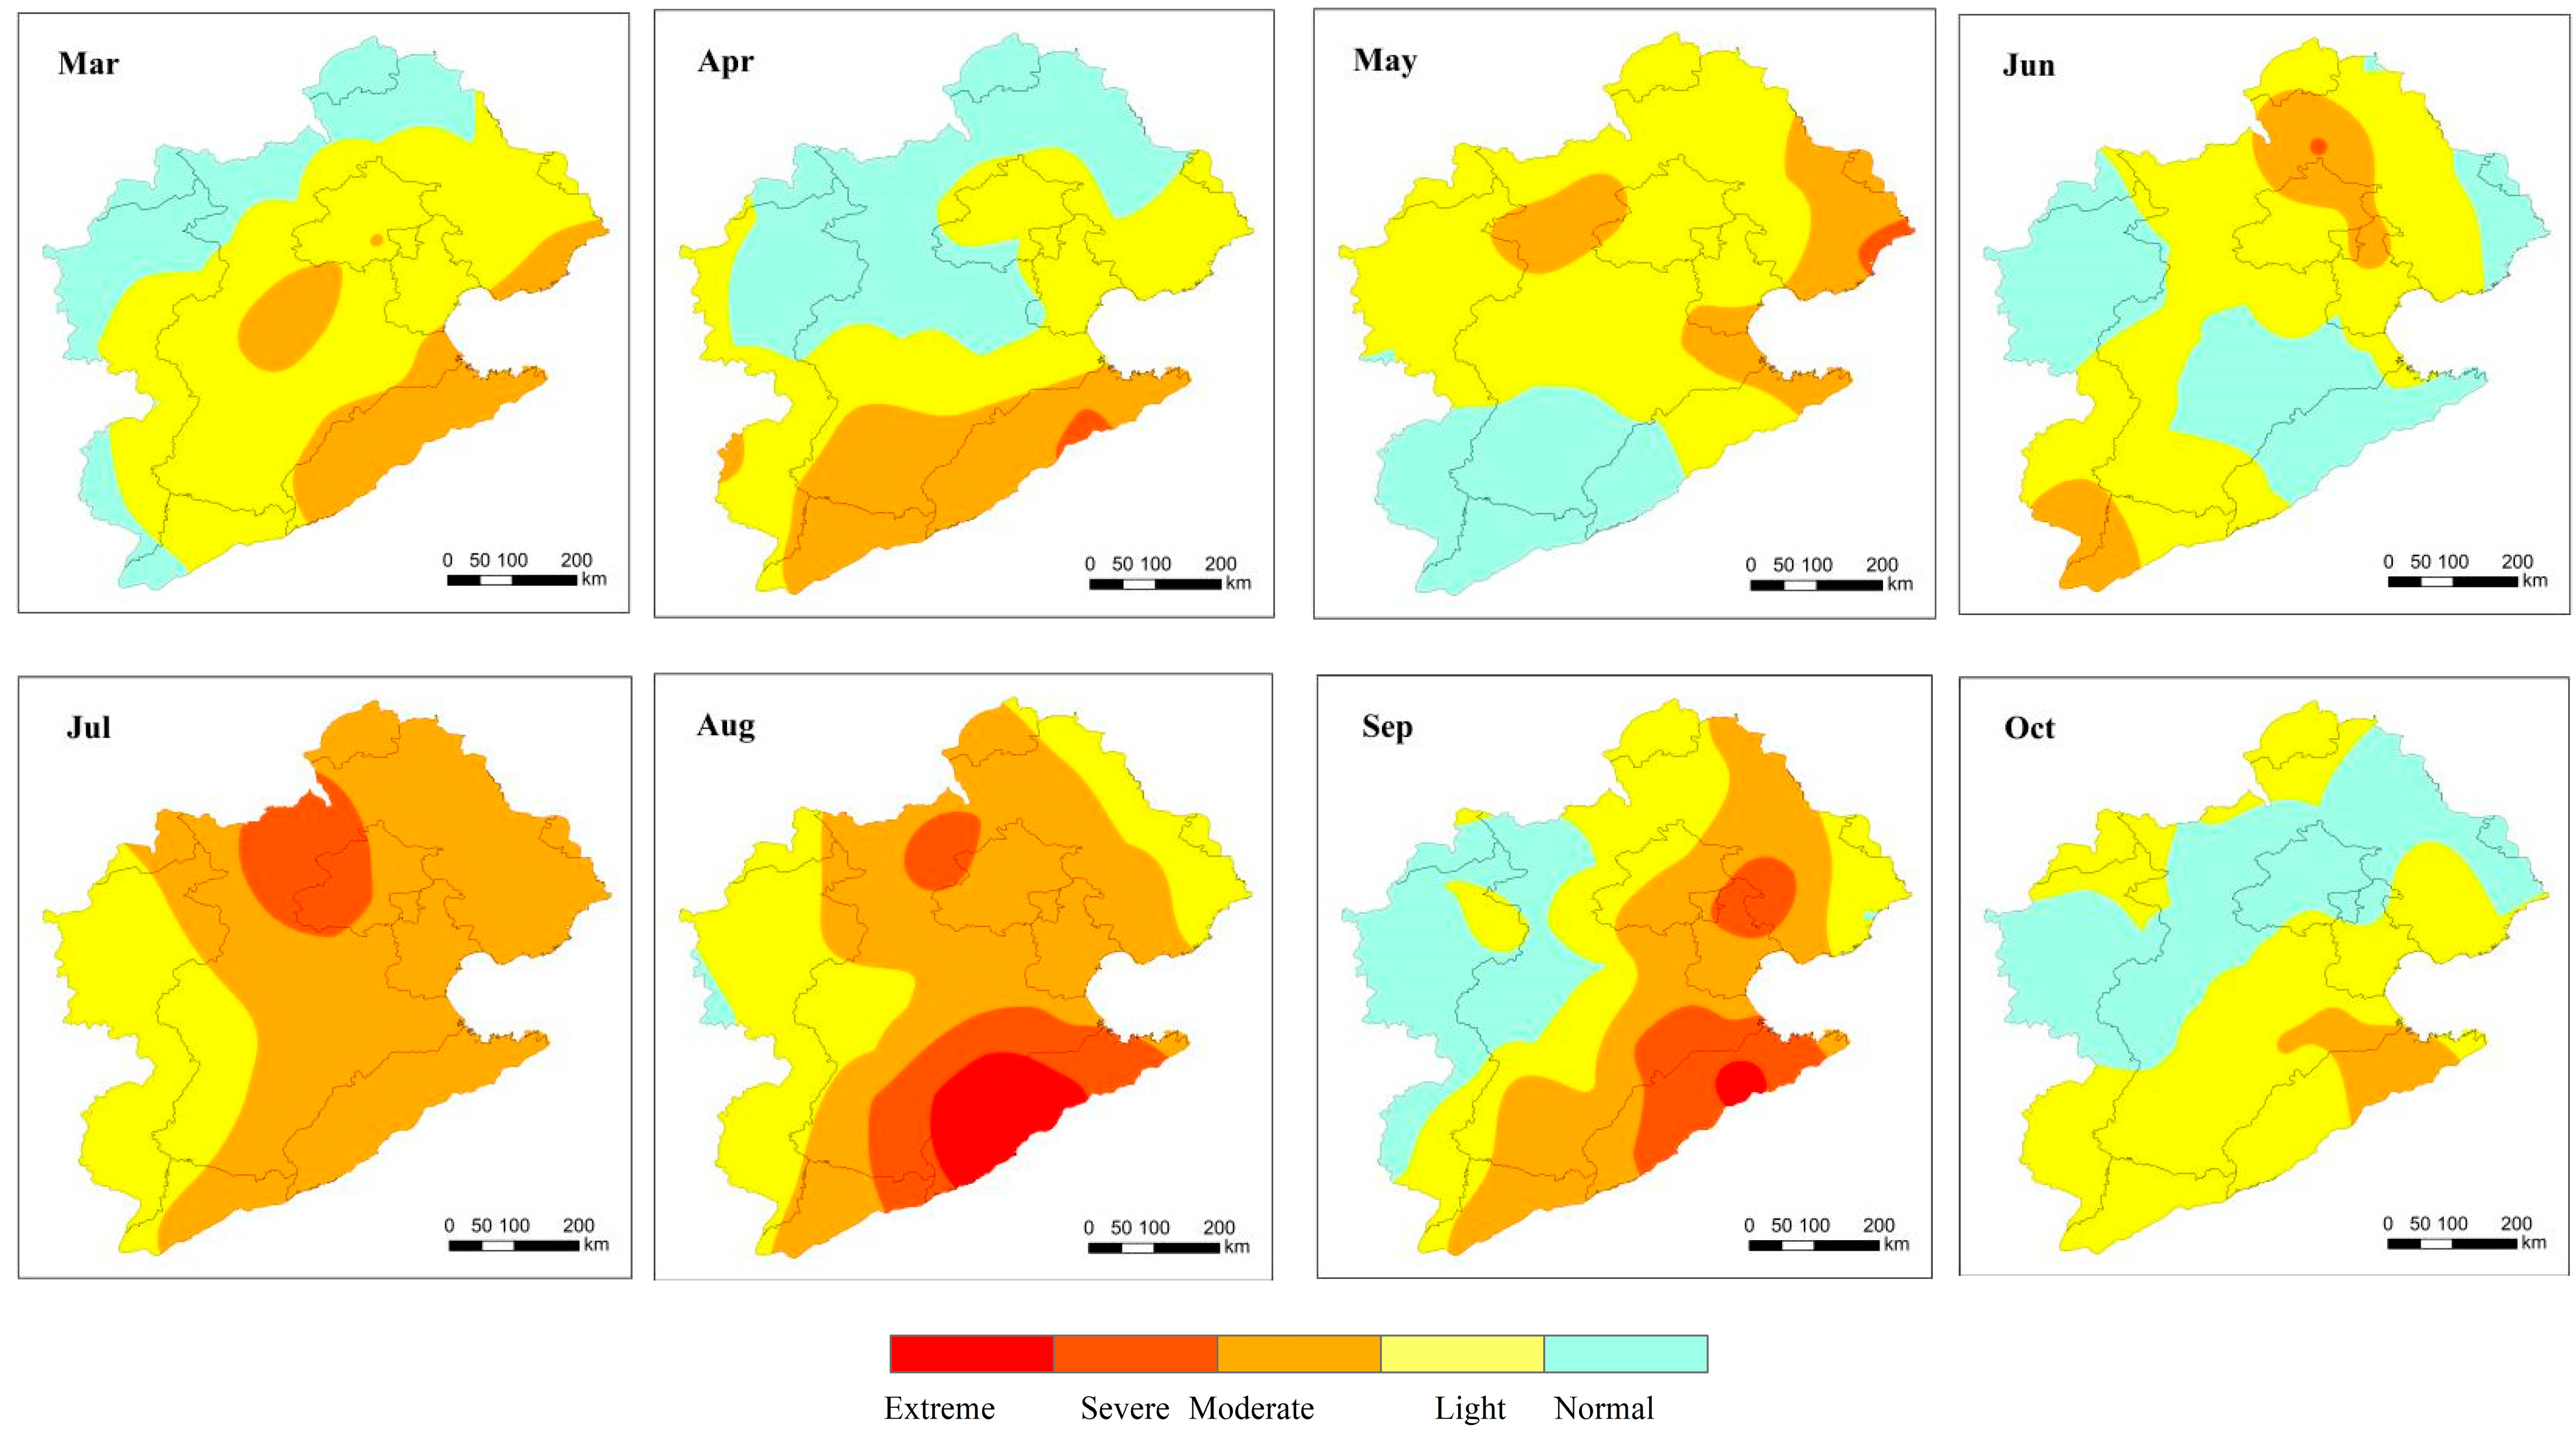
Figure 11 depicts the spatial distribution of agricultural drought in the Hai River Basin for 2002, as monitored by the original CMI. Comparing the monthly drought monitoring results with actual conditions reveals that the original CMI primarily identified drought areas in the central and southern parts of the Hai River Basin. In March and April, almost the entire plain region of the basin was in a state of drought, with moderate drought occurring in parts of northern Shandong and southern Hebei. The drought area identified by the original CMI in May and June was significantly larger than the actual drought area, and some regions in the northern part of the basin were identified as having moderate to severe drought, which was inconsistent with the actual conditions. According to the drought monitoring results from the original CMI, the drought rapidly intensified and expanded from the southeast to the northwest of the Hai River Basin in the summer, with most areas experiencing moderate drought and some regions in Shandong, northern Henan, and central and southern Hebei even experiencing severe to extreme drought. In September, the severity of the drought in Hebei and Shandong still had not been effectively alleviated. In October, most regions in Hebei still had light drought, and some areas in Shandong even had moderate drought. These findings indicate that the original CMI significantly overestimated the drought extent and severity in the Hai River Basin in 2002, highlighting the need for improvements in drought monitoring indices to better reflect actual conditions.
In summary, the original CMI shows considerable discrepancies when compared with actual drought conditions. In contrast, the improved CMI provides a more accurate representation of the spatial characteristics of agricultural drought and outperforms the original CMI in agricultural drought evaluation.

5. Discussion

Agricultural drought is a complex process resulting from the combined effects of multiple factors. Its occurrence, development, and termination are influenced not only by meteorological factors such as precipitation, temperature, and humidity but also by crop characteristics and agricultural irrigation [38,39]. Moreover, different crops have specific growth periods and water requirements (crop coefficients) and vary in their sensitivity to agricultural drought [40]. When moisture in the root zone is insufficient, inducing water stress, crop roots cannot obtain enough water to meet transpiration demands, thereby impairing their drought tolerance. Agricultural irrigation is an extremely important human factor in drought mitigation, and relevant studies have verified that irrigation can reduce the degree of crop drought [8]. While the CMI incorporates meteorological factors such as precipitation and temperature, it fails to fully account for the water requirements of different crop types and the impact of irrigation during different developmental stages. This study establishes an improved CMI-based agricultural drought assessment method by fully considering changes in crop water requirements and incorporating drought mitigation practices. Specifically, we introduce a crop coefficient and a water stress coefficient, and enhance the soil water balance equation using an irrigation threshold method informed by local irrigation practices. This method addresses the original CMI’s limitations of low sensitivity and accuracy in monitoring large-scale drought events in irrigated areas. Nevertheless, the study still has certain limitations, which are mainly reflected in the following aspects:
(1)
First, although the improvement of the soil water balance equation effectively enhanced the simulation results of soil moisture content at the annual and monthly scales, the accuracy of the weekly scale simulation results was not high. Due to the lack of specific information on irrigation timing, actual irrigation amount, and irrigation frequency, the irrigation threshold method had to be used in the soil hydrological simulation process to estimate the above information, and errors are inevitable. If accurate irrigation information is available, the simulation results of soil moisture and the assessment results of agricultural drought will be more reliable.
(2)
Second, the crop coefficients used in this study are constant values set for specific growth stages of different crops in different regions. They are scientific results derived from the research on the variation patterns of crop coefficients during the growth period by institutions such as FAO and the Chinese Academy of Sciences over the years and are widely applicable. However, these static crop coefficients have large differences between different regions and may result in spatial and temporal discontinuity in large-scale continuous drought monitoring results [39]. Future research can consider introducing dynamic crop coefficients that change with the growth process to enhance the accuracy of agricultural drought monitoring.
(3)
Finally, consistent with the principle of the original CMI, the improved CMI is also constructed based on the principle of soil water balance and may be more suitable for the northern dry farming areas. Whether it has advantages in drought monitoring in the southern paddy areas needs further discussion. In addition, since irrigated farmland accounts for most of the arable land in the Hai River Basin, this study did not consider the scattered non-irrigated farmland, which may cause errors in some local areas.
Despite these limitations, the study still has certain practical significance for guiding drought risk management and prevention in large-scale irrigated farming areas.

6. Conclusions

Based on the fundamental principles of the CMI, this study proposes an improved agricultural drought assessment method by incorporating crop coefficients and water stress coefficients and modifying the soil water balance equation with an irrigation threshold. This study selected the Hai River Basin as a case study to evaluate its applicability. The main conclusions are as follows:
(1)
Regarding soil moisture simulation across annual, monthly, and weekly scales, the improved soil water balance equation exhibits a multi-year average relative error of 5.1% between simulated and observed values, a significant improvement over the 26.2% error of the original equation. The monthly average relative errors of the improved equation are all below 20%, whereas those of the original equation exceed 20% in most months. Although some errors persist, the weekly soil moisture simulated by the improved equation more closely matches the observed variation trends and provides a more objective reflection of farmland soil moisture dynamics.
(2)
Regarding drought identification accuracy across annual, monthly, and weekly scales, the improved CMI achieves a higher accuracy across all time scales. The annual drought identification accuracy of the original CMI is 52.2%, while the improved index reaches 61.9%, an increase of 9.7%. From July to October, the improved CMI maintains accuracy rates above 60%, whereas the original index shows high accuracy only in August and September. The original CMI yields significantly lower values than the converted RSM index annually in spring, a pattern that is inconsistent with actual conditions. In contrast, the temporal dynamics of the improved CMI align more closely with those of the converted RSM index, and its drought monitoring results correspond better with actual conditions.
(3)
The spatial analysis of agricultural drought revealed that the original CMI indicated large areas of moderate drought in the Hai River Basin during the spring and summer–autumn of 2002, with severe to extreme drought in the southern region—a finding that significantly deviates from observed conditions. The improved CMI offers a more accurate description of the spatial characteristics of agricultural drought and outperforms the original index by providing a more accurate characterization of agricultural drought spatial patterns.
In summary, the improved CMI-based agricultural drought assessment method proposed in this study, which incorporates the role of agricultural irrigation, can more accurately reflect actual soil moisture changes, enhance the precision of agricultural drought monitoring, and overcome the shortcomings of the original CMI for large-scale irrigated agricultural regions.

Author Contributions

M.Y. and X.L. came up with the idea and designed the study; X.L. and J.X. performed the analysis and wrote the paper; H.J., X.Z., and L.S. helped in collecting and analyzing the data. All authors have read and agreed to the published version of the manuscript.

Funding

The study was financially supported by the National Key Research and Development Program of China (Grant No. 2022YFC3202300), the National Natural Science Foundation of Hubei Province (No. 2024AFB012), the Natural Science Foundation of Hubei Province (No. 2022CFD037) and the National Public Research Institutes for Basic R&D Operating Expenses Special Project [grant numbers CKSF20241018/SZ].

Data Availability Statement

The original contributions presented in this study are included in the article. Further inquiries can be directed to the corresponding authors.

Conflicts of Interest

The authors declare no conflicts of interest.

References

  1. Ni, S.; Wang, H.; Liu, J.; Gu, Y. Characteristics and causes of agricultural drought disasters in China. Chin. Agric. Sci. Bull. 2022, 38, 106–111. (In Chinese) [Google Scholar]
  2. Li, Y.; Chang, J.; Fan, J.; Yu, B. Agriculaural drought evolution characteristics and driving mechanisms in the Yellow River Basin under climate and land use changes. Trans. Chin. Soc. Agric. Eng. 2021, 37, 84–93. (In Chinese) [Google Scholar]
  3. Zhang, Y.; Wu, Z.; Singh, V.P.; Lin, Q.; Ning, S.; Zhou, Y.; Jin, J.; Zhou, R.; Ma, Q. Agricultural drought characteristics in a typical plain region considering irrigation, crop growth, and water demand impacts. Agric. Water Manag. 2023, 282, 108266. [Google Scholar] [CrossRef]
  4. Li, Z.; Hao, Z.; Shi, X.; Déry, S.J.; Li, J.; Chen, S.; Li, Y. An agricultural drought index to incorporate the irrigation process and reservoir operations: A case study in the Tarim River Basin. Glob. Planet. Change 2016, 143, 10–20. [Google Scholar] [CrossRef]
  5. Hu, J.; Jin, M.; Shi, P. Drought vulnerability assessment of winter wheat in eastern region of Gansu Province under different irrigation levels. J. Catastrophology 2022, 37, 178–183. (In Chinese) [Google Scholar]
  6. Xu, J.; Ju, H.; Mei, X.; Liu, Q.; Yang, J. Simulation on potential effects of drought on winter wheat in Huang-Huai-Hai Plain from 1981 to 2010. Trans. Chin. Soc. Agric. Eng. 2015, 31, 150–158. (In Chinese) [Google Scholar]
  7. Lu, J.; Carbone, G.J.; Gao, P. Detrending crop yield data for spatial visualization of drought impacts in the United States, 1985–2014. Agric. For. Meteorol. 2017, 237–238, 196–208. [Google Scholar] [CrossRef]
  8. Li, C.; You, S.; Wu, Y.; Wang, Y. Improved crop water deficit index for monitoring drought disaster change process of spring maize in the Northeast China. Trans. Chin. Soc. Agric. Eng. (Trans. CSAE) 2019, 35, 175–185. (In Chinese) [Google Scholar]
  9. Wu, D. Creation of Drought Index for Winter Wheat Based on Effective Soil Moisture and Evapotranspiration on the North China Plain. Ph.D. Thesis, Nanjing University of Information Science and Technology, Nanjing, China, 2021. (In Chinese). [Google Scholar]
  10. Sakamoto, C.M. The Z-index as a variable for crop yield estimation. Agric. Meteorol. 1978, 19, 305–313. [Google Scholar] [CrossRef]
  11. Palmer, W.C. Keeping track of crop moisture conditions, nationwide: The new Crop Moisture Index. Weather Wise 1968, 21, 156–161. [Google Scholar] [CrossRef]
  12. Meyer, S.J.; Hubbard, K.G.; Wilhite, D.A. A Crop-Specific Drought Index for maize: I. Model Development and Validation. Agron. J. 1993, 85, 388–395. [Google Scholar] [CrossRef]
  13. Narasimhan, B.; Srinivasan, R. Development and evaluation of Soil Moisture Deficit Index (SMDI) and Evapotranspiration Deficit Index (ETDI) for agricultural drought monitoring. Agric. For. Meteorol. 2005, 133, 69–88. [Google Scholar] [CrossRef]
  14. Huang, W.; Yang, X.; Qu, H.; Feng, L.; Huang, B.; Wang, J.; Shi, S.; Wu, Y.; Zhang, X.; Xiao, X.; et al. Analysis of spatio-temporal characteristic on seasonal drought of spring maize based on crop water deficit index. Trans. Chin. Soc. Agric. Eng. (Trans. CSAE) 2009, 25, 28–34. (In Chinese) [Google Scholar]
  15. Hao, Z.; Aghakouchak, A. A Nonparametric Multivariate Multi-Index Drought Monitoring Framework. J. Hydrometeorol. 2014, 15, 89–101. [Google Scholar] [CrossRef]
  16. Shafer, B.A.; Dezman, L.E. Development of a Surface Water Supply Index (SWSI) to assess the severity of drought conditions in snowpack runoff areas. In Proceedings of the Western Snow Conference, Reno, Nevada, 19–23 April 1982; Colorado State University: Fort Collins, CO, USA, 1982; pp. 164–175. [Google Scholar]
  17. Kogan, F.N. Droughts of the late 1980s in the United States as derived from NOAA polar-orbiting satellite data. Bull. Am. Meteorol. Soc. 1995, 76, 655–668. [Google Scholar] [CrossRef]
  18. Palmer, W.C. Meteorological Drought; U.S. Department of Commerce Weather Bureau Research Paper; U.S. Department of Commerce, Weather Bureau: Washington, DC, USA, 1965.
  19. Ye, J.; Shen, S.; Lu, H. Application of modified palmer drought severity index in agricultural drought monitoring. Chin. J. Agro-Meteorol. 2009, 30, 257–261. (In Chinese) [Google Scholar]
  20. Kang, J.; Zi, X.; Wang, S.; He, L. Evaluation and Optimization of Agricultural Water Resources Carrying Capacity in Haihe River Basin, China. Water 2019, 11, 999. [Google Scholar] [CrossRef]
  21. Li, H.; Wang, Q.; Zuo, M.; Long, X.; Zang, X. Scale effects and driving mechanisms of flood in a multilevel sub-basin perspective—A case study of Haihe River Basin, China. Environ. Impact Assess. Rev. 2025, 115, 107984. [Google Scholar] [CrossRef]
  22. Zhao, A.; Zhang, W.; Zou, L.; Cao, S.; Yue, Y.; Sa, Q. Characteristics of propagation from meteorological to hydrological drought under natural conditions in the Haihe River Basin of China: Time, probability, and threshold. J. Hydrol. Reg. Stud. 2025, 59, 102359. [Google Scholar] [CrossRef]
  23. Yang, M.; Xiao, W.; Zhao, Y.; Li, X.; Lu, F.; Lu, C.; Chen, Y. Assessing Agricultural Drought in the Anthropocene: A Modified Palmer Drought Severity Index. Water 2017, 9, 725. [Google Scholar] [CrossRef]
  24. Wang, A.; Shi, X. A Multilayer Soil Moisture Dataset Based on the Gravimetric Method in China and Its Characteristics. J. Hydrometeorol. 2019, 20, 1721–1736. [Google Scholar] [CrossRef]
  25. Shang, S.; Mao, X.; Lei, Z.; Yang, S. Simulation Model on Soil Water Dynamics and Its Application; Science Press: Beijing, China, 2009. (In Chinese) [Google Scholar]
  26. Allen, R.G.; Pereira, L.S.; Raes, D.; Smith, M. Crop Evapotranspiration: Guidelines for Computing Crop Water Requirements. Irrigation and Drainage Paper No. 56; Food and Agriculture Organization of the United Nations (FAO): Rome, Italy, 1998. [Google Scholar]
  27. Thomas, J.; Jack, K. The Crop Moisture Index Unnatural Response to Changes in Temperature. J. Appl. Meteorol. 1978, 17, 1864–1866. [Google Scholar] [CrossRef]
  28. Thornthwaite, C.W. An approach toward a rational classification of climate. Geogr. Rev. 1948, 38, 55–94. [Google Scholar] [CrossRef]
  29. Trajkoric, S. Temperature-based approaches for estimating reference evapotranspiration. J. Irrig. Drain. Eng. 2005, 131, 316–325. [Google Scholar] [CrossRef]
  30. Li, Y.; Wang, W.; Wang, G.; Liu, C.; Zheng, H.; Ma, Z. The applicability of various potential evapotranspiration estimation methods in the headwater area of the Yellow River. Hydrogeol. Eng. Geol. 2021, 48, 10–19. (In Chinese) [Google Scholar]
  31. Liu, X.; Li, Y.; Wang, Q. Evaluation on several temperature-based methods for estimating reference crop evapotranspiration. Trans. Chin. Soc. Agric. Eng. (Trans. CSAE) 2006, 22, 12–18. (In Chinese) [Google Scholar]
  32. Liu, Z.; Yan, A.; Qiao, C. Research on application pf Palmer drought model in Jinghuiqi irrigation area. Agric. Res. Arid. Areas 2010, 28, 259–264. (In Chinese) [Google Scholar]
  33. Xiao, J.; Liu, Z.; Liu, X.; Liu, Z.; Chen, Y. Analysis and study on irrigation problem of main spring maize area in China. Water Sav. Irrig. 2010, 4, 1–7. (In Chinese) [Google Scholar]
  34. GB/T 32136-2015; Grade of Agricultural Drought. Standards Press of China: Beijing, China, 2015. (In Chinese)
  35. Zou, X.; Zhai, P.; Zhang, Q. Variations in droughts over China: 1951–2003. Geophys. Res. Lett. 2005, 32, 353–368. [Google Scholar] [CrossRef]
  36. Rong, Y.; Duan, L.; Xu, M. Analysis on Climatic diagnosis of Persistent drought in North China during the period from 1997 to 2002. Arid. Zone Res. 2008, 25, 842–850. (In Chinese) [Google Scholar]
  37. Gu, R.; Tang, Z. Analysis of the Cause of Drought in Shandong in the Summer 2002. Meteorol. Mon. 2004, 30, 22–26. (In Chinese) [Google Scholar]
  38. Feng, J.; Wang, Z. A review on evapotranspiration estimation models using remotely sensed data. J. Hydraul. Eng. 2012, 39, 914–925. (In Chinese) [Google Scholar]
  39. Zhou, L.; Wu, J.; Zhang, J. Remote sensing-based drought monitoring approach and research progress. Sci. Geogr. Sin. 2015, 35, 630–636. (In Chinese) [Google Scholar]
  40. Liang, X.; Wang, X.; Zhao, X.; Cao, T. Drought resistance comparison of main maize varieties in west semiarid areas of jilin province. Mol. Plant Breed. 2018, 16, 4466–4472. (In Chinese) [Google Scholar]
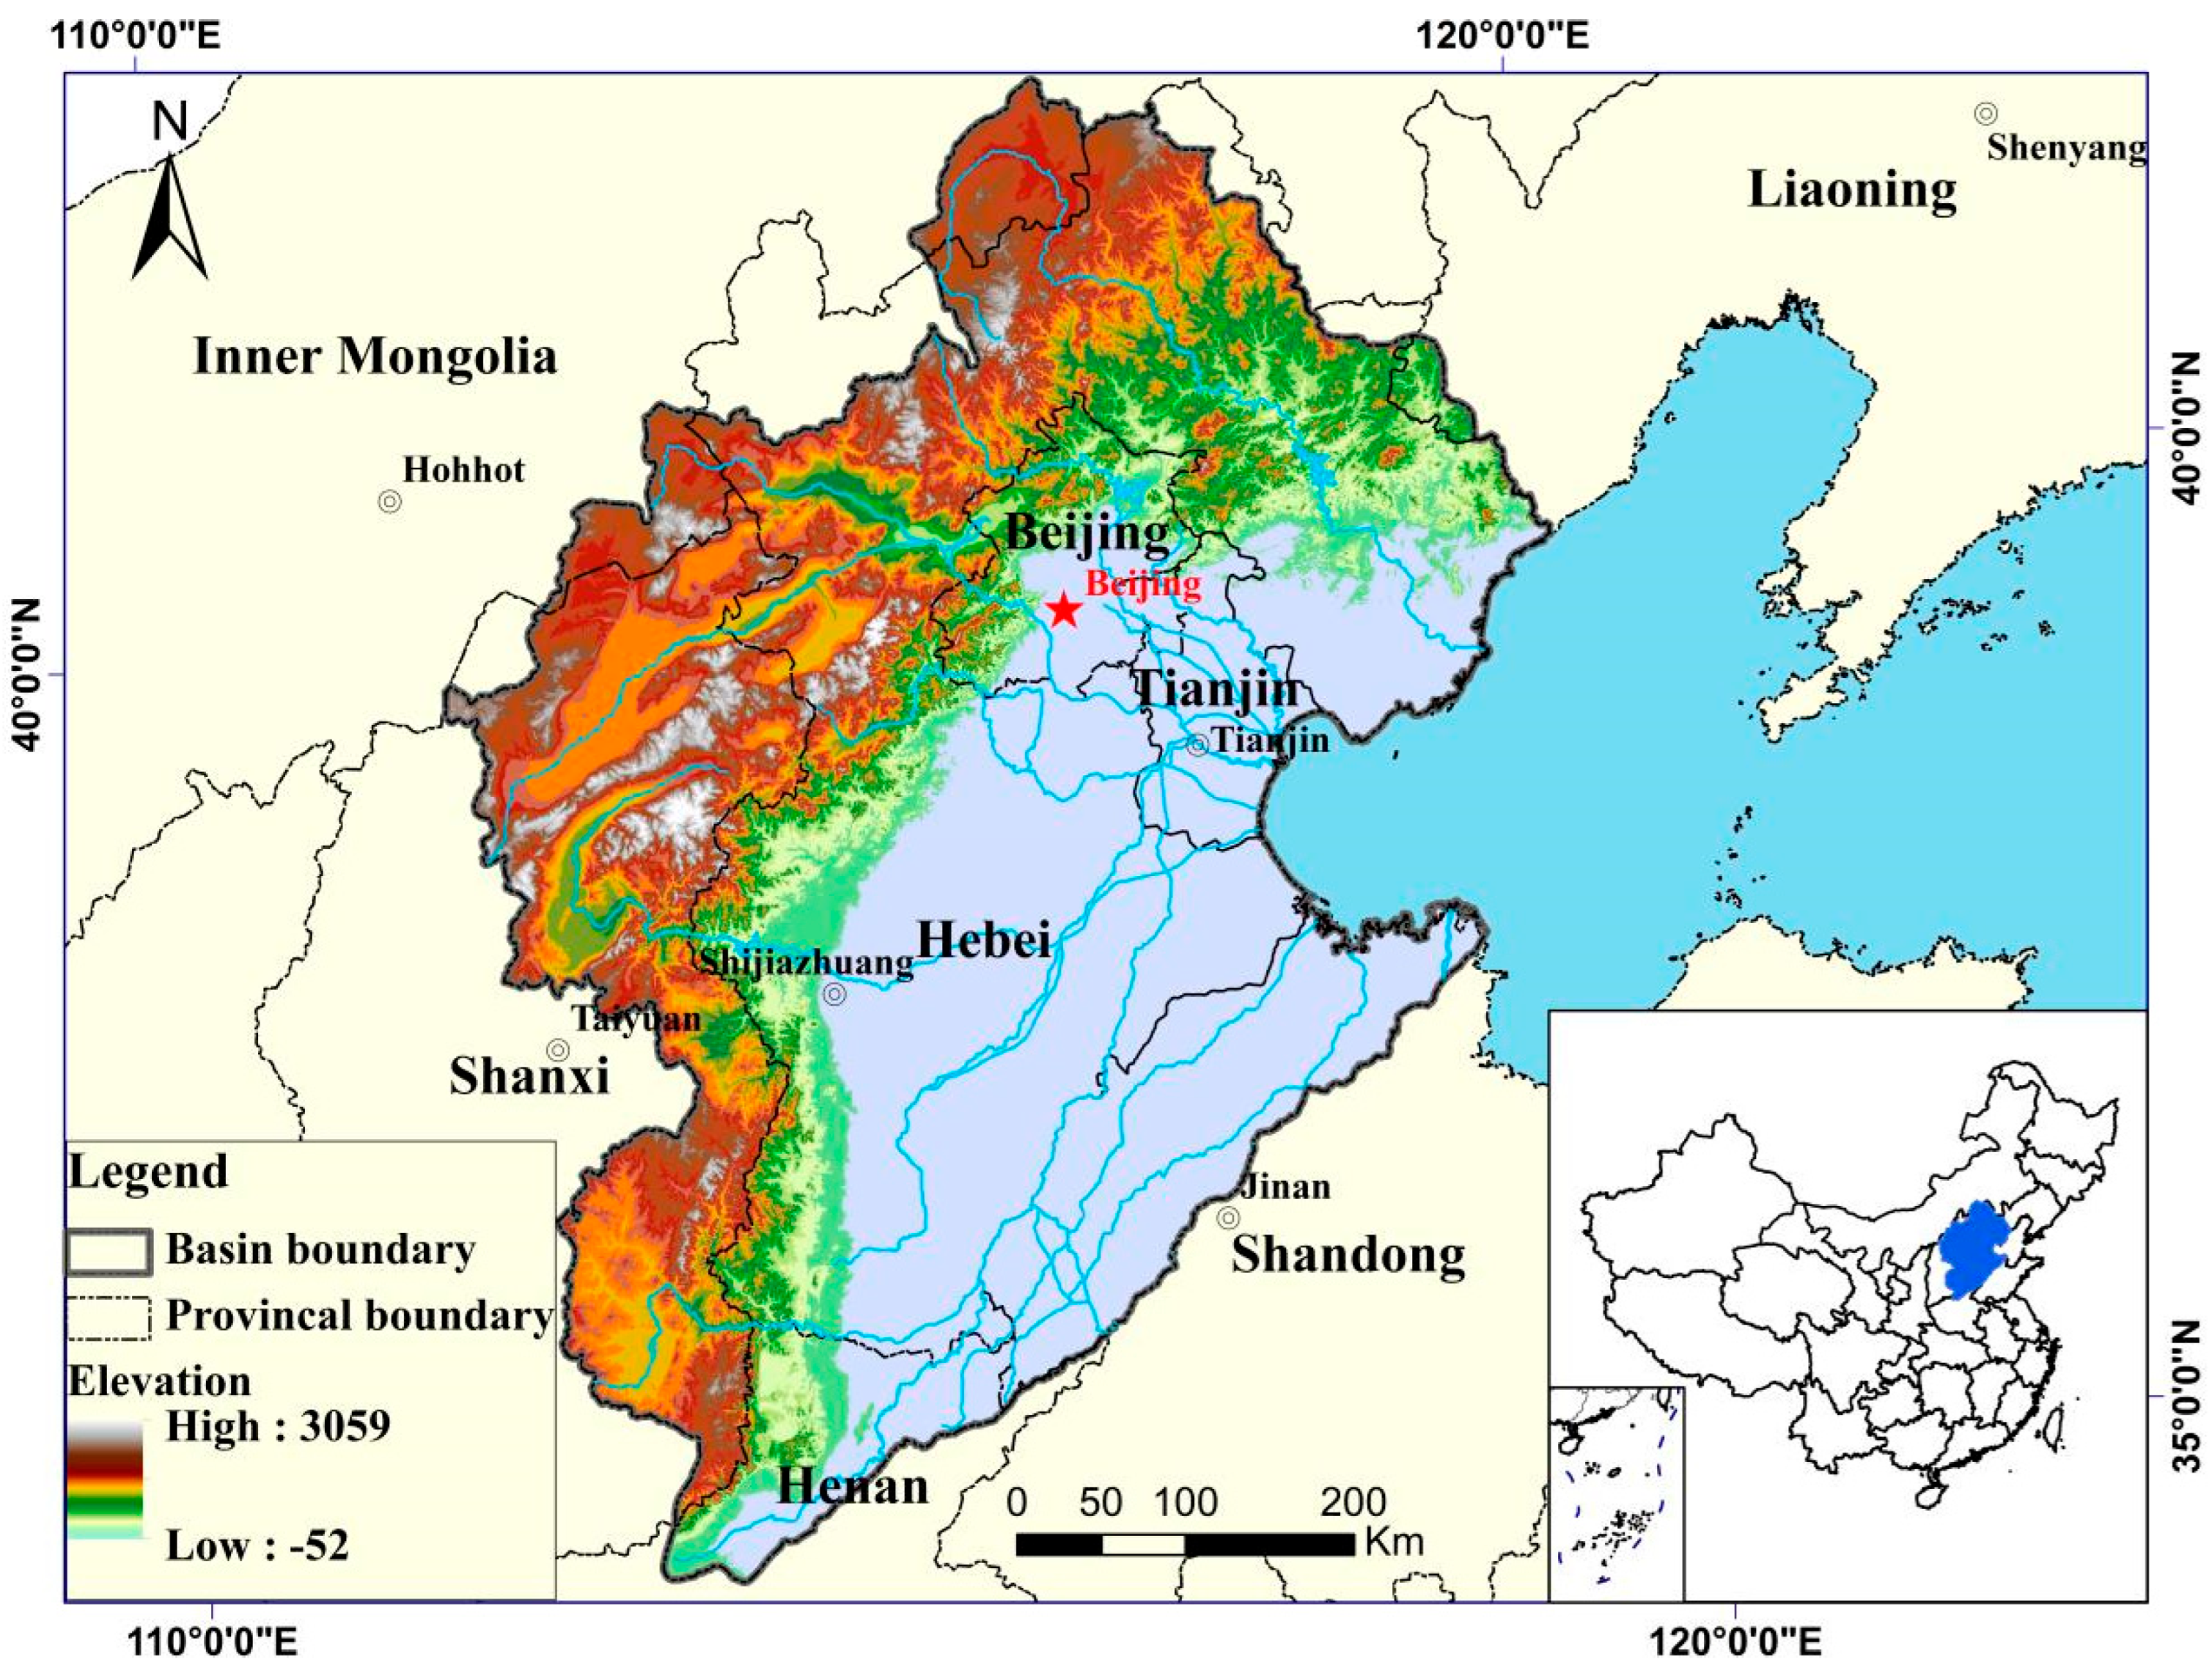
Figure 1. The location and topography of the Haihe River Basin in China.
Water 17 03372 g001
Figure 2. The distribution of Meteorological Stations in the Haihe River Basin.
Water 17 03372 g002
Figure 3. Comparison of multi-year average relative errors in soil moisture derived from original and improved water balance equations at 32 stations in the Haihe River Basin during 1993–2012. Note: * p-values > 0.05 (Improved equation); # p-values > 0.05 (Original equation).
Water 17 03372 g003
Figure 4. Monthly relative error of the original and improved soil water balance equations in Haihe River Basin during 1993–2012.
Water 17 03372 g004
Figure 5. Comparison between weekly simulated and observed soil moisture derived from original and improved water balance equations from 1993 to 2012 at three stations: (1) Luancheng, (2) Liaocheng, and (3) Baodi.
Water 17 03372 g005aWater 17 03372 g005b
Figure 6. Annual drought identification accuracy rate of the original and improved CMI of 32 stations in the Haihe River Basin during 1993–2012. Note: * p-values > 0.05 (Improved CMI); # p-values > 0.05 (Original CMI).
Water 17 03372 g006
Figure 7. Monthly drought identification accuracy rate of the original and improved CMI in the Haihe river basin during 1993–2012.
Water 17 03372 g007
Figure 8. Time series plot of the two weekly CMIs from 1993 to 2012 at three stations: (1) Luancheng, (2) Liaocheng, and (3) Baodi.
Water 17 03372 g008
Figure 9. Spatial distribution of drought grade based on the RSM in the Haihe River Basin from March to October 2002.
Water 17 03372 g009
Figure 10. Spatial distribution of drought grade based on the improved CMI in the Haihe River Basin from March to October 2002.
Water 17 03372 g010
Figure 11. Spatial distribution of drought grade based on the original CMI in the Haihe River Basin from March to October 2002.
Water 17 03372 g011
Table 2. CMI and RSM classification of drought grades.
Drought GradeCMI aRSM (%) b
ClayLoamSand
Normal≥0.0≥55≥60≥65
Light drought0.0~−0.9945~5550~6055~65
Moderate drought−1.00~−1.9935~4540~5045~55
Severe drought−2.00~−2.9925~3530~4035~45
Extreme drought≤−3.00<25<30<35
Notes: a The data was obtained from Palmer [11]; b The data was obtained from Agricultural Drought Level (GB/T 32136-2015).
Disclaimer/Publisher’s Note: The statements, opinions and data contained in all publications are solely those of the individual author(s) and contributor(s) and not of MDPI and/or the editor(s). MDPI and/or the editor(s) disclaim responsibility for any injury to people or property resulting from any ideas, methods, instructions or products referred to in the content.