Article

Estimation of Soil Erosion and Enhancing Sediment Retention in the Lam Phra Phloeng Watershed: Insights from RUSLE and InVEST Modelling

by
Uma Seeboonruang
1,
Ranadheer Mandadi
1,*,
Prapas Thammaboribal
2,
Arlene L. Gonzales
3 and
Ganni S. V. S. A. Bharadwaz
4
1
Civil Engineering Department, School of Engineering, King Mongkut’s Institute of Technology Ladkrabang, Bangkok 10520, Thailand
2
Remote Sensing and Geographic Information Systems FoS, Asian Institute of Technology, Pathum Thani 12120, Thailand
3
College of Agriculture, Food and Sustainable Development, Department of Environmental Science, Mariano Marcos State University, City of Batac 2906, Philippines
4
Disaster Preparedness, Mitigation and Management, Asian Institute of Technology, Pathum Thani 12120, Thailand
*
Author to whom correspondence should be addressed.
Water 2025, 17(23), 3339; https://doi.org/10.3390/w17233339
Submission received: 6 September 2025 / Revised: 29 October 2025 / Accepted: 18 November 2025 / Published: 21 November 2025
(This article belongs to the Section Water Erosion and Sediment Transport)

Abstract

The increasing rate of land use change, particularly deforestation and agricultural expansion, has intensified soil degradation, leading to reduced sediment retention and accelerated soil erosion. This study aims to analyze soil erosion and sediment retention in the Lam Phra Phloeng (LPP) watershed, Thailand, using a coupled modelling approach integrating the Revised Universal Soil Loss Equation (RUSLE) and the Sediment Delivery Ratio (SDR) model from the Integrated Valuation of Ecosystem Services and Tradeoffs (InVEST) suite. Six land use classes (forest, cropland, rangeland, flooded vegetation, built-up areas, and water bodies) were identified using Sentinel-2 MSI satellite data, with a Random Forest (RF) classification algorithm achieving an overall accuracy of 91.3% (Kappa coefficient = 0.89). The results indicate that forested areas exhibit the highest sediment retention, whereas croplands and rangelands experience the most significant soil loss due to erosion. The RUSLE model estimated an average annual soil loss ranging between 50 and 90 tons/ha/year, with the highest erosion rates observed in agricultural lands with steep slopes and minimal vegetation cover. The InVEST SDR model further corroborates these findings, showing that sediment retention is predominantly concentrated in densely vegetated areas, reinforcing the crucial role of natural forests in preventing soil displacement. This complementary modelling approach identifies priority areas for soil conservation practices. This study is the first study to integrate the RUSLE and InVEST models for the Lam Phra Phloeng watershed, providing a coupled assessment of erosion risk and sediment retention capacity and offering a novel and transferable framework for watershed-scale conservation planning and soil management in tropical monsoonal environments.

1. Introduction

Soil is a non-renewable and invaluable natural resource that provides essential goods and services critical to sustaining ecosystems and life forms [1]. Soil is a major carbon reservoir that sequesters carbon dioxide and, in certain ecosystems, methane, thereby contributing to climate stability [1]. However, the growing demand for agriculture has driven the conversion of forests and grasslands into cultivated fields and pastures. Moreover, one-fifth of the world’s farmland is at risk of soil erosion, which increased by 2.5% between 2001 and 2012, largely due to crop expansion and deforestation [2]. This shift from natural vegetation to agriculture can hinder soil preservation [3]. The cultivation of various crops, such as cotton, coffee, soybeans, palm oil, and wheat, can exacerbate soil erosion, compromising the soil’s natural capacity to regenerate [4]. In turn, the resultant soil erosion reduces agricultural productivity, degrades various ecosystem functions, intensifies hydrogeological risks such as floods and landslides, causes significant loss to biodiversity, harms urbanized infrastructure, and, in extreme scenarios, displaces the human population [5].
At the global level, land degradation and soil erosion have emerged as major threats to food production, ecosystem functioning, and carbon balance. These global patterns are mirrored in many developing nations, where rapid agricultural expansion and deforestation have accelerated erosion. Thailand exemplifies this broader trend, as the country is undergoing rapid urbanization and agricultural intensification that have transformed its land management systems [6]. This drives soil degradation through erosion, contamination, nutrient depletion, compaction, acidification, salinization, and biodiversity loss [7]. The country’s main forms of soil degradation are water erosion (65.5%), physical (24.3%), chemical (7.3%), and biological degradation (2.9%) [8]. Agricultural practices on steep upland slopes significantly contribute to deforestation and further soil degradation by erosion, resulting in various environmental challenges [9]. The intensive cultivation of crops in these upland regions has also led to substantial nutrient loss, accelerated by soil erosion [10].
Around half of the planet’s topsoil has been degraded in the past 150 years [3]. Approximately 33% of global croplands are moderately or highly degraded, with an increasing proportion of croplands wherein external inputs, including fertilizers and pesticides, often obscure the true extent of soil degradation [11]. Approximately 80% of arable land worldwide is affected by at least some form of degradation, including aridity, soil salinization, depletion of soil carbon, and decline of vegetation [2]. Due to the degradation and erosion of soil, soil health is threatened by salinization, acidification, nutrient imbalances, soil organic matter (SOM) loss, and the decline of soil biodiversity [11].
Soil erosion and degradation negatively impact a population of 3.2 billion, which is 40% of the global population, posing a direct threat to global food security and well-being [2]. Soil degradation poses a significant threat to the global food supply, resulting in the depletion of land ranging from 36 to 75 billion tons each year and causing freshwater shortages [12,13,14]. It is projected to lower food productivity worldwide by 12% and increase food prices by up to 30% by 2040 [2]. The situation’s urgency is heightened since fertile soil layers cannot be replaced easily. Hence, the faster rate at which organic material in the soil layer is depleting is 50–100 times more than it can be naturally replenished [15].
Soil erosion remains a significant challenge that restricts agricultural and forestry productivity [16]. In Thailand, rapid soil erosion brought on by both anthropogenic and climatic factors has put agricultural output and land productivity at risk. While other sections of Thailand are attempting to solve this issue through management strategies, no such initiatives have been taken in the LPP watershed. This is due to the lack of a baseline report upon which land managers and policymakers may depend and take appropriate actions. Currently, a handful of studies can be found online that address soil erosion at LPP, and the majority of these studies involve only one model, either RUSLE or InVEST.
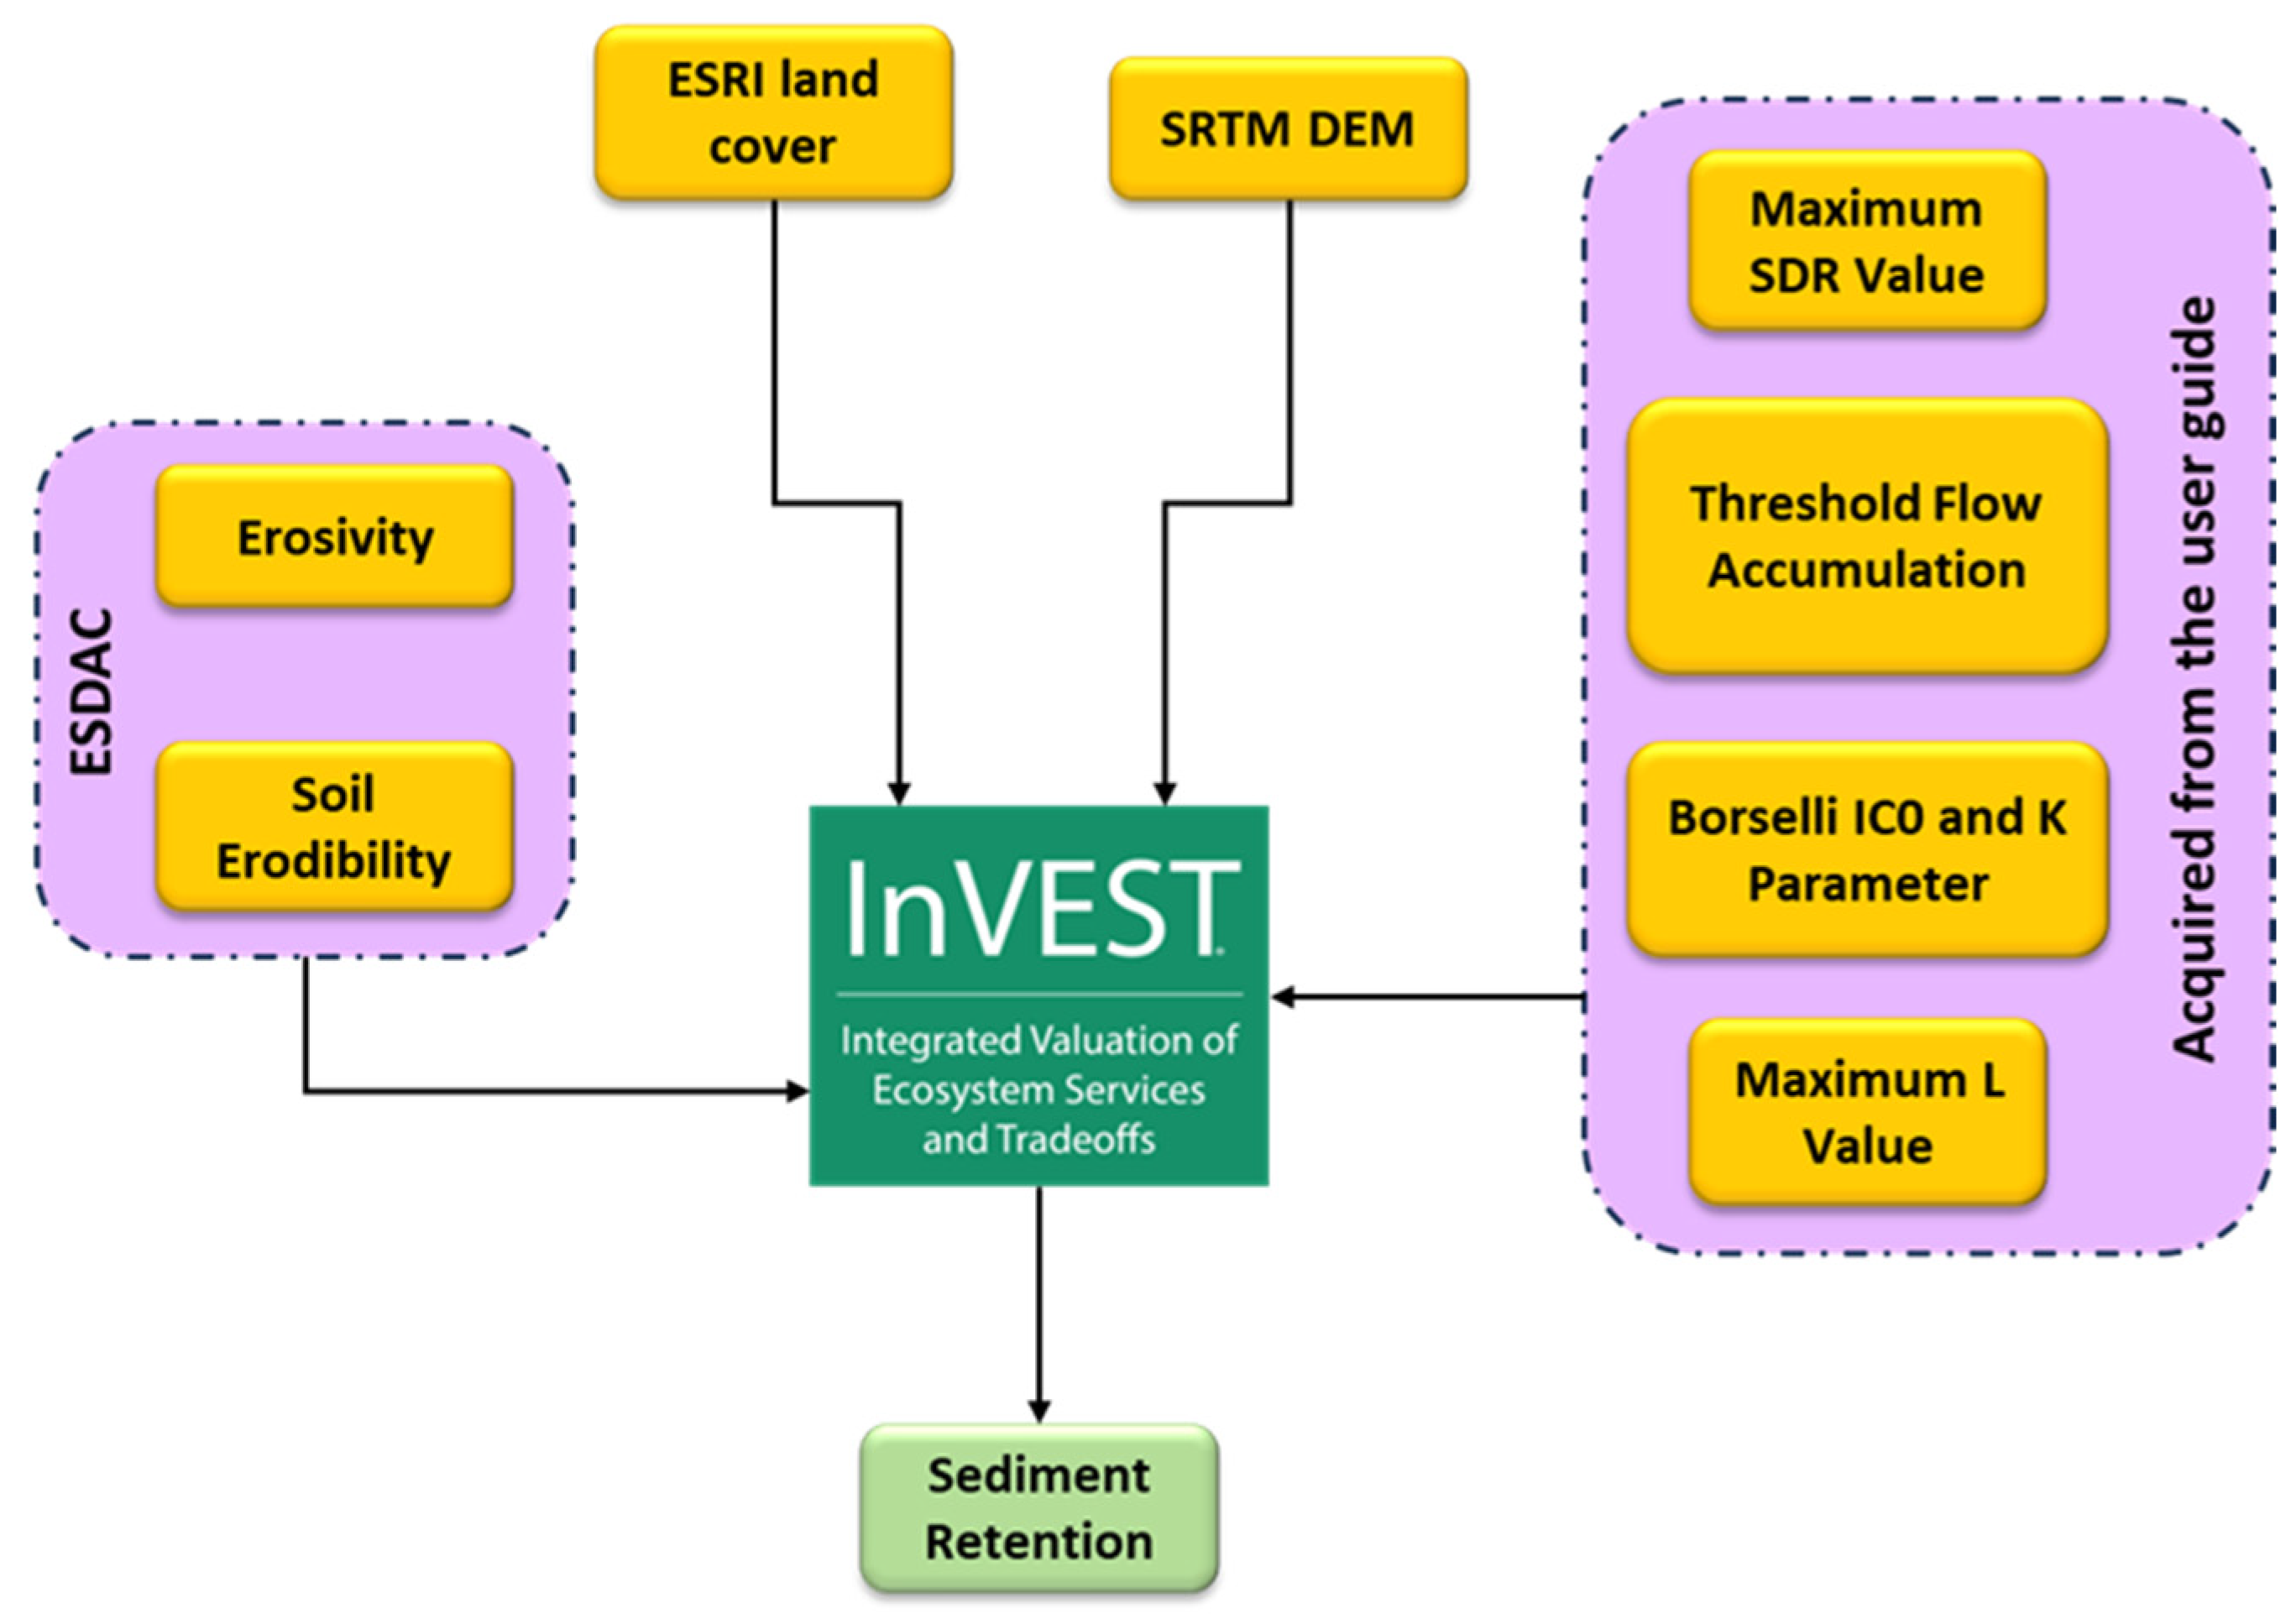
Therefore, this study focuses on analyzing soil erosion and sediment delivery in the LPP using a coupled modelling approach that involves the Revised Universal Soil Loss Equation (RUSLE) and Sediment Delivery Ratio (SDR) model of Integrated Valuation of Ecosystem Services and Tradeoffs (InVEST). The InVEST tool has been widely applied to assess sediment and nutrient dynamics under climate and land use change scenarios [17]. Although higher-resolution local soil data are limited, the dominant silty loam soils are fairly uniform, and the integration with high-resolution DEM and land cover ensures realistic erosion estimates. An investigation on sediment delivery was carried out using the SDR model of InVEST while accounting for factors like topography, land cover, and hydrological processes. This coupled modelling framework (described in Figure 1) was implemented to assess the synergistic impacts of land use change on soil erosion and sediment yield, considering the spatial and temporal dynamics of these processes.
InVEST and RUSLE were chosen for their simplicity of usage and applicability in this study [18,19]. Although models such as Artificial Neural Networks (ANN), Water Erosion Prediction Project (WEPP), and Soil and Water Assessment Tool (SWAT) have significant advantages [20,21] these also have shortcomings that are incompatible with this study’s coupled modelling approach. Even though the ANN models are useful for prediction, they require a large amount of data and fail to provide the necessary knowledge to investigate the interplay between sediment delivery and soil erosion, which has been critical for investigation [20]. The SWAT, a physically based and semi-distributed model, simulates watershed hydrology, water quality, sediment fluxes, and soil erosion. However, SWAT is highly data-intensive and requires complex scripting for data transfer [21]. which exceeds the scope of this study. Also, the challenges posed by its workflows and calibration programme [1,22] makes it unsuitable for the coupled modelling framework adopted in this study. Similarly, WEPP, a process-based model, requires detailed soil, topographic, and climatic data [21], which are unavailable for the study area (LPP). Consequently, its complexity surpasses the scope of this study, making the simpler InVEST SDR and RUSLE models more appropriate for this study.
Recent studies show that integrating soil-erosion models with sediment-delivery frameworks improves targeting of conservation measures. Combining gross soil-loss estimates with sediment export pathways enhances ecosystem-service assessment and land use planning [23]. This paper’s use of RUSLE with InVEST-SDR aligns with these emerging best practices in tropical watershed research.
The objective of this study is to quantify the spatial patterns of soil erosion and sediment retention in the Lam Phra Phloeng watershed using an integrated RUSLE–InVEST modelling framework, in order to identify priority areas for soil conservation and sustainable land management.
This is the first study to integrate RUSLE and InVEST models for the Lam Phra Phloeng watershed to provide a coupled assessment of erosion risk and sediment retention capacity. The approach bridges empirical and ecosystem-service-based modelling, offering a practical decision-support tool for land and water resource management in a monsoonal tropical watershed.

2. Study Area

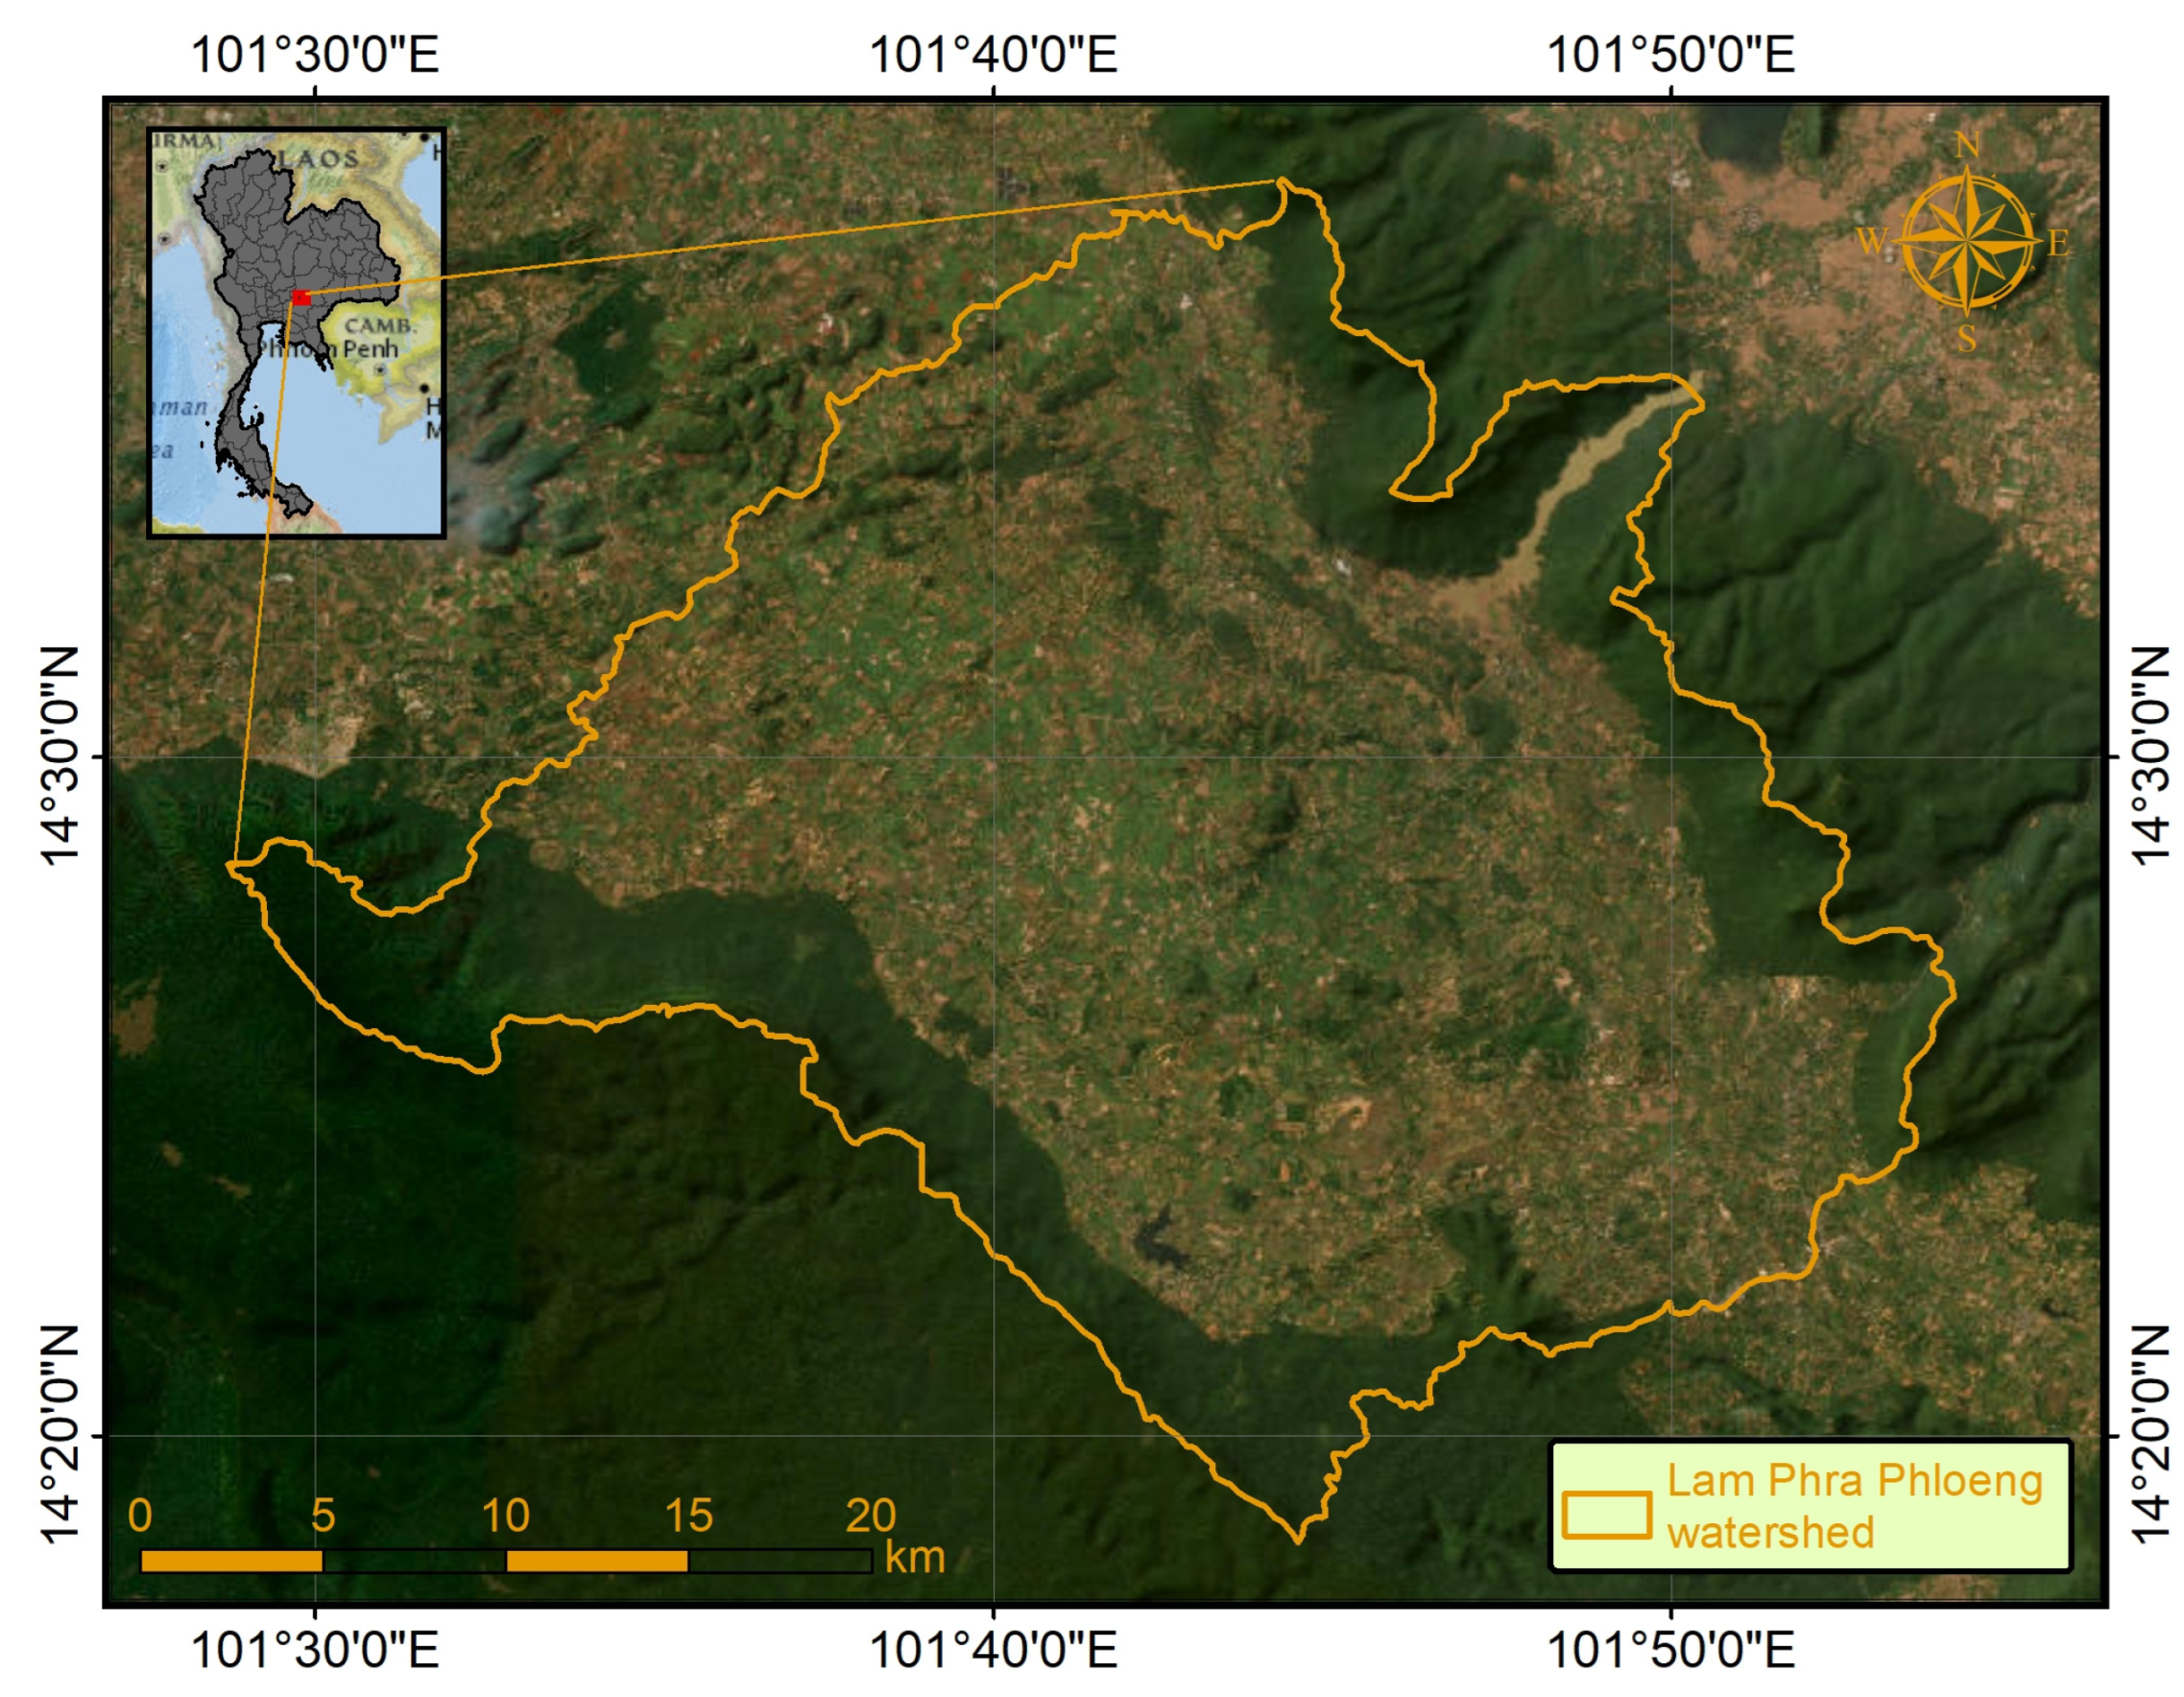
Situated on the Khorat Plateau, the Lam Phra Phloeng watershed (Figure 2) is bordered to the east by the Pha Khao Phu Luang Reserve Forest and to the southwest by the Khao Yai Reserve Forest. The Lam Phra Phloeng watershed is km2, with elevated areas along its eastern and western borders, and fewer undulating and low-elevation sections in the middle. The elevation varies from 260 m in the northeast to around 1307 m in the southwest. The climate is influenced by the northeast and southwest monsoons, with an average rainfall of 1117 mm [24], of which the majority occurs between May and September. The soil has a gently undulating texture and is primarily silty loam. The undulating terrain of LPP, the movement of water through a narrow channel, along with the complex land use pattern, made this area a suitable case study for this research.
The LPP region has experienced intensive deforestation and agricultural expansion since the 1970s, leading to severe soil loss on upland slopes and sedimentation in the downstream reservoir. This sediment accumulation has reduced reservoir capacity, affected irrigation reliability, and degraded water quality. Previous studies in [25,26] have also noted increasing erosion rates in this watershed, but most analyses were limited to single-model applications. These factors together highlight the LPP watershed as a critical area requiring a comprehensive erosion–sediment retention assessment.
While certain forested areas are protected, there is a noticeable slow encroachment of upland agriculture into the forest region [25]. After 1970, a significant portion of Lam Phra Phloeng’s local forests were cut down for farming. Since then, natural vegetation has been cleared using slash-and-burn practices and converted into cropping grounds, marking the beginning of the area’s agricultural history. The area has seen a significant shift in land usage from subsistence to market-oriented farming [26]. Land resources are said to have seriously degraded over time as a result of widespread mechanical tilling, continuous cropping without adequate fallow times or nitrogen replacement with cover crops, and ongoing chemical fertilizer usage [27]. All these effects have significantly impacted soil degradation and ultimately erosion, which could pose a threat to agricultural productivity. As the majority of the population in LPP is dependent on agriculture, understanding the problem and providing a possible solution to address this environmental concern.

3. Datasets and Methodology

3.1. Datasets Used

Two separate models, namely the InVEST SDR and the RUSLE, had their own sets of inputs. The ESRI land cover was used for the simulation of the InVEST model, the ESRI global land cover was applied in InVEST due to its standardized classes compatible with the model’s parameterization, whereas for the RUSLE model, the land cover map was generated manually from Sentinel-2 MSI satellite data. Sentinel-2 imagery was selected for RUSLE to produce a high-resolution LULC map required for calculating C and P factors.
For the InVEST model simulation, digital elevation data were acquired from SRTM. SRTM DEM was used in the model for its hydrologically consistent surface and suitability for flow direction and accumulation modelling, whereas for the RUSLE model, digital elevation data from ASTER were used because of its higher vertical precision, slope and LS factor derivation can be improved. All spatial analyses were performed at a raster resolution of 30 m × 30 m, meaning each pixel represents an area of 900 m2 (0.09 ha). To ensure consistency across all model inputs, the rainfall erosivity (R) and soil erodibility (K) datasets, originally available at coarser resolutions, were resampled to 30 m × 30 m resolution to match the DEM and land use layers. This resampling enables coherent overlay and analysis in the RUSLE model while preserving dominant spatial patterns relevant to erosion risk at the watershed scale. Detailed characteristics of the input dataset (e.g., Spatial resolution, Period considered for rainfall erosivity, etc.) used for InVEST SDR and RUSLE are provided in Table 1 and Table 2.
The ASTER data was developed by the Ministry of Economy, Trade, and Industry (METI) of Japan and the United States National Aeronautics and Space Administration (NASA). It was preferred over the Shuttle Radar Topography Mission (SRTM) as ASTER data was generated using stereo-pair images, which improve coverage and reduce the possibility of artefacts.

3.1.1. RUSLE Model

The Revised Universal Soil Loss Equation (RUSLE) is an empirical model for estimating average annual soil loss and its associated risk [31]. The RUSLE model has been used widely and effectively in various catchments worldwide [32,33]. RUSLE is being extensively validated and implemented in various geographical circumstances [18], including tropical regions with watersheds similar to LPP [34]. Also, the established performance of RUSLE assures the accuracy of the estimates of soil erosion [33] have assessed the reliability and effectiveness of the RUSLE model, particularly in areas where soil erosion is a significant concern. It applies to arable land and requires long-term rainfall data. The model uses several key factors (Ri, Ki, Li, Si, Ci, and Pi), to calculate annual soil loss (Equation (1)).
A = Ri × Ki × Li × Si × Ci × Pi
where A indicates the annual total soil loss (t/ha−1 year−1), t indicates the thickness of soil loss, Ri refers to the rainfall erosivity (MJ · mm (ha · hr)−1); Ki refers to the soil erodibility (ton·ha·(ha·hr)−1); Li is the length of slope, Si is the steepness of slope; Ci represents the factor of vegetation cover; and Pi indicates the support practice factors [35]. This parameterization explicitly reflects the local hydrogeomorphological context, where steep slopes, rainfall concentration, and varying land cover create distinct erosion and sediment delivery zones. In this study, Relevant factors are based on available data in the catchment and applied to the RUSLE model.

3.1.2. InVEST SDR Model

The InVEST Sediment Delivery Ratio (SDR) model is a robust geospatial framework developed by the Natural Capital Project, with key contributions from Stanford University, the World Wildlife Fund, and the Nature Conservancy [36]. This study selected the InVEST SDR model due to its specific emphasis on ecosystem services and its direct alignment with the study’s objective, which was to assess the role of land cover in sediment retention [37]. It is a fully distributed model that accepts inputs in raster formats, including climate data, soil layer, topography, and land cover. The spatial analytical capacities of the model to integrate these datasets are vital for accurately delineating sediment sources and sinks [19]. It enables the mapping and quantification of sediment delivery and retention services, primarily in rural landscapes. The outputs provide the average sediment delivery and retention values per sub-catchment and sediment yield values per pixel [38]. It can effectively estimate annual soil loss in specific regions by applying the Universal Soil Loss Equation (USLE) [36]. Additionally, InVEST SDR is designed for seamless integration with other models to enhance ecosystem service assessments. This integration supports coupling models like RUSLE, consistent with recently published studies [30,39,40]. The model’s algorithm first calculates the mean yearly amount of sediment eroded, or soil loss, for each pixel [39]. Secondly, it determines the “sediment delivery ratio,” which represents the proportion of soil loss that reaches the stream (Equation (2)).
I C = log 10 D u p D d n
where Dup refers to the upslope component, which is defined as (Equation (3)):
D u p = C ¯ S ¯ A
In this equation, C ¯ represents the average C factor for the contributing upslope zone; S ¯ represents the mean gradient (m/m); A represents the size of the upslope contributing region (m2). The D-infinity flow algorithm determines the area of the upslope contributing zone [41].
Then the downslope component ( D d n ) is expressed as (Equation (4)):
D d n = i d i C i S i
where di indicates the flow path’s mean length towards the downslope, from the ith pixel to the stream (m); C factors are Ci and Si and the slope gradient of the ith pixel, respectively. The downhill flow path is based on the D-infinity flow algorithm [41]. The SDR (Equation (5)) for a pixel (i) is derived from the IC utilizing a sigmoid function [28].
S D R i = S D R M a x 1 + exp I C 0     I C i k b
SDRMax represents the maximum theoretical sediment delivery ratio (SDR), which is defined as the highest proportion of fine-grained sediment (<1000 μm) that can reach the stream. If detailed soil information is unavailable, the default value will be set to 0.8.

3.2. Methodology

For the RUSLE model simulation, five important inputs were generated, namely the LS factor, K factor, r factor, C factor and P factor. For the calculation of the LS factor from ASTER GDEM, at first flow direction and fill sinks were analyzed. Using flow direction and fill sinks, respectively, flow accumulation and slope gradient were computed using ArcGIS software (10.7). Furthermore, the LS factor was generated from flow accumulation and slope gradient. The soil map was generated from the FAO dataset, which consists of different soil classes for an area. WorldClim precipitation data was used to calculate the rainfall erodibility and erosivity factor. The calculation of the C factor and P factor involves land use mapping and generating a Normalized Difference Vegetation Index (NDVI) cover of the study area. For this purpose, Sentinel-2 MSI data with 13 spectral bands and 10 m spatial resolution were used. Radiometric correction was not required as ESA supplied level-2 products; nonetheless, the atmospheric correction was carried out using the Sen2cor tool (12.0.0) included in the Sentinel Application Platform (SNAP). The atmospheric/topographic (ATCOR) module of the Sentinel-2 toolbox was used to carry out the geometric correction. Bands 2, 3, 4, and 8 (blue, green, red, and NIR) were then combined to provide a single picture for both the classification procedure and generating the NDVI.
The Random Forest (RF) classification algorithm in SNAP was used in this paper to classify land use and land cover (LULC) in Lam Phra Phloeng. Random forest, introduced by [42], is a supervised machine learning technique commonly utilized for the classification of geospatial data. The random forest technique yields a comprehensive and more precise outcome by combining the results of several trees. This approach is proven effective for diverse predictive tasks like medical science [43], bioinformatics [44], psychology [45], and machine learning [46] due to its capability to manage complex datasets and handle the overfitting issue. A key feature of the Random Forest Algorithm is its capacity to process datasets containing continuous variables (for regression) and categorical variables (for classification).
The raster calculation framework in the GIS (10.7, Arc GIS) interface has been used to apply the RUSLE to model soil loss. A flowchart detailing the procedures and required data is provided in Figure 3.
The semantics for the InVEST SDR model simulation have been presented in Figure 4. SDR is calculated using the hydrologic connectivity of a region, based on the method by [28]. The process starts with the calculation of a connectivity index (IC), which measures a pixel’s connectivity to the stream by assessing its upslope contributions and flow path, as outlined by [29].
In this study, RUSLE and InVEST SDR models were compared under the baseline land use scenario to assess soil erosion and sediment retention. RUSLE estimates gross on-site soil loss based on rainfall, soil, topography, and land-cover factors (as detailed in Section 3.1.1), whereas InVEST SDR quantifies sediment yield and retention by explicitly modelling downslope transport using the Sediment Delivery Ratio (SDR). Together, the two models provide complementary insights into erosion processes and the ecosystem service of sediment retention across the watershed.

4. Results

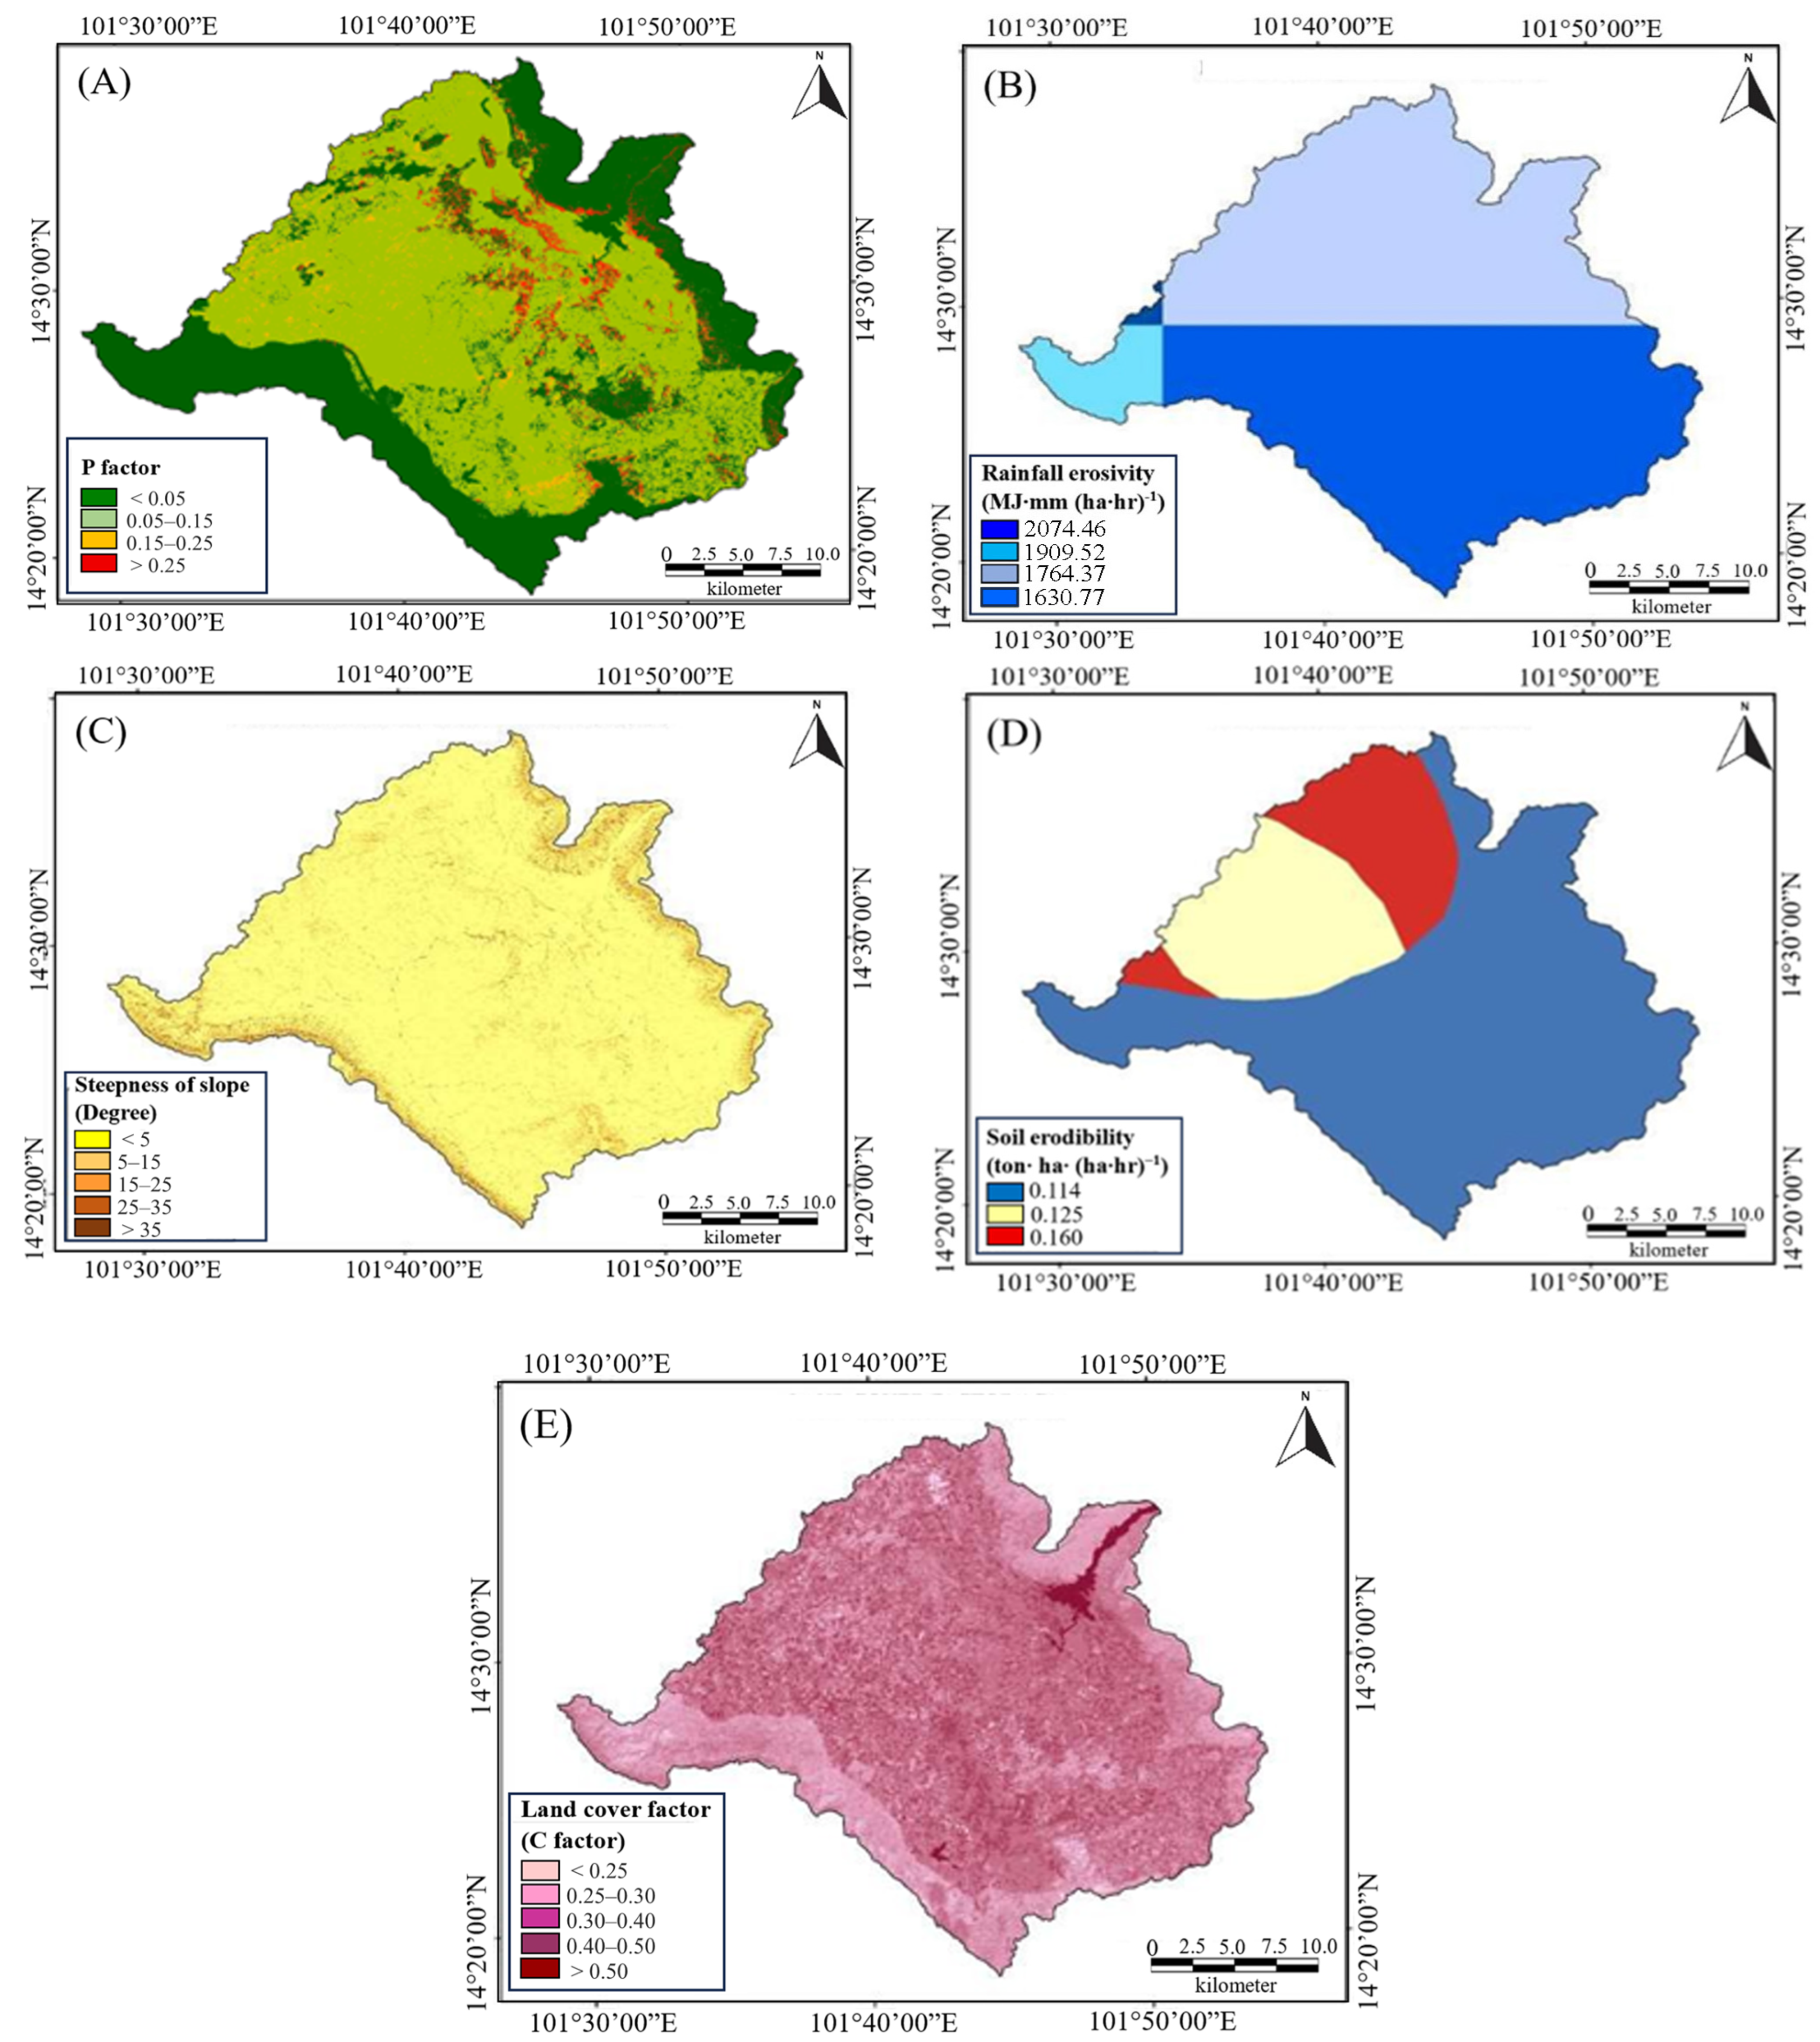
The average annual soil loss in the RUSLE model is calculated using five parameters, namely the LS factor (slope length and steepness), K factor (soil erodibility), R factor (rainfall erosivity), C factor (cover management), and P factor (support practice).
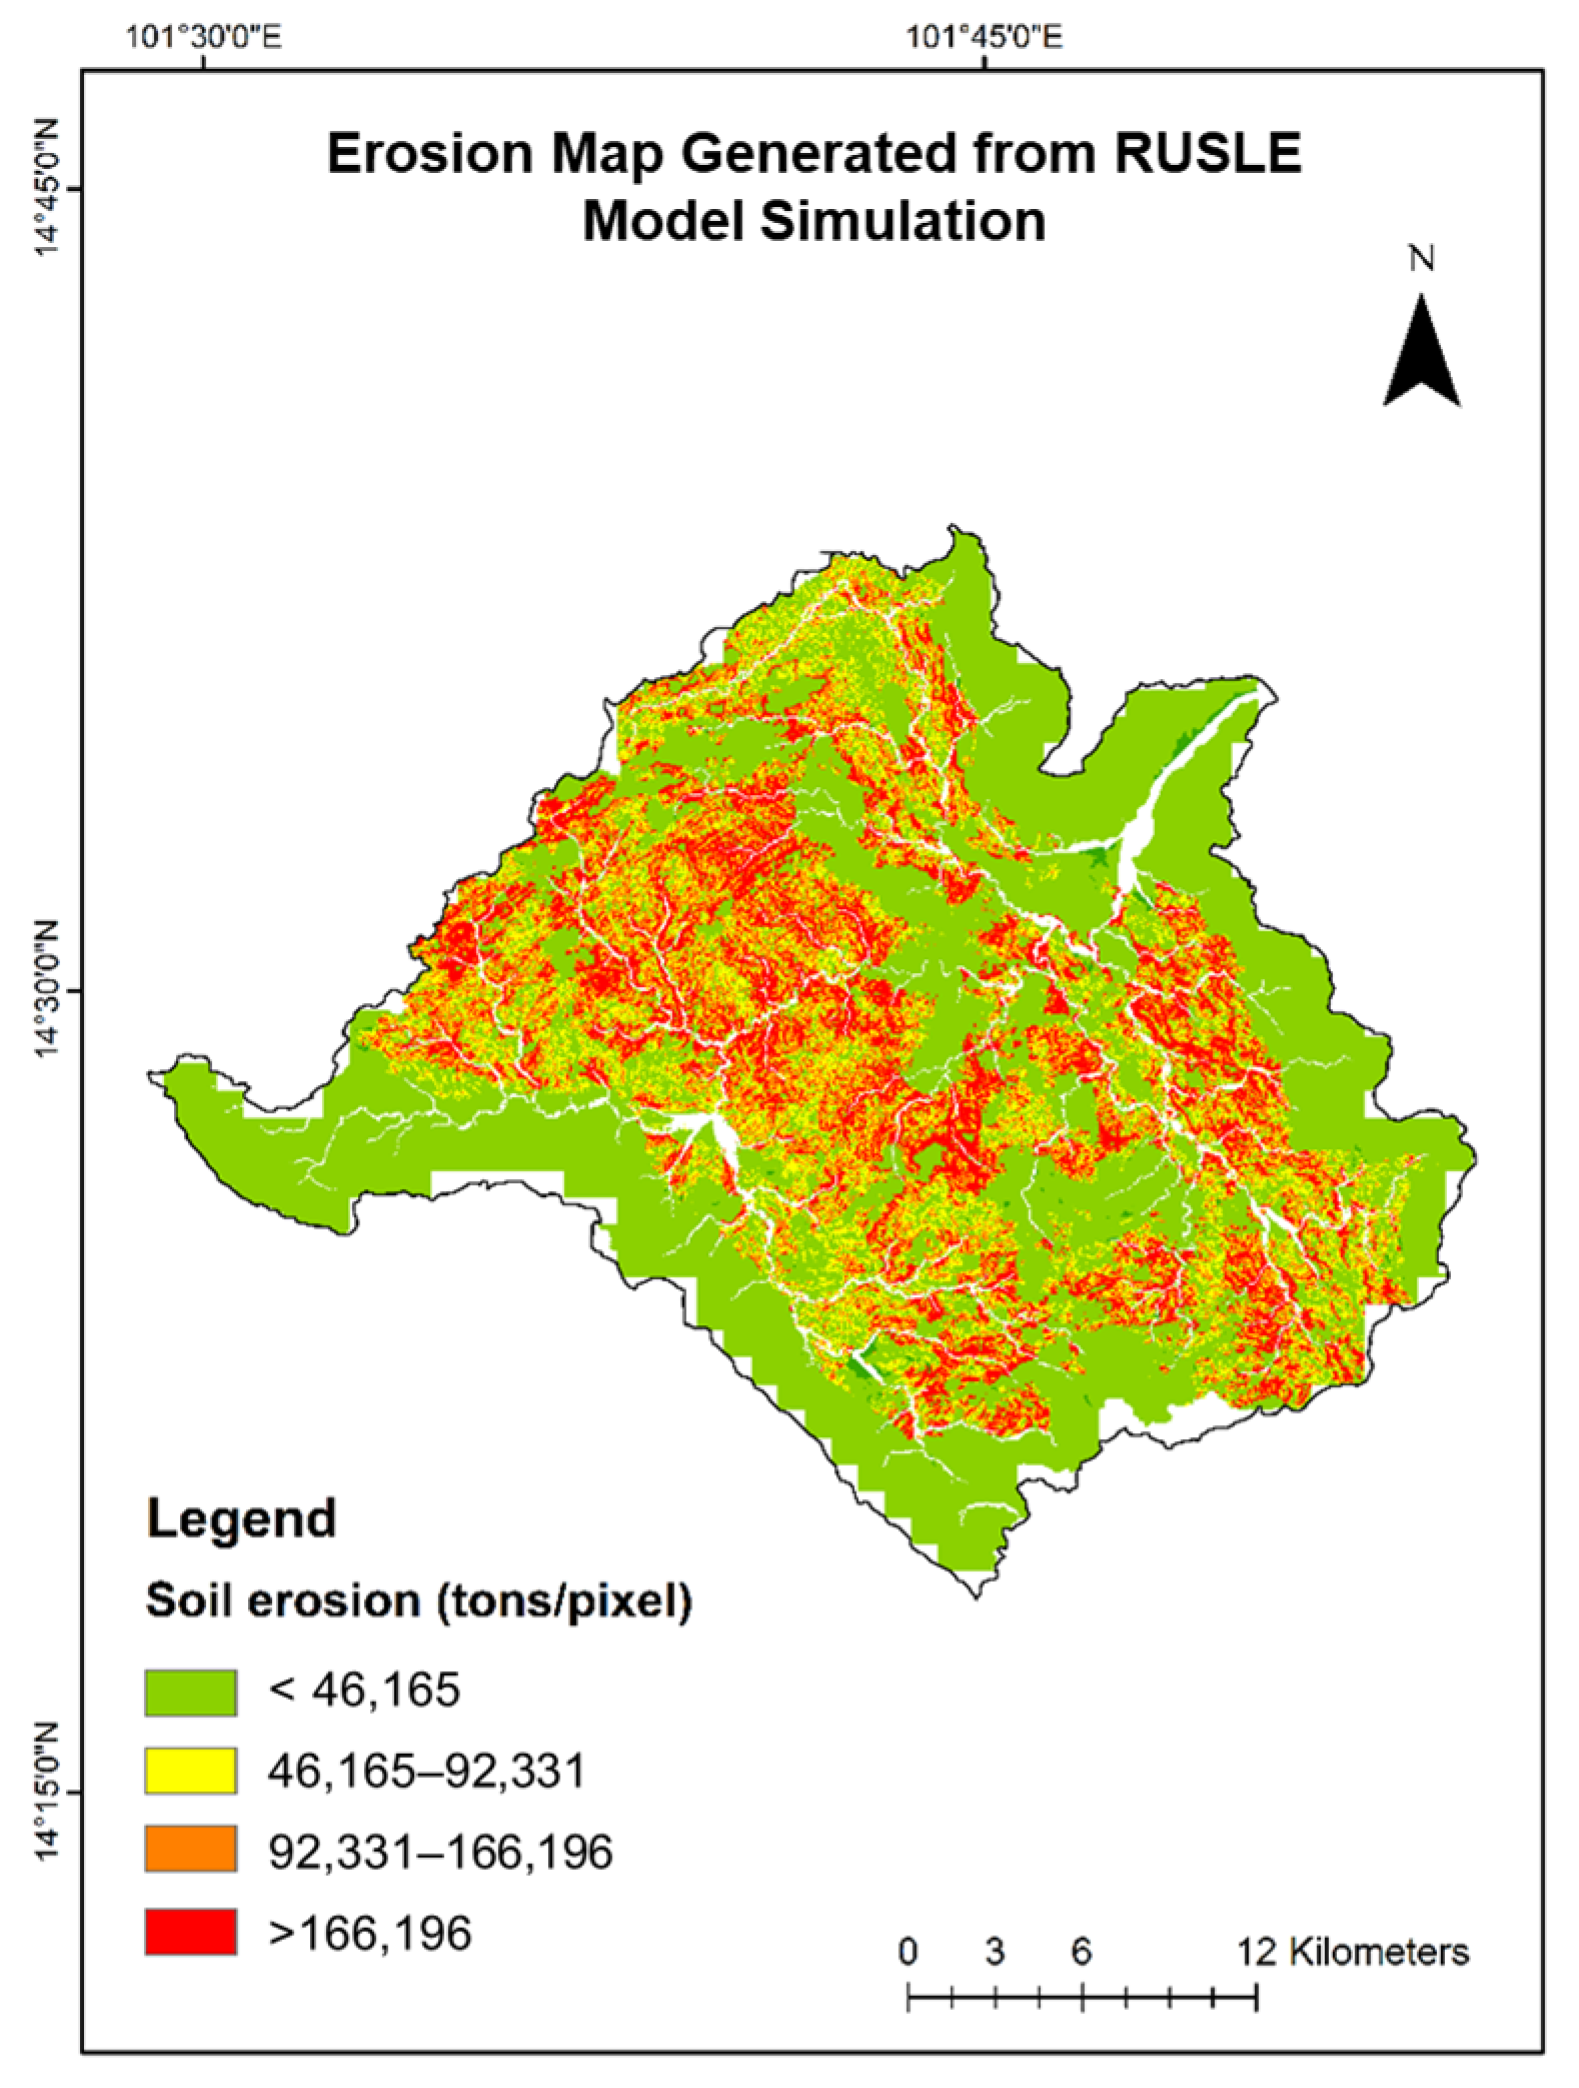
These factors were selected to realistically reflect the LPP watershed’s hydrogeomorphological setting, where steep upland slopes and high-intensity rainfall drive runoff and soil detachment, and land cover patterns modulate erosion risk. The spatial distribution of these inputs is illustrated in Figure 5. The erosion map generated by the RUSLE model indicates that areas under cropland and rangeland underwent severe soil erosion. In contrast, areas covered with vegetation showed minimal soil erosion.

4.1. Land Use Mapping

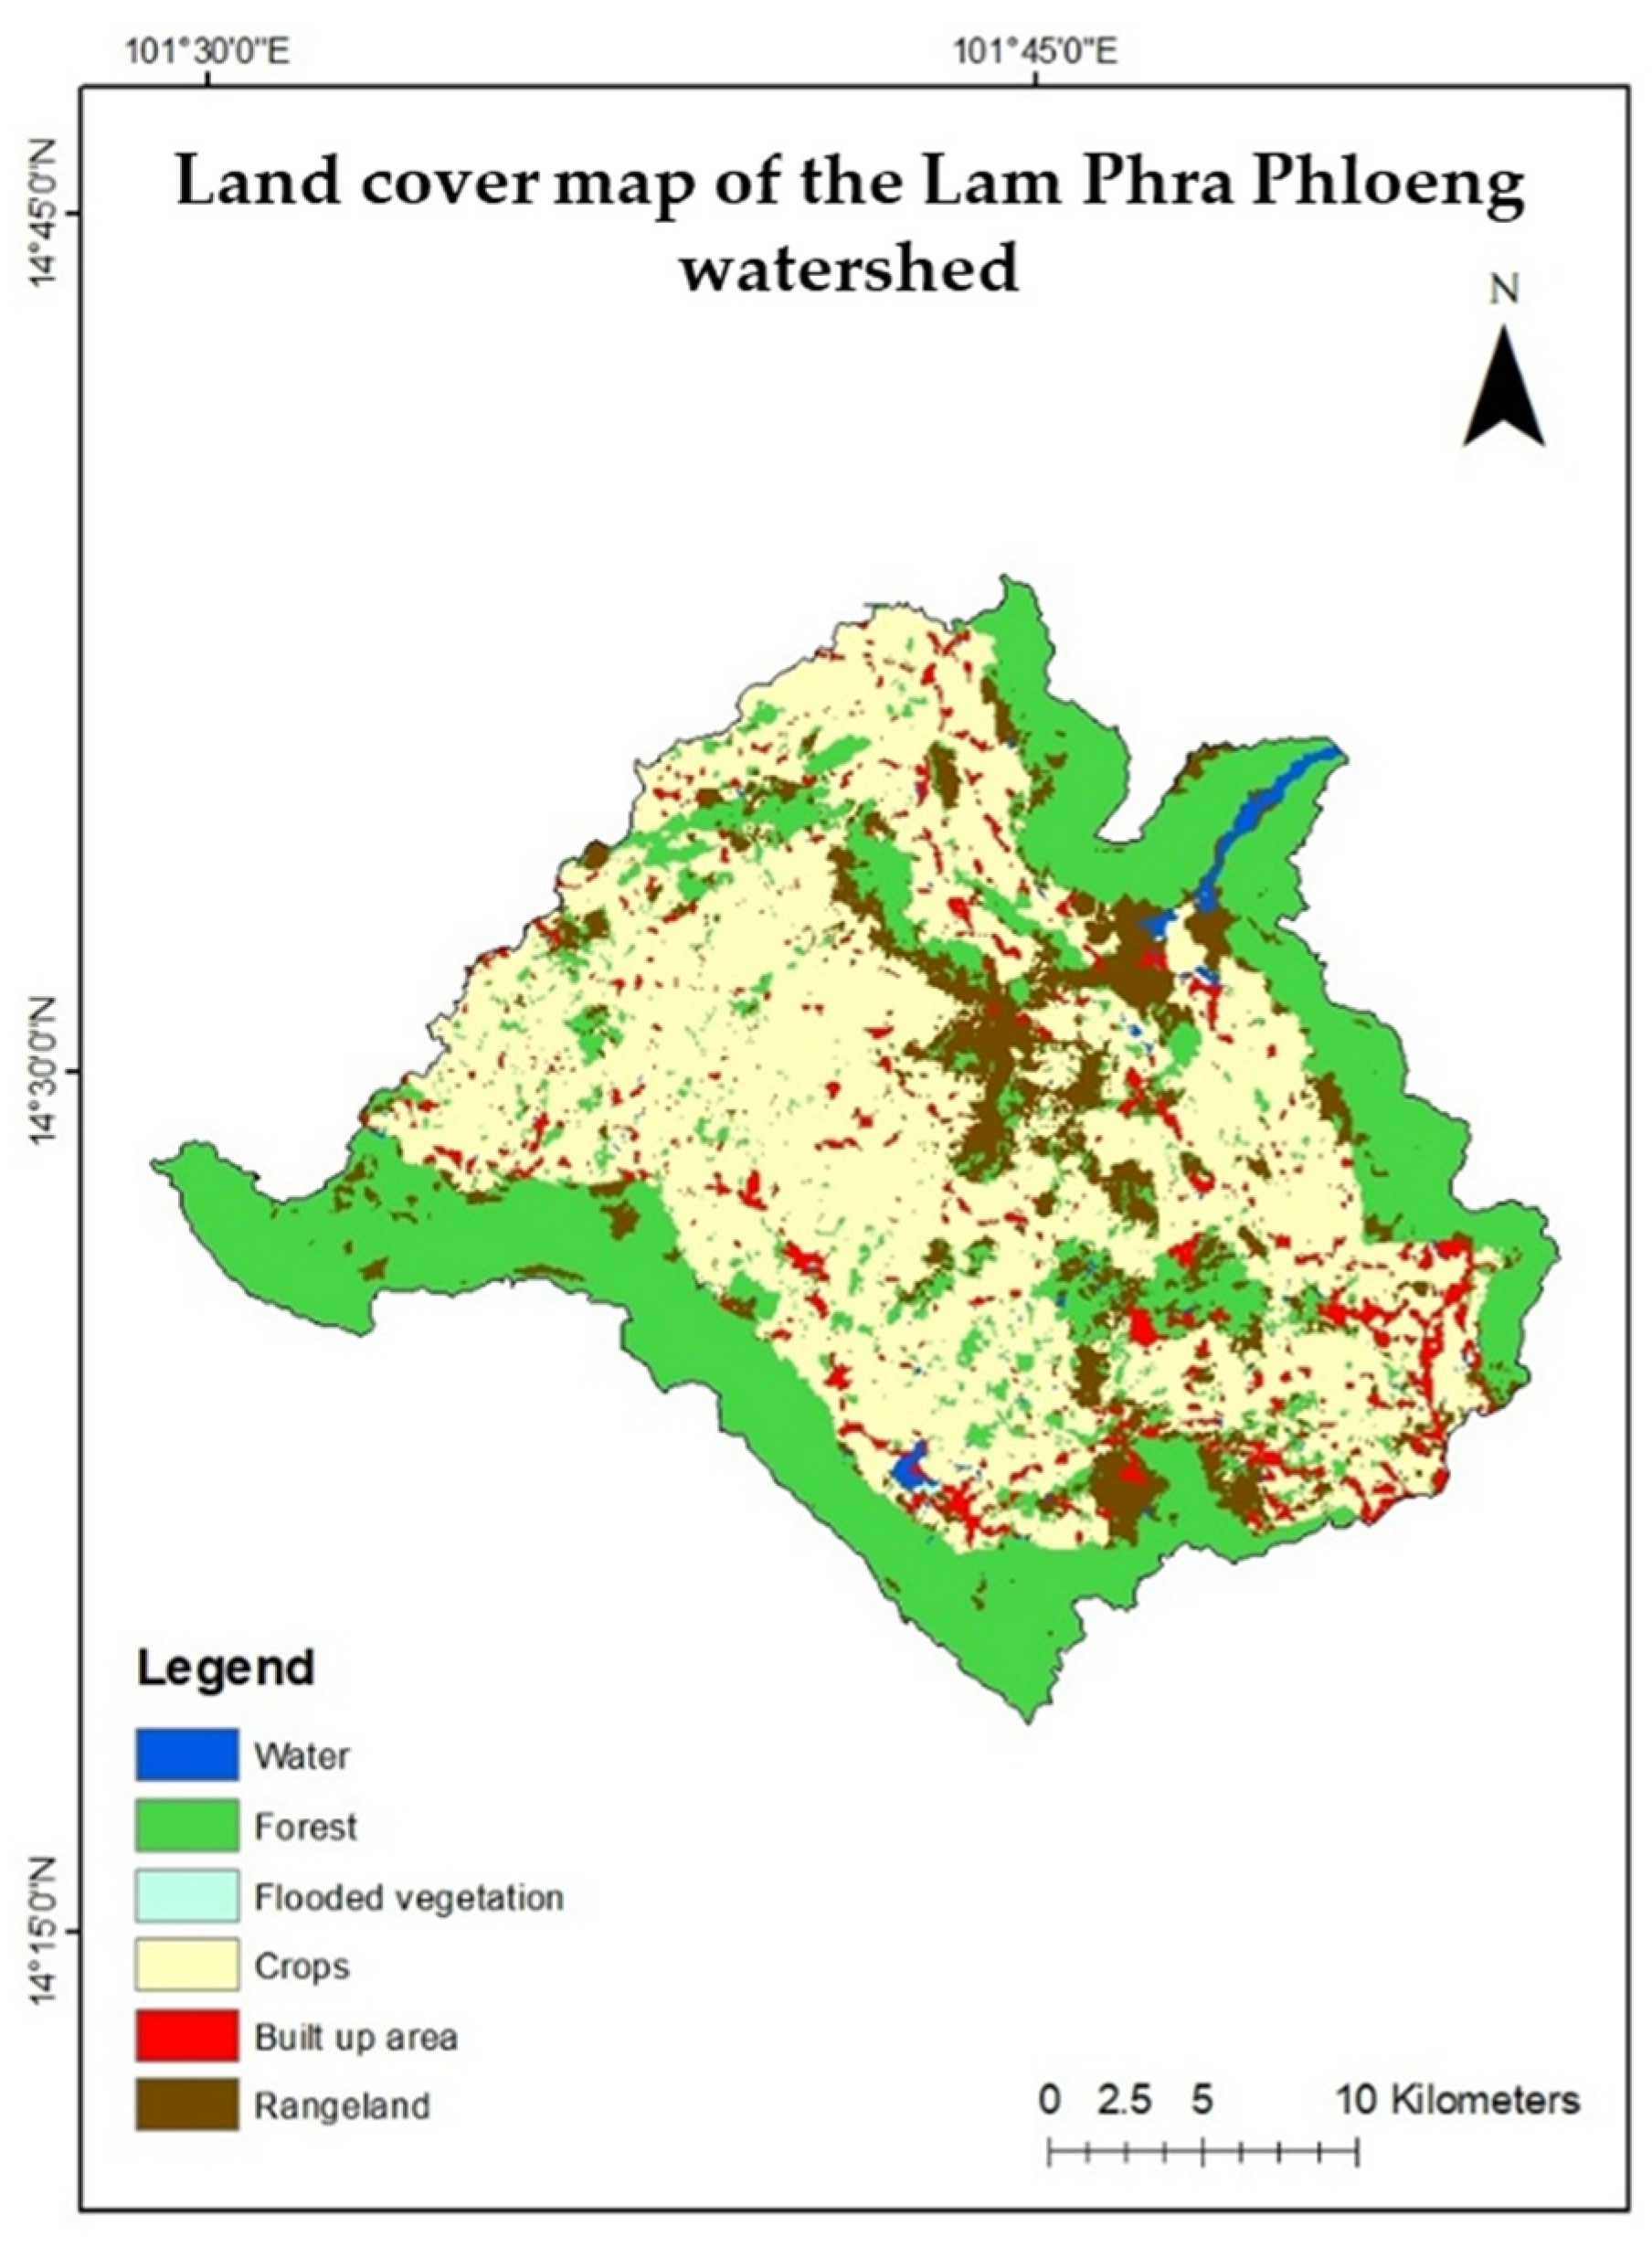
The land use and land cover map (Figure 6) was generated from the Sentinel-2 MSI datasets using the RF classification algorithm. The overall accuracy obtained for the classification process is 91.3% and the Kappa coefficient was 0.89. The accuracy information for each class is presented in Table 3. Among the six classes, built-up areas and waterbodies were classified with the highest accuracy, whereas flooded vegetation and rangeland had the lowest accuracy. The overall accuracy above 85% and a Kappa coefficient exceeding 0.80 indicate a high level of reliability for land use classification. Therefore, the achieved accuracy (91.3% overall, Kappa = 0.89) represents an excellent classification quality suitable for subsequent spatial analysis [47,48]. The LULC of the study area is divided into six classes, with cropland and forest being the most dominant. Along the eastern and western boundaries of the study area, where the terrain is hilly, a dense forest cover was observed. The plain land in the middle of the study area is primarily composed of cropland. There are some scattered patches of vegetation with settlements and rangeland in the middle valley, which are at risk as population pressure in the future might result in the conversion of the forest into cropland.
The results obtained from LULC mapping suggest that cropland and forests are the most dominant land use classes, occupying 397.06 and 283.09 square kilometres, respectively. Rangeland covers 87.95 km2, and 41.35 km2 is covered by built-up areas.

4.2. Soil Loss and Sediment Retention in Lam Phra Phloeng

The erosion map generated from the RUSLE model (Figure 7) shows varying levels of soil loss in the LPP watershed. Most of the area is coloured light green, indicating low erosion rates (<50 t/ha/yr). However, higher erosion rates, represented in orange, and red, occur mainly in rangeland and cropland, with rates ranging between 70 and 90 t/ha/yr. Accordingly, these land cover classes are more prone to erosion because they have less vegetation cover and are disturbed by tillage and grazing. As a whole, the map shows that crops and rangeland are more prone to erosion than areas with denser vegetation. These hotspots are predominantly located in the northern and central regions of the watershed. Even with the data categorized, a clear trend emerges, showing an increase in erosion in the specific areas, which correlates with factors such as land cover and slope. When topography, land cover, and other relevant elements were considered together, the map effectively conveys the distribution of erosion risk throughout the watershed.
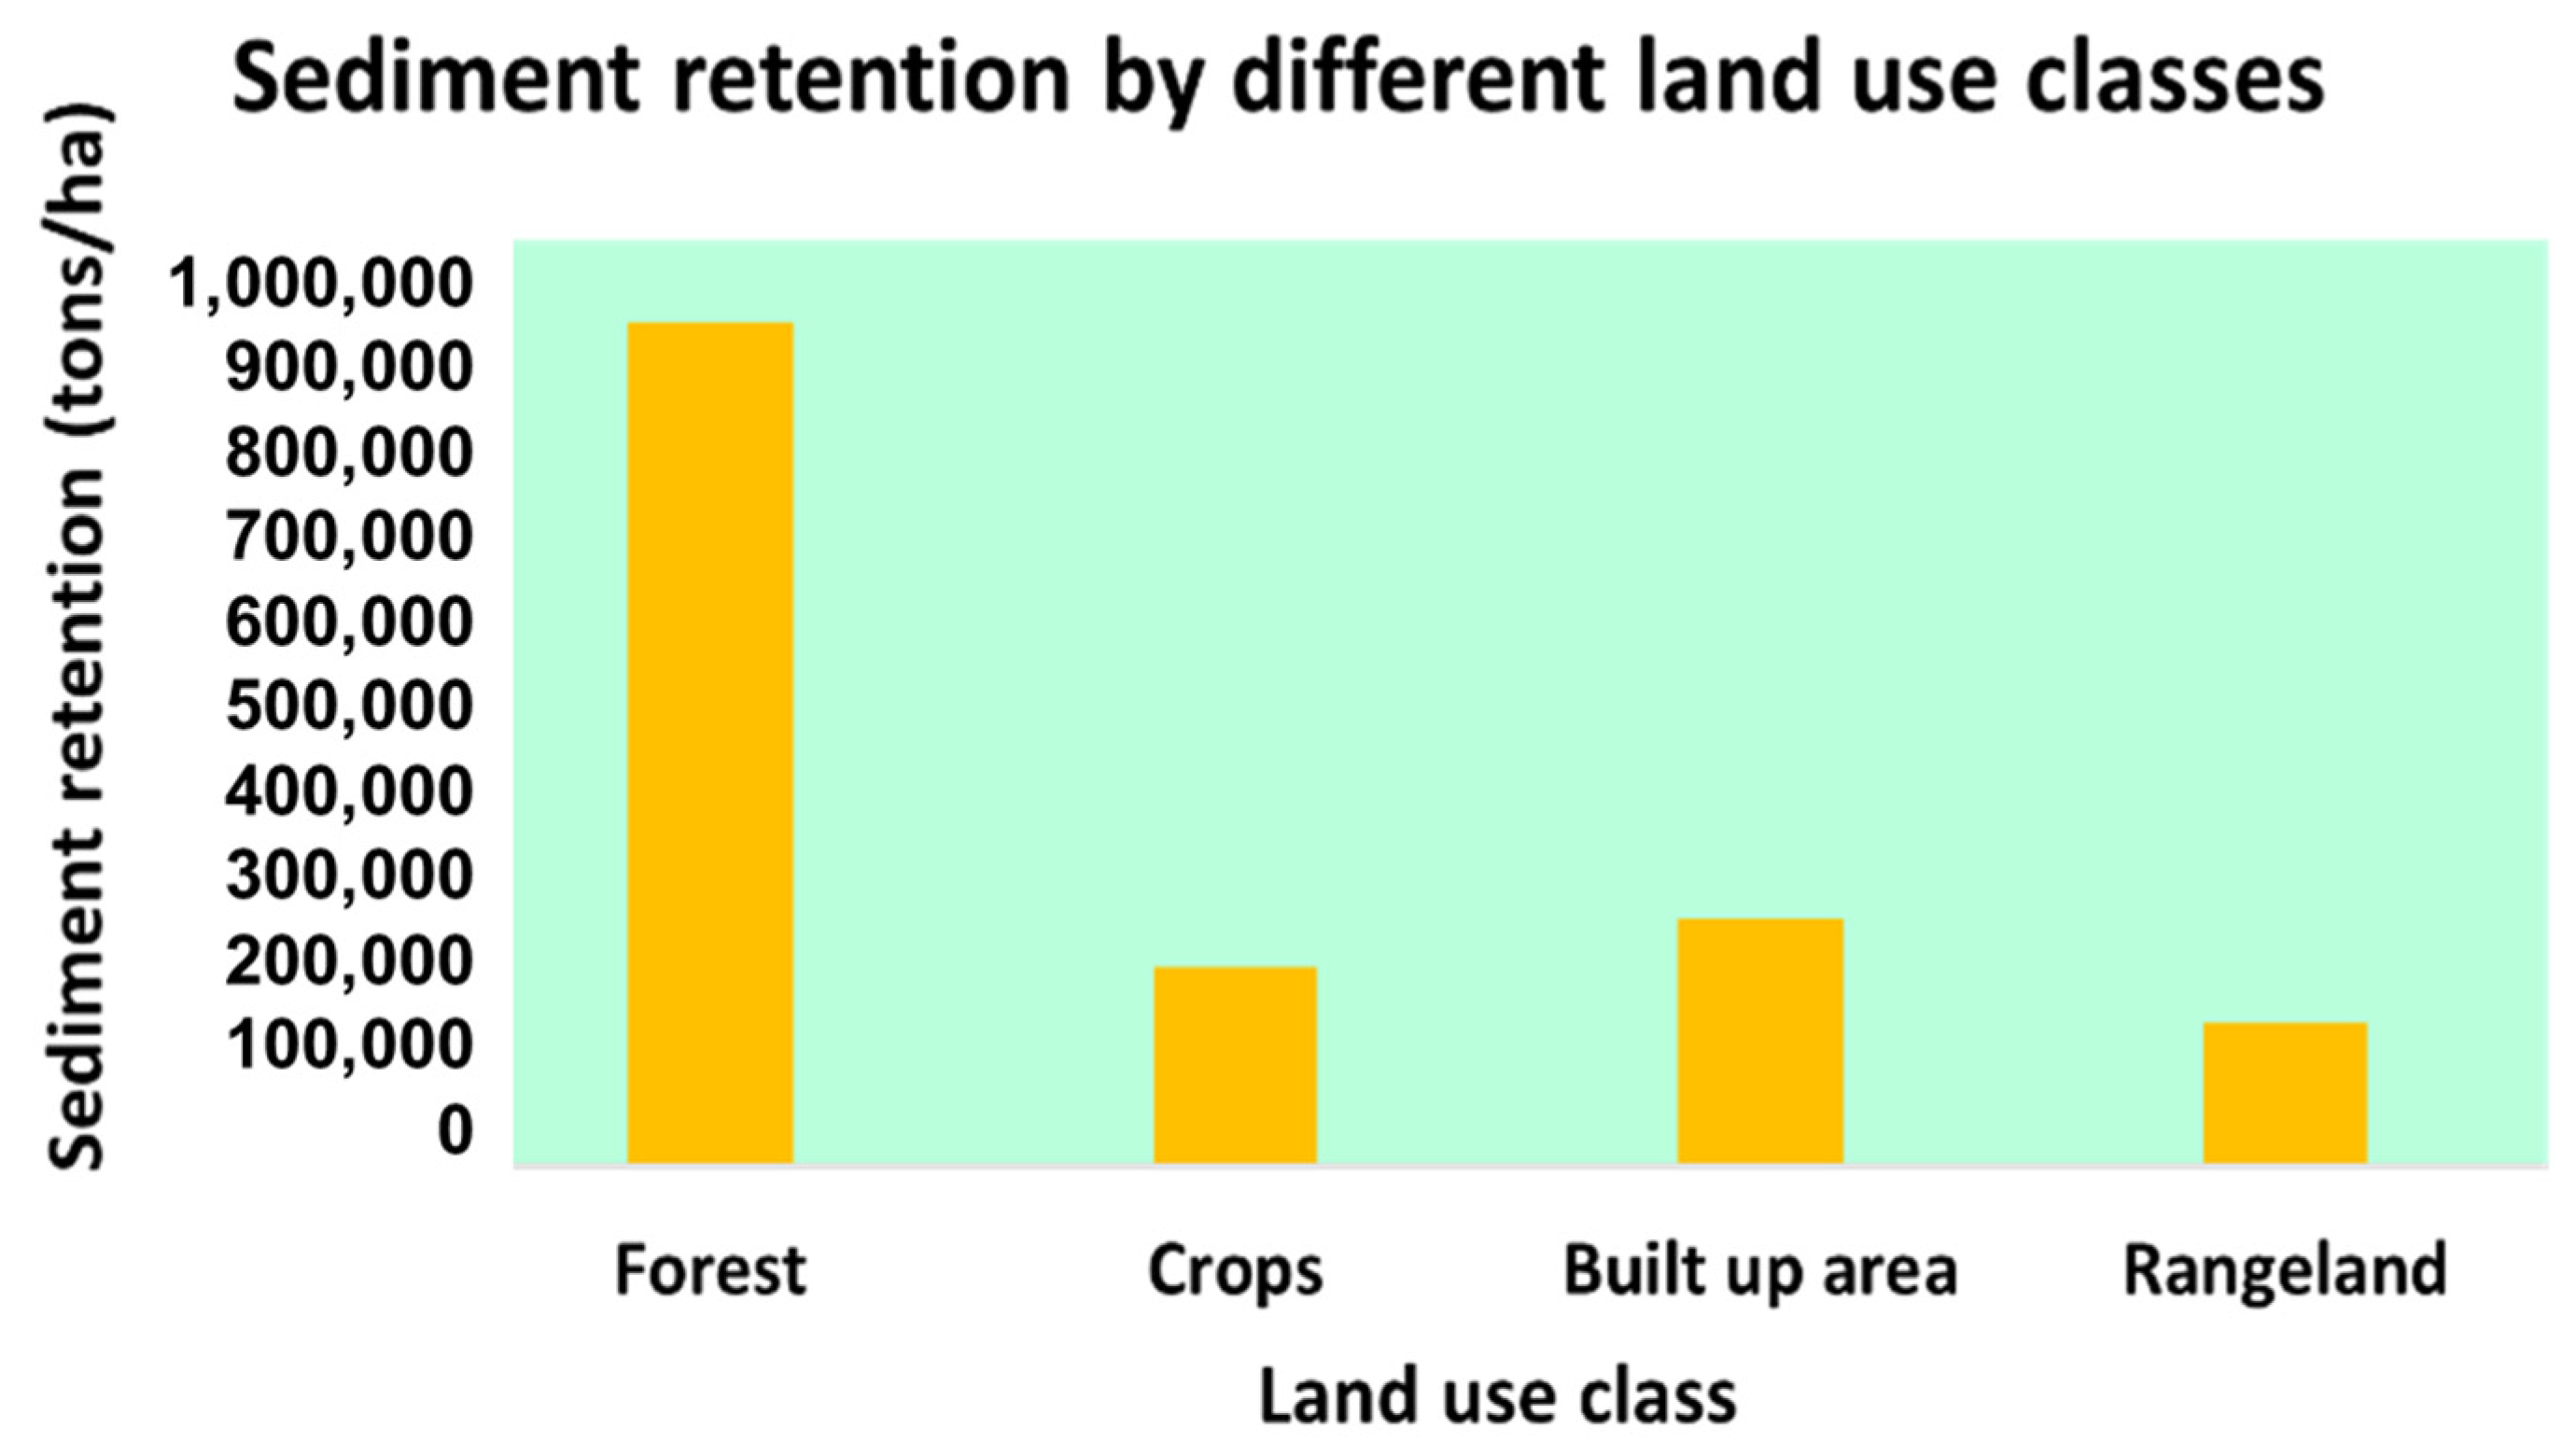
The sediment retention map of the Lam Phra Phloeng watershed (Figure 8) was generated by simulating the InVEST SDR model. The sediment retention services were categorized into five classes where red colour denotes high sediment retention and green denotes low sediment retention. The sediment retention was divided into five classes based on the continuous values obtained from the InVEST SDR model output to mimic the four land use classes that contribute to sediment retention, namely forest, crops, build-up areas, and rangeland. The threshold for legend in Figure 9 was made based on a quantile interval in GIS software (10.7, Arc GIS), which is a common way of depicting sediment retention over a watershed [38,49,50]. The results obtained from simulating InVEST SDR at the Lam Phra Phloeng watershed suggest that sediment retention is highest along the eastern and western borders of the study area and lowest in the middle valley. Comparing the land cover map (Figure 5) with the sediment retention result indicates areas with high vegetation cover experienced more sediment retention and vice versa.
It is clear from Figure 9 and Figure 10 that the sediment retention capacity of forests is the highest in the Lam Phra Phloeng watershed, followed by waterbodies and built-up areas. The sediment retention was found to be lowest for rangelands, as sediment movement can occur easily through rainfall and wind in rangelands compared to croplands and built-up areas.

5. Discussion

The observed spatial distribution of erosion hotspots and sediment retention zones aligns with the watershed’s slope geometry and rainfall runoff patterns, confirming the hydro-morphological realism of the selected model parameters. The results obtained from simulating the InVEST SDR model suggest that sediment retention ranges from 1025 tons/pixel to 7254 tons/pixel. The pixel-based units are typical of raster-based modelling outputs. By specifying the pixel area, the results remain directly scalable for comparison with per-hectare figures. The sediment retention is relatively higher in areas covered with natural forests and lower in rangeland areas. The soil erosion map generated from the RUSLE model further corroborates this observation, as the areas with low sediment retention are associated with high erosion and vice versa. The majority of the study area has a low erosion rate (<50 t/ha/year), with high values observed mainly in the central parts. A similar result was also obtained by other studies in various parts of Thailand. For example, ref. [51] documented that the average annual soil loss in 2017 was 10,293.19 tons/km2 and the average annual sediment retention was 2892.58 tons/km2 at Songkhla, Thailand (Table 4). Ref. [52] reported a sediment export of 29.64 tons/km2 at the Ing Watershed, Thailand, in 2019. The average annual soil loss at the Pasak River Basin, Thailand, was observed to be 673 tons/km2 [53]. The results of the current study also align with worldwide patterns. For example, research conducted in the Ethiopian Highlands has revealed average soil losses between 2500 and 4000 tons/km2 per year, with much greater losses observed in agricultural land [54]. The Mediterranean region’s agricultural areas have experienced high erosion rates, which can surpass 100 tons/km2 per year in certain cases [55]. According to these findings and the current study, cultivated lands are highly susceptible to soil erosion, so it is imperative to take effective conservation measures.
The spatial congruence between high soil erosion (RUSLE) and low sediment retention (InVEST SDR) zones underscores the complementary nature of the two models in characterizing sediment dynamics. The higher erosion rates in cropland and rangeland areas are primarily attributed to limited vegetation cover, intensive tillage, and exposure of soil surfaces to rainfall impact—a pattern consistent with findings from [50,51] in other Thai watersheds.
The modelled sediment retention gradients (high along forested uplands, low in central agricultural plains) further validate the hydrological connectivity principle underlying the InVEST SDR model. This suggests that maintaining upstream forest integrity directly enhances downstream sediment retention and water quality.
Additionally, comparison with earlier single-model studies (e.g., [55,57]) shows that the coupled RUSLE–InVEST framework yields a more nuanced understanding of erosion–retention interplay, improving the identification of critical conservation zones.
While model uncertainties persist due to DEM resolution and parameter calibration constraints, the strong spatial correlation (r > 0.8) observed between modelled erosion risk and vegetation density supports the reliability of these outputs for management planning.
Overall, the discussion demonstrates that integrating empirical erosion estimates (RUSLE) with process-based ecosystem service modelling (InVEST SDR) offers a more robust representation of sediment retention mechanisms in monsoonal catchments like Lam Phra Phloeng.
These observations provide a conceptual basis for understanding the high erosion phenomenon in Thailand, which necessitates immediate attention through effective conservation and management practices. To boost the agricultural output of lowland farmers and agribusinesses, several mountainous regions in Thailand’s northern and northeastern watersheds have already encouraged the extension of agricultural fields onto nearby highlands. It is in contrast, the InVEST SDR model uses this soil loss estimate together with topography and hydrological connectivity to quantify how much of the eroded soil is essential to note that the RUSLE model estimates gross soil loss from hillslopes. In contrast, the InVEST SDR model utilizes this soil loss estimate, along with topography and hydrological connectivity, to quantify the amount of eroded soil retained within the catchment. Therefore, rather than comparing absolute values directly, the two models together provide a more complete picture of erosion risk and sediment retention capacity in the watershed. Modern, sophisticated land management strategies often employ models to understand sediment dynamics [59], and these models vary in complexity depending on their intended uses and services. Physics-based models have gained considerable attention in recent times [60] as they can replicate the complex conditions of system dynamics. On the other hand, if there is minimal knowledge of sediment dynamics available or data is relatively scarce, it is better to employ simple models like InVEST instead of absolute predictions [38]. InVEST is also frequently used for scenario comparisons, as they can predict the response to land use or climate change [60]. However, the InVEST and RUSLE models also have their own limitations. Uncertainties in absolute forecasts arise because of the dependency of Borselli IC on the DEM resolution in InVEST. The accuracy of the InVEST SDR model is heavily influenced by the DEM resolution used. Coarser DEM resolutions may result in less detailed modelling of topographical characteristics, limiting model performance. For example, research evaluating DEM resolutions between 0.5 and 20 m found that, whereas soil loss estimates changed by around 18%, sediment export findings differed significantly, demonstrating how sensitive the model is to DEM resolution. This aligns with recent findings that the sensitivity of physiographic parameters strongly influences hydrological ecosystem services, even in data-scarce deltaic regions [61]. On the other hand, the RUSLE model estimates sheet and rill erosion however its calculations do not include gully and streambank erosion. This exclusion may significantly underestimate overall soil loss in regions with these erosion patterns [62].
These models are often unable to provide a spatiotemporal distribution of soil loss from erosion due to the limitations imposed by complex settings and a shortage of geospatial data that accurately describe the environment’s complexity. Satellite data availability and advancements have enhanced current models and offered efficient techniques for land resource management, monitoring, and analysis. The majority of these models include drawbacks that are mostly associated with the physical features of the area in which the model was initially evaluated. Implementing these methods in Thailand, where data and field measurements are limited, is indeed challenging. Considering the InVEST SDR model’s sensitivity to DEM resolution, it illustrates the importance of high-quality topographical data. Since the RUSLE model excludes certain erosion processes, it may not fully capture soil erosion, especially in areas prone to streambank and gully erosion. Hence, the adoption of integrated modelling approaches that address different types of erosion processes is essential to achieving accurate soil loss estimates.
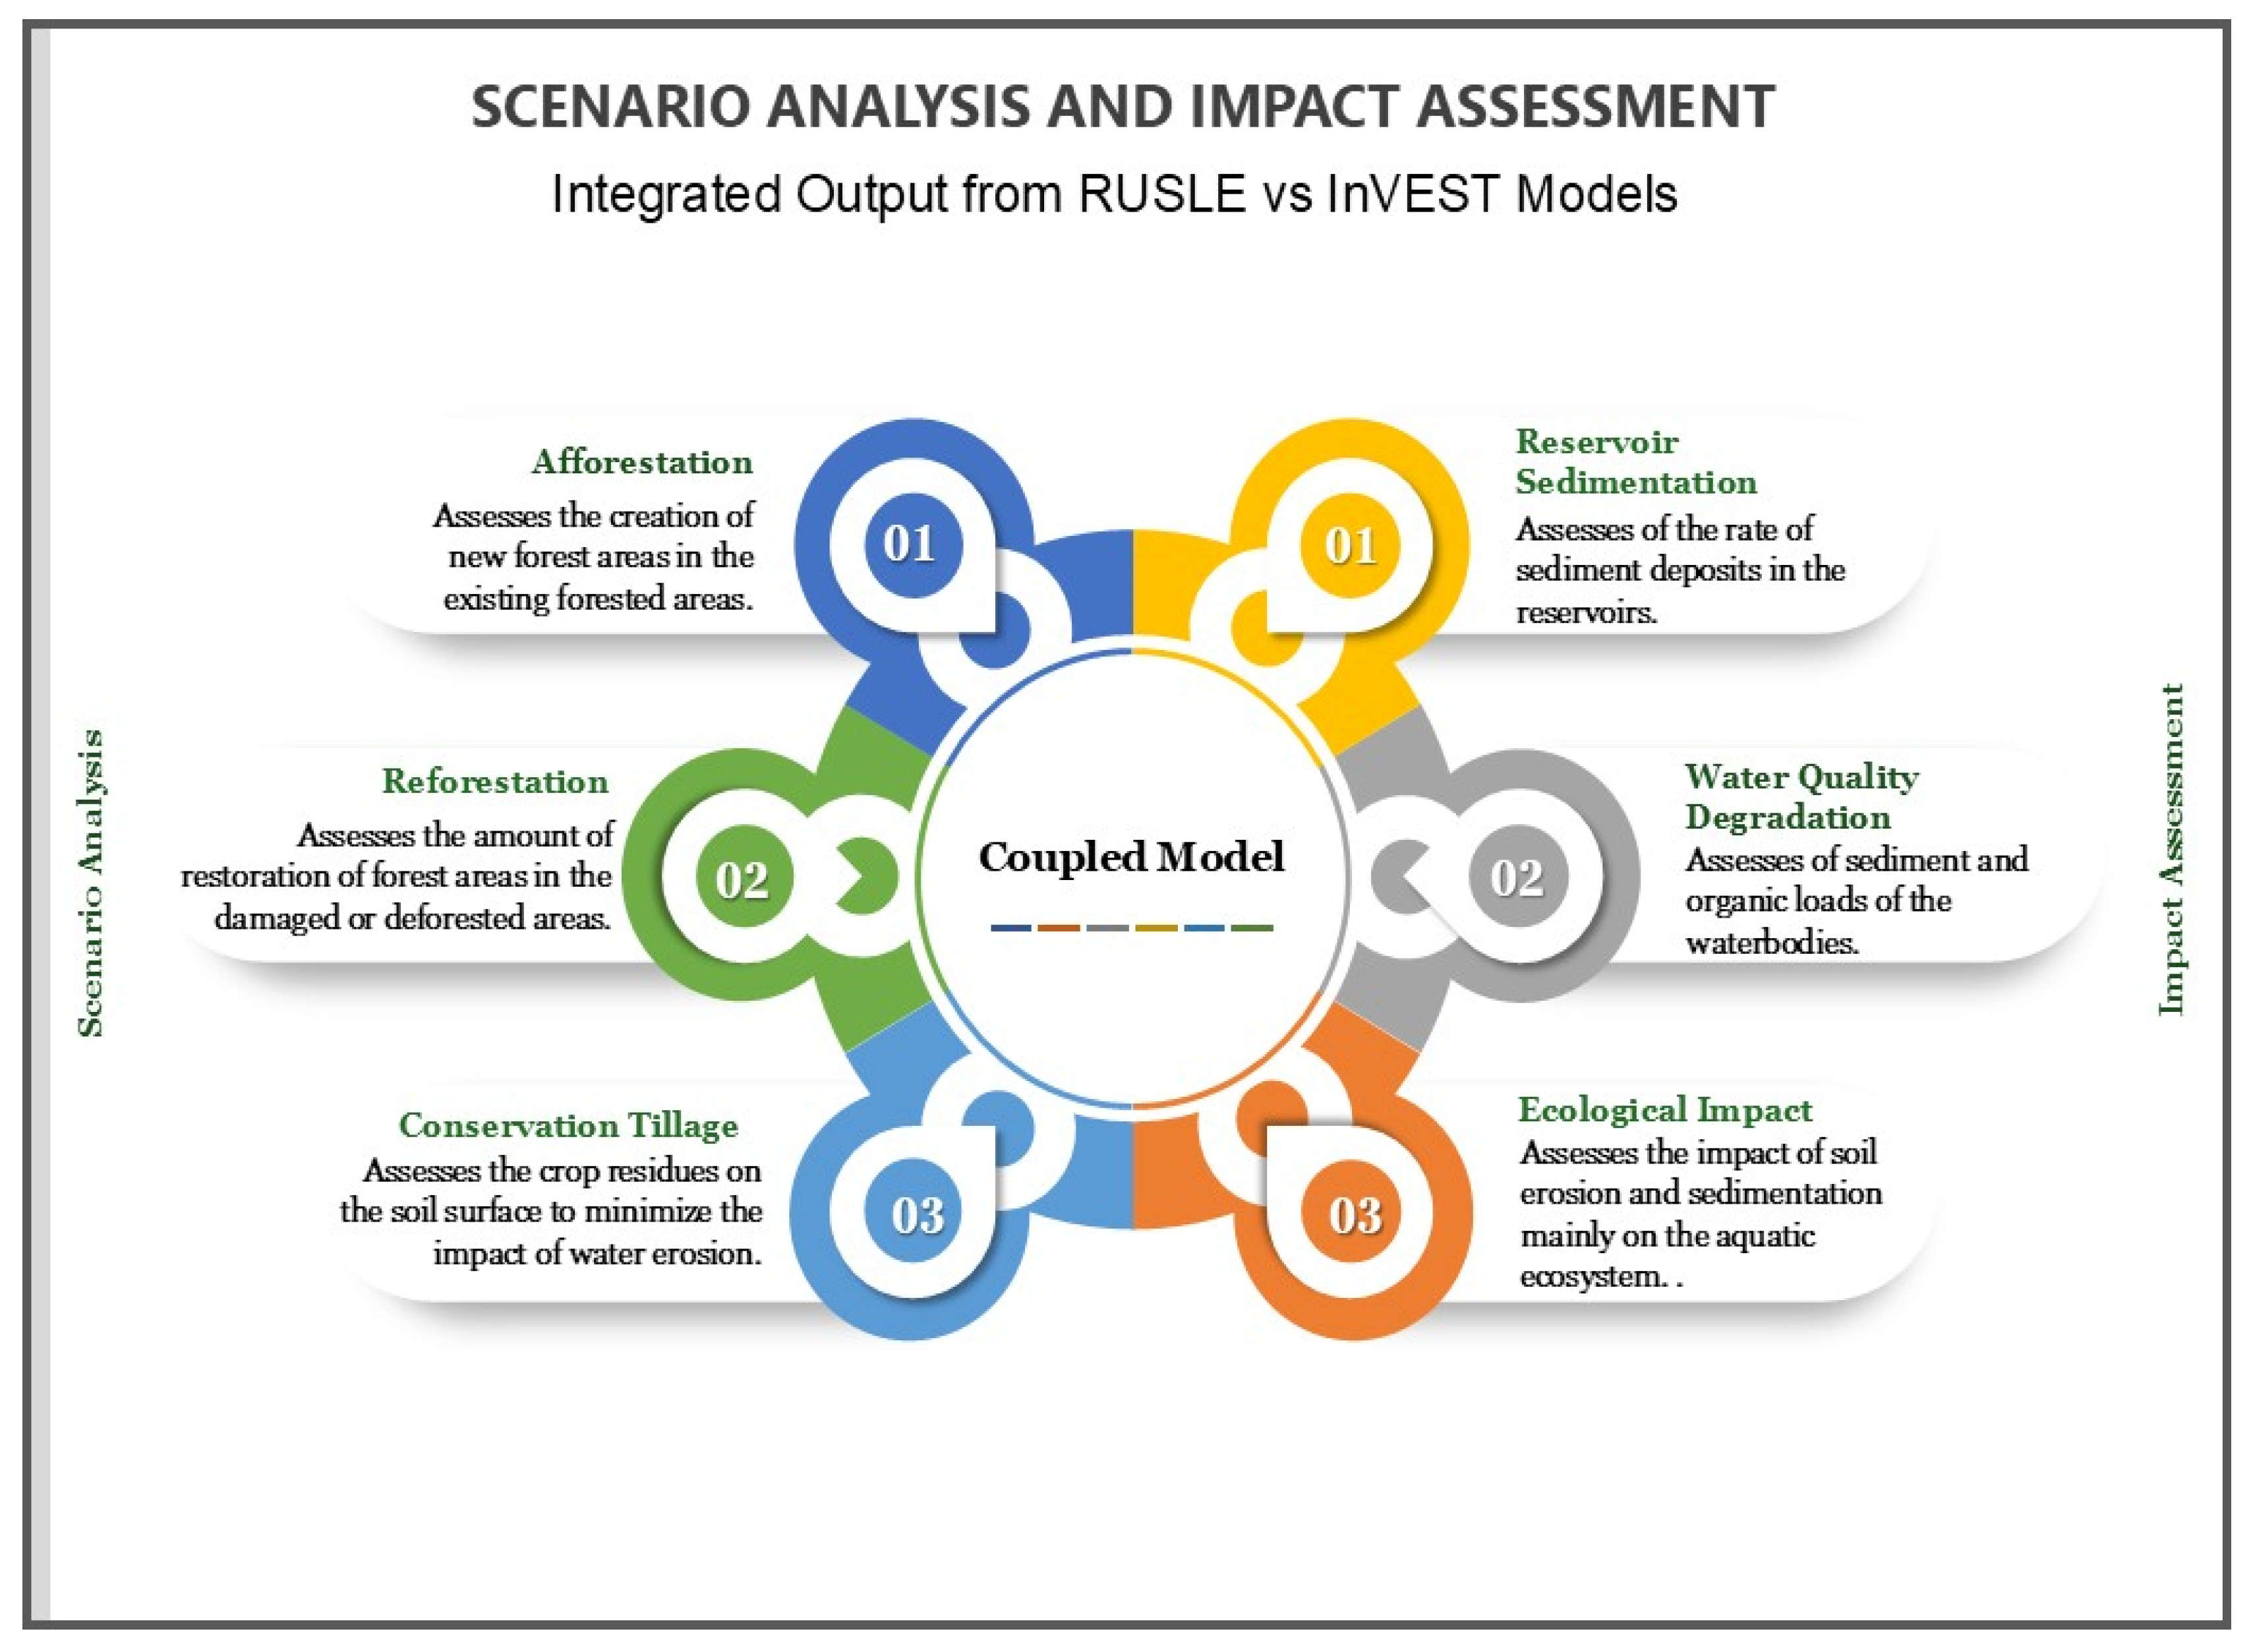
This study also demonstrates a future pathway for coupling the InVEST and RUSLE models for environmental and ecological management studies (Figure 10). The InVEST model can be utilized for different land cover and climatic scenario analyses, generating information on soil loss and sediment retention under these scenarios. These studies are helpful for stakeholders and policymakers as they identify areas that require immediate protection: afforestation or reforestation. The coupled modelling is also useful for modelling reservoir sedimentation measurement, water quality analysis and assessing ecological impacts of sediment erosion.
Although the primary objective of this study is to delineate zones of erosion hazard using the coupled RUSLE-InVEST approach, it is equally important to highlight how this information can support future scenario analyses and conservation planning. The conceptual framework presented in Figure 10 illustrates how identified erosion-prone zones could guide targeted management interventions such as afforestation, reforestation, or conservation tillage, and help assess their potential impacts on reservoir sedimentation, water quality, and ecological integrity. This linkage highlights the practical relevance of the model outputs for informing integrated land use and soil conservation strategies in the watershed.

6. Conclusions

This study successfully applied an integrated RUSLE–InVEST modelling framework to quantify soil erosion and sediment retention dynamics in the Lam Phra Phloeng watershed, Thailand. The results reveal that forested areas exhibit the highest sediment retention capacity, while cropland and rangeland are the most erosion-prone due to minimal vegetation cover and intensive land use. The findings confirm the essential role of natural vegetation in reducing soil displacement and maintaining hydrological stability.
The study’s primary limitations include reliance on remotely sensed datasets without field-based validation, potential uncertainties arising from DEM resolution (30 m), and exclusion of gully or streambank erosion from RUSLE estimates. Future work should integrate higher-resolution topographic data (e.g., LiDAR-based DEMs), in situ sediment measurements, and model calibration to enhance spatial accuracy. Coupling with climate or land use change scenarios can further reveal future erosion–sediment interactions.
Extending this coupled framework to other tropical and monsoonal watersheds would provide comparative insights into sediment regulation under varying land management practices. Integrating socioeconomic and land policy data could also improve scenario-based decision-making for sustainable watershed management.
Overall, this study contributes a novel, transferable modelling framework that combines empirical and ecosystem service approaches to identify priority conservation zones and support evidence-based soil and water resource management in data-scarce environments.

7. Recommendations

This study highlights several important recommendations for soil conservation and watershed management in the Lam Phra Phloeng watershed. Future research should integrate high-resolution DEM and climate datasets to minimize uncertainties and enhance the spatial precision of erosion and sediment retention estimates. A key limitation of this study is the absence of field-based validation of model outputs; therefore, future work can extend this study by incorporating ground-truth measurements to calibrate and validate the RUSLE and InVEST SDR results. At the management level, targeted conservation measures such as afforestation, agroforestry, conservation tillage, and cover crops are strongly recommended in erosion-prone croplands and rangelands to reduce soil loss. Integrated watershed management strategies should also prioritize reforestation and strategic land use planning to maintain sediment retention capacity and protect downstream water resources. Moreover, the results of this study can support policymakers in designing location-specific conservation policies and incentive schemes that encourage sustainable practices among farmers and local communities. Finally, the coupled RUSLE–InVEST framework can be further extended to simulate land use and climate change scenarios, thereby providing critical insights for long-term planning and resilience building in the watershed.

Author Contributions

U.S., R.M., and G.S.V.S.A.B.; Methodology: U.S., R.M., A.L.G., and G.S.V.S.A.B.; Software: R.M.; Validation, R.M. and A.L.G.; Formal analysis: R.M. and P.T.; Data curation: U.S. and R.M.; Writing—original draft: R.M., U.S. and P.T.; Writing—review and editing: U.S., R.M., A.L.G., and G.S.V.S.A.B.; Visualization: R.M., P.T., and G.S.V.S.A.B.; Supervision: U.S.; Project administration: U.S.; Funding acquisition: U.S. All authors have read and agreed to the published version of the manuscript.

Funding

King Mongkut’s Institute of Technology Ladkrabang, School of Engineering [2566-02-01-033] Project titled “Impact of Future Land Use Change and Climate Change on Soil Erosion by Using Remote Sensing and GIS Techniques in Lam Phra Phloeng Watershed, Nakhon Ratchasima, Thailand”.

Data Availability Statement

All datasets used in this study are publicly available: land use/land cover data from ESRI Living Atlas, SRTM DEM from NASA Earthdata, watershed boundary from DIVA-GIS, rainfall erosivity and soil erodibility from ESDAC. Model parameters (Maximum SDR, Threshold Flow Accumulation, Borselli IC0, K Parameter, and Maximum L value) were adopted from published literature [27,28,29]. No new datasets were generated.

Acknowledgments

The authors gratefully acknowledge the administrative and technical support provided by the School of Engineering, King Mongkut’s Institute of Technology Ladkrabang (KMITL). The study also benefited from freely available datasets provided by ESRI Living Atlas, NASA Earthdata, DIVA-GIS, and the European Soil Data Centre (ESDAC), which greatly facilitated the analysis and interpretation of results. During the preparation of this work, the author used ‘Grammarly’ (V.1.132.0.0) only to improve the readability of some sentences. After using this tool/service, the author(s) reviewed and edited the content as needed and take(s) full responsibility for the content of the publication.

Conflicts of Interest

The authors declare that they have no known competing financial interests or personal relationships that could have appeared to influence the work reported in this paper.

References

  1. FAO. Voluntary Guidelines for Sustainable Soil Management. 2017. Available online: https://openknowledge.fao.org/server/api/core/bitstreams/9a5b9373-3558-43b3-b732-f69326a7314d/content (accessed on 10 July 2025).
  2. UNEP. Why Restoring Nature is Good for Farmers, Fisheries and Food Security. Available online: https://www.unep.org/news-and-stories/story/why-restoring-nature-good-farmers-fisheries-and-food-security (accessed on 10 July 2025).
  3. WWF. What Is Erosion? Effects of Soil Erosion and Land Degradation. Available online: https://www.worldwildlife.org/threats/soil-erosion-and-degradation (accessed on 10 July 2025).
  4. Van Cotthem, W. Soil Erosion and Degradation—DESERTIFICATION. Available online: https://desertification.wordpress.com/2019/04/08/soil-erosion-and-degradation/ (accessed on 10 July 2025).
  5. FAO. Key Messages|Global Symposium on Soil Erosion|Food and Agriculture Organization of the United Nations. Available online: https://www.fao.org/about/meetings/soil-erosion-symposium/key-messages/en/ (accessed on 10 July 2025).
  6. Banerjee, S.; Das, S.; Kandekar, A.M.; Scaringi, G.; Sangode, S.J. Scale-dependency, rainfall, and lithologic controls on the hypsometry of the Western Ghats, India. J. Earth Syst. Sci. 2023, 132, 49. [Google Scholar] [CrossRef]
  7. Pansak, W.; Takrattanasaran, N.; Nongharnpitak, N.; Khongdee, N. Soil-Related Laws in Thailand. In International Yearbook of Soil Law and Policy; Springer: Cham, Switzerland, 2024; Volume 2022, pp. 243–262. [Google Scholar] [CrossRef]
  8. Somprakon, S.; Yothapakdee, T.; Howpinjai, I.; Painkhit, P.; Yodkeaw, S.; Kruama, K.; Lattirasuvan, T. Soil Fertility and Carbon Sequestration Assessment in 8-Year Restored Forest Area, Phrae Province. Thai J. Forestry. Available online: https://li01.tci-thaijo.org/index.php/tjf/article/view/261433 (accessed on 10 July 2025).
  9. Ekasingh, B.; Gypmantasiri, P. Maize in Thailand: Production Systems, Constraints, Research Priorities. 2004. Available online: www.cimmyt.org (accessed on 10 December 2024).
  10. Tsubo, M.; Basnayake, J.; Fukai, S.; Sihathep, V.; Siyavong, P.; Chanphengsay, M. Toposequential effects on water balance and productivity in rainfed lowland rice ecosystem in Southern Laos. Field Crops Res. 2006, 97, 209–220. [Google Scholar] [CrossRef]
  11. FAO. Intergovernmental Technical Panel on Soils; FAO: Rome, Italy, 2015.
  12. Pimentel, D.; Burgess, M. Soil erosion threatens food production. Agriculture 2013, 3, 443–463. [Google Scholar] [CrossRef]
  13. Borrelli, P.; Robinson, D.A.; Fleischer, L.R.; Lugato, E.; Ballabio, C.; Alewell, C.; Meusburger, K.; Modugno, S.; Schütt, B.; Ferro, V.; et al. An assessment of the global impact of 21st century land use change on soil erosion. Nat. Commun. 2017, 8, 2013. [Google Scholar] [CrossRef] [PubMed]
  14. Dinar, A.; Tieu, A.; Huynh, H. Water Scarcity Impacts on Global Food Production. Glob. Food Secur. 2019, 23, 212–226. [Google Scholar] [CrossRef]
  15. Zurich. Why Soil is Important to Life on Earth—And Helps Fight Climate Change|Zurich Insurance. Available online: https://www.zurich.com/media/magazine/2021/how-soil-supports-life-on-earth-and-could-help-win-the-fight-against-climate-change (accessed on 10 July 2025).
  16. Zhou, Z.C.; Shangguan, Z.P.; Zhao, D. Modeling vegetation coverage and soil erosion in the Loess Plateau Area of China. Ecol. Model. 2006, 198, 263–268. [Google Scholar] [CrossRef]
  17. Banerjee, S.; Pal, I.; Loc, H.H. Modeling the impacts of climate and land use changes on nutrient export using the INVEST model in Tra Vinh Province of the Vietnamese Mekong Delta. In The Mekong Delta Environmental Research Guidebook; Elsevier: Amsterdam, The Netherlands, 2025; pp. 349–363. [Google Scholar] [CrossRef]
  18. Renard, K.G. Predicting Soil Erosion by Water: A Guide to Conservation Planning with the Revised Universal Soil Loss Equation (RUSLE); United States Department of Agriculture, Agricultural Research Service: Washington, DC, USA, 1997.
  19. Kareiva, P.; Tallis, H.; Ricketts, T.H.; Daily, G.C.; Polasky, S. Natural Capital: Theory and Practice of Mapping Ecosystem Services; SAGE Publications Ltd.: London, UK, 2011. [Google Scholar] [CrossRef]
  20. Bishop, C.M. Pattern Recognition and Machine Learning. Available online: https://link.springer.com/book/9780387310732 (accessed on 10 July 2025).
  21. Arnold, J.G.; Moriasi, D.N.; Gassman, P.W.; Abbaspour, K.C.; White, M.J.; Srinivasan, R.; Santhi, C.; Harmel, R.D.; van Griensven, A.; Van Liew, M.W.; et al. SWAT: Model Use, Calibration, and Validation. Trans. ASABE 2012, 55, 1491–1508. Available online: https://swat.tamu.edu/media/99051/azdezasp.pdf (accessed on 8 December 2024). [CrossRef]
  22. Abbaspour, K.C. SWAT-CUP SWATCalibration and Uncertainty Programs; Eawag: Dübendorf, Switzerland, 2015. [Google Scholar]
  23. Hazbavi, Z.; Sadeghi, S.H.; Gholamalifard, M. Dynamic Analysis of Soil Erosion-Based Watershed Health. Geogr. Environ. Sustain. 2019, 12, 43–59. [Google Scholar] [CrossRef]
  24. Phetprayoon, T.; Sarapirome, S.; Navanugraha, C.; Wonprasaid, S. Surface Runoff Estimation Using Grid-Based Curve Number Method in the Upper Lam Phra Phloeng Watershed, Thailand. 2009. Available online: https://www.researchgate.net/publication/266052436 (accessed on 10 December 2024).
  25. Lorsirirat, K. Effect of Forest Cover Change on Sedimentation in Lam Phra Phloeng Reservoir, Northeastern Thailand. In Forest Environments in the Mekong River Basin; Springer: Tokyo, Japan, 2007. [Google Scholar]
  26. Cho, K.M.; Zoebisch, M.A.; Cho, K.M.; Zoebisch, M.A. Land-Use Changes in the Upper Lam Phra Phloeng Watershed, Northeastern Thailand: Characteristics and Driving Forces. J. Agric. Rural. Dev. Trop. Subtrop. 2003, 104, 15–29. [Google Scholar]
  27. Wahid, S.M.; Babela, M.S. Evaluating Landscape Predictors with Reference to Watershed Hydrology: A Case Study from Lam Phra Phloeng Watershed, Northeast Thailand. Asia Pac. J. Rural. Dev. 2008, 18, 41–56. [Google Scholar] [CrossRef]
  28. Vigiak, O.; Borselli, L.; Newham, L.T.H.; McInnes, J.; Roberts, A.M. Comparison of conceptual landscape metrics to define hillslope-scale sediment delivery ratio. Geomorphology 2012, 138, 74–88. [Google Scholar] [CrossRef]
  29. Borselli, L.; Cassi, P.; Torri, D. Prolegomena to sediment and flow connectivity in the landscape: A GIS and field numerical assessment. Catena 2008, 75, 268–277. [Google Scholar] [CrossRef]
  30. Ekanayaka, H.B.G.D.M.P.; Abeysingha, N.; Amarasekara, M.G.T.S.; Samarathunga, D. The Use of InVEST SDR Model to Evaluate Soil Erosion in the Closer Catchment of the Proposed Lower Malwathu Oya Reservoir, Sri Lanka. 2024. Available online: https://ssrn.com/abstract=4815789 (accessed on 10 December 2024).
  31. Chuenchum, P.; Xu, M.; Tang, W. Predicted trends of soil erosion and sediment yield from future land use and climate change scenarios in the Lancang–Mekong River by using the modified RUSLE model. Int. Soil Water Conserv. Res. 2020, 8, 213–227. [Google Scholar] [CrossRef]
  32. Markose, V.J.; Jayappa, K.S. Soil loss estimation and prioritization of sub-watersheds of Kali River basin, Karnataka, India, using RUSLE and GIS. Environ. Monit. Assess. 2016, 188, 225. [Google Scholar] [CrossRef] [PubMed]
  33. Fayas, C.M.; Abeysingha, N.S.; Nirmanee, K.G.S.; Samaratunga, D.; Mallawatantri, A. Soil loss estimation using rusle model to prioritize erosion control in KELANI river basin in Sri Lanka. Int. Soil Water Conserv. Res. 2019, 7, 130–137. [Google Scholar] [CrossRef]
  34. Panagos, P.; Borrelli, P.; Meusburger, K.; van der Zanden, E.H.; Poesen, J.; Alewell, C. Modelling the effect of support practices (P-factor) on the reduction of soil erosion by water at European scale. Environ. Sci. Policy 2015, 51, 23–34. [Google Scholar] [CrossRef]
  35. Elleaume, N.; Locatelli, B.; Makowski, D.; Vallet, A.; Poulenard, J.; Oszwald, J.; Lavorel, S. Uncertainties in future ecosystem services under land and climate scenarios: The case of erosion in the Alps. Ecol. Model. 2025, 502, 111041. [Google Scholar] [CrossRef]
  36. Nelson, E.; Mendoza, G.; Regetz, J.; Polasky, S.; Tallis, H.; Cameron, D.; Chan, M.A.; Daily, G.C.; Goldstein, J.H.; Kareiva, P.; et al. Modeling multiple ecosystem services, biodiversity conservation, commodity production, and tradeoffs at landscape scales. Front. Ecol. Environ. 2009, 7, 4–11. [Google Scholar] [CrossRef]
  37. Sharp, R.; Tallis, H.T.; Ricketts, T.; Guerry, A.D.; Wood, S.A.; Chaplin-Kramer, R.; Nelson, E.; Ennaanay, D.; Wolny, S.; Olwero, N.; et al. InVEST 3.2. 0 User’s Guide. Available online: https://www.researchgate.net/profile/Gregory-Verutes/publication/323832082_InVEST_User‘s_Guide/links/5aad657ea6fdcc1bc0badaab/InVEST-Users-Guide (accessed on 10 July 2025).
  38. Hamel, P.; Chaplin-Kramer, R.; Sim, S.; Mueller, C. A new approach to modeling the sediment retention service (InVEST 3.0): Case study of the Cape Fear catchment, North Carolina, USA. Sci. Total Environ. 2015, 524–525, 166–177. [Google Scholar] [CrossRef] [PubMed]
  39. Bhatt, S.C.; Singh, M.M.; Singh, S.K.; Rana, N.K.; Kori, R.K.; Patel, A.; Sachan, H. Assessment of Soil and Sediment Loss in the Ken River Basin, Central India, Using RUSLE and InVEST SDR Models. Environ. Qual. Manag. 2025, 34, e70042. [Google Scholar] [CrossRef]
  40. Debie, E.; Awoke, Z. Assessment of the effects of land use/cover changes on soil loss and sediment export in the Tul Watershed, Northwest Ethiopia using the RUSLE and InVEST models. Int. J. River Basin Manag. 2024, 22, 471–486. [Google Scholar] [CrossRef]
  41. Tarboton, D.G. A new method for the determination of flow directions and upslope areas in grid digital elevation models. Water Resour. Res. 1997, 33, 309–319. [Google Scholar] [CrossRef]
  42. Breiman, L. Bagging Predictors; Kluwer Academic Publishers: Alfin am Rhine, The Netherlands, 1996. [Google Scholar]
  43. Dai, B.; Chen, R.C.; Zhu, S.Z.; Zhang, W.W. Using random forest algorithm for breast cancer diagnosis. In Proceedings of the 2018 International Symposium on Computer, Consumer and Control, IS3C 2018, Taichung, Taiwan, 6–8 December 2018; Institute of Electrical and Electronics Engineers Inc.: Piscataway, NJ, USA, 2018; pp. 449–452. [Google Scholar] [CrossRef]
  44. Qi, Y. Random Forest for Bioinformatics. In Ensemble Machine Learning; Springer: New York, NY, USA, 2012; pp. 307–323. [Google Scholar] [CrossRef]
  45. Fife, D.A.; D’Onofrio, J. Common, uncommon, and novel applications of random forest in psychological research. Behav. Res. Methods 2023, 55, 2447–2466. [Google Scholar] [CrossRef] [PubMed]
  46. Ren, Q.; Cheng, H.; Han, H. Research on machine learning framework based on random forest algorithm. AIP Conf. Proc. 2017, 1820, 080020. [Google Scholar] [CrossRef]
  47. Congalton, R.G. Accuracy assessment and validation of remotely sensed and other spatial information. Int. J. Wildland Fire 2001, 10, 321–328. [Google Scholar] [CrossRef]
  48. Thammaboribal, P.; Tripathi, N.K. Predicting Land Use and Land Cover Changes in Pathumthani, Thailand: A Comprehensive Analysis from 2013 to 2023 Using Landsat Satellite Imagery and CA-ANN Algorithm, with Projections for 2028 and 2038. Int. J. Geoinform. 2024, 20, 13–27. [Google Scholar] [CrossRef]
  49. Rangsiwanichpong, P.; Kazama, S.; Ekkawatpanit, C.; Gunawardhana, L. Evaluation of cost and benefit of sediment based on landslide and erosion models. Catena 2019, 173, 194–206. [Google Scholar] [CrossRef]
  50. Kantharajan, G.; Govindakrishnan, P.M.; Singh, R.K.; Natalia, E.C.; Jones, S.K.; Singh, A.; Mohindra, V.; Kumar, N.K.R.K.; Rana, J.C.; Jena, J.K.; et al. Quantitative assessment of sediment delivery and retention in four watersheds in the Godavari River Basin, India, using InVEST model—An aquatic ecosystem services perspective. Environ. Sci. Pollut. Res. 2023, 30, 30371–30384. [Google Scholar] [CrossRef]
  51. Srichaichana, J.; Trisurat, Y.; Ongsomwang, S. Land use and land cover scenarios for optimum water yield and sediment retention ecosystem services in Klong U-Tapao watershed, Songkhla, Thailand. Sustainability 2019, 11, 2895. [Google Scholar] [CrossRef]
  52. Kulsoontornrat, J.; Ongsomwang, S. Suitable land-use and land-cover allocation scenarios to minimize sediment and nutrient loads into kwan phayao, upper ing watershed, thailand. Appl. Sci. 2021, 11, 10430. [Google Scholar] [CrossRef]
  53. Loc, H.H.; Thanavanh, T.; Nguyet, D.A.; Upadhyay, S.; Maung, T.M.; Shrestha, S.; Park, E.; Hamel, P. Understanding the impacts of land use changes on the sustainability of hydrological ecosystem services: The case of Pasak River Basin, Thailand. Environ. Dev. Sustain. 2024. [Google Scholar] [CrossRef]
  54. Bewket, W.; Sterk, G. Assessment of soil erosion in cultivated fields using a survey methodology for rills in the Chemoga watershed, Ethiopia. Agric. Ecosyst. Environ. 2003, 97, 81–93. [Google Scholar] [CrossRef]
  55. Geeson, N.; Kirkby, M.; Kosmas, C. The Medalus Project: Mediterranean Desertification and Land Use: Manual on Key Indicators of Desertification and Mapping Environmentally Sensitive Areas to Desertification; European Union: Luxembourg, 1999. [Google Scholar]
  56. Sirikaew, U.; Seeboonruang, U.; Tanachaichoksirikun, P.; Wattanasetpong, J.; Chulkaivalsucharit, V.; Chen, W. Impact of climate change on soil erosion in the lam phra phloeng watershed. Water 2020, 12, 3527. [Google Scholar] [CrossRef]
  57. Ongsomwang, J.S.; Thinley, U. Spatial Modeling for Soil Erosion Assessment in Upper Lam Phra Phloeng Watershed, Nakhon Ratchasima, Thailand. Suranaree J. Sci. Technol. 2009, 16, 253–262. [Google Scholar]
  58. Wattanasetpong, J.; Seeboonruang, U.; Sirikaew, U.; Chen, W. Assessment of land cover on soil erosion in Lam Phra Phloeng watershed by USLE model. MATEC Web Conf. 2018, 192, 02017. [Google Scholar] [CrossRef]
  59. Iamnarongrit, T. Application of Neuro-Genetic Optimizer for Sediment Forecasting in Lam Phra Phloeng Reservoir. Master’s Thesis, Mahidol University, Nakhon Pathom, Thailand, 2007. [Google Scholar]
  60. Brauman, K.A.; Daily, G.C.; Duarte, T.K.E.; Mooney, H.A. The nature and value of ecosystem services: An overview highlighting hydrologic services. Annu. Rev. Environ. Resour. 2007, 32, 67–98. [Google Scholar] [CrossRef]
  61. Banerjee, S.; Hu Loc, H.; Pal, I.; Mukhopadhyay, A.; Van Pham Huynh, T.; Pham, D.T.; Thi, H.C.N. Assessing the sensitivity of physiographical parameters in modeling hydrological ecosystem services that support food security: The case of Vietnamese Mekong Delta. Model. Earth Syst. Environ. 2025, 11, 239. [Google Scholar] [CrossRef]
  62. Benavidez, R.; Jackson, B.; Maxwell, D.; Norton, K. A review of the (Revised) Universal Soil Loss Equation ((R)USLE): With a view to increasing its global applicability and improving soil loss estimates. Hydrol. Earth Syst. Sci. 2018, 22, 6059–6086. [Google Scholar] [CrossRef]
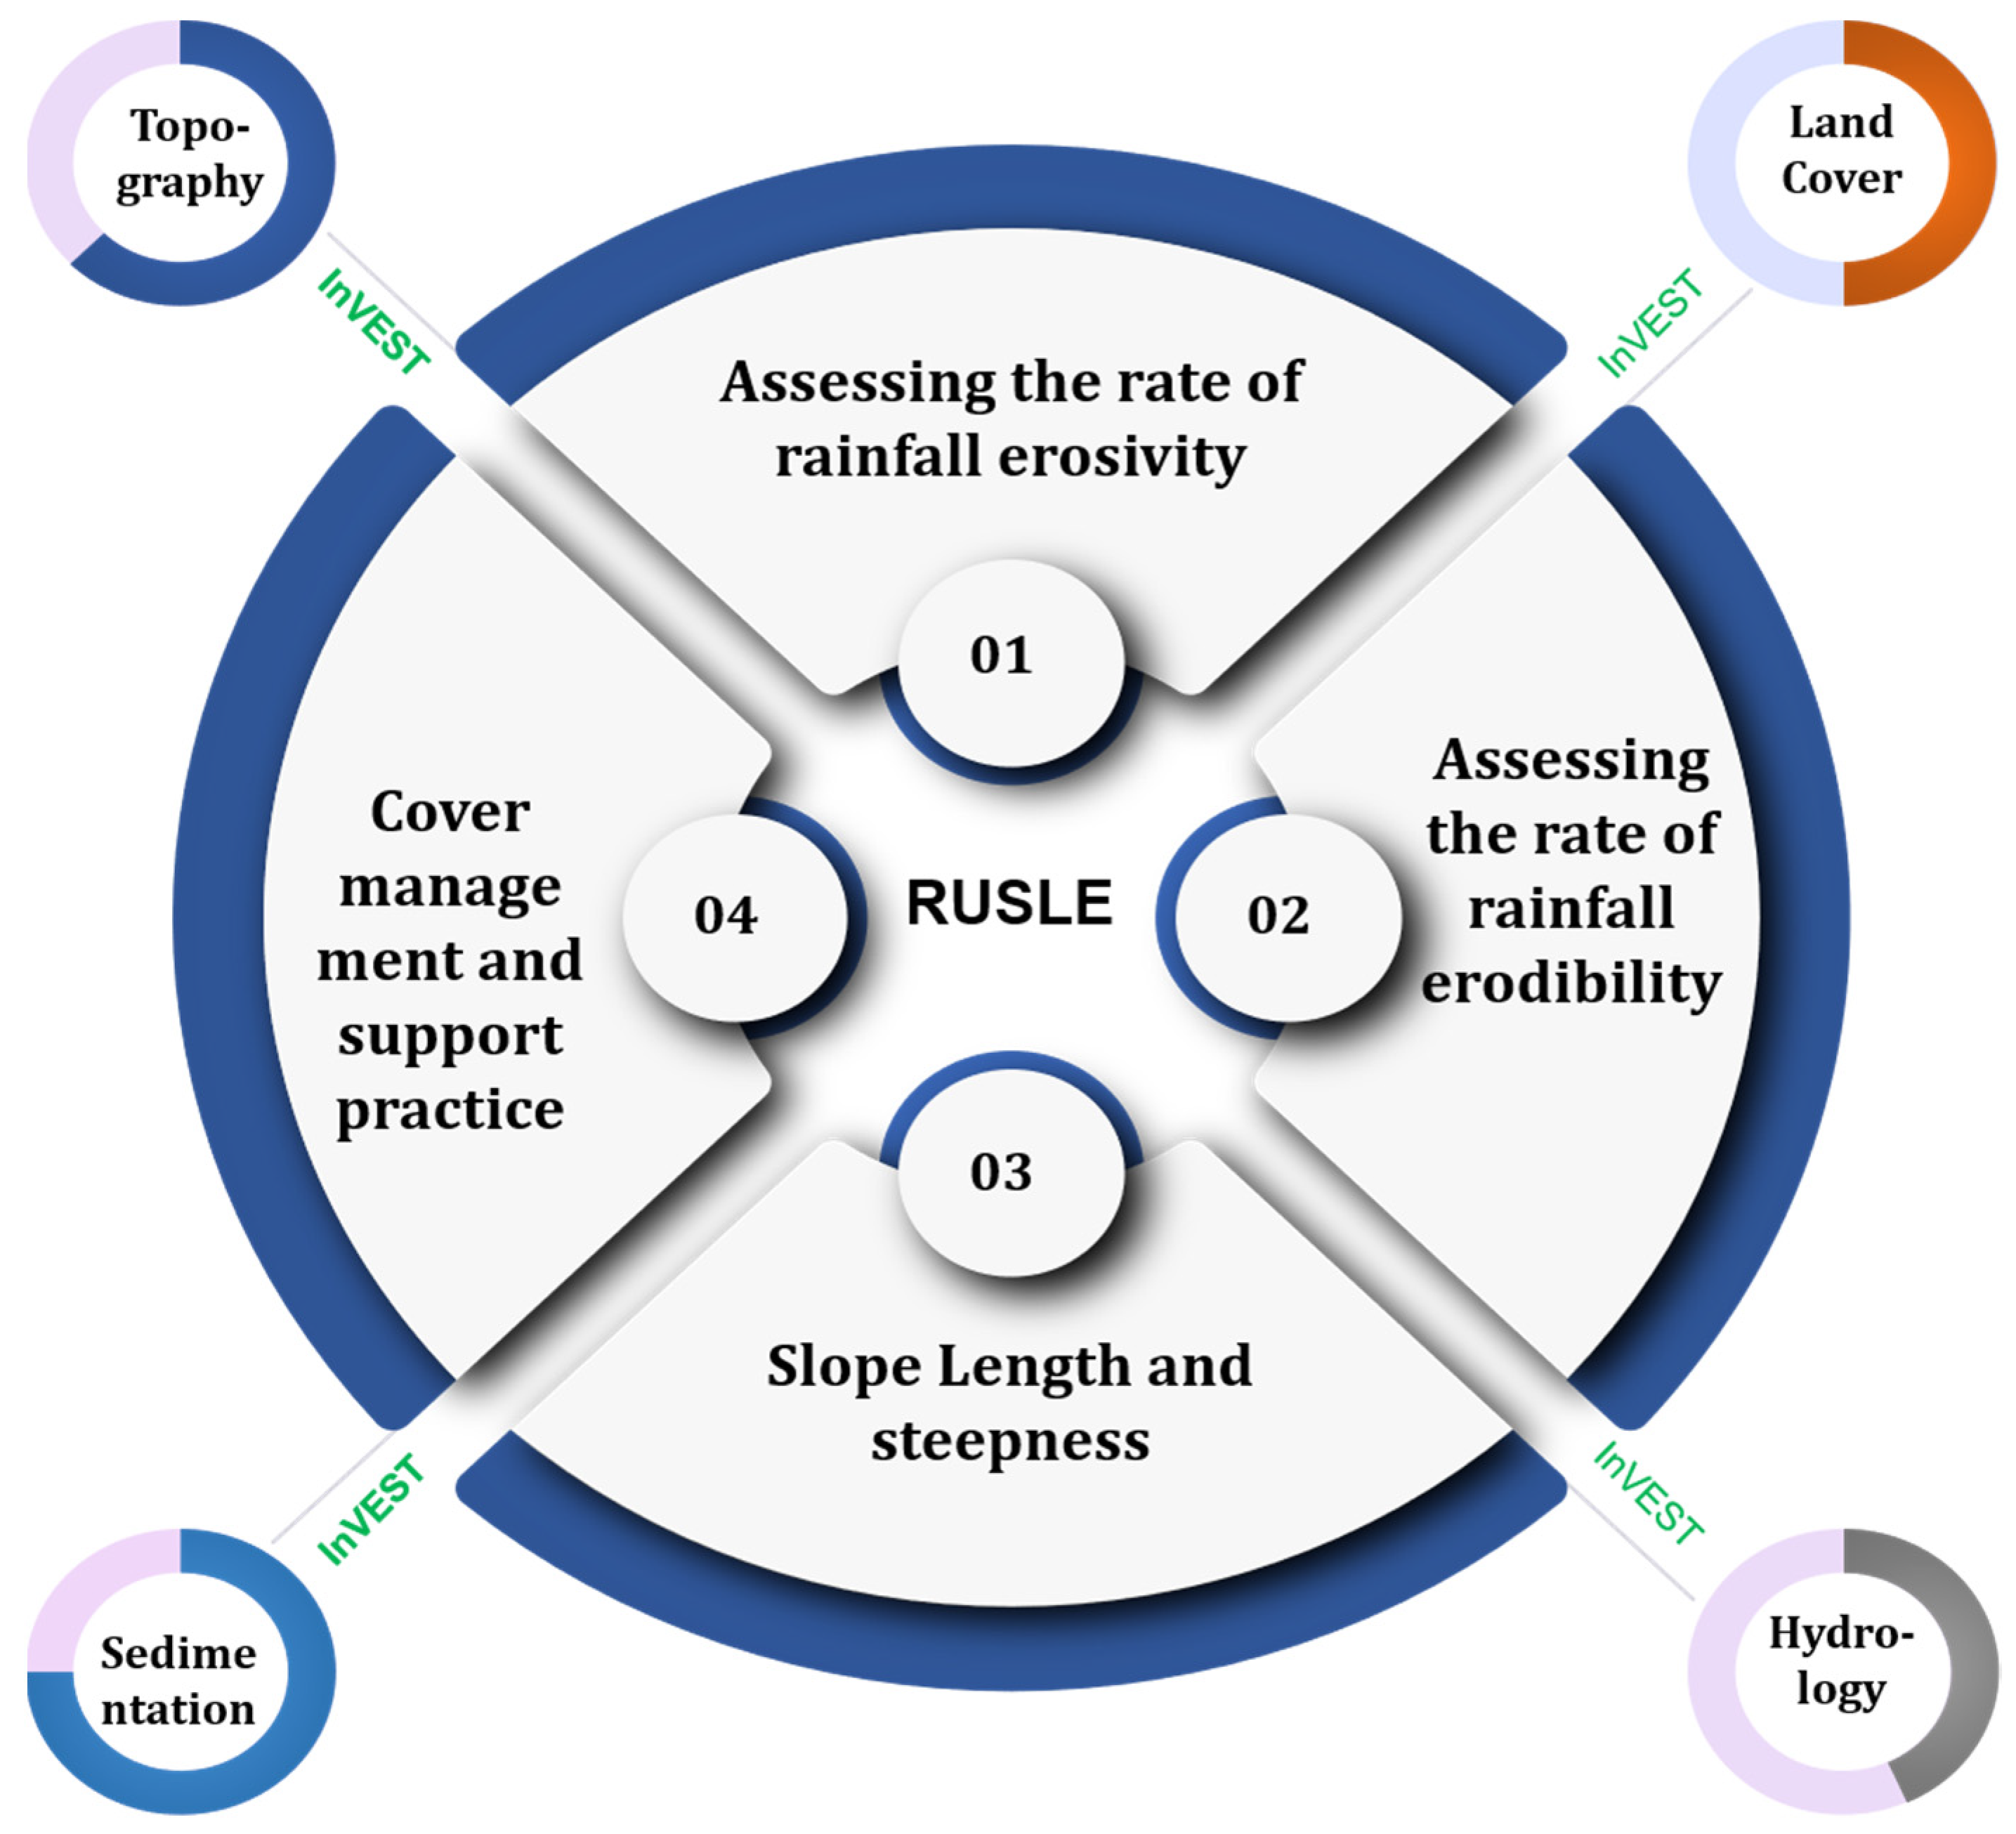
Figure 1. Coupled modelling framework using InVEST SDR and RUSLE model.
Water 17 03339 g001
Figure 2. Lam Phra Phloeng watershed.
Water 17 03339 g002
Figure 3. Flowchart of the RUSLE model simulation.
Water 17 03339 g003
Figure 4. Flowchart for simulation of the InVEST SDR model.
Water 17 03339 g004
Figure 5. Input parameters for the RUSLE model (A) P factor, (B) R factor, (C) LS factor, (D) K factor, and (E) C factor.
Water 17 03339 g005
Figure 6. Land cover map of the Lam Phra Phloeng watershed derived from Sentinel-2 MSI satellite imagery (10 m resolution) using the Random Forest (RF) supervised classification algorithm.
Water 17 03339 g006
Figure 7. Erosion map generated from RUSLE model simulation.
Water 17 03339 g007
Figure 8. Spatial distribution of sediment retention in Lam Phra Phloeng watershed modelled by InVEST SDR. Units are in tons/pixel. Each pixel is 30 m × 30 m (0.09 ha).
Water 17 03339 g008
Figure 9. Sediment retention of individual land use classes.
Water 17 03339 g009
Figure 10. Futuristic implications of the coupled modelling studies using InVEST and RUSLE.
Water 17 03339 g010
Table 1. List of inputs for the RUSLE model.
Data UsedDescriptionSource
ASTER GDEMThe Global Digital Elevation Model (GDEM) is the product of the Advanced Spaceborne Thermal Emission and Reflection Radiometer (ASTER).https://earthexplorer.usgs.gov/ (accessed on 17 December 2024)
Soil dataA global dataset that contains soil properties and soil classificationhttps://www.fao.org/soils-portal/data-hub/soil-maps-and-databases/en/ (accessed on 17 December 2024)
Climate dataGridded weather and climate datahttps://www.worldclim.org/ (accessed on 17 December 2024)
Land use land coverLand use land cover map derived from Sentinel 2 MSI satellite imageryhttps://browser.dataspace.copernicus.eu/ (accessed on 17 December 2024)
Table 2. List of inputs for the InVEST SDR model.
Data UsedDescriptionSource
Land use/land coverLand use and land cover classification of the study areahttps://livingatlas.arcgis.com/landcover/ (accessed on 17 December 2024)
SRTM DEMDigital Elevation Model represents the elevation variation in the study area https://www.earthdata.nasa.gov/ (accessed on 17 December 2024)
Watershed boundaryShapefile of LPP watershed boundaryhttps://diva-gis.org/data.html (accessed on 17 December 2024)
ErosivityRainfall erosivity reflects the intensity and duration of rainfall in the area of interest.https://esdac.jrc.ec.europa.eu/content/global-rainfall-erosivity (accessed on 17 December 2024)
Soil Erodibility Soil erodibility is the susceptibility of soil particles to detachment and transport by rainfall and runoff.https://esdac.jrc.ec.europa.eu/content/global-soil-erodibility (accessed on 17 December 2024)
Maximum SDR Theoretical maximum sediment delivery ratio. It is the highest possible fraction of eroded sediment that can reach a river or stream channel (0.80)[28]
Threshold Flow AccumulationThe density and structure of the river network extracted from a Digital Elevation Model (1000)[28]
Borselli IC0Connectivity index at the start point (0.5)[29]
Borselli K Parametershape of the relationship between hydrologic connectivity and the nutrient delivery ratio (2.4)[29]
Maximum L value The maximum allowed value of the slope length parameter (122)[30]
Table 3. Accuracy information for land use mapping at LPP.
Accuracy Table for RF Classification
User Accuracy (%)Producer Accuracy (%)Overall Accuracy (%)Kappa Coefficient
Water96.195.291.30.89
Forest91.592.8
Flooded vegetation86.786.7
Crops90.489.3
Built-Up Area93.294.7
Rangeland85.987.1
Table 4. A comparison between the rate of soil erosion studies found in the Lam Phra Phloeng (LPP) watershed and surrounding areas.
Study AreaRate of Erosion/Rate of Soil LossReference
Songkhla, Thailand10,293 tons/km2[51]
Ing Watershed, Thailand 29.64 tons/km2[52]
Pasak River Basin, Thailand673 tons/km2[53]
Lam Phra Phloeng (LPP) watershed6000 tons/km2[56]
Lam Phra Phloeng (LPP) watershed3140 tons/km2[57]
Lam Phra Phloeng (LPP) watershed6429 tons/km2[58]
Lam Phra Phloeng reservoir500 tons/km2[25]
Lam Phra Phloeng (LPP) watershed196,771 tons/km2[59]
Disclaimer/Publisher’s Note: The statements, opinions and data contained in all publications are solely those of the individual author(s) and contributor(s) and not of MDPI and/or the editor(s). MDPI and/or the editor(s) disclaim responsibility for any injury to people or property resulting from any ideas, methods, instructions or products referred to in the content.