Article

Occurrence of Microplastics in Inland and Island Wastewater Treatment Plants and the Role of Suspended Solids as Monitoring Indicators

by
Suthida Theepharaksapan
1,
Paranee Sriromreun
2,
Pradabduang Kiattisaksiri
3,
Athit Phetrak
4,
Chalintorn Molee
5 and
Suda Ittisupornrat
5,*
1
Department of Civil and Environmental Engineering, Engineering Faculty, Srinakharinwirot University, Nakhon Nayok 26120, Thailand
2
Department of Chemical Engineering, Engineering Faculty, Srinakharinwirot University, Nakhon Nayok 26120, Thailand
3
Faculty of Public Health, Thammasat University, Lampang Campus, Lampang 52190, Thailand
4
Department of Social and Environmental Medicine, Faculty of Tropical Medicine, Mahidol University, Bangkok 10400, Thailand
5
Climate Change and Environmental Research Center, Department of Climate Change and Environment, Technopolis, Khlong Luang, Pathumthani 12120, Thailand
*
Author to whom correspondence should be addressed.
Water 2025, 17(22), 3330; https://doi.org/10.3390/w17223330 (registering DOI)
Submission received: 26 September 2025 / Revised: 8 November 2025 / Accepted: 12 November 2025 / Published: 20 November 2025
(This article belongs to the Section Wastewater Treatment and Reuse)

Abstract

Microplastics (MPs) are increasingly recognized as emerging contaminants in aquatic environments; however, their occurrence and fate in tropical wastewater treatment systems remain poorly understood. This study provides the first inland–island comparison of MP removal in wastewater treatment plants (WWTPs) across Thailand’s Eastern Economic Corridor. Influent and effluent samples were collected from six WWTPs, encompassing five treatment types: oxidation ditch, aerated lagoon, stabilization pond, aerated tank, and sand filtration combined with reverse osmosis. Polymeric composition and size distribution were examined in parallel with conventional water quality indicators. Across all sites, polyethylene and polypropylene dominated influent MPs, together accounting for 57–92% of total abundance. Inland plants received heterogeneous municipal wastewater, including domestic inputs and agricultural runoff. In contrast, island facilities consistently showed PE-enriched influents (45–60%) in site F, reflecting tourism-driven reliance on single-use plastics and personal care products. In addition, several minor polymers were identified, including poly (vinyl stearate) (up to 26%), polyamide, and ethylene–butyl acrylate, highlighting overlooked pathways of MP entry into WWTPs. Fine MPs (100–300 μm) comprised over two-thirds of influent particles, with stabilization ponds reaching 16,000 MP m−3. Removal efficiency ranged from 86.0% to 98.5%. Spearman’s correlation and multiple linear regression analyses revealed strong positive relationships between MPs and both total suspended solids (TSS) and turbidity. Suspended solids parameters emerged as the most reliable predictor of MP abundance (adjusted R2 = 0.91, p = 0.001). This finding highlights TSS coupled with turbidity as a practical, cost-effective indicator for monitoring MPs in tropical WWTPs. To achieve greater accuracy, a larger dataset should be built and further analyzed.

1. Introduction

Plastic pollution has emerged as a critical global concern, with plastic production and mismanaged waste continuing to outpace existing management systems. Projections suggest that without strong interventions, the amount of mismanaged plastic waste could double by 2050 [1]. As larger plastic debris degrades, it fragments into microplastics (MPs), particles smaller than 5 mm that persist in the environment and pose serious ecological and human health risks [2,3]. Among these, polyethylene (PE), polypropylene (PP), polyethylene terephthalate (PET), and polystyrene (PS), which dominate consumer packaging, are the most frequently detected polymers in sewerage systems and wastewater treatment plants (WWTPs), and are commonly released into aquatic environments [4,5].
MP contamination has now been reported worldwide in rivers, lakes, oceans, and wastewater treatment systems [6,7]. WWTPs, while vital for pollution control, are increasingly recognized as significant sources of MPs due to the incomplete removal achieved by conventional processes [5,8]. Recent studies show that removal efficiency varies widely across systems: some advanced technologies achieve high retention, whereas conventional plants may release millions of MPs per day into receiving waters [9,10,11,12]. However, important knowledge gaps remain regarding the mechanisms responsible for MP retention, whether dominated by sedimentation, biofilm entrapment, or filtration, and the extent to which these processes are linked to operational water quality indicators [7,12]. In line with this, Sullivan and team demonstrated a significant correlation between suspended particulate matter, a satellite-observable parameter, and MP concentrations in a UK estuary. This finding highlights the potential of water quality substitutes for estimating MP fluxes across broader spatial and temporal scales [13].
In Thailand, MPs have been detected in municipal wastewater effluents, confirming their continuous release into rivers and coastal environments [14,15]. Seasonal variability, particularly during the monsoon season, may influence influent characteristics, WWTP performance, and ultimately MP fate, but this has not been systematically evaluated [16]. Moreover, unlike the European Union, where MPs are being incorporated into emerging monitoring frameworks, Thailand’s effluent standards currently do not regulate MPs, creating a regulatory gap that complicates mitigation strategies.
The Eastern Economic Corridor (EEC), which covers the provinces of Chonburi, Rayong, and Chachoengsao, is Thailand’s most dynamic hub for industrial development and tourism [17]. Rapid urban growth, industrial expansion, and intensive coastal tourism have substantially increased plastic waste generation, raising concerns about MP contamination in both inland and marine ecosystems. Recent surveys around coral reefs in the eastern Gulf of Thailand revealed high MP contamination dominated by PE and PP, with potential ecological risks to marine biodiversity [18,19]. Conventional WWTPs in the EEC primarily employ oxidation ditch (OD), aerated lagoon (AL), and stabilization pond (SP) in inland municipalities, while island communities rely on smaller-scale systems such as aerated tanks (AT) or sand filtration (SF) coupled with reverse osmosis (RO). Inland plants typically treat heterogeneous municipal inputs, including domestic, commercial, and industrial wastewaters, whereas island systems are more influenced by tourism-driven waste streams dominated by single-use plastics. These contrasting contexts are expected to affect the variety of MP contamination and removal efficiency; however, systematic comparative evaluations are lacking. In addition, the development of simple screening approaches for MPs remains a critical gap. Previous studies have primarily explored the use of turbidity as a potential indicator of MPs in raw water sources, but such approaches have not yet been systematically applied to wastewater treatment systems [13,20,21].
Therefore, this study provides the first comparative assessment of MP occurrence and fate in inland and island WWTPs within Thailand’s EEC. The investigation aims to explain how treatment configurations and influent characteristics influence MP removal and persistence across different systems. It was hypothesized that inland WWTPs would exhibit greater variability in influent quality due to mixed municipal, industrial, and agricultural inputs, whereas island systems dominated by tourism-related wastewater would display more consistent influent characteristics. For this assumption, MPs between inland and island may indicate distinct MP profiles. The specific objectives of this study are to (i) quantify the abundance, size distribution, and polymer composition of MPs in the influent and effluent of six representative WWTPs, to (ii) compare MP polymer composition and abundance between inland and island WWTPs, and to (iii) examine relationships between MP abundance and physicochemical parameters to identify potential indicators for practical MP monitoring in influent and effluent of wastewater treatment system. Collectively, these objectives aim to establish a scientific basis for understanding MP behavior across diverse treatment configurations, while providing a cost-effective and time-efficient approach for routine monitoring.

2. Materials and Methods

2.1. Study Area and Wastewater Treatment Plants

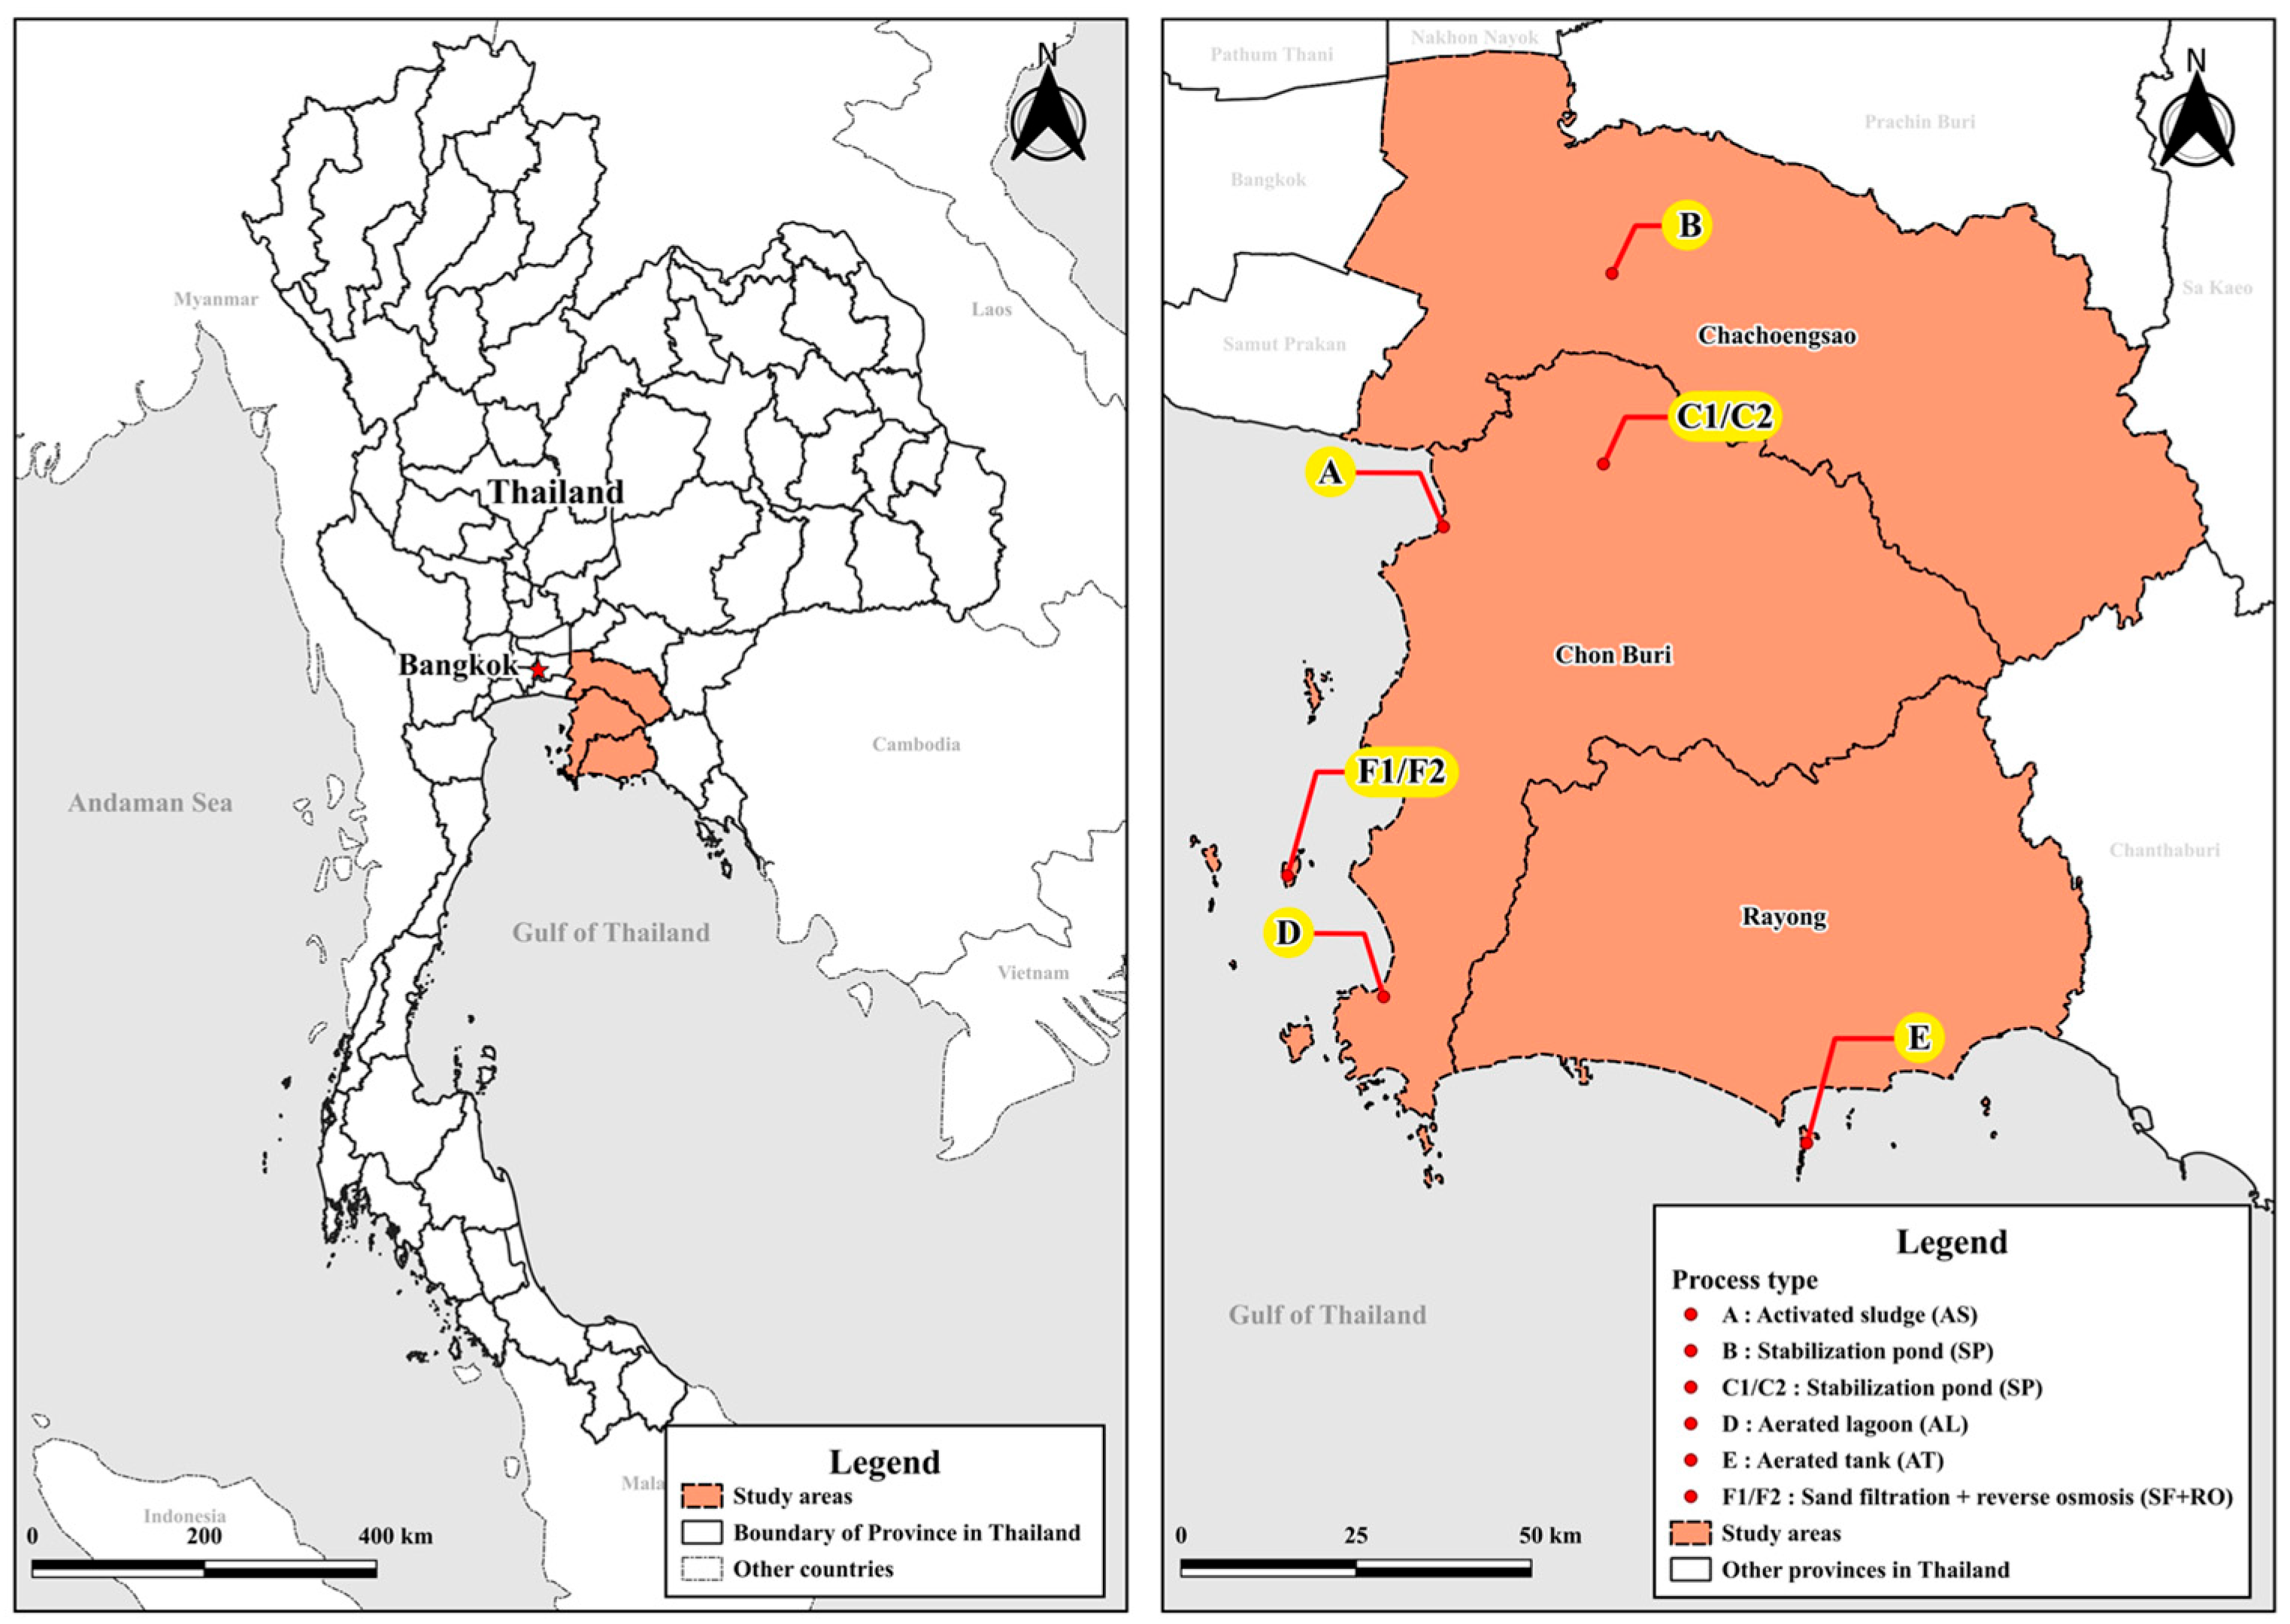
This study was conducted in the EEC, covering the provinces of Chachoengsao, Chonburi, and Rayong. Six representative WWTPs were selected to evaluate MP removal performance, capturing both inland and island contexts (Figure 1). The inland WWTPs consisted of one OD system (Site A), two SPs (Sites B and C), and one AL system (Site D). Site C was monitored during two separate campaigns and is reported as C1 and C2. The island WWTPs included one AT (Site E) and one facility employing sand filtration combined with RO (Site F). The latter was monitored twice, reported as F1 and F2. The inland plants (Sites A–D) primarily receive heterogeneous municipal wastewater composed of domestic, commercial, and light industrial inputs, whereas the island plants (Sites E and F) are strongly influenced by tourism activities. This selection reflects the diversity of treatment configurations and operating conditions within the EEC and provides a comparative framework for investigating inland–island contrasts in MP characteristics and removal efficiency.

2.2. Sampling of Wastewater

Sampling was conducted at six WWTPs representing different treatment configurations within Thailand’s EEC. At each plant, both influent and effluent samples were collected. Among these, two WWTPs, C (inland) and F (island), were sampled twice to represent distinct seasonal conditions: C1 and F1 during the dry season, and C2 and F2 during the wet season, resulting in a total of 16 samples (8 influent and 8 effluent). This design enabled the comparison of MP characteristics under varying hydrological and operational conditions across inland and island systems. For each sampling event, the volume of collected water varied depending on turbidity and system characteristics, ranging from 5 to 200 L for influent and 200–2000 L for effluent (Table S2). Each sample was filtered in the field using a cascade of stainless-steel sieves (5 mm, 1 mm, 300 µm, and 100 µm mesh; 21 cm diameter) operated with a submerged pump, following the method of Razeghi et al. (2021) [22]. Particles retained on the 5 mm sieve were discarded, while those on the 1 mm, 300 µm, and 100 µm sieves were gently rinsed with distilled water and separately transferred into pre-cleaned glass bottles. Because only a few particles were retained on the 1 mm sieve, this fraction was combined with the 300 µm fraction to reduce reagent use and analytical time. All samples were stored at 4 °C in the dark and transported to the laboratory for further pretreatment and microplastic identification, as described in Section 2.3.
Figure 1. Location of the six studied WWTPs within the EEC, Thailand. Sites A–D represent inland systems (OD, AL, and SP), whereas Sites E and F correspond to island-based facilities (AT and sand filtration with RO). Sites C and F were monitored twice during the sampling campaigns and are denoted as C1/C2 and F1/F2, respectively. Detailed characteristics of each WWTP are provided in Table S1.
Water 17 03330 g001

2.3. Microplastic Pretreatment and Identification

Sample pretreatment followed the wet peroxide oxidation (WPO) protocol described by Masura et al. (2015) [23], with minor modifications to improve digestion efficiency for wastewater samples [11]. The fractions retained after sieving were first dried at 60 °C overnight, then transferred into 250 mL glass beakers. Each subsample was treated with 20 mL of 0.05 M FeSO4·7H2O solution and 20 mL of 30% H2O2. Reactions were maintained at 60 °C on a hot plate until organic matter was fully digested, with additional H2O2 added as required. Following digestion, density separation was conducted using a saturated NaCl solution (density ~1.2 g cm−3). The mixture was allowed to settle overnight, and the supernatant containing floating particles was carefully decanted and vacuum-filtered through anodisc filters (aluminum oxide, pore size: 0.2 µm, diameter: 25 mm, Whatman, UK). Filters were transferred into pre-cleaned glass Petri dishes, sealed with aluminum foil, and stored in a desiccator prior to further examination. In cases where samples contained dense particles, more than one anodisc filter was used for filtration to avoid sample clogging.
The representative total particles on the anodisc filter were analyzed using Fourier-transform infrared (FTIR) Spectrum 3 spectroscopy (PerkinElmer, Springfield, IL, USA) with a DTGS (deuterated triglycine sulfate) detector operated in transmission mode (128 scans, spectral range 1200–4000 cm−1, resolution 4 cm−1). This spectral range was selected because the anodisc filters used for filtration produce strong background interference below 1200 cm−1. Excluding this region minimized spectral noise and improved matching accuracy. The characteristic absorption bands of the main polymers identified in this study occur primarily above 1200 cm−1, allowing reliable spectral matching for polymer identification. However, some limitations of polymer identification, like in the case of PTFE, have been reported by using an anodisc filter [24]. In this case, Attenuated Total Reflectance (ATR-FTIR) was randomly used to confirm PTFE spectrum analysis. The photograph was captured using a Spotlight 400 FT-IR imaging system. Particles were classified as microplastics only when FTIR spectra showed ≥70% match with polymer reference libraries. Polymer identification was conducted using the PerkinElmer Spectrum version 10 software and the PerkinElmer polymer reference library, which contains over 5000 spectra of synthetic and natural polymers. The ≥70% similarity threshold was adopted following practices established in previous MP studies [25,26]. To reduce false positives, only synthetic polymers identified in this study confirmed by FTIR were reported as MPs. Natural fibers such as cellulose and animal hair were excluded from the dataset. All analyses were conducted under controlled laboratory conditions to minimize airborne contamination, as described in Section 2.4.

2.4. Quality Assurance and Quality Control (QA/QC)

Strict QA/QC measures were applied throughout sampling and laboratory procedures to minimize contamination and ensure reproducibility. During fieldwork, personnel wore cotton laboratory coats and nitrile gloves, and all handling was performed using stainless-steel or glass equipment to avoid plastic-derived contamination. All equipment was washed with laboratory detergent and rinsed three times with ultrapure water prior to use. Laboratory triplicate blanks were also processed in a similar manner to the samples. The blank volume of 1.6 L was chosen based on the volume of distilled water used for the pretreatment process. Some MP particles displayed an average of 1.5 ± 1.3 MP L−1. The MP counts were reported without being blank-corrected. All pretreatment steps were conducted under a clean-air bench equipped with continuous HEPA filtration to minimize airborne contamination. Only glass and metal apparatus were used, and all materials were rinsed with ultrapure water before each use [27].

2.5. Physicochemical Water Quality Analysis

Physicochemical parameters were analyzed to support the interpretation of microplastic data. The measured parameters included pH, electrical conductivity (EC), salinity, dissolved oxygen (DO), turbidity, total suspended solids (TSS), soluble chemical oxygen demand (sCOD), total nitrogen (TN), and total phosphorus (TP). On-site measurements of pH, EC, salinity, and DO were conducted using calibrated probes (YSI 60, Yellow Springs, OH, USA). Turbidity was determined using a portable turbidimeter (Thermo Fisher Scientific, Waltham, MA, USA). COD was analyzed following standard Hach methods (Hach, Loveland, CO, USA). TN was measured with a TOC analyzer (TOC-L, Shimadzu, Kyoto, Japan), while TSS and TP were quantified according to the Standard Methods for the Examination of Water and Wastewater [28].
All analyses were carried out in duplicate, and results are presented as mean values. Instrument calibration was verified using manufacturer-recommended standards, and reagent blanks were processed alongside the samples to ensure data reliability.

2.6. Statistical Analysis

Statistical analyses were performed to explore the relationships between MP concentrations and physicochemical water quality parameters and to construct predictive models. Correlation analysis was conducted separately for influent and effluent samples to account for potential differences in MP behavior before and after treatment. All analyses were based on individual data obtained from each sampling event (n = 8) across six WWTPs, including duplicate campaigns at two sites (C and F). The Shapiro–Wilk test was applied to assess the normality of each variable. Spearman’s rank correlation was employed to evaluate monotonic relationships between MP concentrations and individual water-quality parameters. Parameters showing statistically significant correlations were selected as candidate predictors for regression modeling. Subsequently, multiple linear regression (MLR) analysis was performed to quantify the predictive influence of these parameters on MP concentrations and to identify the most relevant predictors. Model performance was evaluated using the coefficient of determination (R2) and adjusted R2 (Adj. R2), which accounts for the number of predictors and minimizes overfitting. The statistical significance of individual predictors was assessed using p-values at a 95% confidence level [29]. All statistical analyses were conducted using Minitab 17 software (Minitab Inc., State College, PA, USA).

3. Results and Discussion

3.1. Performance of WWTPs
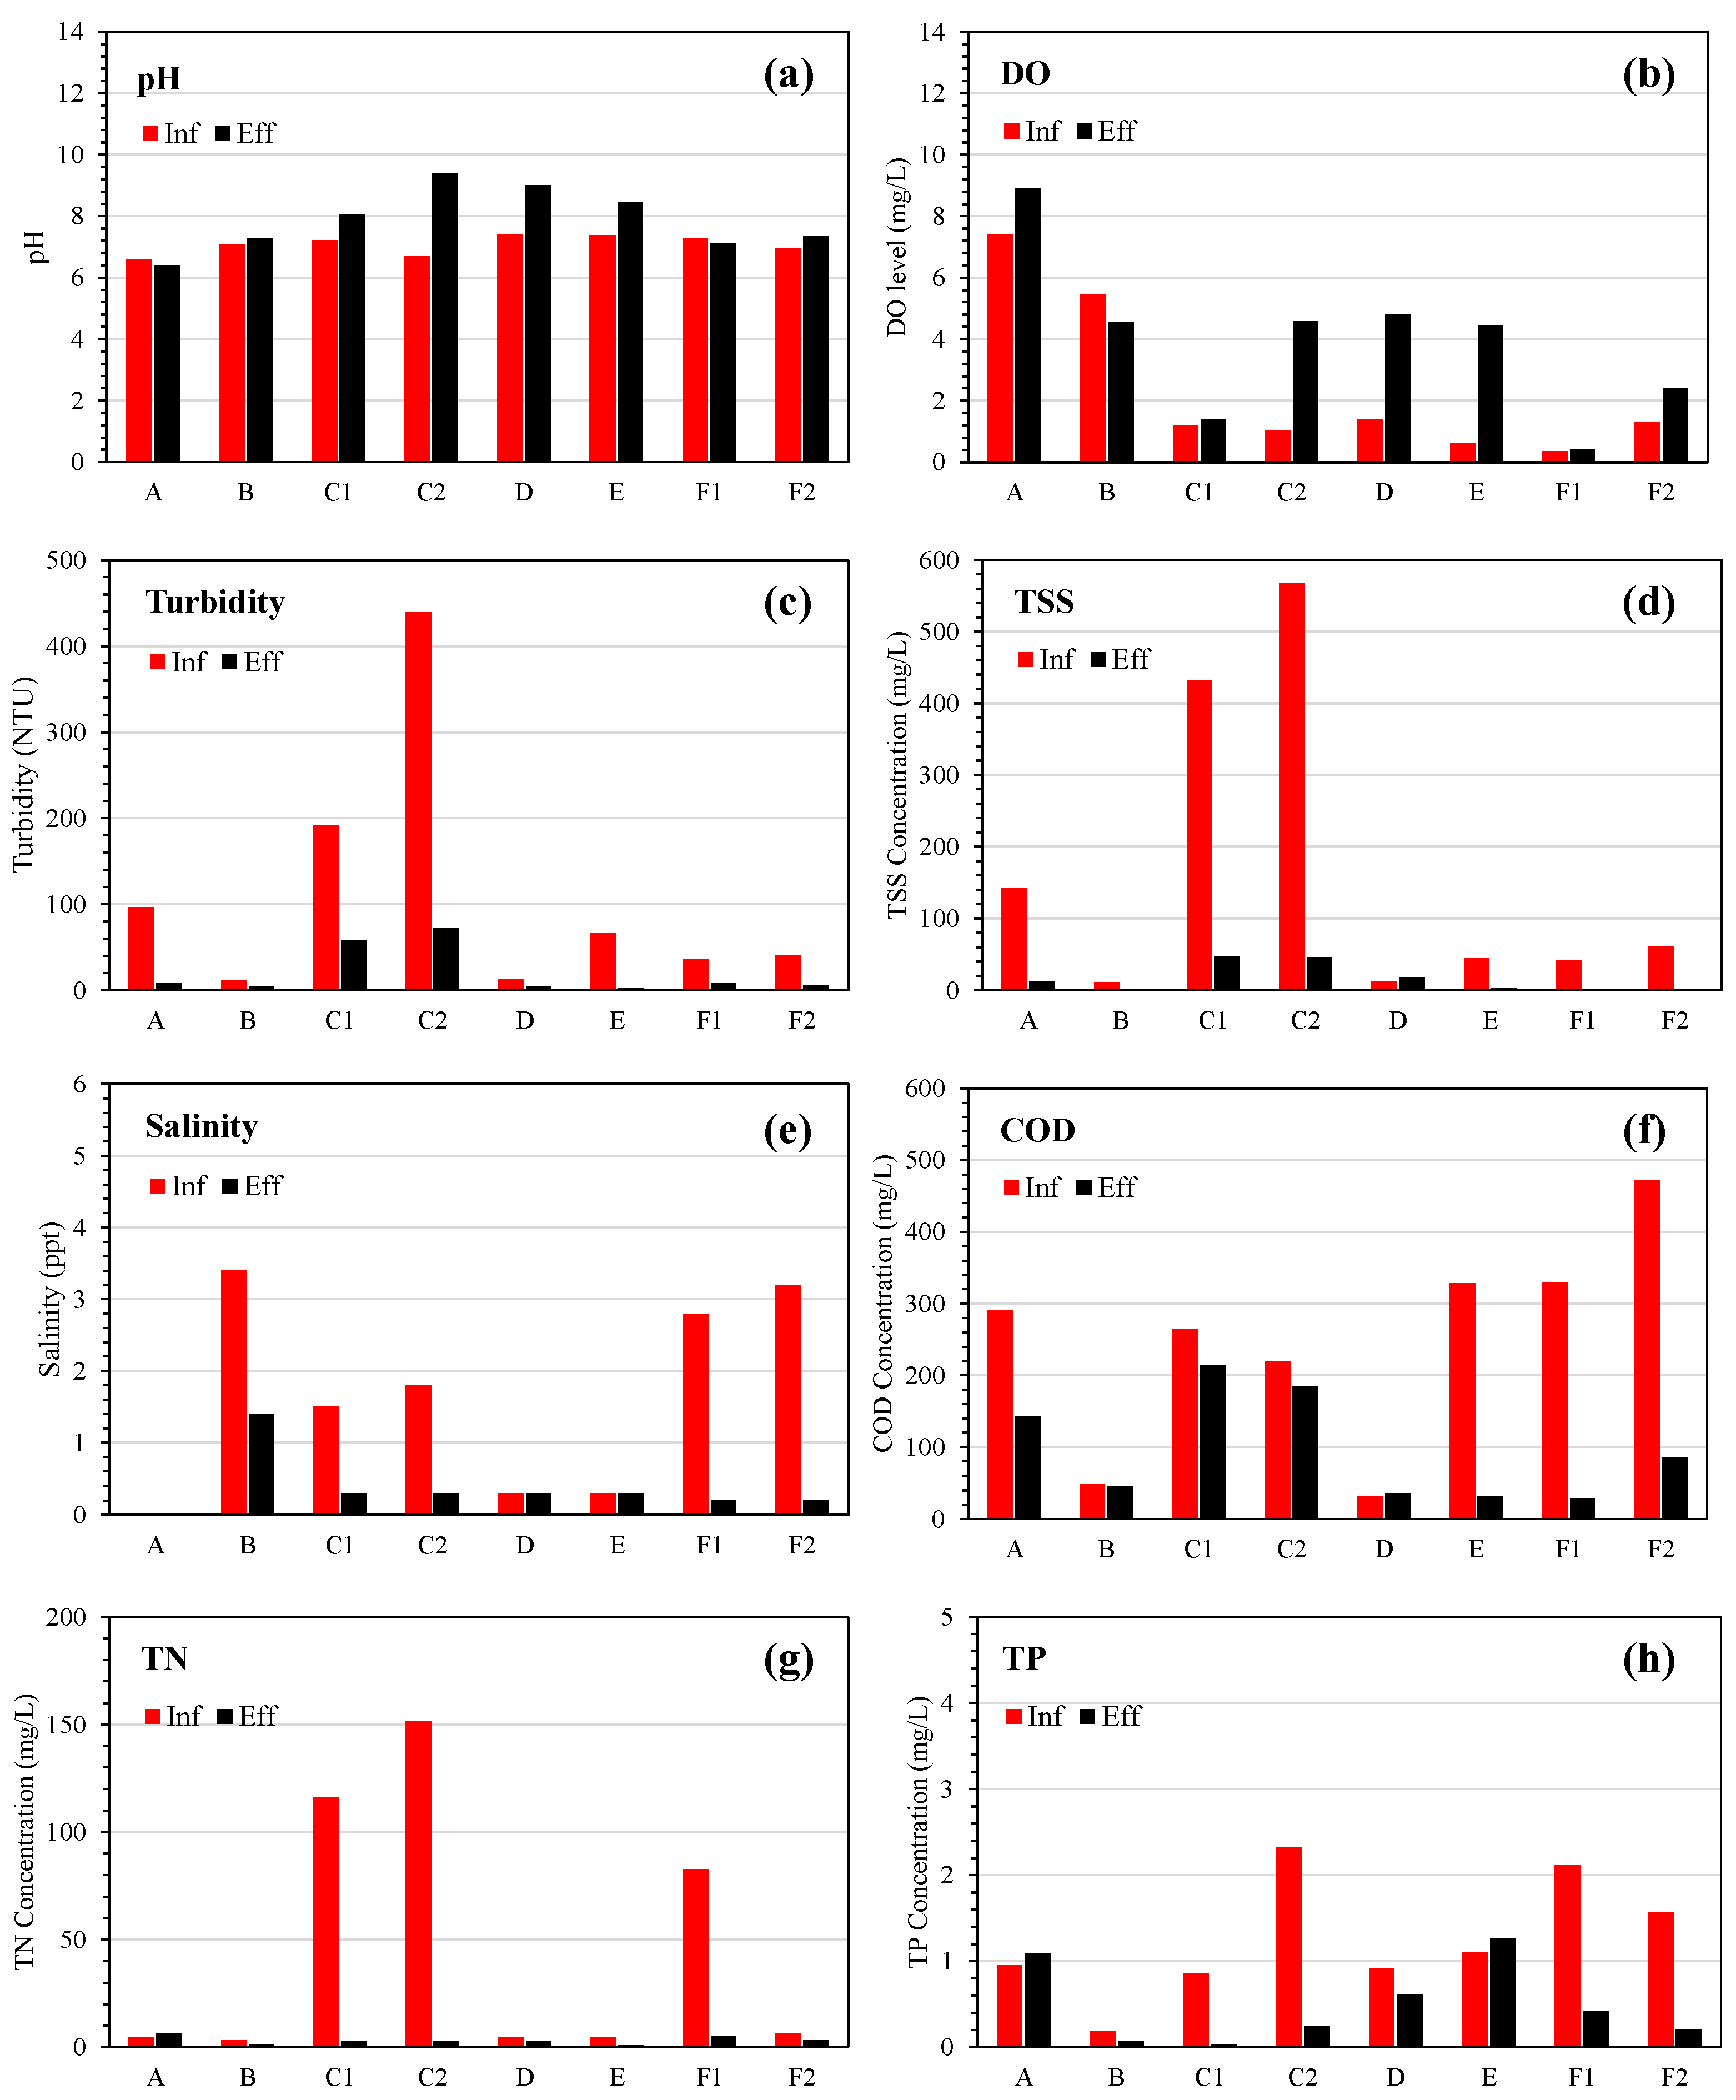
The treatment performance of the six WWTPs was evaluated using conventional physicochemical indicators to provide a foundation for subsequent analyses (Figure 2). Effluent pH values were consistently within the neutral to slightly alkaline range (6.5–9.0) across all systems, indicating favorable conditions for biological treatment processes (Figure 2a) [30,31]. Dissolved oxygen concentrations increased markedly after treatment in most plants, with the oxidation ditch system (site A) exhibiting the highest effluent DO (>8 mg L−1) (Figure 2b). These observations highlight the role of aeration efficiency and oxygen transfer in sustaining biological activity and overall treatment performance [30].
Substantial reductions in turbidity and TSS were observed across most treatment systems (Figure 2c,d). The TSS concentration in influents and effluents was varied, in the range of 10.9–568.3 and <0.2–48.0 mg L−1. It was noticed that effluent TSS concentrations from the SPs (sites C1 and C2) consistently exceeded the Thai discharge limit of 30 mg L−1, whereas the RO-based system (site F) achieved markedly lower levels (<0.2 mg L−1). These contrasting results underscore the differing removal efficiencies between sedimentation and filtration-based processes. The limited amount of suspended solids removed in pond systems is likely attributed to high nutrient concentration, which promotes algal proliferation, while the membrane-based process enables near complete solid–liquid separation.
Salinity varied considerably among the investigated sites (Figure 2e). Elevated influent salinity was observed at several WWTPs, except for site A, where data were unavailable. Meanwhile, sites D and E were not contaminated with saline because the salinity level was unchanged. The contaminated salinity levels both inland and on the island were between 1.5 and 3.4 ppt. Only the RO-based plant (site F) achieved a substantial reduction in effluent salinity, while the other biological systems showed a reduction trend due to large pond volume dilution, particularly site C. The spatial variability in salinity can be attributed to multiple local factors, including seawater use for toilet flushing and equipment cleaning during the dry season [32], as well as tidal intrusion into upstream rivers under low-flow conditions [33]. In inland areas, the combined sewer network likely facilitates saline inputs from domestic and groundwater sources to the treatment facilities. Although conventional biological processes efficiently remove organic matter and suspended solids [30,34], they are inherently limited in their salt removal capabilities due to the absence of ion-exchange or membrane-based separation mechanisms.
The removal efficiency of sCOD varied considerably among the six WWTPs (Figure 2f). The aerated treatment system (site E) and the RO-based system (site F) consistently achieved the low effluent COD concentrations (<100 mg L−1), reflecting superior overall treatment performance. In contrast, the SPs (sites B, C1, and C2) and the AL (site D) exhibited unstable and generally poor COD reduction. The OD plant (site A) also showed relatively low efficiency. The observed variation in COD reduction across systems can possibly be attributed to differences in treatment configuration, aeration efficiency, and susceptibility to salinity stress. The RO-based system (site F) achieved the greatest COD removal, consistent with its capability to retain dissolved and colloidal organics through membrane filtration [34]. Conversely, aerated configurations maintained higher oxygen transfer rates and microbial activity, supporting enhanced organic matter degradation [35]. Furthermore, elevated salt concentrations are known to inhibit microbial metabolism and floc formation, thereby diminishing the effectiveness of biological oxidation [36]. This mechanism likely contributed to the limited COD removal observed in the pond systems (sites B, C1, and C2).
Figure 2. Influent (red) and effluent (black) concentrations of physicochemical parameters in WWTPs of the EEC: (a) pH, (b) DO, (c) turbidity, (d) TSS, (e) salinity, (f) COD, (g) TN, and (h) TP. Note: Each bar represents an individual measurement rather than an averaged value. Sites C and F were sampled twice (C1–C2 and F1–F2) to represent dry and wet season conditions.
Water 17 03330 g002
Nutrient removal performance varied considerably among the six WWTPs (Figure 2g,h). TN concentrations in influent were more varied between 3.3 and 151.7 mg L−1, with the highest TN level in C1 and C2. On the other hand, at site F1, samples collected during April, corresponding to the peak tourism season, also exhibited elevated TN levels. However, TN concentrations in effluents showed high removal efficiency below the national discharge level of 20 mg L−1. TP concentrations ranged from 0.2 to 2.3 mg L−1 across systems, with several WWTPs maintaining effluent TP below the national discharge limit of 2 mg L−1. Variations in nutrient removal are largely attributable to differences in influent composition, biological activity, and process configuration. The high TN concentrations at sites C1 and C2 likely reflect nutrient enrichment from agricultural runoff and domestic wastewater from surrounding communities, while the seasonal increase at site F1 may be associated with tourism-related inputs such as toilet flushing and cleaning activities.
These findings emphasize that actual treatment efficiency is predominantly governed by process design and influent variability. In particular, salinity in some inland systems appeared to limit COD removal, underscoring the sensitivity of biological processes to dissolved salts. The superior performance of the RO-based system further illustrates the potential of advanced membrane technologies to achieve comprehensive contaminant removal.

3.2. Profiles and Size Distributions of MPs in Influent

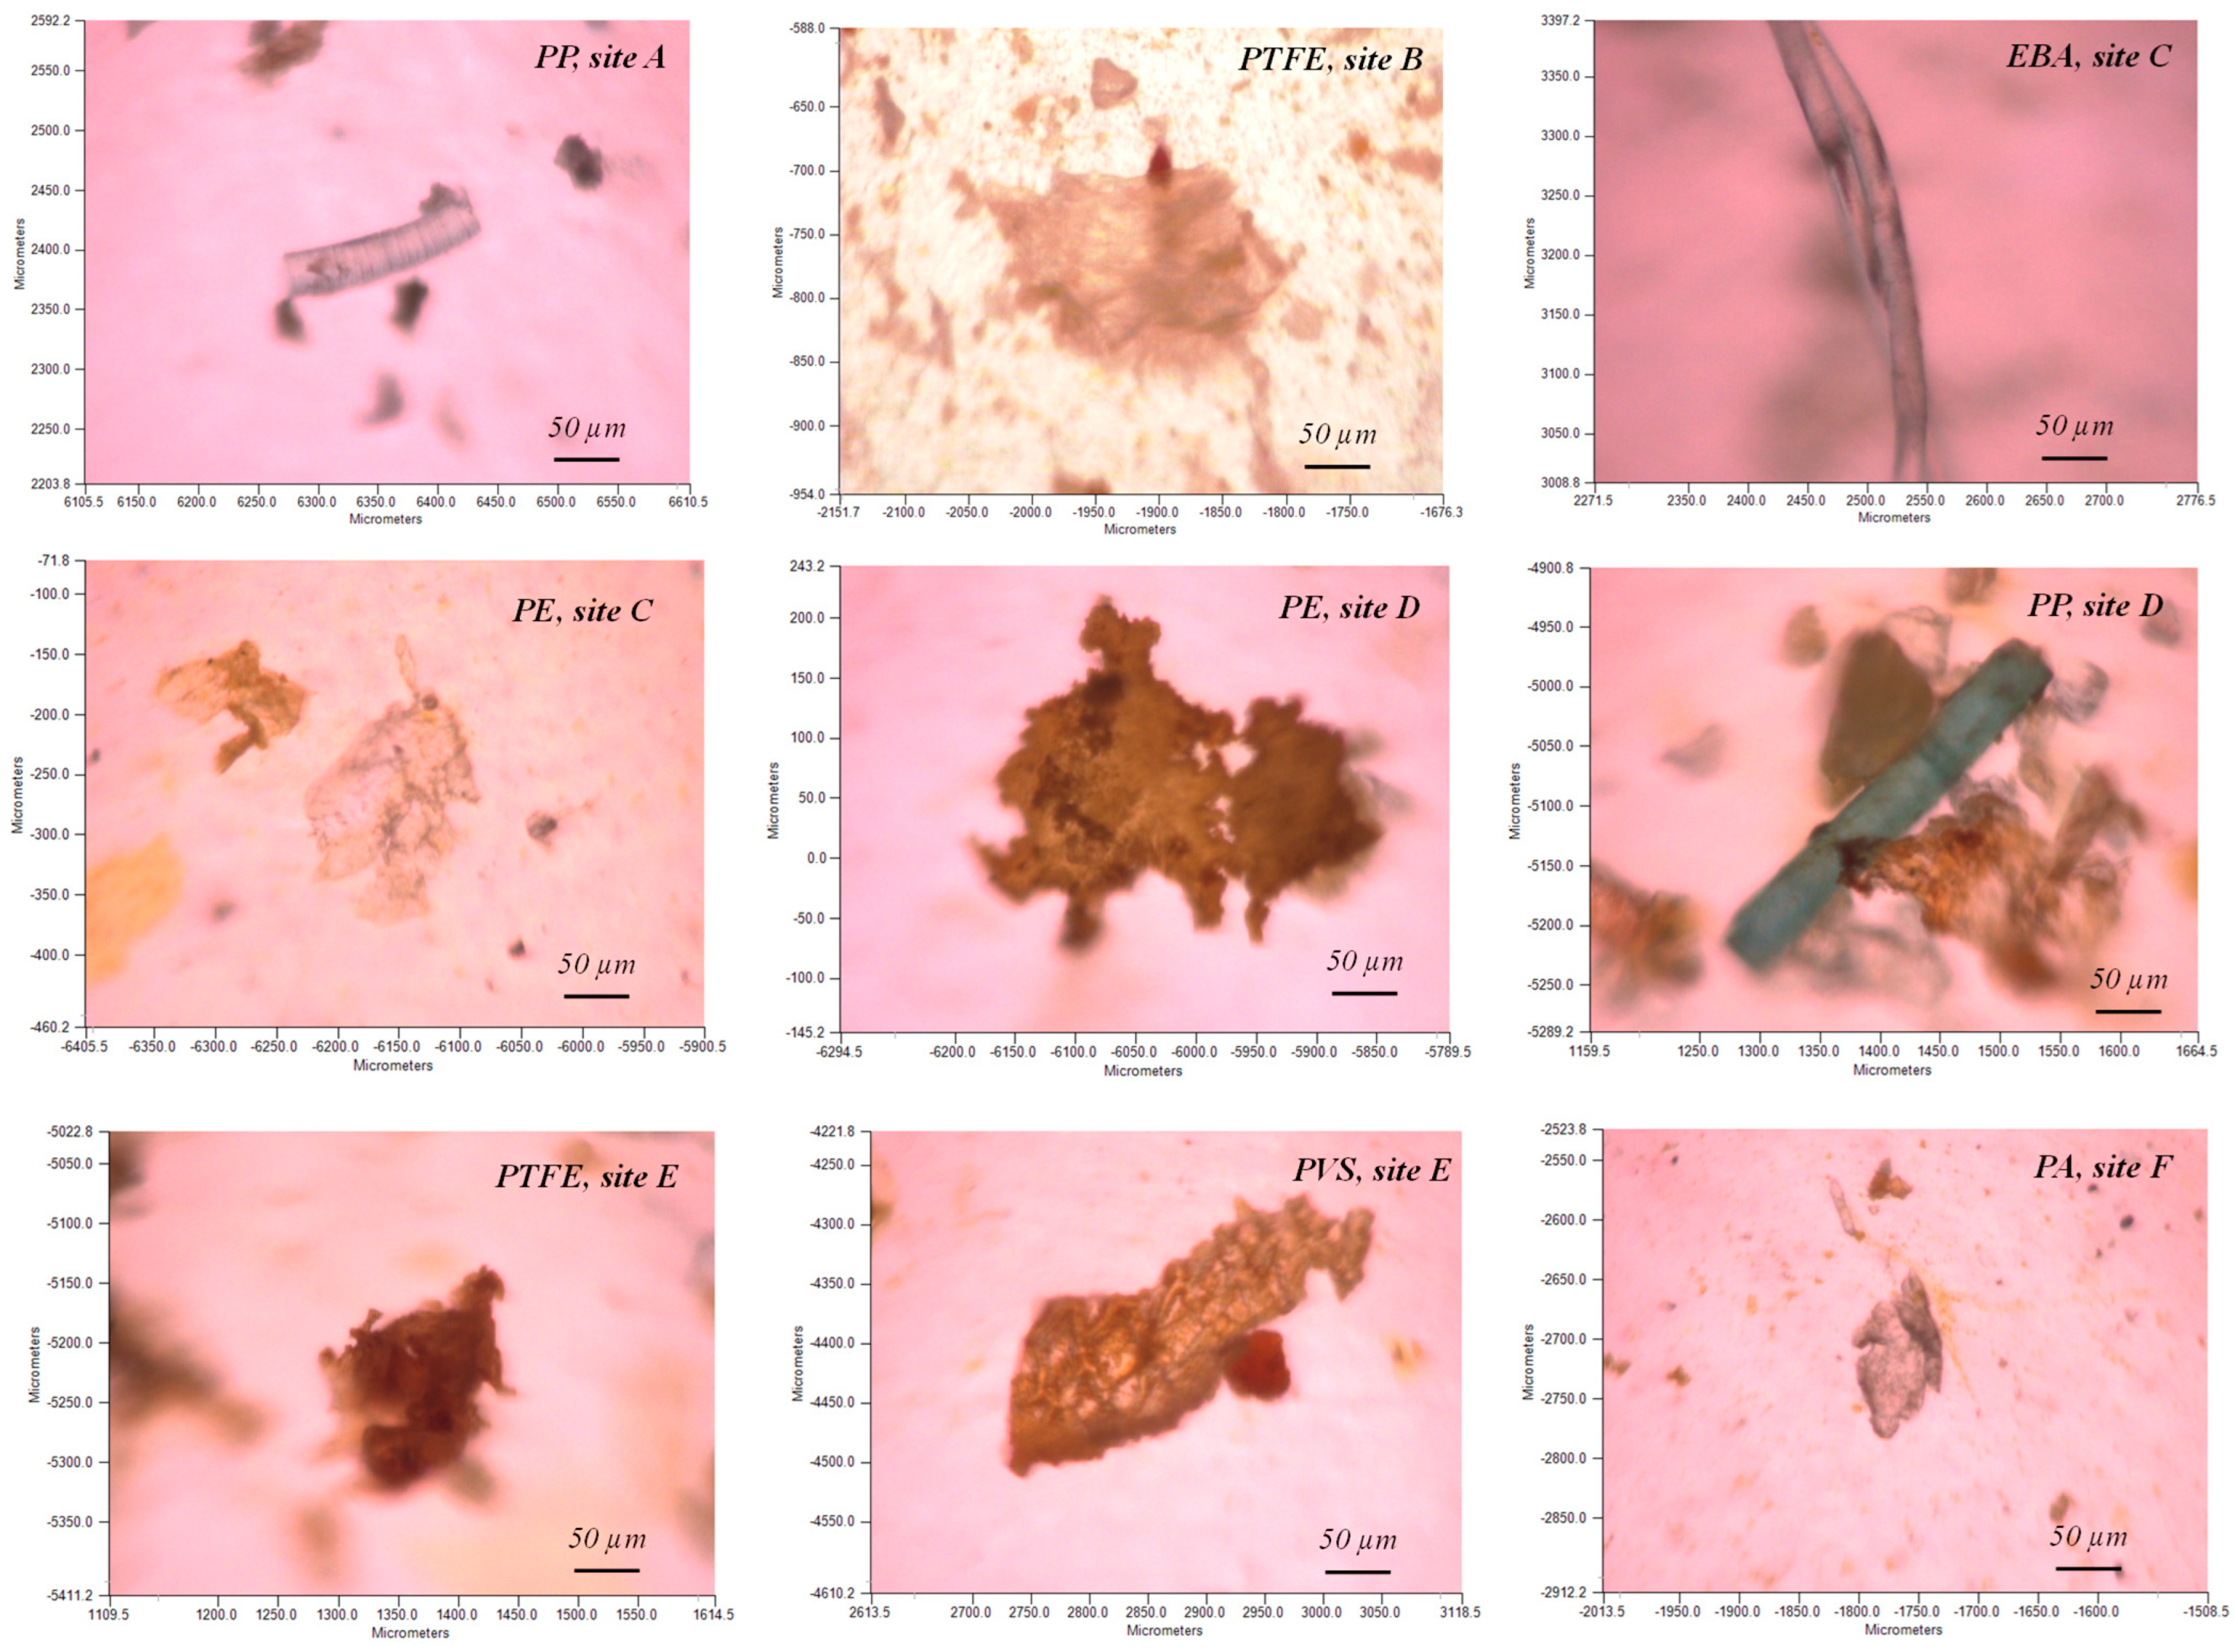
Figure 3 illustrates the site-specific polymeric composition of influent MPs across six WWTPs. Polyethylene (PE) and polypropylene (PP) together accounted for 57–92% of the total abundance, while other polymers such as polyvinyl stearate (PVS), polyamide (PA), and ethylene–butyl acrylate (EBA) were present in smaller proportions. PE contributed 25–60% of the total MPs, while PP ranged from 24 to 53%. Among the island WWTPs, sites F1 and F2—which receive wastewater from large tourist populations (~5 million visitors per year; Table S1)—showed PE proportions exceeding 50% (54–60%). Site E, which serves a smaller tourist base (~1.5 million visitors per year), exhibited lower PE contributions (~25%). An inland facility (site D), which also receives tourism-related inflows, showed a PP-dominated profile (PP ~53%, PE ~39%, others ~8%). Representative microscopic images and the corresponding FTIR spectra of selected polymers are shown in Figure 4, Figures S2 and S3.
The predominance of PE and PP reflects their widespread use in packaging, single-use plastics, and personal care products, consistent with global WWTP studies identifying these polymers as the most abundant in influent wastewater [5,12]. The higher PE fraction in island systems possibly indicates a stronger influence from tourism-driven activities, where residues from single-use items and personal care products substantially contribute to plastic loads [37,38,39]. In contrast, inland systems exhibited higher PP shares due to mixed municipal and industrial inputs and the prevalence of PP in rigid packaging materials [38,40]. Minor polymers, including PVS, PA, PTFE, and EBA, reveal additional, source-specific pathways of MP entry into wastewater. PVS, commonly used in coatings, adhesives, and as a film-forming agent in sunscreens, suggests contributions from household and cosmetic products. Recent evidence also indicates increasing PVS prevalence in marine biota from 43% in 2012 to 57% in 2022 in seahorse gastrointestinal tracts from the southeastern Black Sea [41], highlighting its growing environmental relevance. Its detection in both inland and island influents underscores the need to consider non-traditional MP sources beyond packaging and textiles. PA likely originated from synthetic textile fibers, while EBA is used in adhesives and flexible household products [42]. In addition, PTFE is widely used in chemical-resistant materials such as nonstick home cookware, high-temperature wire and cable insulation, and waterproof fabrics [43]. Although less abundant, these polymers collectively illustrate the diverse and multifaceted sources contributing to microplastic contamination in WWTP influents [11,44].
In theory, although saturated NaCl (density ~1.2 g cm−3) used for MP extraction could not float high-density polymers (PET; 1.38–140 g cm−3, PVC; 1.16–1.45 g cm−3, PTFE; 2.1–2.3 g cm−3), some previous studies have observed PET, PVC, and PTFE by using saturated NaCl [11,24] due to the fact that MPs may gradually degrade for a long time, resulting in the loss of some of the physicochemical properties of the plastics. On the other hand, not only can their density properties be used to separate plastic types, but also some factors such as capillary force, lyophobicity, and the surface tension of water may influence the capability of MPs to float [45].
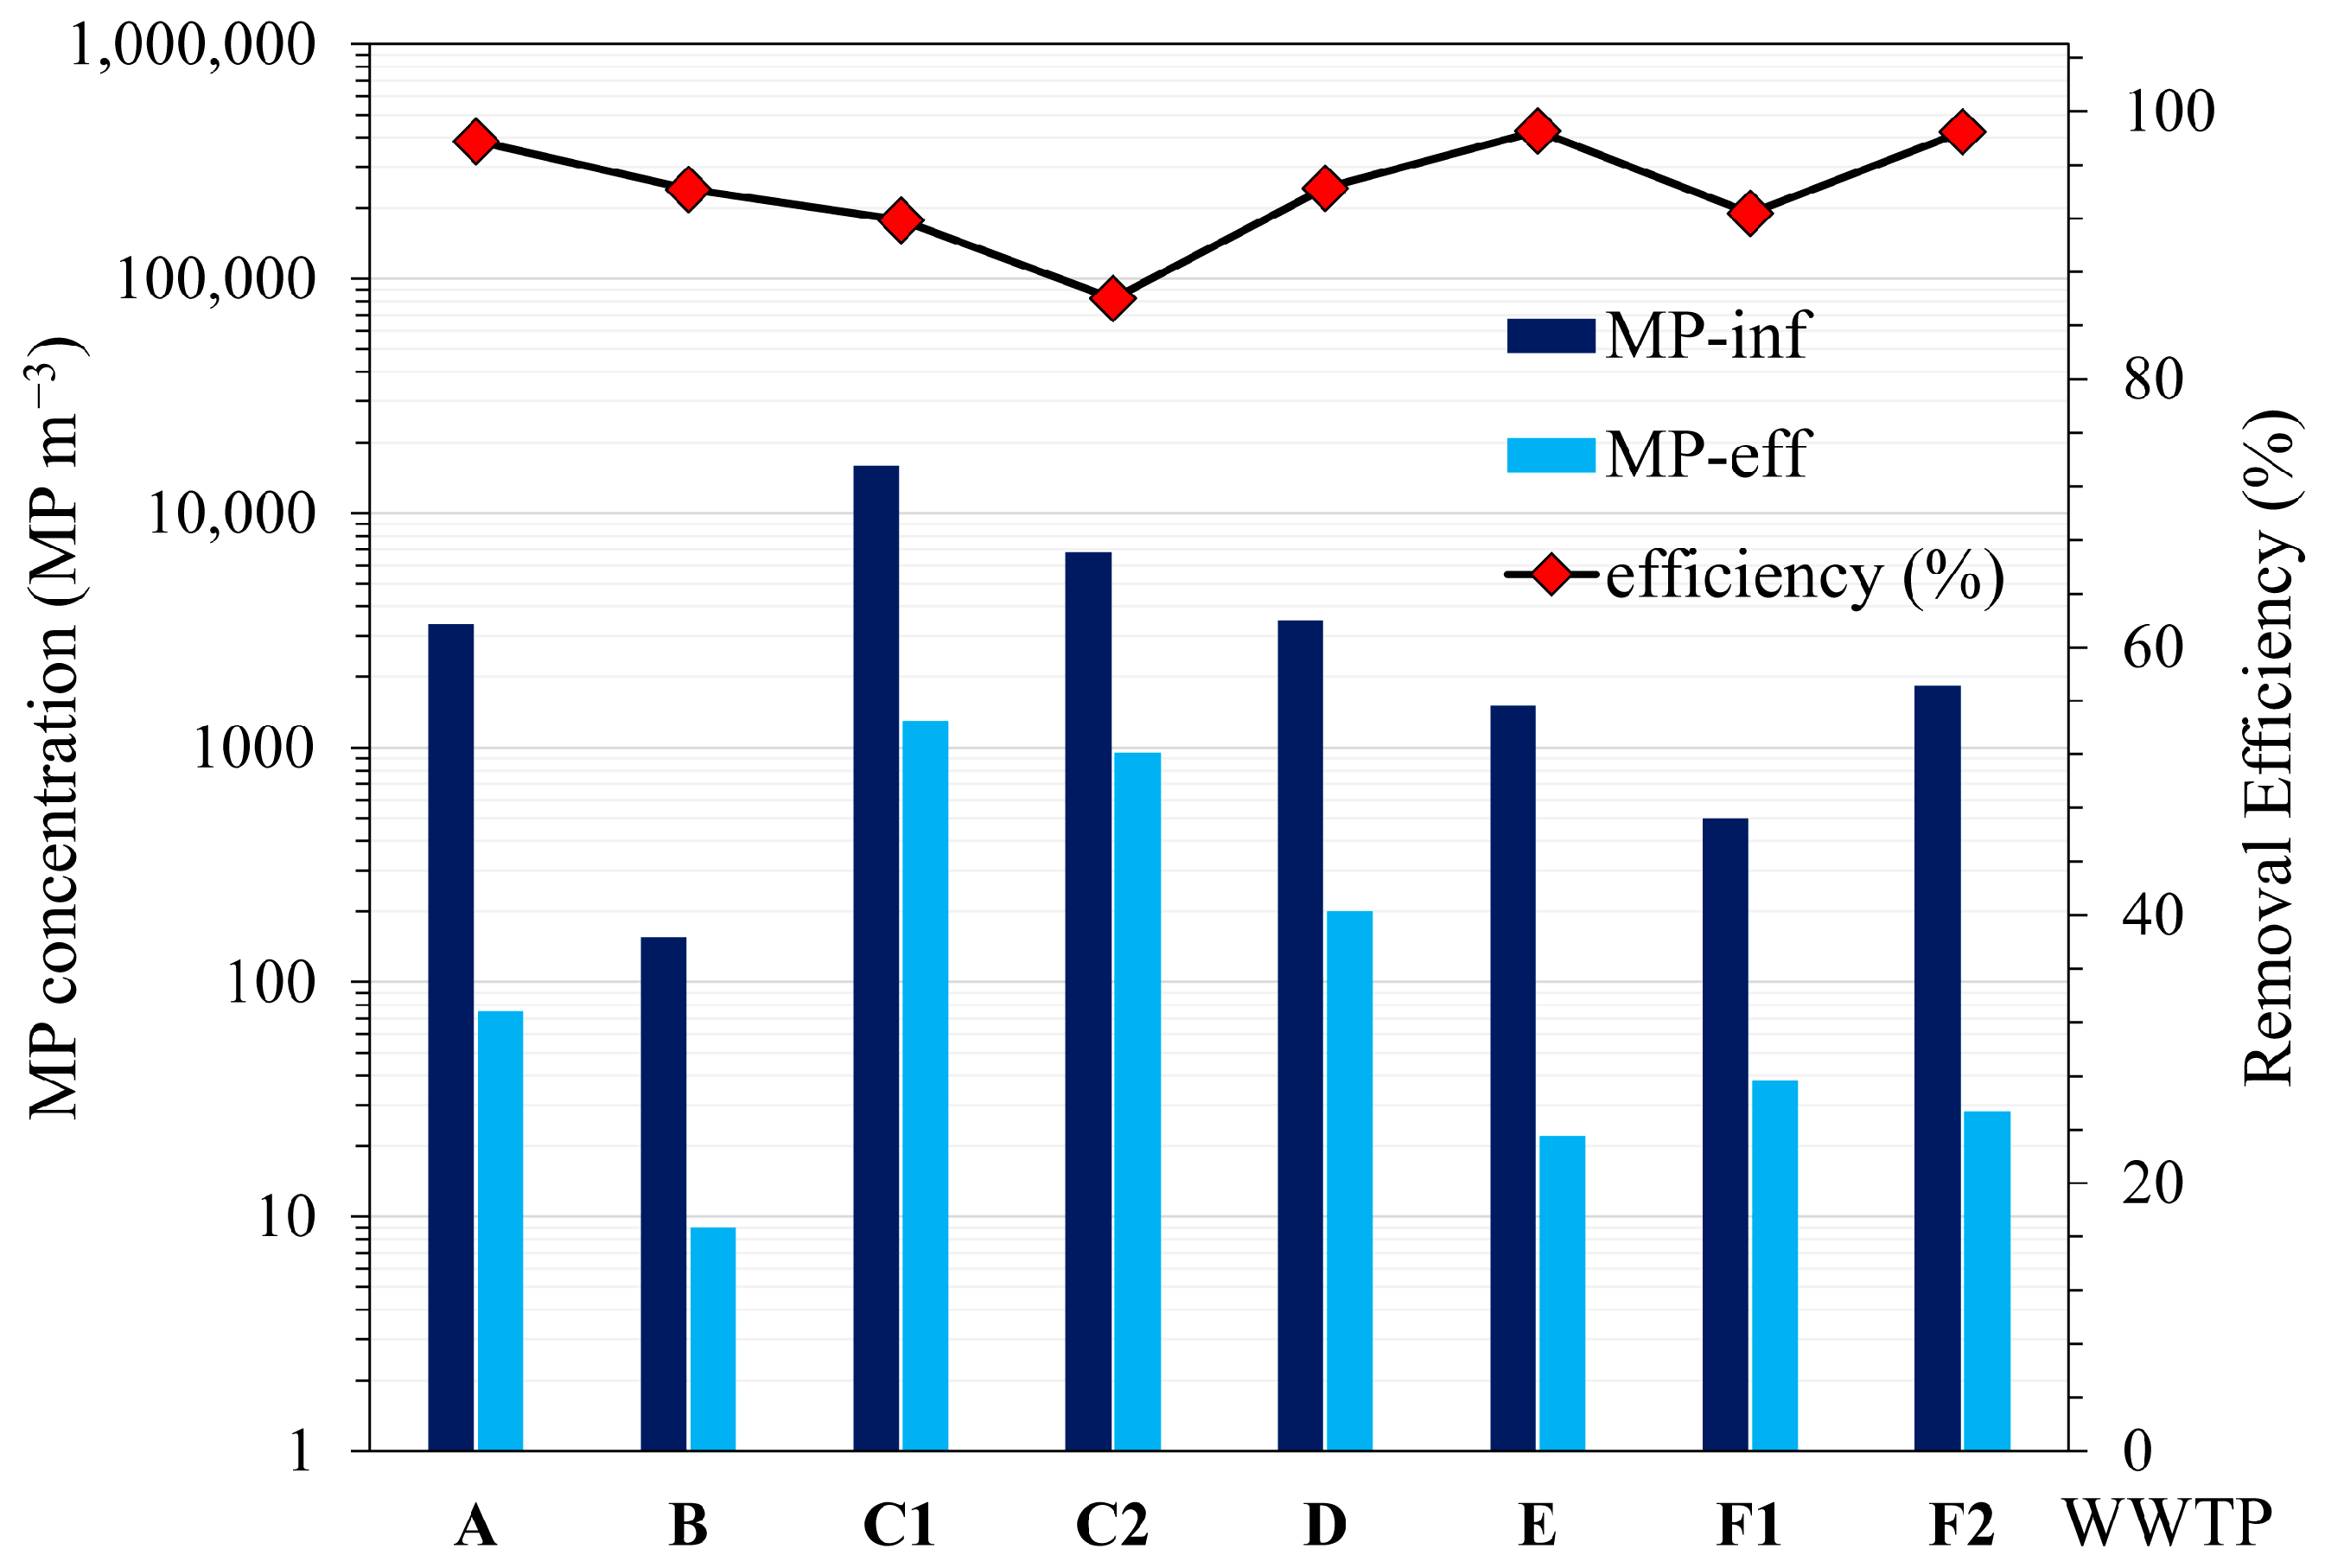
In addition to polymer type, the size distribution analysis revealed that fine MPs (<300–100 μm) overwhelmingly dominated the influent streams at all sites, accounting for more than two-thirds of the total abundance (Figure S1). The highest MP concentrations were recorded in SP influents, with sites C1 and C2 reaching 16,000 and 6800 MP m−3, respectively, followed by sites A (3360 MP m−3) and D (3500 MP m−3). In contrast, sites B, E, F1, and F2 exhibited substantially lower abundances (<2000 MP m−3) (Figure 5). Larger MPs (>1 mm) were detected at all sites but represented only a minor fraction of the total. The predominance of fine MPs (<300 μm) was consistent across all WWTP influents. This pattern aligns with reports from other tropical regions, where small-sized MPs are recognized as the dominant fraction entering wastewater systems and coastal areas [5].

3.3. MP Removal Efficiency of WWTPs

Comparative evaluation showed that all WWTPs substantially reduced MP loads, achieving overall removal efficiencies of between 86.0% and 98.5%. The MP concentrations in influent and effluent streams in a log scale are shown in Figure 5. Among the inland systems, the OD plant at site A exhibited the highest efficiency (97.8%), whereas the SP at site C recorded the lowest (86.0%). Other inland facilities, including the AL (site D) and the peri-urban SP (site B), also demonstrated high removals (>94%), reflecting the combined influence of sedimentation and biological treatment. Island-based systems located in tourism-intensive areas also performed effectively. The AT system (site E) maintained removal efficiencies exceeding 98%, while the advanced RO-based systems (sites F1–F2) achieved near-complete elimination of MPs due to the effectiveness of membrane filtration as a physical barrier for fine particles.
These findings emphasize the dominant role of treatment configuration and operational intensity in governing MP removal performance. Comparative interpretation with previously reported systems (Table 1) further supports these observations. In Thailand, the SP, representing a low-energy natural process, achieved variable removal efficiencies ranging from 75 to 100%, primarily governed by sedimentation [46]. The MP composition observed in this system was comparable to that found in the present study, with PE and PP being the dominant polymers. However, algal blooms occurring at Site C likely enhanced MP aggregation and resuspension downstream. This phenomenon aligns with the findings of Chukwuka et al. (2025) [47], who reported that seasonal nutrient runoff and agricultural practices could trigger algal blooms that intensify MP dispersion in aquatic environments.
On the other hand, the main mechanism of MP removal in aeration-based systems such as the OD, AL, and AT (Sites A, D, and E) can be attributed to the aeration process, which promotes the transfer of MPs from the water column to the sludge phase. Similar trends were reported for WWTPs operating with sequencing batch reactor (SBR), OD, and conventional activated-sludge (CAS) configurations, where aeration tanks served as the key removal units, facilitating MP capture and deposition within the sludge [16,48,49].
Furthermore, advanced membrane-based processes demonstrated superior performance. The RO-based system at Site F achieved nearly complete MP elimination, consistent with results from Australia, where MP concentrations decreased from 1.5 MP L−1 after primary sedimentation to 0.48 MP L−1 after activated sludge and 0.21 MP L−1 following tertiary RO polishing [51]. Comparable outcomes were also reported for membrane bioreactor (MBR) systems in Finland, which employ microfiltration for efficient solid–liquid separation [50], as well as for secondary activated sludge systems combined with sand filtration or AnMBR configurations in North America, achieving 95–99% removal [52].
These comparisons reveal a consistent technological gradient in MP removal; low-energy natural systems (SP) rely mainly on sedimentation, moderate-efficiency biological systems (AL, OD, CAS, SBR) enhance MP aggregation through biofloc formation, and advanced membrane-based configurations (MBR, RO) achieve near-complete retention. The agreement between this study and global datasets highlights the universal influence of process configuration and operational intensity on the fate of MPs in treated effluents.

3.4. Correlation Between Water Quality Parameters and Microplastic Abundance
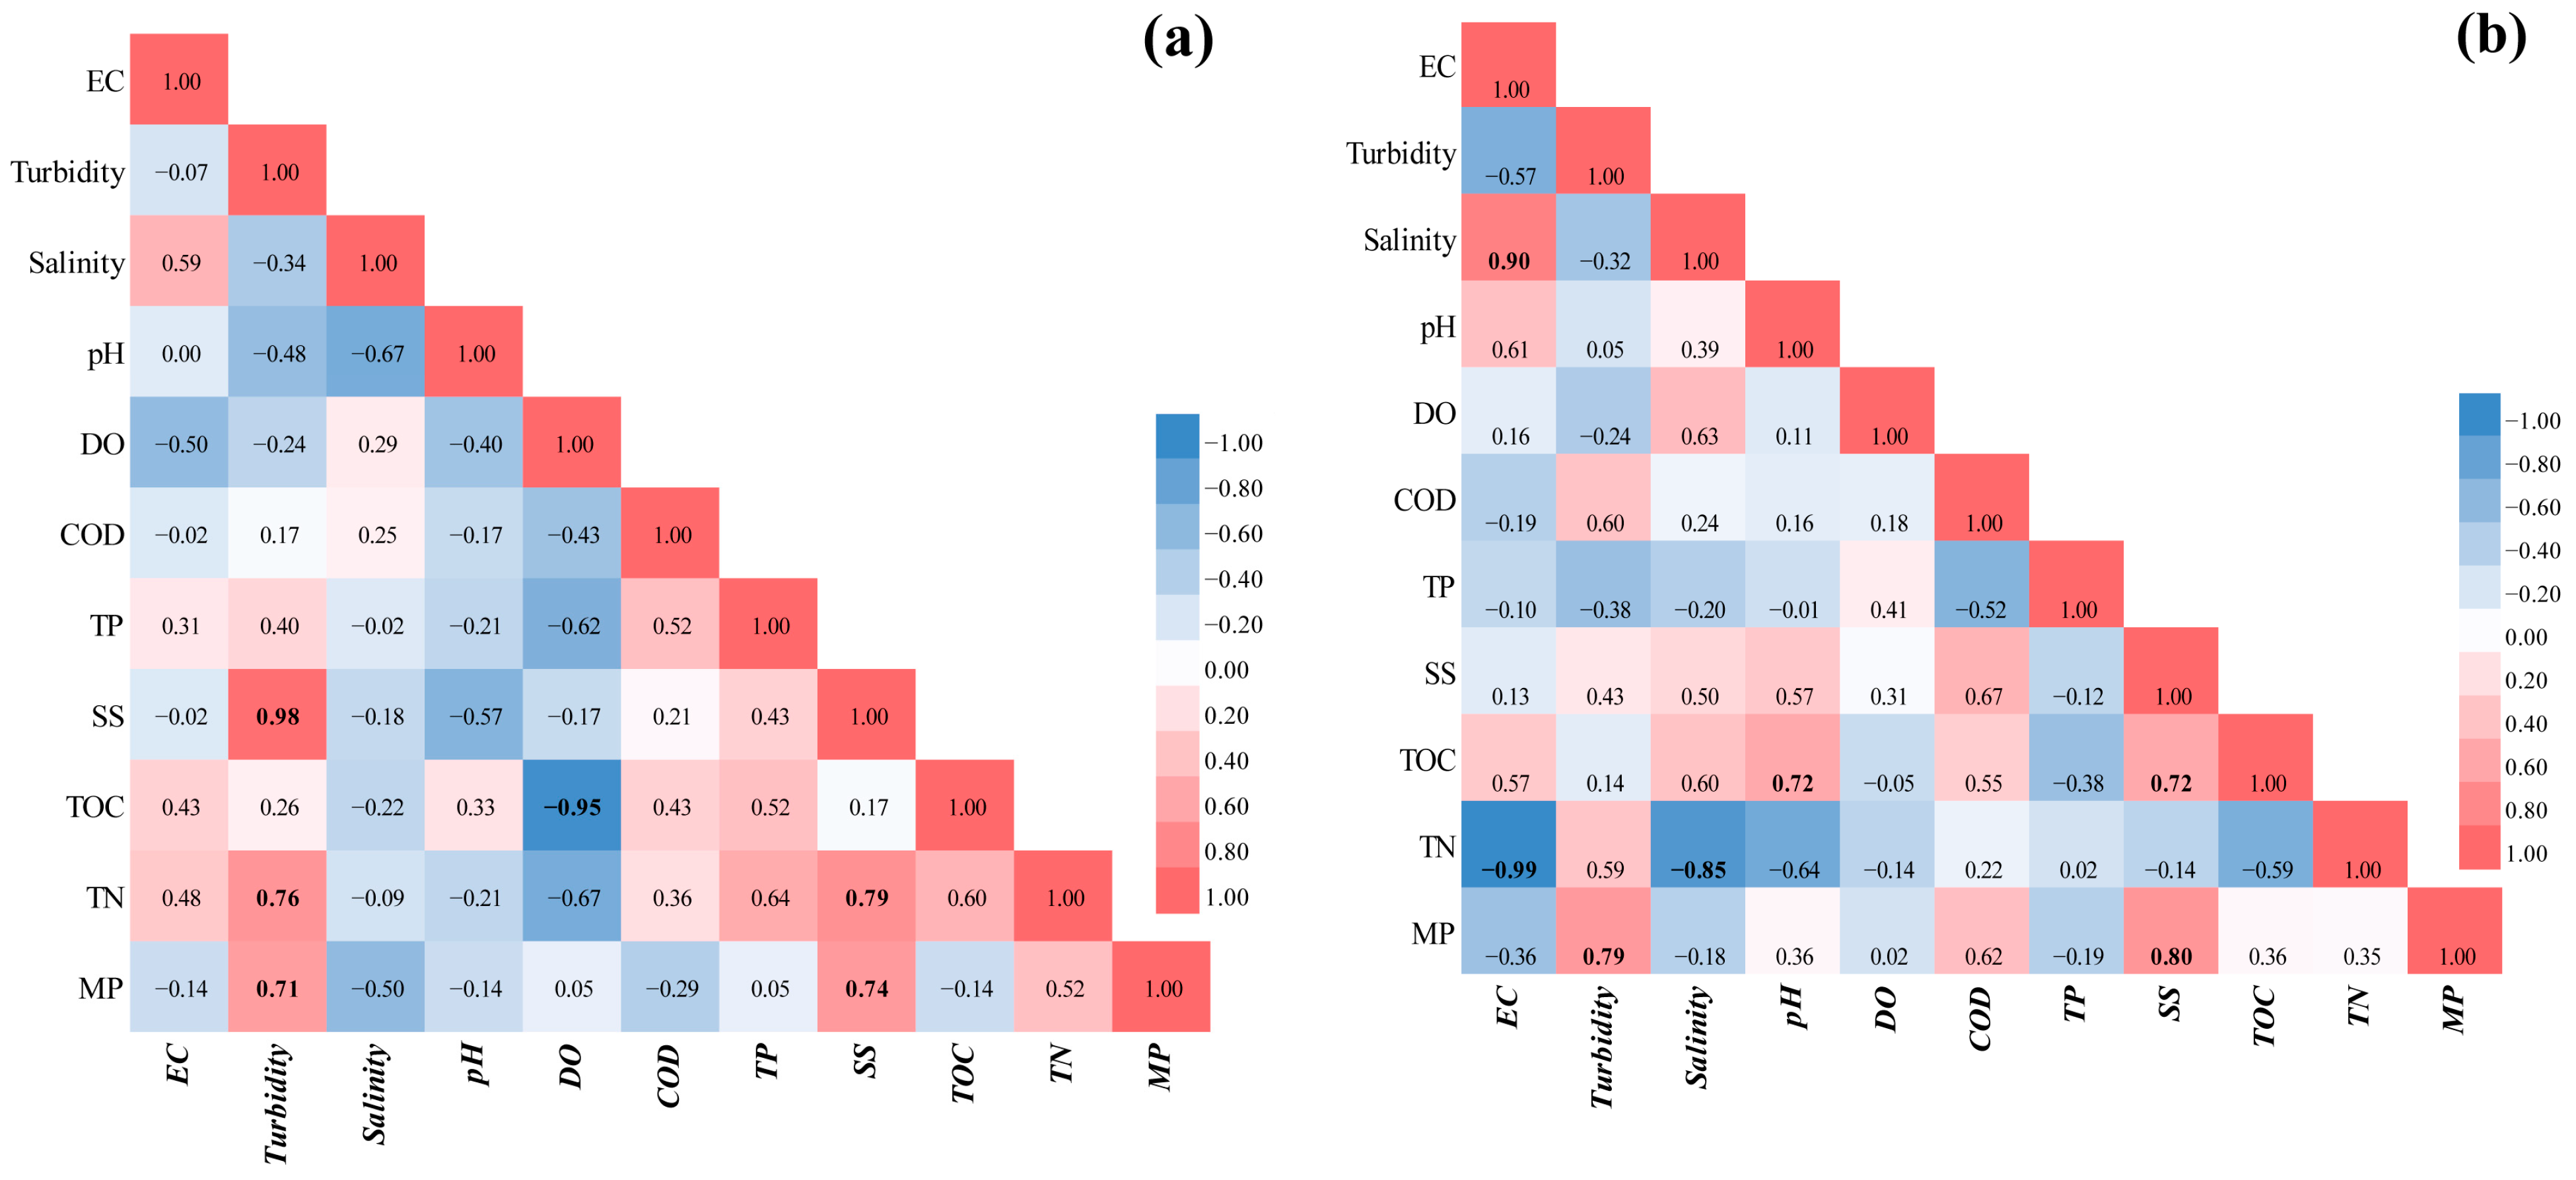
Spearman’s rank correlation analysis was conducted separately for influent and effluent samples to elucidate the relationships between MP concentrations and conventional water-quality parameters (Figure 6). In influent samples (Figure 6a), MPs showed strong positive correlations with turbidity (ρ = 0.71) and TSS (ρ = 0.74), indicating that MPs primarily coexist with suspended particulates and solid-bound materials entering wastewater systems. A moderate positive correlation was also observed with TN (ρ = 0.52). In effluent samples (Figure 6b), MPs remained positively correlated with TSS (ρ = 0.80) and turbidity (ρ = 0.79), while a moderate association was also found with COD (ρ = 0.62). These relationships demonstrate that particulate- and organic-related parameters strongly influence MP abundance throughout the treatment process.
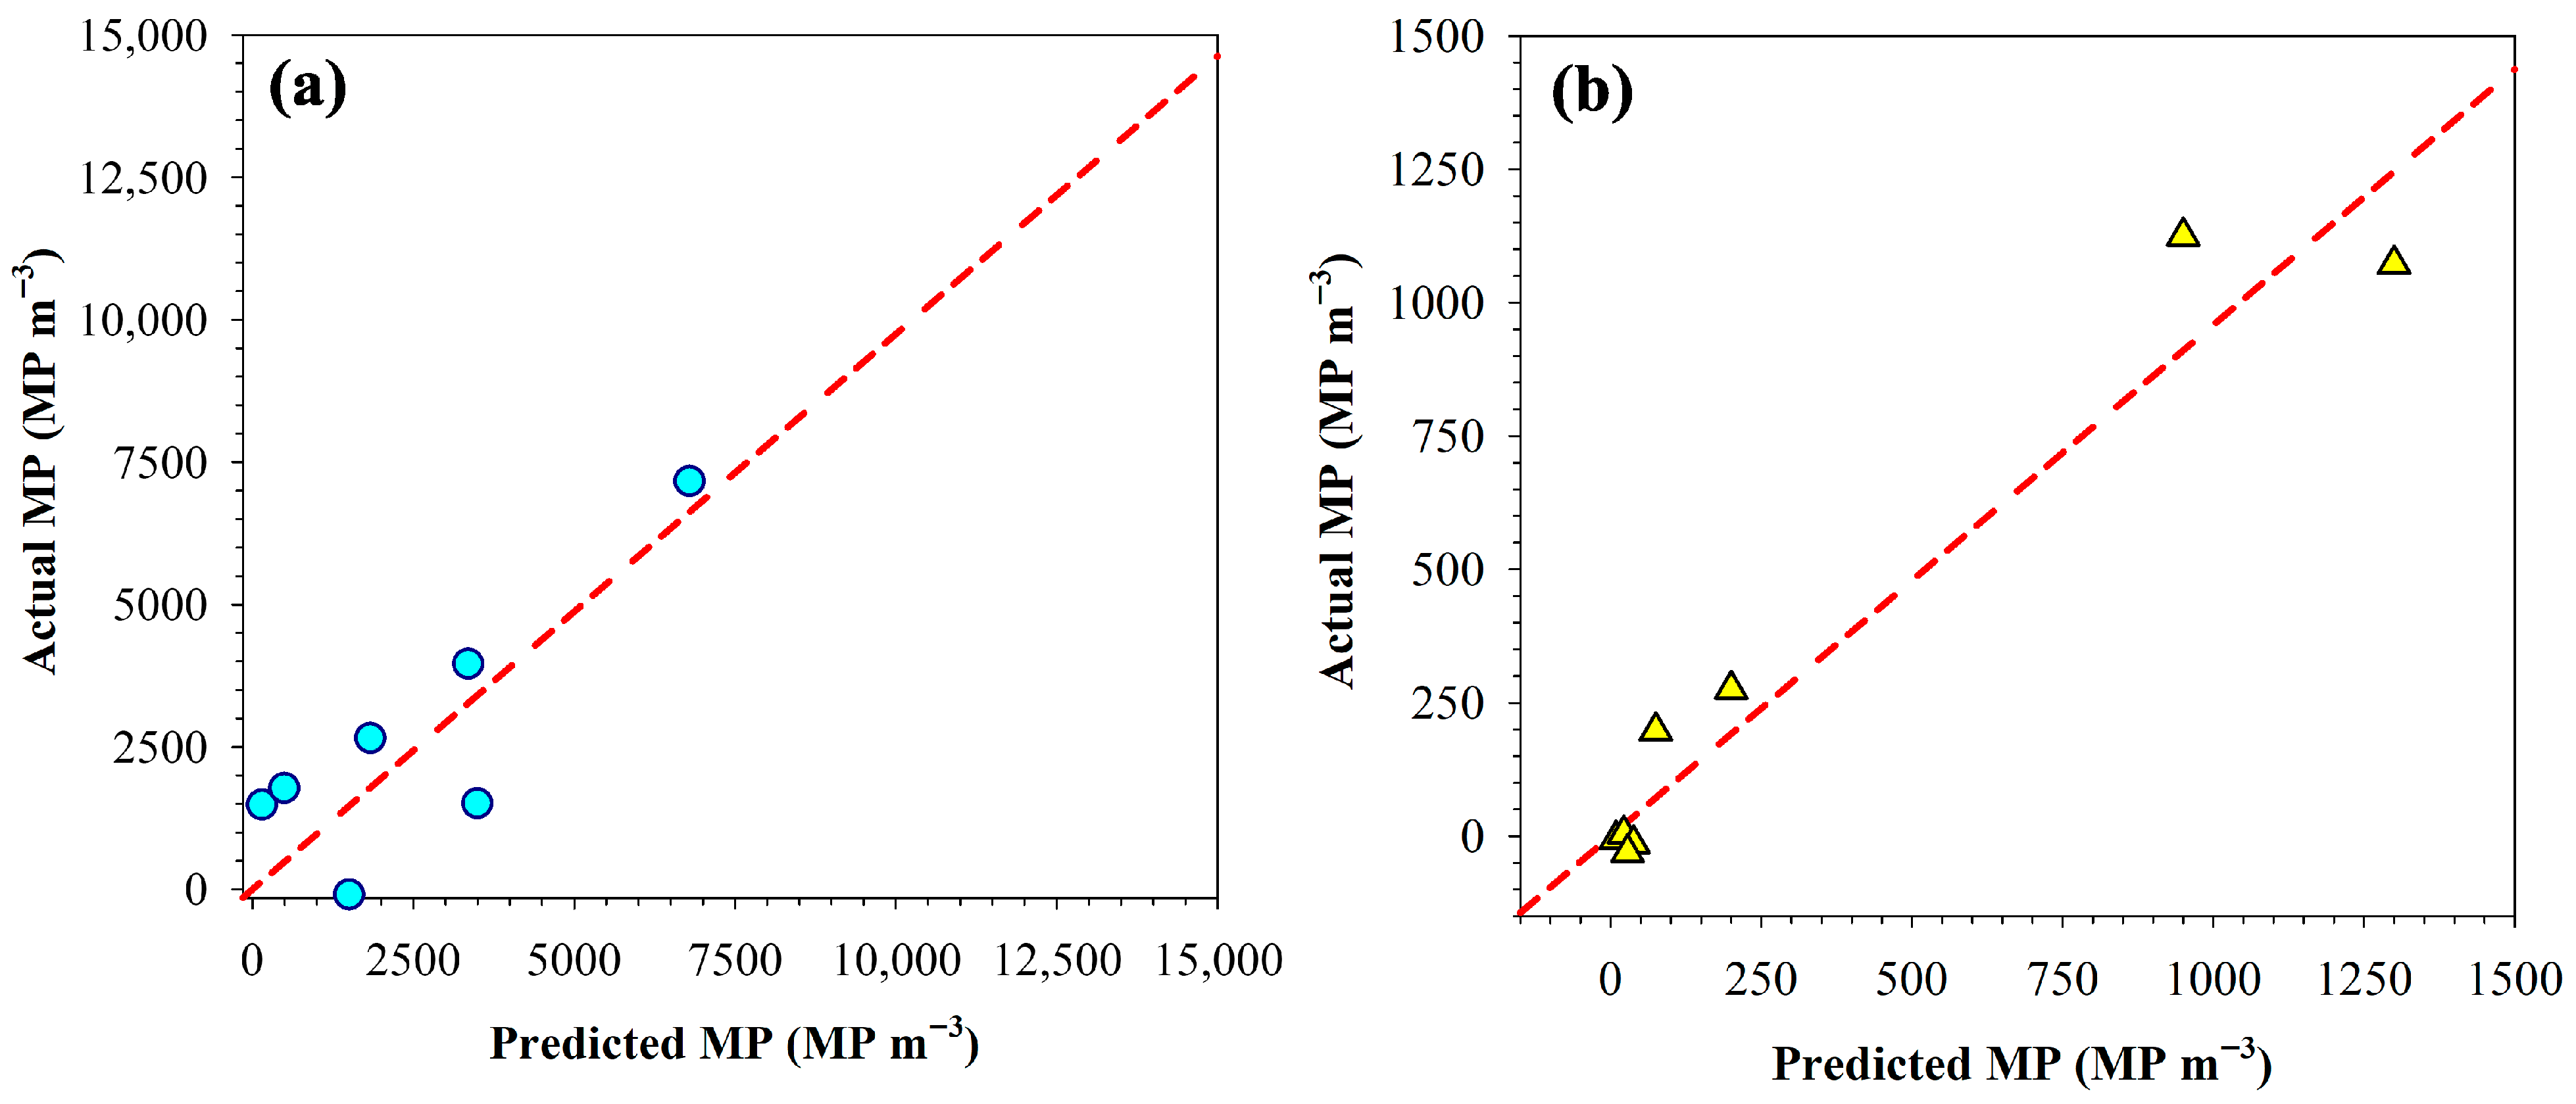
Based on these relationships, MLR models were developed to predict MP concentrations using key physicochemical parameters (Table 2). Separate models were constructed for influent and effluent samples to capture the contrasting dynamics of MPs before and after treatment. For influent samples, TSS alone exhibited a statistically significant correlation with MP concentrations (p = 0.028; adjusted R2 = 0.513), while turbidity alone explained less variance (p = 0.167; adjusted R2 = 0.174). When both variables were combined, explanatory power improved markedly (adjusted R2 = 0.918), suggesting complementary predictive effects between particulate and optical indicators. For effluent samples, the predictive performance was even higher; TSS alone accounted for 0.914 of MP variability (p < 0.05), while turbidity alone explained 0.857 (p < 0.05). The combined model (TSS and Turbidity) maintained a similarly strong fit (adjusted R2 = 0.914%), confirming that these two parameters are reliable and complementary predictors of residual MPs after treatment. The consistency between observed and predicted MP concentrations, as illustrated in Figure 7, further validates the robustness of the MLR models.
Figure 7. Comparison between observed and predicted MP concentrations obtained from MLR models for (a) influent and (b) effluent samples. Blue dots represent influent data, and yellow triangles represent effluent data. Note: The dashed red line represents the 1:1 reference line, indicating perfect agreement between measured and modeled values.
Water 17 03330 g007
The strong positive correlations between MPs and both TSS and turbidity clearly indicate that MPs are closely associated with suspended particulate matter within wastewater systems. This relationship supports the understanding that MPs tend to adsorb onto, or co-precipitate with, organic and inorganic solids during treatment processes [53,54]. Regression analysis further confirmed TSS as the most reliable and statistically significant predictor of MP abundance, reflecting its direct measurement of particulate mass that can physically trap or carry MPs through settling and filtration stages. In contrast, turbidity represents the optical scattering of particles rather than their mass concentration and is thus more sensitive to variations in particle size and morphology. Although its predictive stability was slightly lower than that of TSS, turbidity remains valuable as a complementary parameter, particularly for rapid or field-based MP screening, consistent with prior studies reporting its potential as a proxy indicator in surface and drinking waters [13,20,21]. The results demonstrate that suspended solid–related indicators, particularly TSS, provide a robust and practical basis for assessing MP behavior across different treatment stages. The strong TSS–MP association observed in both influent and effluent samples underscores the potential of TSS as a quantitative indicator for MP monitoring, while turbidity serves as a complementary, rapid indicator for on-site screening.

3.5. Limitations to the Proposed Approach and Future Perspectives

This study used Anodisc filters, which resulted in the omission of a fingerprint region (<1200 cm−1), which could limit the detection of certain polymers. To improve the accuracy of MP analysis, the use of ATR-FTIR or Raman spectroscopy is recommended to comply in future studies for comprehensive spectral confirmation [55]. Several limitations must be acknowledged. The dataset, although representative of six WWTPs, remains relatively small, limiting generalization across seasons and hydrological conditions. In particular, the limited sample size (n = 8) constrains the statistical robustness of the correlation and regression analyses. Future investigations should therefore include a larger number of samples and repeated measurements within each WWTP type to validate and refine the TSS-based predictive relationship under varying operational and seasonal conditions. Despite these limitations, this study establishes a valuable baseline dataset for Thailand that can guide subsequent research and policymaking.
Future efforts should expand temporal coverage, integrate real-time detection tools, and investigate the fate of residual MPs in sludge and biosolids [56]. Comparative studies on advanced processes, such as MBR and electrocoagulation, are also essential to support technological upgrades in developing regions [11,57,58]. Nevertheless, this study provides an inland–island comparative dataset of MP removal in WWTPs in Thailand’s EEC, with broader implications for emerging economies facing similar urban–tourism dynamics. The results confirm that while conventional biological systems achieve moderate to high MP removal, fine particles (<300–100 μm) and buoyant polymers (PE, PP) remain persistent in effluents. These fractions may pose ecological risks [59] and highlight the inadequacy of sedimentation processes, as well as the negative impact of nutrients on complete MP retention. A key contribution lies in demonstrating TSS as a reliable predictor for MP monitoring, supported by robust regression models. To validate this assumption and enhance predictive applicability, future studies should expand the dataset size and include site-specific calibration for model refinement.

4. Conclusions

This study provides a comparative assessment of MP occurrence and removal across full-scale WWTPs within Thailand’s EEC, offering new insights into MP behavior under tropical operating conditions. Overall, removal efficiencies exceeded 90%, although fine (<300 μm) and buoyant polymers such as PE and PP persisted in the treated effluents, underscoring the limitations of conventional sedimentation and biological processes. PE and PP collectively accounted for 58–95% of influent MPs, reflecting their ubiquity in wastewater-derived plastics. Variations in MP abundance and polymer composition among WWTPs appeared to be driven by differences in wastewater characteristics and anthropogenic activity patterns, with island systems exhibiting higher proportions of PE, likely associated with short-term tourism-related plastic use.
The observed positive correlations between MP concentrations and TSS, coupled with turbidity, suggest that these suspended-solid parameters could serve as practical and cost-effective indicators for rapid MP monitoring. The results thus support the potential integration of TSS- and turbidity-based approaches into routine WWTP monitoring to infer MP dynamics. Future studies should expand sampling coverage and temporal resolution to strengthen the reliability of these indicators and to develop locally calibrated regression frameworks for MP assessment in WWTPs.

Supplementary Materials

The following supporting information can be downloaded at https://www.mdpi.com/article/10.3390/w17223330/s1: Table S1: Characteristics of the six wastewater treatment plants (WWTPs) investigated in the Eastern Economic Corridor (EEC), Thailand; Table S2: Summary of wastewater sampling campaigns, locations, and sample volumes for MP analysis; Table S3: Physicochemical characteristics of influent and effluent wastewater samples collected from six WWTPs in Thailand’s Eastern Economic Corridor (EEC); Figure S1: Size distribution of MPs in influent samples from six wastewater treatment plants (WWTPs) in the Eastern Economic Corridor (EEC), Thailand. Data are presented as stacked bar charts showing abundance (MP m−3) of MPs in two size fractions: <5 mm–300 μm and <300–100 μm; Figure S2: Representative FTIR spectra of selected polymers identified in influent samples: polyethylene (PE), polypropylene (PP), polyamide (PA), Spectra were obtained in transmission mode (128 scans, 1200–4000 cm−1, 4 cm−1 resolution), confirming polymer assignments; Figure S3: Representative FTIR spectra of selected polymers identified in influent samples: polytetrafluoroethylene (PTFE), poly (vinyl stearate) (PVS) and ethylene–butyl acrylate (EBA). Spectra were obtained in transmission mode (128 scans, 1200–4000 cm−1, 4 cm−1 resolution), confirming polymer assignments.

Author Contributions

Conceptualization, S.I.; data curation, P.K. and C.M.; funding acquisition, S.I.; investigation, P.S., A.P. and C.M.; methodology, P.K. and S.I.; project administration, S.I.; software, S.T.; validation, A.P.; visualization, P.S.; writing—original draft, S.T. and S.I.; writing—review and editing, S.T. and S.I. All authors have read and agreed to the published version of the manuscript.

Funding

This research was supported by the Thailand Science Research and Innovation (Grant numbers 180103/2023, 198405/2024).

Data Availability Statement

The original contributions presented in this study are included in the article/Supplementary Materials. Further inquiries can be directed to the corresponding author.

Acknowledgments

The authors declare that financial support was received for the research and/or publication of this article. The authors also wish to express their gratitude to Rajamangala University of Technology Suvarnabhumi for providing access to the Minitab statistical software used in data analysis. Furthermore, the authors convey special thanks to the municipalities in the Chachoengsao, Chonburi, and Rayong provinces for their efforts in facilitating the collection of microplastics.

Conflicts of Interest

The authors declare that the research was conducted in the absence of any commercial or financial relationships that could be construed as a potential conflict of interest.

References

  1. Mennekes, D.; Nowack, B. Predicting Microplastic Masses in River Networks with High Spatial Resolution at Country Level. Nat. Water 2023, 1, 523–533. [Google Scholar] [CrossRef]
  2. Andrady, A.L. Microplastics in the Marine Environment. Mar. Pollut. Bull. 2011, 62, 1596–1605. [Google Scholar] [CrossRef]
  3. Hale, R.C.; Seeley, M.E.; Guardia, M.J.L.; Mai, L.; Zeng, E.Y. A Global Perspective on Microplastics. J. Geophys. Res. Ocean. 2020, 125, e2018JC014719. [Google Scholar] [CrossRef]
  4. Iordachescu, L.; Nielsen, R.V.; Papacharalampos, K.; Barritaud, L.; Denieul, M.-P.; Plessis, E.; Baratto, G.; Julien, V.; Vollertsen, J. Point-Source Tracking of Microplastics in Sewerage Systems. Finding the Culprit. Water Res. 2024, 257, 121696. [Google Scholar] [CrossRef]
  5. Liu, W.; Zhang, J.; Liu, H.; Guo, X.; Zhang, X.; Yao, X.; Cao, Z.; Zhang, T. A Review of the Removal of Microplastics in Global Wastewater Treatment Plants: Characteristics and Mechanisms. Environ. Int. 2021, 146, 106277. [Google Scholar] [CrossRef]
  6. Dris, R.; Gasperi, J.; Rocher, V.; Saad, M.; Renault, N.; Tassin, B. Microplastic Contamination in an Urban Area: A Case Study in Greater Paris. Environ. Chem. 2015, 12, 592. [Google Scholar] [CrossRef]
  7. Sun, J.; Dai, X.; Wang, Q.; van Loosdrecht, M.C.M.; Ni, B.-J. Microplastics in Wastewater Treatment Plants: Detection, Occurrence and Removal. Water Res. 2019, 152, 21–37. [Google Scholar] [CrossRef] [PubMed]
  8. Carr, S.A.; Liu, J.; Tesoro, A.G. Transport and Fate of Microplastic Particles in Wastewater Treatment Plants. Water Res. 2016, 91, 174–182. [Google Scholar] [CrossRef]
  9. Bayo, J.; López-Castellanos, J.; Olmos, S. Membrane Bioreactor and Rapid Sand Filtration for the Removal of Microplastics in an Urban Wastewater Treatment Plant. Mar. Pollut. Bull. 2020, 156, 111211. [Google Scholar] [CrossRef]
  10. Dayal, L.; Yadav, K.; Dey, U.; Das, K.; Kumari, P.; Raj, D.; Mandal, R.R. Recent Advancement in Microplastic Removal Process from Wastewater—A Critical Review. J. Hazard. Mater. Adv. 2024, 16, 100460. [Google Scholar] [CrossRef]
  11. Ittisupornrat, S.; Namyuang, C.; Phetrak, A.; Sriromreun, P.; Theepharaksapan, S. Microplastic Contamination and Removal Efficiency in Greywater Treatment Using a Membrane Bioreactor. Front. Microbiol. 2025, 16, 1519230. [Google Scholar] [CrossRef] [PubMed]
  12. Lares, M.; Ncibi, M.C.; Sillanpää, M.; Sillanpää, M. Occurrence, Identification and Removal of Microplastic Particles and Fibers in Conventional Activated Sludge Process and Advanced MBR Technology. Water Res. 2018, 133, 236–246. [Google Scholar] [CrossRef]
  13. Sullivan, E.; Cole, M.; Atwood, E.C.; Lindeque, P.K.; Chin, P.T.; Martinez-Vicente, V. In Situ Correlation between Microplastic and Suspended Particulate Matter Concentrations in River-Estuary Systems Support Proxies for Satellite-Derived Estimates of Microplastic Flux. Mar. Pollut. Bull. 2023, 196, 115529. [Google Scholar] [CrossRef]
  14. Tadsuwan, K.; Babel, S. Microplastic Contamination in a Conventional Wastewater Treatment Plant in Thailand. Waste Manag. Res. 2021, 39, 754–761. [Google Scholar] [CrossRef]
  15. Kittipongvises, S.; Phetrak, A.; Hongprasith, N.; Lohwacharin, J. Unravelling Capability of Municipal Wastewater Treatment Plant in Thailand for Microplastics: Effects of Seasonality on Detection, Fate and Transport. J. Environ. Manag. 2022, 302, 113990. [Google Scholar] [CrossRef]
  16. Hongprasith, N.; Kittimethawong, C.; Lertluksanaporn, R.; Eamchotchawalit, T.; Kittipongvises, S.; Lohwacharin, J. IR Microspectroscopic Identification of Microplastics in Municipal Wastewater Treatment Plants. Environ. Sci. Pollut. Res. 2020, 27, 18557–18564. [Google Scholar] [CrossRef] [PubMed]
  17. Tontisirin, N.; Anantsuksomsri, S. Economic Development Policies and Land Use Changes in Thailand: From the Eastern Seaboard to the Eastern Economic Corridor. Sustainability 2021, 13, 6153. [Google Scholar] [CrossRef]
  18. Bissen, R.; Chawchai, S. Microplastics on Beaches along the Eastern Gulf of Thailand—A Preliminary Study. Mar. Pollut. Bull. 2020, 157, 111345. [Google Scholar] [CrossRef] [PubMed]
  19. Phaksopa, J.; Worachananant, S.; Thamrongnawasawat, T.; Tanapivattanakul, K.; Kumnuandao, S.; Chamcha-Em, T.; Khamrueang, A.; Chaimongkol, T. Microplastic Pollution and Risk Assessment around Coral Reefs of the Eastern Part, Thailand. Environ. Sci. Pollut. Res. Int. 2025, 32, 12441–12454. [Google Scholar] [CrossRef] [PubMed]
  20. Bayarkhuu, B.; Byun, J. Optimization of Coagulation and Sedimentation Conditions by Turbidity Measurement for Nano- and Microplastic Removal. Chemosphere 2022, 306, 135572. [Google Scholar] [CrossRef]
  21. Zhou, Q.; Tu, C.; Yang, J.; Fu, C.; Li, Y.; Waniek, J.J. Trapping of Microplastics in Halocline and Turbidity Layers of the Semi-Enclosed Baltic Sea. Front. Mar. Sci. 2021, 8, 761566. [Google Scholar] [CrossRef]
  22. Razeghi, N.; Hamidian, A.H.; Wu, C.; Zhang, Y.; Yang, M. Microplastic Sampling Techniques in Freshwaters and Sediments: A Review. Environ. Chem. Lett. 2021, 19, 4225–4252. [Google Scholar] [CrossRef]
  23. Masura, J.; Baker, J.; Foster, G.; Arthur, C. Laboratory Methods for the Analysis of Microplastics in the Marine Environment: Recommendations for Quantifying Synthetic Particles in Waters and Sediments; NOAA Marine Debris Division: Silver Spring, MD, USA, 2015. [Google Scholar]
  24. Vibhatabandhu, P.; Prachayakul, T.; Tang-siri, J.; Benmas, P.; Srithongouthai, S.; Kanokkantapong, V. Effect of Tidal Current on the Settling and Accumulation of Microplastics in the Chao Phraya River Estuary, Thailand. Mar. Pollut. Bull. 2024, 200, 116068. [Google Scholar] [CrossRef]
  25. Miserli, K.; Konstantinou, I. Determination of Microplastics in Municipal Wastewater Treatment Plant Effluents and Sludge Using Micro-Raman Spectroscopy. Water Emerg. Contam. Nanoplastics 2025, 4. [Google Scholar] [CrossRef]
  26. Zhang, K.; Shi, H.; Peng, J.; Wang, Y.; Xiong, X.; Wu, C.; Lam, P.K.S. Microplastic Pollution in China’s Inland Water Systems: A Review of Findings, Methods, Characteristics, Effects, and Management. Sci. Total Environ. 2018, 630, 1641–1653. [Google Scholar] [CrossRef] [PubMed]
  27. Wesch, C.; Elert, A.M.; Wörner, M.; Braun, U.; Klein, R.; Paulus, M. Assuring Quality in Microplastic Monitoring: About the Value of Clean-Air Devices as Essentials for Verified Data. Sci. Rep. 2017, 7, 5424. [Google Scholar] [CrossRef]
  28. Eaton, A.D.; Baird, R.B.; Rice, E.W.; Bridgewater, A. Standard Methods for the Examination of Water and Wastewater, 23rd ed.; American Public Health Association: Washington, DC, USA, 2017; ISBN 978-0-87553-287-5. [Google Scholar]
  29. Cox, D.R.; Spjøtvoll, E.; Johansen, S.; van Zwet, W.R.; Bithell, J.F.; Barndorff-Nielsen, O.; Keuls, M. The Role of Significance Tests [with Discussion and Reply]. Scand. J. Stat. 1977, 4, 49–70. [Google Scholar]
  30. Metcalf, E. Wastewater Engineering: Treatment and Resource Recovery, 5th ed.; McGraw-Hill: New York, NY, USA, 2014. [Google Scholar]
  31. Wiesmann, U.; Choi, I.S.; Dombrowski, E.M. Fundamentals of Biological Wastewater Treatment; Wiley-VCH: Weinheim, Germany, 2006; p. 362. ISBN 978-3-527-31219-1. [Google Scholar]
  32. Tang, S.L.; Yue, D.P.T.; Li, X.Z. Comparison of Engineering Costs of Raw Freshwater, Reclaimed Water and Seawater for Toilet Flushing in Hong Kong. Water Environ. J. 2006, 20, 240–247. [Google Scholar] [CrossRef]
  33. Limsakul, A.; Kammuang, A.; Paengkaew, W.; Sooktawee, S.; Aroonchan, N. Changes in Slow-Onset Climate Events in Thailand. Environ. Eng. Res. 2024, 29, 220784. [Google Scholar] [CrossRef]
  34. Zhao, Y.; Zhuang, X.; Ahmad, S.; Sung, S.; Ni, S.Q. Biotreatment of High-Salinity Wastewater: Current Methods and Future Directions. World J. Microbiol. Biotechnol. 2020, 36, 37. [Google Scholar] [CrossRef]
  35. Kim, J.; Wu, B.; Jeong, S.; Jeong, S.; Kim, M. Recent Advances of Membrane-Based Hybrid Membrane Bioreactors for Wastewater Reclamation. Front. Membr. Sci. Technol. 2024, 3, 1361433. [Google Scholar] [CrossRef]
  36. Ittisupornrat, S.; Theepharaksapan, S.; Krasaesueb, N.; Phetrak, A. Impact of Saline Valorization in Contaminated Municipal Wastewater on the Treatment Performance and Bacterial Community Dynamics of a Membrane Bioreactor. J. Chem. Technol. Biotechnol. 2023, 98, 633–641. [Google Scholar] [CrossRef]
  37. Thompson, R.C.; Moore, C.J.; vom Saal, F.S.; Swan, S.H. Plastics, the Environment and Human Health: Current Consensus and Future Trends. Philos. Trans. R. Soc. B Biol. Sci. 2009, 364, 2153–2166. [Google Scholar] [CrossRef]
  38. Andrady, A.L. The Plastic in Microplastics: A Review. Mar. Pollut. Bull. 2017, 119, 12–22. [Google Scholar] [CrossRef]
  39. Song, K.; Li, L. Occurrence of Microplastics in Wastewater Treatment Plants. In Microplastics in Urban Water Management; John Wiley & Sons: Weinheim, Germany, 2023; pp. 91–117. [Google Scholar] [CrossRef]
  40. Geyer, R.; Jambeck, J.R.; Law, K.L. Production, Use, and Fate of All Plastics Ever Made. Sci. Adv. 2017, 3, e1700782. [Google Scholar] [CrossRef]
  41. Onay, H.; Minaz, M.; Ak, K.; Er, A.; Emanet, M.; Karslı, B.; Bilgin, S. Decade of Microplastic Alteration in the Southeastern Black Sea: An Example of Seahorse Gastrointestinal Tracts. Environ. Res. 2023, 218, 115001. [Google Scholar] [CrossRef]
  42. Jessieleena, A.; Rathinavelu, S.; Velmaiel, K.E.; John, A.A.; Nambi, I.M. Residential Houses—A Major Point Source of Microplastic Pollution: Insights on the Various Sources, Their Transport, Transformation, and Toxicity Behaviour. Environ. Sci. Pollut. Res. 2023, 30, 67919–67940. [Google Scholar] [CrossRef] [PubMed]
  43. Vibhatabandhu, P.; Srithongouthai, S. Influence of Seasonal Variations on the Distribution Characteristics of Microplastics in the Surface Water of the Inner Gulf of Thailand. Mar. Pollut. Bull. 2022, 180, 113747. [Google Scholar] [CrossRef] [PubMed]
  44. Reddy, A.S.; Nair, A.T. The Fate of Microplastics in Wastewater Treatment Plants: An Overview of Source and Remediation Technologies. Environ. Technol. Innov. 2022, 28, 102815. [Google Scholar] [CrossRef]
  45. Extrand, C.W.; Moon, S.I. Using the Flotation of a Single Sphere to Measure and Model Capillary Forces. Langmuir 2009, 25, 6239–6244. [Google Scholar] [CrossRef] [PubMed]
  46. Kiattisaksiri, P.; Eaktasang, N.; Pasukphun, N.; Youdee, K.; Suma, Y. Occurrence of Microplastics across Seasonal Variations in a Municipal Wastewater Treatment Plant in Thailand. Trends Sci. 2025, 22, 9931. [Google Scholar] [CrossRef]
  47. Chukwuka, A.V.; Adegboyegun, A.D.; Adeogun, A.O. Algal Bloom-Mediated Microplastic Dispersion in Coastal Areas of West Africa: Integrated Insights and Risk Projections from Molecular Models and Remote-Sensed Evaluations. J. Hazard. Mater. 2025, 489, 137590. [Google Scholar] [CrossRef]
  48. Lv, X.; Dong, Q.; Zuo, Z.; Liu, Y.; Huang, X.; Wu, W.-M. Microplastics in a Municipal Wastewater Treatment Plant: Fate, Dynamic Distribution, Removal Efficiencies, and Control Strategies. J. Clean. Prod. 2019, 225, 579–586. [Google Scholar] [CrossRef]
  49. Pittura, L.; Foglia, A.; Akyol, Ç.; Cipolletta, G.; Benedetti, M.; Regoli, F.; Eusebi, A.L.; Sabbatini, S.; Tseng, L.Y.; Katsou, E.; et al. Microplastics in Real Wastewater Treatment Schemes: Comparative Assessment and Relevant Inhibition Effects on Anaerobic Processes. Chemosphere 2021, 262, 128415. [Google Scholar] [CrossRef]
  50. Talvitie, J.; Mikola, A.; Koistinen, A.; Setälä, O. Solutions to Microplastic Pollution—Removal of Microplastics from Wastewater Effluent with Advanced Wastewater Treatment Technologies. Water Res. 2017, 123, 401–407. [Google Scholar] [CrossRef] [PubMed]
  51. Ziajahromi, S.; Neale, P.A.; Rintoul, L.; Leusch, F.D.L. Wastewater Treatment Plants as a Pathway for Microplastics: Development of a New Approach to Sample Wastewater-Based Microplastics. Water Res. 2017, 112, 93–99. [Google Scholar] [CrossRef] [PubMed]
  52. Michielssen, M.R.; Michielssen, E.R.; Ni, J.; Duhaime, M.B. Fate of Microplastics and Other Small Anthropogenic Litter (SAL) in Wastewater Treatment Plants Depends on Unit Processes Employed. Environ. Sci. Water Res. Technol. 2016, 2, 1064–1073. [Google Scholar] [CrossRef]
  53. Reza, T.; Mohamad Riza, Z.H.; Sheikh Abdullah, S.R.; Abu Hasan, H.; ‘Izzati Ismail, N.; Othman, A.R. Microplastic Removal in Wastewater Treatment Plants (WWTPs) by Natural Coagulation: A Literature Review. Toxics 2024, 12, 12. [Google Scholar] [CrossRef]
  54. Acarer, S. A Review of Microplastic Removal from Water and Wastewater by Membrane Technologies. Water Sci. Technol. 2023, 88, 199–219. [Google Scholar] [CrossRef]
  55. Tarte, J.V.; Ahmed, M.B.; Tra, V.-T.; Wang, Q.; Johir, M.A.H.; Nghiem, L.D. Large Scale Microplastic Fibre Analysis in Wastewater: A Comprehensive Review and Recommendations. Curr. Pollut. Rep. 2025, 11, 49. [Google Scholar] [CrossRef]
  56. Prata, J.C.; da Costa, J.P.; Lopes, I.; Duarte, A.C.; Rocha-Santos, T. Environmental Exposure to Microplastics: An Overview on Possible Human Health Effects. Sci. Total Environ. 2020, 702, 134455. [Google Scholar] [CrossRef] [PubMed]
  57. Nafea, T.H.; Al-Maliki, A.J.; Al-Tameemi, I.M. Sources, Fate, Effects, and Analysis of Microplastic in Wastewater Treatment Plants: A Review. Environ. Eng. Res. 2024, 29. [Google Scholar] [CrossRef]
  58. Xu, Q.; Ni, B.-J. Microplastics Removal and Degradation in Urban Water Systems. In Microplastics in Urban Water Management; John Wiley & Sons, Ltd.: Hoboken, NJ, USA, 2022; pp. 211–242. ISBN 978-1-119-75937-9. [Google Scholar]
  59. Suanluang, S.; Vibhatabandhu, P.; Srithongouthai, S. Spatial Distribution and Potential Ecological Risk of Microplastics in Surface Sediments of the Inner Gulf of Thailand. Appl. Environ. Res. 2025, 47, 1–17. [Google Scholar] [CrossRef]
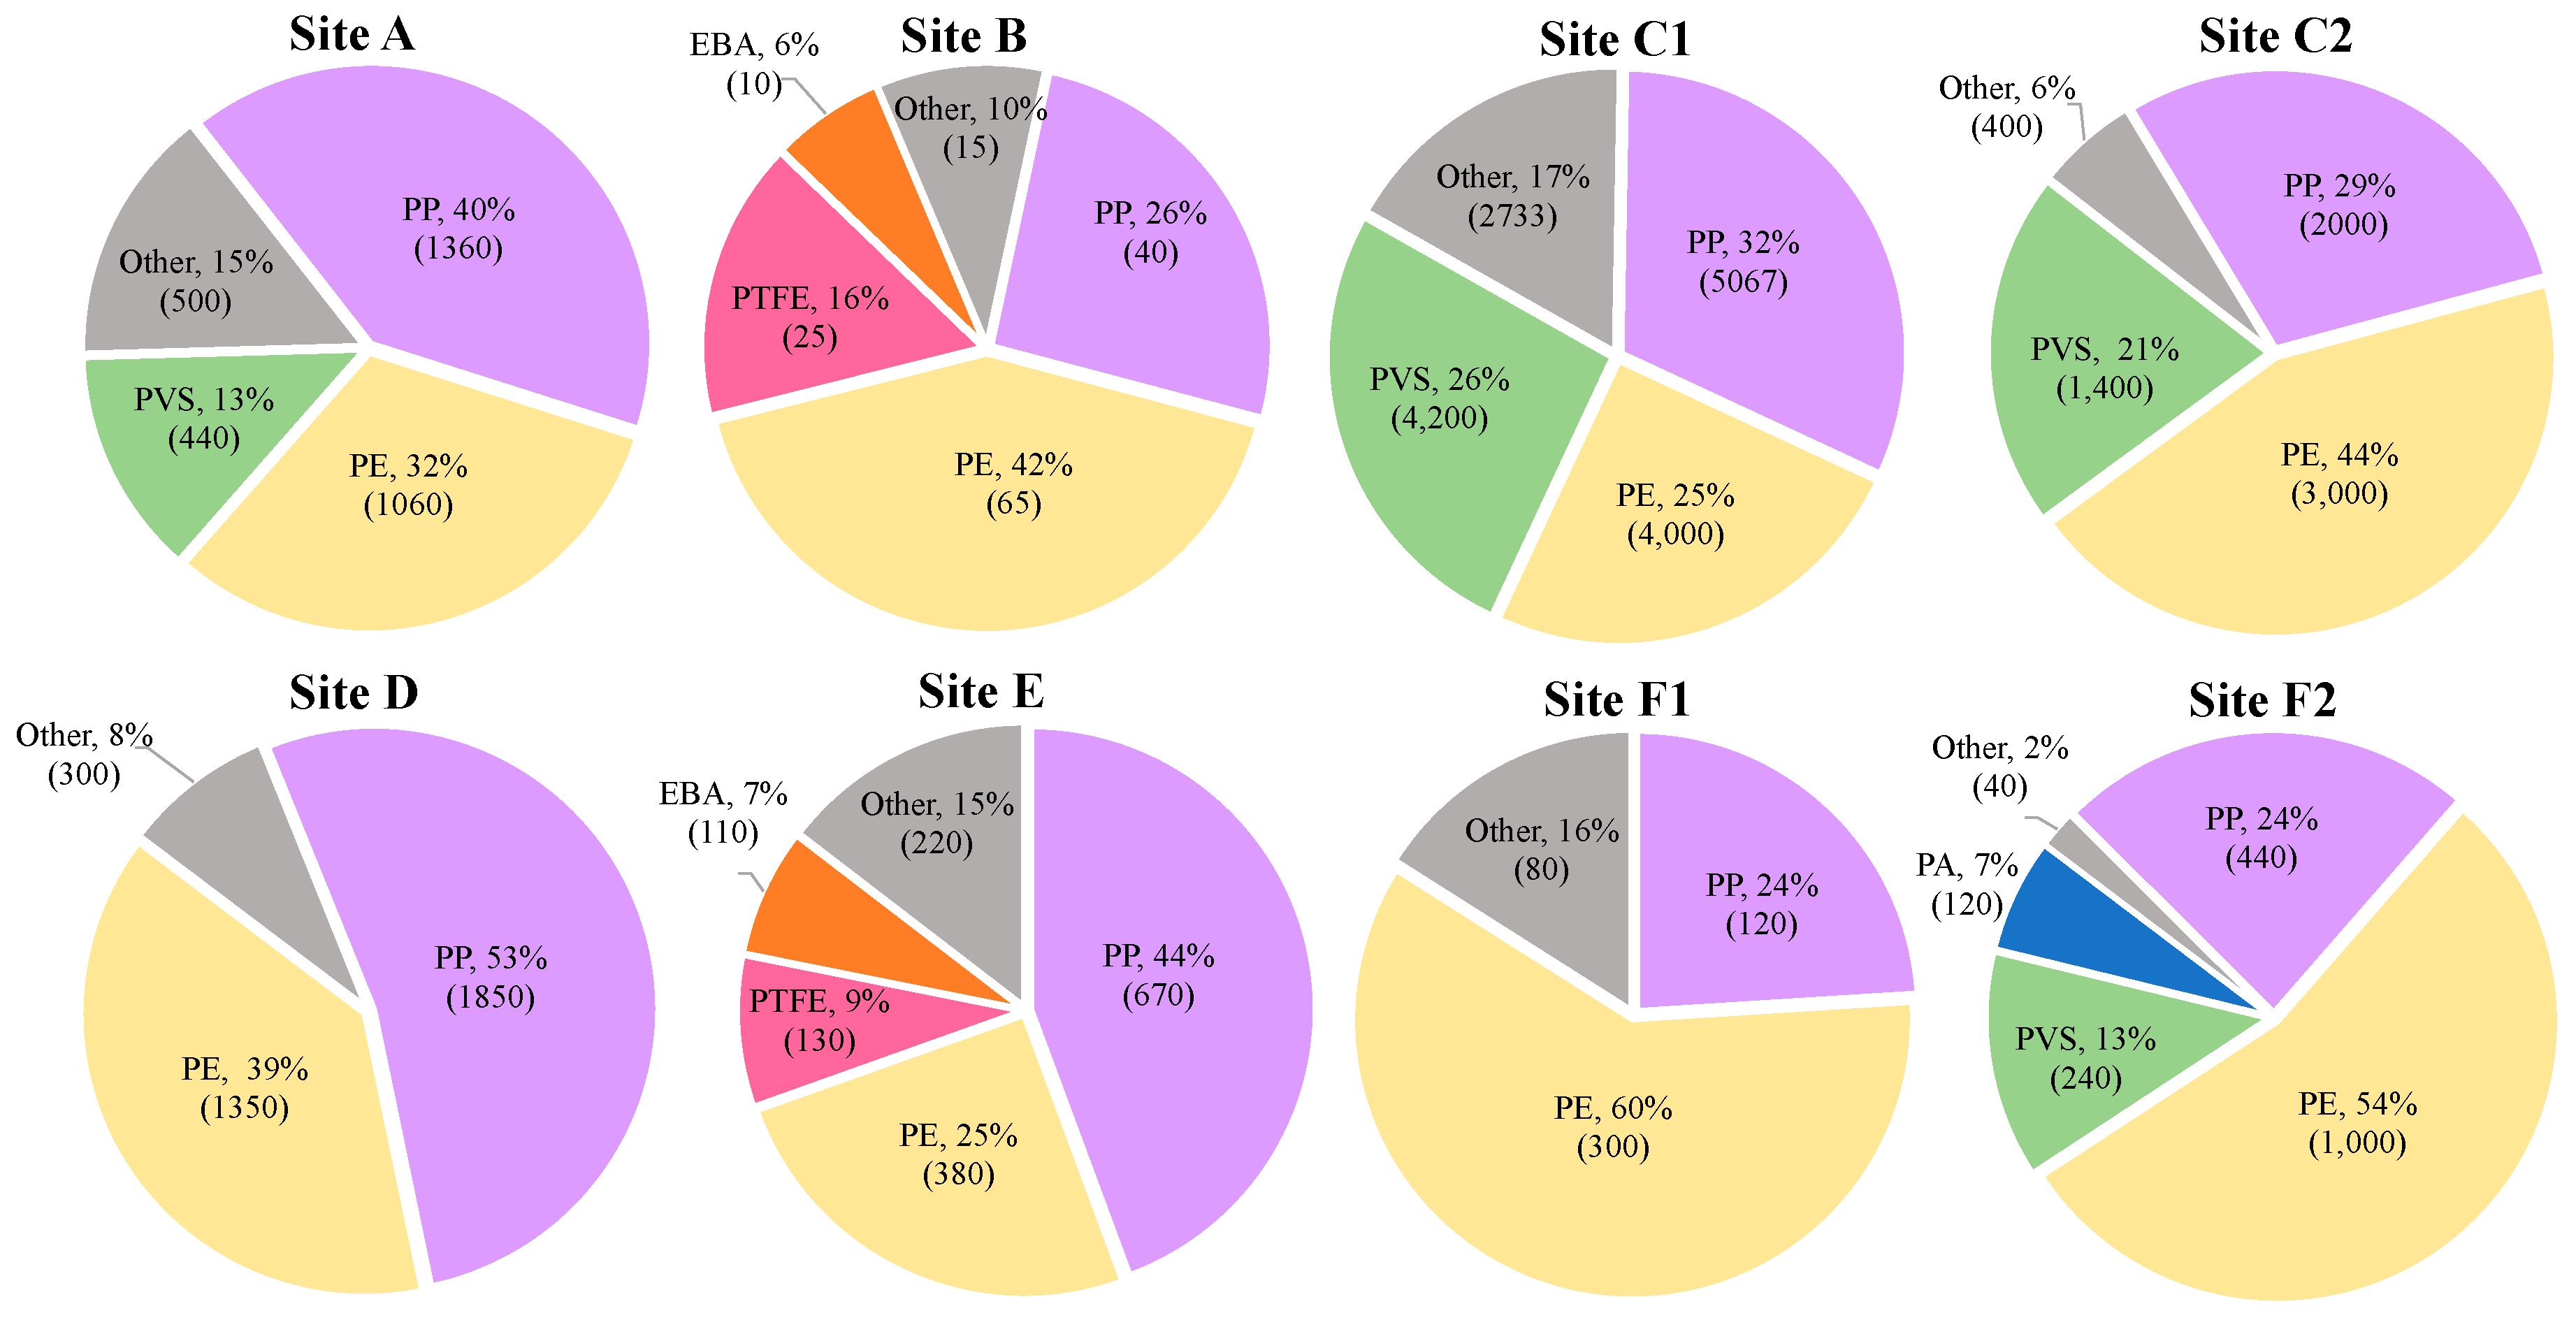
Figure 3. Polymeric composition of influent MPs detected in six WWTPs of Thailand’s EEC. Each pie chart represents an individual sampling event from sites A–F2. Numbers in parentheses denote the total microplastic abundance (MP m−3) within each polymer category.
Water 17 03330 g003
Figure 4. Representative microscopic images of influent MPs in WWTPs of the EEC, confirming polymer identity across inland and island systems.
Water 17 03330 g004
Figure 5. MP concentrations in influent and effluent streams in log scale and corresponding removal efficiencies (%) across six WWTPs in the EEC.
Water 17 03330 g005
Figure 6. Spearman’s correlation matrices showing relationships between MP concentrations and water quality parameters in (a) influent and (b) effluent samples. Color intensity reflects correlation strength and direction. Note: Bold numbers indicate statistically significant correlations at p < 0.05.
Water 17 03330 g006
Table 1. Reported influent–effluent MP concentrations and removal efficiencies across full-scale wastewater treatment systems.
CountryTreatment ProcessInfluent
(MP L−1)
Effluent
(MP L−1)
Removal (%)Dominant PolymerSource
Asia
ThailandSP1.30 ± 1.610.22 ± 0.4275–100Fragment (PET, PP, PE)[46]
ThailandSBR, OD, CAS12.22.084Fiber (PES, 18%), PE (13%), Polyacrylate (12%), PP (9%)[16]
ChinaOD0.28 ± 0.020.13 ± 0.0153.6 (number)/97 (mass)PET (47%), PS (20%), PE (18%), PP (15%)[48]
Europe
ItalyCAS3.60.76–1.985.7Fiber (PE, PET)[49]
FinlandMBR6.9 ± 1.00.005 ± 0.00499.9Polyester (60%), PE (14%), Polyacrylate (7%)[50]
AustraliaAS + SF + RO12–1170.21–1.598.3–99.8Fiber, Fragment (PE, PET)[51]
USAAS/SF/AnMBR133 ± 36/94 ± 185.9/0.595.6–99.4Fiber (44–83%) > Fragment > Paint chip[52]
Note: CAS = conventional activated sludge; MBR = membrane bioreactor; OD = oxidation ditch; SBR = sequencing batch reactor; SP = stabilization pond; SF = sand filtration; RO = reverse osmosis; AnMBR = anaerobic membrane bioreactor.
Table 2. Summary of MLR models developed to estimate MP concentrations based on selected water quality parameters.
Data SourceModel TypeRegression EquationAdj. R2p-Value
Influent SampleTSS MP = 18.5   T S S + 1162 0.5130.028 *
Turbidity MP = 19.4   T u r b i d i t y + 2030 0.1740.167
TSS and Turbidity MP = 1624 69.5   T u r b i d i t y + 63.2   T S S 0.9180.001 *
Effluent SampleTSS MP = 24.2   T S S 66.9 0.9140.000 *
Turbidity MP = 16.8   T u r b i d i t y 19.5 0.8570.001 *
TSS and Turbidity MP = 5.43   T u r b i d i t y + 17.1   T S S 63.5 0.9140.001 *
Note: Models were developed using measured microplastic ( M P ) concentrations (MP m−3) as the dependent variable (n = 8). Adjusted R2 (Adj. R2) indicates model fit. An asterisk (*) denotes statistical significance at p < 0.05; relationships reflect statistical associations rather than causal effects.
Disclaimer/Publisher’s Note: The statements, opinions and data contained in all publications are solely those of the individual author(s) and contributor(s) and not of MDPI and/or the editor(s). MDPI and/or the editor(s) disclaim responsibility for any injury to people or property resulting from any ideas, methods, instructions or products referred to in the content.