Article

Migration and Heating Mechanisms of Deep-Cyclogenic Thermal Water in Geothermal-Anomaly Mines

1
College of Geology and Environment, Xi’an University of Science and Technology, Xi’an 710054, China
2
Shanxi Provincial Key Laboratory of Geological Support for Coal Green Exploitation, Xi’an University of Science and Technology, Xi’an 710054, China
3
Geological Research Institute for Coal Green Mining, Xi’an University of Science and Technology, Xi’an 710054, China
4
Changjiang Institute of Survey, Planning, Design and Research Co., Ltd., Wuhan 430010, China
*
Author to whom correspondence should be addressed.
Water 2025, 17(22), 3298; https://doi.org/10.3390/w17223298
Submission received: 30 September 2025 / Revised: 9 November 2025 / Accepted: 17 November 2025 / Published: 18 November 2025
(This article belongs to the Special Issue Hydrogeology of the Mining Area)

Abstract

Identifying the causes and mechanisms of heat hazards in mining operations is essential for effective heat hazard prevention and control. In recent years, hydrothermal phenomena have frequently occurred in the eastern part of the Chenghe Mining Area, located in the central Weibei Coalfield. However, research on the geothermal fluid migration patterns and heat generation mechanisms in this region remains limited. This study comprehensively explores the geothermal field characteristics in the area, based on well temperature logging data, rock thermal conductivity, temperature control models, temperature curve analysis, and numerical simulations. It reveals the key controlling factors and mechanisms behind the formation of geothermal anomalies in the region. The results show that the overall geothermal heat flow trend in the area is characterized by low heat in the northwest and high heat in the southeast. The formation of geothermal anomalies is primarily influenced by water-conducting faults and coal seams. Based on this, the temperature control models are classified into two types: the fault + deep circulating thermal water uplift model and the coal seam heat-resistant-folded temperature control model. Heat transfer occurs through groundwater convection along the F1 fault and its secondary faults, which transport heat. The heat generation mechanism in the study area involves the heating of groundwater during deep circulation, followed by the upward migration of the heated water along the F1 fault, which adds an additional heat source to the surrounding rock of the fault, creating localized thermal anomalies. The findings of this study provide direct guidance for safe production in the Chenghe Mining Area and offer a universal theoretical framework for understanding the causes of heat hazards in mining areas with strong tectonic activity in northwestern China.

1. Introduction

Geothermal energy, as a core component of the clean energy system, plays a crucial supporting role in advancing China’s “dual-carbon” strategic goals. However, it also constitutes a significant source of high-temperature thermal hazards in underground mines [1,2]. With the ongoing transition to deeper coal mining in China, mine heat hazards have intensified progressively and have emerged as a major safety threat, ranking alongside the five conventional mine hazards—roof collapse, gas outburst, fire, water inrush, and dust explosions [3,4,5]. Mine thermal hazards primarily affect four key aspects: surrounding rock stability, working environment conditions, support structures, and auxiliary systems. Of particular concern are their adverse effects on miners’ health, work efficiency, and the operational lifespan of electromechanical equipment, as well as their potential to increase the risk of spontaneous combustion of coal and gas-related accidents [6]. In recent years, hydrothermally driven thermal hazards—previously uncommon in coal deposits of northwestern China—have been encountered during the construction and operation of the Xizhuo and Bailiang coal mines in the eastern Chenghe Mining Area, located in the central part of the Weibei Coalfield. These hazards pose serious constraints on safe and efficient mining operations. However, the complex geological, hydrological, and geothermal conditions in this region present significant challenges for geothermal research [7,8,9,10]. Specifically, factors such as the genetic mechanisms and circulation patterns of geothermal fluids in deep aquifer systems largely control the behavior and distribution of deep geothermal anomalies [11,12]. Therefore, to effectively mitigate and prevent mine heat hazards during coal extraction, it is essential to conduct in-depth investigations into the migration characteristics and thermal evolution mechanisms of geothermal fluids within deep hydrothermal systems.
In hydrothermal systems, the migration pathways of geothermal fluids and their heating mechanisms are closely linked to deep-seated heat-conductive structures [13]. In particular, blind faults that penetrate the basement serve as effective conduits for transferring deep-sourced heat to shallower crustal levels, exerting a decisive influence on the spatial distribution of shallow geothermal fields [14]. Currently, scientific inquiry into the migration patterns and thermal evolution mechanisms of geothermal fluids has attracted significant attention. From a systems theory perspective, Wang et al. proposed a genetic framework termed “same-source symbiosis–crust–mantle heat generation–tectonic heat accumulation,” classifying China’s major hydrothermal systems into seven types: paleo-buried hill composite hydrothermal systems in sedimentary basins, deep depression stratabound hydrothermal systems in sedimentary basins, geopressured hydrothermal systems in rift basins, continent–continent collision plate-margin hydrothermal systems, thermally controlled tectonic hydrothermal systems in subduction zones, deep-circulation hydrothermal systems in uplifted mountain ranges, and recent volcanic hydrothermal systems. They systematically analyzed the migration conditions, heat source mechanisms, and genetic models of these systems, thereby refining the theoretical foundations and methodological framework for geothermal resource research in China [13]. Based on temperature measurements and tracer tests conducted in the Dongli Lake area north of the Cangxian uplift in the North China Basin, Yin et al. investigated the control of deep concealed faults on hydrothermal activity, confirming that the Cangdong Fault connects with shallow geothermal reservoirs and functions as a key pathway for hydrothermal fluid flow, thus enhancing understanding of geothermal genesis in sedimentary basins [15]. By integrating geophysical prospecting, hydrogeological testing, geothermal temperature monitoring, hydrochemical analysis, and isotopic studies, Yang et al. comprehensively elucidated the genetic mechanisms of hydrothermal resources in their study area, demonstrating that deep fault zones act as primary channels for upward heat transfer [16]. Focusing on the Haihu New District in Xining City, Zhao et al. employed a multidisciplinary approach—including hydrogeochemical analysis, statistical methods, isotope data, and geochemical modeling—to systematically examine the hydrogeochemical characteristics and formation mechanisms of the local geothermal system. They concluded that high-temperature anomalies arise from the mixing of deeply circulated geothermal water with cooler meteoric water during its ascent along fault zones [17]. Fan et al. investigated the thermal-hydraulic coupling effects in geothermal reservoirs and the influence of fault zones on fluid flow and heat transfer, further validating the robustness of numerical simulation methods in addressing such complex processes [18,19]. Collectively, these studies—spanning macroscopic theoretical frameworks and site-specific case analyses—highlight the critical role of deep-seated faults in controlling geothermal systems and have established a mature methodological system, within which numerical simulation has proven effective in reconstructing geothermal fluid migration pathways. Nevertheless, research on geothermal phenomena in the tectonically active coal mining regions of the southern Ordos Basin remains limited. There is a pressing need to adapt and optimize research methodologies according to local geological conditions to improve the reliability and practical applicability of research outcomes.
Our previous research, integrating surface borehole measurements, groundwater temperature surveys, and thermal conductivity tests of coal-bearing strata, comprehensively investigated the distribution characteristics of the present-day geothermal field. Key controlling factors were identified, including faults, folds, the thermal conductivity of coal measures, and groundwater activity. The formation patterns of geothermal anomalies were delineated, leading to their classification into two genetic models in the study area: a fault-controlled deep-circulation hydrothermal upwelling model and a coal seam heat resistance–fold thermal regulation model [20]. Notably, geothermal studies in the Chenghe Mining Area remain limited, and no systematic investigation has yet been conducted on the migration of deep geothermal fluids or their associated heating mechanisms. Influenced by the F1 and F10 faults, the role of these structures in the development of the high-temperature geothermal system is still poorly understood. Therefore, further research on the geothermal system in the eastern Chenghe Mining Area carries significant academic value and practical relevance.
This study focuses on the eastern Chenghe Mining Area, utilizing extensive drilling data and geological information to construct corresponding contour maps. The spatial distribution characteristics of terrestrial heat flow in the region are systematically analyzed, enabling a preliminary assessment of the genesis of thermal hazards in the mining district and contributing to an improved understanding of regional geothermal field characteristics. Furthermore, by integrating the identified thermal regulation models and classifying borehole temperature profiles, a three-dimensional geological model derived from numerical simulation is employed to jointly investigate the controlling factors and genetic mechanisms of both the geothermal fluid flow system and the observed thermal anomalies. The reliability of the model is validated through comparison of simulation results with field measurements, thereby providing a scientific basis and strategic direction for mitigating mine heat hazards and promoting the clean utilization of geothermal resources within the coalfield.

2. Materials and Methods

2.1. Geological Background and Thermal Hazard Phenomenon

The Chenghe Mining Area is located in the central part of the Weibei Coalfield. It belongs to the Carboniferous–Permian marine–continental coalfield and represents a typical North China-type coalfield. The area lies along the western boundary of the Dongwang Uplift, a first-order tectonic unit, and is characterized by complex geological structures and well-developed fault systems. The predominant fault orientations are EW, NE to NEE, and NNE, with the F1, BF2, and BF3 faults forming the main structural framework. In addition, continuous fold structures trending NE to NEE are present, with amplitudes of approximately 200 m.
The study area is located in the Xizhuo and Bailiang Coalfields within the eastern part of the Chenghe Mining District. It is bounded by the F1 and F10 faults, forming a horst structure. The strata mainly exhibit a monoclinic structure with a NEE strike and NNW dip direction, with gentle dips not exceeding 15°. The stratigraphic sequence in ascending order is as follows: Middle Ordovician Fengfeng Formation (O2f), Upper Carboniferous Taiyuan Formation (C3t), Lower Permian Shanxi Formation (P1s), Lower Permian Lower Shihezi Formation (P1sh), Upper Permian Upper Shihezi Formation (P2sh), Upper Permian Sunjiagou Formation (P2s), Lower Triassic Liujiagou Formation (T1l), Lower Triassic Heshanggou Formation (T1h), Middle Triassic Zhifang Formation (T2z), and the Cenozoic Erathem (Kz). Well-developed fold structures are distributed throughout the region, including the A1 anticline in the northeast, the B2 anticline and X1 syncline in the northwest, and the Xizhuo syncline in the central part (Figure 1). The basement is primarily composed of Cambrian and Ordovician limestone formations exceeding 1000 m in thickness, which gradually thin toward the north. No collapsed columns have been identified within the study area. Notably, thermal hazards are highly pronounced, with Coal Seam No. 5 currently being mined under first-level thermal hazard conditions across most of the area, and second-level conditions observed in the northeastern section.

2.2. Temperature Logging Date

Borehole temperature measurement data serve as the foundational basis for geothermal studies in a given region. The most direct and widely used method for acquiring geothermal temperature data is continuous temperature logging of borehole fluid systems, commonly referred to as well temperature logging [21,22,23]. Depending on the quality of the temperature data, borehole temperature measurements can be classified into four categories: systematic steady-state thermal data, static well temperature data, quasi-steady-state thermal data, and transient thermal data. Steady-state temperature logging data, obtained after the borehole temperature has reached thermal equilibrium with the formation, exhibit minimal deviations and can be directly utilized. Quasi-steady-state temperature data and non-steady-state temperature data, while still associated with significant errors, may serve as supplementary datasets. All other temperature measurements must undergo appropriate correction procedures before they can be employed in regional geothermal field studies [24,25].
This study included a total of 82 borehole temperature measurements, including both historical and newly acquired data. These consist of one steady-state measurement, three quasi-steady-state measurements, 76 simplified measurements, and two transient measurements. For data that cannot be directly used, the “three-point method” is applied to correct non-quasi-steady-state temperature readings [26,27,28]. The “three-point method” involves connecting three predetermined reference points—the constant-temperature point, the neutral point, and the bottomhole temperature point—to form a reference curve. Using the slope of this curve, interpolation between these points is performed to generate a corrected dataset. The bottomhole temperature is calibrated using the time-temperature curve from a quasi-steady-state borehole, while the neutral point is defined as the intersection of two temperature curves. Both the depth and temperature of the constant-temperature point are predetermined parameters.

2.3. Geothermal Gradient Calculation

The temperature measurements from steady-state and quasi-steady-state boreholes exhibit high accuracy and can be directly used for computational analysis. However, data obtained from simplified thermometric boreholes must be calibrated before they can be reliably applied in calculations. The calculation formula for geothermal gradient is as follows [22]:
T = G H H 0 + T 0
Among these parameters: G represents the average geothermal gradient of the borehole temperature measurement (°C/100 m); H denotes the bottom-hole depth (m); H0 indicates the depth of the constant temperature zone, typically set at 20 m; T signifies the bottom-hole temperature or the corrected bottom-hole temperature (°C); and T0 represents the temperature of the constant temperature zone, generally taken as 14 °C.

2.4. Rock Thermal Conductivity

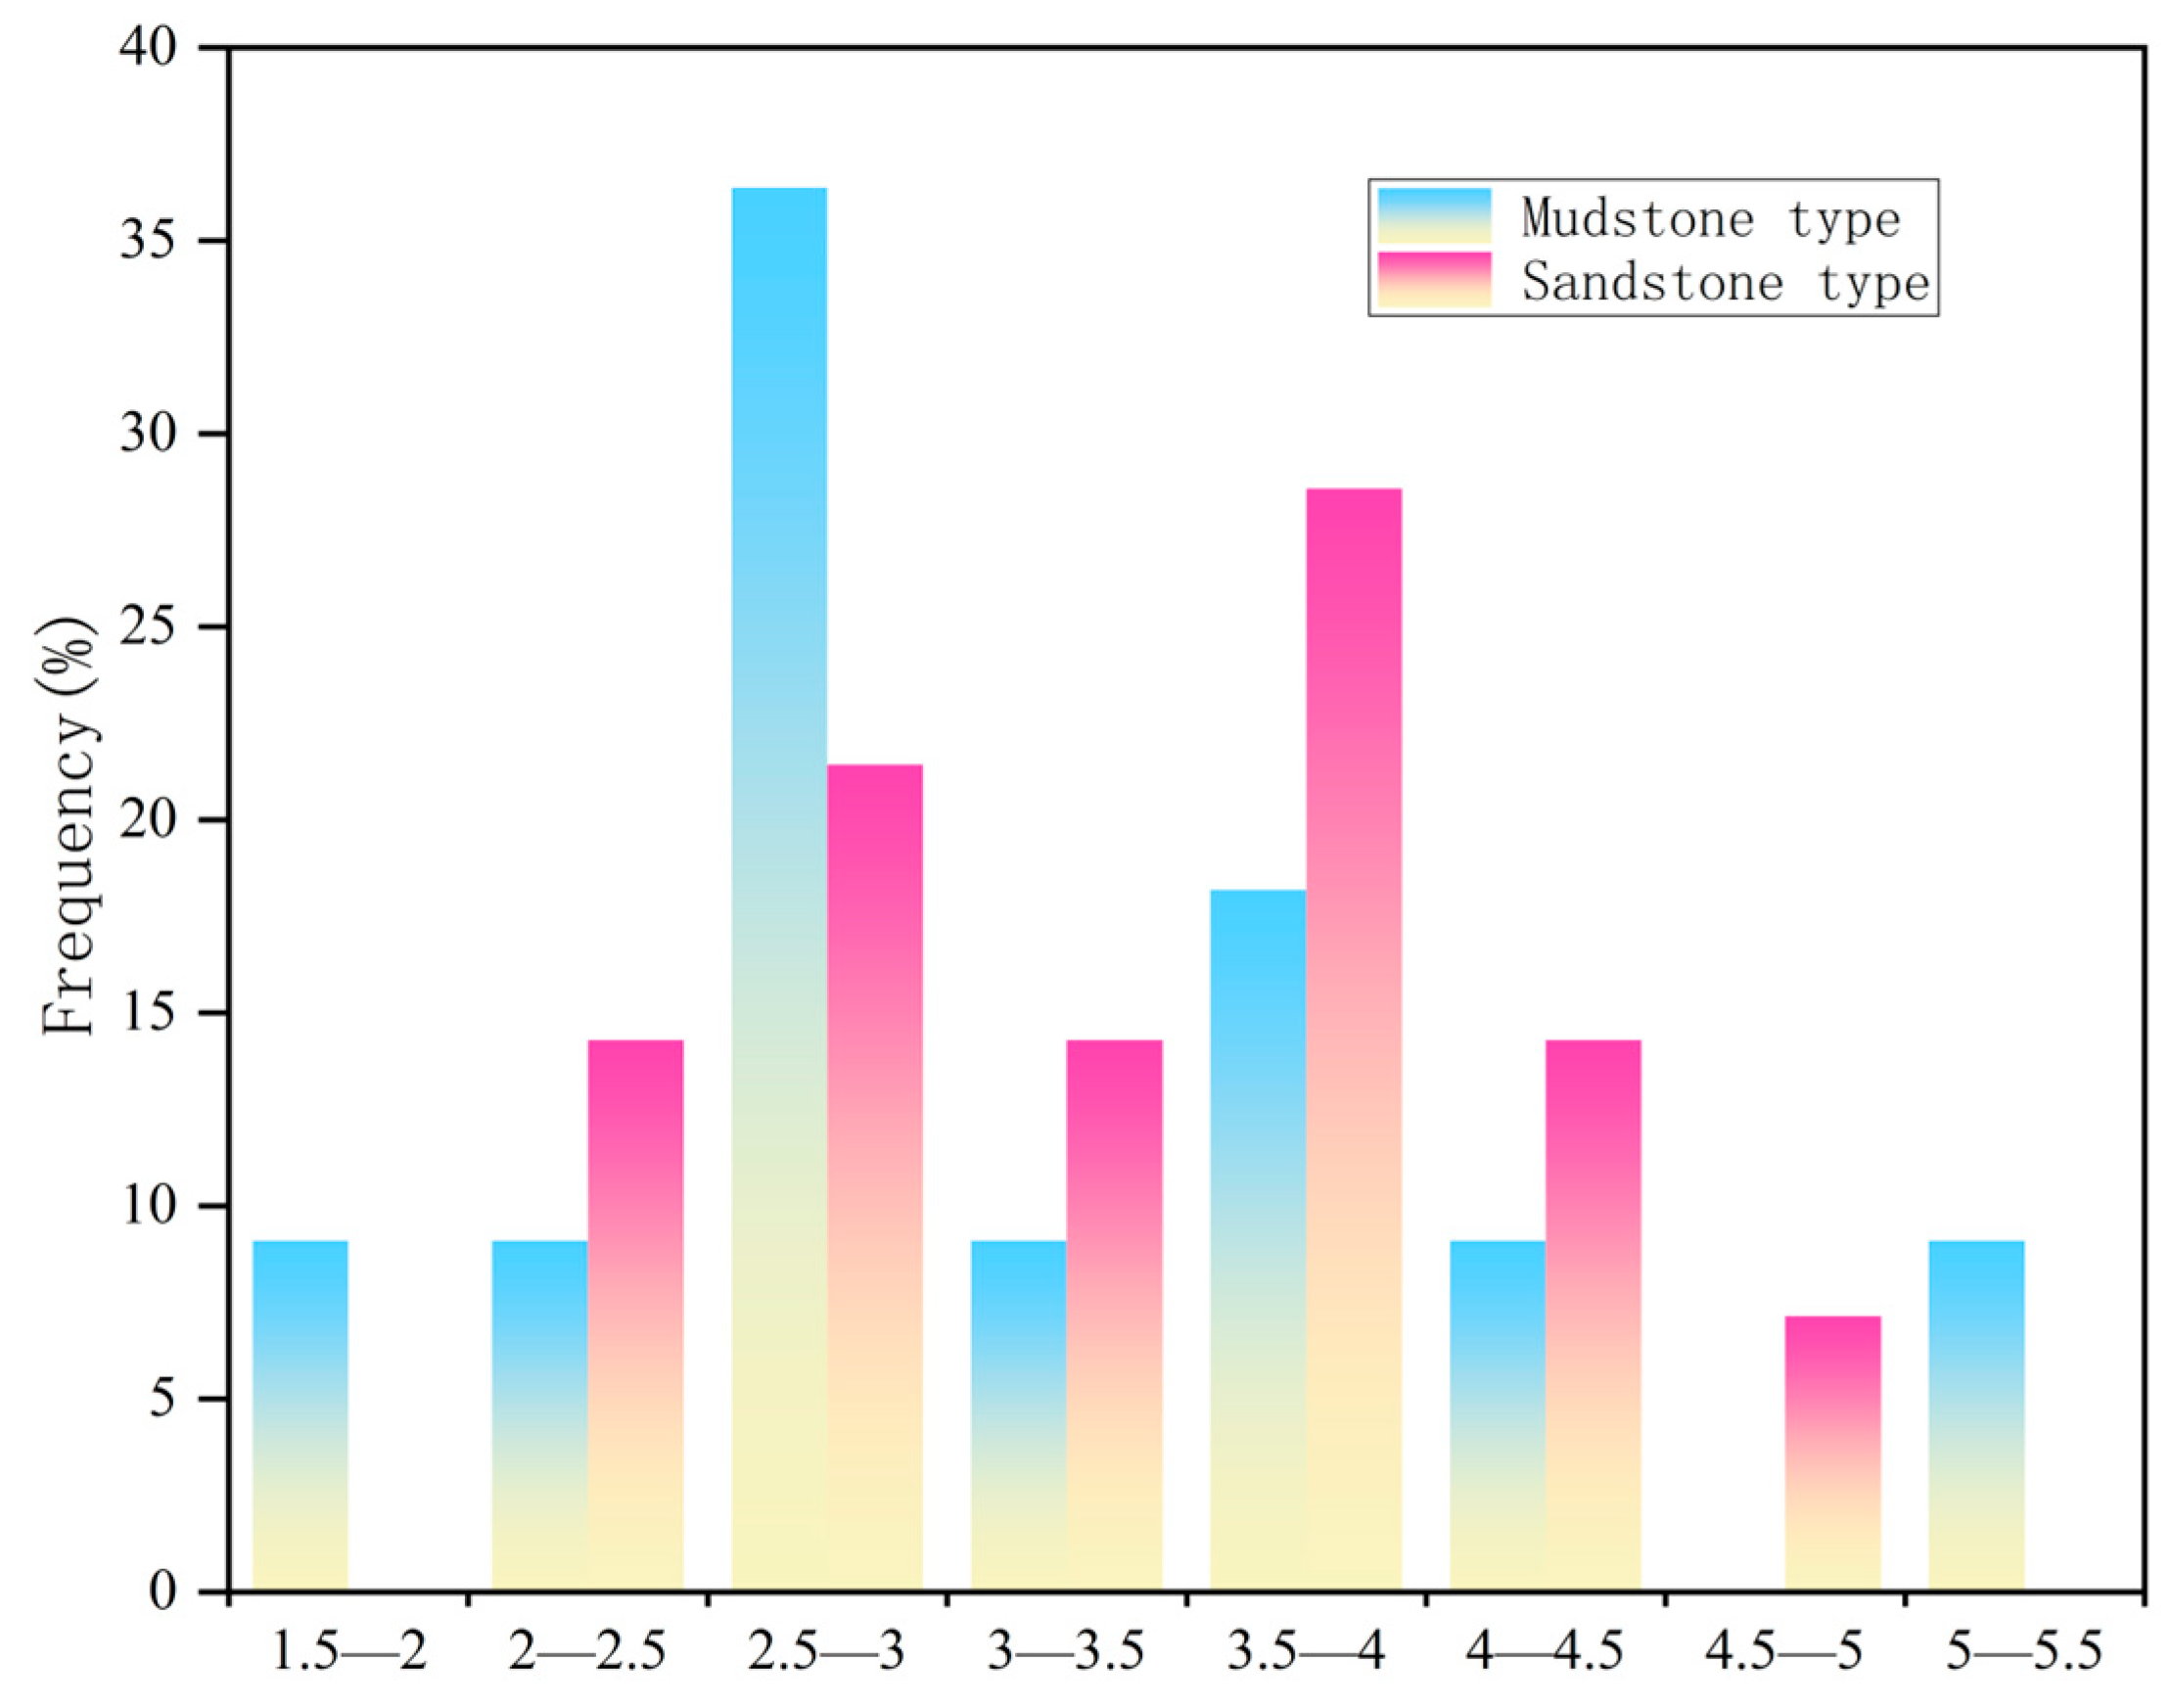
Thermal conductivity, which characterizes the heat transfer capacity of rocks, serves as a primary thermophysical parameter and fundamental data for determining terrestrial heat flow values [29]. The testing was conducted under ambient laboratory conditions using a TCS (The thermal conductivity scanner is manufactured by Xi’an Xiaxi Electronics Technology Co., Ltd. in Xi’an, China.) to analyze 25 representative samples. To minimize experimental uncertainties and prevent the propagation of errors into subsequent heat flow calculations, five replicate measurements were performed for each sample, with the mean value adopted for analysis. The results indicate that the thermal conductivity of rocks in the eastern Chenghe Mining Area ranges from 1.95 to 5.07 W/(m·K), with a mean value of 3.32 W/(m·K) (Table 1). The thermal conductivity exhibits significant heterogeneity, with considerable variation even within the same lithological type. Specifically, the thermal conductivity of mudstone ranges from 1.95 to 5.07 W/(m·K), with a mean value of 3.20 W/(m·K), and is predominantly concentrated within the 2.5–3.0 W/(m·K) interval. Sandstone exhibits thermal conductivity values between 2.24 and 4.59 W/(m·K), demonstrating less variability, and has a mean thermal conductivity of 3.41 W/(m·K), primarily distributed in the 3.5–4.0 W/(m·K) range (Figure 2). The higher thermal conductivity of sandstone compared to mudstone is consistent with the distribution patterns of thermal conductivity observed in coal-bearing strata in the North China region.

2.5. Heat Flow Calculation

The calculation of geothermal heat flow typically involves measuring the thermal conductivity of rocks and the vertical geothermal gradient within the same stratum, where the subsurface temperature exhibits a linear variation. The heat flow value is then obtained by multiplying these two parameters [30]. The calculation formula is as follows:
q = G × K
Among these parameters, K represents the thermal conductivity of formation rocks in W/(m·°C), and G denotes the geothermal gradient in °C/100 m. In this study, the “weighted average method” based on the thicknesses of various lithologies in boreholes was employed to calculate the thermal conductivity of mudstone and fine-grained sandstone formations. The calculation formula is as follows [31,32]:
K = D 1 n ( d 1 k 1 + d 2 k 2 + d 3 k 3 + + d n k n ) 1
Among these parameters, K represents the weighted average thermal conductivity of the borehole; k denotes the thermal conductivity of individual rock layers; d signifies the cumulative thickness of each lithological layer within the borehole; and D is the sum of all d values. The calculation results indicate that the thermal conductivities of the corresponding mudstone and fine sandstone formations are 2.56 W/(m·K) and 2.86 W/(m·K), respectively, with both exhibiting vertical anisotropy.

2.6. Numerical Simulation Control Equations

For this simulation, COMSOL Multiphysics 6.2 software was employed to conduct a triple-phase coupled modeling involving heat transfer in solids, porous media, and fluids. The governing heat transfer equation is as follows:
ρ C P T t + ρ C P u · T = · K T + Q
Among these parameters, ρ is the density; K is the thermal conductivity; CP is the specific heat capacity; μ is the dynamic viscosity; u is the velocity.
The governing equation for Darcy’s Law is as follows:
t ρ ε p + · ρ u = Q m
Among these parameters, εP is the porosity.

3. Results and Discussion

3.1. Current Geothermal Field Distribution Characteristics

3.1.1. Geothermal Gradient

Based on the calculated results, present-day geothermal gradient distribution maps for the Bailiang Coalfield and Xizhuo Coalfield were generated (Figure 1). The results show that the geothermal gradient across the entire well sections in the study area ranges from 2.57 to 5.43 °C/hm, with an average of 3.66 °C/hm. This value is higher than those reported for the Ordos Basin (2.9 °C/hm) [32], the Huaibei area (2.5 °C/hm), the Huainan area (2.83 °C/hm) [33], and the Qinshui Basin (2.82 °C/hm) [34]. The spatial distribution of the geothermal gradient is closely associated with the underlying basement structures. The highest values, ranging from 4.5 to 5.0 °C/hm, are found near the F1 fault in the southeastern part of the study area. In contrast, the northeastern region adjacent to the A1 anticline exhibits slightly lower gradients, ranging from 4.0 to 4.5 °C/hm. The lowest geothermal gradient, approximately 3.0 °C/hm, is observed in the central zone between the Xizhuo syncline and the F10 fault in the northwestern part. Areas with geothermal gradients ≥ 3.0 °C/hm account for 88.31% of the total study area, indicating that this region can be classified as a high geothermal anomaly zone.

3.1.2. Heat Flow

Based on the measured geothermal gradients and rock thermal conductivities in the mining area, this study obtained a total of 45 terrestrial heat flow values. The estimation results are summarized in Table 2 and the spatial distribution of heat flow across the study area is presented in Figure 3. In the eastern part of the Chenghe Mining Area, heat flow values range from 66.81 to 128.49 mW/m2, with an average of 90.96 mW/m2. This is significantly higher than the average heat flow reported for the Hancheng area (73.75 mW/m2) [35] and the Ordos Basin (62.0 mW/m2) [36]. Furthermore, all measured values exceed the continental average heat flow of China (63.8 mW/m2) [37], indicating that the region represents a typical high heat flow province. The magnitude of heat flow is comparable to that observed in the northeastern Gonghe Basin, where values also exceed 90 mW/m2 [38]. The spatial distribution of terrestrial heat flow exhibits fundamental consistency with the geothermal gradient pattern. This is manifested by the highest values, predominantly exceeding 100 mW/m2, occurring in the southeastern region surrounding the F1 fault, indicating significant geothermal activity and a pronounced positive thermal anomaly. This phenomenon is likely attributable to the hydraulically conductive nature of the F1 fault, which provides a conduit for the upward migration of subsurface heat flow, resulting in advective heat transport along the fault zone. In contrast, the northern sector of the Xizhuo Syncline in the northwestern area exhibits lower heat flow values, typically ranging between 70 and 85 mW/m2.
Overall, the presence of this high heat flow anomaly is likely controlled by structural factors. The fault systems developed in the southeastern part of the mining area may serve as effective conduits for upward heat migration from deeper crustal sources.

3.2. Research on Thermogenic Mechanism

Based on the aforementioned research analysis, the most pronounced geothermal anomaly zone in the study area is located near the F1 fault. This observation suggests that the F1 fault and its associated secondary faults may play a key role in the formation of geothermal anomalies in the region. To rigorously evaluate this hypothesis, this study conducted a detailed analysis of temperature logs from the study area and applied numerical simulation techniques to investigate and verify the migration patterns of deep-circulating thermal water and the associated heat transfer processes near the F1 fault [39,40].

3.2.1. Temperature Control Mode and Temperature Profile Curve

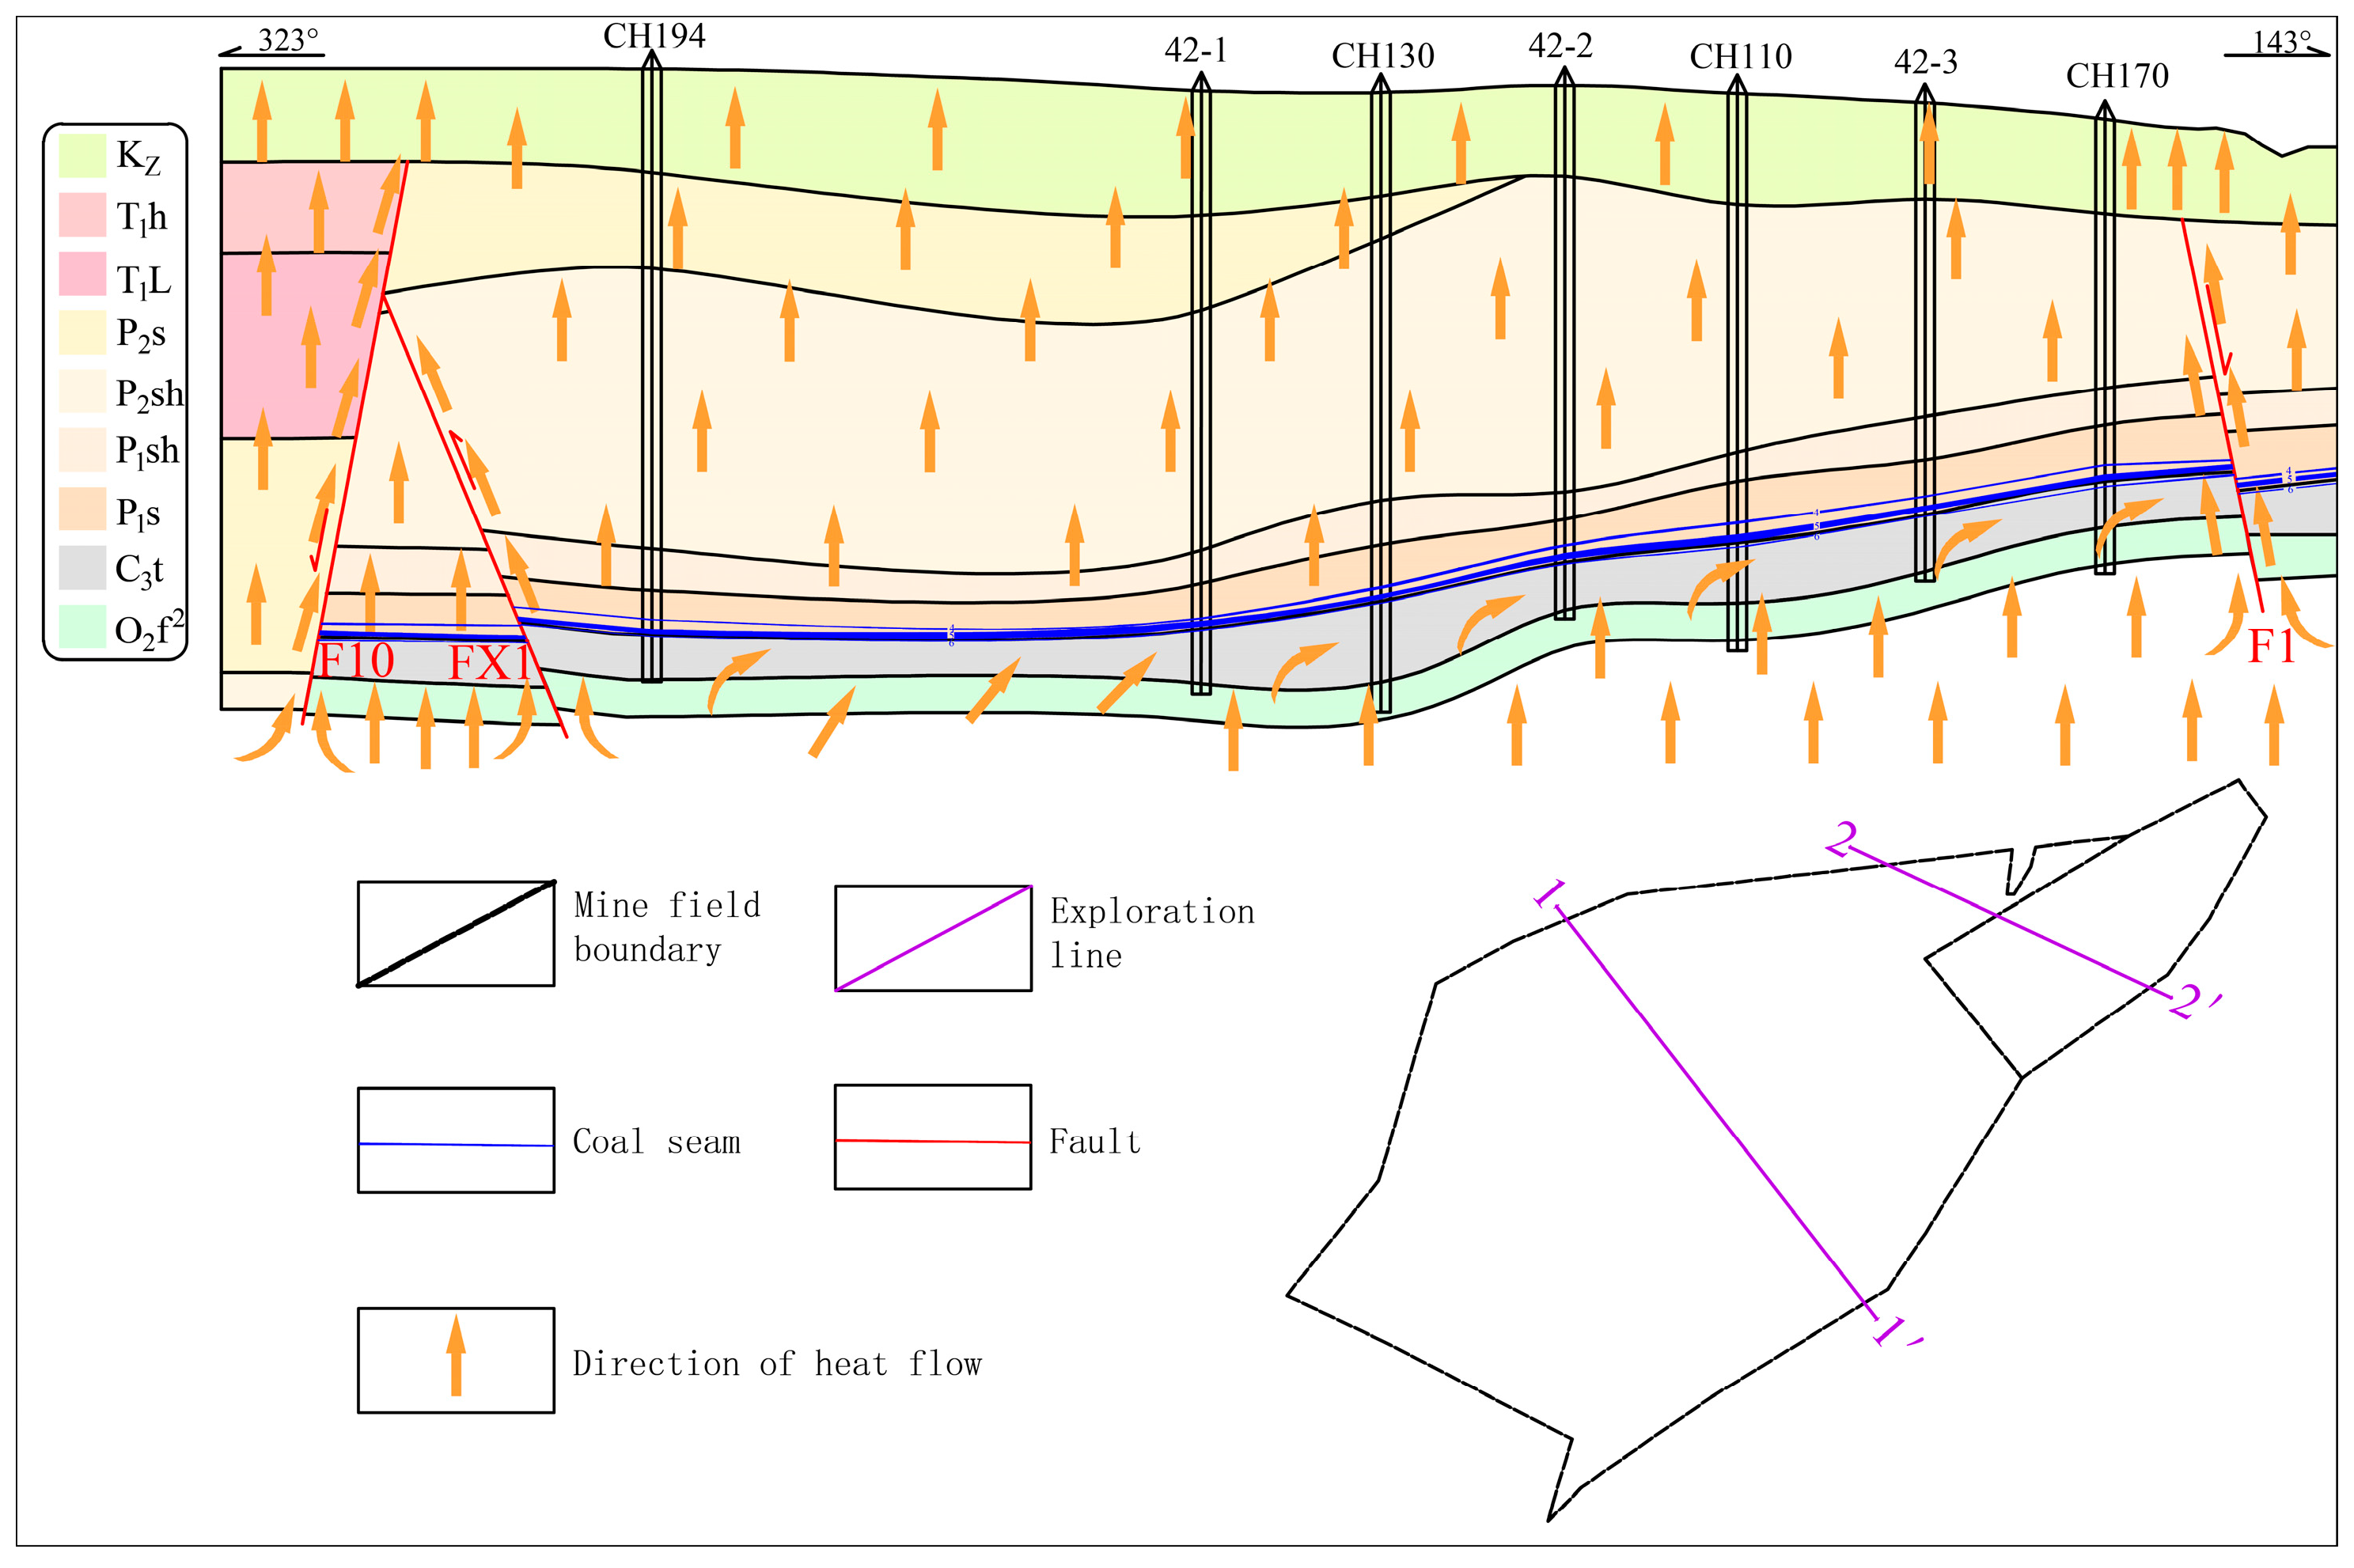
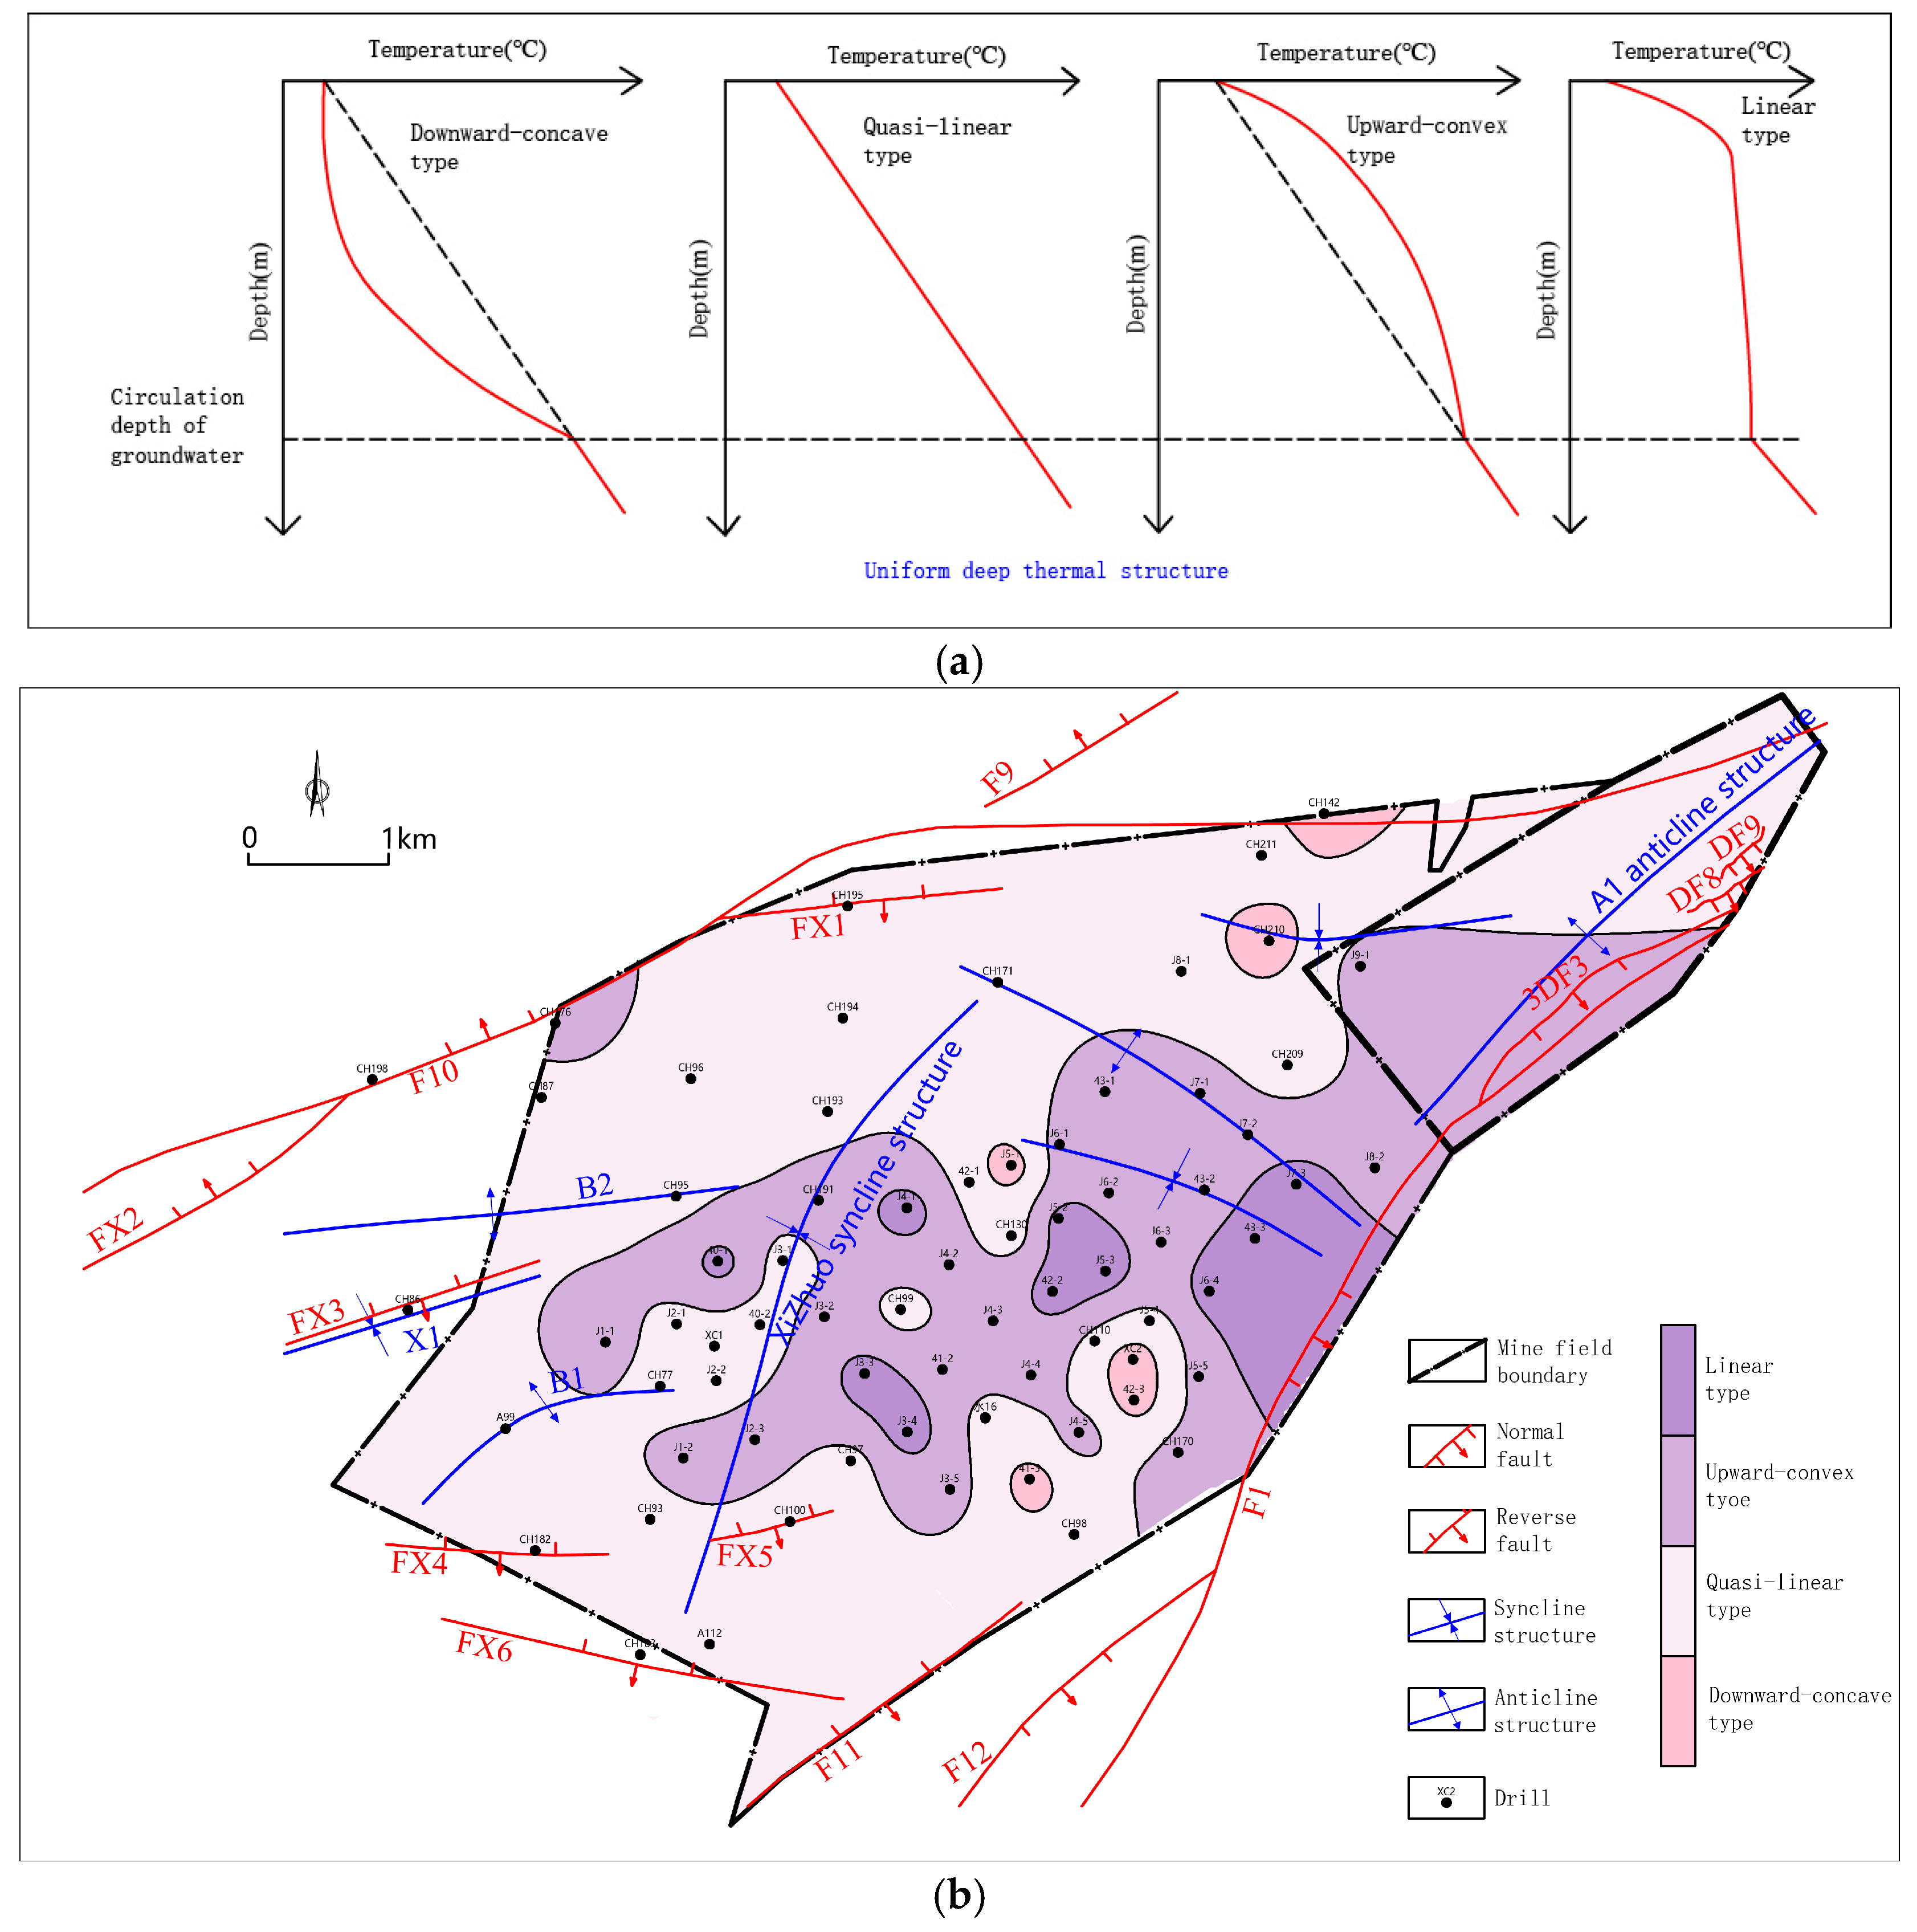
This study systematically analyzed the formation mechanism of geothermal anomalies along the exploratory transect 1–1′ within the study area (Figure 4). Based on 77 borehole temperature measurement datasets (Due to the instantaneous nature of the temperature measurements in boreholes XC1 and XC2, the neutral temperature point cannot be reliably determined, consequently resulting in lower data accuracy and their subsequent exclusion from the dataset.), the temperature–depth profiles were categorized into four distinct types—concave, linear, convex, and straight (Figure 5a)—with their spatial distribution shown in Figure 5b. As illustrated in Figure 4, deep heat transfer is primarily governed by coal seams and fault structures. Due to their low thermal conductivity, coal seams function as thermal insulators, impeding vertical heat flow and promoting lateral heat migration along the strata beneath the coal layers. This process results in localized heat accumulation and the formation of geothermal anomalies, representing a typical “coal seam insulation–stratigraphic superposition” thermal control model. In contrast, fault zones act as preferential conduits for upward heat transfer, enabling the movement of thermal energy along fault planes to shallower depths, thereby influencing the regional geothermal distribution. Figure 4 shows that straight-type temperature profiles are predominantly located near the F1 fault in the southeastern part of the study area. Given the hydrogeological setting of this zone as a groundwater discharge area, it is inferred that a well-connected high-temperature fluid reservoir—i.e., a geothermal reservoir unit—has developed in the vicinity of the F1 fault.
In summary, two primary thermal control mechanisms contribute to the significant geothermal anomalies observed in the study area: the “fault-controlled deep-circulation hydrothermal upwelling” mechanism and the “coal seam thermal resistance–folding” mechanism. The main heat-transport pathways are the F1 fault and its associated secondary fracture zones. The heat transfer process involves groundwater being heated by surrounding rocks during deep circulation, followed by upward migration along hydraulically conductive fault zones in the form of hydrothermal fluids. This ascending heated water serves as an additional heat source, warming the surrounding rock mass and ultimately leading to the formation of localized geothermal anomalies.

3.2.2. Numerical Simulation

To further validate the aforementioned findings, this study employs a coupled numerical model of fluid flow and heat transfer. The simulation focuses on the F1 and 3DF3 faults within the Bailiang Coal Mine. A representative cross-section along exploratory line 2–2′ near these faults was selected to develop a triple-coupled model that integrates solid heat transfer, porous media heat transfer, and fluid-driven thermal convection. This approach facilitates a comprehensive analysis of the seepage–temperature coupling phenomena in the deep rock masses of the mining area. The numerical simulation of the geothermal field was conducted using specialized simulation software.
(1) Model setup
This study employed the finite element method to conduct transient numerical simulations. Based on the actual dimensions and characteristics of the 2-2′ profile, an equivalently scaled three-dimensional numerical model was established. The model extends 2000 m along the profile, with a vertical depth range from 0 to −800 m and a lateral width of 1500 m. The geological framework of the model comprises two major fault zones and six stratigraphic units, which, in descending order, are the unconsolidated layer, the Sunjiagong Formation, the Upper Shihezi Formation, the Lower Shihezi Formation, the Shanxi Formation, and the underlying Taiyuan Formation. The temperature and depth of the constant temperature zone used in the simulation were set according to the determined values above, and the initial temperature at the model boundaries was uniformly set to 293.1 K. Since the geothermal heat flow values derived in this study correspond to the average heat flow values of the strata beneath the loose layer in each borehole, the baseline heat flow was taken as the average value for the study area, 90.96 mW/m2. Given the presence of high-temperature confined water in the limestone aquifer and the permeability of the F1 fault, the water table in the region’s Ordovician limestone is approximately +380 m, while the elevation of the fault’s top and surface are +275.16 m and +73.76 m, respectively. After calculations, the pressure at the top and bottom of the fault were assigned values of 1 MPa and 3 MPa, respectively, with the bottom temperature set at the measured temperature of well 39-2, 310 K. Based on temperature data, it was concluded that the F1 fault intersects the fault zone and exhibits relatively high temperatures. It was inferred that the high-temperature water in the limestone aquifer is transported through the fault zone, which contributes to the present geothermal field characteristics. Therefore, F1 was selected as the water-conducting fault, with fluid heat transfer considered. The transient simulation was solved over a total time period of 60 years. To determine the most suitable time step, a sensitivity analysis was conducted by comparing simulation results for Δt = 0.02 s, 0.01 s, and 0.005 s while fixing the total time to 60 years. The results indicated that when Δt ≤ 0.02 s, the change in key output values (such as maximum strain energy) was less than 1%. Therefore, Δt = 0.02 s was ultimately selected. The thermodynamic properties of each layer are shown in Table 3, referencing the work of Yu et al. [41] and Wang et al. [42]. Based on the selected parameters and given boundary conditions, a flow-heat coupled finite element numerical analysis was performed for the geometry model of this simulation, with mesh division, computational unit generation, and mesh model output for numerical calculation.
(2) Analysis of simulation results
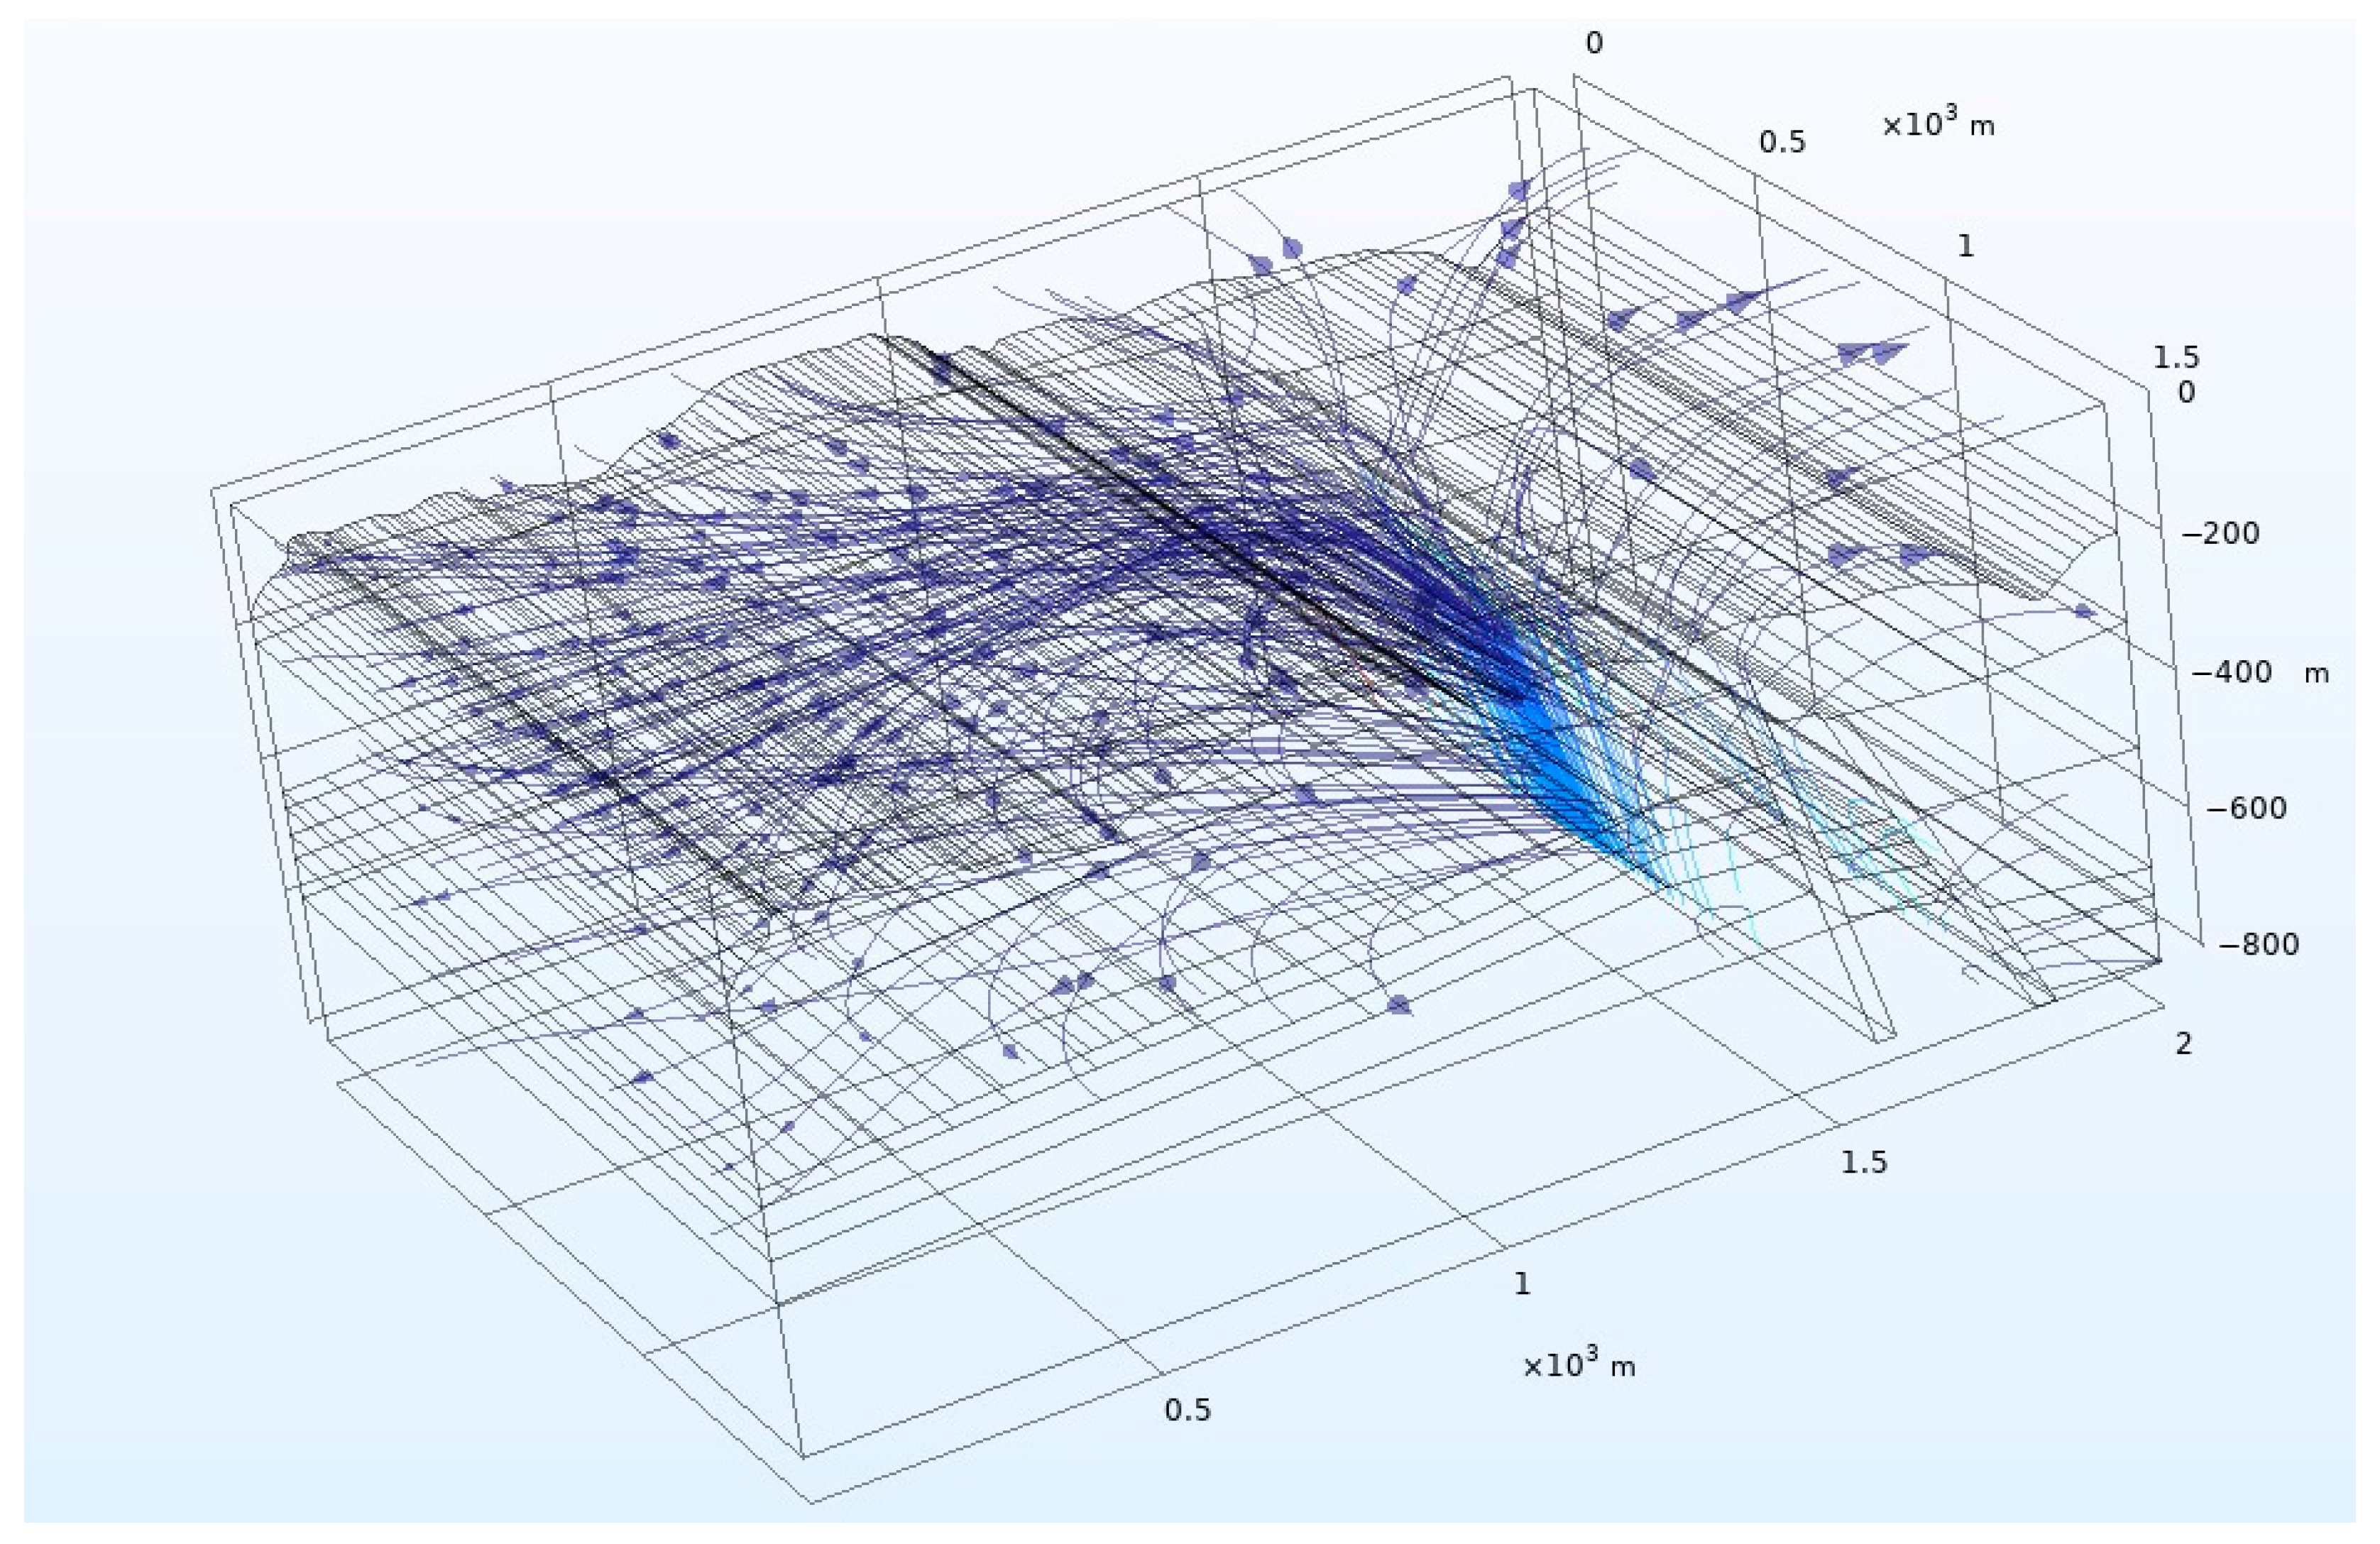
Figure 6 presents the flow field simulation results based on Darcy’s Law. As shown in the figure, the hydraulic pressure distribution within the system reaches a relatively stable state. Faults function as highly permeable pathways, exhibiting significantly higher hydraulic conductivity compared to the surrounding rock matrix, and thus serve as the primary conduits for fluid migration, transmitting hydraulic pressure to adjacent strata [43]. Due to the pronounced pressure difference between the top and bottom of the fault zone, pore water pressure within the fault increases, resulting in the formation of a distinct hydraulic gradient [44,45]. Driven by this pressure differential, high-temperature groundwater from deep reservoirs continuously infiltrates into the fault fractures and migrates upward along the fault zone into shallower formations [46,47,48]. This process not only facilitates the redistribution of heat flow but also exerts a significant influence on the thermal structure of the shallow geothermal field.
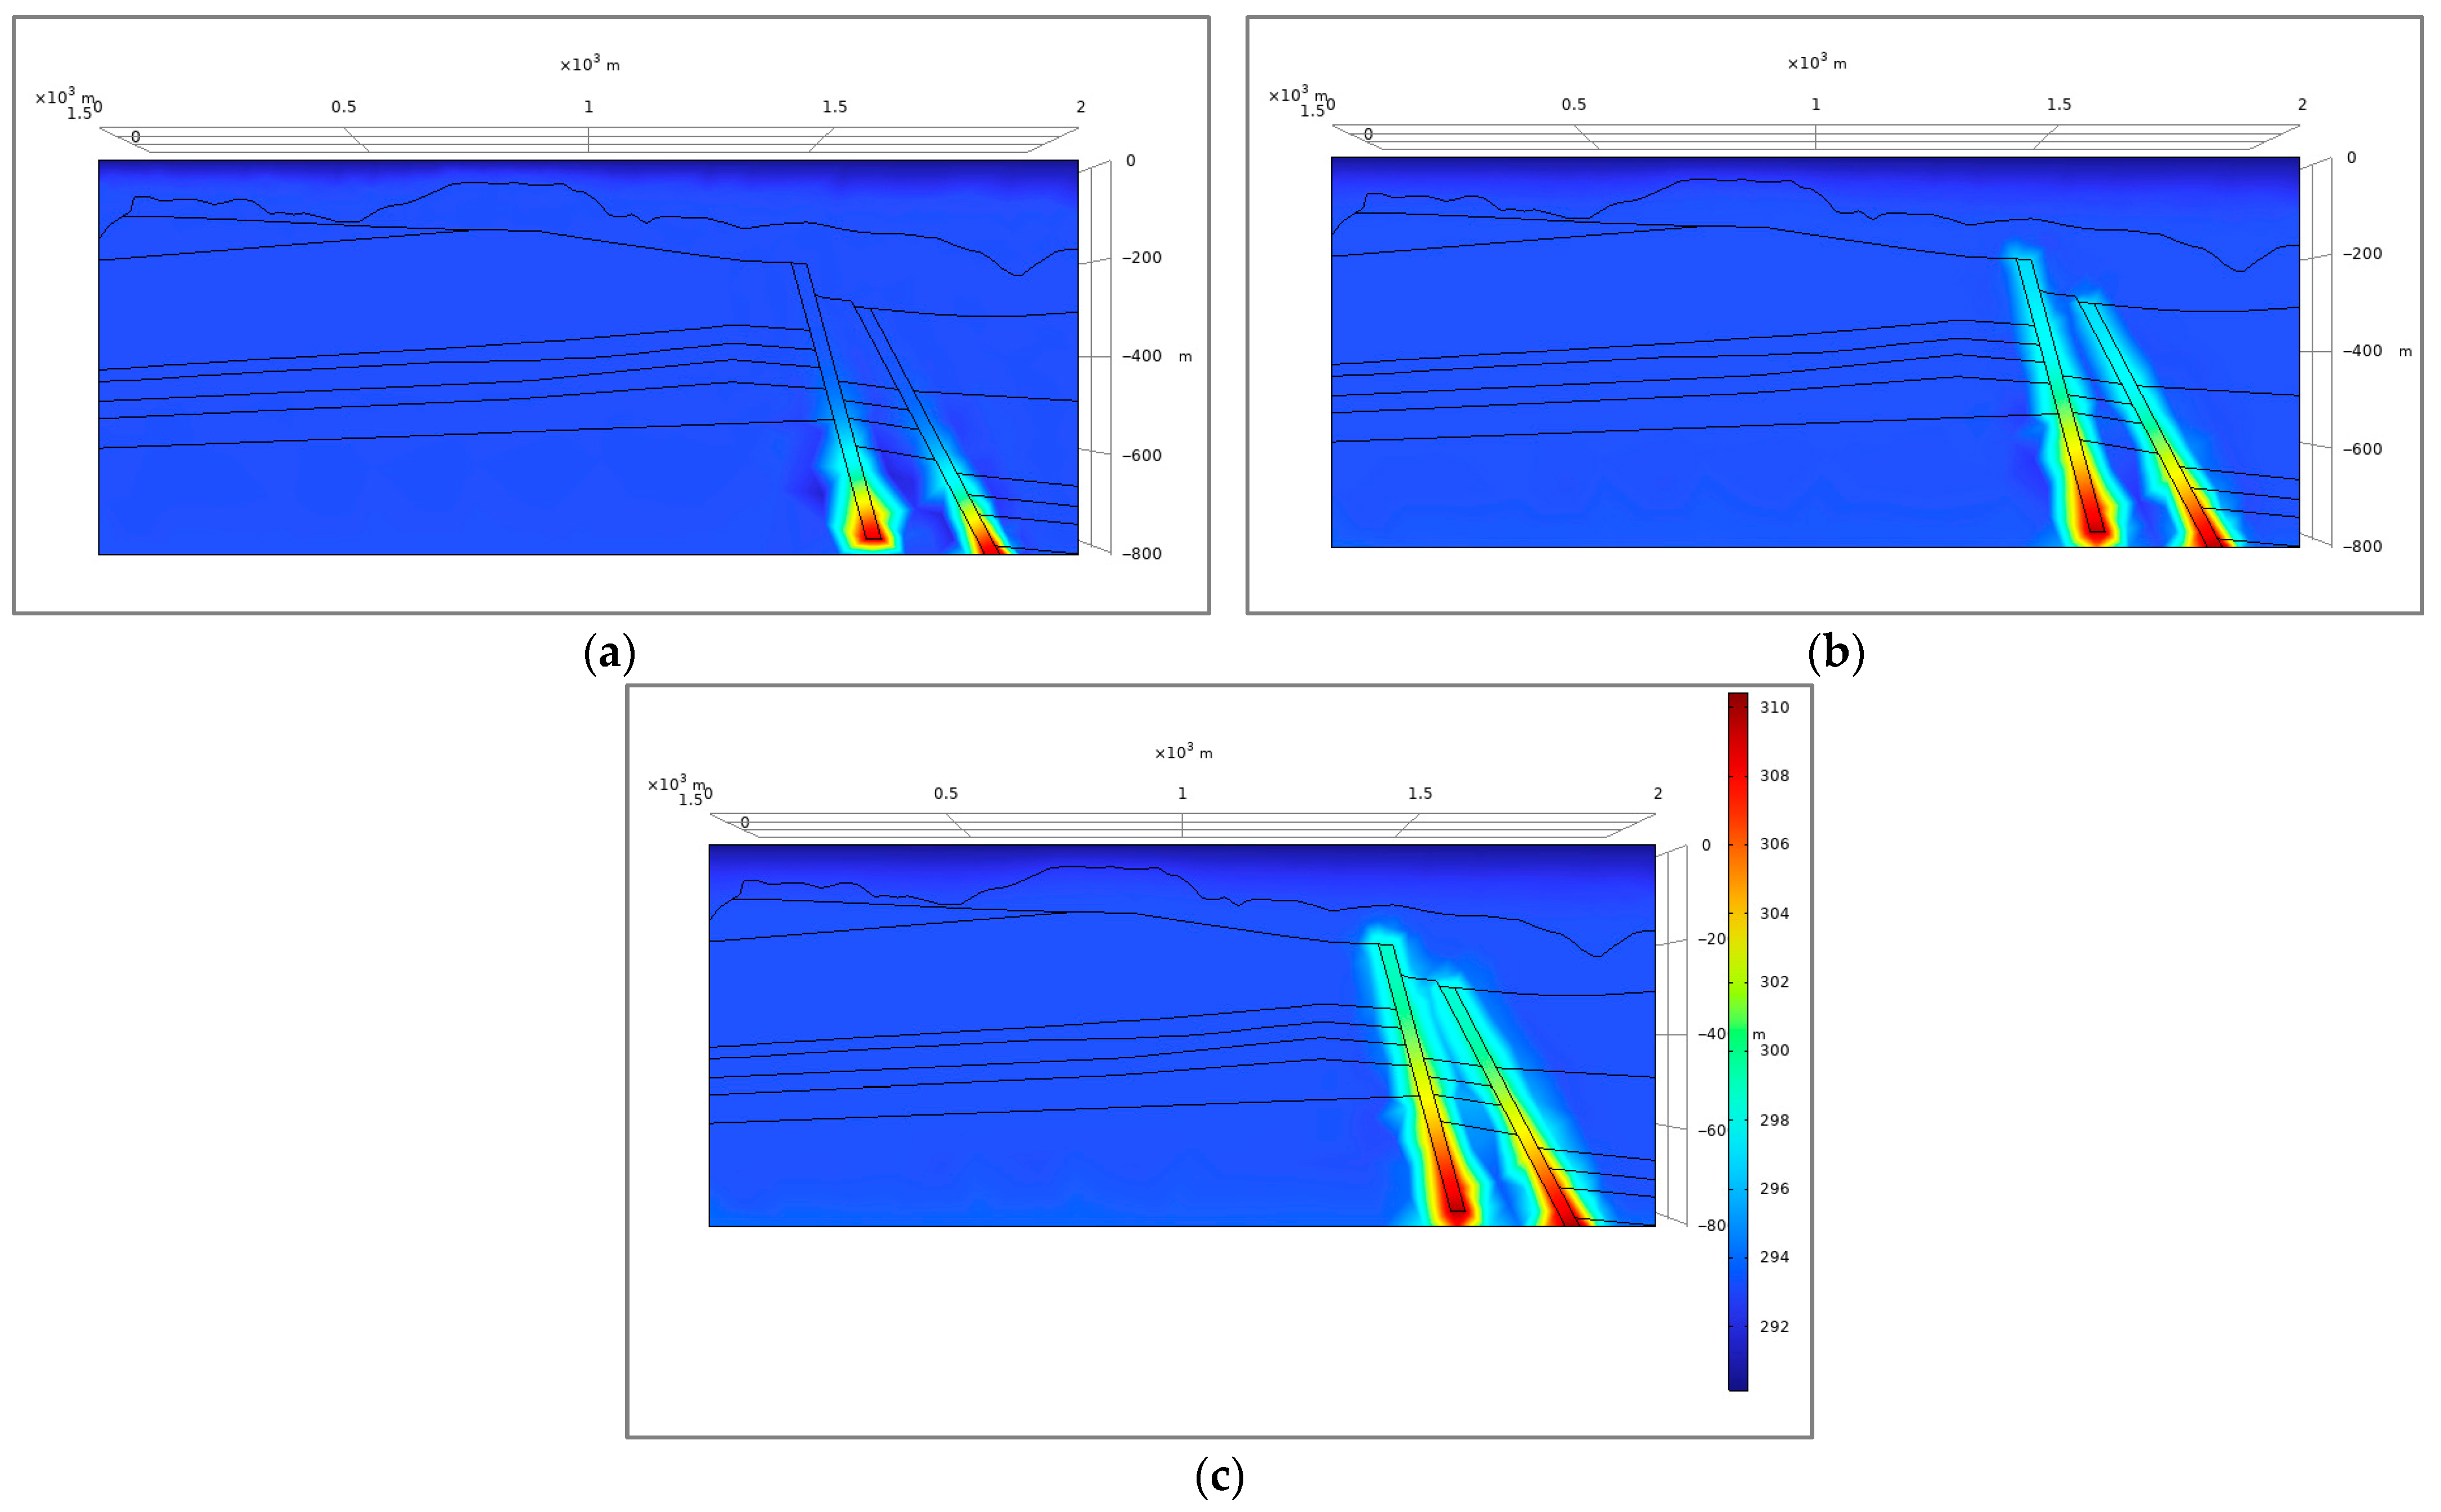
Figure 7 illustrates the simulation results of the temperature field evolution within the fault zone at different time steps. The results show that during the initial stage, the influx of high-temperature groundwater from depth into the fault zone rapidly exchanges heat with the surrounding rock, leading to a sharp increase in rock temperature and the formation of a localized high-temperature anomaly. As time progresses, the thermally affected zone expands both upward and laterally, with the high-temperature region gradually extending upward along the fault. By t = 60 years, the high-temperature zone has reached the mid-section of the fault. Notably, both the magnitude of temperature change and the heating rate decrease significantly with increasing distance from the base of the fault, indicating the gradual attenuation of thermal energy during heat transfer. This observation suggests that while thermal convection dominates within the fault zone, thermal conduction still exerts a significant influence on the spatial distribution of the temperature field.
Figure 8 presents the simulation results, which clearly demonstrate significant disturbances in the temperature field near the fault zones. A stable upward hydraulic head is generated within the faults, indicating the presence of a distinct groundwater upwelling zone. This phenomenon suggests that fluid convection within the faults substantially modifies the local thermal structure. The isotherms within and around the F1 and 3DF3 faults exhibit an upward-bulging morphology, characterizing a pronounced positive thermal anomaly. At the same depth, temperatures within the faults are higher than those in the surrounding rock. In the central part of the fault, temperatures range from 306 to 312 K, which is 6–10 K higher than in thermally stable areas. This indicates that groundwater, heated at depth, migrates upward along these faults due to their enhanced permeability relative to the surrounding formations, transporting deep thermal energy to shallower depths and resulting in a concentrated geothermal anomaly near the top of the fault zone. In regions influenced by fault-related heat transfer, the temperature field is markedly altered, with isotherms arched upward along the fault and gradually decreasing laterally away from it. In contrast, areas not affected by fault-driven thermal advection maintain a heat transfer regime dominated by solid conduction and porous media conduction, exhibiting a steady upward-decreasing thermal gradient. However, variations in the thermal conductivity of the rock masses lead to differences in the rate of temperature change across different regions.
In summary, the characteristics of the temperature field in the study area are predominantly controlled by fault structures and the presence of deep aquifers. Groundwater undergoing deep circulation is heated by high-temperature rocks and functions as a primary medium for heat transport. Utilizing the F1 and 3DF3 faults as major conduits, this heated groundwater transports deep-seated thermal energy upward along the fault planes, generating localized geothermal anomalies in the shallow crust and shaping the current pattern of temperature anomalies observed in the region.
(3) Validation of simulation reliability
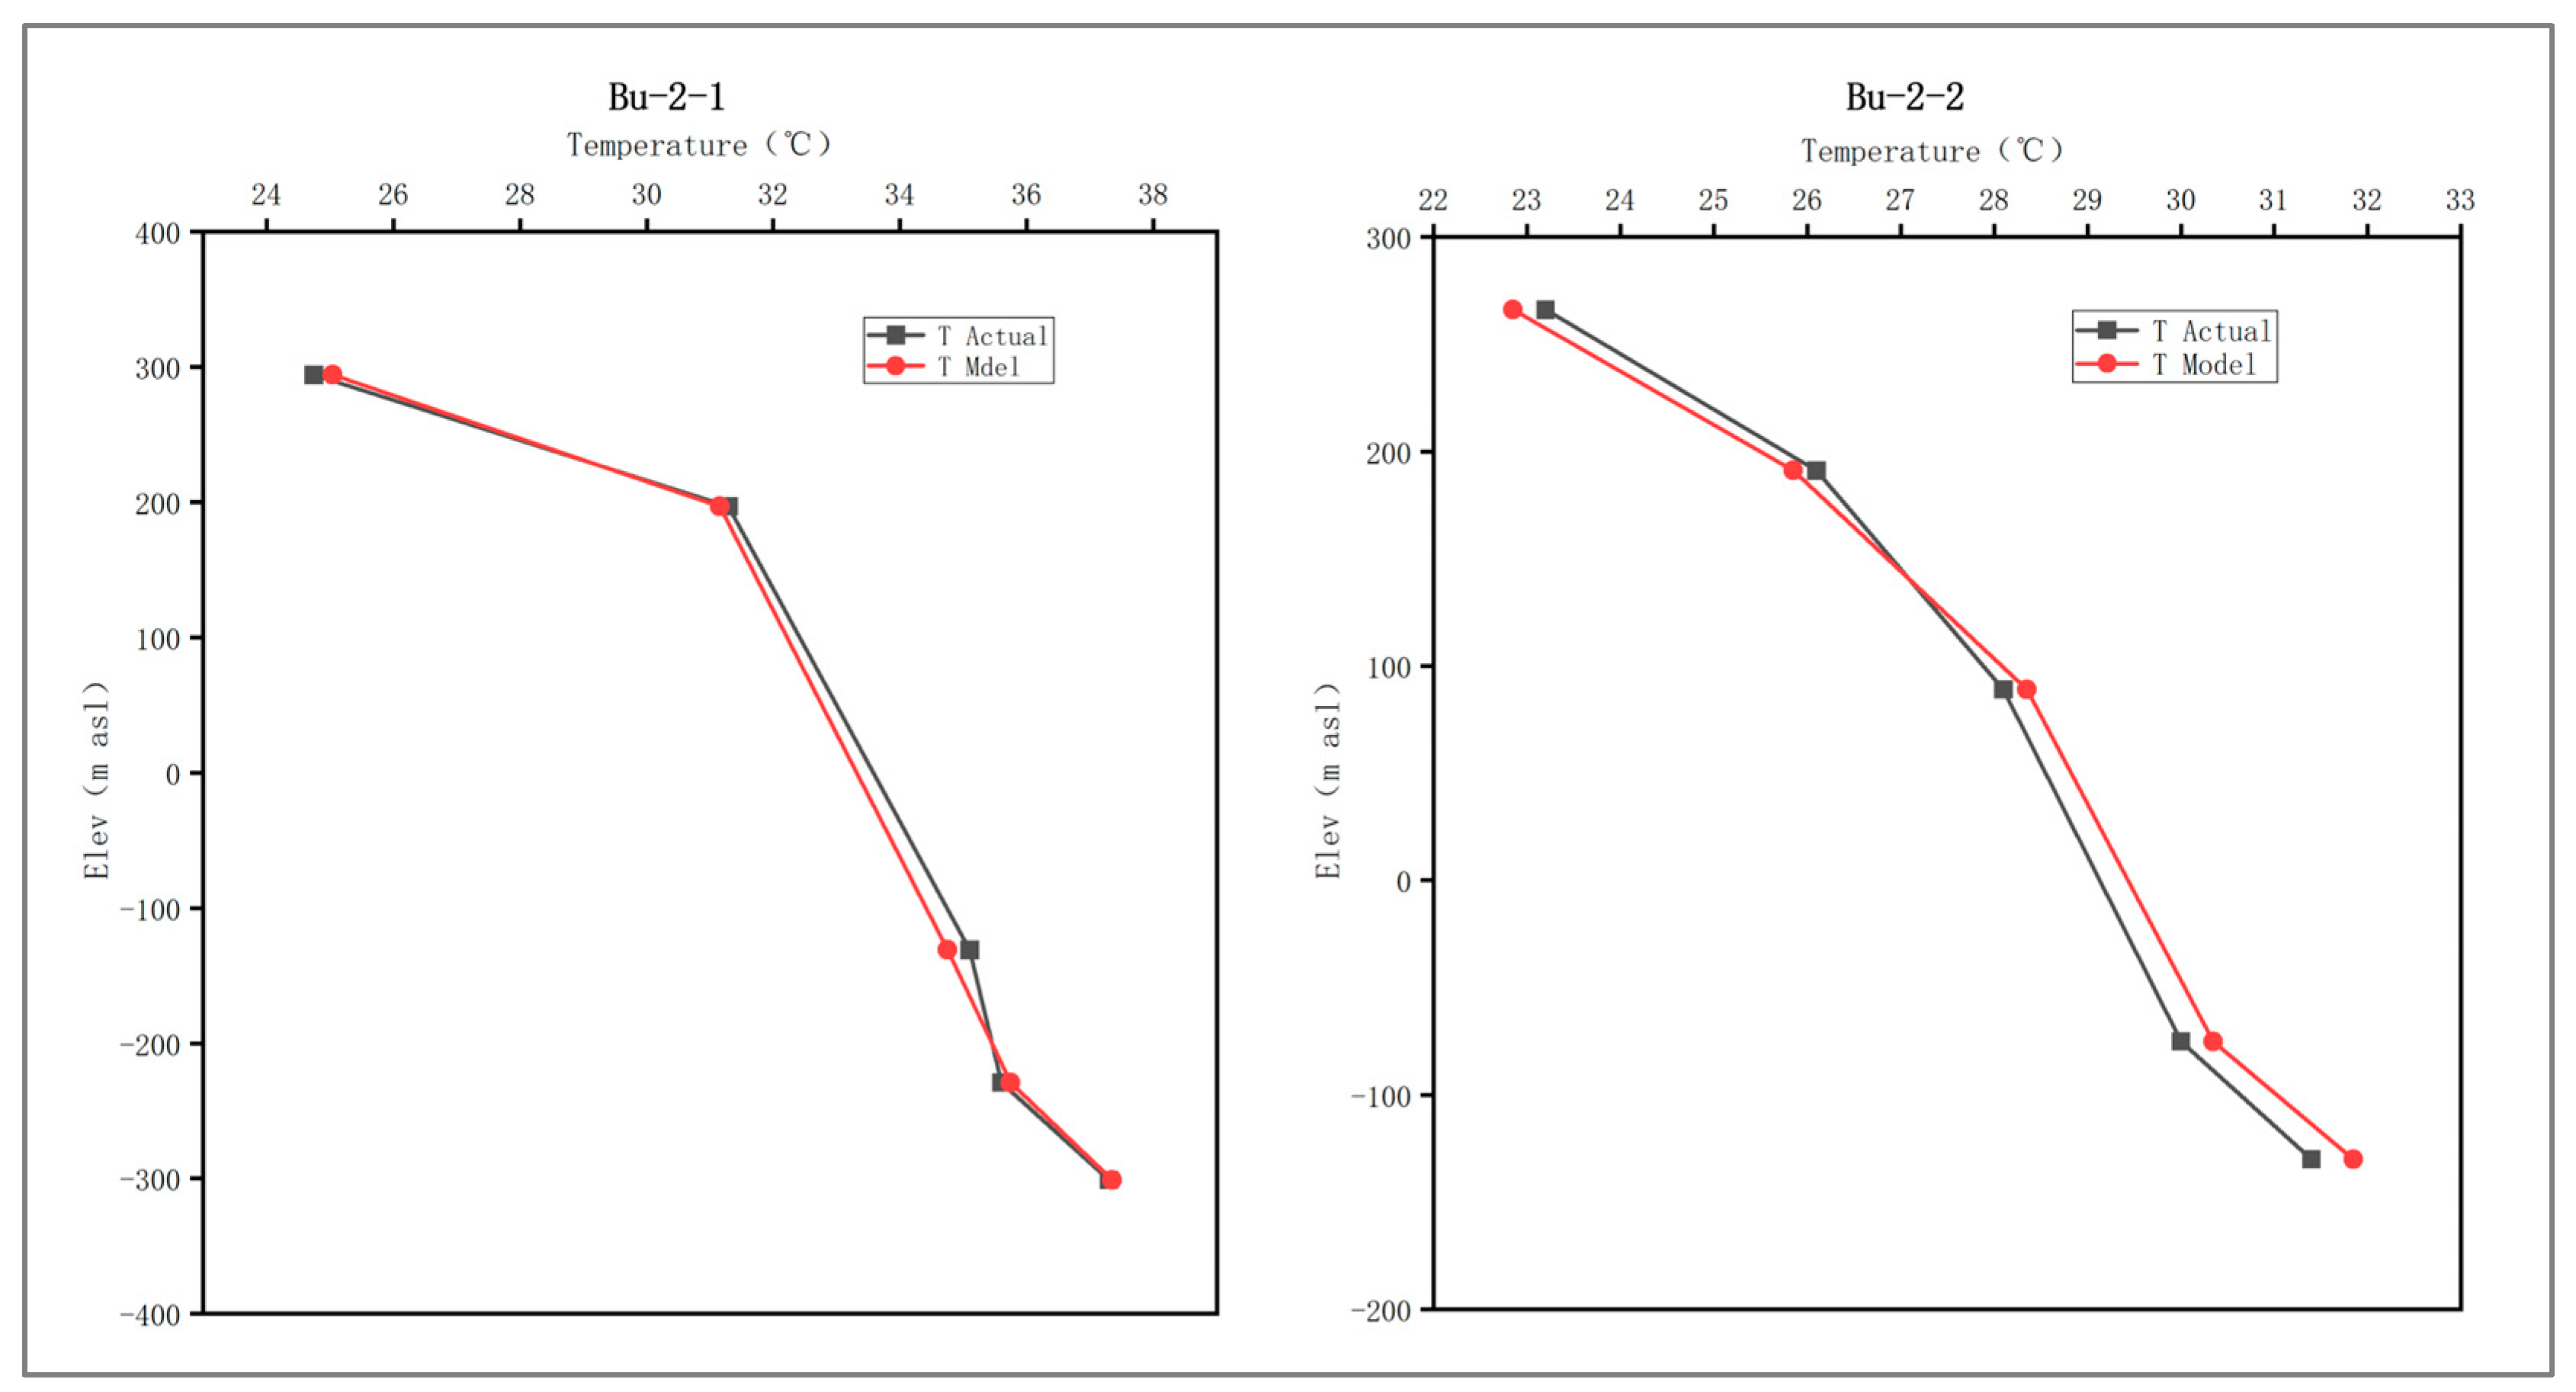
To validate the reliability of the simulation results, a comparison was conducted between the measured data from boreholes Bu-2-1 and Bu-2-2, located near the simulated fault zone, and the corresponding simulation outputs. The results show minimal discrepancies between the measured temperatures and the numerically simulated values at these boreholes (Figure 9). The simulated geothermal gradients at the locations of Bu-2-1 and Bu-2-2 are 2.8 °C/hm and 2.5 °C/hm, respectively, while the measured values are 2.8 °C/hm and 2.4 °C/hm, demonstrating a high degree of consistency. This comparison provides strong evidence for the high reliability of the numerical simulation conducted in this study. Moreover, these results confirm the accuracy of the previously estimated heat flow values in the eastern Chenghe Mining Area and offer a solid foundation and reference for future investigations into temperature conditions in deeper formations within the mining area.

4. Conclusions

This study compiled borehole temperature logging data from the Chenghe Mining Area and systematically analyzed the characteristics of the present-day geothermal field as well as the controlling factors of regional heat flow. The migration patterns of deep groundwater and heat transfer mechanisms were thoroughly investigated. The results indicate that the eastern part of the Chenghe Mining Area exhibits high geothermal gradients and terrestrial heat flow values. The geothermal gradient ranges from 2.57 to 5.43 °C/hm, with a mean value of 3.66 °C/hm, while the terrestrial heat flow varies between 66.81 and 128.49 mW/m2, averaging 90.96 mW/m2, confirming it as a typical geothermal anomaly zone. The region near the F1 fault in the southeastern part of the study area represents the primary high heat flow zone.The formation of geothermal anomalies in the area is significantly controlled by water-conducting faults, with additional influence from low-thermal-conductivity coal seams that impede heat transfer. Based on this, the thermal regimes governing the severe geothermal anomalies in the eastern Chenghe Mining Area are classified into two types: a “fault-controlled deep-circulation hydrothermal upwelling” model and a “coal seam thermal resistance-folding” model. Both temperature curve categorization and numerical simulations consistently demonstrate that the main heat conduction pathways are the F1 fault and its secondary fractures. Heat transfer within the study area is dominated by thermal convection driven by groundwater migration. The heating mechanism is interpreted as follows: groundwater is heated by surrounding rocks during deep circulation, and the heated water ascends through water-conducting faults, acting as an additional heat source that warms the surrounding rock mass, thereby forming localized thermal anomalies. The findings of this study not only provide direct guidance for safe production in the Chenghe Mining Area but also establish a universal theoretical framework for understanding the genesis of geothermal hazards in mining districts with strong tectonic activity in northwestern China.

Author Contributions

T.P.: conceptualization, resources, funding acquisition, writing review and editing; M.W.: investigation, formal analysis, visualization, writing—original draft; X.G.: investigation, visualization; S.C.: investigation, visualization, formal analysis; Y.D.: methodology, writing review and editing; S.W.: conceptualization, resources, writing review and editing; Z.R.: conceptualization, resources; Y.C.: conceptualization, resources. All authors have agreed to their contributions. All authors have read and agreed to the published version of the manuscript.

Funding

This research received no external funding.

Data Availability Statement

The original contributions presented in this study are included in the article. Further inquiries can be directed to the corresponding author.

Conflicts of Interest

Author Ziqiang Ren was employed by the company Changjiang Institute of Survey, Planning, Design and Research Co., Ltd. The remaining authors declare that the research was conducted in the absence of any commercial or financial relationships that could be construed as a potential conflict of interest.

References

  1. Jiyang, W.; Zhonghe, P.; Yuanzhi, C.; Yonghui, H.; Guangzheng, J.; Zhenneng, L.; Yanlong, K. Global geothermal energy development and utilization: Current status and prospects. Sci. Technol. Rev. 2023, 41, 5–11. [Google Scholar]
  2. Wang, J.Y.; Kong, Y.L.; Duan, Z.F.; Jixiong, Z.; Xilian, L.; Yonghui, H.; Naning, L.; Yuanzhi, C.; Nan, Z.; Weizun, Z.; et al. Geothermal energy exploitation and storage in coal field under the dual carbon goal. Coal Geol. Explor. 2023, 51, 1–11. [Google Scholar]
  3. Cai, M.F.; Xue, D.L.; Ren, F.H. Current status and development strategy of metal mines. Chin. J. Eng. 2019, 41, 417–426. [Google Scholar]
  4. Wang, C.; Lu, S.; Li, M.; Zhang, Y.; Sa, Z.; Liu, J.; Wang, H. Study on the dust removal and temperature reduction coupling performances of magnetized water spray. Environ. Sci. Pollut. Res. 2022, 29, 6151–6165. [Google Scholar] [CrossRef]
  5. Chen, W.; Liang, S.Q.; Liu, J. Proposed split-type vapor compression refrigerator for heat hazard control in deep mines. Appl. Therm. Eng. 2016, 105, 425–435. [Google Scholar] [CrossRef]
  6. Xu, Y.; Chen, L.; Zhang, J.; Haiwei, J. Research Progress of Heat Damage Prevention and Control Technology in Deep Mine. Sustainability 2025, 17, 6200. [Google Scholar] [CrossRef]
  7. Guo, Q.H. Hydrogeochemistry of high-temperature geothermal systems in China: A review. Appl. Geochem. 2012, 27, 1887–1898. [Google Scholar] [CrossRef]
  8. Yang, P.; Cheng, Q.; Xie, S.; Wang, J.; Chang, L.; Yu, Q.; Zhan, Z.; Chen, F. Hydrogeochemistry and geothermometry of deep thermal water in the carbonate formation in the main urban area of Chongqing, China. J. Hydrol. 2017, 549, 50–61. [Google Scholar] [CrossRef]
  9. Zhang, L.; Chen, S.; Zhang, C. Geothermal power generation in China: Status and prospects. Energy Sci. Eng. 2019, 7, 1428–1450. [Google Scholar] [CrossRef]
  10. Wang, Y.C.; Li, L.; Wen, H.G.; Hao, Y. Geochemical evidence for the nonexistence of supercritical geothermal fluids at the Yangbajing geothermal field, southern Tibet. J. Hydrol. 2022, 604, 127243. [Google Scholar] [CrossRef]
  11. Giambiagi, L.; Álvarez, P.; Spagnotto, S.; Godoy, E.; Lossada, A.; Mescua, J.; Barrionuevo, M.; Suriano, J. Geomechanical model for a seismically active geothermal field: Insights from the Tinguiririca volcanic-hydrothermal system. Geosci. Front. 2019, 10, 2117–2133. [Google Scholar] [CrossRef]
  12. Goswami, S.; Abhishek, K.; Subhasish Tripathy, R. Re-visiting Geothermal Fluid Circulation, Reservoir Depth and Temperature of Geothermal Springs of India. J. Hydrol. 2022, 610, 128131. [Google Scholar] [CrossRef]
  13. Wang, G.L.; Lin, W.J. Formation mechanisms and genetic models of major hydrothermal geothermal systems in China. Acta Geol. Sin. 2020, 94, 1923–1937. [Google Scholar]
  14. Pruess, K.; Oldenburg, C.M.; Moridis, G. TOUGH2 User’s Guide, Version 2; Lawrence Berkeley National Laboratory: Berkeley, CA, USA, 1999. [Google Scholar]
  15. Yin, X.X.; Lin, J.W.; Li, H.; Li, H.; Dong, L.; Yan, J.; Zhang, S.; Li, Z. Hydrothermal Control by Deep Hidden Faults on Geothermal Systems in Sedimentary Basins: A Case Study of the Cangdong Fault in the North China Basin. Acta Geol. Sin. 2025, 99, 243–257. [Google Scholar] [CrossRef]
  16. Yang, Z.; Luo, Z.; Han, J. Genesis Mechanism of Geothermal Water in Binhai County, Jiangsu Province, China. Water 2025, 17, 1542. [Google Scholar] [CrossRef]
  17. Zhen, Z.; Chuanlong, H.; Guangxiong, Q.; Baizhong, Y. Hydrogeochemical Characteristics and Genesis Analysis of High-Salinity Geothermal Water in the Haihu New District, Xining City. Geofluids 2025, 99, 243–257. [Google Scholar]
  18. Fan, Z.; Parashar, R. Analytical Solutions for a Wellbore Subjected to a Non-isothermal Fluid Flux: Implications for Optimizing Injection Rates, Fracture Reactivation, and EGS Hydraulic Stimulation. Rock Mech. Rock Eng. 2019, 52, 4715–4729. [Google Scholar] [CrossRef]
  19. Fan, Z.; Eichhubl, P.; Newell, P. Basement fault reactivation by fluid injection into sedimentary reservoirs: Poroelastic effects. J. Geophys. Res. Solid. Earth 2019, 124, 7354–7369. [Google Scholar] [CrossRef]
  20. Peng, T.; Liu, K.X.; Chen, Y.; Wang, F.; Li, B. Main Controlling Factors and Formation Mode of Geothermal Anomaly in Eastern Chenghe Mining Area of Weibei Coalfield. Geofluids 2022, 2022, 3209790. [Google Scholar] [CrossRef]
  21. Wang, Z.T.; Zhang, C.; Jiang, G.Z.; Hu, J.; Tang, X.C.; Hu, S.B. Characteristics and genetic mechanism of the present-day geothermal field in the Xiong’an New Area. Chin. J. Geophys. 2019, 62, 4313–4322. [Google Scholar]
  22. Hong, Y.M. Logging Principles and Comprehensive Interpretation; China University of Petroleum Press: Dongying, China, 1993; p. 38. [Google Scholar]
  23. Wang, H.Y.; Liu, S.W.; Lei, X. Characteristics of the present-day geothermal field in the Lower Yangtze region of South China. J. China Coal Soc. 2013, 38, 896–900. [Google Scholar]
  24. Rao, S.; Hu, S.B.; Zhu, C.Q.; Xiao-Yin, T.; Wei-Wei, L.; Ji-Yang, W. The characteristics of heat flow and lithospheric thermal structure in Junggar Basin, northwest China. Chin. J. Geophys. 2013, 56, 2760–2770. [Google Scholar]
  25. Tan, J.Q.; Ju, Y.W.; Hou, Q.L.; Zhang, W. Distribution characteristics of the present-day geothermal field and its influencing factors in Sulin Mining Area, Huaibei Coalfield. Chin. J. Geophys. 2009, 52, 732–739. [Google Scholar]
  26. Zhong, S.X. Discussion on the correction of simple temperature logging curves. Coal Geol. Explor. 1985, 4, 48–51. [Google Scholar]
  27. Luo, Y.; Ju, Y.W.; Tan, J.Q. Characteristics of the present-day geothermal field and prediction of high-temperature thermal hazards in the Suntan-Zhaoji Exploration Area. J. Grad. Univ. Chin. Acad. Sci. 2011, 28, 734–739. [Google Scholar]
  28. Tan, J.Q.; Ju, Y.W.; Zhang, W.Y.; Hou, Q.; Tan, Y. Terrestrial heat flow in the central-southern Huaibei Coalfield and its implications for coalbed methane resources. Sci. China Ser. D Earth Sci. 2010, 40, 855–865. [Google Scholar]
  29. Mraidi, I.; El Asmi, A.M.; Skanji, A.; El Asmi, K.; Saidi, M. New insights on source rock maturation in the southern Gulf of Gabes (Tunisia) via 1-D modeling: Effect of combined corrected borehole temperature and thermal conductivity on heat flow distribution. Arab. J. Geosci. 2021, 14, 773. [Google Scholar] [CrossRef]
  30. Boumehdi, M.; Hahou, Y.; Amrouch, K.; Berkat, N.E. New assessment of geothermal resources in Morocco: Evaluation of the curie point depth method using magnetic data for geothermal gradient and heat flow estimation. Sci. Afr. 2025, 28, e02726. [Google Scholar] [CrossRef]
  31. He, Z.G.; Liu, C.Y.; Zhao, J.F. A Study on Geothermal Field and Its Geological Significance in Southern Area of the North China Craton. Geol. Review. 2009, 55, 428–433. [Google Scholar]
  32. Qi, K. A Preliminary Study on the Meso-Cenozoic Thermal Regime and Lithospheric Dynamic Evolution of the Ordos Basin. Ph.D. Thesis, Northwest University, Xi’an, China, 2018. [Google Scholar]
  33. Wang, Z.T.; Gu, C.C.; Lu, H.F.; Wang, Y.B.; Hu, S.B.; Jiang, G.Z.; Zhang, C. Impact of thrust nappe structures on regional geothermal field distribution in the Lianghuai area. Earth Sci. Front. 2025, 1–18. [Google Scholar] [CrossRef]
  34. Sun, Z.X.; Zhang, W.; Hu, B.Q.; Pan, T.-Y. Terrestrial heat flow and geothermal field characteristics in the Qinshui Basin. Chin. J. Geophys. 2006, 49, 130–134. [Google Scholar]
  35. Wang, J.Y.; Huang, S.P. Compilation of terrestrial heat flow data in the Chinese mainland (2nd edition). Seismol. Geol. 1990, 4, 351–366. [Google Scholar]
  36. Pang, Z.H.; Duan, Z.F. Accumulation patterns and exploitation and utilization targets of geothermal resources in the coal-bearing area in North China. Coal Geol. Explor. 2024, 52, 14–22. [Google Scholar]
  37. Liu, F.; Wang, G.L.; Jiang, G.Z.; Hu, S.B.; Zhang, W.; Lin, W.J.; Liu, J.H.; Zhang, X.Y.; Qu, Z.W.; Liao, C.Z. New progress and insights into terrestrial heat flow measurements in continental China. Earth Sci. Front. 2024, 31, 19–30. [Google Scholar]
  38. Wang, Y.; Lin, W.; Lu, R.; Zhu, J. Terrestrial heat flow and heat controlling factors in the northeastern Tibetan Plateau: A case study of Gonghe Basin. Renewable 2025, 256, 124038. [Google Scholar] [CrossRef]
  39. Li, Z.J.; Xu, Y.; Jia, M.T.; Liu, H.; Pan, W.; Deng, Y. Numerical simulation of collaborative mining of deep mine stratum geothermal energy and heat hazard control. J. Cent. South Univ. Sci. Technol. 2021, 52, 671–680. [Google Scholar]
  40. Schweizer, D.; Prommer, H.; Blum, P.; Siade, A.J.; Butscher, C. Reactive transport modeling of swelling processes in clay-sulfate rocks. Water Resour. Res. 2018, 54, 6543–6565. [Google Scholar] [CrossRef]
  41. Yu, H.; Xu, T.; Yuan, Y.; Gherardi, F.; Tian, H. Numerical analysis of coupled thermal-hydraulic processes based on the embedded discrete fracture modeling method. Appl. Therm. Eng. 2024, 253, 123765. [Google Scholar] [CrossRef]
  42. Wang, K.; Zhou, J.; Ma, Y.; Ding, A.; Chen, X. Constitutive and numerical modeling for the coupled thermal-hydro-mechanical processes in dual-porosity geothermal reservoir. Appl. Therm. Eng. 2023, 223, 120027. [Google Scholar] [CrossRef]
  43. Chen, Q.Y.; Wang, F. Mathematical modeling and numerical simulation of water-rock interaction in shale under fracturing-fluid flowback conditions. Water Resour. Res. 2021, 57, e2020WR029537. [Google Scholar] [CrossRef]
  44. Zeng, Z.; Shen, W.; Wang, M.; Li, Z.; Wang, X.; Ding, J. Numerical simulation of multi-field coupling in geothermal reservoir heat extraction of enhanced geothermal systems. J. Pet. Explor. Prod. Technol. 2024, 14, 1631–1642. [Google Scholar] [CrossRef]
  45. Keintjem, R.J.; Pratama, H.B.; Tawakal, A.; Wardana, A.P.; Hamdani, M.R.; Abdillah, Y.Z. Assessment of Bedugul Geothermal Prospect Using A Numerical Reservoir Modeling. Indones. J. Geosci. 2023, 10, 181–200. [Google Scholar] [CrossRef]
  46. Huang, X.; Zeng, Y.; Lu, S.; Lu, G.; Ou, H.; Wang, B. Formation and Evolution Mechanisms of Geothermal Waters Influenced by Fault Zones and Ancient Lithology in the Yunkai Uplift, Southern China. Water 2025, 17, 1885. [Google Scholar] [CrossRef]
  47. Yuan, W.; Xing, Y.; Wei, M.; Guo, X.; Liu, J.; Gao, J.; Zhang, C.; Zhai, Y. Hydrochemical Characteristics and Indication to Geothermal Genesis of Low–Medium-Temperature Convection Geothermal Field in Yanshan Orogenic Basin, China. Water 2024, 16, 433. [Google Scholar] [CrossRef]
  48. Liu, X.; Luo, X.; Liu, S.; Zhang, P.; Li, M.; Pan, Y. A Numerical Investigation of the Nonlinear Flow and Heat Transfer Mechanism in Rough Fractured Rock Accounting for Fluid Phase Transition Effects. Water 2024, 16, 342. [Google Scholar] [CrossRef]
Figure 1. The structure outline and the distribution of the current geothermal gradient in the study area.
Water 17 03298 g001
Figure 2. Frequency distribution histogram of thermal conductivity for mudstone and sandstone.
Water 17 03298 g002
Figure 3. Heat flow of Bailiang coalfield and Xizhuozi coalfield.
Water 17 03298 g003
Figure 4. Schematic diagram of the research area profile location and temperature control mode.
Water 17 03298 g004
Figure 5. (a) Typology of temperature logs; (b) spatial distribution of temperature log types.
Water 17 03298 g005
Figure 6. Visualization of the simulated flow field based on Darcy’s Law.
Water 17 03298 g006
Figure 7. Conceptual model of the thermal regime within the study area: (a) t = 5 a; (b) t = 30 a; (c) t = 60 a.
Water 17 03298 g007
Figure 8. Conceptual model of the thermal regime within the study area.
Water 17 03298 g008
Figure 9. Comparison of observed and simulated data.
Water 17 03298 g009
Table 1. The summary table of the tested results of rock thermal conductivity.
BoreholesSample NumberDepth (m)LithologyThermal Conductivity (W/(m·°C))
XC-1XC1-1136–138Fine Sandstone2.41
XC1-2178–181Medium Sandstone2.72
XC1-3338–340Sandy Mudstone2.89
XC1-4345–347Coarse sandstone3.60
XC1-5493–496Sandy Mudstone4.14
XC1-6509–511Siltstone4.59
XC1-7524–525Fine Sandstone3.43
XC1-8558–570Carbonaceous mudstone2.63
XC1-9571–579Fine Sandstone4.12
XC1-10587Carbonaceous mudstone3.06
XC1-11604Sandy Mudstone5.07
XC-2XC2-1127–130Siltstone4.12
XC2-2145–148Sandy Mudstone2.24
XC2-3154–157Sandy Mudstone3.98
XC2-4162–163Siltstone2.79
XC2-5280–290Sandy Mudstone3.75
XC2-6334–340Fine Sandstone3.99
XC2-7406–409Fine Sandstone2.24
XC2-8415–418Medium Sandstone3.98
XC2-9421–424Fine Sandstone2.79
XC2-10436–439Fine Sandstone3.29
XC2-11442–444Sandy Mudstone2.56
XC2-12465–470Sandy Mudstone1.95
Table 2. The heat flow database of the eastern Chenghe Mining Area.
BoreholesBlock Range (m)Geothermal Gradient (°C/hm)Lithological Proportion/%Heat Flow (mW/m2)
Shale + Sandy Shale
Shale + Coal
Fine Sandstone
40-1136.7–510.162.90.650.3577.087
40-2118–532.443.30.610.3988.086
41-2108–492.73.50.390.6195.724
41-3130.42–423.224.580.710.29120.976
42-1134.43–531.9030.710.2979.230
42-298.13–439.130.900.1077.575
42-3104.28–385.794.850.680.32128.489
43-1107.16–490.1030.710.2979.173
43-270.65–424.382.80.620.3874.659
43-3109.75–385.703.70.810.1996.688
CH20977.0–429.503.340.001.0095.524
CH21084–508.830.070.9385.128
CH211119.5–464.82.710.520.4873.050
J1-1 *123.1–541.122.70.560.4472.441
J1-2128.65–510.032.90.410.5979.102
J2-1143.41–556.8030.590.4180.214
J2-2118–538.223.20.530.4786.203
J2-3129.5–513.383.50.560.4493.900
J3-1130.5–552.222.90.720.2876.468
J3-2113.45–535.4630.660.3479.608
J3-3132.74–519.282.70.660.3471.692
J3-4116.49–491.172.950.710.2977.868
J3-5136.5–444.893.60.820.1893.890
J4-1104.8–529.872.70.700.3071.347
J4-2113.64–491.921.40.710.2969.952
J4-3119.2–478.153.30.510.4989.060
J4-4124–4463.80.890.1198.366
J4-5122.12–409.673.90.790.21102.129
J5-1109–501.013.50.520.4894.307
J5-2116.4–492.792.50.600.4066.806
J5-3107.55–443.953.30.520.4888.941
J5-4113–403.554.20.950.05108.089
J5-5106–371.043.80.800.2099.368
J6-199.5–482.753.70.710.2997.718
J6-2115.9–460.723.40.610.3990.771
J6-3108.4–410.854.10.690.31108.472
J6-4124–388.773.50.620.3893.326
J7-1110.95–455.3540.590.41106.960
J7-2101.22–435.24.40.690.31116.444
J7-3113.5–390.523.40.800.2088.915
J8-191–529.943.70.580.4299.115
J8-299–326.264.70.600.40125.550
J9-1 *84–502.643.50.610.3993.462
XC1120.3-541.73.290.580.4288.090
XC2120.08–417.584.280.700.30113.175
Note: Those marked with an asterisk (*) are steady-state or approximately steady-state boreholes.
Table 3. Thermodynamic property parameters of each layer.
Rock FormationThermal
Conductivity
(W/(m·K))
Density
(kg/m3)
Specific Heat
Capacity
(J/(kg·K))
Specific
Heat Rate
(1)
Permeability
(m2)
Porosity
(1)
Dynamic Viscosity
(Pa·s)
Unconsolidated Layer2.020001000
Shihezi Formation, Shanxi Formation2.525001000
Taiyuan Formation, Ordovician Limestone Aquifer2.52500150011 × 10−110.2
Fault2.52000200011 × 10−100.31 × 10⁻⁶
Disclaimer/Publisher’s Note: The statements, opinions and data contained in all publications are solely those of the individual author(s) and contributor(s) and not of MDPI and/or the editor(s). MDPI and/or the editor(s) disclaim responsibility for any injury to people or property resulting from any ideas, methods, instructions or products referred to in the content.