Article

Evaluating a Simple Algorithm for an Evapotranspiration Retrieval Energy Balance Model in Mediterranean Citrus Orchards

by
Kevin Alain Salamanca Lopez
1,*,
Gila Abílio João
1,
Hewlley Maria Acioli Imbuzeiro
1,
Daniela Vanella
2,
Simona Consoli
2,
Giuseppe Longo Minnolo
2,
Gabrielle Ferreira Pires
1 and
José Francisco de Oliveira-Júnior
3
1
Agricultural Engineering Department, Universidade Federal de Viçosa (UFV), Viçosa 36570-900, Brazil
2
Dipartimento di Agricoltura, Alimentazione e Ambiente (Di3A), Università degli Studi di Catania, Via S. Sofia, 100, 95123 Catania, Italy
3
Institute of Atmospheric Sciences (ICAT), Federal University of Alagoas (UFAL), Av. Lourival Melo Mota, S/N, Tabuleiro do Martins, Maceió 57072-900, Brazil
*
Author to whom correspondence should be addressed.
Water 2025, 17(22), 3286; https://doi.org/10.3390/w17223286
Submission received: 4 September 2025 / Revised: 15 October 2025 / Accepted: 20 October 2025 / Published: 18 November 2025
(This article belongs to the Section Hydrology)

Abstract

Accurate estimation of actual crop evapotranspiration ( E T a ) is crucial for effective irrigation management, especially in regions facing growing water scarcity. This study evaluates the performance of the Simple Algorithm for Evapotranspiration Retrieving (SAFER) in a Mediterranean citrus orchard using remote sensing and Eddy Covariance (EC) data. The model was calibrated using local flux tower data from 2021 to 2022. The results show strong agreement between observed and modeled E T a during the wet season, with excellent statistical metrics (R2 = 0.89 and 0.85; r = 0.95 and 0.92; RMSE = 0.95 mm day−1 and 0.91 mm day−1; bias = −0.94 mm day−1 and 0.53 mm day−1 for 2021 and 2022, respectively), confirming the reliability of SAFER under well-watered conditions. However, the model performance decreased significantly during the dry season, R2 = 0.352 and 0.167; r = −0.593 and 0.408; RMSE = 0.86 mm day−1 and 0.68 mm day−1; bias = 0.01 mm day−1 and 0.38 mm day−1 for 2021 and 2022, respectively, likely due to the limited capacity of vegetation indices to detect plant physiological stress under water deficit conditions. SAFER detected spatial variability in E T a across the orchard, highlighting its potential for irrigation zoning. Comparisons with studies in tropical and semi-arid regions demonstrated consistency in mid-season E T a estimates, supporting the model’s adaptability. Despite reduced accuracy under drought conditions, SAFER remains a cost-effective and reliable tool for E T a monitoring during optimal growth periods. Overall, it shows strong potential as a remote sensing-based tool for sustainable crop management, though dry-season applications require additional stress-adjustment factors.

1. Introduction

Net radiation at the Earth’s surface is primarily partitioned into latent heat (LE) and sensible heat (H) fluxes [1]. These two energy fluxes are the main components of the surface energy balance (SEB) [1,2]. The processes of convection, mass, and heat transfer from the surface to the free atmosphere are linked to the H. At the same time, LE is a key component of the surface water balance, responsible for the evapotranspiration (ET) process [2], which is defined as the energy available to transport water from the soil and plant leaves to the atmosphere [3,4].
Understanding the behavior of the energy balance components related to ET (i.e., LE) is fundamental for irrigation support, especially in agro-ecosystems such as citrus groves in the Mediterranean climate region, whose productivity depends mainly on irrigation [3,5,6,7]. Therefore, qualifying the SEB components is fundamental for determining ET, and, thus, improving the irrigation support in semi-arid regions of the Mediterranean basin [4,5,7].
The EC technique has become the reference method for directly measuring SEB fluxes [2,8]. By capturing high-frequency exchanges of energy, water, and momentum between ecosystems and the atmosphere, EC allows direct assessment of surface energy balance dynamics [9,10]. Typically, an EC system combines a three-dimensional sonic anemometer with an infrared gas analyzer [11]. Despite its robustness, the EC method presents several challenges, including limited spatial representativeness compared to satellite approaches, incomplete energy balance closure, and underestimation of SEB under thermal stratification or non-stationary turbulence, which necessitate detailed corrections for accurate estimates [9]. According to the author, these challenges often necessitate adjustments to ensure energy balance conservation. Other issues include the sensitivity of sensors to environmental conditions, such as atmospheric stability and surrounding vegetation, which can affect the transfer of heat and mass between the Earth’s surface and the atmosphere, resulting in information gaps [12]. Alternatives, such as remote sensing, have been explored to fill these gaps, providing spatiotemporal information at different wavelengths of the electromagnetic spectrum over the Earth’s surface and allowing the behavior of energy fluxes to be estimated through SEB models [13].
Mediterranean climates are characterized by irregularity and scarcity of water supplies, which affect water availability levels for irrigation [7,14,15]. Several studies have evaluated the temporal behavior of SEB fluxes, mainly for the ET process determination, in Mediterranean regions, contributing to the proper management of water resources, particularly in the context of climate change scenarios [16], for which water scarcity and the increased recurrence and intensity of droughts are expected. The climate change effects exacerbate the shortage of water resources in these affected regions. This fact negatively impacts irrigated agriculture, leading to the need to monitor crop water consumption to achieve sustainable water management [8]. This objective can be pursued through tools that determine the SEB components at the agro-ecosystem level [17]. One of these tools is the SAFER model, which utilizes remote sensing to estimate the SEB components at different spatial and temporal scales. SAFER has already been used in different climatic conditions. For example, a study calibrated the algorithm for conditions in California [8], United States, for grape cultivation. Additionally, Teixeira et al. [4,18] used the model to estimate the ET fluxes in lemon orchards, as well as in soybean and corn crops. A recent work quantified ET for orange and lime crops in the Amazon Region [19]. This study applied the SAFER algorithm, utilizing satellite (Landsat 7 and 8) and meteorological data. The SAFER algorithm determined ET with an overall accuracy of 75%, showing higher accuracy for lime crops. These findings highlight the value of satellite imagery as an effective tool for estimating ET with this algorithm.
This study assesses the potential of the SAFER model as a tool to enhance irrigation support and water resource monitoring in semi-arid and Mediterranean agricultural systems, particularly considering the drought challenges in the region. The study also seeks to demonstrate the model’s usefulness for water resource management. In parallel, the study calibrated the algorithm for Mediterranean conditions, as it was initially calibrated for other crops and in different geographical conditions. The SAFER model, with Sentinel-2 imagery and agrometeorological data, was used to estimate the main components of the SEB and ET in a citrus crop under the Mediterranean climatic conditions of Lentini, Sicily (Italy). These estimates were compared with SEB measurements obtained using an EC system, which are representative of the fluxes in the orange grove.

2. Materials and Methods

2.1. Study Site

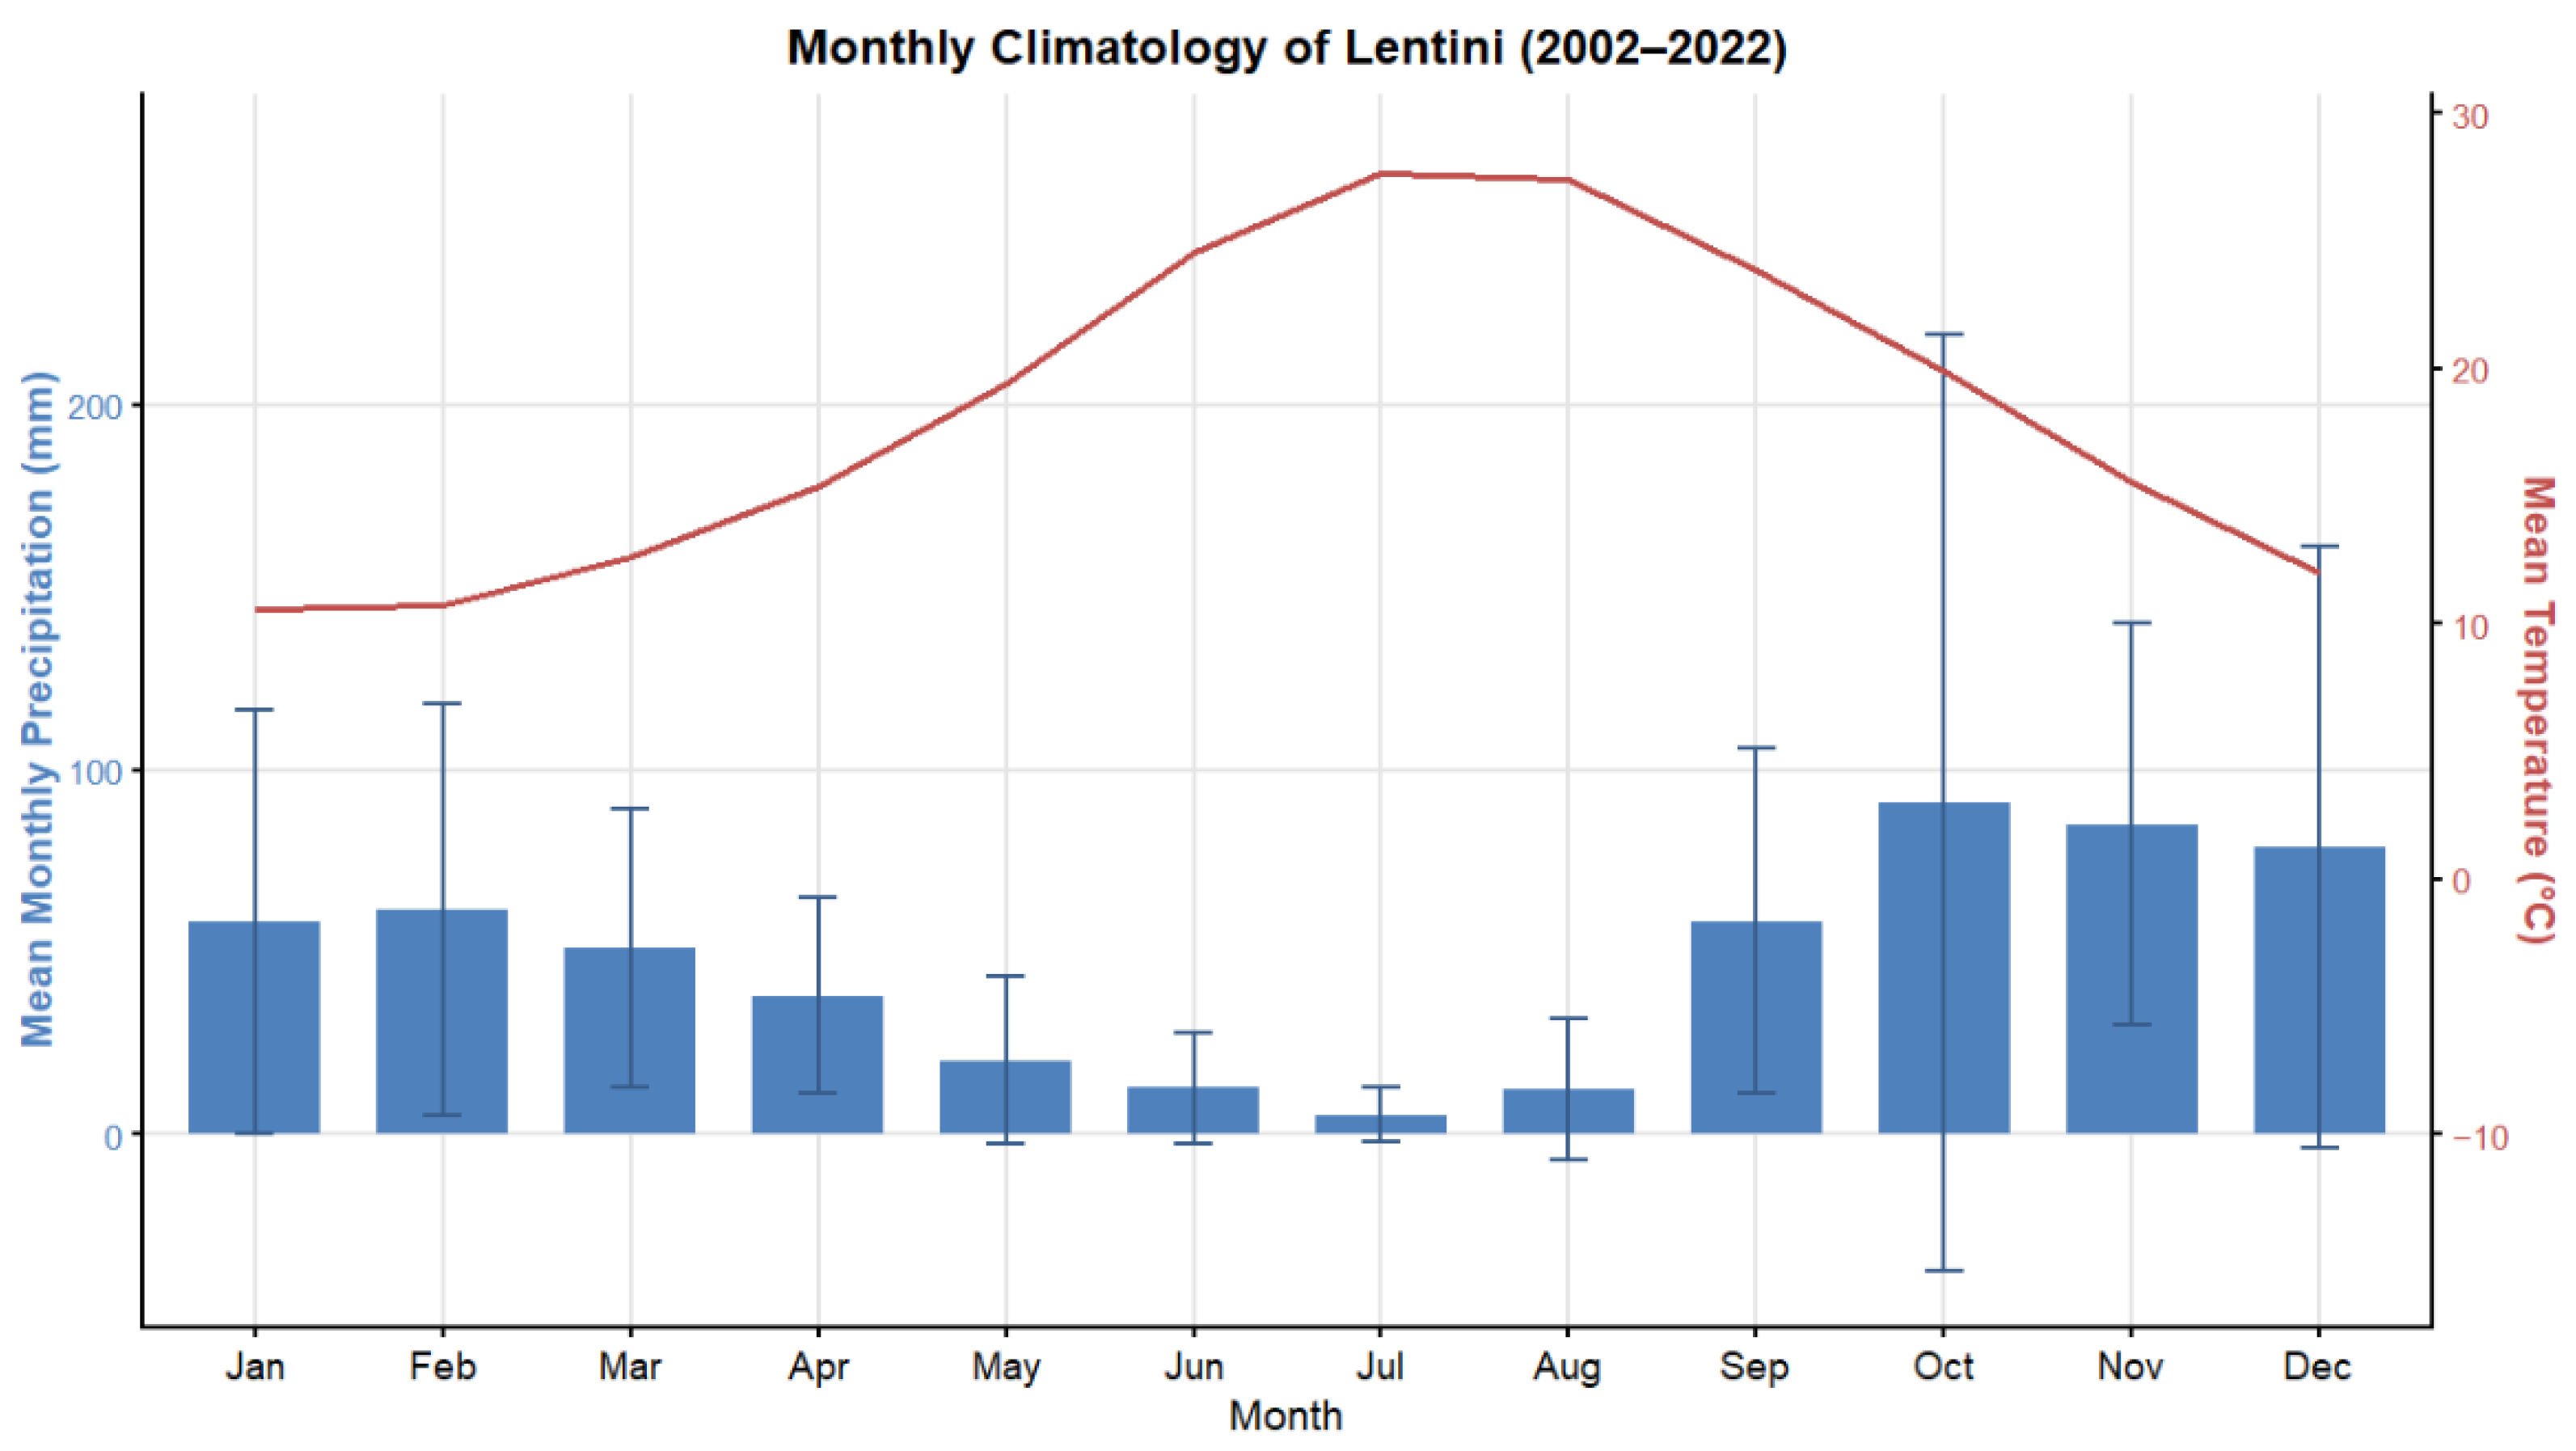
The study site comprises a 0.7-hectare orange orchard located in eastern Sicily (Italy), specifically in Lentini (Figure 1). It is managed by the “Consiglio per la ricerca in agricoltura e l’analisi dell’economia agraria, Centro di ricerca Olivicoltura, Frutticoltura e Agrumicoltura” (CREA-OFA) of Acireale. The study area is characterized by a Mediterranean warm-summer climate (Köppen Csa Code) that features a rainy season during winter [20,21]. Figure 2 shows the monthly average precipitation and the mean air temperature from 2002 to 2023 recorded at Lentini agrometeorological station managed by the Agrometeorological Information Service of Sicily (SIAS).
During the reference period (2002–2023), the monthly average air temperatures ranged from 12.7 °C, 18.3 °C, and 24.8 °C for minimum, mean, and maximum temperatures, respectively. The winter months (DJF) exhibited lower temperatures and higher precipitation compared to the summer months (JJA), which were characterized by higher temperatures and lower precipitation. The average observed monthly and annual rainfall at the station was approximately 47.7 mm and 572.6 mm, respectively. July (5.3 mm) and October (90.0 mm) were the months with the lowest and highest average monthly precipitation, respectively, during the reference period.
The orchard under study consists of orange trees (Citrus sinensis (L.) Osbeck cv. “Tarocco Sciara”), planted in 2010, with a 6 m × 4 m spacing. The soil is sandy loam, with a field capacity and permanent wilting point of 0.28 m3/m3 and 0.14 m3/m3, respectively, and a density of approximately 1.25 g/cm3 [5,22]. An EC flux tower, installed at the study site in 2016, was used for collecting the turbulent fluxes, using a three-dimensional sonic anemometer (CSAT3-3D, Campbell Scientific Inc., Logan, UT, USA) and an open-path infrared gas analyzer (Li-7500, Li-cor Biosciences Inc., Lincoln, Nebraska) to measure high-frequency (10 Hz) wind components and H 2 O and C O 2 concentrations, respectively. The low-frequency (30 min), net radiation (Rn, W m−2), and soil heat flux (G, W m−2) were measured using a net radiometer, located at 7 m above the ground (CNR-1 Kipp and Zonen, Delft, The Netherlands), and three soil heat flux plates (HFP01SC, Hukseflux, Delft, The Netherlands), respectively. The H and LE fluxes were calculated using the covariances between vertical wind velocity and air temperature, as well as between vertical wind velocity and water vapor density, according to the methodology provided in Saitta et al. [23].
Within the reference period (2021–2022), a qualitative and quantitative analysis of the local EC fluxes and agrometeorological data records from the SIAS Lentini weather station was carried out in R version 4.5.1 using the AGRIWATER [23] package version 1.0.2, together with the acquisition and processing of Sentinel-2 satellite images using the Google Earth Engine (GEE) tool.

2.2. EC Footprint Analysis

The EC footprint analysis is a crucial method in micrometeorology for interpreting turbulent flow measurements from EC flux towers. Ideally, these towers should be installed on homogeneous, flat terrain with a uniform tree species distribution and similar thermal properties [9]. However, many locations do not meet these criteria, requiring a thorough understanding of the source zone and its impact on the measured signal [24]. The footprint is the surface area contributing to measurements at a specific point during a certain period [10]. It varies depending on measurement height, wind direction, atmospheric stability, and terrain roughness [25]. Advanced models, including analytical models, stochastic Lagrangian particle simulations, and extensive eddy simulations, are employed to address flow heterogeneities. These models and their parameters are essential for accurately estimating the contribution of different source areas to flow and vertical concentration measurements [9].

2.3. Description of the SAFER Model

The SAFER model is an alternative to the SEB Algorithm for Land (SEBAL) [13] that requires no anchor pixels or thermal strips, enhancing its practicality and operational applicability. It integrates radiometric data from satellite images with agrometeorological data such as reference ET, global solar radiation, and air temperature to estimate ET on a large scale. Designed for satellite-based applications, such as Landsat 8, Sentinel-2, and MODIS, which lack thermal bands, the model applies the SAFER algorithm to spatialize mass and SEB fluxes, where the spatial resolution depends on the set of images used. For the experiment, Sentinel-2 images with a spatial resolution of 10 m   p i x e l 1 were utilized. These data were accessed through the Agriwater version 1.0.2 an R package [26], which provides the radiation_s2 function for estimating ET using remote sensing data. It should be noted that, for optimal results, the model requires simple calibration to local conditions [4].
The modeling approach includes as input the planetary albedo for the entire solar spectrum, calculated as a weighted sum of the reflectance in narrow spectral bands ( r p   ):
a p = w b r p
where w b (0.32, 0.26, 0.25, and 0.17) represent the weights for the blue, green, red, and infrared bands, respectively, depicting the proportion of incident solar radiation in each band relative to the total incoming radiation [18].
Then, the daily surface albedo is calculated using a regression equation:
a 0 = a a p + b
In which 1.70 and 0.13 are regression coefficients a and b, derived from planetary albedo for 24 h, found by Teixeira et al. [18].
The daily surface temperature is estimated as a residual in the daily radiation balance:
T 0   =   R G S a 0 R G   +   ε A σ T a 4 R n ε s   σ 4
where R n is the daily Net Radiation, ε s is the Surface Emissivity, and σ is the Stefan-Boltzmann Constant 5.67   ×   10 8     W m 2   K 4 [18,26].
The surface emissivity is calculated as:
ε s = a s ln N D V I + b s
In which a s = 1.0035 and b s = 0.0589 are regression coefficients [17,18].
ε a = a A l n τ s w b A
where a A = 0.9634, y b A = 0.1135 are regression coefficients, and sw is the shortwave atmospheric transmissivity, calculated as the ratio of daily incoming solar radiation R G to incident solar radiation at the top of the atmosphere [27].
Rn is calculated using the Slob equation [18]:
R n = 1 a 0 R G a L τ s w
where a L is a coefficient related to the air temperature ( T a ):
a L = c T a d
The values of c and d are 6.99 and 39.93, obtained as regression coefficients in the past experiments [28,29]. We retained the physically based coefficients c and d. These have been extensively validated over Mediterranean-type agroecosystems and orchard canopies. These coefficients encode radiative–thermal constraints that are expected to be transferable across sites with comparable climates, canopy architectures, and background reflectance’s. In contrast, the empirical pair a and b in Equation (9) with local tower and Sentinel-2 data from Lentini was calibrated to account for site-specific phenology and stress responses. This hybrid strategy preserves physical consistency and transferability for the radiative terms (via c, d), while ensuring local representativeness of the E T f r relationship (via a, b).
Regarding the satellite component, the NDVI is calculated as:
N D V I = r N I R     r R E D r N I R   +   r R E D
where r N I R and r R E D are the reflectances in the near-infrared and red infrared bands, respectively.
The evaporative fraction, which is the ratio of the actual ET to the reference ET, is calculated as:
E T f r   = e x p a + b ( L S T a 0 N D V I )
where a = −0.463 and b = −0.002 represent the regression coefficients between the calculated evaporative fraction and the one estimated by satellite. These values were estimated in this study during the calibration process under the specific conditions of Sicily, Italy.
Finally, the actual daily ET is calculated as:
E T a = E T f r E T 0
where E T 0 is the reference evapotranspiration, calculated using the standard FAO Penman-Monteith method [30], and calculated using the BrazilMet 0.4.0 R package. The E T a and E T f r are actual evapotranspiration and observed evaporative fraction, respectively.

2.4. Model Calibration and Validation

Data sources and preprocessing:
(i)
EC data (at 30 min resolution) and H, LE, Rn, G data from the Lentini tower (Section 2.1) were quality-controlled following standard practice (spike removal, tilt correction, frequency-response, and WPL density corrections), screened by nighttime u⋆ thresholds, and aggregated to daily values when data coverage ≥ 80%. Energy-balance closure was monitored as EBC = (H + LE)/(Rn − G); days with poor closure were flagged and excluded from calibration but kept for sensitivity checks.
(ii)
Meteorological records from SIAS provided daily E T 0 (FAO-56 Penman–Monteith) and auxiliary variables.
(iii)
Sentinel-2 MSI images (cloud-masked and atmospherically corrected) supplied a 0 , NDVI, and the variables needed for Equations (1)–(8); only scenes with cloud cover ≤10% over the footprint were retained. All satellite quantities were extracted as the footprint-weighted mean within the 50–90% EC footprint contours for each date.
The SAFER model requires internal calibration to determine the optimal empirical coefficients a and b in Equation (9), following the methodology proposed by Teixeira et al. [17] and further applied by Venâncio et al. [31]. This calibration is achieved through linear regression analysis, in which the relationship between the remote sensing-based variable L S T   a 0 1   N D V I 1 and the natural logarithm of the ratio of observed ET to E T 0   L n ( E T   E T 0 1 ) is established for each flux tower within the study area. This procedure enables the model to be locally parameterized, enhancing its representativeness under site-specific conditions. This hybrid strategy preserves physical consistency while adapting the evaporative fraction (EF) relationship to local agro-meteorological conditions. Additional methodological details and applications of the SAFER model using Agriwater R version 1.0.2 can be found in Silva et al. [26] and Safre et al. [8], who provide comprehensive insights into its structure and implementation.
The SAFER model was calibrated for the Lentini site (37.337° N, 14.893° E) using flux tower measurements and remote sensing data. The observed evaporative fraction E T f r was derived as the ratio between E T a , measured by the EC system, and E T 0 , estimated using the FAO Penman-Monteith method [30]. Then, a linear relationship is established between the remote sensing parameters Land Surface Temperature ( L S T ), albedo (a_0), ( N D V I ) and the observed values of L n   E T f r , using the independent variable ( L S T   a 0 1   N D V I 1 ). Through a linear regression, the coefficients a (intercept) and b (slope) are obtained, which are incorporated into Equation (9). Finally, the calibrated model is validated by comparing E T a estimates with flux tower measurements, ensuring its accuracy for regional applications.
The SAFER model was calibrated using a combination of remote sensing data and ground-based observations. Harmonized Sentinel-2 MSI images, listed in Table 1, were utilized to derive the necessary remote sensing parameters ( L S T   a 0 1   N D V I 1 ) for the calibration process. These images correspond to specific dates throughout 2021 and 2022, ensuring a representative temporal coverage of the study area. Additionally, meteorological data from the Lentini weather station and flux tower measurements from the Micro Tower site were incorporated to provide observed L n   E T f r values. The integration of these datasets enabled the development of a robust linear regression model, which is essential for determining the optimal coefficients a and b in Equation (9).
To validate the SAFER model, a comprehensive dataset was employed, including agrometeorological records from the SIAS Lentini weather station, Sentinel-2 MSI imagery (see Table 2), and SEB flux measurements obtained from the micrometeorological tower. These data sources provided reference values of actual ET, H, and LE, which were directly compared to SAFER model simulations. The validation spanned the years 2021 and 2022, encompassing a broad range of seasonal variability and environmental conditions. Model performance was quantitatively evaluated using standard statistical indicators: the coefficient of determination (R2), root mean square error (RMSE), and mean bias error (MBE). These metrics were applied to assess the accuracy of SAFER in estimating H, LE, and ET. Observed ET values derived from the EC technique were used as ground truth for the evaluation. This multivariable, multi-temporal validation framework demonstrated the model’s reliability and predictive skill in capturing ET dynamics and energy flux partitioning under Mediterranean climatic conditions, supporting its applicability for operational monitoring and hydrological modeling in similar environments.

2.5. Additional Performance Metrics

In addition to the R2, we now report RMSE and MBE for model validation. These metrics are widely used for evaluating models, as seen in recent studies [32,33], and were employed in this research to provide a more comprehensive evaluation of SAFER performance, which is included in the results section.

Validation Metrics

Together with the R2 (Equation (11)), we evaluated model skill using RMSE (Equation (12)) and MBE (Equation (13)). Let yi and y ^ be the daily and average be the daily EC-derived ET and the corresponding SAFER estimate for day i = 1, …, n. Metrics are defined as:
R 2 = 1 i = 1 n y i ^ y i 2 i = 1 n y ¯ y i 2
R M S E = 1 n i = 1 n y i ^ y i 2
MBE = 1 n i = 1 n y i ^ y i
Errors are reported in mm d−1 (consistent with ET units); negative MBE indicates underestimation by SAFER relative to EC. Metrics are computed for (i) all valid dates, and (ii) stratified by wet vs. dry season.

3. Results

3.1. Footprint Analysis

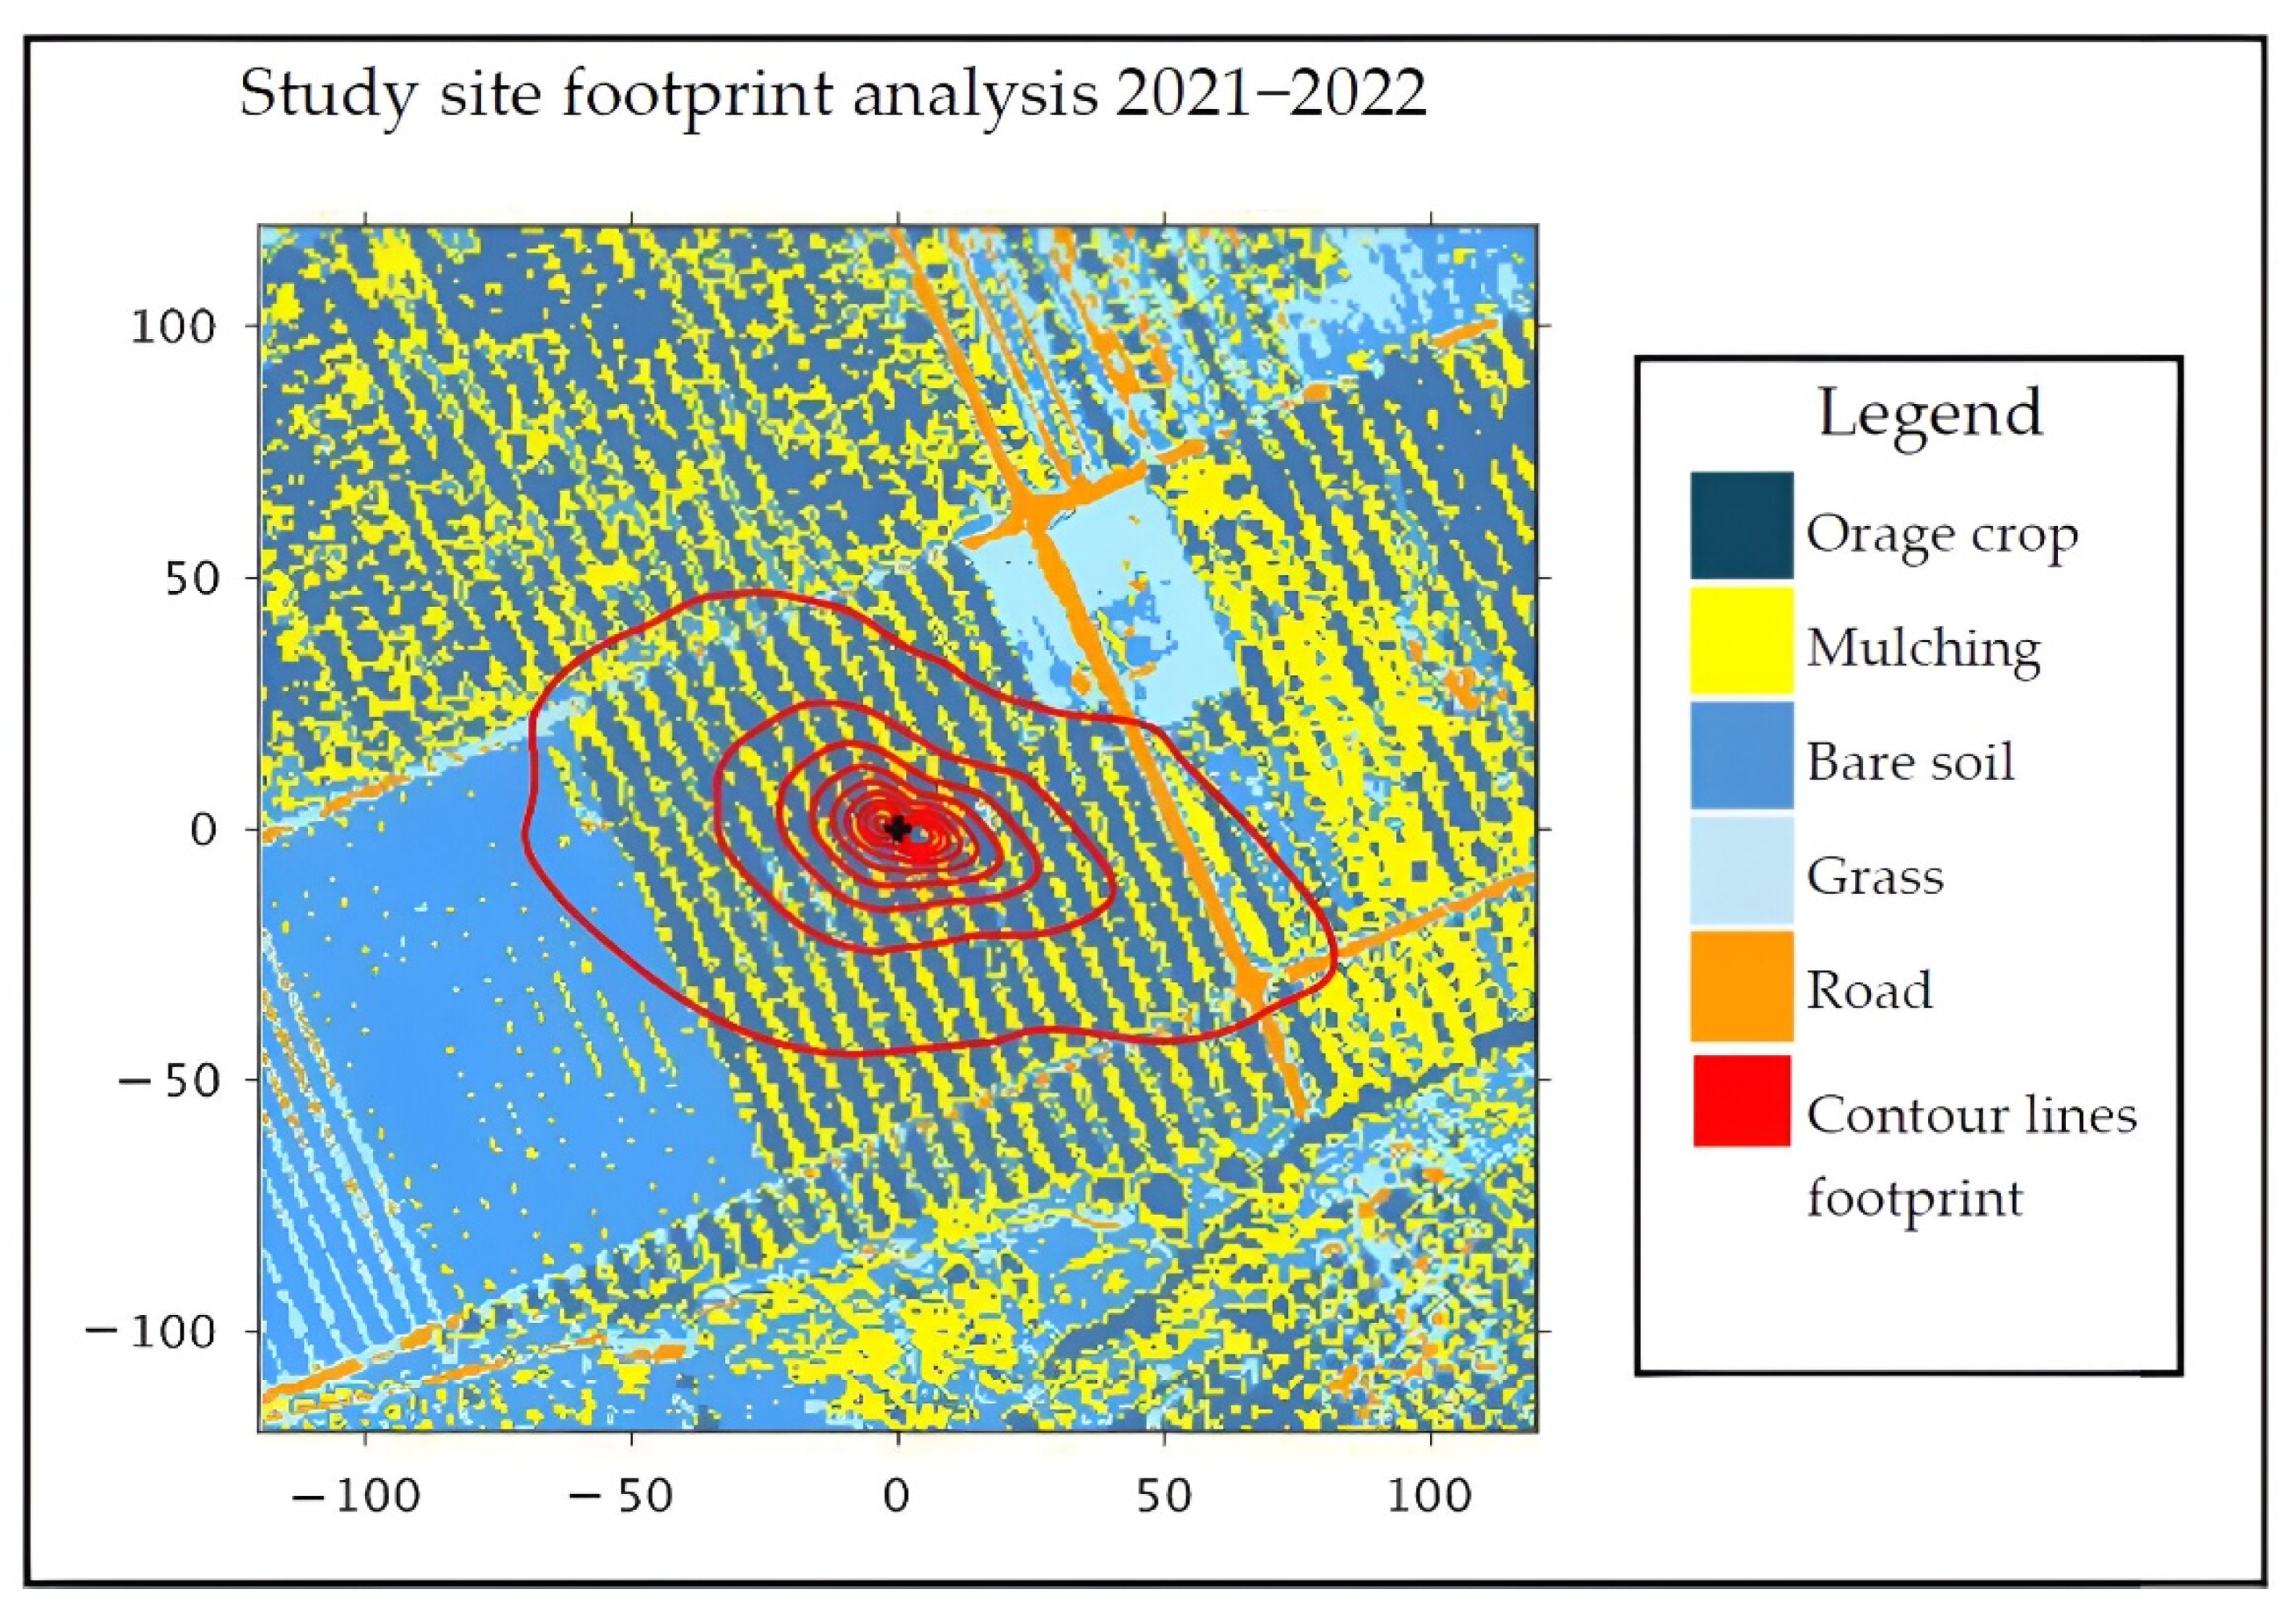
The footprint area was calculated using the widely applied micrometeorological model by Kljun [25]. This method combines equations based on principles of atmospheric turbulence and mass transport to calculate the impact of meteorological conditions, terrain characteristics, and surface properties on the extent and shape of the footprint. For this purpose, we utilized the online program developed by Kljun et al. [25] for processing our data. Figure 3 presents a map of the study area overlaid with the automatic land cover classification and the flux tower footprint contour lines, calculated in 10% intervals from 10% to 90%. The title of each panel in the figure annotates the footprint-weighted contribution of each land cover class to the measured flux. This analysis reveals that the largest contribution comes from the orange crop, at 64.2%, followed by mulching at 27.2%. Other land covers, such as bare soil (6.9%), grass (1.3%), and roads (0.4%), contribute marginally to the total measurements. The elongated shape of the footprint aligns with the predominant wind direction pattern during the analyzed period (2021–2022), confirming that most of the footprint area effectively represents the crop of interest.

3.2. Calibration

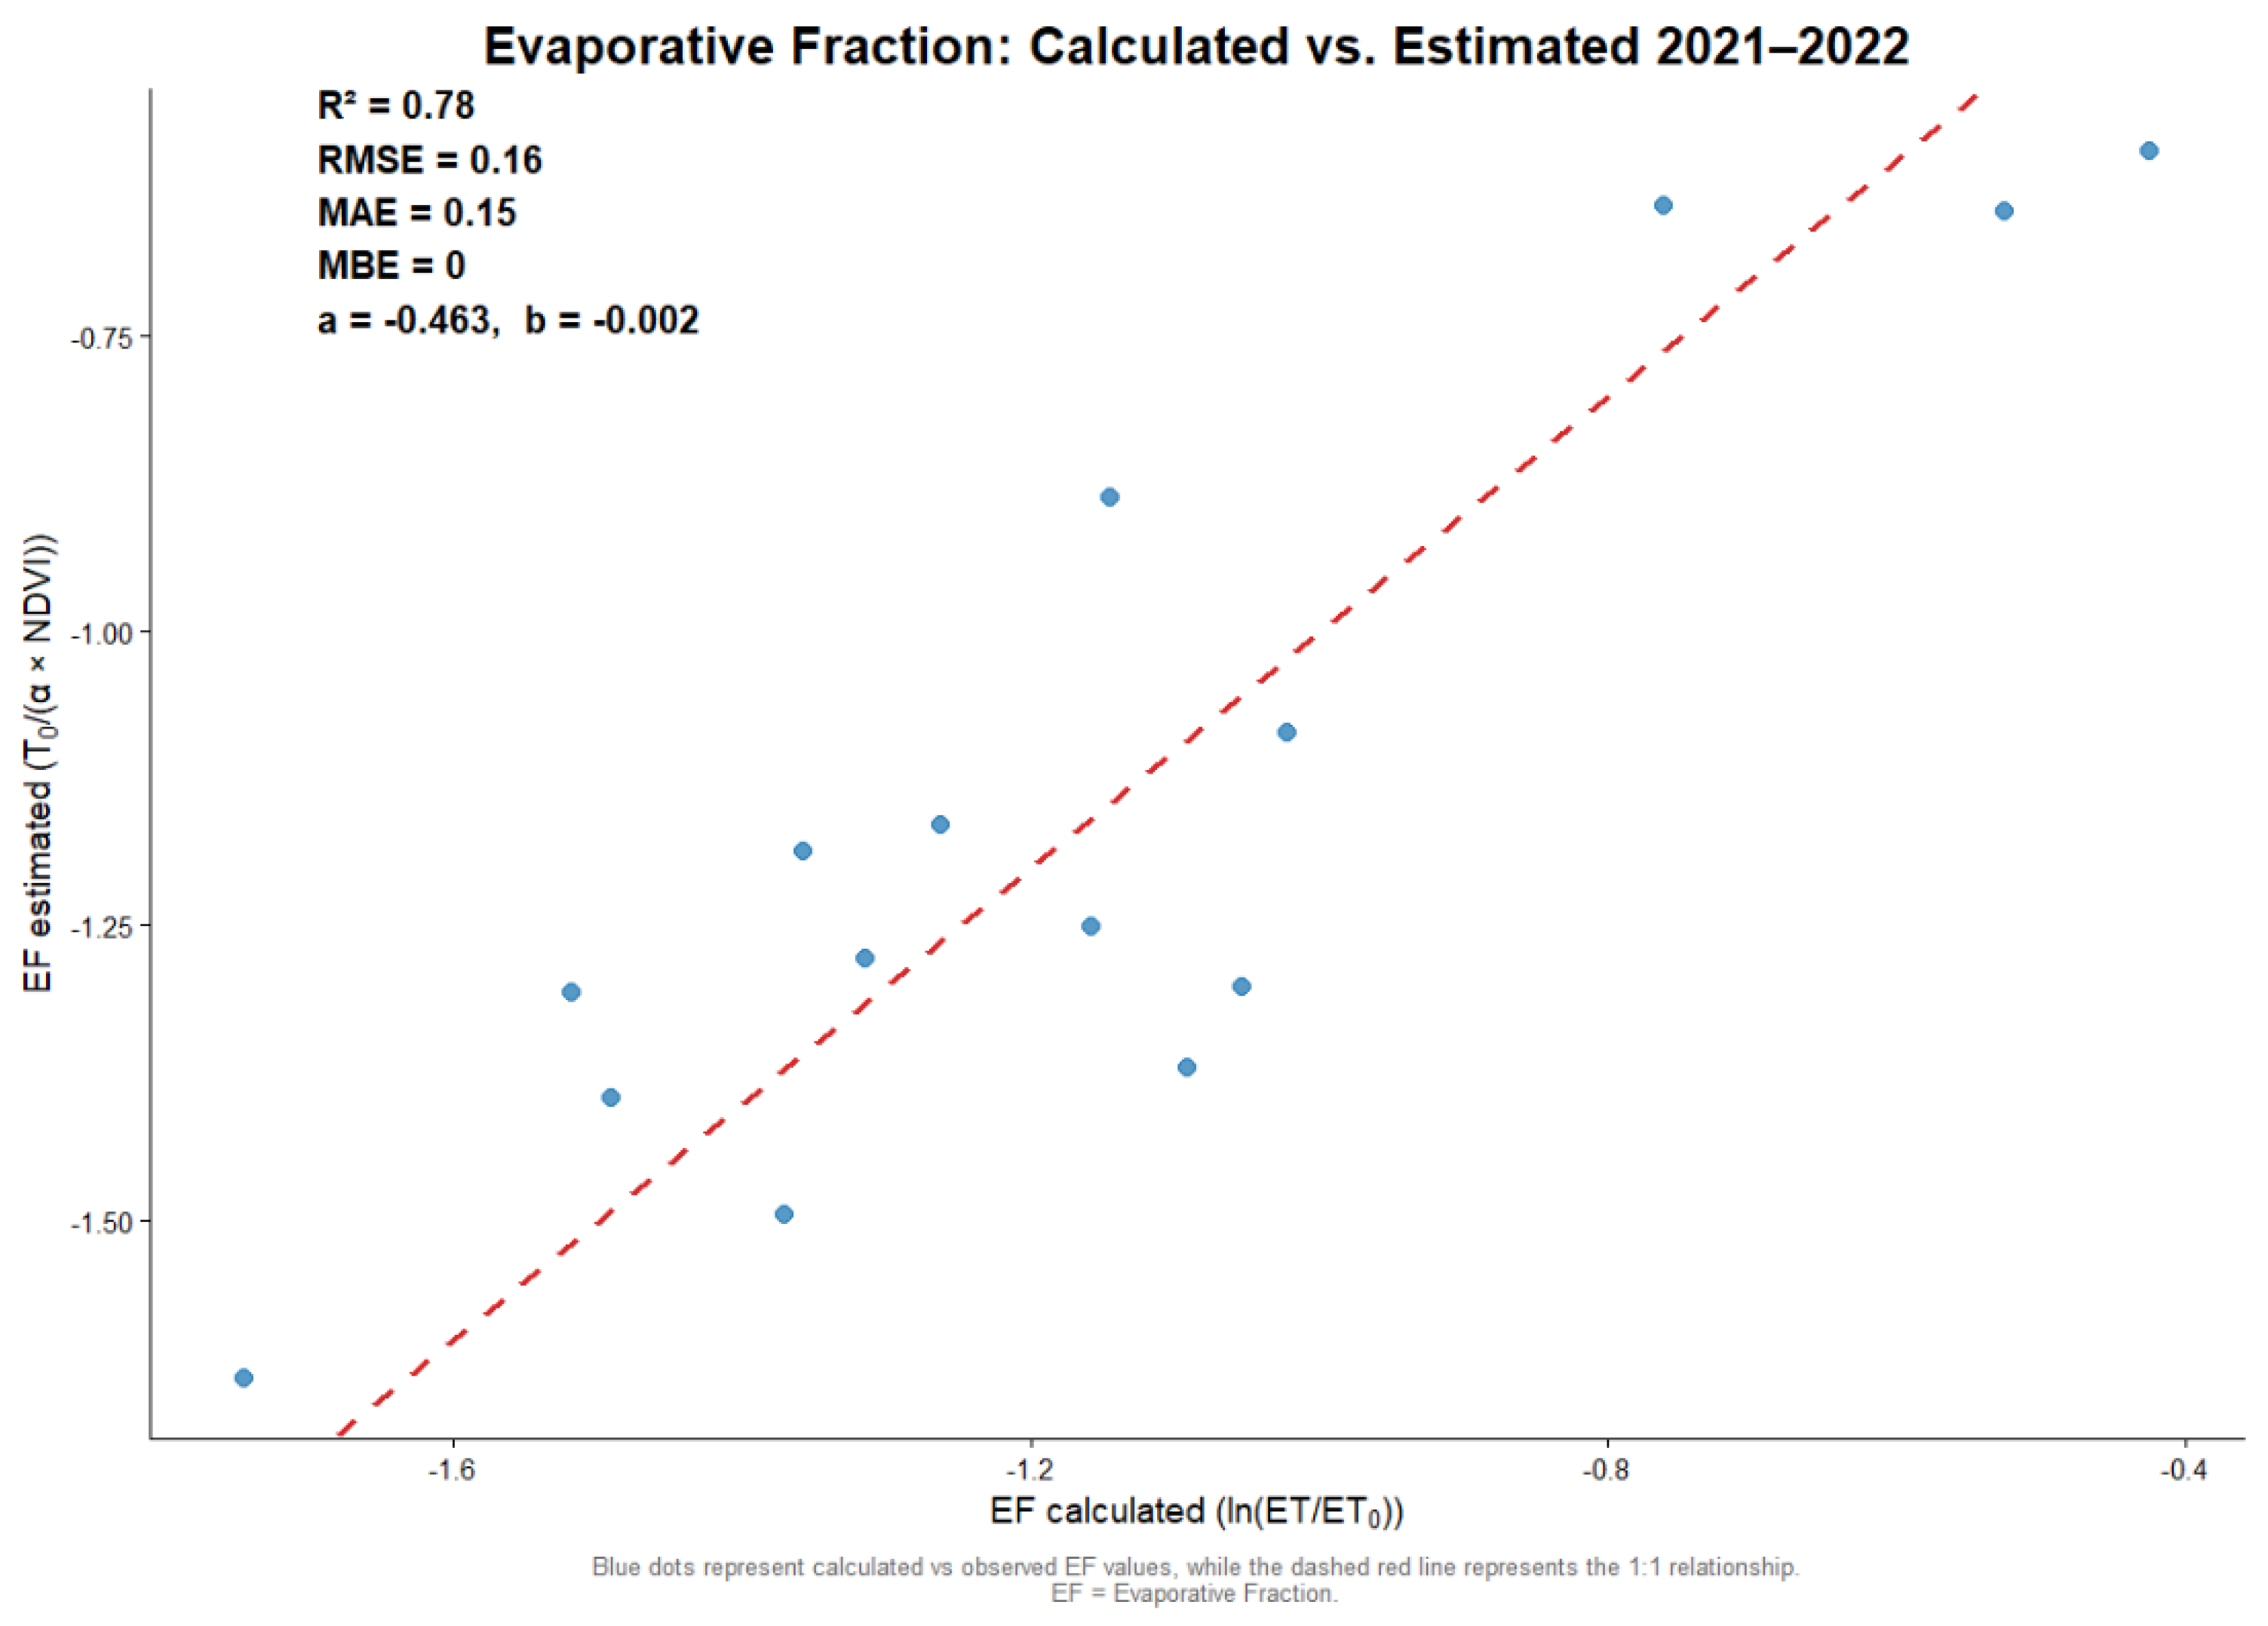
The linear regression results showed a good model fit, show Figure 4, with a R2 of 0.7823, indicating that approximately 78% of the variability in L n   E T f r is explained by the independent variable ( L S T   a 0 1   N D V I 1 ). The intercept a was −0.463143, and the coefficient of the independent variable b was −0.002310, both of which were statistically significant (p < 0.01). The model exhibited a low Root Mean Square Error (RMSE) of 0.16 and a Mean Absolute Error (MAE) of 0.15. Furthermore, a Mean Bias Error (MBE) of zero indicates the absence of any systematic overestimation or underestimation in the model calibration, demonstrating its unbiased nature. The residual standard error was 0.1752, suggesting that the model has acceptable accuracy in predicting the evaporative fraction under Lentini’s conditions. These results allow calibrating Equation (9) to estimate E T f r more accurately in the Mediterranean condition of the region.
Our results highlight the need for local calibration of parameters a and b to represent site-specific evaporation under dry conditions. This is consistent with the notion that radiative constraints are more portable than empirical EF slopes, which reflect canopy physiology and stress. We therefore recommend re-estimating a and b whenever canopy composition or hydroclimate differ markedly from the calibration setting.

3.3. Model Validation Results

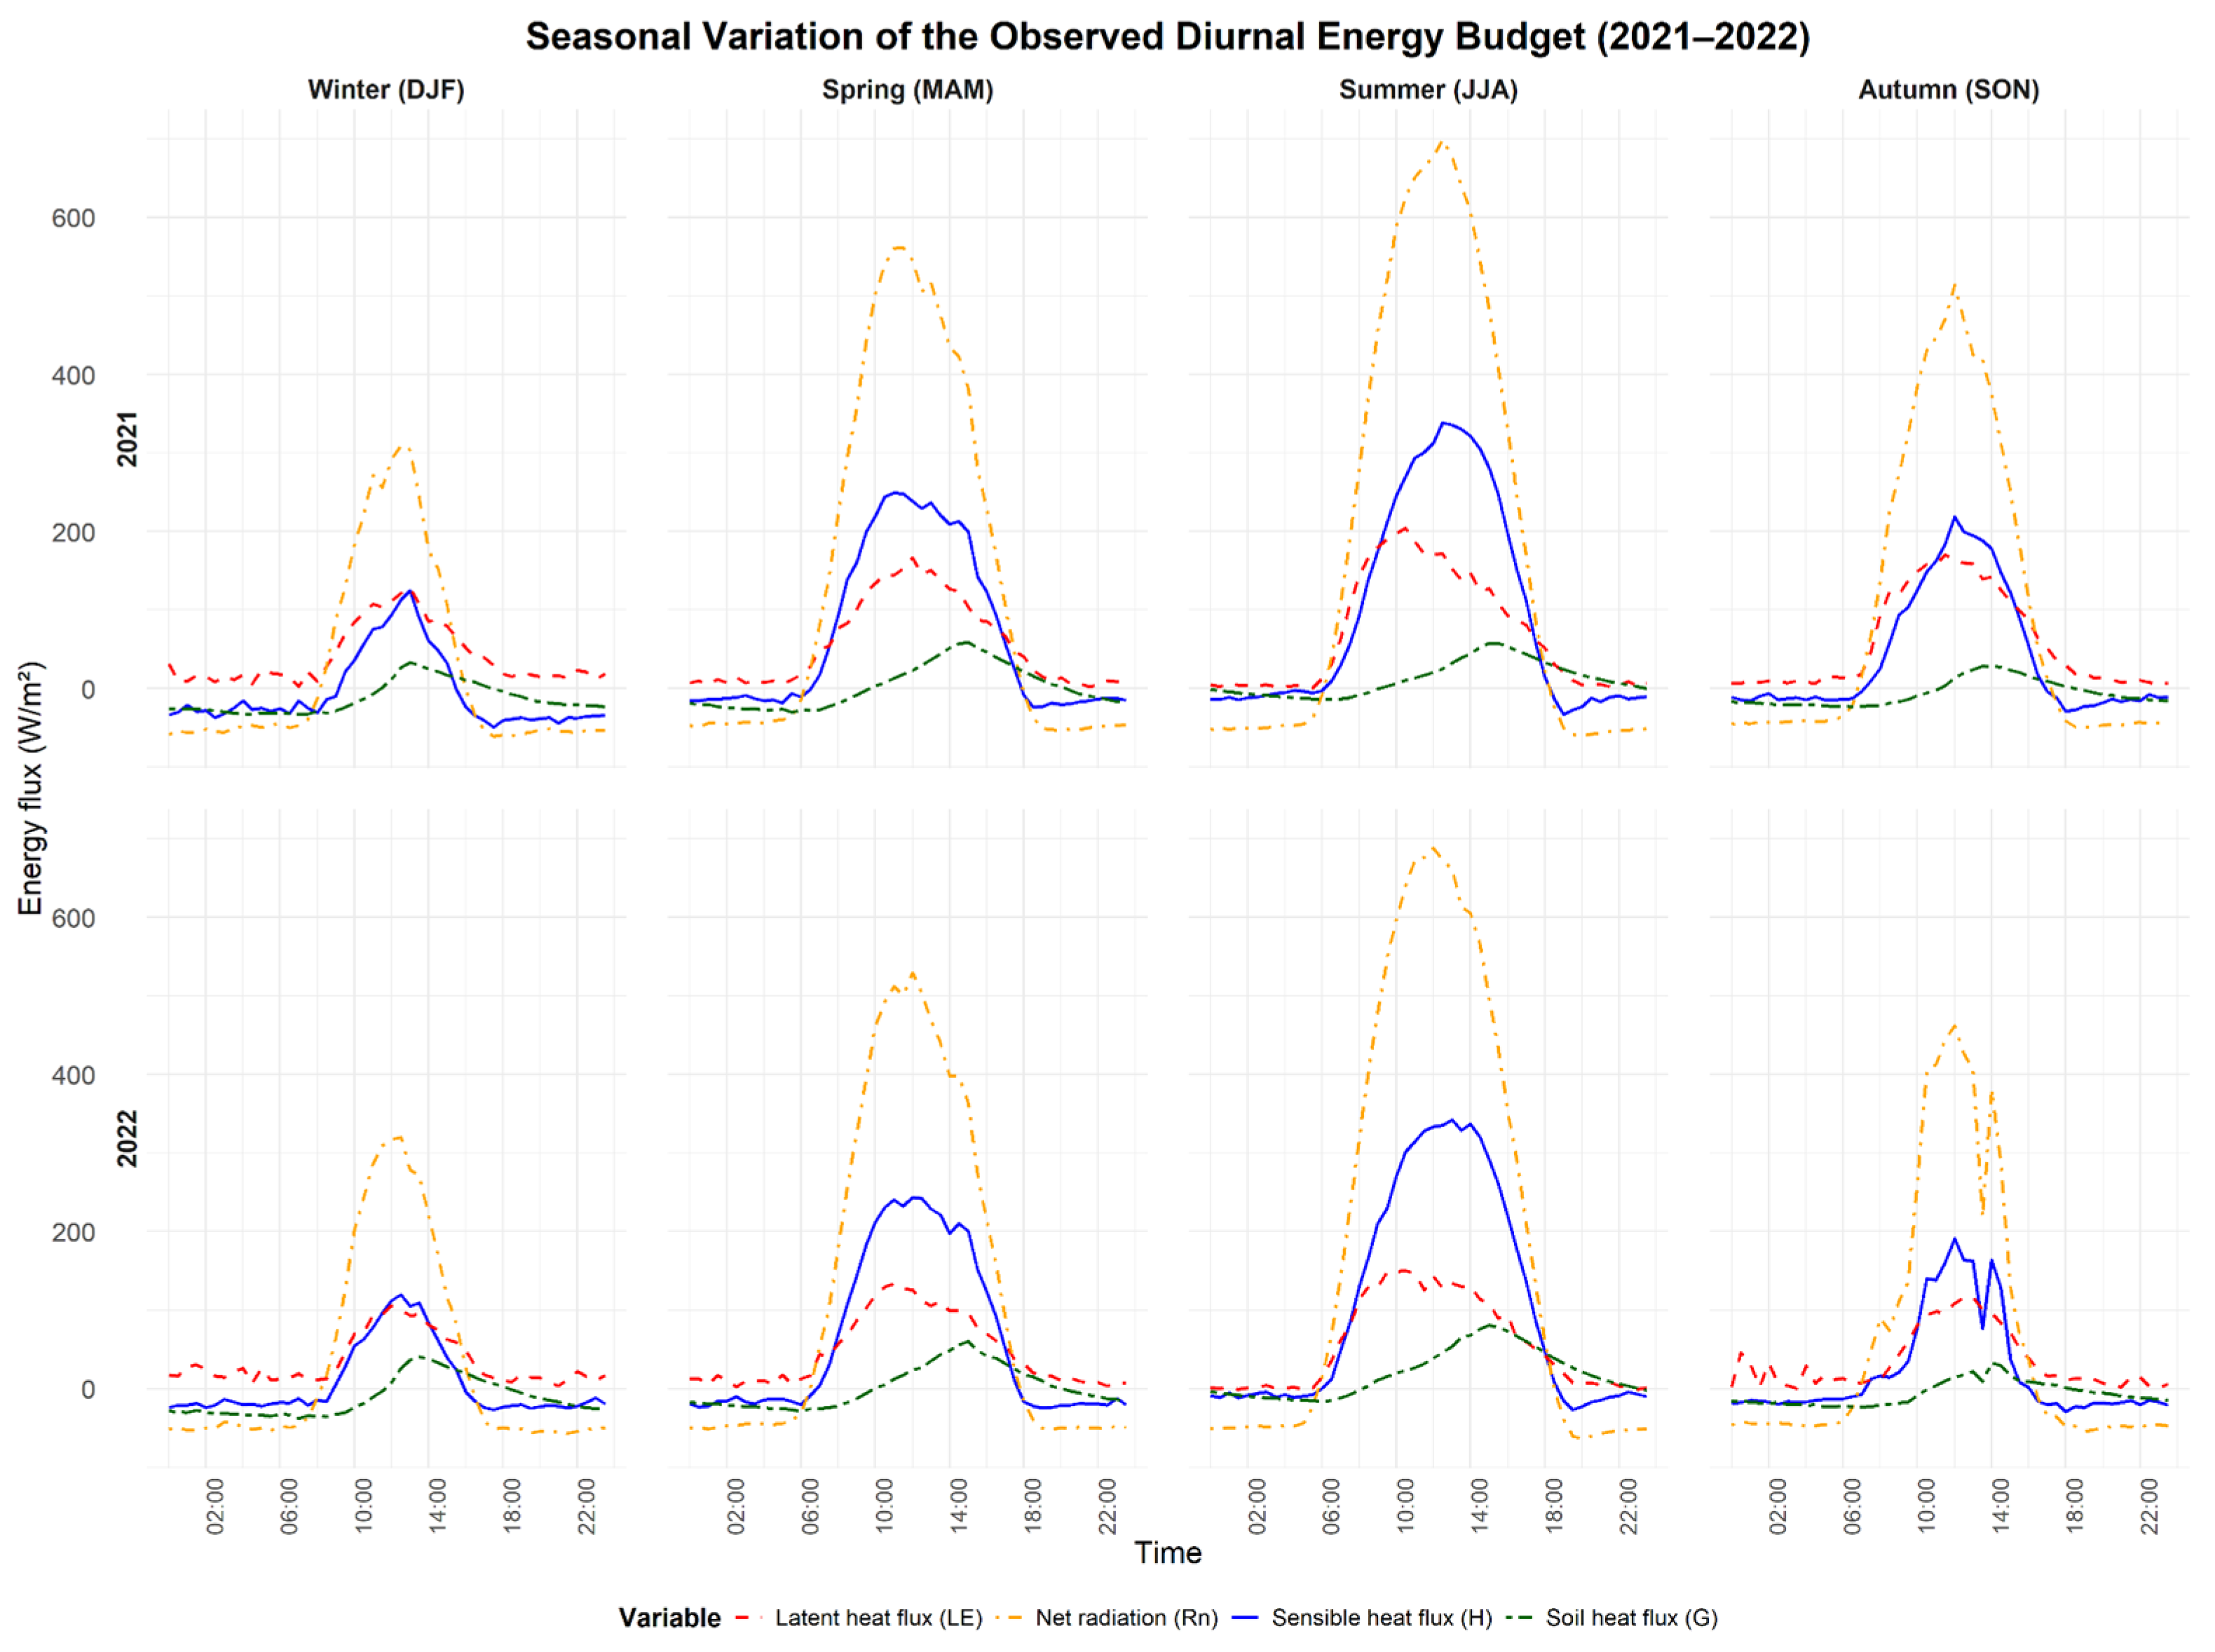
Analysis of daily energy flows (Figure 5) reveals a marked seasonal contrast in the behavior of the citrus orchard. During the summer (JJA), the annual maximum values of all components of the energy balance are observed, with Rn reaching 699 W m−2, H of 338 W m−2, and LE of 172 W m−2. However, this season is characterized by a clear dominance of H over LE, with an H/LE ratio exceeding 1.6 during the midday period. This imbalance, more pronounced in 2022 than in 2021, is a direct indicator of severe water stress that limits ET and explains the greater challenges for modeling during this period.
In spring (MAM), the system exhibits more balanced behavior, with Rn values reaching up to 561 W m−2, H of 249 W m−2, and LE of 166 W m−2, maintaining an H/LE ratio of approximately 1.5. The transition from negative nighttime values to daytime maximums occurs gradually and predictably, creating ideal conditions for modeling. This stability in the energy balance, combined with adequate water availability, allows the SAFER model to achieve its maximum accuracy during the spring season.
Autumn (SON) exhibits a marked reduction in all energy fluxes, with Rn decreasing to 469 W m−2, H to 219 W m−2, and LE to 160 W m−2, accompanied by notable interannual variability. The differences between 2021 and 2022 are particularly evident in LE fluxes, which show a 30% reduction in the drier year. This season is also characterized by nocturnal condensation events, evidenced by positive LE values during the night, which adds complexity to modeling processes.
Winter (DJF) represents the most stable scenario for modeling, with the lowest annual values in all energy fluxes: Rn of 320 W m−2, H of 125 W m−2, and LE of 129 W m−2, along with prolonged nighttime periods with negative fluxes. Low evaporative demand and predictable system behavior allow the model to operate with high accuracy under these conditions. Significant heat loss from the ground, indicated by negative G values down to −35 W m−2, completes the picture of this season of minimal biological activity and maximum environmental stability.
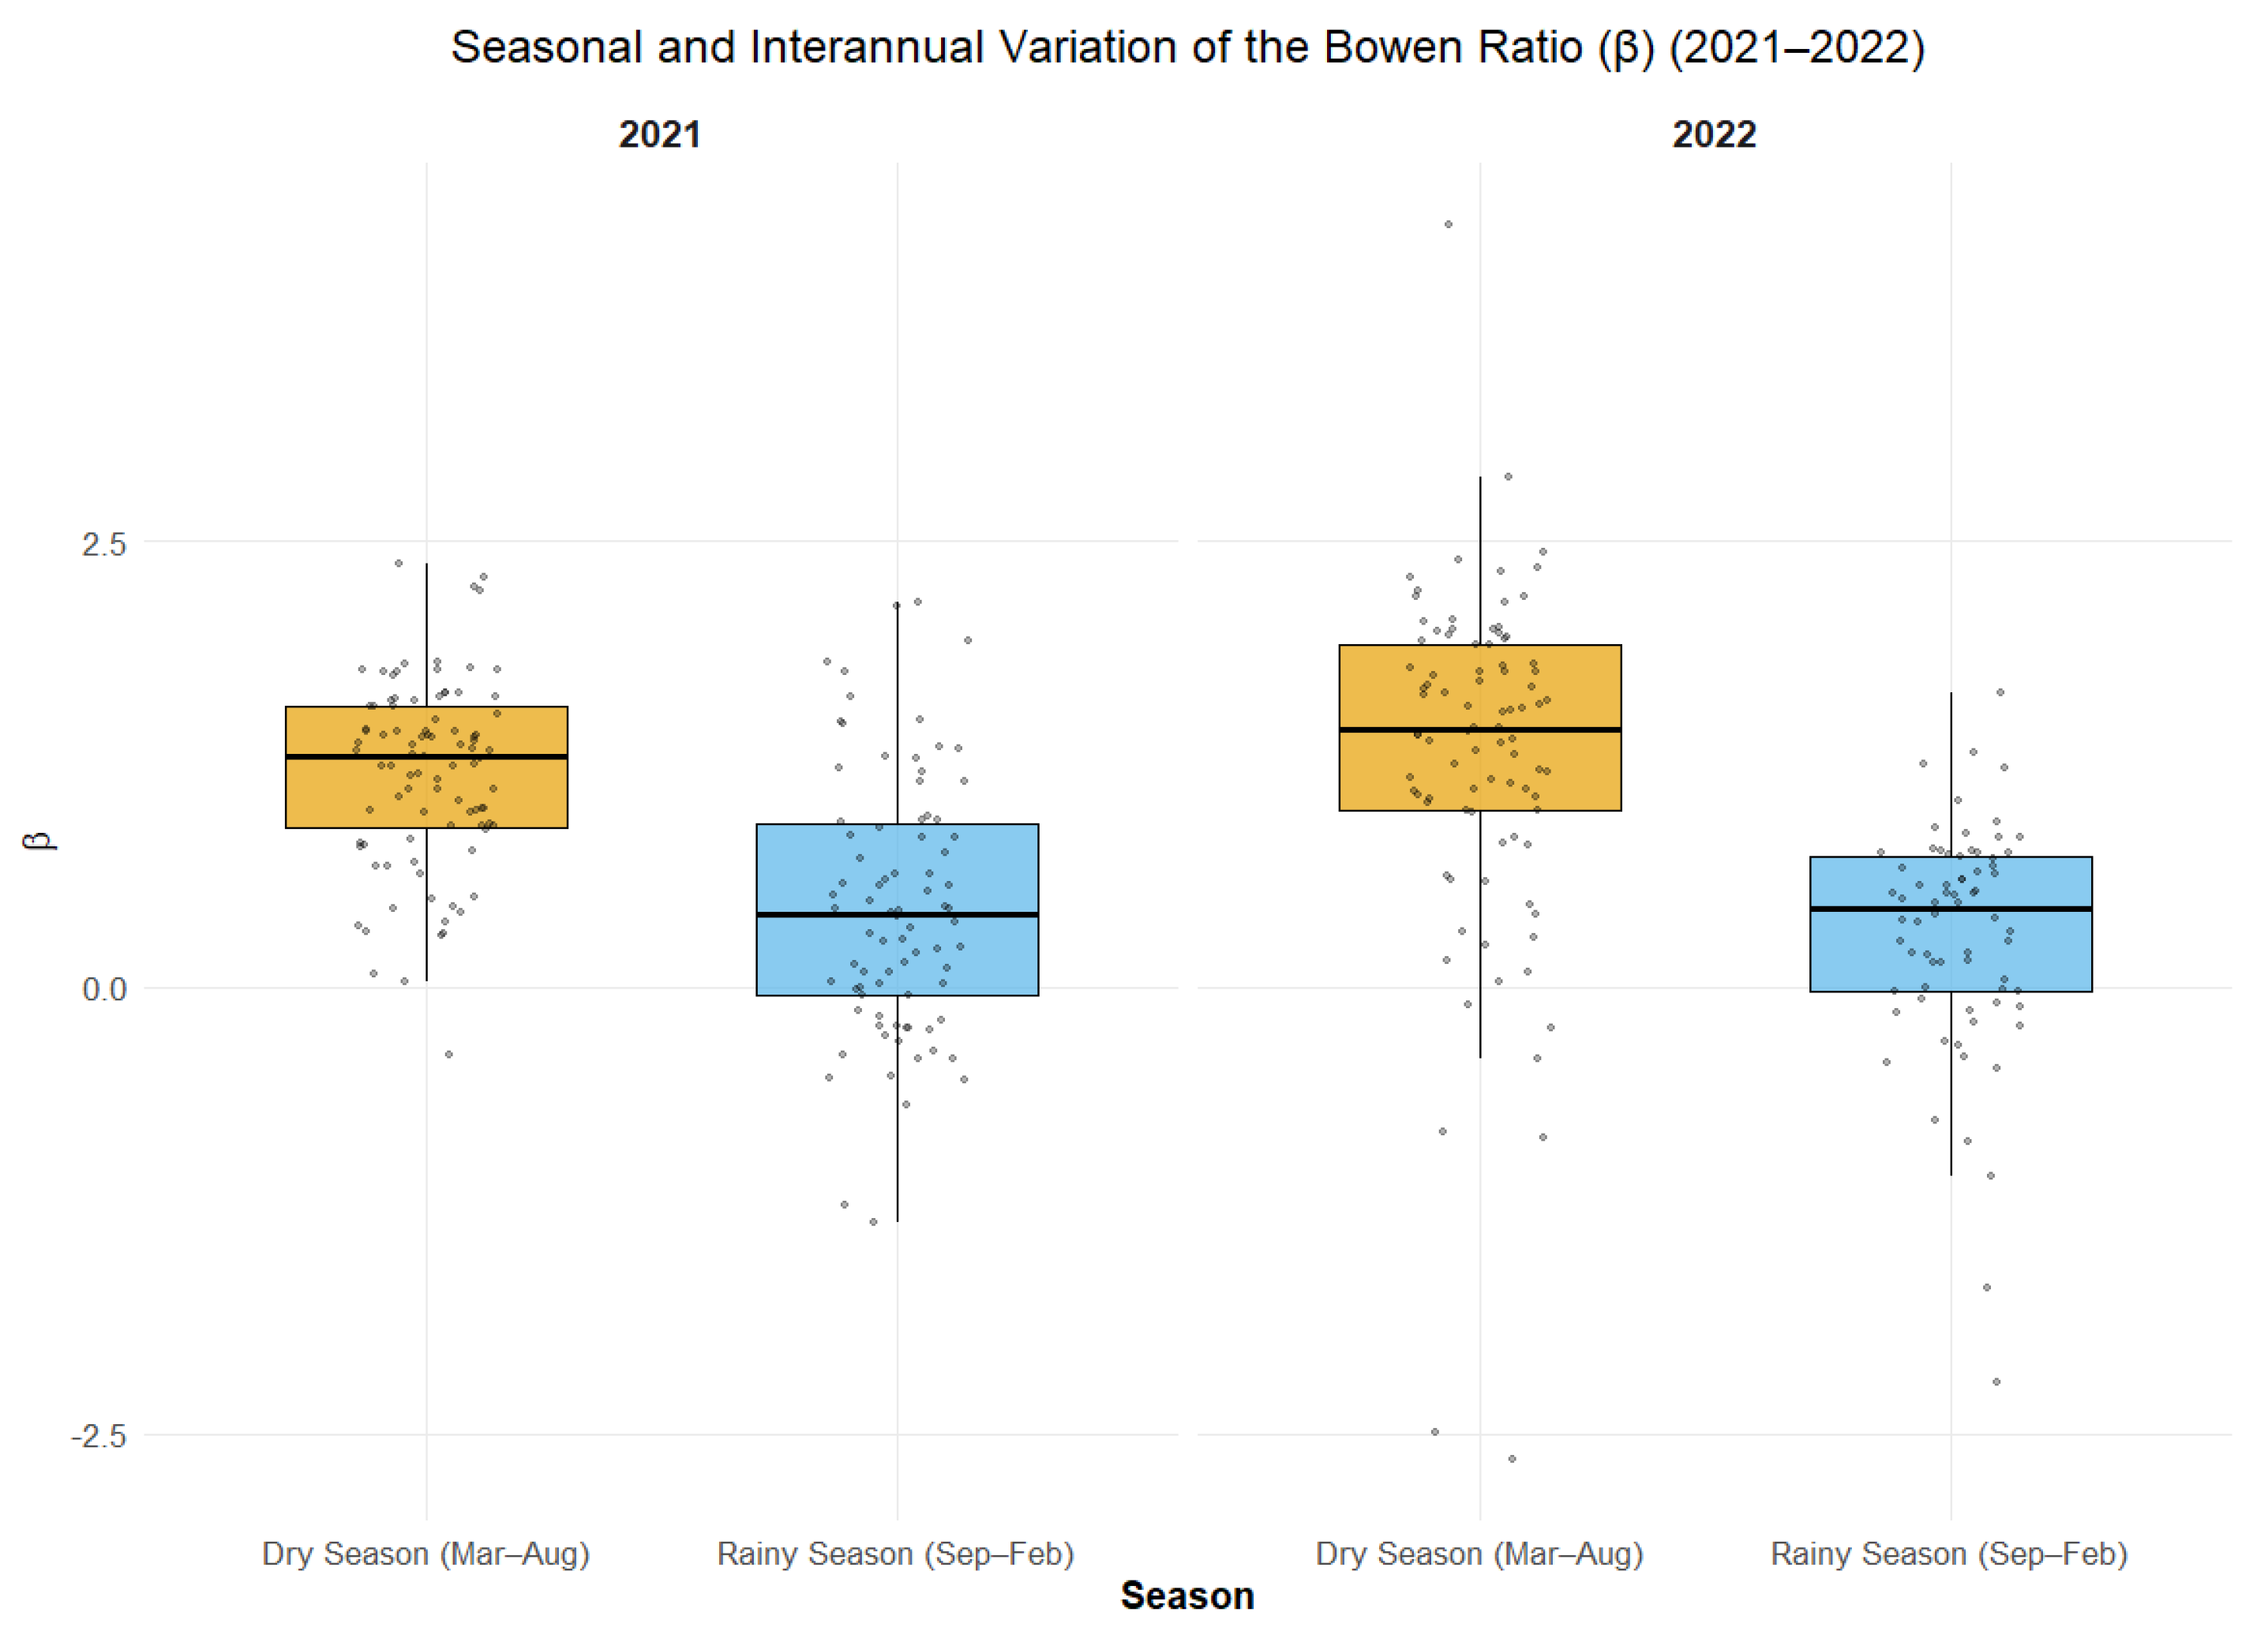
In Figure 6, the analysis of the Bowen ratio (β) reveals a clear difference in the performance of the SAFER model between dry and rainy seasons during the years 2021 and 2022. In the rainy season, consistently low β values (β = 0.45 in 2021; β = 0.29 in 2022) reflected conditions of high water availability and LE dominance, allowing the model to achieve high accuracy (R2 = 0.89 in 2021; R2 = 0.85 in 2022) due to the predictable linear relationship between remote sensing variables and E T a . In contrast, during the dry season, high and variable β values (β = 1.19 in 2021; β = 1.29 in 2022) indicated a dominance of H and severe water stress, resulting in lower model accuracy (R2 = 0.35 in 2021; R2 = 0.17 in 2022) due to the nonlinear nature of energy flows under water-limited conditions. This marked seasonal difference highlights the need to incorporate water stress parameters to improve E T a estimates in dry periods.
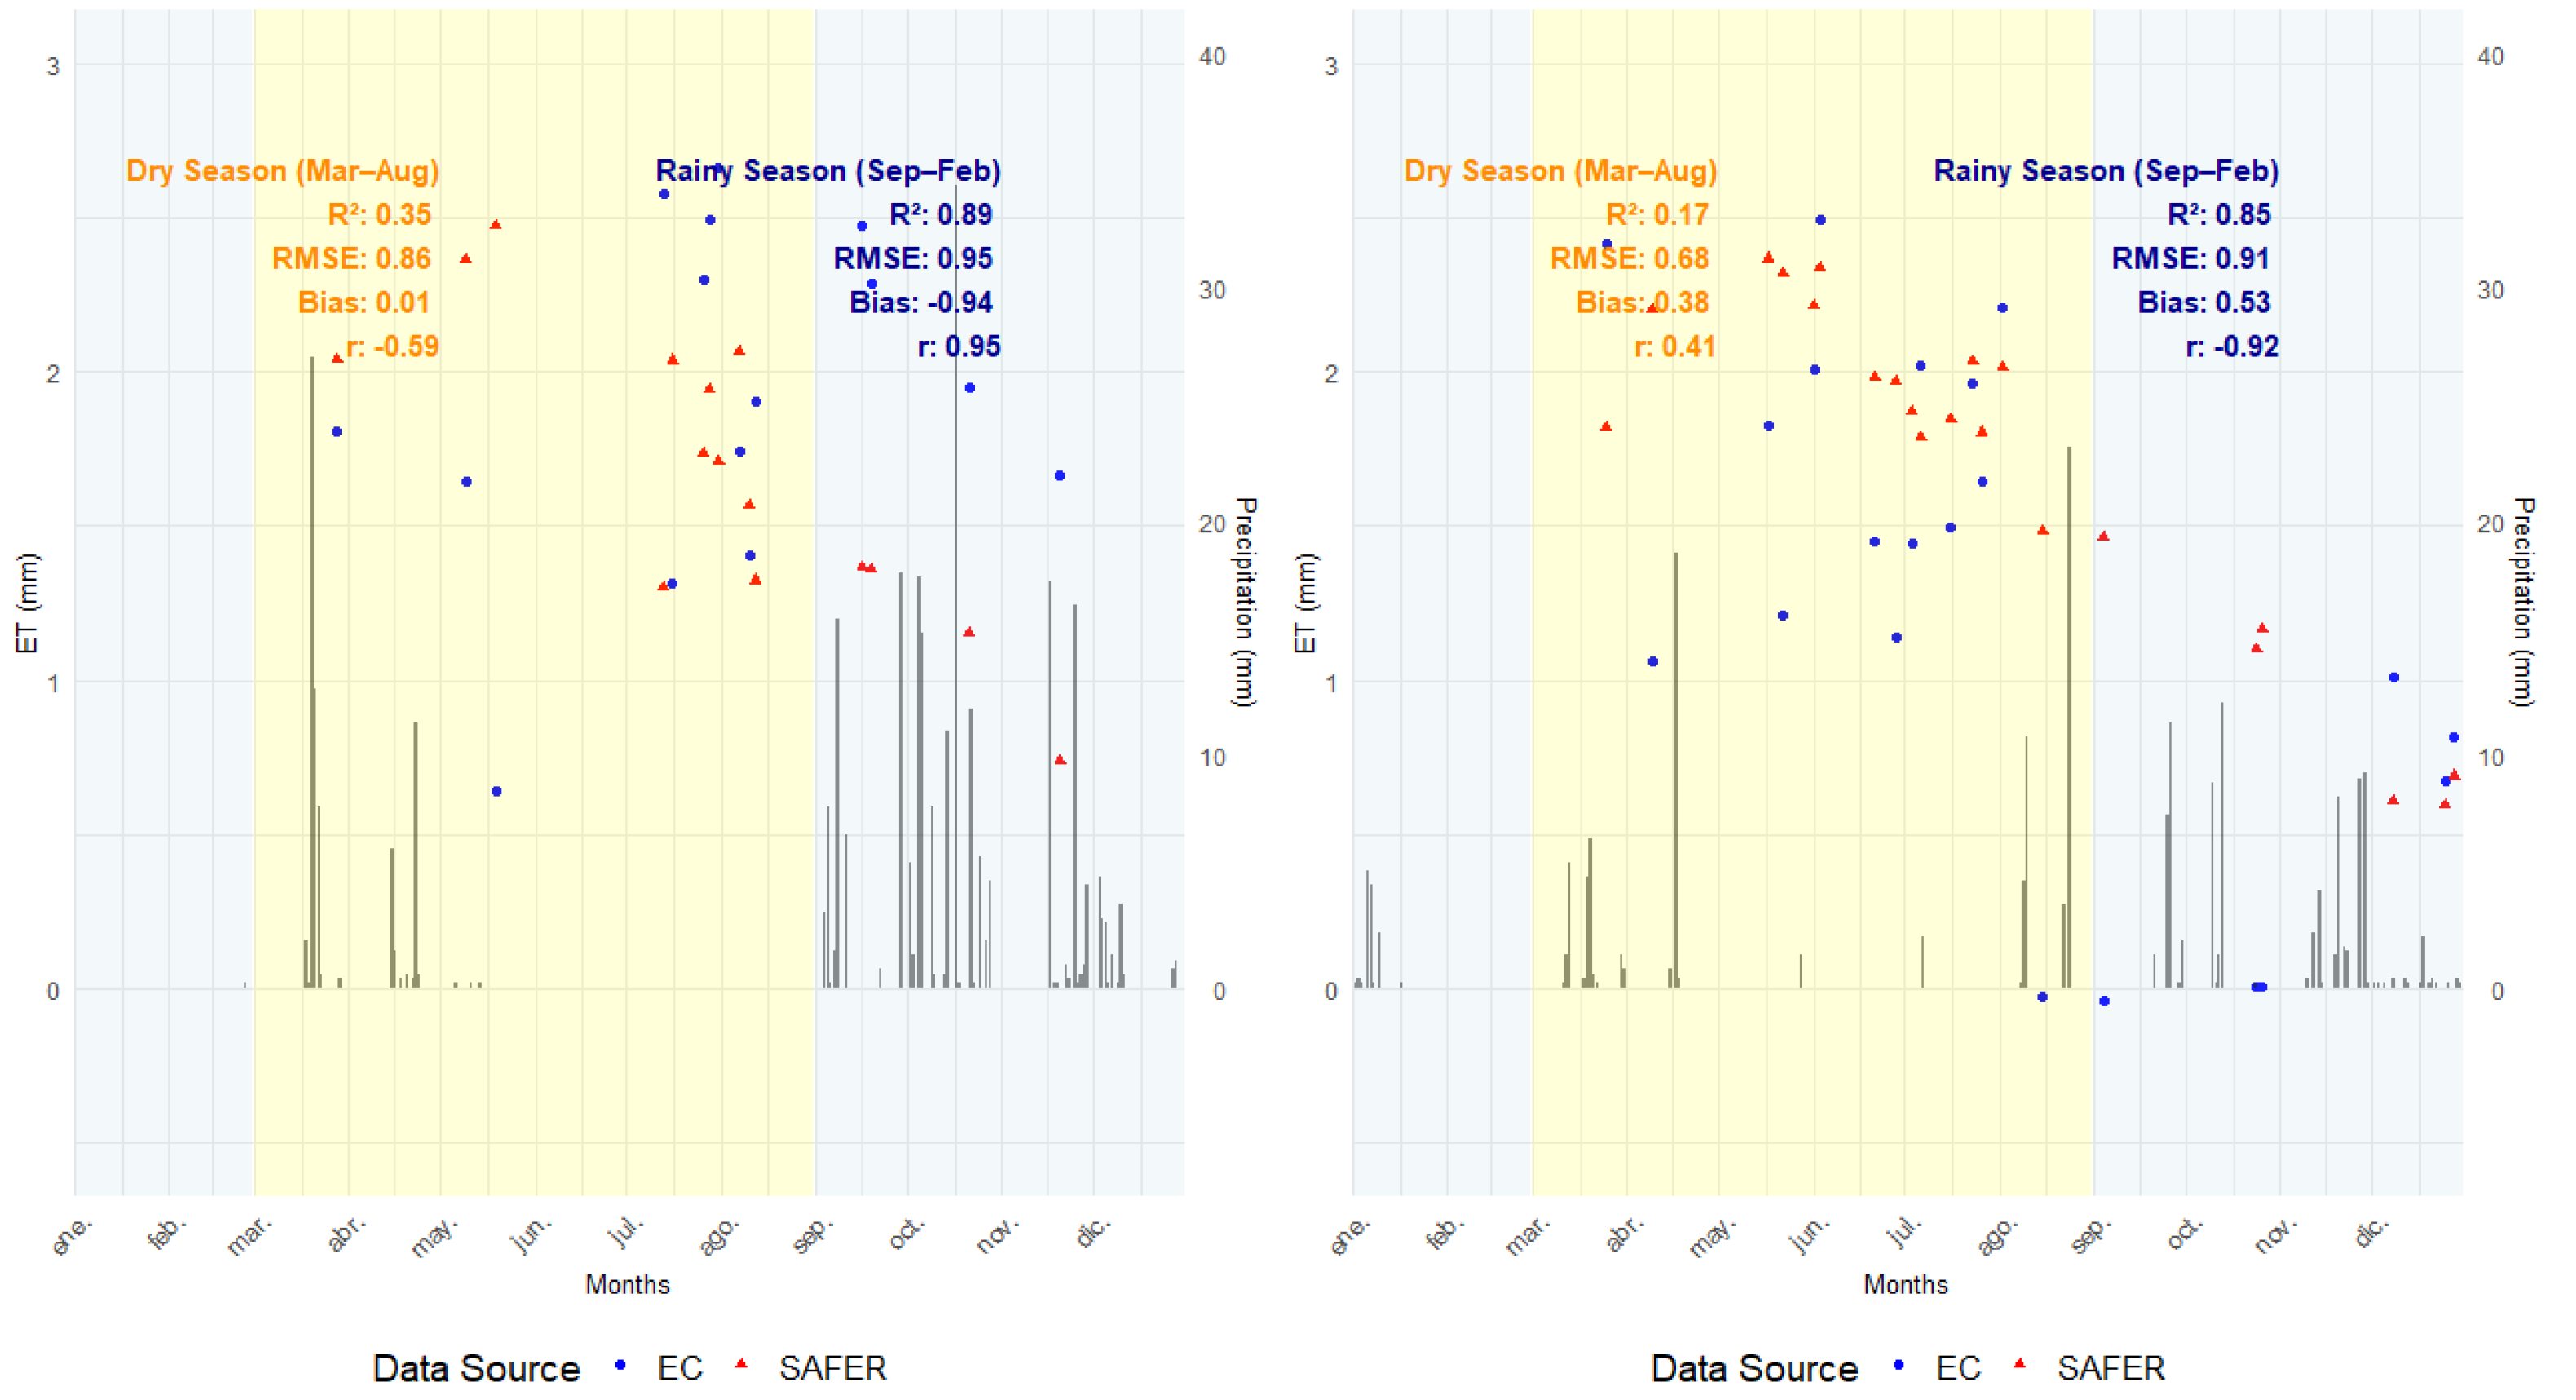
The validation of the SAFER model against EC-derived E T a (Figure 7) revealed marked seasonal variability in performance. During the dry season (March–August), model accuracy was substantially lower, with R2 of 0.35 in 2021 and 0.17 in 2022, indicating limited explanatory power (35.2% and 16.7%, respectively). This decline was attributed to extreme climatic conditions, which intensified plant water stress and limited ET. Consequently, the model tended to underestimate ET, as evidenced by RMSE values of 0.86 mm day−1 (2021) and 0.68 mm day−1 (2022) and low correlation coefficients (r = −0.59 and 0.41, respectively), reflecting its reduced sensitivity to water-limited conditions. The global analysis for 2021 (n = 15 days) yielded an R2 of 0.18, an RMSE of 0.88 mm day−1, and an MBE of −0.25 mm day−1, indicating a slight overall underestimation.
Conversely, model performance improved significantly during the rainy season (September–December), with R2 values of 0.89 (2021) and 0.85 (2022), indicating strong agreement between modeled and observed ET. More favorable atmospheric conditions contributed to increased water availability and reduced thermal stress, enhancing model reliability. However, the model exhibited a negative MBE of −0.94 mm day−1 in 2021 and a positive MBE of 0.53 mm day−1 in 2022, indicating a tendency to under- or overestimate ET depending on the year. Despite these biases, correlation coefficients remained high (r = 0.95 in 2021 and r = −0.92 in 2022), indicating a strong temporal alignment between the modeled and observed fluxes. The global analysis for 2022 (n = 21 days) showed improved integrated performance, with an R2 of 0.38, an RMSE of 0.75 mm day−1, and an MBE of 0.42 mm day−1.
Normalized Difference Vegetation Index (NDVI) dynamics further explain seasonal ET patterns. During the rainy season, NDVI values increased markedly (up to 0.93), reflecting enhanced vegetation activity and canopy development, which supported higher ET rates. In contrast, NDVI values declined during the dry season (as low as 0.41), consistent with reduced photosynthetic capacity and vegetation cover under drought stress. These findings underscore that while NDVI is incorporated into the E T f r calculation of the SAFER model, its current parameterization does not fully capture the complex interactions between vegetation dynamics and water stress under extreme climatic conditions. The model’s performance limitations during the dry season suggest that the relationship between NDVI and evaporative fraction becomes nonlinear under moisture-limited regimes, where vegetation indices alone cannot adequately represent stomatal regulation and soil moisture constraints. This underscores the need for improved model formulations that better account for the dynamic coupling between vegetation status and water availability, potentially through the integration of additional stress indices or modified parameterizations of the NDVI-ET relationship during periods of meteorological drought.
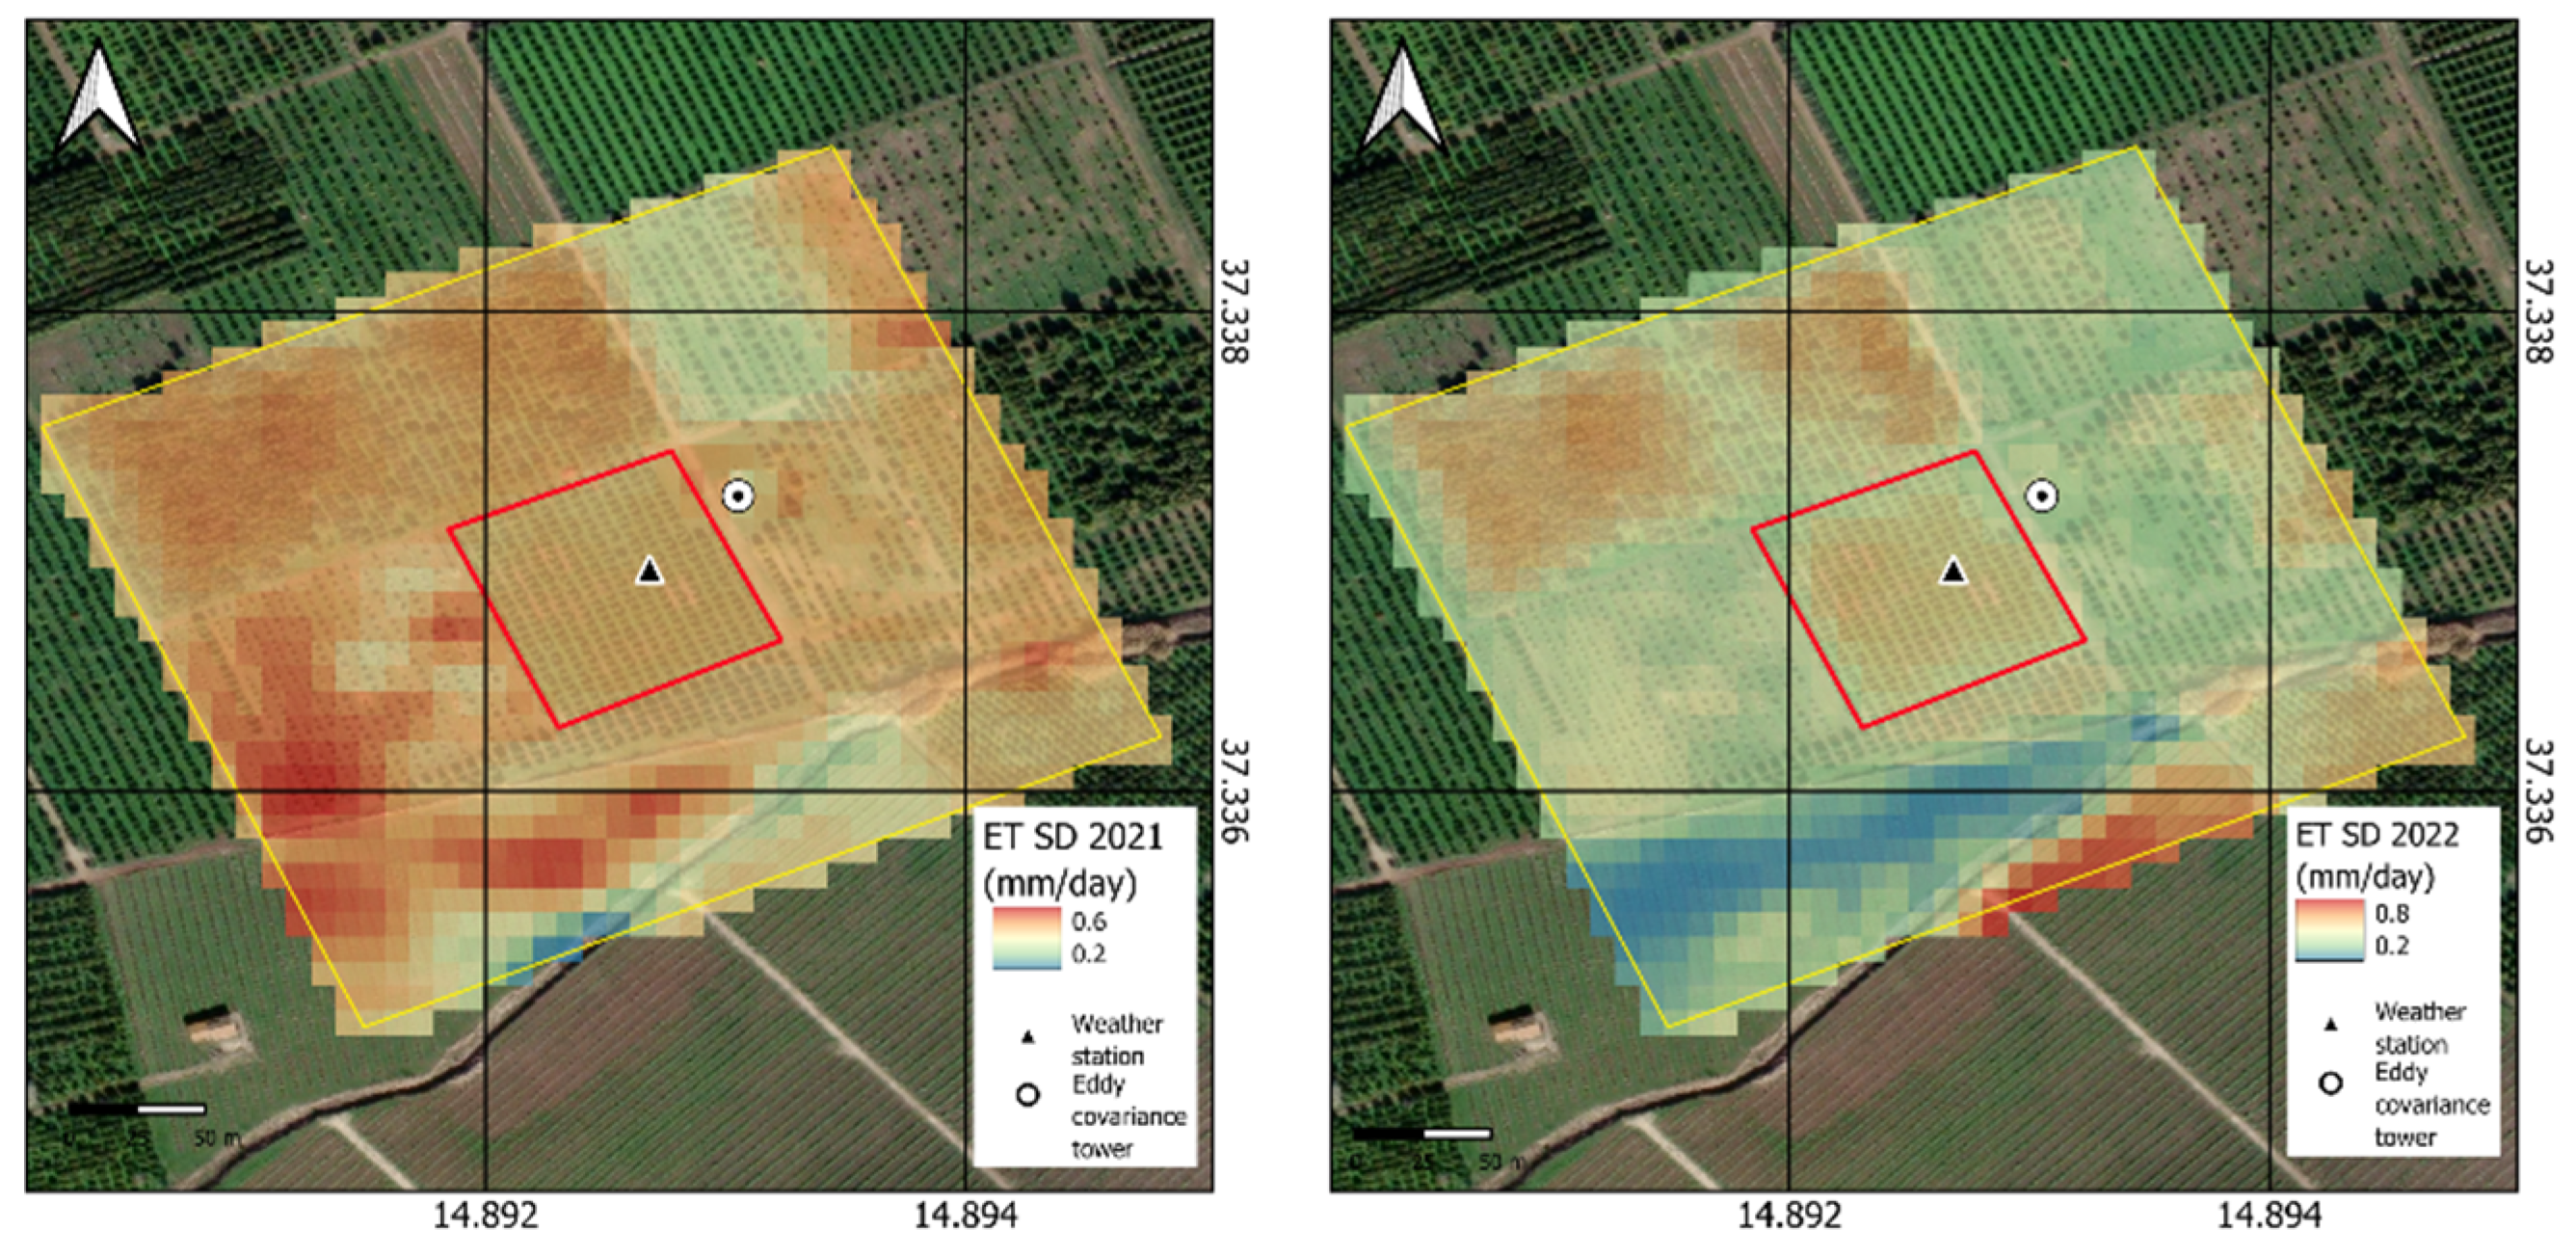
In Figure 8 color scale represents ET variability in mm day−1, ranging from approximately 0.2 mm day−1 (blue) to higher values of 0.6 mm day−1 in 2021 and up to 0.8 mm day−1 in 2022 (red). The study site is outlined in yellow, with the flux tower (black triangle) and a specific region of interest marked by the red square.
In 2021, ET variability is more pronounced in the southwestern section, where values exceed 0.6 mm day−1, while the central and northeastern parts exhibit lower variability, ranging from 0.2 to 0.4 mm day−1. In contrast, the 2022 map shows a more homogeneous distribution of ET variability across the study site [34], with slightly increased values in the southern region (~0.8 mm day−1). The decrease in localized hotspots of high variability and the more uniform spatial distribution in 2022 suggest potential shifts in land cover characteristics, atmospheric conditions, or differences in irrigation and crop growth patterns between the years. Additionally, the variability within the red-marked region near the flux tower appears lower in 2022 than in 2021, indicating possible changes in energy flux dynamics or measurement conditions.

Model Validation with Error Metrics

Beyond R2, we now report RMSE and MBE to provide a more comprehensive assessment of SAFER performance. Over the whole validation period, SAFER yielded RMSE (0.88 mm day−1 and 0.75 mm day−1), and MBE (−0.25 mm day−1 and 0.42 mm d−1), with R2 (0.18 and 0.38) for 2021 and 2022, respectively. When stratified by season, dry-season errors increased RMSE, and MBE patterns, indicating inconsistent model behavior under water-limited conditions (Table 3). In 2021, the slightly positive MBE (0.01 mm d−1) suggested minor overestimation during dry periods, while in 2022 the negative correlation coefficient (r = −0.59) revealed inverse patterns between observed and modeled ET. These patterns are consistent with the energy-partition shift observed during the dry season.
The results are presented for the entire period, as well as separately for the rainy and dry seasons. Metrics include R2, RMSE, and MBE. Values are reported in mm d−1 (MBE < 0 indicates underestimation).

4. Discussion

The calibration and validation of the SAFER model under Mediterranean conditions revealed its strong potential for estimating E T a in citrus orchards. When calibrated with local flux tower data and remote sensing imagery, the model demonstrated reliable agreement with observed ET values, especially during the rainy season. The model achieved high R2 (0.89 in 2021 and 0.85 in 2022) under cooler and wetter conditions, suggesting that SAFER performs optimally when soil moisture is not a limiting factor. These findings align with previous research conducted in tropical conditions [19] where the SAFER algorithm demonstrated an overall accuracy of approximately 75% in citrus orchards under humid climates in the eastern Amazon. Both studies highlight the model’s effectiveness across diverse climatic conditions if sufficient calibration is performed. A simple log-linear regression was adopted to demonstrate SAFER’s applicability and ensure reproducible calibration with limited data. This choice enhances model interpretability and transferability across sites. Nevertheless, future work should systematically test alternative calibration strategies to further improve robustness, including nonlinear regression (e.g., generalized additive models or polynomial terms), regularized linear models (ridge/LASSO) to handle multicollinearity, and machine-learning approaches (e.g., tree-based ensembles or kernel methods). Any such extensions should be evaluated with strict out-of-sample cross-validation, assessed for extrapolation risk, and accompanied by model-agnostic diagnostics to preserve interpretability in operational contexts.
However, our study also revealed a marked decline in SAFER performance during dry summer months (March–August), with substantially lower R2 values (0.35 in 2021 and 0.167 in 2022), along with high RMSE and negative or low correlation coefficients. These periods are characterized by intense solar radiation, elevated air temperatures, and reduced precipitation, all of which contribute to water stress in citrus crops. Under these conditions, SAFER tended to underestimate. This limitation can be attributed to the model’s reliance on vegetation indices, particularly NDVI, which may not promptly reflect physiological stress when the canopy remains green. Similar limitations were observed by Abou Ali et al. [3], who reported reduced model performance under semi-arid conditions due to difficulties in capturing the reduction in transpiration caused by soil moisture deficits.
Addressing the lower performance of the SAFER model during the dry season is essential for enhancing its operational reliability. The elevated Bowen ratio values (β > 1.2) confirm that energy partitioning was dominated by sensible heat flux, a regime where the empirical relationship between NDVI and the evaporative fraction becomes nonlinear. If model improvements remain limited after implementing adjustments for water stress, the underlying cause may be structural. The model’s foundation on linear regressions may be inherently constrained in capturing the complex, threshold-driven physiological responses of citrus trees to severe soil moisture deficit, where stomatal regulation decouples transpiration from both vegetation indices and atmospheric demand.
Despite these seasonal limitations, the SAFER model effectively represented the spatial heterogeneity E T a across the orchard. In 2021, E T a variability was more pronounced, particularly in the southwestern portion of the field, possibly reflecting variations in irrigation distribution, plant development, or microclimatic influences. By contrast, E T a it was more uniformly distributed in 2022, likely due to consistent irrigation and vegetative coverage. These spatial differences emphasize the utility of SAFER in identifying zones of differential water use, supporting precision agriculture strategies.
Our findings are consistent with other SAFER-based studies in diverse cropping systems. Teixeira et al. [4] applied the model in Mediterranean lemon orchards. They found that it accurately reproduced mid-season ET values (3–4 mm day−1) and crop coefficients in the 0.5–0.8 range, which were comparable to our estimates. Similarly, Do Nascimento Leão et al. [19] observed ET rates in citrus crops that aligned with lysimetric and eddy covariance-based values in the humid tropics, further supporting the robustness of the SAFER model across climatic zones.
From a practical standpoint, these results reinforce the applicability of SAFER as a decision-support tool for irrigation recommendations. Its ability to estimate ETa using satellite imagery facilitates near-real-time monitoring of crop water needs, reducing dependence on extensive field instrumentation. This capability is particularly critical in Mediterranean regions, where water scarcity requires an efficient irrigation tool. SAFER estimates enable growers to anticipate peak water demand during the summer and adjust irrigation volumes accordingly, thereby minimizing over-irrigation and enhancing water use efficiency.
Nevertheless, the current model configuration has key limitations. The lack of a mechanism to detect physiological plant responses, such as stomatal closure under stress, may mean that E T a it may be overestimated in drought scenarios. Integrating indicators of plant water status, such as stem water potential or stomatal conductance, as suggested by Anderson et al. [35], could improve model responsiveness. Likewise, incorporating soil moisture data or coupling SAFER with a soil water balance model may help correct E T a estimates when water availability limits transpiration. Abou Ali et al. [3] and Agam & Berliner [36] emphasize the importance of accounting for dew formation and nighttime condensation, which may affect latent heat fluxes and are often underrepresented in remote sensing-based models.
Another issue is model transferability. Although the SAFER model was successfully calibrated for this Mediterranean orchard, its empirical coefficients (a and b) differed from those used in other studies, indicating the need for site-specific adjustments. The ability to apply the model to other crops, climates, or management systems may require localized recalibration. As noted by Tramblay et al. [16], variability in regional climate responses requires robust calibration frameworks to ensure accurate modeling.
Future enhancements to the SAFER model should include:
  • Integration of physiological crop indicators to account for drought-induced transpiration reduction.
  • Coupling with soil moisture sensors or remote sensing of surface wetness to detect water deficits.
  • Phenological modeling to capture seasonal shifts in canopy function, particularly in evergreen species like citrus.
  • Expansion of calibration efforts across different orchard systems to develop region-specific coefficients.
The persistent challenges in estimating E T a during the dry season, as evidenced by the low R2 and high RMSE of the SAFER model, underscore a fundamental limitation of linear regression-based approaches in capturing the nonlinear dynamics of water-stressed ecosystems. Our findings suggest that the relationship between remote sensing indices (like NDVI) and evaporative fraction becomes highly nonlinear under moisture deficits, a complexity that simple empirical models struggle to represent. This limitation highlights a promising avenue for future research: the integration of advanced machine learning (ML) algorithms that are explicitly designed to model such nonlinear relationships. Recent studies strongly support this direction. For instance, Wang et al. [37] demonstrated that ensemble ML frameworks, such as XGBoost, significantly outperformed physical models in estimating latent heat flux. Meanwhile, Haonan et al. [38] found that Back Propagation Neural Networks (BP) achieved high accuracy in predicting ET for crops in challenging saline-alkali soils. Furthermore, Amani et al. [39] showed that algorithms like Random Forest (RF) and Support Vector Machine (SVM) could provide robust, climate-adaptive E T a estimates using minimal satellite inputs, with RF identifying land surface temperature as a critical predictor—a variable highly sensitive to water stress. Therefore, future iterations of ET models for Mediterranean agroecosystems could be substantially improved by adopting or hybridizing with these advanced ML techniques to better capture the complex interplay between vegetation, soil moisture, and atmospheric demand, especially under the water-limited conditions that are becoming increasingly prevalent.

5. Conclusions

This study confirms SAFER’s reliability for estimating E T a and surface energy balance components in Mediterranean citrus orchards. The model performed well under non-stressed, wet season conditions, producing high R2 values and realistic E T a estimates when validated against eddy covariance flux tower data. However, its accuracy declined significantly during the dry season, highlighting limitations in capturing crop water stress with current vegetation index-based approaches.
The results emphasize the critical role of local calibration to improve SAFER’s accuracy under different environmental conditions. Our findings align with previous studies in both tropical and semi-arid climates, confirming the broad applicability of SAFER when site-specific calibration is undertaken. Spatial variability analyses further demonstrated the model’s ability to support irrigation by identifying areas with differing water demands.
Moreover, the SAFER model offers a practical and cost-effective alternative to traditional ET estimation methods, especially in areas lacking continuous ground-based measurements. Its compatibility with freely available satellite data (e.g., Sentinel-2) and its integration into open-source tools make it accessible for operational use by farmers, researchers, and policymakers alike. This democratization of ET monitoring tools can contribute to more equitable and efficient water distribution strategies, particularly in regions facing increasing water scarcity due to climate change.
Despite these strengths, further refinement is necessary to improve the model’s sensitivity to biophysical changes during drought stress. Enhancing the model to account for physiological responses and soil moisture dynamics would significantly bolster its reliability across diverse climatic conditions and cropping systems. Continued research and development are also essential for establishing generalized calibration protocols that support large-scale implementation.
In conclusion, the SAFER model shows great promise as a remote sensing-based decision-support tool for sustainable water resource management in Mediterranean agriculture and beyond. Its capacity to deliver accurate, spatially explicit ET estimates provides a foundation for precision irrigation, adaptive drought response, and informed water policy, all of which are vital for building resilience in agricultural systems under a changing climate.

Author Contributions

Conceptualization, K.A.S.L. and G.A.J.; methodology, K.A.S.L.; software, K.A.S.L.; validation, K.A.S.L., H.M.A.I. and G.F.P.; formal analysis, K.A.S.L.; investigation, K.A.S.L. and G.A.J.; resources, H.M.A.I. and S.C.; data curation, K.A.S.L.; writing—original draft preparation, K.A.S.L., D.V., G.A.J. and H.M.A.I.; writing—review and editing, H.M.A.I., S.C., J.F.d.O.-J. and G.L.M.; visualization, K.A.S.L.; supervision, H.M.A.I., D.V. and S.C.; project administration, H.M.A.I. and S.C.; funding acquisition, H.M.A.I. and S.C. All authors have read and agreed to the published version of the manuscript.

Funding

Conselho Nacional de Desenvolvimento Científico e Tecnológico (CNPq), Coordination for the Improvement of Higher Education Personnel (CAPES), award number 001. The study was carried out within the framework of the project PRIN 2022 SWAM4Crops “Smart Technologies and Remote Sensing methods to support the Sustainable Agriculture Water Management of Mediterranean Woody Crops”.

Data Availability Statement

The original contributions presented in this study are included in the article. Further inquiries can be directed to the corresponding author.

Acknowledgments

The authors have reviewed and edited the output and take full responsibility for the content of this publication.

Conflicts of Interest

The authors declare no conflicts of interest.

References

  1. Liu, Y.; Chen, R.; Han, C.; Liu, Z.; Zhao, Y.; Yang, Z. Research on the Characteristics, Driving Mechanism and Spatial Pattern of Carbon Sink in Alpine Ecosystem: A Study Case of Qilian Mountains. Agric. For. Meteorol. 2024, 356, 110166. [Google Scholar] [CrossRef]
  2. Kang, M.; Cho, S. Progress in Water and Energy Flux Studies in Asia: A Review Focused on Eddy Covariance Measurements. J. Agric. Meteorol. 2021, 77, 2–23. [Google Scholar] [CrossRef]
  3. Abou Ali, A.; Bouchaou, L.; Er-Raki, S.; Hssaissoune, M.; Brouziyne, Y.; Ezzahar, J.; Khabba, S.; Chakir, A.; Labbaci, A.; Chehbouni, A. Assessment of Crop Evapotranspiration and Deep Percolation in a Commercial Irrigated Citrus Orchard under Semi-Arid Climate: Combined Eddy-Covariance Measurement and Soil Water Balance-Based Approach. Agric. Water Manag. 2023, 275, 107997. [Google Scholar] [CrossRef]
  4. Teixeira, A.; Leivas, J.; Struiving, T.; Reis, J.; Simão, F. Energy Balance and Irrigation Performance Assessments in Lemon Orchards by Applying the SAFER Algorithm to Landsat 8 Images. Agric. Water Manag. 2021, 247, 106725. [Google Scholar] [CrossRef]
  5. Consoli, S.; Stagno, F.; Vanella, D.; Boaga, J.; Cassiani, G.; Roccuzzo, G. Partial Root-Zone Drying Irrigation in Orange Orchards: Effects on Water Use and Crop Production Characteristics. Eur. J. Agron. 2017, 82, 190–202. [Google Scholar] [CrossRef]
  6. Rallo, G.; Paço, T.A.; Paredes, P.; Puig-Sirera; Massai, R.; Provenzano, G.; Pereira, L.S. Updated Single and Dual Crop Coefficients for Tree and Vine Fruit Crops. Agric. Water Manag. 2021, 250, 106645. [Google Scholar] [CrossRef]
  7. Vanella, D.; Ferlito, F.; Torrisi, B.; Giuffrida, A.; Pappalardo, S.; Saitta, D.; Longo-Minnolo, G.; Consoli, S. Long-Term Monitoring of Deficit Irrigation Regimes on Citrus Orchards in Sicily. J. Agric. Eng. 2021, 52, 1193. [Google Scholar] [CrossRef]
  8. Safre, A.L.S.; Nassar, A.; Torres-Rua, A.; Aboutalebi, M.; Saad, J.C.C.; Manzione, R.L.; de Castro Teixeira, A.H.; Prueger, J.H.; McKee, L.G.; Alfieri, J.G.; et al. Performance of Sentinel-2 SAFER ET Model for Daily and Seasonal Estimation of Grapevine Water Consumption. Irrig. Sci. 2022, 40, 635–654. [Google Scholar] [CrossRef]
  9. Aubinet, M.; Vesala, T.; Papale, D. Eddy Covariance: A Practical Guide to Measurement and Data Analysis; Springer: Berlin/Heidelberg, Germany, 2012. [Google Scholar] [CrossRef]
  10. Thaner Dos Santos, H. Análise de Footprint e Eficiência no Uso da Água em Pastagem Natural. Available online: https://locus.ufv.br/server/api/core/bitstreams/1510521b-f917-44c9-b650-385c23317316/content (accessed on 20 May 2025).
  11. Liu, S.; Xu, Z. Micrometeorological Methods to Determine Evapotranspiration. In Observation and Measurement of Ecohydrological Processes; Springer: Berlin/Heidelberg, Germany, 2018; pp. 1–39. [Google Scholar]
  12. Baldocchi, D. Measuring Fluxes of Trace Gases and Energy between Ecosystems and the Atmosphere—The State and Future of the Eddy Covariance Method. Glob. Change Biol. 2014, 20, 3600–3609. [Google Scholar] [CrossRef]
  13. Bastiaanssen, W.G.M.; Menenti, M.; Feddes, R.A.; Holtslag, A.A.M. A Remote Sensing Surface Energy Balance Algorithm for Land (SEBAL) 1. Formulation. J. Hydrol. 1998, 212–213, 198–212. [Google Scholar] [CrossRef]
  14. Catalano, G.A.; Maci, F.; D’Urso, P.R.; Arcidiacono, C. GIS and SDM-Based Methodology for Resource Optimisation: Feasibility Study for Citrus in Mediterranean Area. Agronomy 2023, 13, 549. [Google Scholar] [CrossRef]
  15. Moreira da Silva, M.; Resende, F.C.; Freitas, B.; Aníbal, J.; Martins, A.; Duarte, A. Urban Wastewater Reuse for Citrus Irrigation in Algarve, Portugal—Environmental Benefits and Carbon Fluxes. Sustainability 2022, 14, 10715. [Google Scholar] [CrossRef]
  16. Tramblay, Y.; Koutroulis, A.; Samaniego, L.; Vicente-Serrano, S.M.; Volaire, F.; Boone, A.; Le Page, M.; Llasat, M.C.; Albergel, C.; Burak, S.; et al. Challenges for Drought Assessment in the Mediterranean Region under Future Climate Scenarios. Earth Sci. Rev. 2020, 210, 103348. [Google Scholar] [CrossRef]
  17. De, A.H.; Teixeira, C. Determining Regional Actual Evapotranspiration of Irrigated Crops and Natural Vegetation in the São Francisco River Basin (Brazil) Using Remote Sensing and Penman-Monteith Equation. Remote Sens. 2010, 2, 1287–1319. [Google Scholar] [CrossRef]
  18. Teixeira, A.H.d.C.; Victoria, D.C.; Andrade, R.G.; Leivas, J.F.; Bolfe, E.L.; Cruz, C.R. Coupling MODIS Images and Agrometeorological Data for Agricultural Water Productivity Analyses in the Mato Grosso State, Brazil. In Remote Sensing of the Ocean, Sea Ice, Coastal Waters, and Large Water Regions 2014; SPIE Press: Bellingham, WA, USA, 2014; Volume 9239, pp. 278–291. [Google Scholar] [CrossRef]
  19. do Nascimento Leão, F.; Mercante, E.; Oliveira, W.K.M..; Boas, M.A.V.; Correa, M.M.; Bazzi, C.L.; da Silva, A.C. Determination of Evapotranspiration for Citrus Using SAFER Algorithm in the Oriental Amazon. Remote Sens. Appl. 2025, 38, 101526. [Google Scholar] [CrossRef]
  20. Ramírez-Cuesta, J.M.; Consoli, S.; Longo, D.; Longo-Minnolo, G.; Intrigliolo, D.S.; Vanella, D. Influence of Short-Term Surface Temperature Dynamics on Tree Orchards Energy Balance Fluxes. Precis. Agric. 2022, 23, 1394–1412. [Google Scholar] [CrossRef]
  21. Bonaccorso, B.; Cancelliere, A.; Rossi, G. Detecting Trends of Extreme Rainfall Series in Sicily. Adv. Geosci. 2005, 2, 7–11. [Google Scholar] [CrossRef]
  22. Carmela, V.; Dimitra, R. Analisi del Clima in Sicilia. 2006. Available online: https://iris.unife.it/handle/11392/524203 (accessed on 20 May 2025).
  23. Saitta, D.; Vanella, D.; Ramírez-Cuesta, J.M.; Longo-Minnolo, G.; Ferlito, F.; Consoli, S. Comparison of Orange Orchard Evapotranspiration by Eddy Covariance, Sap Flow, and FAO-56 Methods under Different Irrigation Strategies. J. Irrig. Drain. Eng. 2020, 146, 05020002. [Google Scholar] [CrossRef]
  24. Schmid, H.P. Footprint Modeling for Vegetation Atmosphere Exchange Studies: A Review and Perspective. Agric. For. Meteorol. 2002, 113, 159–183. [Google Scholar] [CrossRef]
  25. Kljun, N.; Calanca, P.; Rotach, M.W.; Schmid, H.P. A Simple Two-Dimensional Parameterisation for Flux Footprint Prediction (FFP). Geosci. Model. Dev. 2015, 8, 3695–3713. [Google Scholar] [CrossRef]
  26. de Oliveira Ferreira Silva, C.; Heriberto de Castro Teixeira, A.; Lilla Manzione, R. Agriwater: An R Package for Spatial Modelling of Energy Balance and Actual Evapotranspiration Using Satellite Images and Agrometeorological Data. Environ. Model. Softw. 2019, 120, 104497. [Google Scholar] [CrossRef]
  27. Teixeira, A.H.d.C.; Leivas, J.F.; Andrade, R.G.; Hernandez, F.B.T.; Momesso, F.R.A. Modelling Radiation and Energy Balances with Landsat 8 Images under Different Thermohydrological Conditions in the Brazilian Semi-Arid Region. In Proceedings of the SPIE Remote Sensing, Toulouse, France, 21–24 September 2015; Volume 9637, pp. 112–125. [Google Scholar] [CrossRef]
  28. Teixeira, A.H.d.C.; Bastiaanssen, W.G.M.; Ahmad, M.D.; Bos, M.G. Reviewing SEBAL Input Parameters for Assessing Evapotranspiration and Water Productivity for the Low-Middle São Francisco River Basin, Brazil: Part A: Calibration and Validation. Agric. For. Meteorol. 2009, 149, 462–476. [Google Scholar] [CrossRef]
  29. Teixeira, A.H.d.C.; Bastiaanssen, W.G.M.; Ahmad, M.D.; Moura, M.S.B.; Bos, M.G. Analysis of Energy Fluxes and Vegetation-Atmosphere Parameters in Irrigated and Natural Ecosystems of Semi-Arid Brazil. J. Hydrol. 2008, 362, 110–127. [Google Scholar] [CrossRef]
  30. Allen, R.; Pereira, L.; Raes, D.; Fao, M.S. Crop Evapotranspiration-Guidelines for Computing Crop Water Requirements-FAO Irrigation and Drainage Paper 56; Food and Agriculture Organization of the United Nations: Rome, Italy, 1998. [Google Scholar]
  31. Lima, A.L.B.; Filgueiras, R.; Mantovani, E.C.; Althoff, D.; dos Santos, R.A.; Venancio, L.P. Biophysical Parameters and Actual Evapotranspiration of Bean Culture by Means of Remote Sensing. J. Agric. Sci. 2019, 11, 156. [Google Scholar] [CrossRef]
  32. Chicco, D.; Oneto, L.; Tavazzi, E. Eleven Quick Tips for Data Cleaning and Feature Engineering. PLoS Comput. Biol. 2022, 18, e1010718. [Google Scholar] [CrossRef] [PubMed]
  33. Hodson, T.O. Root-Mean-Square Error (RMSE) or Mean Absolute Error (MAE): When to Use Them or Not. Geosci. Model. Dev. 2022, 15, 5481–5487. [Google Scholar] [CrossRef]
  34. Carrasco, M.; Ortega-Farías, S. Evaluation of a Model to Simulate Net Radiation Over a Vineyard Cv. Cabernet Sauvignon. Chil. J. Agric. Res. 2008, 68, 156–165. [Google Scholar] [CrossRef]
  35. Anderson, M.C.; Norman, J.M.; Mecikalski, J.R.; Otkin, J.A.; Kustas, W.P. A Climatological Study of Evapotranspiration and Moisture Stress across the Continental United States Based on Thermal Remote Sensing: 2. Surface Moisture Climatology. J. Geophys. Res. Atmos. 2007, 112, D11112. [Google Scholar] [CrossRef]
  36. Agam, N.; Berliner, P.R. Dew Formation and Water Vapor Adsorption in Semi-Arid Environments—A Review. J. Arid. Environ. 2006, 65, 572–590. [Google Scholar] [CrossRef]
  37. Wang, L.; Kong, J.; Zhang, Q.; Zhong, Y. A Dual-Source Energy Balance Model-Assisted Ensemble Learning Approach for Estimating Latent Heat Flux. Theor. Appl. Climatol. 2025, 156, 399. [Google Scholar] [CrossRef]
  38. Haonan, Q.; Shihong, Y.; Guangmei, W.; Xiaoling, L.; Jie, Z.; Yi, X.; Shide, D.; Hanwen, L.; Zewei, J. Characterisation of Water and Heat Fluxes of Typical Crops and Simulation of Evapotranspiration in Saline-Alkali Soil of the Yellow River Delta, China. J. Agron. Crop Sci. 2025, 211, e70021. [Google Scholar] [CrossRef]
  39. Amani, S.; Shafizadeh-Moghadam, H.; Morid, S. Integrating Sentinel-2 and Sentinel-3 for Actual Evapotranspiration Estimation across Diverse Climate Zones Using the Sen-ET Plugin and Machine Learning Models. Earth Sci. Inform. 2025, 18, 338. [Google Scholar] [CrossRef]
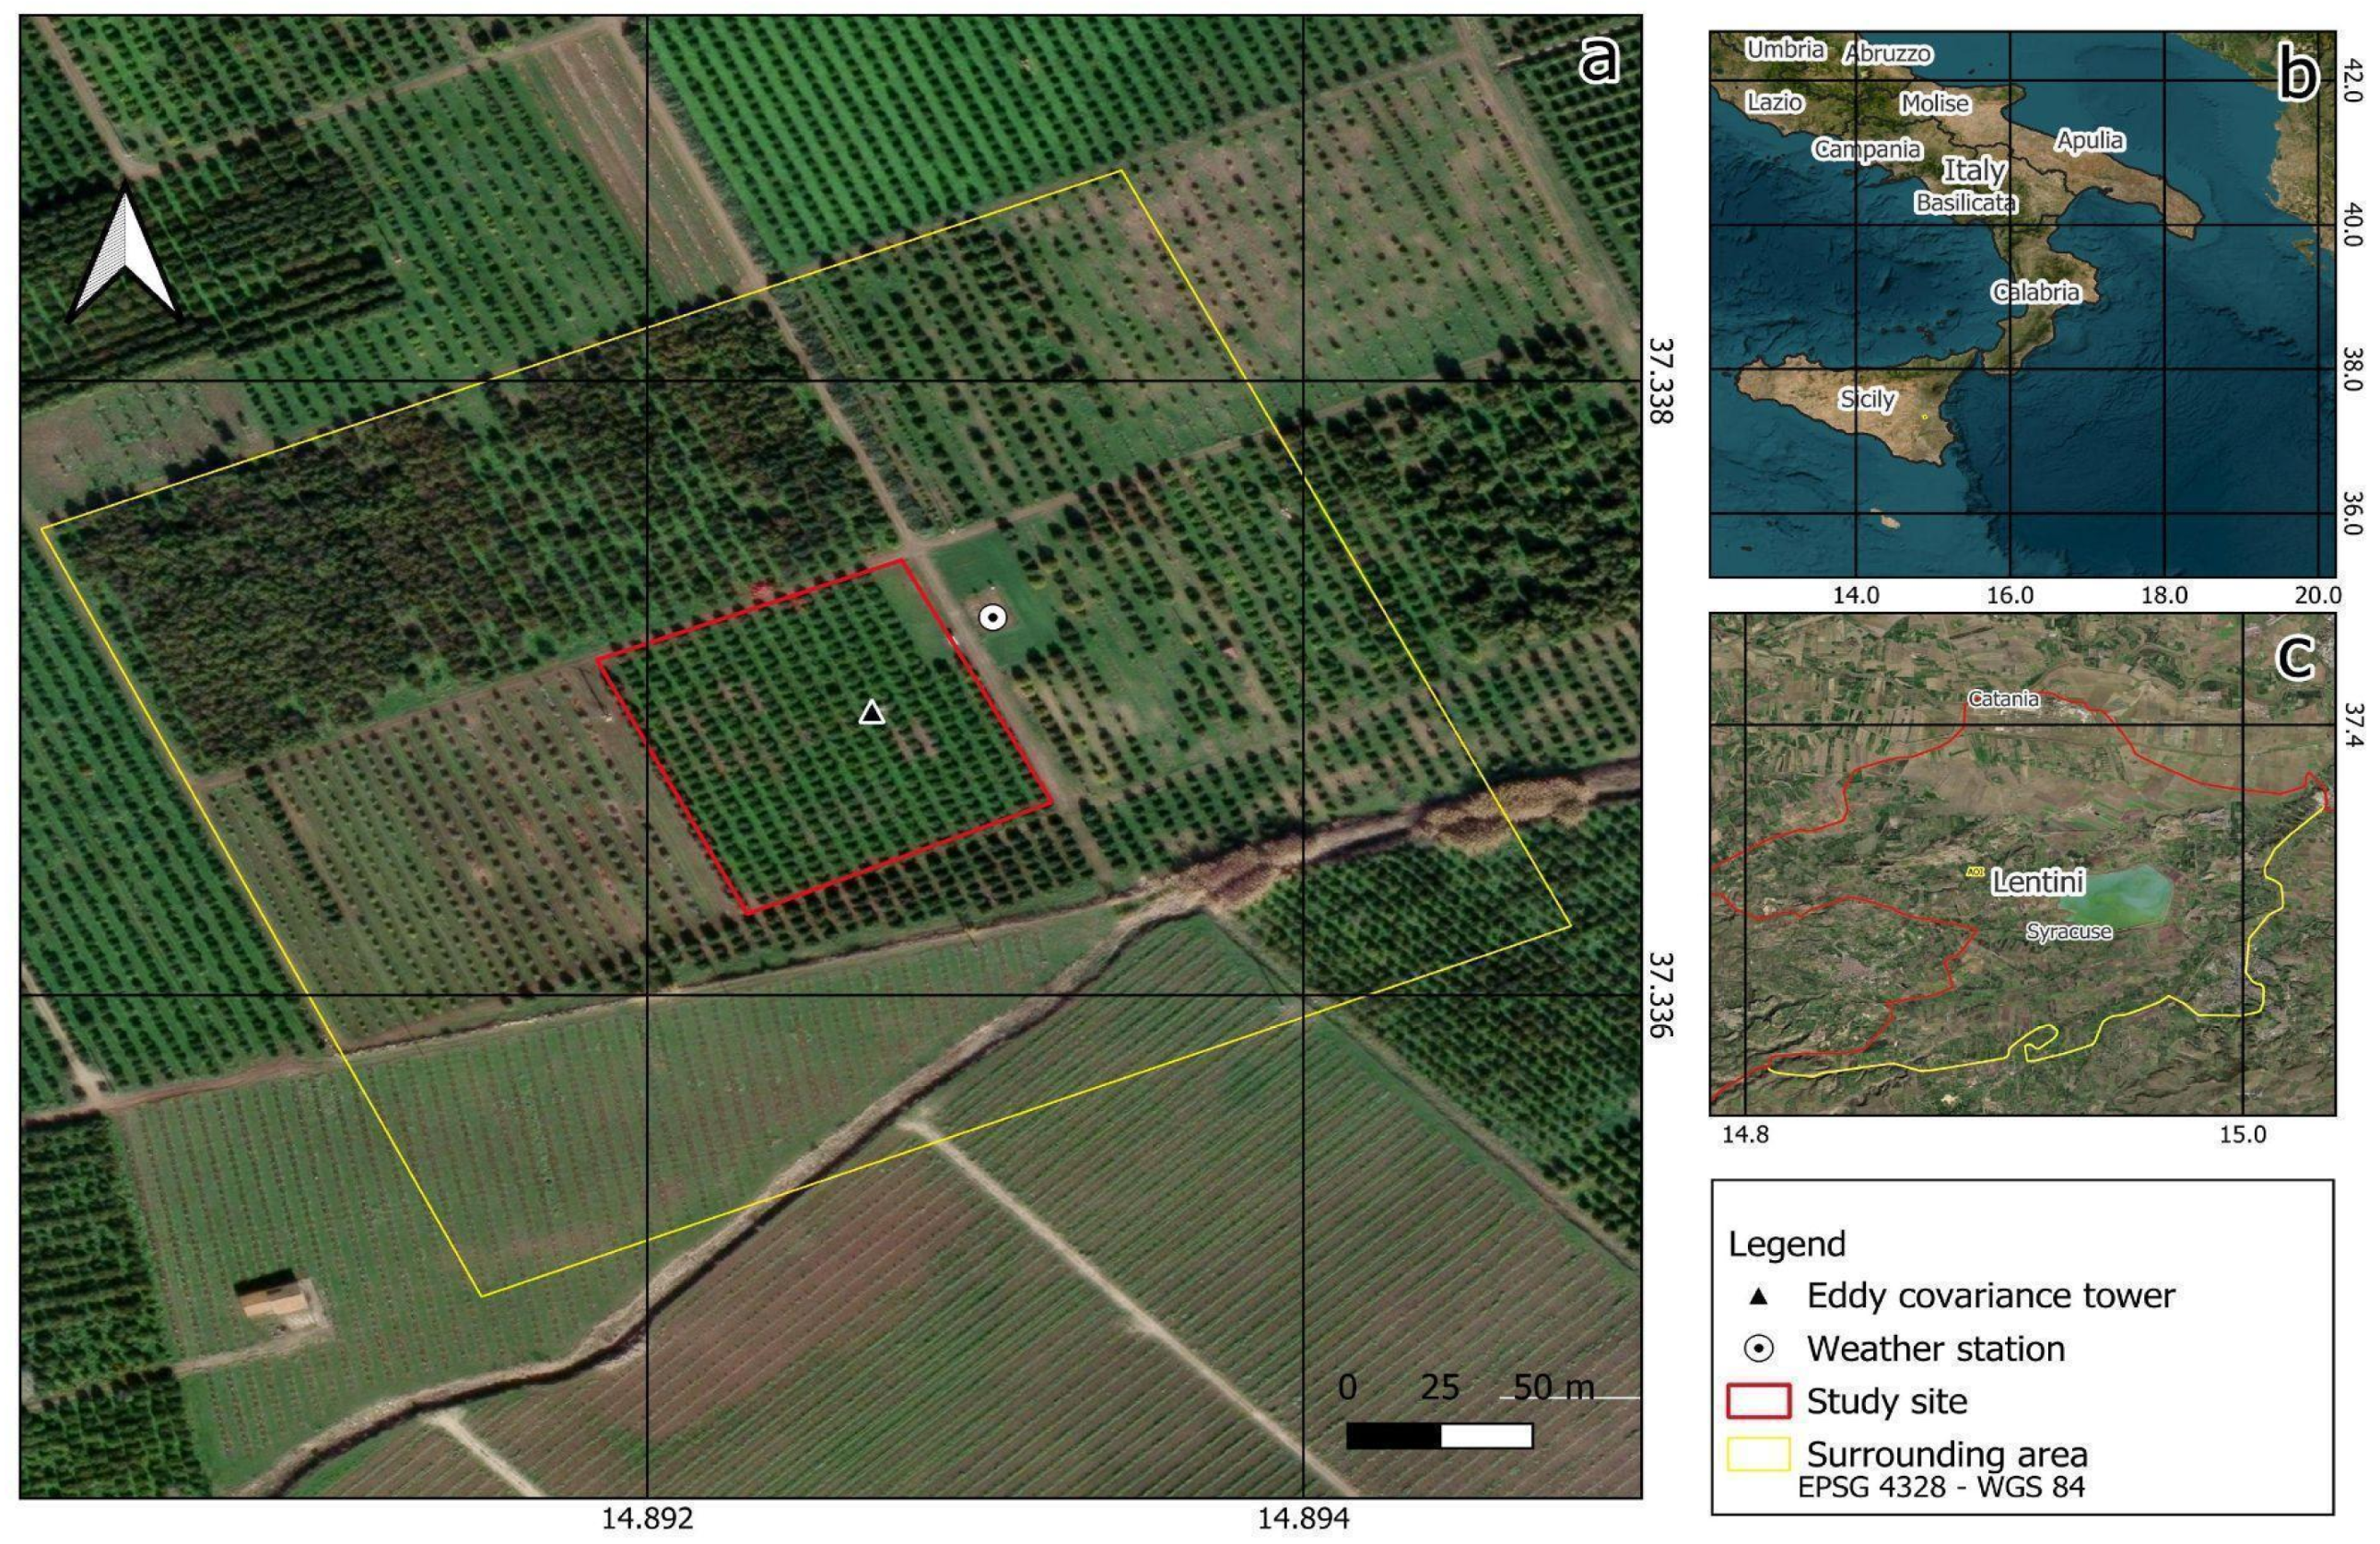
Figure 1. (a) Overview of the study site, including the surrounding area (37°20′12.65″ N, 14°53′33.04″ E, WGS84, 50 m), (b) a map of Italy, and (c), a map of Lentini.
Water 17 03286 g001
Figure 2. Average monthly precipitation and air temperature values from 2002 to 2022, recorded at the Lentini weather station managed by the Sicilian Agrometeorological Information Service (SIAS).
Water 17 03286 g002
Figure 3. EC footprint 2021–2022 map with land cover classification and footprint contour lines from 10% to 90%, in 10% steps. The contribution from each land cover class to the measured flux, weighted by the footprint, is annotated in the title of each panel.
Water 17 03286 g003
Figure 4. Linear regression of evaporative fraction calculated with meteorological and micrometeorological data and evaporative fraction estimated with satellite data.
Water 17 03286 g004
Figure 5. Components of the SEB on a seasonal and annual scale for the experimental site.
Water 17 03286 g005
Figure 6. Bowen ratio box plot for 2021–2021 and seasons.
Water 17 03286 g006
Figure 7. Observed EC and simulated (SAFER) ET behavior for 2021 and 2022 at the experimental site illustrates the spatial distribution of the standard deviation (SD) of average daily ET for 2021 (left) and 2022 (right) in comparison to EC-based ET fluxes.
Water 17 03286 g007
Figure 8. ET daily standard deviation at the study site (square red) and the surrounding area (yellow square) in 2021–2022.
Water 17 03286 g008
Table 1. Harmonized Sentinel-2 MSI images used for model calibration.
Year20212022
DOY87207137209219222152154187197204207214359362
Table 2. Harmonized Sentinel-2 MSI images used for model validation.
YearDOY
202187129139194197207209212219222224259262294324
20228499137142152154172179184187197204207214227247297299342359362362
Table 3. Validation metrics for SAFER against EC-derived ET (daily scale).
SeasonYearn DaysR2RMSEMBEr
Dry2021110.350.860.01−0.59
Rainy202140.890.95−0.940.95
All2021150.180.88−0.25−0.42
Dry2022150.170.680.380.41
Rainy202260.850.910.53−0.92
All2022210.380.750.420.62
Disclaimer/Publisher’s Note: The statements, opinions and data contained in all publications are solely those of the individual author(s) and contributor(s) and not of MDPI and/or the editor(s). MDPI and/or the editor(s) disclaim responsibility for any injury to people or property resulting from any ideas, methods, instructions or products referred to in the content.