1. Introduction
The expansion of urban areas has markedly increased soil sealing, thereby intensifying surface runoff and overloading urban drainage systems. This phenomenon produces significant environmental impacts, including changes to the hydrology and geomorphology of watercourses, as well as an increase in the pollutant load conveyed by stormwater runoff [
1]. These effects underscore the urgent need for solutions that enable more efficient and sustainable stormwater management. The present study addresses this context by evaluating the relative performance of nature-based technologies designed to mitigate the adverse consequences of urban runoff.
Globally, there is a growing trend toward approaches that aim to mimic natural processes in the planning and management of urban drainage systems. Such solutions are known by different terms depending on geographic, institutional, or technical context. Among the most widely used are Sustainable Drainage Systems (SuDSs), Water-Sensitive Urban Design (WSUD), low-impact development (LID), Best Management Practices (BMPs), green infrastructure (GI), and Stormwater Control Measures (SCMs) [
2,
3]. Despite these terminological variations, all these approaches aim to achieve more efficient and sustainable management of urban runoff through nature-integrated solutions that act at the source of the problem [
4].
Over the past decade (2015–2025), research on Sustainable Urban Drainage Systems (SuDSs) has shifted from a “component-by-component” focus to a systemic vision that integrates urban planning, high-resolution hydrology, and real-time operation. The turning point was the synthesis by Fletcher et al. [
2], which clarified the LID/BMPs/WSUD terminology and framed these devices within an ecosystem services perspective, standardising metrics for volume, peak flow, and water quality.
In the years that followed, case studies demonstrated that effectiveness varies widely depending on the combination of techniques employed. The multi-scenario comparison by Joshi et al. [
3] in
Water Research demonstrated that “not all SuDS are equal”: inline detention basins and bioretention cells reduced combined-sewer overflows (CSOs) by up to 68%, whereas stand-alone green roofs achieved less than 20%, a disparity explained by the storage-to-treated-area ratio.
Simultaneously, process representation in the U.S. Environmental Protection Agency’s Stormwater Management Model (SWMM) [
5] was refined.
Gogien et al. [
6] demonstrated that reducing the SWMM time-step from 5 to 1 min can alter the predicted solid load by up to 30%. Meanwhile, ref. [
7] showed that peak discharge is highly sensitive to time-step size, with an increase from 1 to 5–15 min underestimating peak flow by up to 30%. They recommend ≤ 5 min for catchments ≤ 1 km
2 and ≤15 min for larger basins to keep the peak-flow error below 10%.
From 2023 onwards, the research agenda shifted toward territorial integration. The review by Montoya-Coronado et al. [
8], which covered 135 whole-catchment scenarios, concluded that 30% coverage with detention basins and bioretention cells is sufficient to reduce CSO peaks by 20–45%, provided that the modelling includes sewer–sea connections and deep infiltration calibration. In the same year, Cavadini et al. [
9] quantified the synergistic effect of permeable pavements, bioretention, and detention ponds in a Swiss sub-catchment: the combined solution doubled the volume reduction achieved by any single technology, fostering the adoption of blue–green “trains” in municipal regulations.
Climate adaptation has become especially urgent in arid regions. The meta-analysis by De Cristo et al. [
10] reported 10–15% losses in the hydrological efficiency of green roofs after four consecutive dry Mediterranean summers, advocating for deeper substrates and supplementary irrigation to sustain long-term performance.
In Spain, prior contributions have focused on new urban developments, pilot-scale demonstrations, and governance transitions. Rodríguez-Sinobas et al. [
11] examined LID/SuDSs in a newly urbanised district (Valdebebas, Madrid), stressing energy and greenhouse gas (GHG) co-benefits through a shortened water cycle. Perales-Momparler et al. [
12] reported on the pilot elements (e.g., rain gardens, swales, a green roof) and highlighted stakeholder engagement as a lever for SuDS uptake under Mediterranean conditions. At the national scale, Andrés-Doménech et al. [
13] diagnosed SuDS progress in Spain across governance, regulation and technical performance, while Abellán García et al. [
14] reviewed Spanish research with an emphasis on climate sensitivity and a concentration on green roofs and permeable pavements. In contrast, our work applies SuDSs within a densely built Mediterranean neighbourhood and addresses the practical challenges of adapting existing urban infrastructure, integrates Giswater with participatory decision-making, and proposes qualitative indicators (
Ij,
Ic) to support decision-making and to evaluate the hydraulic performance of distinct SuDS typologies, thus offering a practical, replicable framework not explored in those earlier works [
11,
12,
13,
14].
This study, conducted in partnership with B’GEO—Open GIS & Water Solutions (BGEO) for a subbasin of the urban area of Barcelona (the study concerns municipally owned infrastructure, with the exact location withheld to preserve data confidentiality).
The study aims to quantify the relative hydraulic and hydrological impacts of implementing SuDS under various rainfall scenarios. The open-source Giswater platform (version 3.4, 2020; Barcelona, Spain), coupled with the SWMM [
5], was used to (i) characterise the neighbourhood in its current state, i.e., without SuDSs; (ii) explore alternative SuDS implementation strategies; (iii) simulate multiple scenarios combining different rainfall events and suites of SuDS technologies; and (iv) assess hydrological and hydraulic impacts by comparing system performance before and after the proposed interventions.
Urban-scale enhancements were also proposed to minimise these impacts, identifying optimal SuDS locations from hydraulic and hydrological standpoints while respecting local constraints, practical feasibility, and the technical design criteria of each SuDS element.
The results indicate that the deployment of SuDSs in the studied subbasin yields a net reduction in peak flood discharges. Infiltration trenches, permeable pavements, and bioretention cells, in particular, not only attenuate inflows reaching the overflow structure but also provide notable co-benefits for urban space quality.
2. Materials and Methods
The study was conducted in a subbasin of the urban area of Barcelona (Spain), whose geomorphological, climatic, and land use characteristics strongly influence the drainage network’s hydrological response. The objective was to analyse system behaviour under different rainfall events and to evaluate the relative potential of SuDS-based solutions to mitigate their impacts. The dataset comprised topographic information, land use, urban infrastructure layouts, and synthetic hyetographs derived from Intensity–Duration–Frequency (IDF) equations, all processed and analysed in QGIS (version 3.28; 2022; Grüt, Switzerland). These data were integrated in GISwater (version 3.4, 2020; Barcelona, Spain) to structure the drainage network and subsequently modelled with the SWMM. During this phase, sub-catchments, runoff coefficients, and infiltration parameters were defined to reflect the specific conditions of the study area.
A suite of scenarios was then simulated, combining rainfall events of varying return periods with different SuDS configurations, to test the system’s relative performance under contrasting conditions. This approach enabled the exploration of alternative stormwater management strategies tailored to the local urban context. To compare and prioritise the scenarios, performance indices were developed that integrate hydrological, hydraulic, and environmental metrics. These indicators provide a quantitative assessment of the proposed solutions’ effectiveness, thereby informing more resilient and sustainable urban-planning decisions.
2.1. Study Area
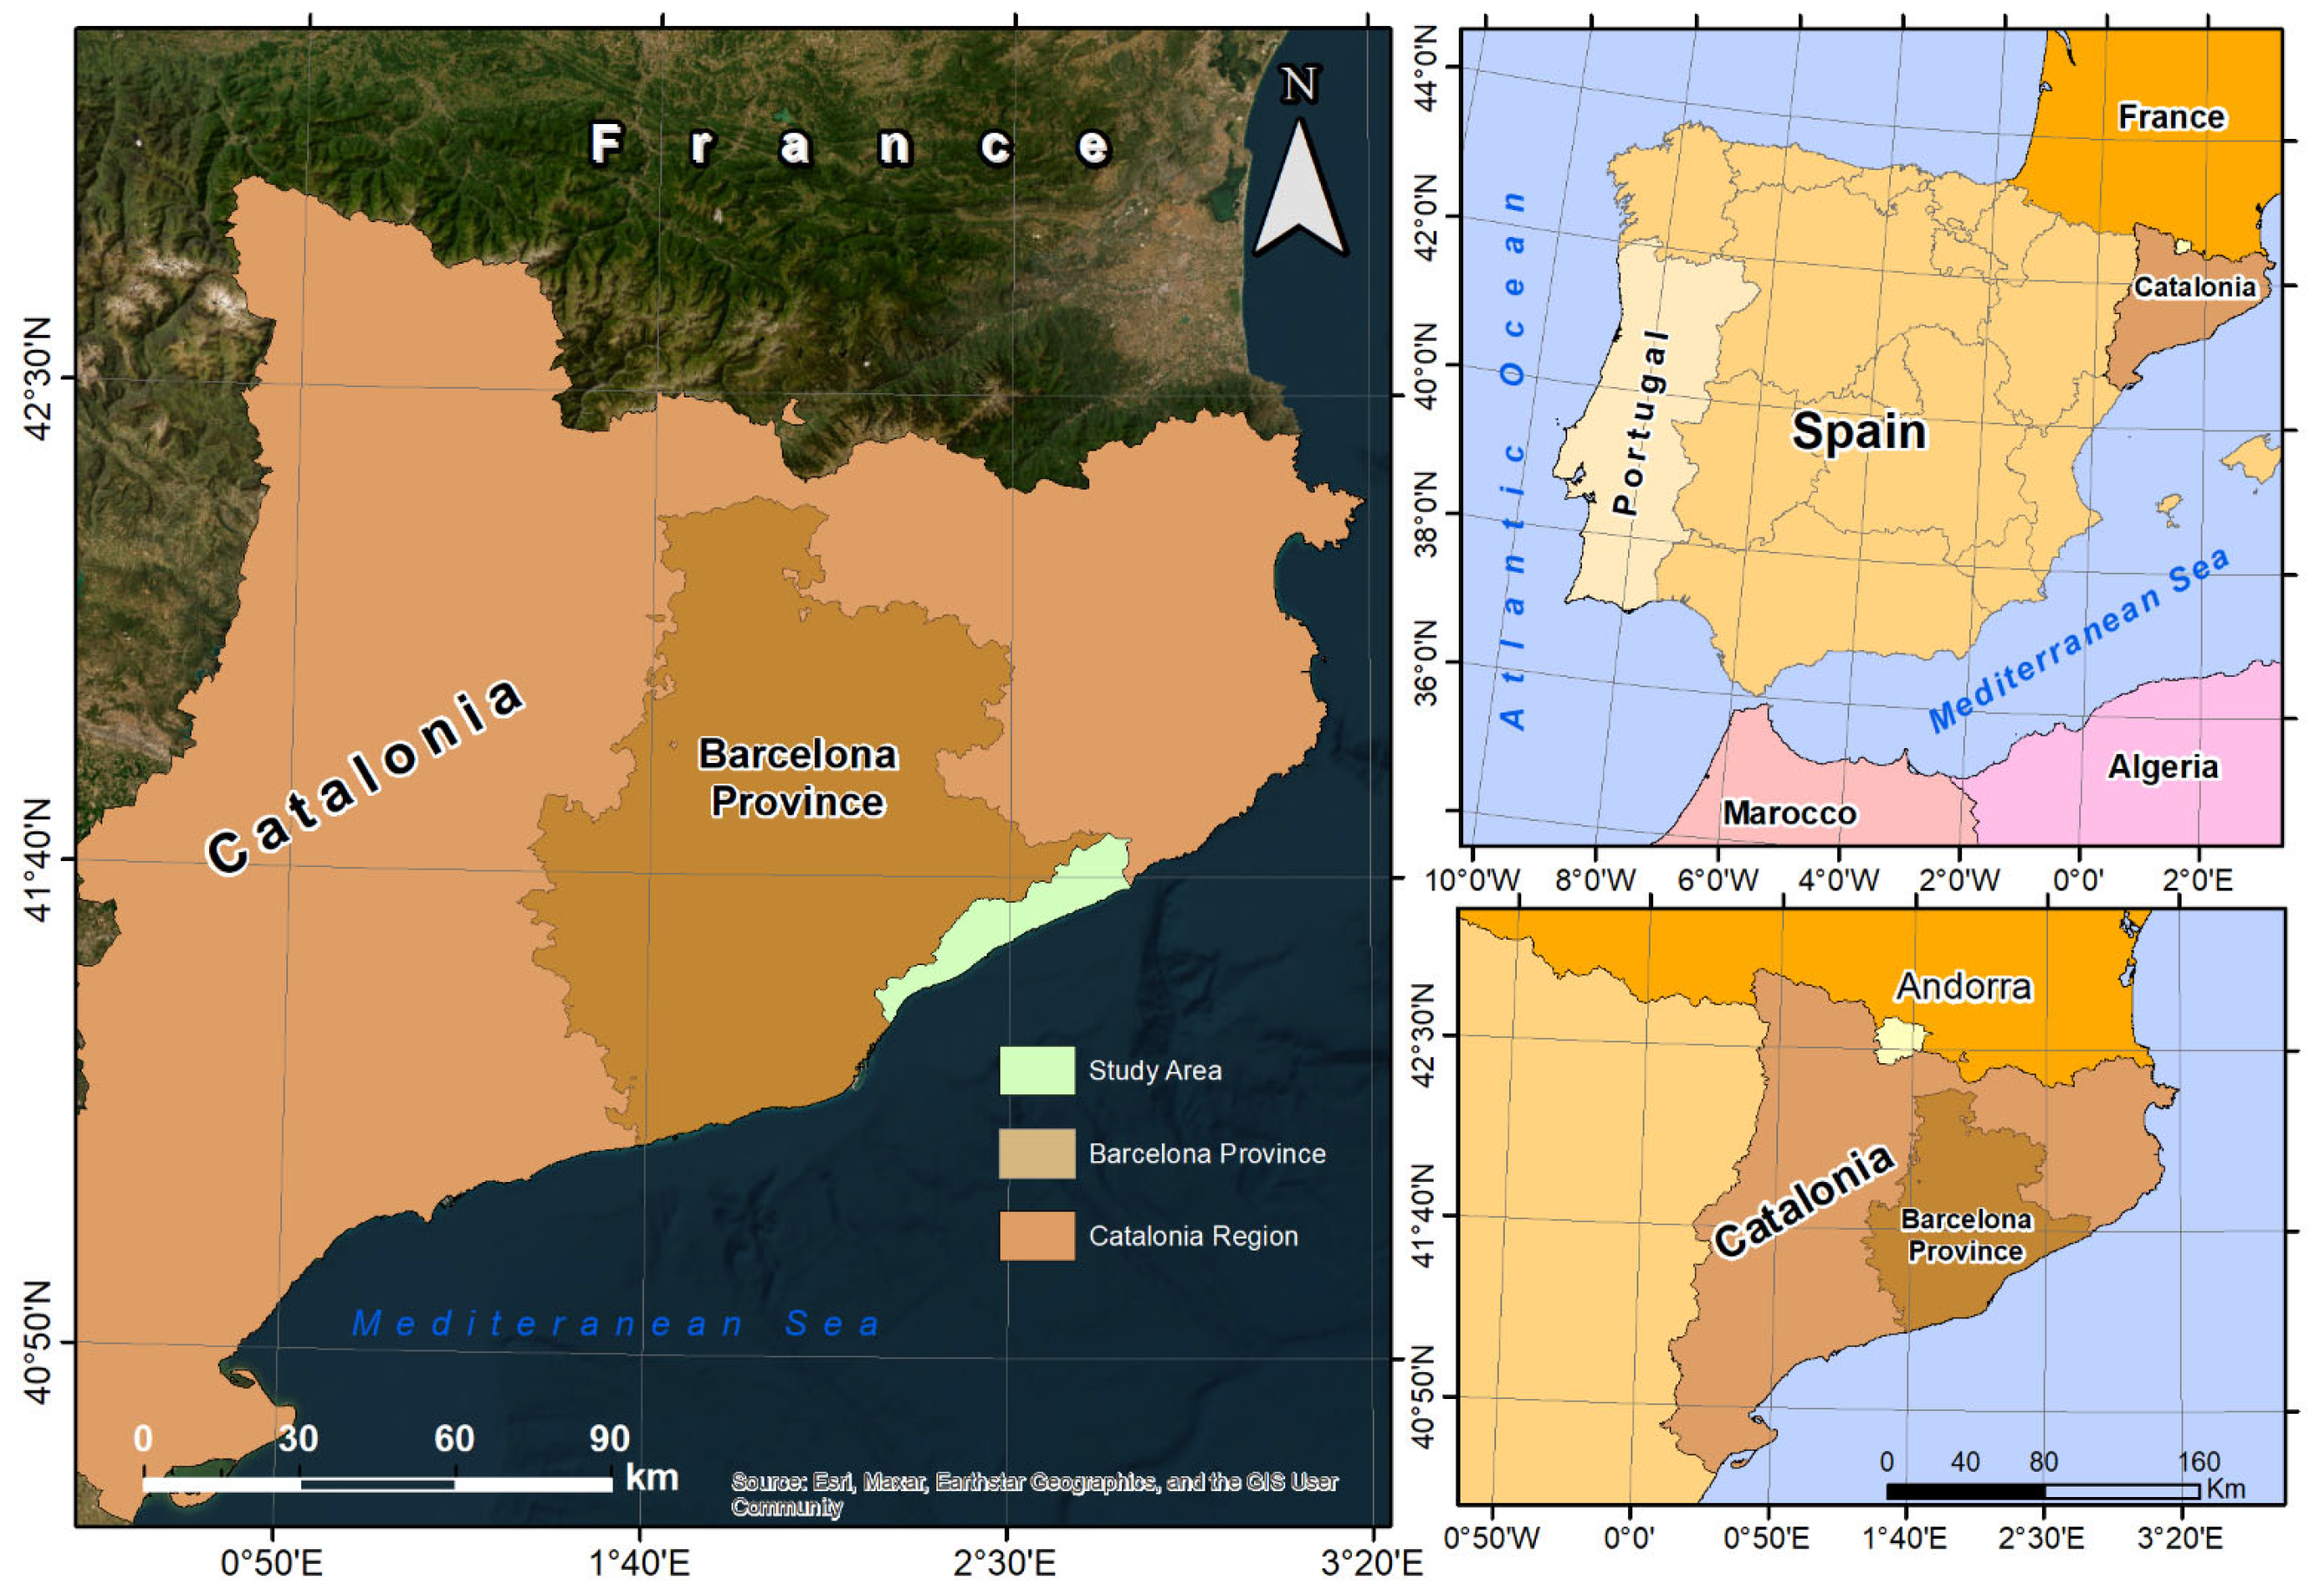
The study area is in a 64 ha subbasin in the urban area of Barcelona, integrated into the metropolitan context of the city.
This area lies on the left bank of the River Besòs, facing the Mediterranean Sea, at the foot of the Serra de la Marina (
Figure 1).
High urban density and the resulting surface sealing have generated several social and environmental challenges that require mitigation. According to Locatelli et al. [
15], during intense rainfall events, a substantial share of stormwater is diverted away from wastewater treatment plants, triggering uncontrolled CSOs that, even during relatively moderate rainfall, can force beach closures for at least 24 h and have serious environmental, social, and economic repercussions.
The present study focuses on a section of the urban area of Barcelona. This area is representative of the city’s urban development history, reflecting the socio-political and economic circumstances of a particular period. Its evolution over the last three decades illustrates the progression of urban-planning instruments, from strategic design to operational management. The study area, originally predominantly agricultural, underwent significant urbanisation during the second half of the 20th century and faced challenges such as property speculation, the Catalan banking crisis, and civic movements that, among other concerns, criticised the shortage of green spaces [
16].
The study area was selected owing to three main factors: (i) the availability of urban-infrastructure cadastral data supplied by BGEO [
17] and managed through Giswater [
18]; (ii) the presence of a clearly delineated drainage catchment (
Figure 1); and (iii) the neighbourhood’s urban complexity, characterised by a mix of commercial, industrial, and residential land uses that facilitates the implementation of diverse SuDS typologies.
2.2. Giswater and SWMM: Integration and Hydrological Processes
Drainage network data were organised and integrated with GISwater. This open-source platform serves as an interface between geographic information systems (QGIS/PostGIS) and hydraulic models, such as the SWMM [
5] and EPANET (for Modelling Drinking Water Distribution Systems) [
19].
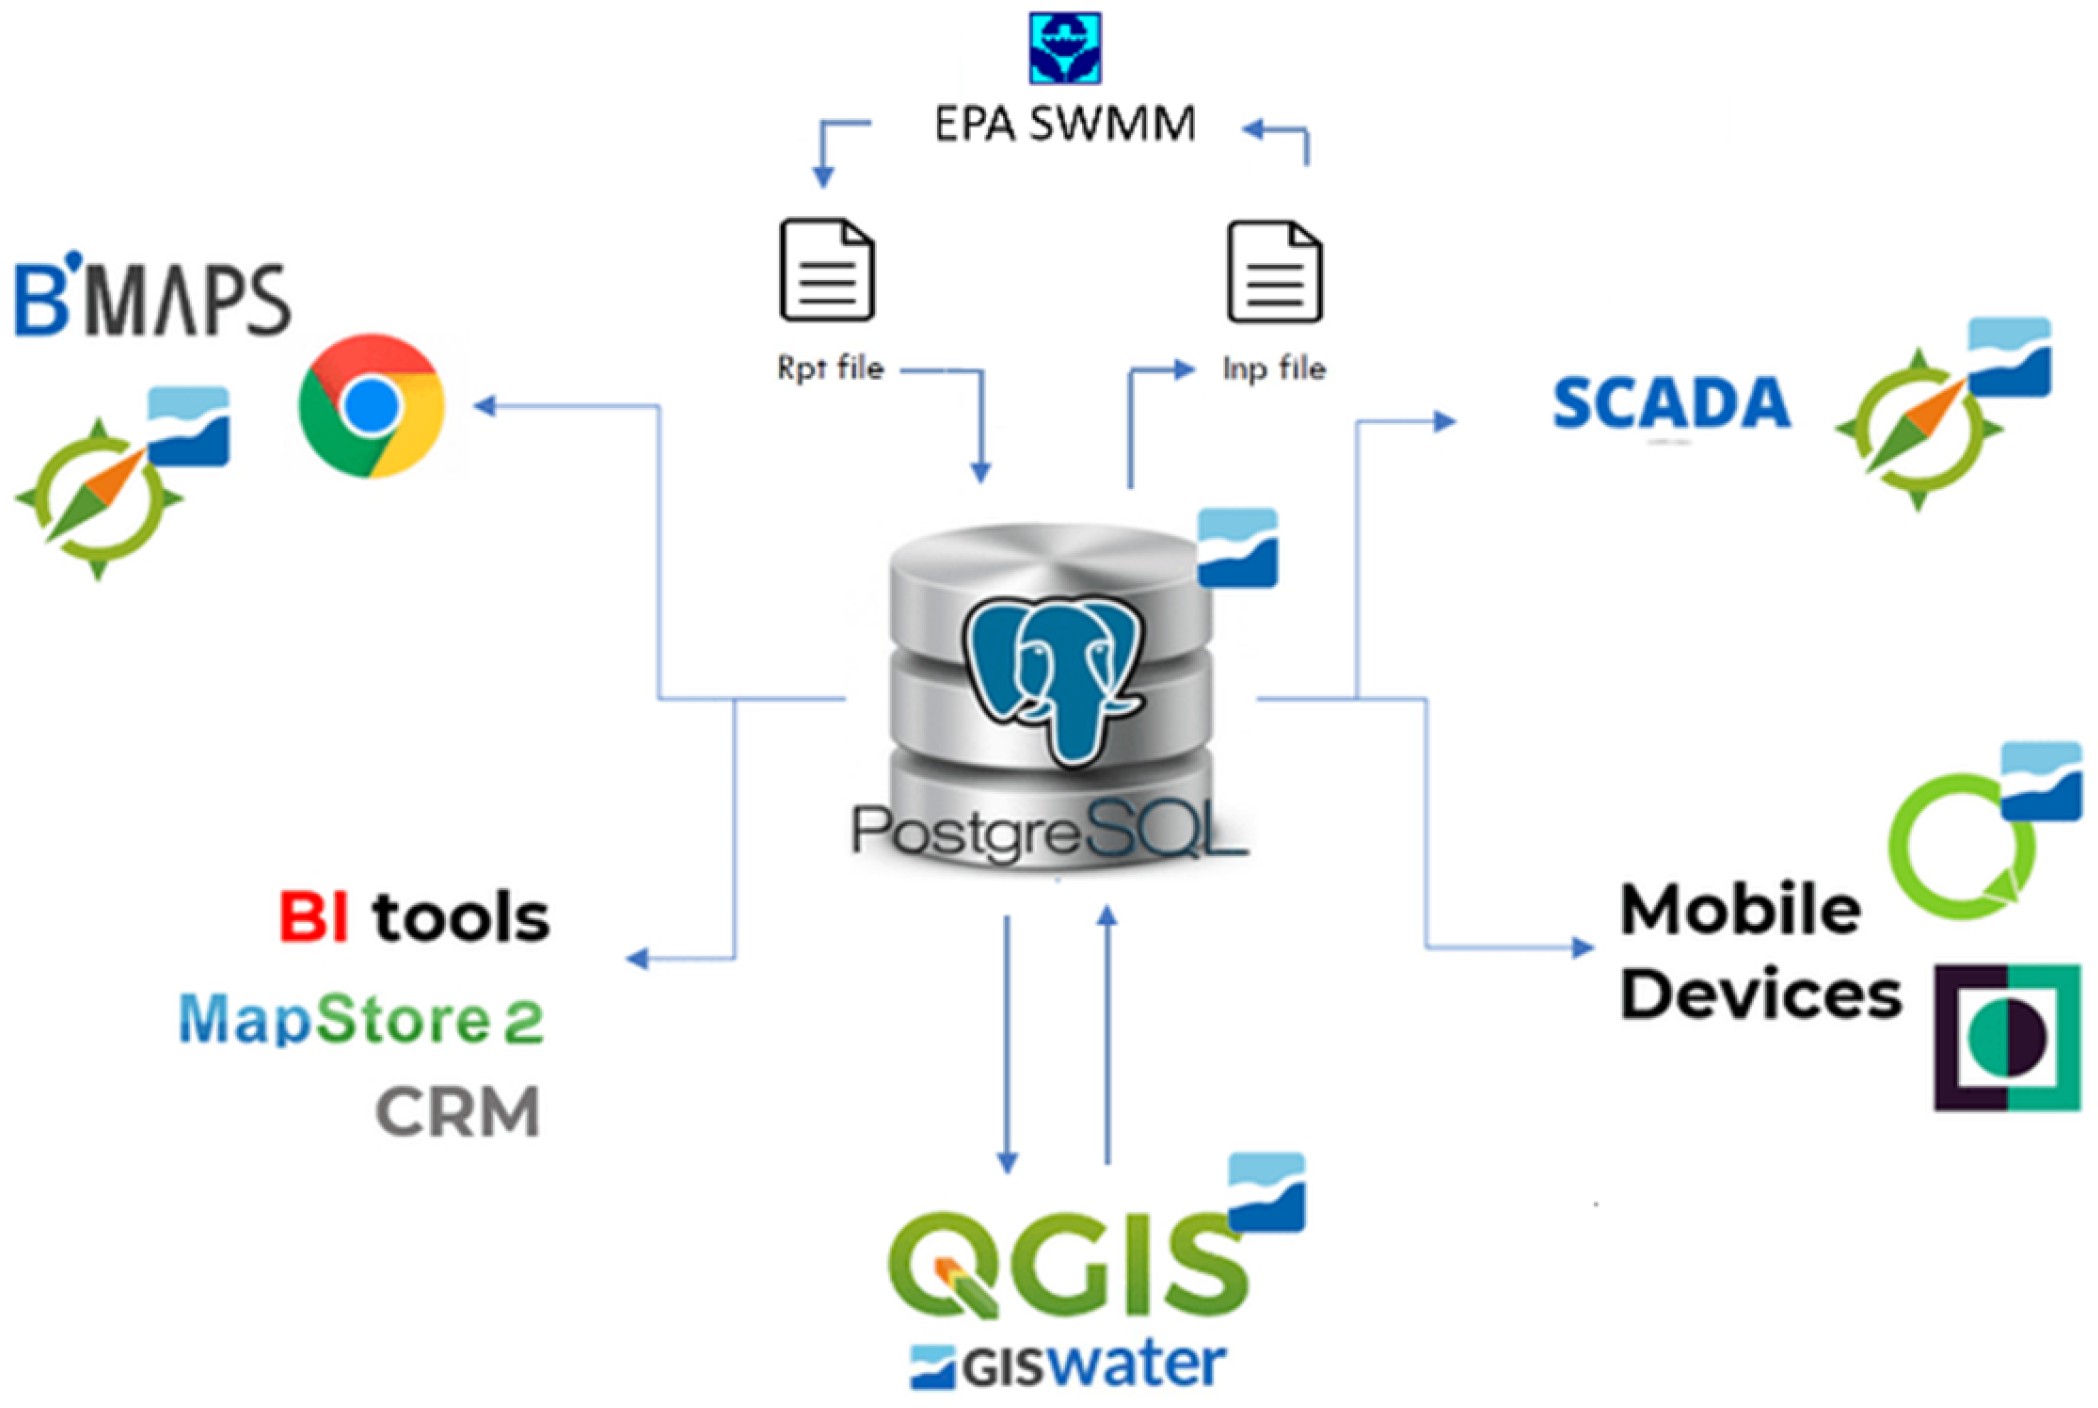
Figure 2 shows how GISwater couples spatial datasets with simulation engines, supporting the planning, operational management, and control of urban hydraulic networks. It also permits the recording, storage, and updating of technical data, documents, and assets associated with sanitation infrastructure [
18]. Moreover, GISwater can be linked to other management platforms, Warehouse Management Systems (WMSs), Supervisory Control and Data Acquisition (SCADA), Enterprise Resource Planning (ERP), Customer Relationship Management (CRM), Business Intelligence (BI) systems, and corporate mobile devices, enabling an integrated approach to urban network management.
Figure 2 illustrates the main interconnections possible within the Giswater ecosystem.
The Stormwater Management Model (SWMM) developed by the U.S. Environmental Protection Agency (EPA) performs a fully dynamic simulation of urban hydrology and hydraulics through a sequence of interdependent computational modules. The model transforms rainfall into surface runoff and routes the resulting flow through a network of channels, pipes, and storage units. The main processes are rainfall–runoff transformation, infiltration, surface routing, and pipe flow.
In the present study, for the rainfall–runoff transformation, the rainfall is applied to each sub-catchment, where it is partitioned into infiltration, surface storage, evaporation, and direct runoff. The model computes rainfall excess at a temporal resolution of 5 min based on the balance between incoming precipitation and losses. The overland flow generated within each sub-catchment is expressed through a non-linear reservoir approach, in which runoff depth varies with the effective rainfall rate, depression storage, and surface slope. This transformation provides the inflow hydrograph entering the drainage system. The infiltration was represented by the SCS Curve Number (CN) method. This method estimates the cumulative infiltration and direct runoff as a function of soil type, land cover, and antecedent moisture conditions. The CN method defines a maximum potential retention and the cumulative runoff. This formulation assumes that infiltration capacity declines non-linearly as the soil becomes saturated. In the SWMM, the CN value is assigned to each sub-catchment and governs the proportion of rainfall converted into surface runoff, providing a simple yet physically based representation of infiltration dynamics. Once generated, surface runoff is routed over the sub-catchment using the kinematic wave approximation of the Saint-Venant equations. This approach assumes a gradually varied, one-dimensional flow dominated by gravity and friction forces, neglecting local acceleration and pressure terms. The resulting continuity and momentum equations determine flow depth and velocity as functions of time, surface slope, roughness (Manning’s n), and flow path length. The computed outflow at each sub-catchment outlet serves as inflow to the corresponding node in the drainage network. Within the drainage network, the SWMM solves the complete dynamic wave form of the Saint-Venant equations to simulate unsteady flow in circular conduits, channels, and storage units. This formulation conserves both mass and momentum, accounting for backwater effects, pressurised flow, surcharging, and reverse flow. Boundary conditions include rainfall-generated inflows, junction continuity, and downstream tailwater levels. The hydraulic grade line and flow rate are iteratively computed at each time step using a finite-difference scheme. When the water depth exceeds the crown of the conduit, the flow regime transitions from open-channel to pressurised conditions, allowing for an accurate representation of surcharge and flooding processes.
The SWMM integrates the rainfall–runoff transformation, infiltration losses, surface flow routing, and dynamic pipe hydraulics into a coherent modelling framework. This combination enables a physically consistent simulation of the hydrological and hydraulic response of urban catchments, including the evaluation of mitigation strategies such as Sustainable Drainage Systems (SuDSs).
2.3. Processing of Cadastral and Giswater Data
The study area was delineated using high-resolution satellite imagery from Google Earth Pro (version 7.3.4, 2022, California, USA) and orthophotos provided by the Cartographic and Geological Institute of Catalonia (ICGC), available in true colour with a spatial resolution of 10 cm. The 1:5000 Catalonia Topographic Map from the ICGC, which includes contour lines with a natural equidistance of 5 m, was also utilised. The drainage network data were obtained from the municipality and complemented with fieldwork carried out by BGEO, also based on a 1:5000 mapping scale. Sub-catchments were defined based on local topography and the existing drainage network, utilising QGIS functionalities [
20] to model surface runoff direction and accumulation. The coordinate system used is the official one in Catalonia (ETRS89 UTM 31N).
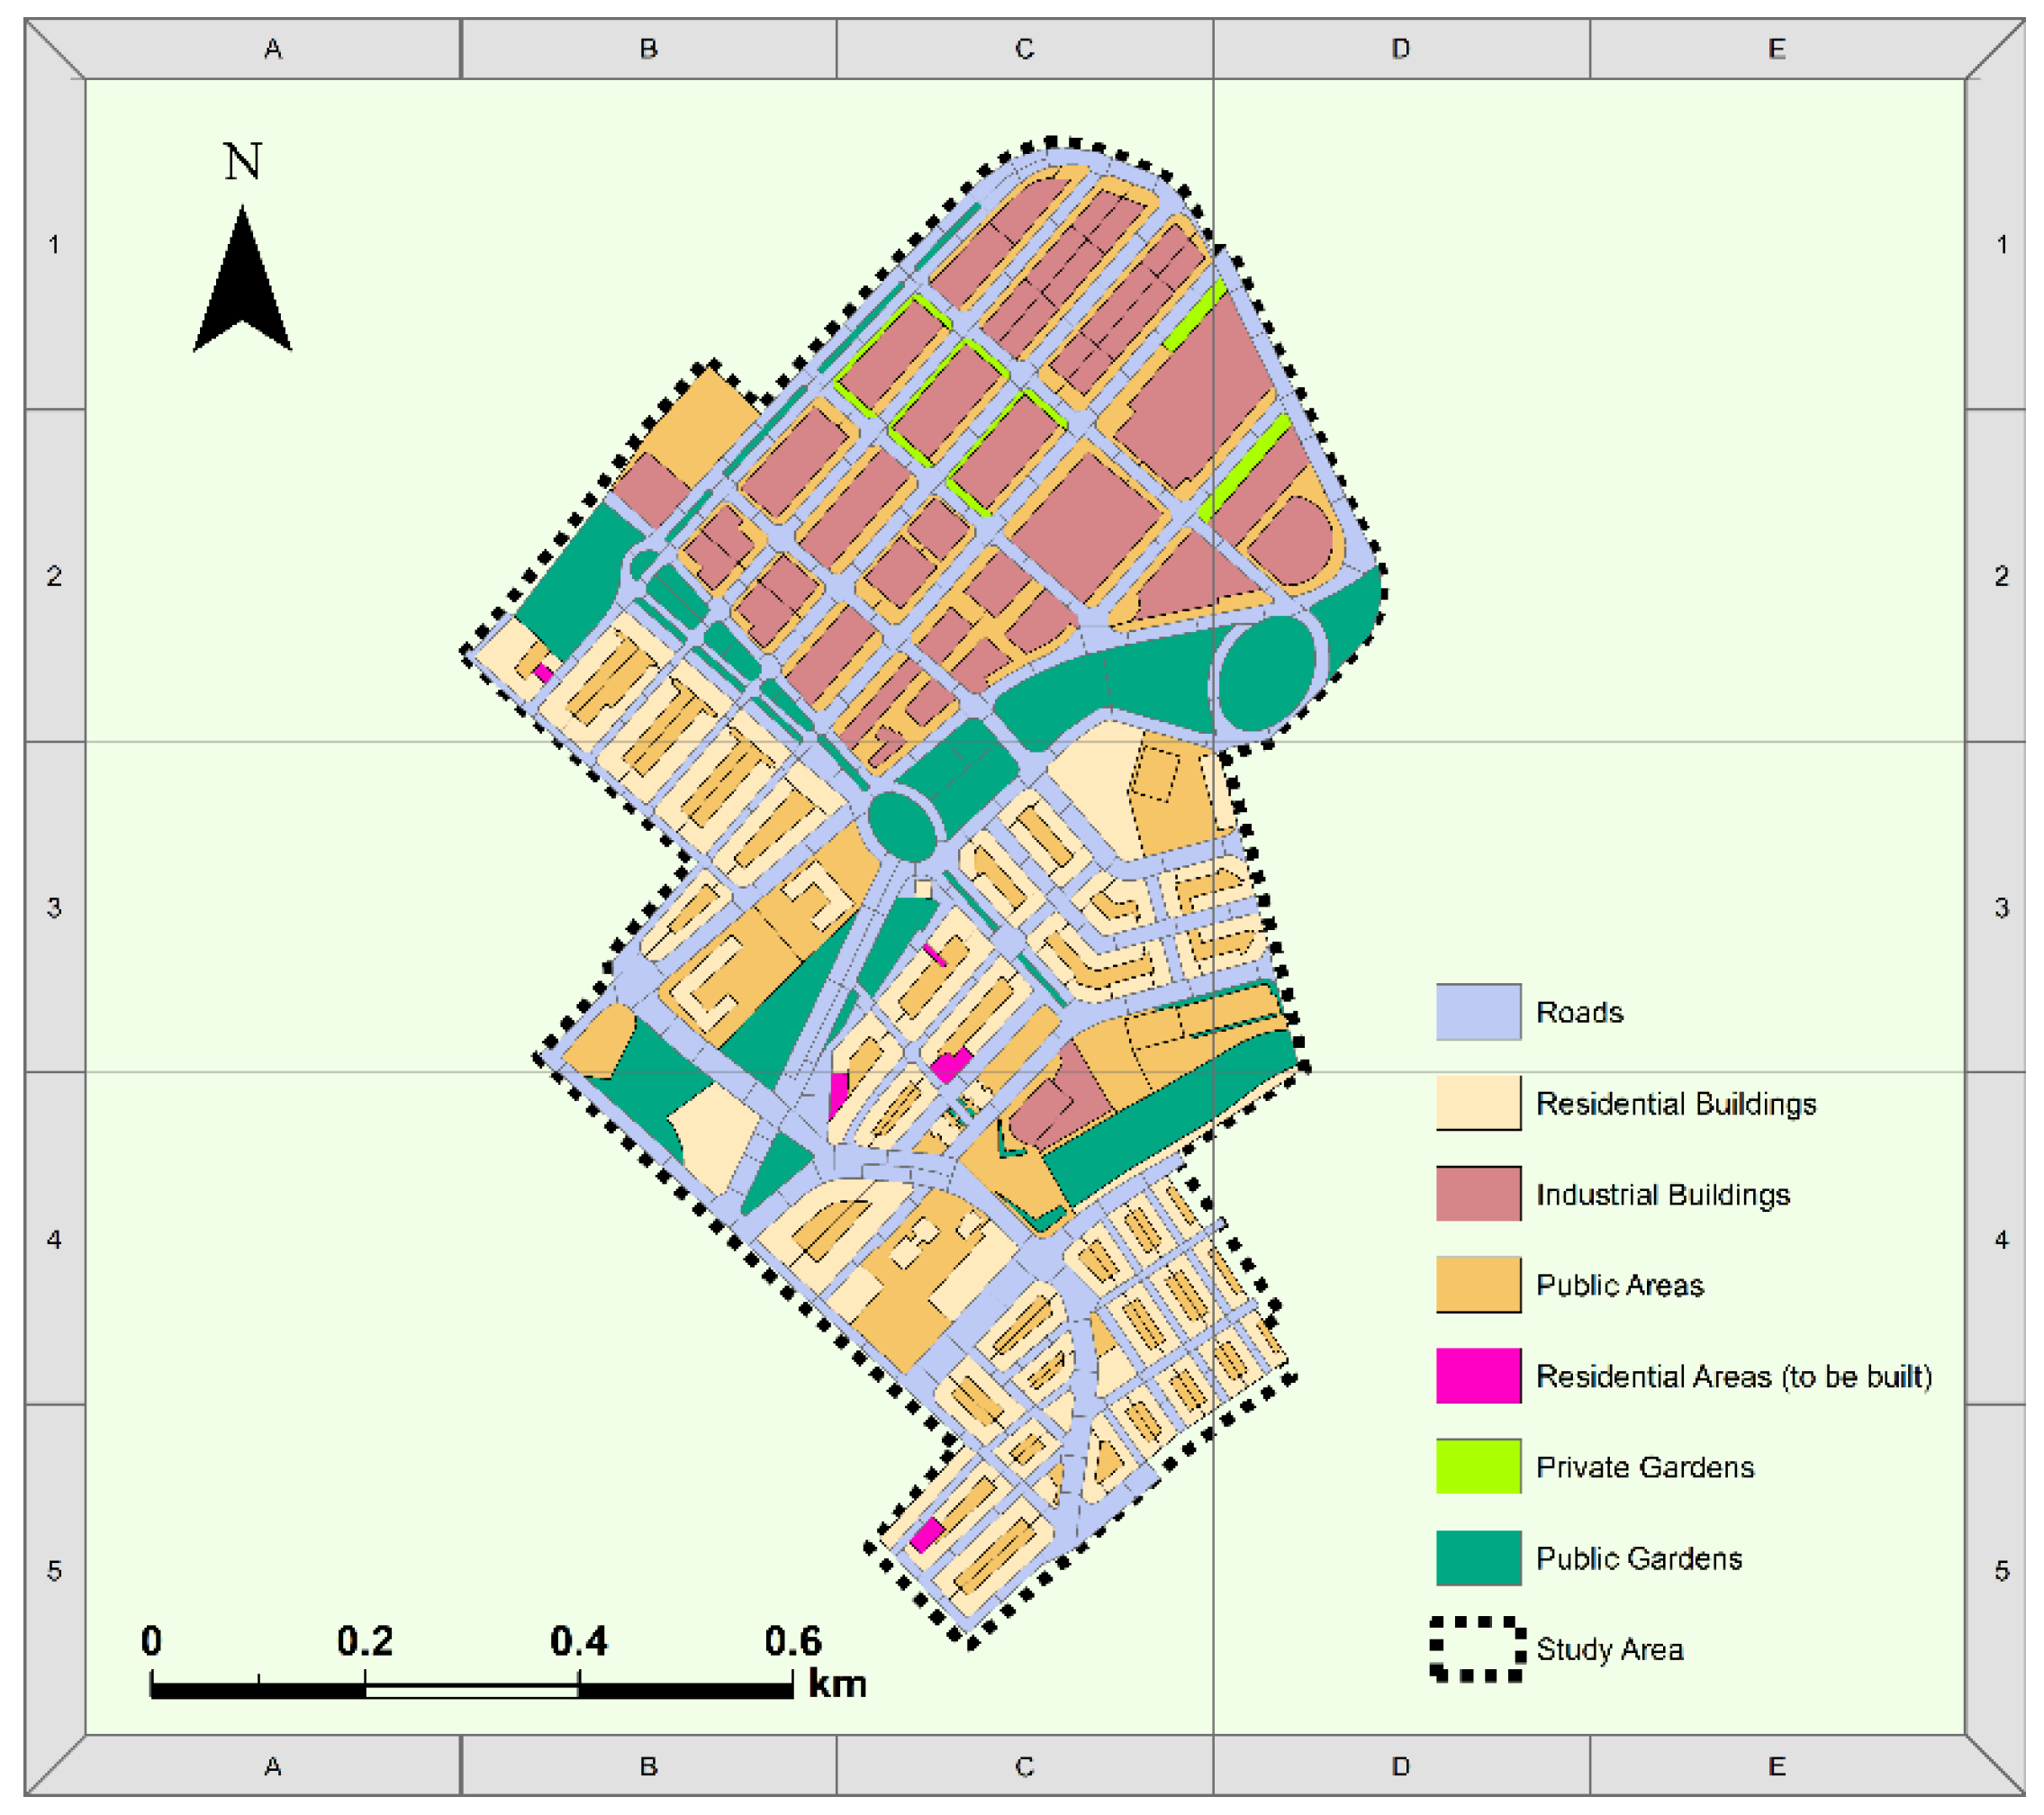
The study area comprises a diverse urban structure, including industrial buildings, characterised by large impermeable roofs and paved yards; residential buildings, ranging from multi-unit blocks to detached houses with moderate impermeability; public areas, such as sidewalks, car parks, and pedestrian zones, which are predominantly paved and contribute significantly to runoff; residential plots to be developed, currently vacant and offering higher infiltration potential; private gardens, typically associated with homes and commercial properties, providing permeable surfaces and ornamental vegetation; public gardens, including parks, green verges, and landscaped roundabouts, which play a key role in stormwater attenuation; and roads, encompassing streets and avenues with asphalt or concrete surfaces, representing the most extensive impermeable network within the catchment.
With technical input from BGEO, the area was classified into the following land use categories: industrial buildings, residential buildings, public areas (parking lots, sidewalks, and public walkways), residential areas (to be built), private gardens, public gardens (natural areas, parks, grassy roundabouts, medians, and natural-soil areas) and roads (
Figure 3).
Table 1 lists the total area of the study site and the corresponding area for each category.
The SuDSs considered in this study include a range of nature-based solutions designed to manage stormwater more effectively within urban environments. These comprise green roofs (GRs), which provide vegetated layers on building rooftops to intercept rainfall and reduce runoff; bioretention cells (BCs), shallow landscaped depressions that filter and temporarily store stormwater; infiltration trenches (ITs), linear gravel-filled structures that promote infiltration into the underlying soil; permeable pavements (PPs), which allow water to pass through their surface and sub-base layers, reducing surface runoff; and rain barrels (RBs), simple storage units that collect roof runoff for later non-potable use. Together, these facilities aim to mimic natural hydrological processes, improving infiltration, reducing peak flows, and enhancing water quality. These specific SuDSs were selected for the case study based on their proven effectiveness in dense urban environments, compatibility with existing infrastructure, and feasibility for implementation within the spatial and economic constraints of the study area.
The integration of spatially referenced data with the SWMM enabled a theoretical analysis of Sustainable Urban Drainage System implementation and the corresponding hydraulic and hydrological sizing of the study area [
2]. These analyses assessed the drainage network’s performance, with a particular emphasis on reducing surface runoff volumes and, consequently, minimising overflow occurrences at diversion structures in combined sewer overflows (CSOs). The approach provides a robust technical foundation for the planned, long-term deployment of nature-based solutions such as SuDSs [
3,
21].
Using data from the Institut Cartogràfic i Geològic de Catalunya (ICGC) and the World Reference Base for Soil Resources (WRB) [
22], local soils were classified as Eutric Leptosol and Calcaric Leptic Cambisol. Mapping these units onto the U.S. Department of Agriculture (USDA) taxonomy showed that the dominant soil in the study area is sandy loam [
23].
Rainfall infiltration into the upper soil layer of each sub-catchment’s pervious portion was modelled with the Curve Number (CN) method [
24]. Infiltration classes result from intersecting the soil hydrologic group with land use/land cover categories, yielding a CN that governs the relationship between total precipitation and effective precipitation (the share that becomes surface runoff). Classes were delineated in QGIS, and CN values were assigned to every sub-catchment under antecedent moisture condition II (AMC II) (field capacity) in accordance with USDA-SCS Urban Hydrology for Small Watersheds (TR-55) [
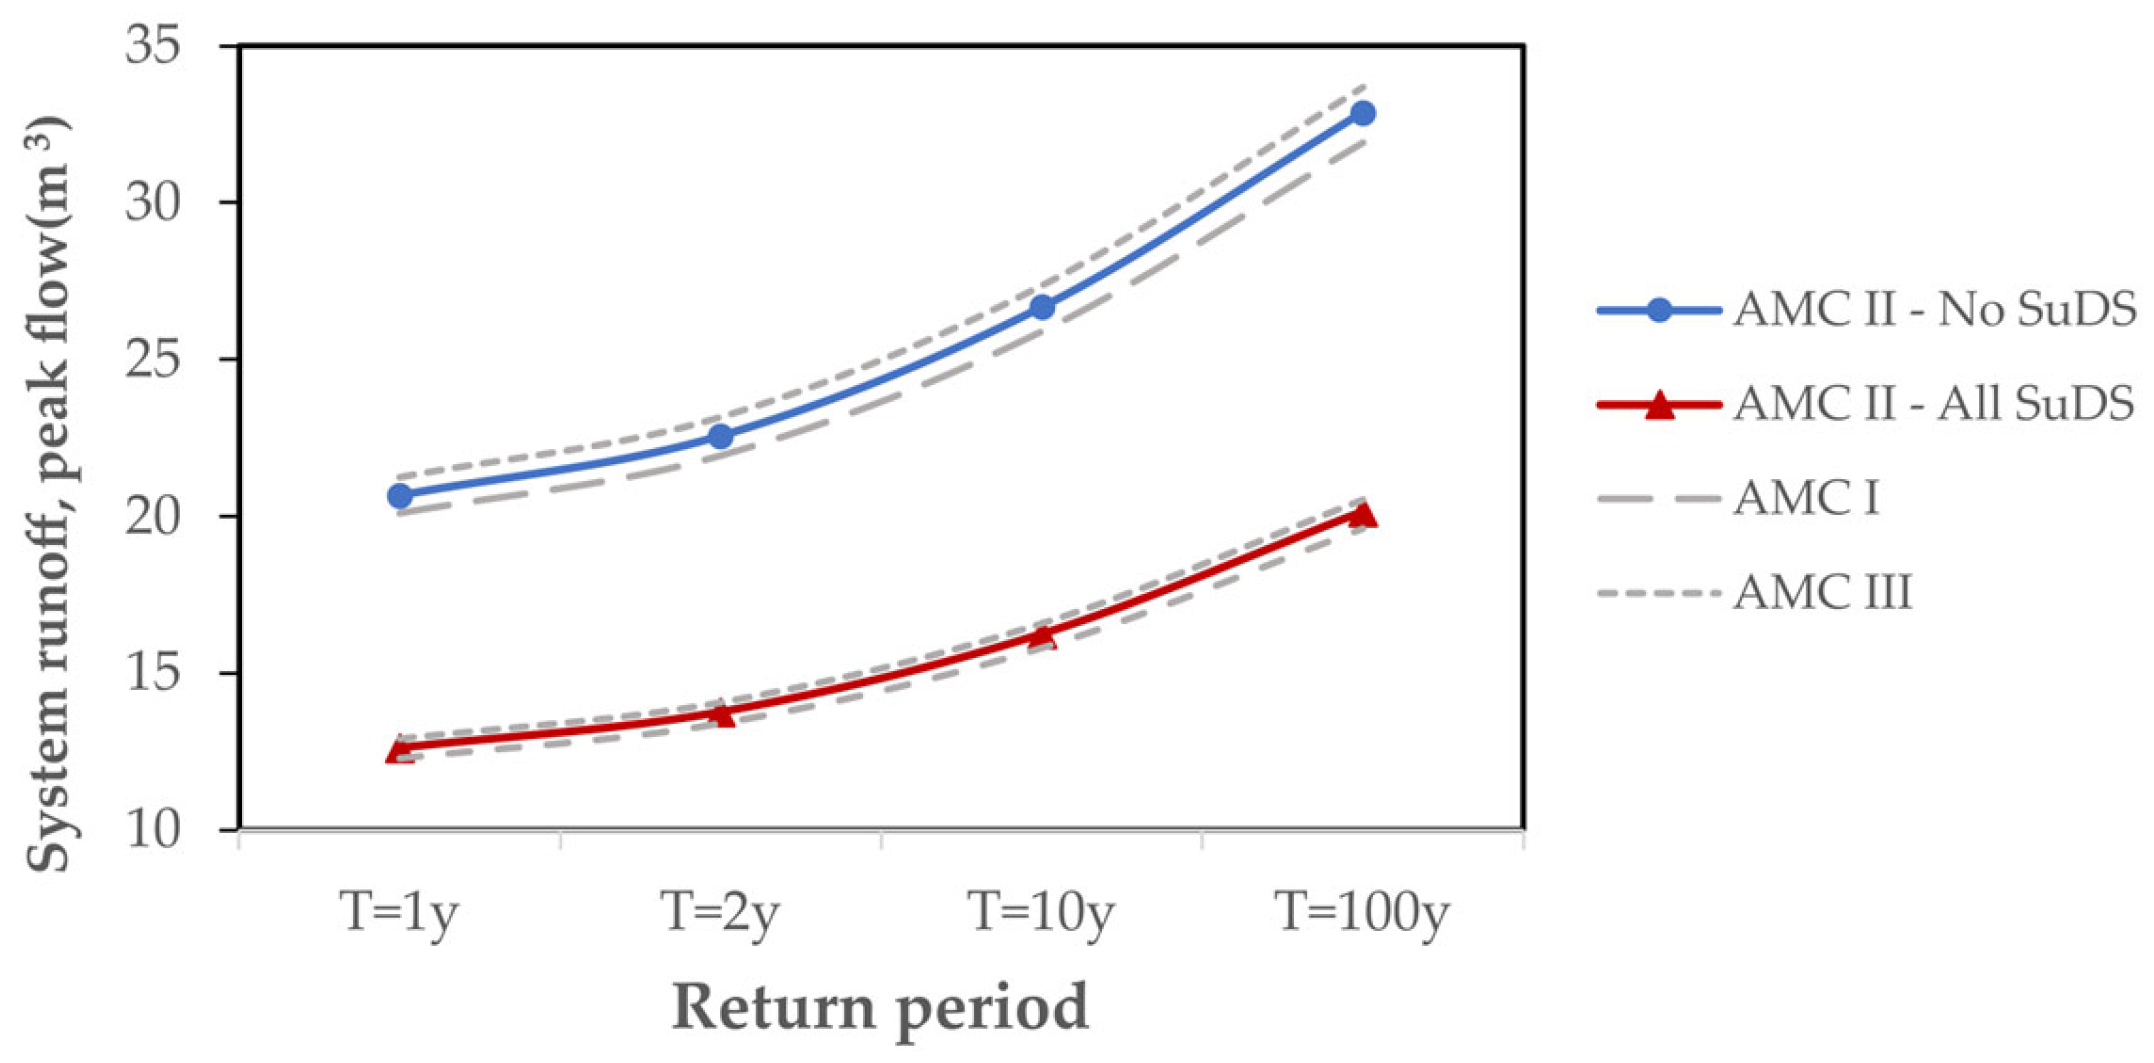
24]. To ensure realistic runoff estimates, the CN values were assigned under antecedent moisture condition II (AMC II), which corresponds to field capacity. This condition reflects average soil moisture and is widely recommended in hydrological modelling for urban catchments, as it balances the extremes of dry and saturated conditions. By adopting AMC II, the study aligns with standard practice in the USDA-SCS TR-55 methodology, providing a robust basis for evaluating stormwater behaviour under typical rainfall scenarios. Subsequently, a sensitivity analysis was carried out for AMC I and AMC II. Each sub-catchment was further characterised by mean slope and by the proportion of pervious and impervious area.
Following geoprocessing and data treatment, all results were stored in a PostgreSQL database, extended with PostGIS spatial capabilities [
25].
2.4. Preparation and Input of Data in SWMM
The selection of SuDS technologies for the subbasin was restricted to low-impact development (LID) practices that can be represented in the SWMM, namely (a) green roofs, (b) bioretention cells, (c) infiltration trenches, (d) permeable pavements, and (e) rain barrels.
Drawing on municipal priorities, neighbourhood characteristics, and the technical feasibility of each sub-catchment, a SuDS allocation table (
Table 1) was compiled, specifying the intended implementation percentages for every sector of the urban neighbourhood. The table was produced jointly with BGEO engineers and municipal staff, all of whom possess detailed knowledge of the city’s infrastructure.
The five SuDS technologies adopted in this study were chosen through a structured SuDS allocation table (see
Table 1). This table was designed to ensure that the selected solutions were technically feasible, contextually appropriate, and economically viable for the study area. The criteria applied included
Availability within SWMM as low-impact development (LID) practices, guaranteeing compatibility with hydraulic and hydrological modelling;
Suitability to local urban typologies, such as residential and industrial buildings, roads, and green areas;
Structural feasibility, considering constraints such as roof load capacity and space for infiltration systems;
Cost-effectiveness and ease of maintenance, prioritising technologies that municipalities can realistically implement;
Conservative coverage percentages, defined through discussions on constructability and funding limitations, acknowledging that public authorities generally have greater capacity to invest in environmental assets than private stakeholders.
The SuDS allocation table was developed collaboratively with BGEO engineers and municipal staff, ensuring alignment with local infrastructure and governance priorities. Coverage percentages for each technology were deliberately conservative to reflect realistic implementation scenarios. This approach was grounded in exploratory discussions of suitability, cost, buildability, and funding availability.
BGEO holds a complete drainage network inventory in QGIS/GISwater, including nodes/manholes (ground and invert levels), conduits (diameter, material, etc.), and electromechanical assets such as pumps. During the initial modelling stage, this inventory was found to contain several errors, which, using in situ observations and BGEO’s assistance, were corrected. The main issues were network discontinuities and pipe/manhole depths, resolved by updating the ground and invert levels of the manholes. The revised dataset was then exported directly from GISwater to the SWMM.
Each SuDS technology requires the specification of distinct physical parameters. These were derived from the local soil classification and from guidance in the SWMM manual. The adopted values are presented in
Table 2.
2.5. Rainfall Characterisation
The Mediterranean climate is characterised by torrential rainfall, which displays short-duration, high-intensity peaks, especially in autumn, and by extreme temperatures. Such conditions generate local flooding problems because the drainage infrastructure cannot cope, resulting in, among other consequences, combined sewer overflows and pollution of the receiving waters [
26].
For the modelling exercise, design storms were based on IDF curves provided by Meteocat (Servei Meteorològic de Catalunya) [
27]. Of the several IDF relationships available, the curve derived from Fabra Observatory rainfall data was selected as the one most representative of the study area. The IDF relation is expressed by Equation (1):
where
is the rainfall intensity (mm min
−1),
is the return period (years), and
is the storm duration (min). This curve enables rainfall intensities to be derived for
= 1, 2, 5, 10, 50, and 100 years and for storm durations as short as one minute.
Using the Fabra Observatory intensity relationship (Equation (1)), rainfall depths were estimated for the runoff modelling of the subbasin (
Table 3). The total duration of each design storm was set as a function of the catchment concentration time (
), expressed in hours, in line with the methodology proposed in the Technical Guide for SuDS Design in Barcelona for Urban Catchments [
28]. For this purpose, Equation (2) was applied:
where
is the degree of urbanisation (ranging from 0 to 1),
i is the slope (mm
−1), and
is the flow path length (km). The concentration time calculated with Equation (2) was
= 28 min; for the present study, it was rounded to
= 30 min, divided into six 5-min blocks (
Table 3) consistent with the SWMM’s time-step structure. Hyetographs were constructed with the alternating block method [
29].
Recent research has highlighted the critical role of temporal resolution in hydrological modelling. Gogien et al. [
6] demonstrated that reducing the computation time step from 5 min to 1 min can change the predicted solids load during convective events by up to 30%. The debate on temporal resolution culminated in Lyu et al. [
7], who demonstrated that peak discharge is highly sensitive to the temporal resolution, whereas the total simulated runoff volume changes only marginally. Increasing the time step from 1 min to 5–15 min systematically underestimates peak flow by up to 30%. The same authors recommend using time steps of ≤5 min for catchments ≤1 km
2 and ≤15 min for larger basins to keep the peak-flow error below 10%.
In light of these findings, the present study adopted a 5 min time step for all simulations, consistent with best practice recommendations for small urban catchments. This choice ensures that peak-flow dynamics are accurately captured, thereby improving the reliability of performance indicators (Ij and Ic) and the relative comparative assessment of SuDS scenarios.
Return periods of 1 and 2 years were selected as representative of ordinary storms, whereas 10 and 100 years were chosen because they are benchmark return periods cited by the Catalan Meteorological Service [
28].
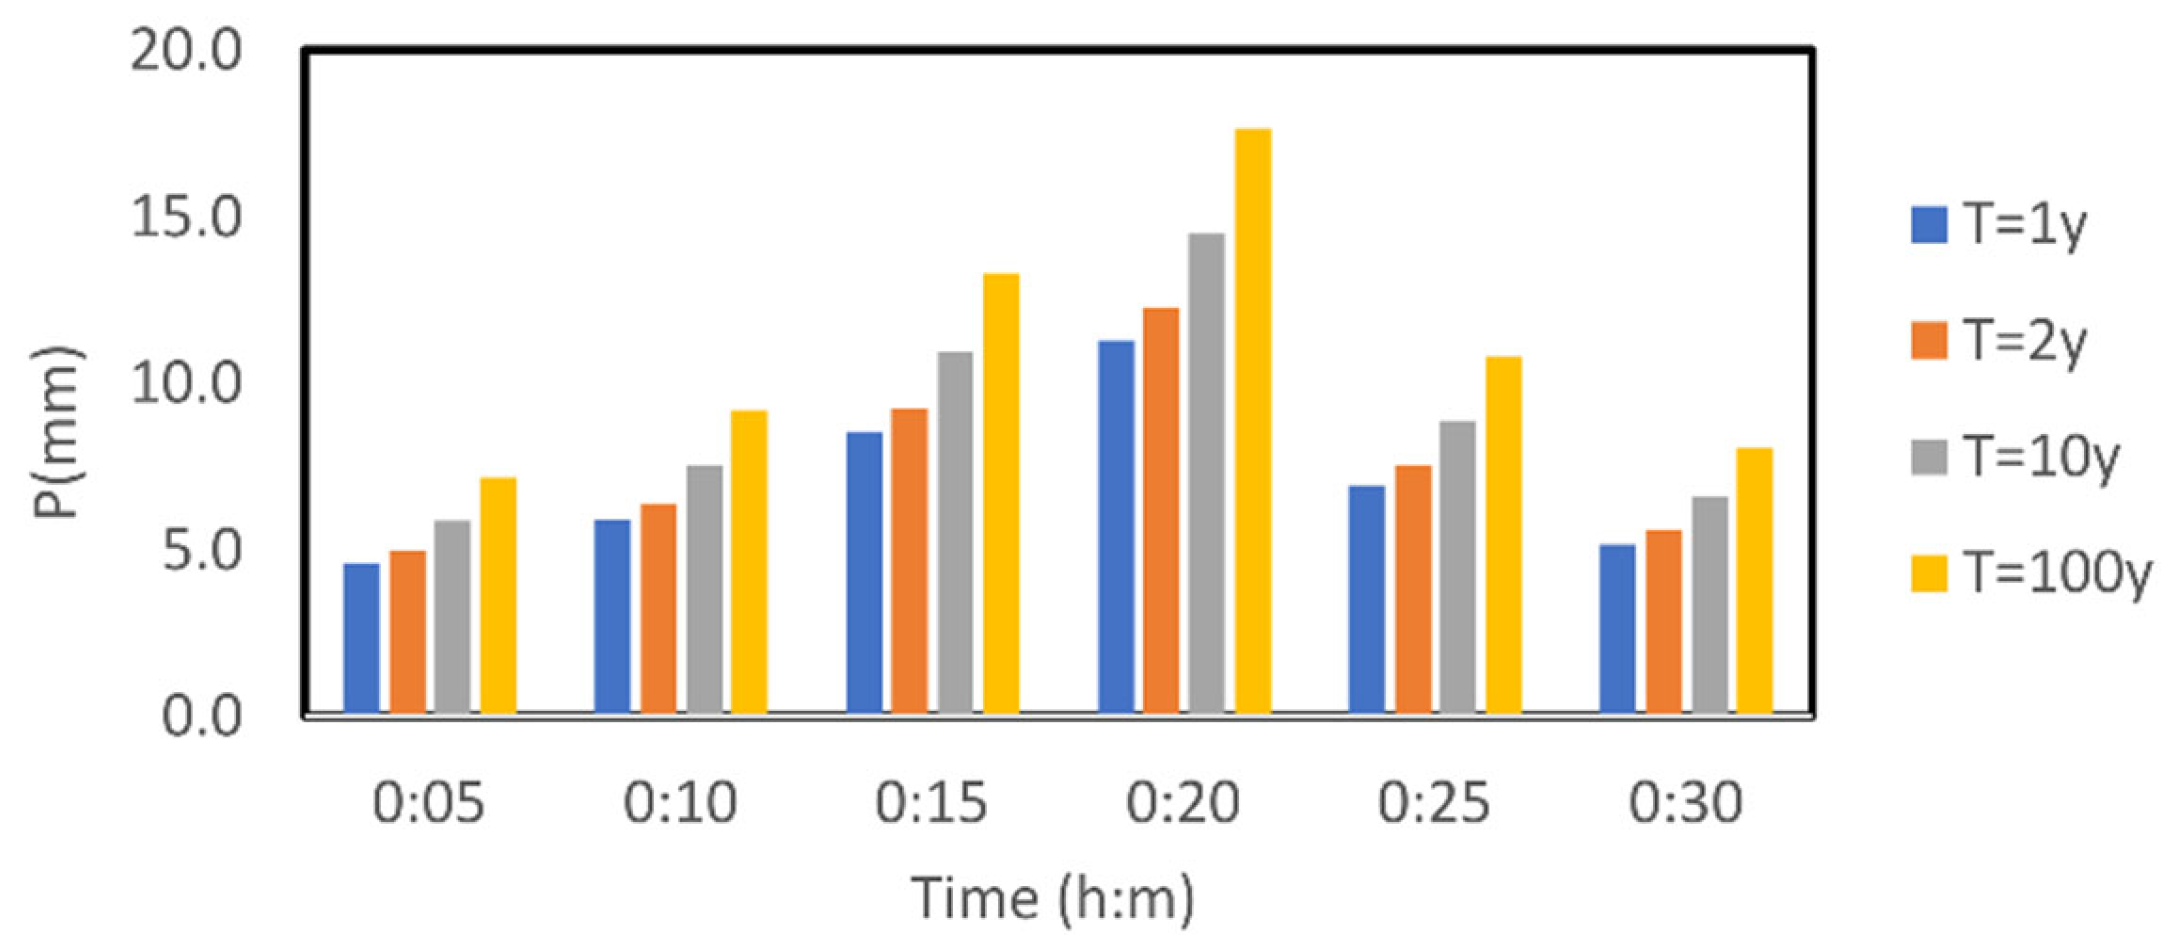
Figure 4 presents the design hyetographs generated using the alternating block method for return periods of 1, 2, 10, and 100 years, illustrating the temporal distribution of rainfall precipitation (mm) throughout each storm event and providing the basis for hydrological modelling in the SWMM.
2.6. Scenarios Considered in the Modelling with and Without SuDSs
Using QGIS/Giswater, the input data files (.inp) required for the SWMM were generated. To simulate SuDS implementation in the study area, seven scenarios were defined for each design storm in
Table 3: (a) no SuDSs; (b) green roofs; (c) bioretention cells; (d) infiltration trenches; (e) permeable pavement; (f) rain barrels; and (g) all SuDSs deployed simultaneously.
For every scenario, manhole and conduit performance indices were computed. Two key assumptions underpinned the simulations: (i) because the analysis concerns ordinary (T =1 y and T = 2 y) rather than extreme events (T = 10 y and T = 100 y), no antecedent rainfall was assumed, so the antecedent soil moisture was taken under field capacity and available for infiltration; and (ii) wastewater flows were excluded from the network, even though it operates as a combined (and occasionally partially separate) system. For all scenarios, the coverage percentage of each SuDS technology was kept constant across simulations to ensure that performance comparisons reflected only the characteristics of the technologies and not variations in implementation area.
2.7. Performance Indicators
To evaluate the hydraulic performance of a stormwater drainage system, specifically within a combined (unitary) network, the following performance indicators were proposed: (a) the manhole indicator (
Ij) and (b) the conduit indicator (
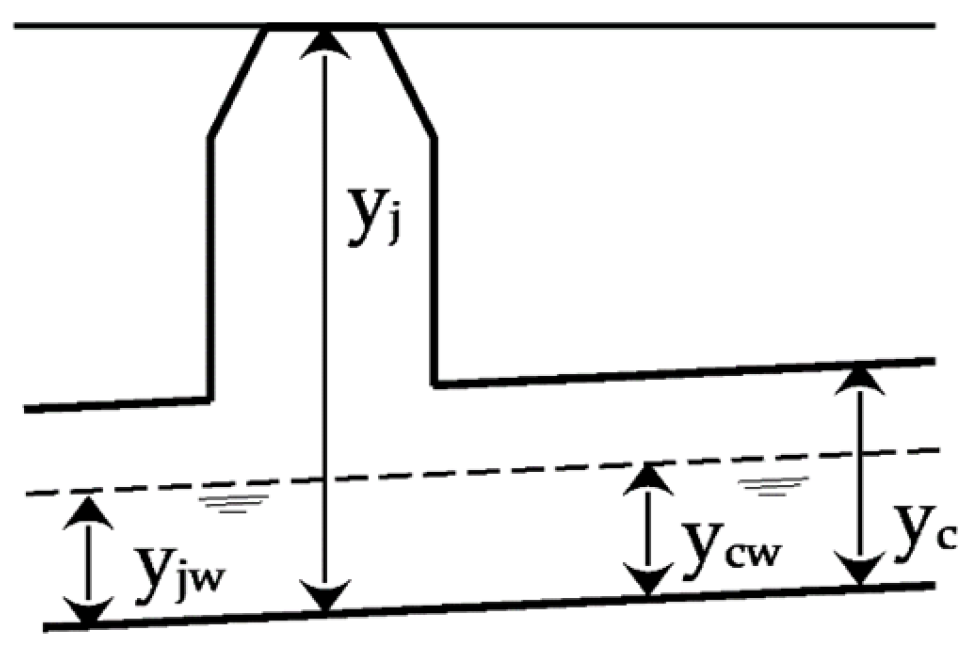
Ic). The parameters that feed into these indicators are displayed in
Figure 5.
The manhole index is given by Equation (3) and ranges from zero (empty conduit) to values exceeding one, which indicate a surcharged manhole and a flooded area.
where
Ij is the junction (manhole) index,
yjw is the water depth at the junction, and
yj is the junction height, that is, the maximum water depth before flooding occurs.
The conduit indicator is likewise obtained from the ratio given in Equation (4), and its value ranges from zero (empty conduit) to one (full conduit):
where
Ic is the conduit index,
ycw is the water depth inside the conduit, and
yc is the total conduit height. Higher values of
Ij and
Ic indicate poorer system performance.
The performance classes defined for the Ic (conduit) and Ij (junction) indices are grounded in the hydraulic behaviour of circular pipes operating under partially full, free-surface flow conditions. When such conduits function as open-channel sections, the relationship between flow depth (yw/yc), discharge (Q/Qfull), and velocity (V/Vfull) follows well-established empirical and theoretical curves.
According to [
29,
30], a circular conduit conveys approximately 50–60% of its full-flow discharge when the flow depth reaches only 50% of the diameter. Hydraulic efficiency continues to increase up to a relative depth of 0.8–0.9
yc, where the flow area and hydraulic radius achieve their optimum combination. Beyond this range, however, the onset of pressurised or near-surcharged conditions causes energy losses, turbulence, and potential backflow, leading to a rapid decline in hydraulic efficiency.
To assess the hydraulic efficiency of the urban drainage components, the performance indicators
Ic and
Ij were classified on a five-level qualitative scale (
Table 4).
Low-to-medium values of the performance indicators indicate that the sewers retain sufficient flow capacity, corresponding to good or acceptable hydraulic performance. As the internal water level rises and the conduits approach their maximum conveyance capacity, performance progressively deteriorates. Consequently, high values of the performance indices signify operating conditions that are close to or exceed the recommended hydraulic capacity, thereby justifying less favourable qualitative ratings.
The use of the Ic and Ij indices provides a standardised framework for performance assessment, allowing for the comparison of hydraulic behaviour across different modelling scenarios (with and without SuDSs).
These indicators were designed as hydrodynamic penalty functions capable of converting continuous model outputs into discrete performance classes (very good, good, fair, poor, insufficient), thereby facilitating spatial interpretation and the prioritisation of intervention alternatives.
Although the model was not calibrated using field data, possible inaccuracies in the absolute values do not compromise the analysis, as the indices were applied under consistent methodological conditions across all scenarios. Their relative and comparative nature ensures that the assessment of internal variations in system behaviour remains valid for sensitivity and scenario-based analysis.
4. Discussion
4.1. Critical Synthesis of the Main Results
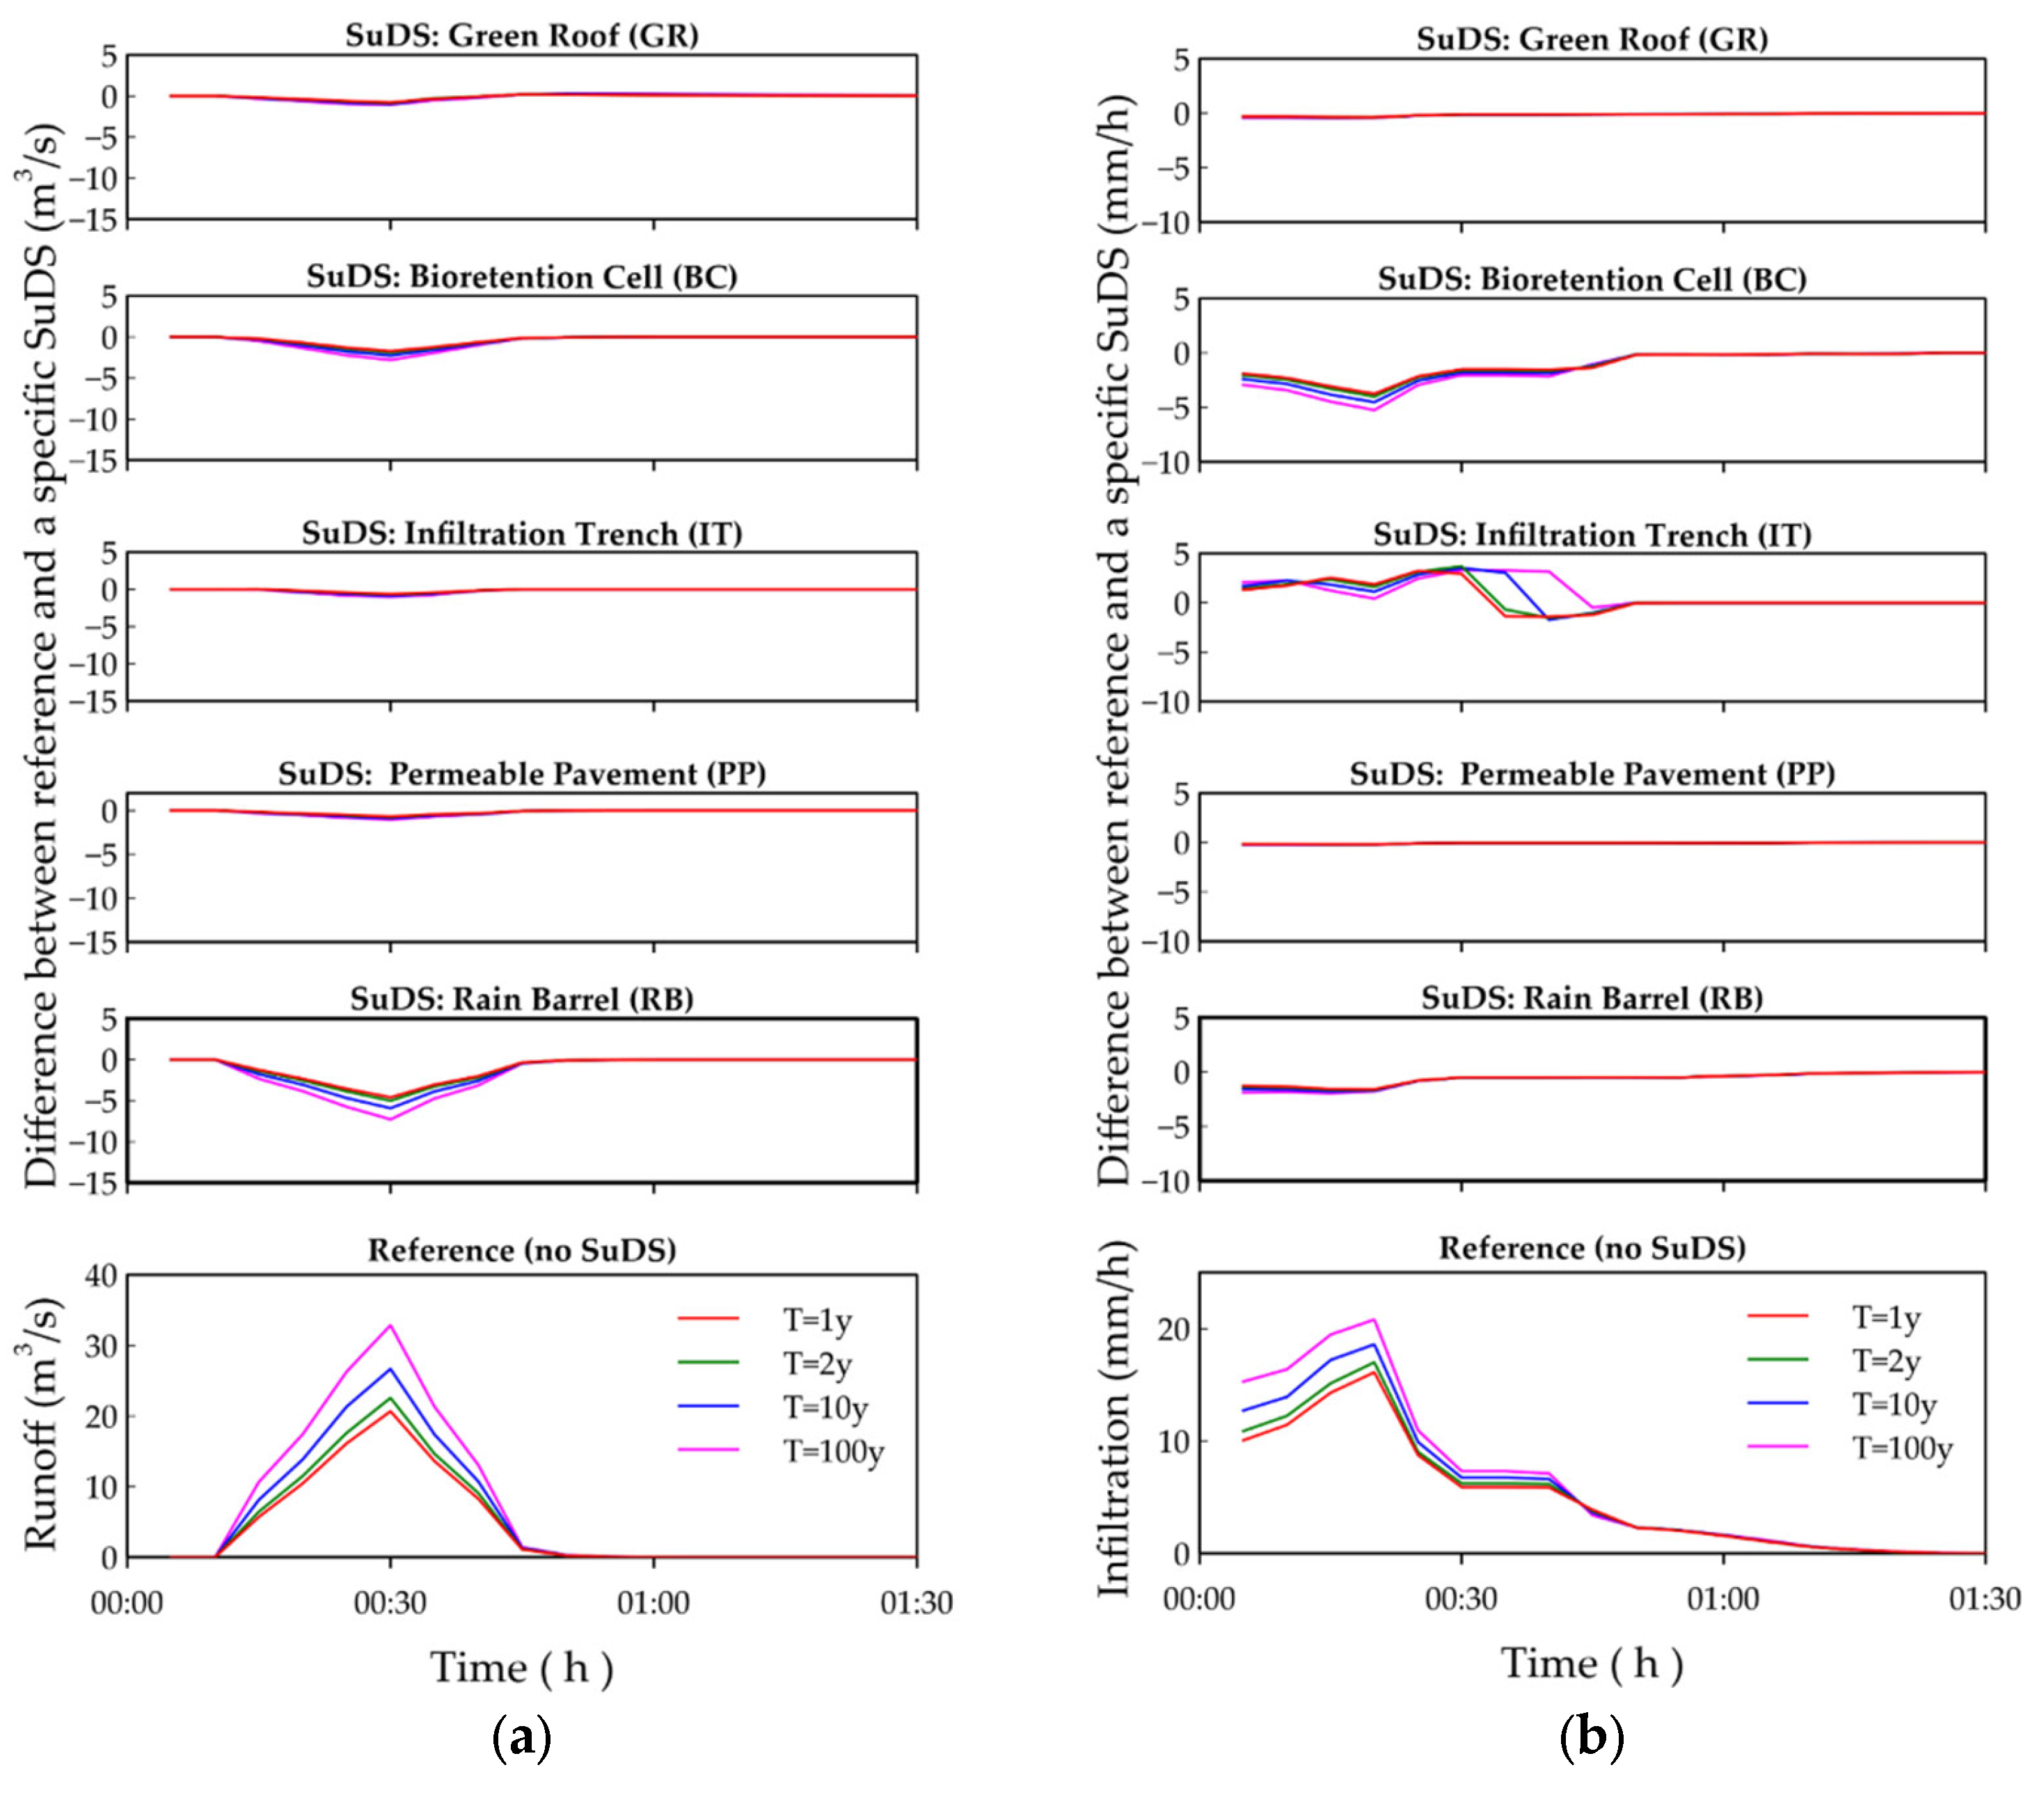
A comprehensive assessment of total runoff volume and peak discharge reductions reveals the effectiveness of the Sustainable Drainage Systems (SuDSs) applied in the subbasin. Under the reference condition, no SuDSs, runoff volumes amount to 22,888 m3 (T1), 25,004 m3 (T2), 29,928 m3 (T10), and 37,053 m3 (T100), with corresponding peak discharges of 20.7 m3 s−1, 22.6 m3 s−1, 26.7 m3 s−1, and 32.9 m3 s−1. The integrated “All SuDSs” scenario is the most effective, achieving absolute reductions of up to 13,183 m3 in runoff volume and 12.8 m3 s−1 in peak flow for T100, equivalent to decreases of 35.6% and 38.9%, respectively. These figures highlight the substantial benefits of an integrated approach in attenuating surface runoff and relieving pressure on urban drainage systems, particularly during extreme events.
Among individual measures, rain barrels perform best, reducing total volume by up to 8309 m3 and peak discharge by 7.3 m3 s−1, both about 22%. Their effectiveness stems from their ability to intercept and store rainfall, as well as their ease of deployment in residential settings. Bioretention cells reduce total runoff by up to 3021 m3 and peak flow by 2.8 m3 s−1 (≈8%), owing to their high infiltration and filtration capacity, making them a robust option where vegetated space is available.
Permeable pavements and infiltration trenches exhibit intermediate performance. The former lowers total runoff by up to 1205 m3 and peak flow by 1.1 m3 s−1 (≈3.3%), while the latter achieves similar reductions. Both technologies are effective for controlling local runoff, particularly in paved areas. Green roofs, by contrast, provide the least benefit, with decreases of <250 m3 in total volume and <1.1 m3 s−1 in peak discharge (<4%). This limited performance is likely related to their restricted footprint and the storage capacity of the roof systems installed.
In summary, although every SuDS option helps curb surface runoff, the combined approach is unequivocally the most effective. Integrating multiple typologies delivers a more comprehensive and resilient response to urban hydrology challenges, fostering sustainable stormwater management and markedly reducing the risks associated with uncontrolled discharges and network surcharges.
The results depicted in
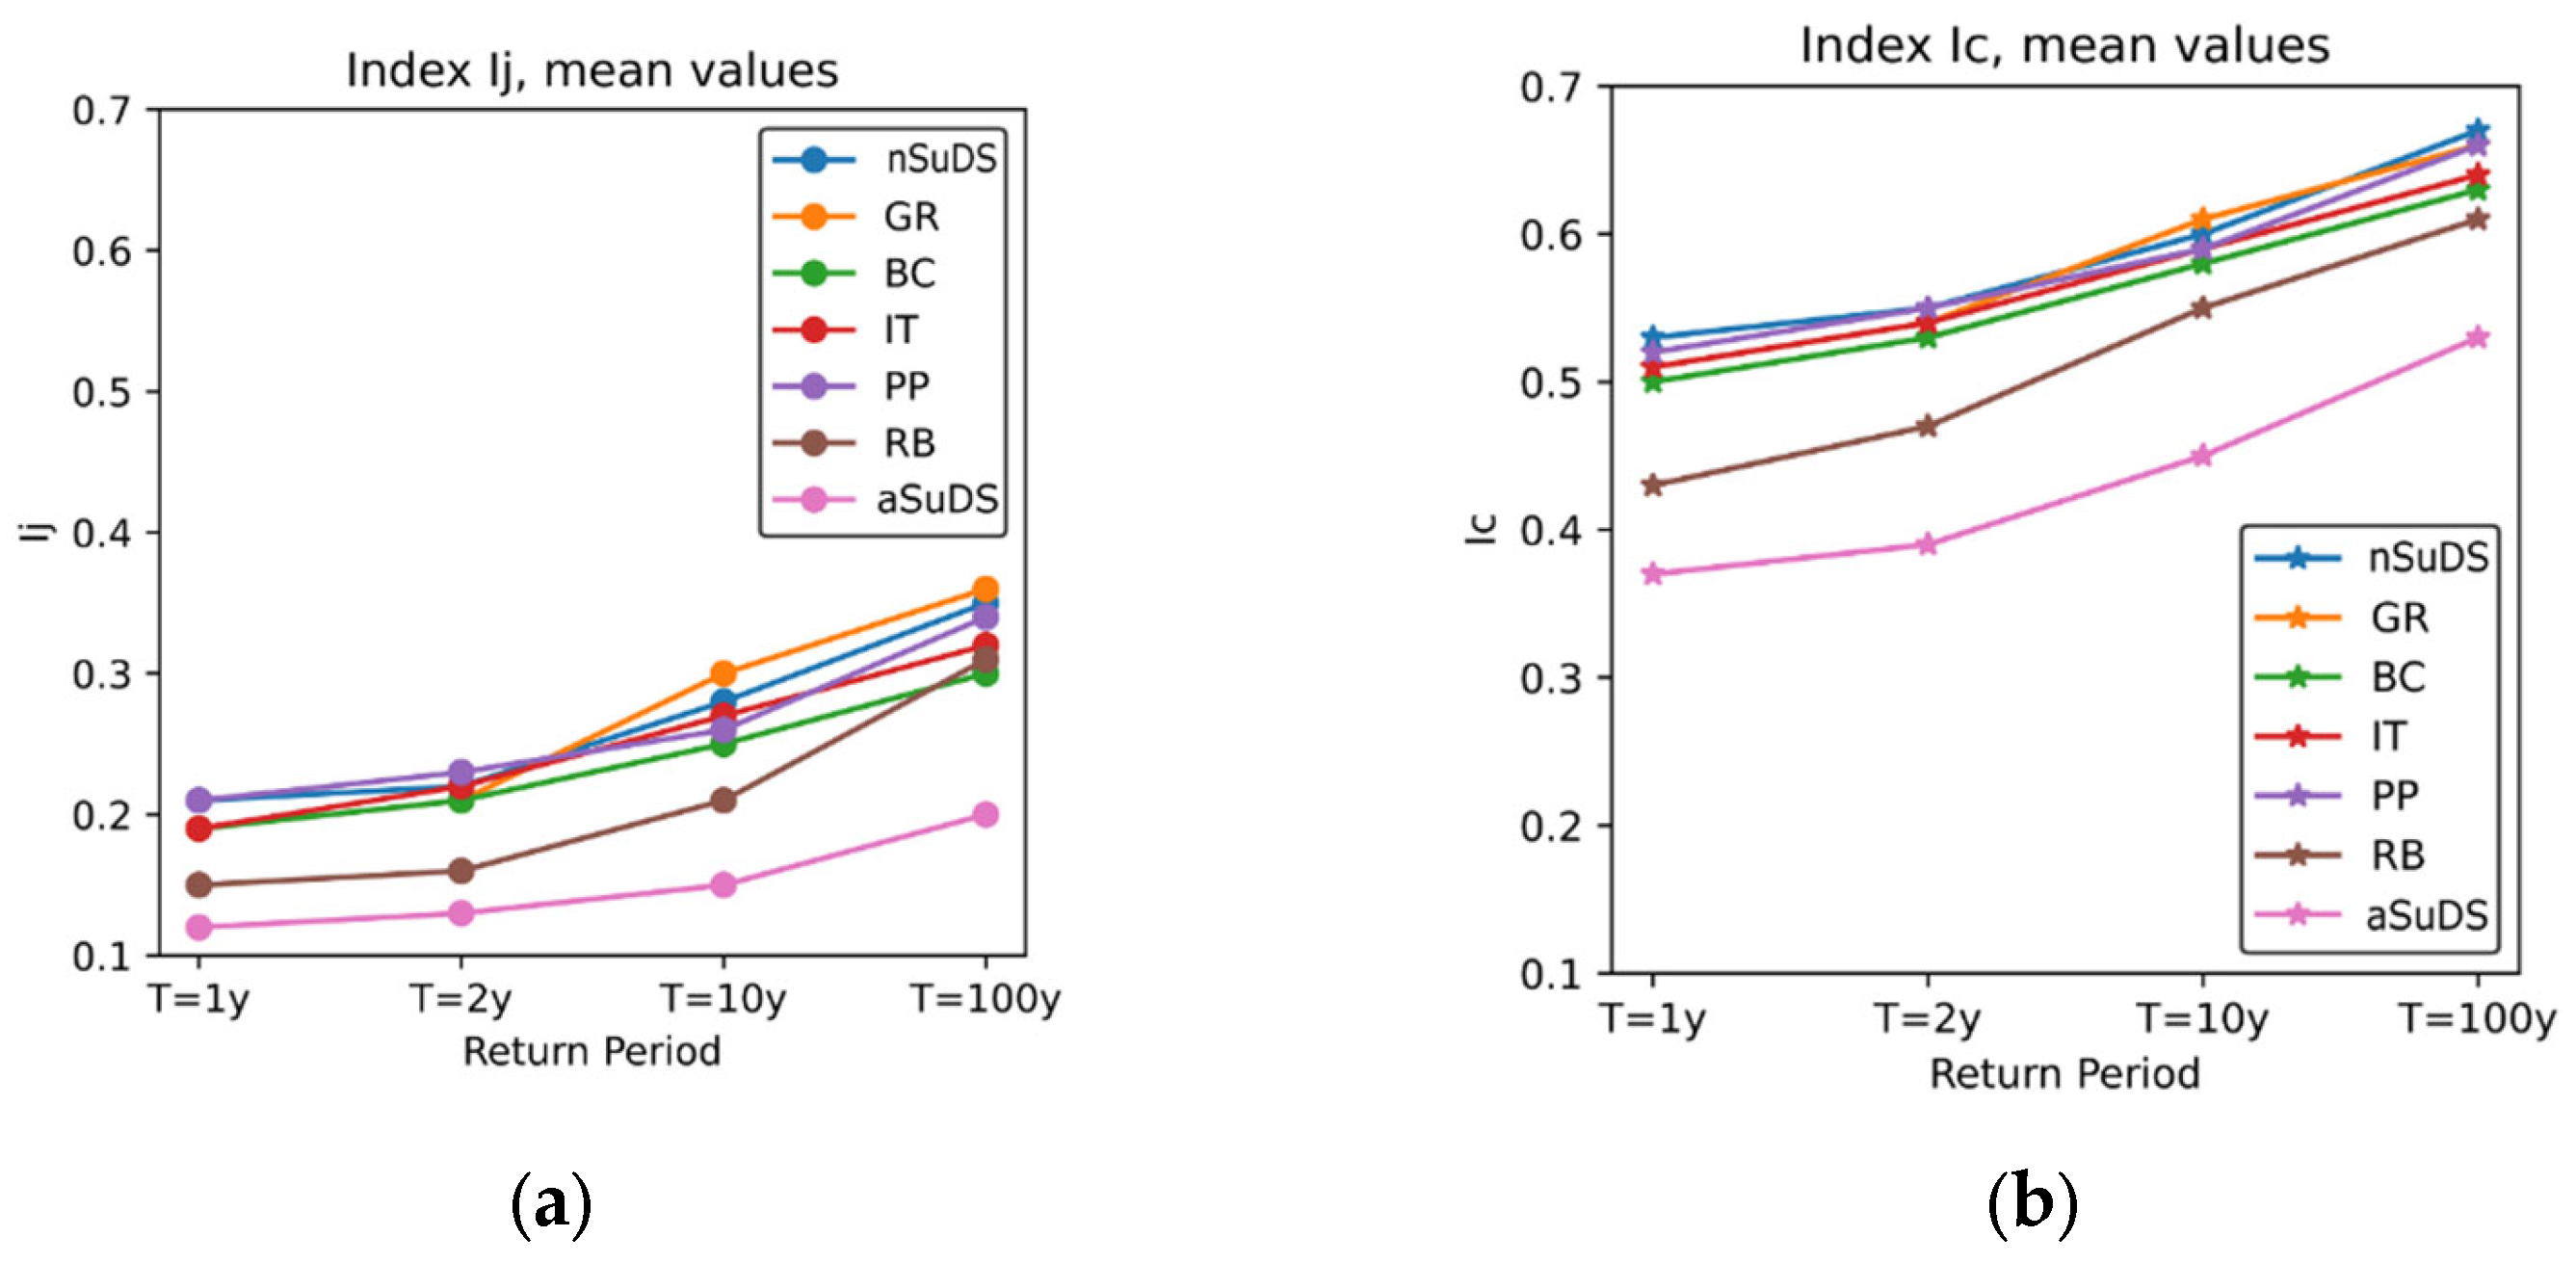
Figure 13 give the global average behaviour of the system, expressed through the mean junction index (
Ij), which reflects surcharge at manholes, and the mean conduit index (
Ic), which indicates surcharge in pipes. For the reference scenario (no SuDSs),
Ij ranges from 0.21 (return period
T1) to 0.35 (
T100), whereas
Ic increases from 0.53 (
T1) to 0.67 (
T100). These values represent the baseline hydraulic stress on the subbasin drainage infrastructure.
The analysis of the hydraulic performance indices Ij (manholes) and Ic (conduits) provides quantitative evidence of the system’s response to SuDS implementation. Under the baseline condition (no SuDSs), average values of Ij = 0.21 and Ic = 0.53 for the 1-year return period indicate that a significant fraction of the network already operates near half capacity during ordinary rainfall. For the 100-year event, these indices rise to Ij = 0.35 and Ic = 0.67, confirming widespread surcharge conditions and the absence of safety margins.
When all SuDSs are implemented, mean values fall to
Ij = 0.12 and
Ic = 0.37 for T
1 and to
Ij = 0.20 and
Ic = 0.53 for T
100. These correspond to performance improvements of approximately 43% and 30%, respectively, compared to the baseline. The downward and leftward displacement of the percentile curves (
Figure 10) further illustrates a systemic reduction in hydraulic stress, with the proportion of conduits operating under surcharge (
Ic > 0.75) declining from nearly 29% to around 10% of the network.
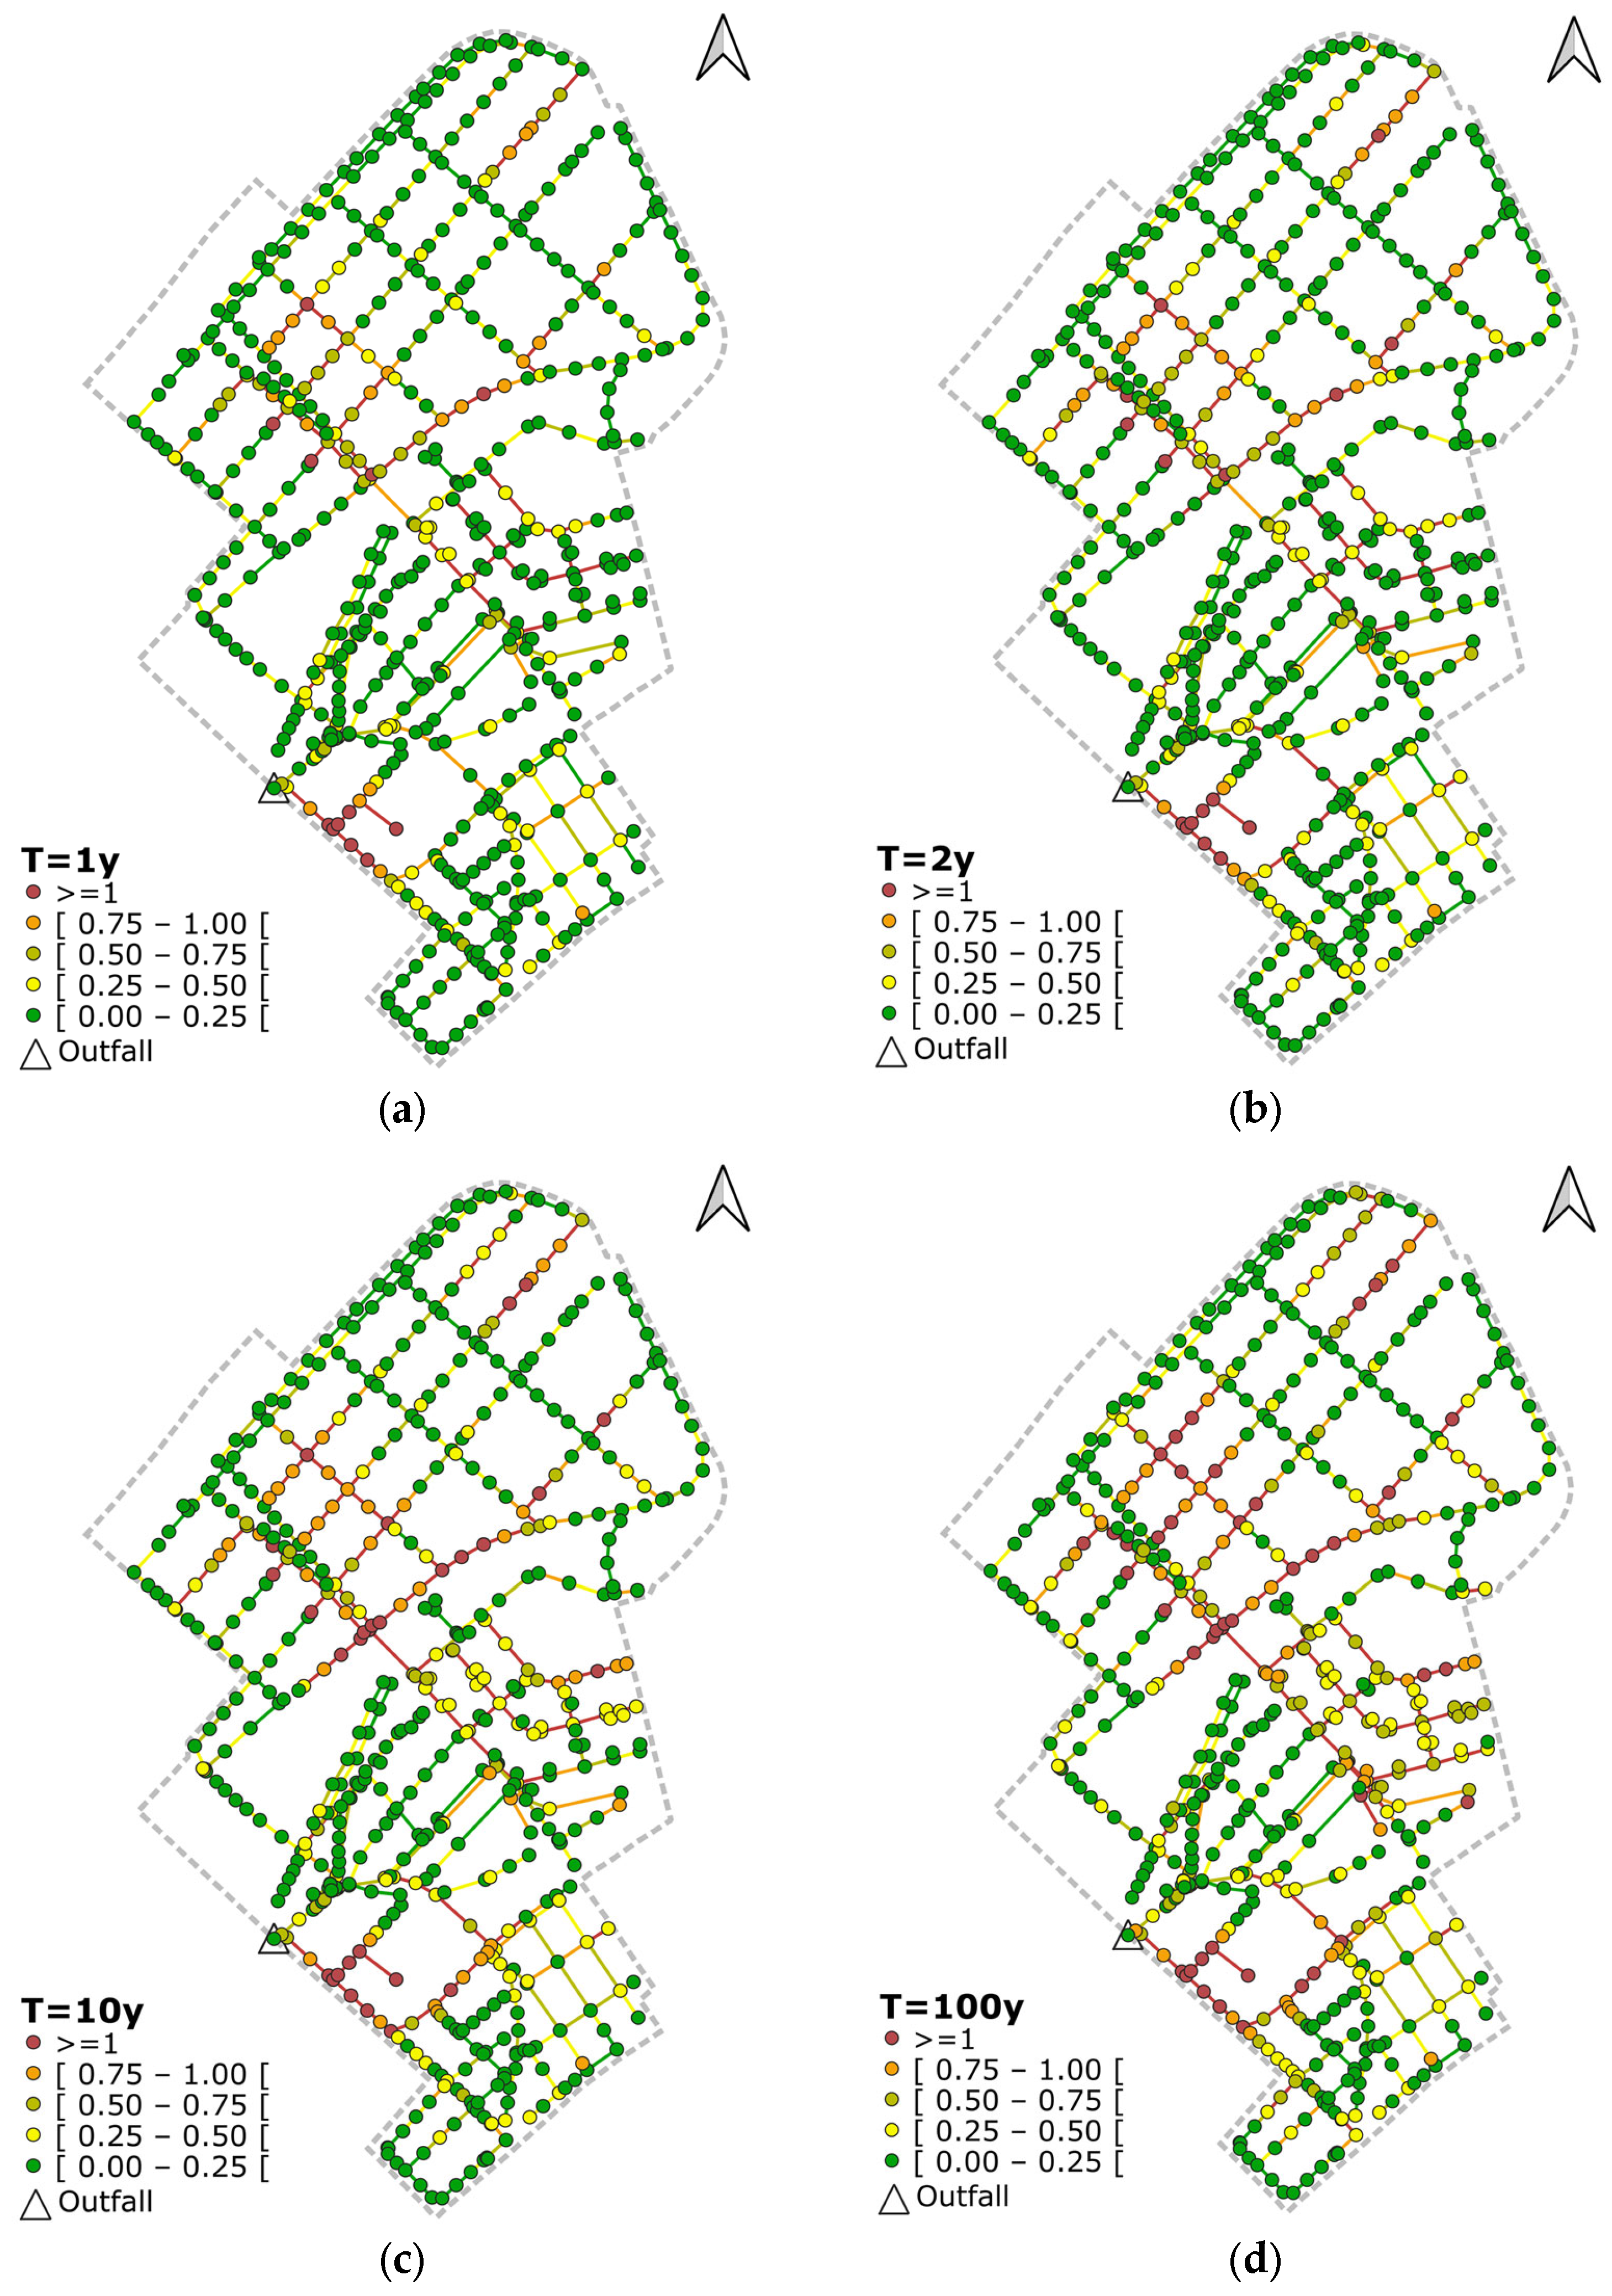
Spatially,
Figure 6 and
Figure 9 demonstrate that the most significant decreases in both indices occur in the southern sector of the study area, which previously exhibited chronic overload. After SuDS implementation, this zone transitions from the “Very Poor/Insufficient” category to “Acceptable/Very Good” (
Table 4 classification). The improvement reflects the cumulative effect of distributed infiltration and storage mechanisms, particularly the combination of rain barrels and bioretention cells, which intercept roof and surface runoff before it reaches the main collectors.
The differential behaviour of Ij and Ic also reveals the mechanisms at play: reductions in Ij are primarily associated with attenuation of surcharge at junctions, whereas lower Ic values denote enhanced conveyance and fewer pressurised segments. Together, these indices confirm that the SuDS allocation covering 42.8% of the basin not only decreases total runoff volumes and peaks but also re-balances the internal hydraulic regime of the network, preventing localised pressure accumulation and backflow events.
Therefore, the integration of Ij and Ic within the evaluation framework transforms qualitative hydraulic mapping into a quantitative performance assessment, reinforcing the conclusion that distributed SuDS deployment yields a measurable and spatially consistent improvement in urban drainage efficiency.
4.2. Comparison with the Hypotheses and the Literature
Starting from the hypothesis that combining multiple SuDS typologies would markedly reduce surface runoff and relieve pressure on the combined sewer network, the results confirm this premise. However, they also show that the magnitude of the benefit is strongly governed by the percentage coverage achieved. Joshi et al. [
3] reported reductions of up to 68% in CSO events when extensive inline detention and bioretention were installed. In the subbasin, the reduction was 20–27%, as only 59% of the sub-catchment area received detention facilities, and part of the network still contains undersized sections. The meta-analysis by Montoya-Coronado et al. [
8] indicates that 30% coverage with detention–bioretention is sufficient to reduce CSO peaks by 20–45%; the present study corroborates the lower end of this range in a Mediterranean setting. Cavadini et al. [
9] documented clear synergies when permeable pavements form part of blue–green treatment trains; in our case, infiltration trenches complemented permeable pavements, but the model simulated these technologies independently rather than as hydraulically linked elements. This simplification means that the potential cumulative benefits of sequential configurations were not captured, which may slightly underestimate integrated performance; however, it does not affect the validity of the comparative analysis of individual technologies.
Finally, the relatively modest efficiency of green roofs (≈4%) aligns with De Cristo et al. [
10], who quantified performance losses of 10–15% after prolonged dry summers, an outcome consistent with recurring Mediterranean droughts.
4.3. Limitations and Uncertainties
The study is subject to several limitations that should be acknowledged: (i) Although BGEO has fully charted the network, it is neither fitted with real-time sensors nor supported by historical, systematic measurement campaigns that would enable hydrological and hydraulic calibration. (ii) The initial conditions assumed soil moisture under field capacity and no residual wastewater flow, a simplification that may underestimate antecedent soil saturation and thus the actual runoff volume. (iii) The implementation percentages on the SuDS allocation table were deliberately conservative, constrained by the municipality’s technical and economic guidelines; more ambitious coverage could yield benefits closer to those reported in other cities. (iv) The modelling concentrated solely on hydraulic and hydrological variables and did not address pollutant removal, even though there is evidence that SuDSs perform well in that regard. (v) Finally, the simulations did not consider temporal degradation arising from clogging, blockage, or changes in soil conductivity, processes that can diminish performance over the medium term.
4.4. Urban-Planning Implications
The vulnerability pattern identified in the southern sector of the neighbourhood, where performance was consistently poorer across all return periods, underscores the need to prioritise interventions in this area, either by installing rainwater tanks on the rear facades of buildings or by converting parking areas to permeable pavement. The favourable cost-to-benefit ratio of rain barrels, simple, distributed, and low-maintenance devices, makes them the most effective entry-level option for municipalities with limited budgets. Strengthening infiltration trenches within existing green corridors would further boost aquifer recharge, while simultaneously advancing climate adaptation objectives and mitigating urban heat island effects.
The outcomes of this study align closely with international and European policy frameworks that promote resilient and sustainable urban environments. The demonstrated reduction in flood risk and the enhancement of infiltration through SuDS implementation directly support the UN Sustainable Development Goals (SDG 6, SDG 11, and SDG 13), which aim to improve water management, promote sustainable urbanisation, and facilitate climate adaptation. Similarly, the EU Urban Agenda and its Partnerships on Climate Adaptation and Sustainable Land Use advocate integrating nature-based solutions into spatial planning and infrastructure renewal. The modelling approach adopted here, combining GISwater with performance indices (Ij and Ic), offers a practical pathway for municipalities to operationalise these frameworks, translating high-level policy commitments into spatially explicit, evidence-based planning actions.
4.5. Recommendations for Future Research
To advance current knowledge, future work should (i) fit the network with real-time sensors to collect hydraulic data to enable the model calibration using field data; (ii) incorporate unitary wastewater flows to capture situations in which network capacity is exceeded; (iii) assess SuDS treatment trains in series, operated under real-time control, as advocated by Fletcher et al. [
2], to gauge additional marginal benefits (iv) undertake field-monitoring campaigns that enable structural calibration of infiltration parameters and quantification of functional degradation over time; and (v) extend the analysis to water quality and ecosystem service metrics (temperature moderation, biodiversity support, and air-quality improvement), developing integrated, multiscale indicators.
In summary, this study confirms the relevance of SuDSs as a mitigation strategy in dense Mediterranean neighbourhoods, yet shows that their absolute effectiveness hinges critically on the implementation area, network integration, and maintenance. A phased approach, starting with rain barrels and progressively adding other typologies, emerges as a technically sound and financially viable pathway for this study area and cities of similar morphology.
5. Conclusions
5.1. Key Results and Findings
Modelling the subbasin without any SuDSs produced surface-runoff volumes ranging from 22,888 m3 (T1) to 37,053 m3 (T100) and peak discharges between 20.7 m3 s−1 and 32.9 m3 s−1, with the greatest surcharging concentrated in the southern sector of the study area. Comparing scenarios in which each SuDS option was deployed individually showed that rain barrels were the most effective stand-alone measure, lowering runoff volume by up to 8309 m3 and peak flow by 7.3 m3 s−1 (≈22% reduction). Bioretention cells also performed well (cuts of ≈3021 m3 and 2.8 m3 s−1), followed by infiltration trenches and permeable pavements, which achieved intermediate reductions (≈3–4% of volume).
When all SuDS typologies (green roofs, bioretention, infiltration trenches, permeable pavements, and rain barrels) were implemented simultaneously, the system registered absolute decreases of up to 13,183 m3 in runoff volume and 12.8 m3 s−1 in peak discharge for the 100-year event, equivalent to reductions of 35.6% and 38.9%, respectively. These results confirm the synergistic benefits of SuDS, which drain 42.8% of the catchment, enhancing peak-flow attenuation and boosting infiltration. This results in a notable increase from 4939 m3 in the baseline to markedly higher values in the SuDS scenarios. Finally, spatial analysis of the junction (Ij) and conduit (Ic) performance indices shows a migration of high-load zones (rated “Fair” to “Insufficient”) towards higher classes (“Very Good” to “Excellent”) across the neighbourhood, particularly in the historically vulnerable southern and central sectors.
5.2. Contributions of the Study
This study offers several innovations to both the knowledge base and the practice of sustainable drainage in Mediterranean settings.
First, it combines GISwater, an open-source platform that links QGIS/PostGIS with the SWMM, with a participatory SuDS allocation table (developed jointly by the municipality and BGEO) to assign SuDS coverage percentages to each sub-catchment, tailored to local characteristics such as land use, topography, and soil type. This methodological approach, merging geoprocessing, hydraulic modelling, and performance indices (Ij and Ic), constitutes a protocol that can be replicated in other dense urban contexts where inadequate drainage capacity triggers uncontrolled CSO discharges and attendant health risks.
Second, the study provides empirical confirmation that not all SuDSs perform equally: rain barrels and bioretention cells emerge as the backbone of peak-flow mitigation, whereas green roofs have only a marginal impact (<4% reduction). By documenting these relative efficiencies, the work strengthens international evidence [
3,
8] while adding data specific to a Mediterranean climate, including considerations of prolonged drought.
Finally, the use of the qualitatively graded indicators Ij and Ic (from “Very Good” to “Insufficient”) facilitates communication of results to decision-makers and local communities. Translating numerical outputs into hydraulic performance classes establishes a link between technical analysis and urban policy formulation, encouraging the adoption of SuDSs as a tool for urban resilience. Collectively, the study equips municipalities and practitioners with scientific and operational criteria for systematically integrating blue–green infrastructure into drainage networks.
5.3. Practical Recommendations
To provide a workable roadmap for the design, implementation, and management of SuDSs in dense urban neighbourhoods, thereby strengthening resilience to intense rainfall events and climate change, the following actions are proposed: (a) Adopt combined solutions wherever feasible. The cumulative retention + infiltration capacity achieved when SuDSs cover 42.8% of the drained area delivers the greatest flood attenuation (−35.6% in runoff volume; −38.9% in peak flow), (b) Prioritise critical sub-catchments. Direct initial investments to the southern and central sub-basins, where baseline performance indices ranged from “Fair” to “Insufficient”. In these sectors, rain barrels and bioretention cells should be deployed as a matter of urgency. (c) Institute programmed maintenance. Establish annual inspection schedules, especially for vegetated devices (bioretention cells, green roofs), to preserve hydrological performance over the long term and avoid efficiency losses caused by substrate clogging or degradation. (d) Adapt to Mediterranean climates. Supplementary irrigation of green roofs and bioretention cells may be required during prolonged dry periods to maintain substrate moisture and functional effectiveness. (e) Engage the community. Raise resident awareness of domestic rain barrels through information campaigns and financial incentives (e.g., subsidies), thereby fostering citizen participation in flood mitigation efforts. (f) Integrate digital management. Promote the use of GISwater across municipal departments, utility concessionaires, and operations teams, enabling real-time monitoring and continuous asset register updates and ensuring the long-term sustainability and straightforward replication of the model.
