3.1. Characterization of DSAC
Table 3 displays the elemental analysis findings of DS and DSAC. It can be seen from this table that the percentages of carbon and nitrogen have been increased, while those of hydrogen and oxygen have been decreased.
Actually, the pyrolysis step leads to the formation of carboneous material by oxygen, hydrogen, nitrogen and sulphur dioxide trace valorization.
During the pyrolysis operation, many steps have been observed:
- -
Hydrogen and oxygen are eliminated as CO, CO2, and H2O.
- -
In addition, the liberation of carbon monoxide and dioxide is usually observed in the range of 200–300 °C. However, between 240 °C and 360 °C, cellulose degradation occurs [
59].
- -
Furthermore, the discharge of hydrocarbons takes place between 300 °C and 400 °C, while between 400 °C and 500 °C, a significant quantity of gaseous hydrocarbons as well as heavy tars are generated. It is important to note that gas generation mainly involves hydrogen, carbon monoxide and hydrocarbons and takes place at temperatures ranging from 500 to 700 °C.
- -
Therefore, between 700 and 1000 °C, the carbon residue is the main substance remaining. In DSAC, carbon levels increased while hydrogen and oxygen levels decline.
This result is mainly due to the discharge of volatiles throughout the pyrolysis process that leads to the removal of non-carbon species but increasing the carbon. It is evident that the carbon amount of activated carbon has been increased notably following its activation, while the oxygen and hydrogen portions have been diminished. Furthermore, when the temperature exceeds 700 °C, the creation of micropores during the activation process has been caused through other elements.
The study based on physical adsorption isotherms is a commonly used method to establish the porous texture of a specific solid [
63]. In this investigation, CO
2 was used as the activation gas. In fact, the major reason for this choice is due to the ability to control the activation process. Date stone exhibits a highly microporous structure, evidenced by an S
micro/S
BET ratio of 93% (
Table 4), while the ratio of the microporous volume to the total pore volume (V
micro/V
T) is near 78%.
Thus, the pores that appear when the pore size reaches 7 nm present mainly the micropore dimensions and also exceed half of the total pore volume (Vmicro/VT). The Vmicro/VT confirms the predominance of micropore volumes.
It is well known that activation aims to increase porosity and establish a specific structure to produce a highly porous solid as the final product [
64]. During the activation process, pore formation usually occurs in three distinct phases: (i) the opening of previously inaccessible pores; (ii) the establishment of new pores; and (iii) the extension of existing pores [
65].
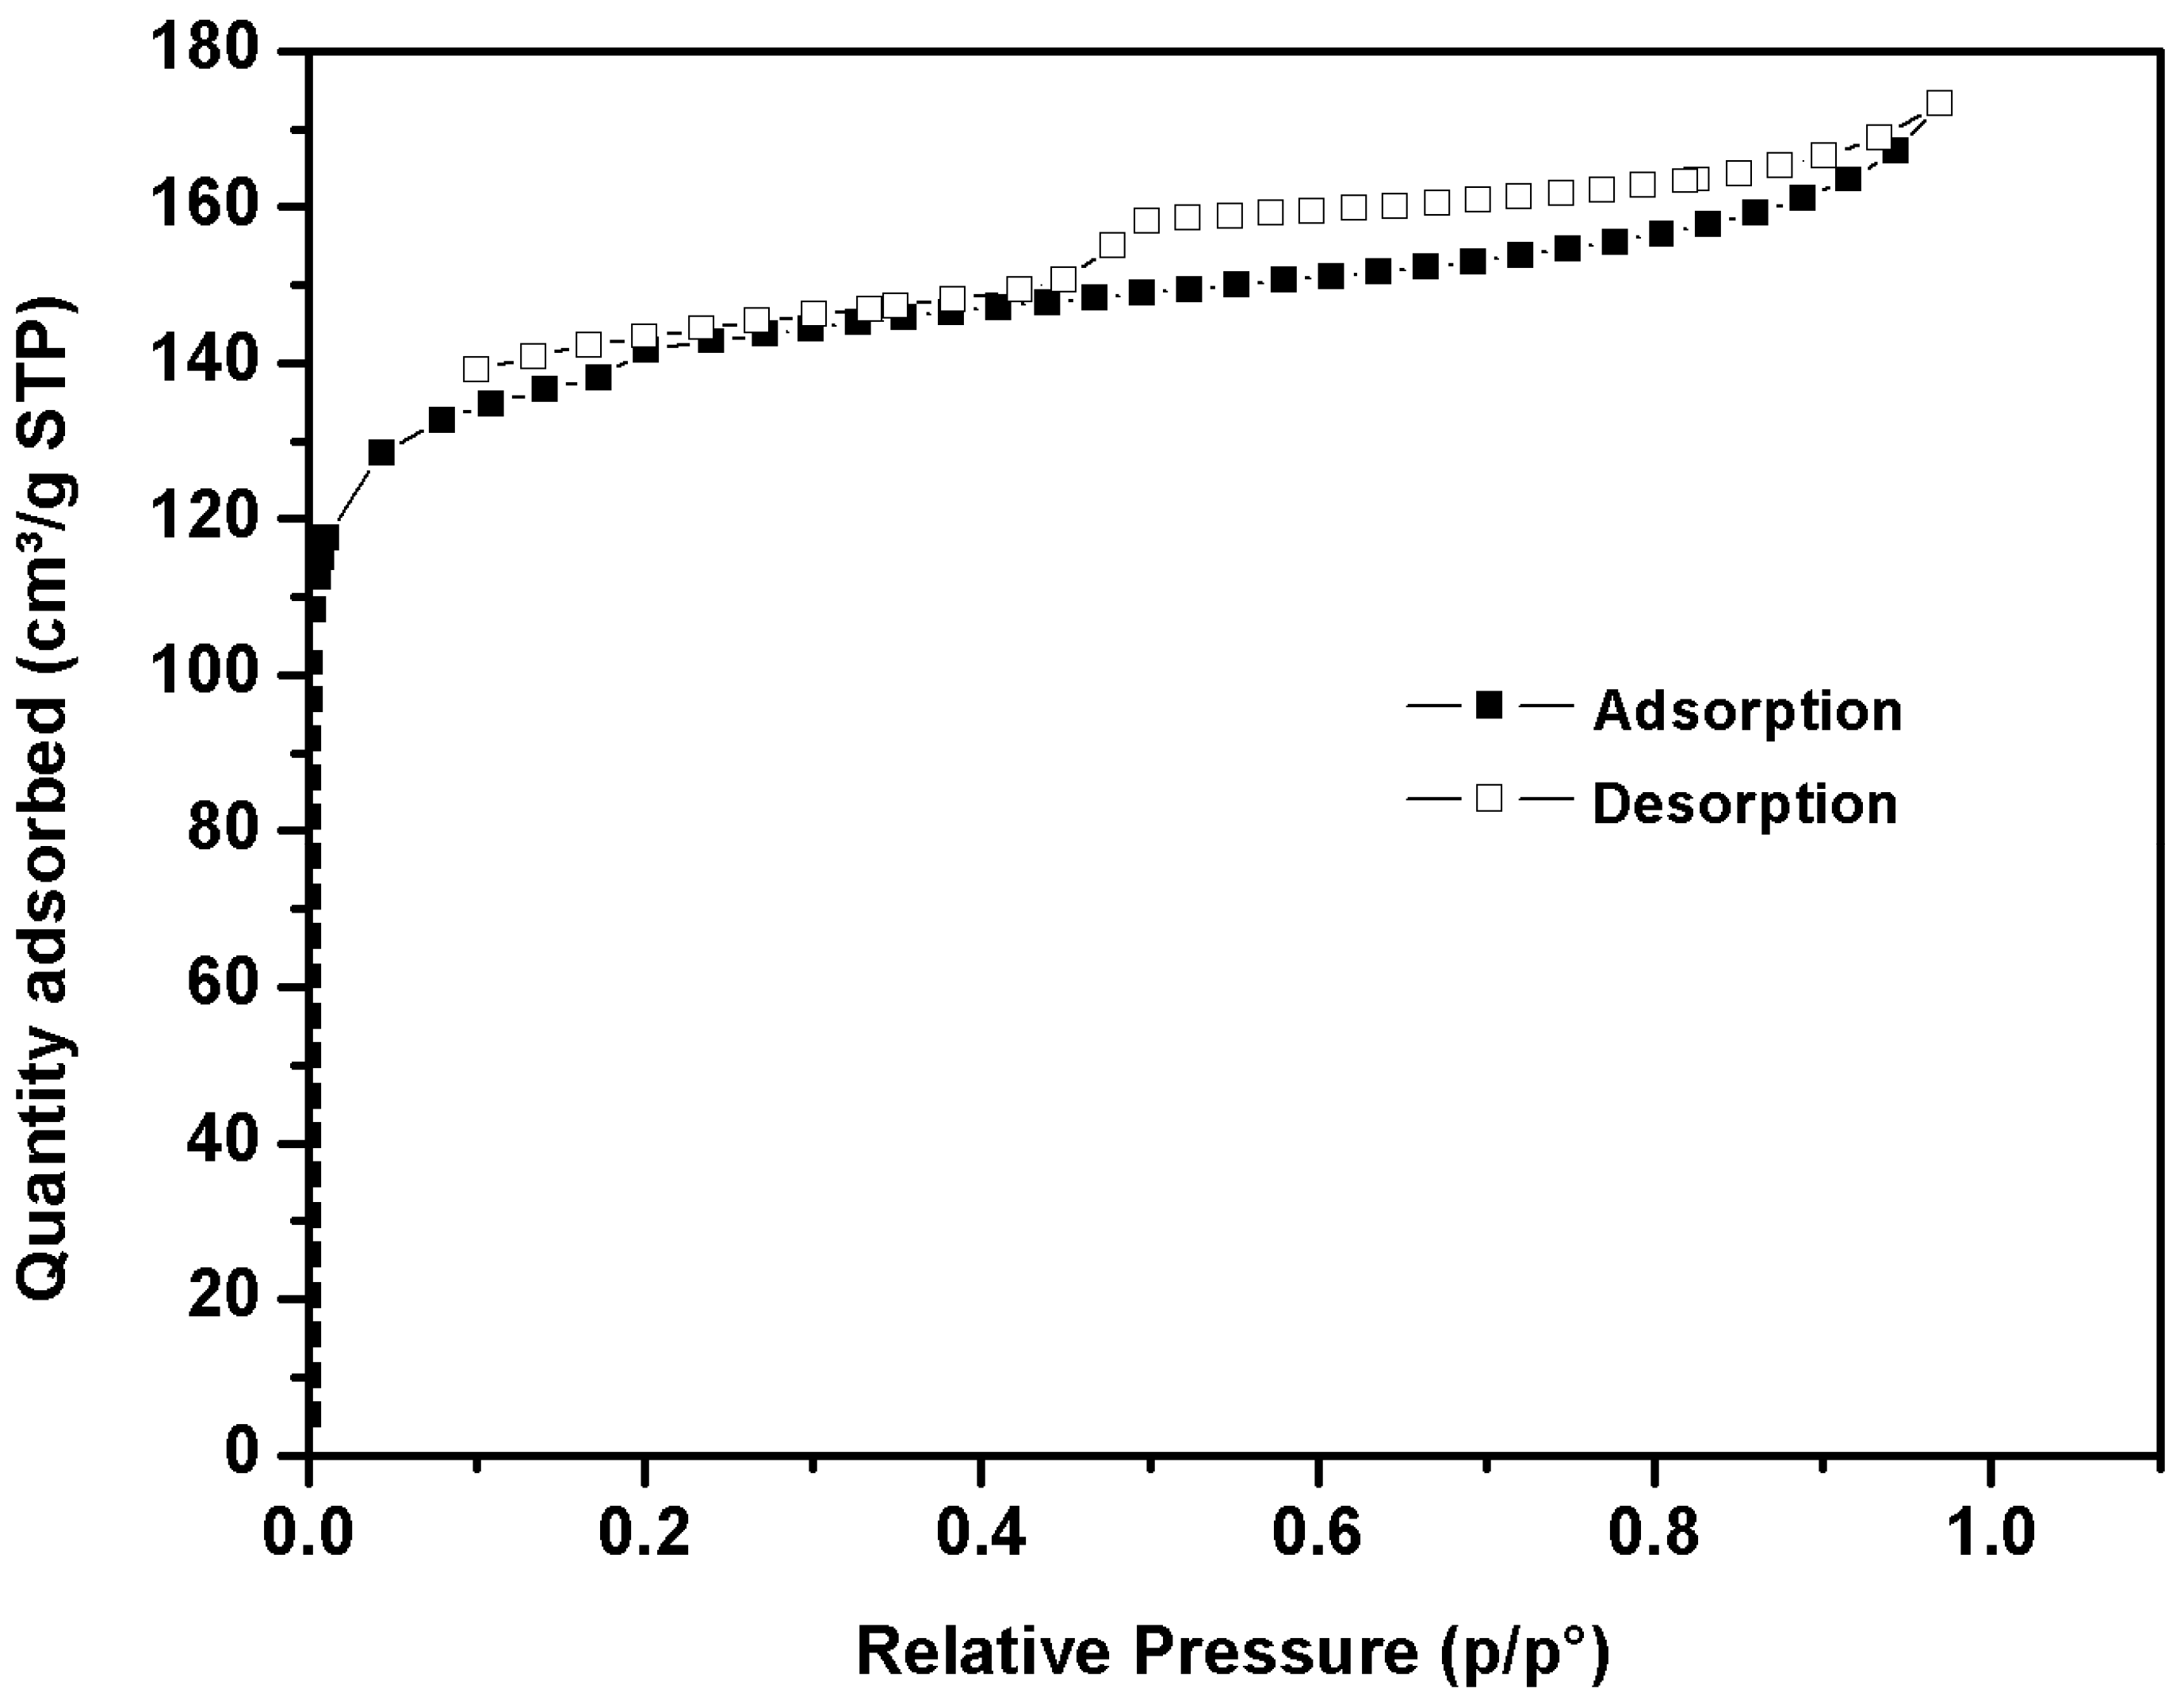
The N
2 adsorption/desorption isotherms at 77 K for activated carbon derived from date stone char are shown in
Figure 1.
The isotherm, at low relative pressure, indicates significant adsorption related to the microporous materials [
66]. Furthermore, the isotherm displays a weak hysteresis loop, indicating the presence of very small mesopore volume. The pH
pzc plays a crucial role in describing the surface behavior. The pH
pzc of activated carbon derived from date stone was 8.2 (
Table 5).
The surface chemistry of carbon adsorbents is characterized by two key criteria: surface acidity and surface basicity. Like that, the type and quantity of the surface functional groups have a significant impact on the surface characteristics of activated carbon.
Table 5 illustrates the acidic and the basic site concentration of DSAC; it seems that the total basic sites were dominant. Indeed, after carbonization between 400 and 500 °C, phenolic and carboxylic groups were excessively formed but decreased when the carbonization exceeded 600 °C and disappeared completely above 800 °C.
Raman spectroscopy is a useful tool to describe the molecular structure of carbon-based materials [
67]. Thus, it was used to characterize and identify the graphitic nature of DSAC.
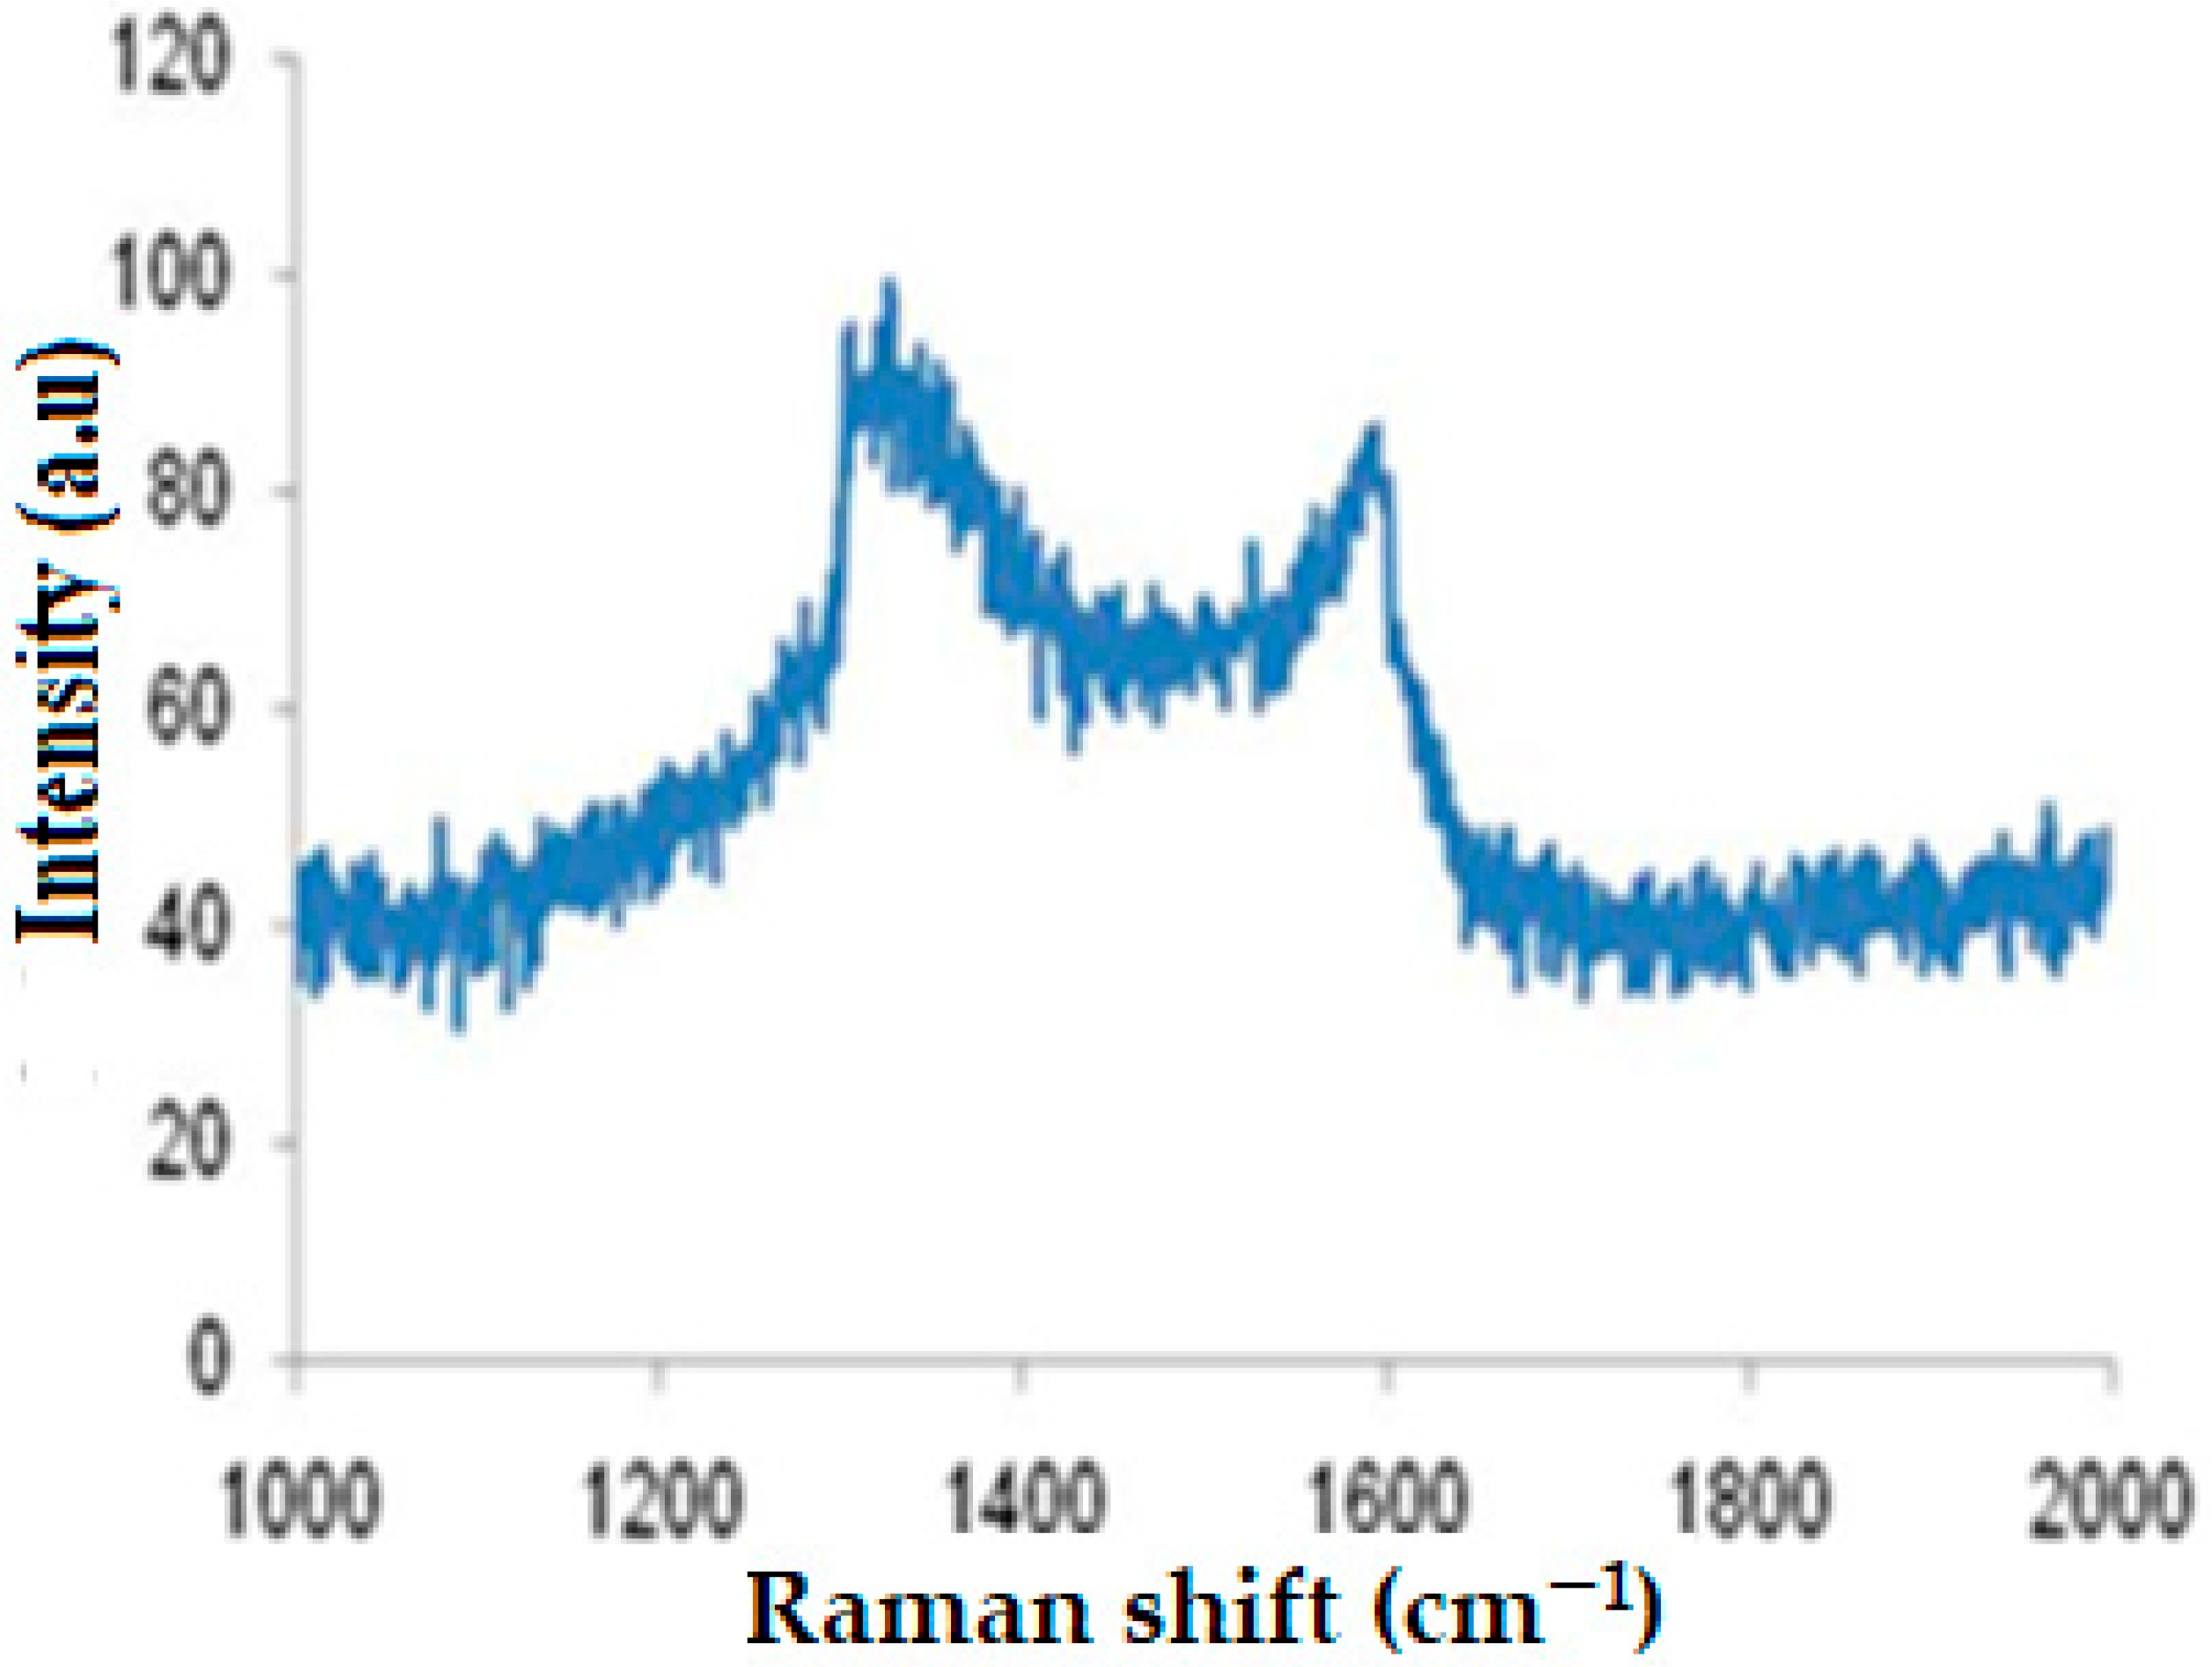
Figure 2 illustrates the Raman spectrum of DSAC sample.
This figure clearly shows the presence of two distinct peaks attributed to the activated carbons. The peak located at 1327 cm
−1 is responsible for D-band linked to the disordered carbon. Moreover, the peak at 1589 cm
−1 is characteristic of G-band, related to the graphitized carbon. In addition, the intensity ratio (R = I
D/I
G) of the D and G bands provides an overview of the carbon material structure [
68]. For DSAC composite, I
D/I
G = 1.14, indicating that the pores are too small (microporous), which confirms the BET observations.
3.2. Adsorption Test
Results related to the adsorption test are depected in the following
Figure 3 and
Figure 4.
- -
Effect of adsorbent dose
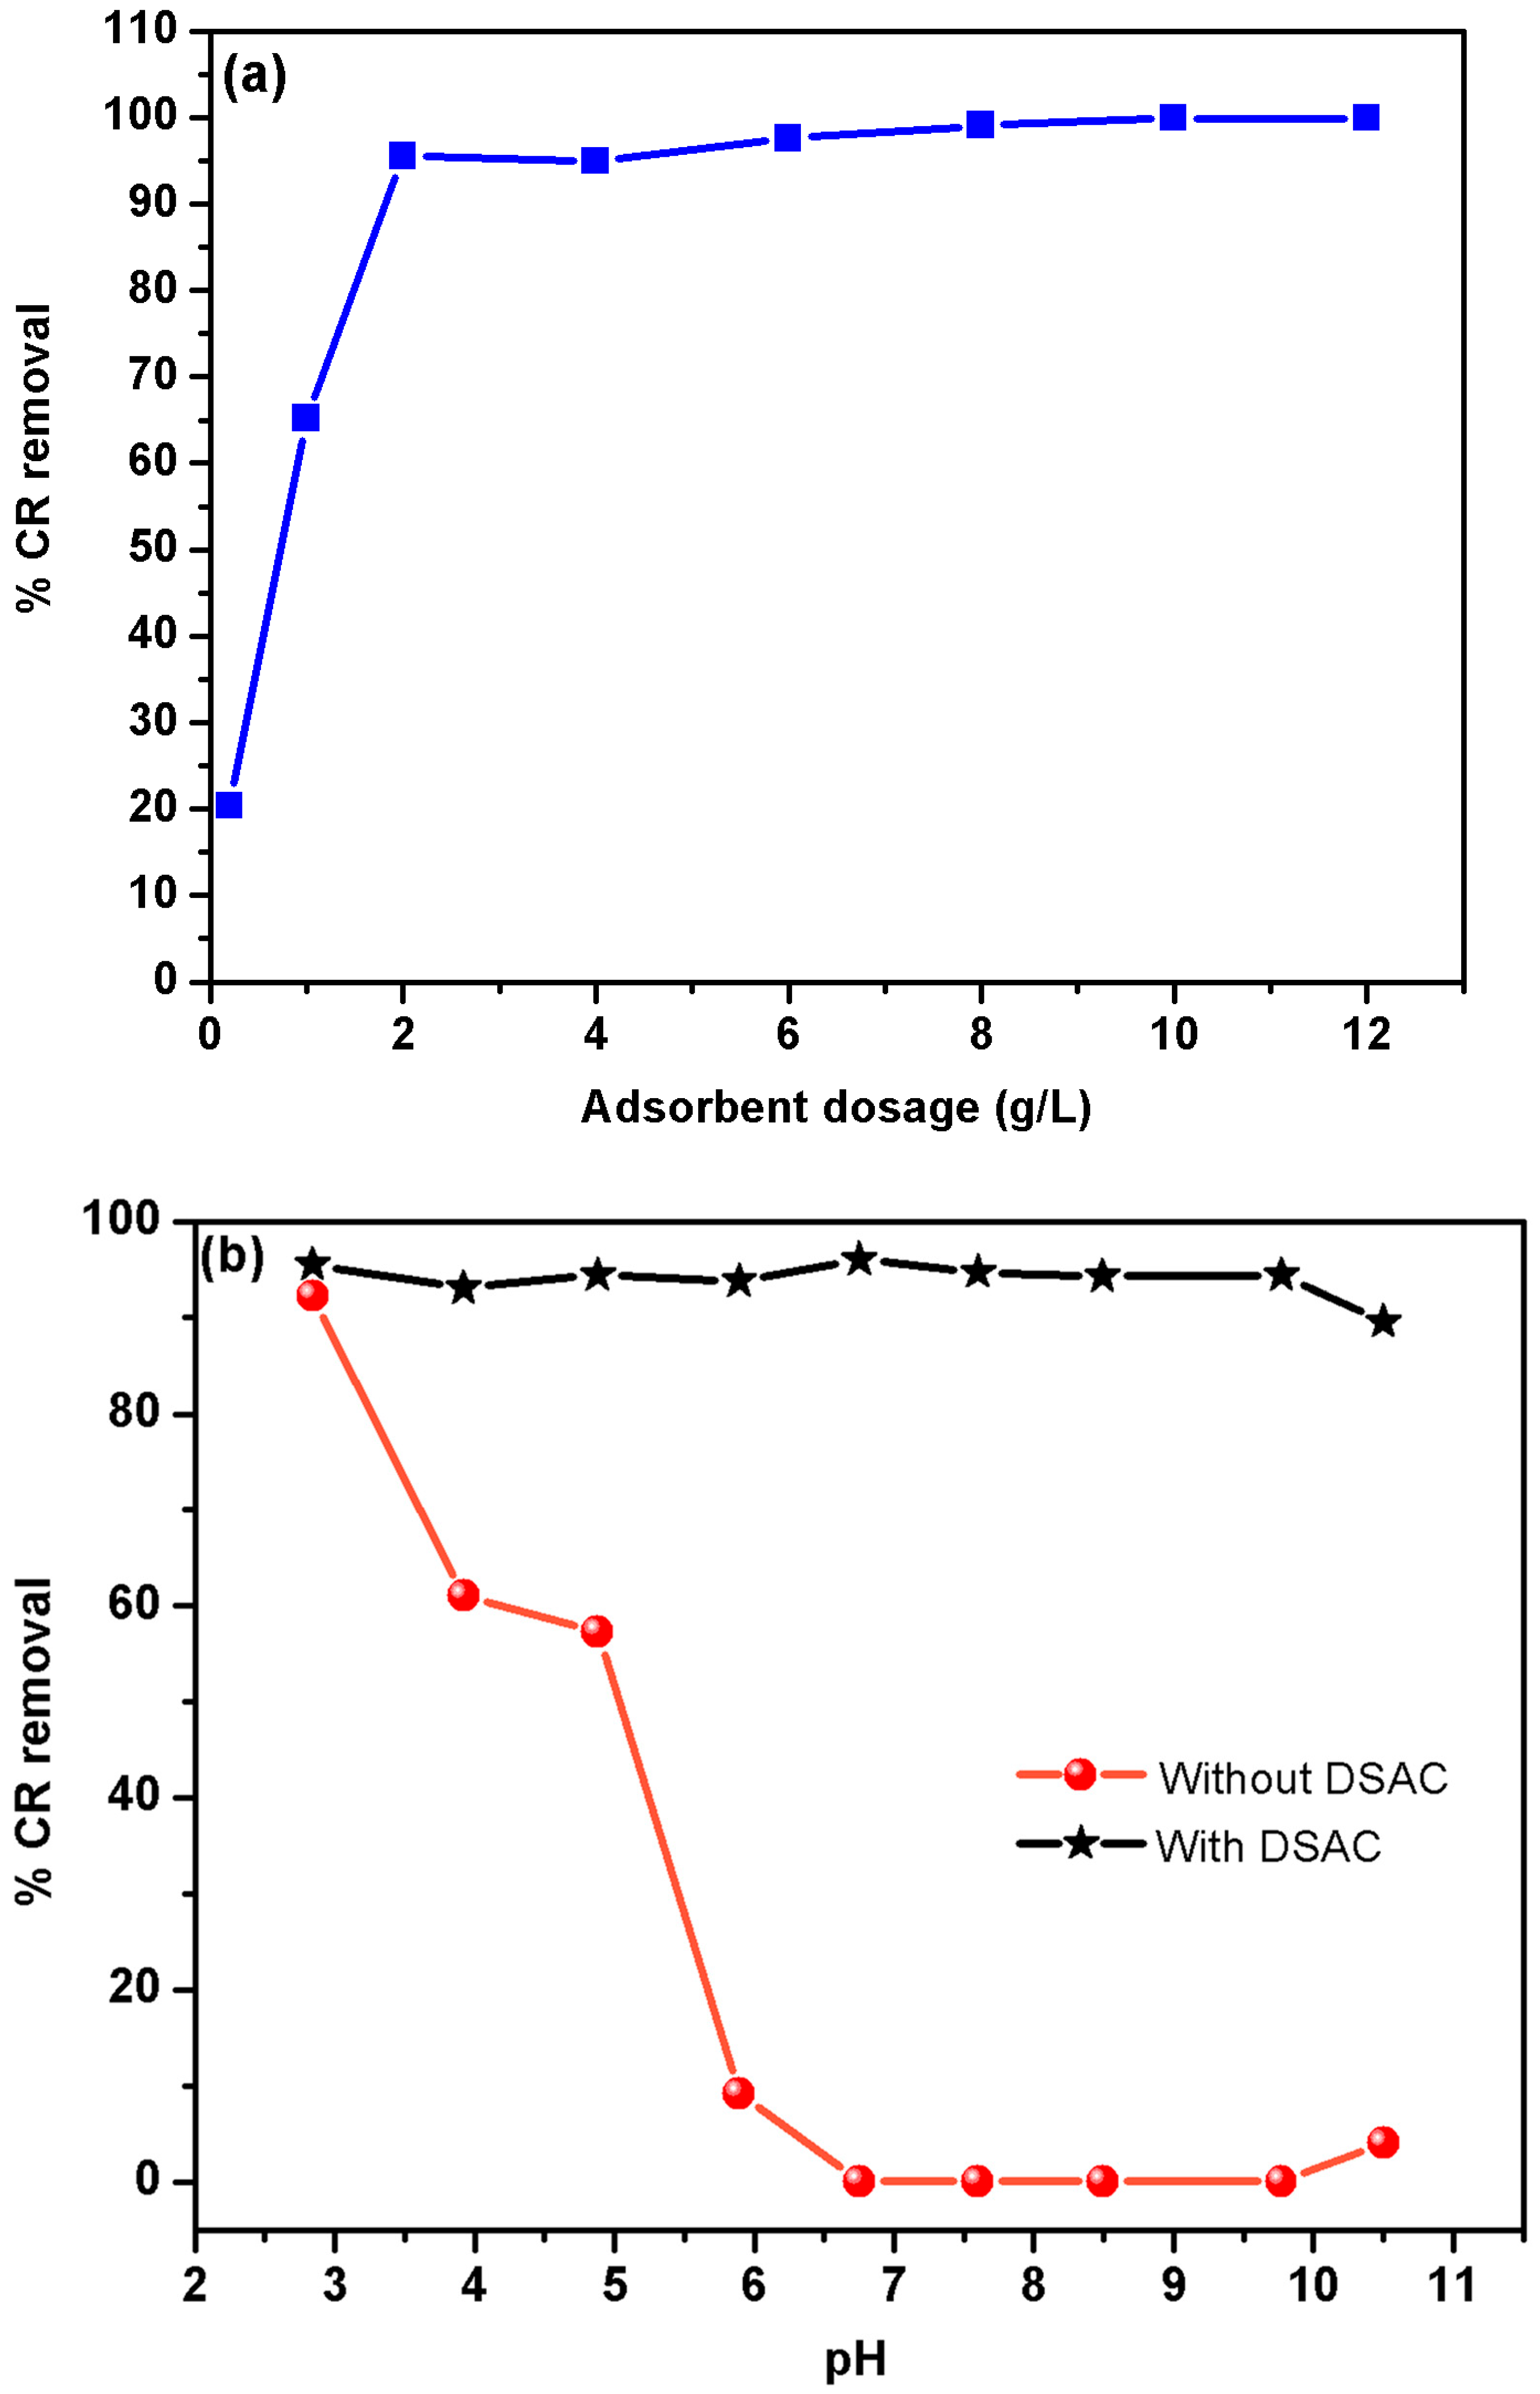
The study of the effect of the adsorbent concentration on CR dye removal was investigated over a range from 0.2 g L
−1 to 12 g L
−1, as shown in
Figure 3a. The result of this study demonstrates that the increase in the DSAC dosage led to a significant improvement in CR removal efficiency, from 20.3% at 0.2 g L
−1 to 99.8% at 12 g L
−1. Therefore, the increase in DSAC amount enhances the active sorption sites on the adsorbent surface [
69]. After the significant improvement in CR retention, the curve reaches a stable phase. This behavior can be attributed to the aggregation phenomenon of the adsorbent particles caused by the excess dose. Consequently, the effective surface area of the adsorbent was notably improved [
70]. Since the maximum practical efficiency was achieved at 2.0 g L
−1, this dosage was selected as the optimal and economically favorable condition for all subsequent experiments, including the factorial design analysis.
- -
Effect of pH solution
The pH value of the solution plays a crucial role in the adsorption of anionic dyes. In fact, the pH value influences the surface bonds of the activated carbon as well as the CR molecule. In addition, the color intensity as well as the structural stability of the CR dye is influenced by the pH value [
69]. It was observed that the CR dye solution exhibits color changes depending on the pH, both for acidic and basic solution. Depending on the pH, its structure can undergo protonation or deprotonation, which modifies its adsorption characteristics, and consequently, its color [
71,
72]. Therefore, the impact of initial pH value on blank CR dye solution was investigated at a concentration equal to 30 mg L
−1. Firstly, the adjusted pH solution was kept for 1 h to evaluate the stability of CR dye. The results show that the optimum pH is pH
0 = 6.8.
Figure 3b illustrates the effect of pH in the range [2.8–10.5] on CR removal in the presence and absence of DSAC adsorbent. This behavior indicates that the structure of CR was affected by the pH value of the solution [
73]. As a consequence, the % of dye degradation was very low. In addition,
Figure 3b shows that the adsorption of dye onto the new composite DSAC is independent of the pH value. More than 90% of CR dye was removed [
74]. This study involves a newcomer in the adsorbent family that particularly presents a very stable structure, which significantly removes the dye molecules for all ranges of pH.
- -
Effect of contact time
The effect of contact time on the CR removal using DSAC at C
0 = 20 mg L
−1 and 50 mg L
−1 was studied. The contact time curve shows a rapid adsorption of CR in the first 15 min followed by a gradually decrease and the adsorption reaches equilibrium (optimum contact time) (
Figure 3c). Adsorption equilibrium for CR was attained within 180 min, beyond which adsorption rates decreased significantly. The process exhibited two distinct kinetic phases. (i) An initial rapid phase, characterized by a sharp increase in adsorption capacity. This is attributed to the immediate occupancy of readily available sites on the adsorbent’s external surface. (ii) A subsequent slower phase, contributing minimally to the overall dye uptake. This stage reflects diffusion-controlled adsorption into the material’s internal pore structure [
75].
- -
Adsorption isotherm
To better understand the type of interaction between the adsorbent and adsorbate, the adsorption isotherm investigation has been carried out. Isotherm models were used to characterize the relationship between equilibrium adsorption capacity (
qe) and equilibrium dye concentration (
Ce) under the experimental conditions (concentration range 2–110 mg L
−1, adsorbent dose 2 g L
−1, temperature 25 ± 1 °C, contact time 3 h and stirring speed 220 rpm).
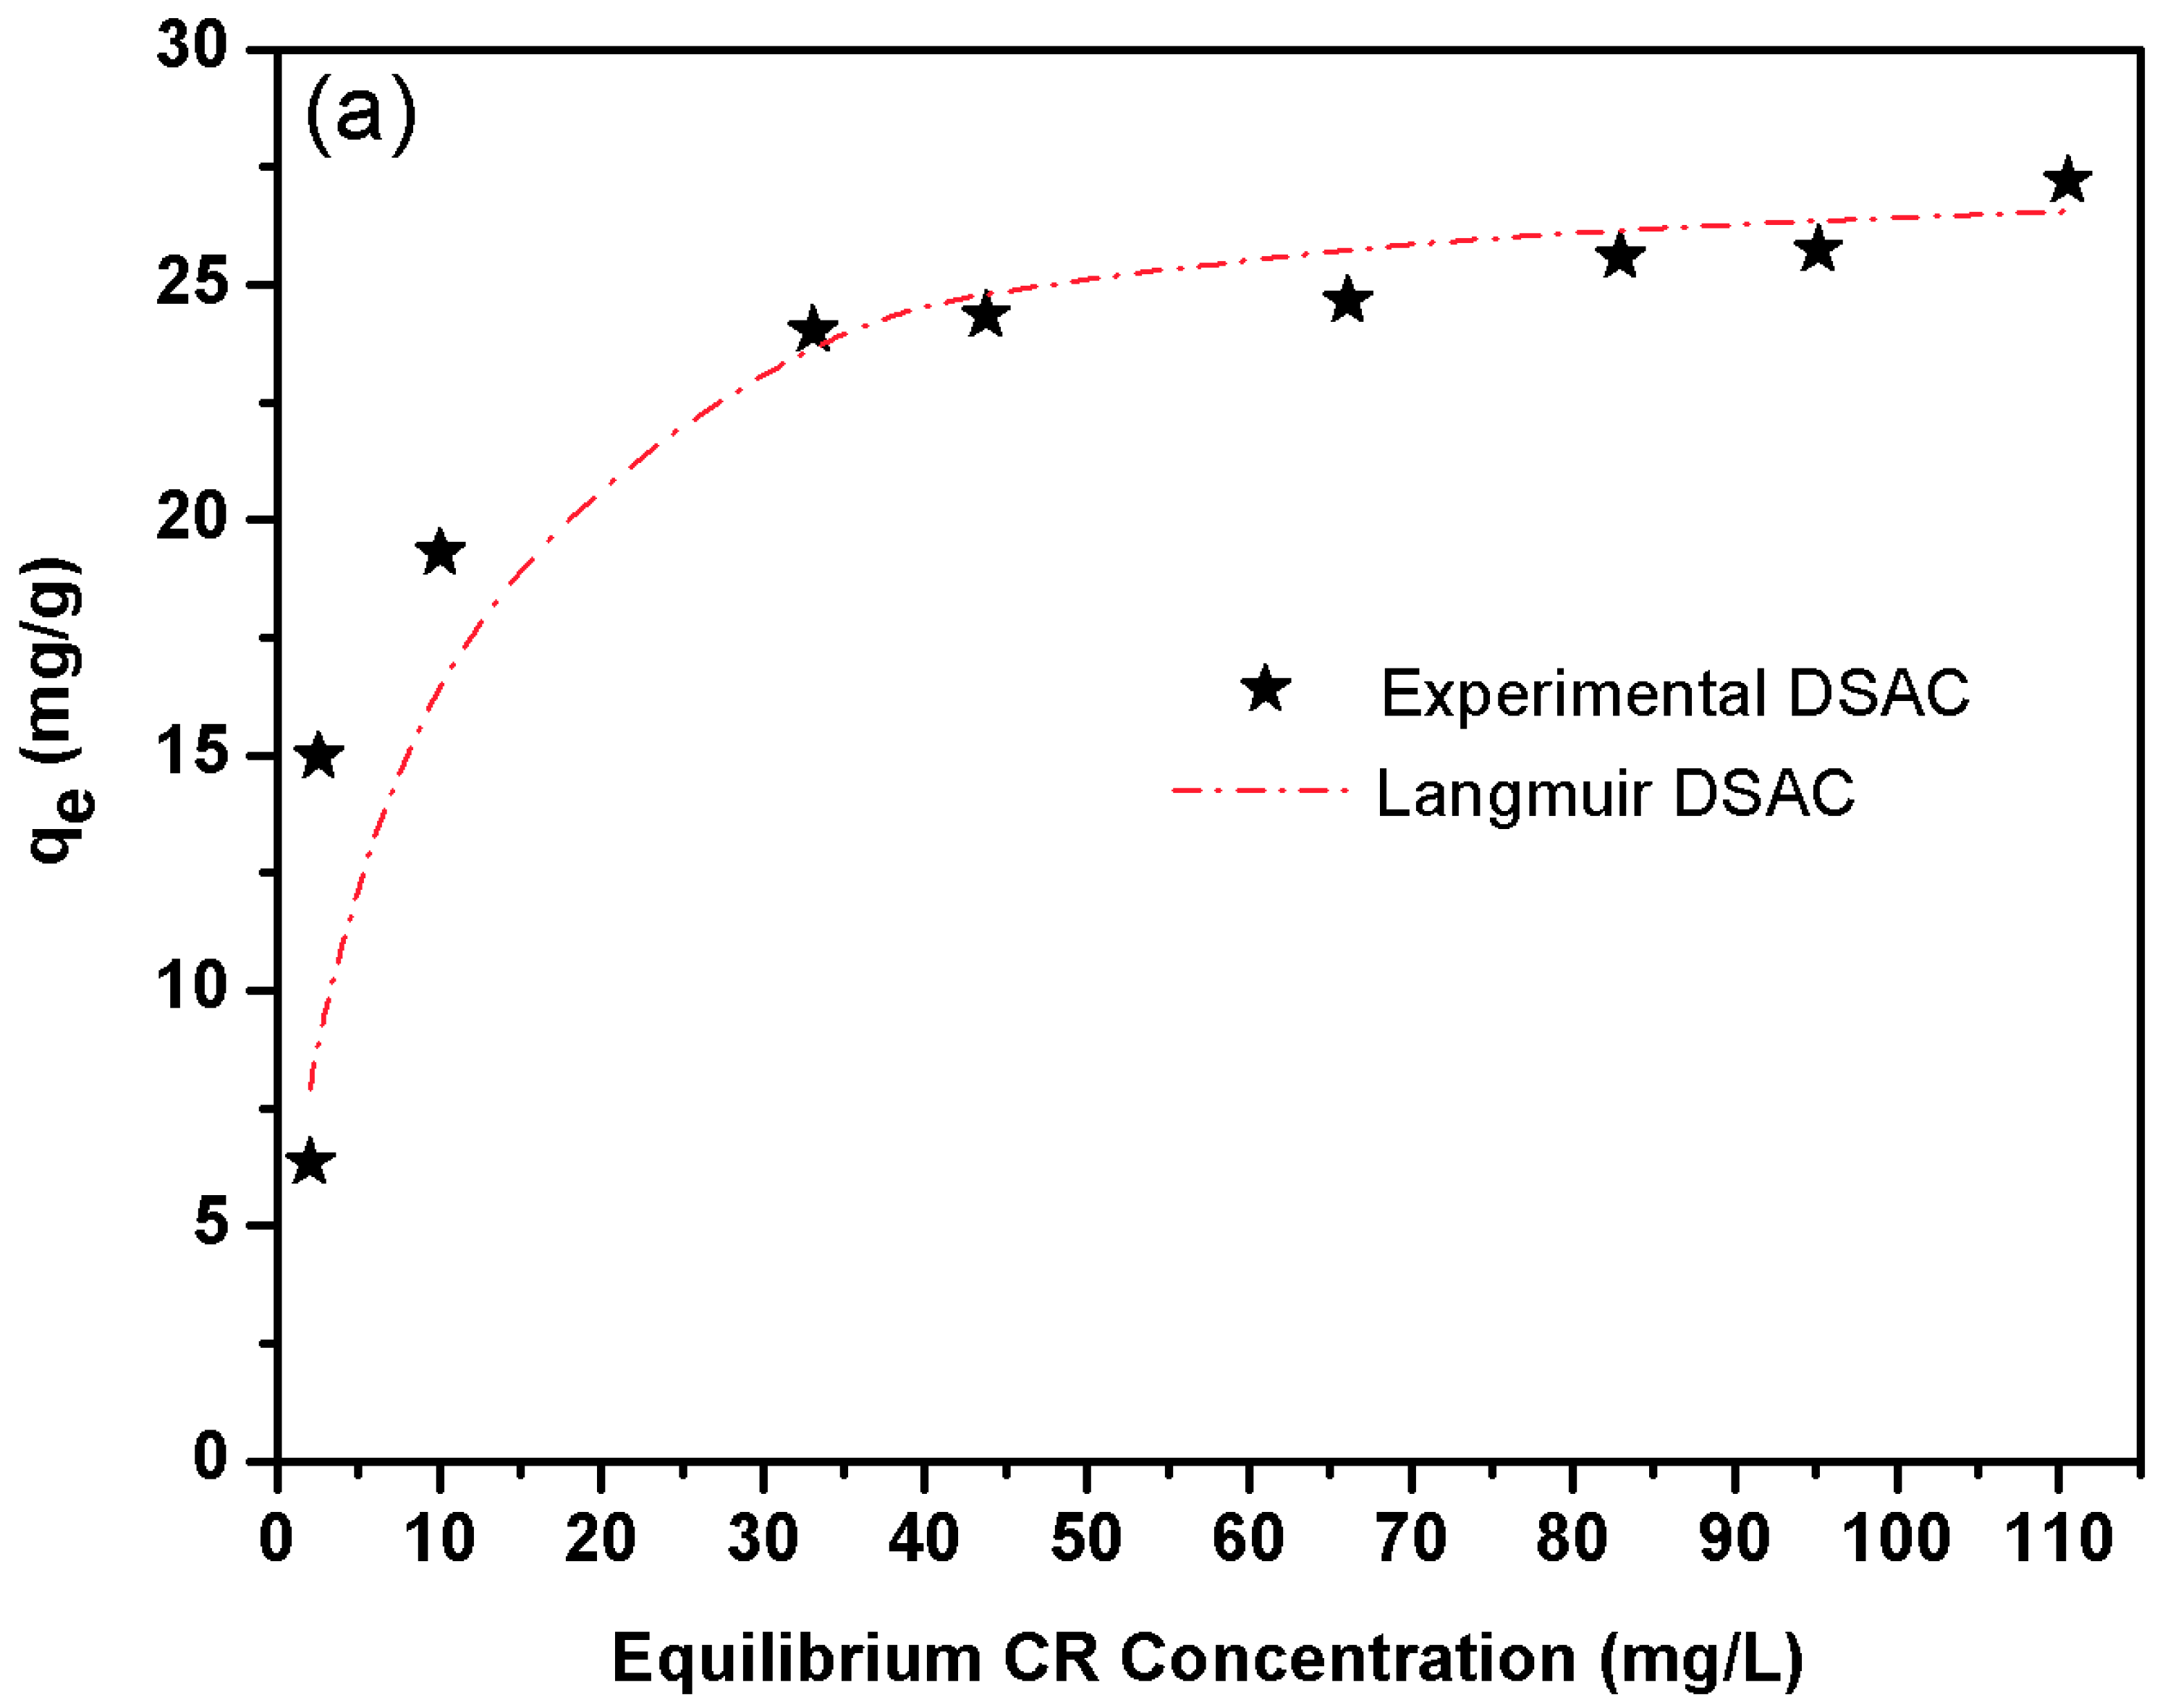
Figure 4a displays the DSAC isotherm profiles for CR. The experimental data demonstrate a strong correlation with the Langmuir isotherm model, suggesting monolayer adsorption onto a homogeneous surface. Notably, this behavior contrasts with literature reports emphasizing mesopore-dominated adsorption mechanisms [
76]. This study explicitly confirms that the adsorbent’s active sites are primarily microporous rather than mesoporous. The microporous structure effectively restricts the leaching of chemical residues, thereby mitigating potential environmental contamination risks. Furthermore, the retention percentage, found to be equal to 94%, can be attributed to the optimized microporous architecture, which enhances dye capture and stability within the adsorbent matrix.
The Langmuir model assumes monolayer adsorption occurs on a homogeneous surface where all sites are energetically equivalent and exhibit no intermolecular interactions. This applies to systems with saturable, single-layer coverage. The Langmuir isotherm model for non-linear form [
77] is determined as follows:
where
Ce: the equilibrium concentration of dye molecules adsorbed (mg L
−1);
qe: the concentration of dye molecules adsorbed (mg g
−1);
qm and
b: the monolayer adsorption capacity and the affinity of the adsorbent towards the adsorbate, respectively, exhibiting the Langmuir constants. The curve of
qe vs.
Ce illustrates a fitted curve, and from
Table 6, the Langmuir constants were produced from the plot of sorption data. Furthermore, a
RL value between 0 and 1 (0 <
RL < 1) confirms a favorable adsorption process for CR dye molecules.
The
RL factor is given by the following equation [
78]:
where
b presents the Langmuir constant, and
C0 is the initial dye concentration (mg L
−1).
The Freundlich equation is an empirically derived mathematical model used to characterize adsorption phenomena, particularly for heterogeneous surfaces. The non-linear form is designated [
79] by:
where
qe: the adsorbed amounts at equilibrium (mg g
−1);
Ce: the equilibrium concentration of the adsorbate (mg L
−1);
KF and
n present the Freundlich equilibrium coefficients,
n provides information about the adsorption process efficiency, and
KF displays the adsorption ability of the adsorbate. The poor curves plotted by
qe against
Ce confirms that the adsorption process does not support the model. The
KF and
n values, as Freundlich equilibrium coefficients, were engendered from the plot of sorption data illustrated in
Table 6. Moreover, the parameter 1/
n with a value ranging between 0 and 1 specified the adsorption intensity or surface heterogeneity.
Temkin’s model allows for the determination of thermodynamic conditions related to the adsorption process. It assumes a linear decrease in the heat of adsorption as a function of the adsorption capacity. The following equation illustrates the Temkin model [
80]:
where
B: the head of adsorption;
qe: the experimental adsorption capacity (mg g
−1); and
Ce: the adsorbed dye concentration at equilibrium (mg L
−1).
where 1/
bT: the adsorption potential of the adsorbent,
R: the universal gas constant (8.314 kJ mol
−1) and
T: the temperature degree in Kelvin (K).
The decrease in the adsorption energy is confirmed by the plot of
qe against
Ce, which indicates a linearity when the adsorption sites are filled. Due to the interaction between adsorbent and adsorbate, the surface coverage increases, leading to the linear decreases in heat adsorption of all molecules in the layer. In addition, it can be assumed that the adsorption process is described by uniform distribution of binding energies up to a maximum value. The parameter data of the Temkin model are illustrated in
Table 6.
The Dubinin–Radushkevich (D-R) model [
81] is applied to estimate the porosity nature and the free energy appearance of the adsorption.
In addition, the D-R model serves to investigate the adsorption process types (physical or chemical). Furthermore, D-R sorption is more general than the Langmuir isotherm since it does not assume a homogenous surface or constant sorption potential. The non-linear isotherm equation of the D-R is as follows:
where
qe: the dye molecule concentration (mg L
−1),
qm: the maximum adsorption capacity (mg g
−1),
β: the activity coefficient related to adsorption mean free energy mol
2 j
−2 and
ε is the Polanyi potential stated by:
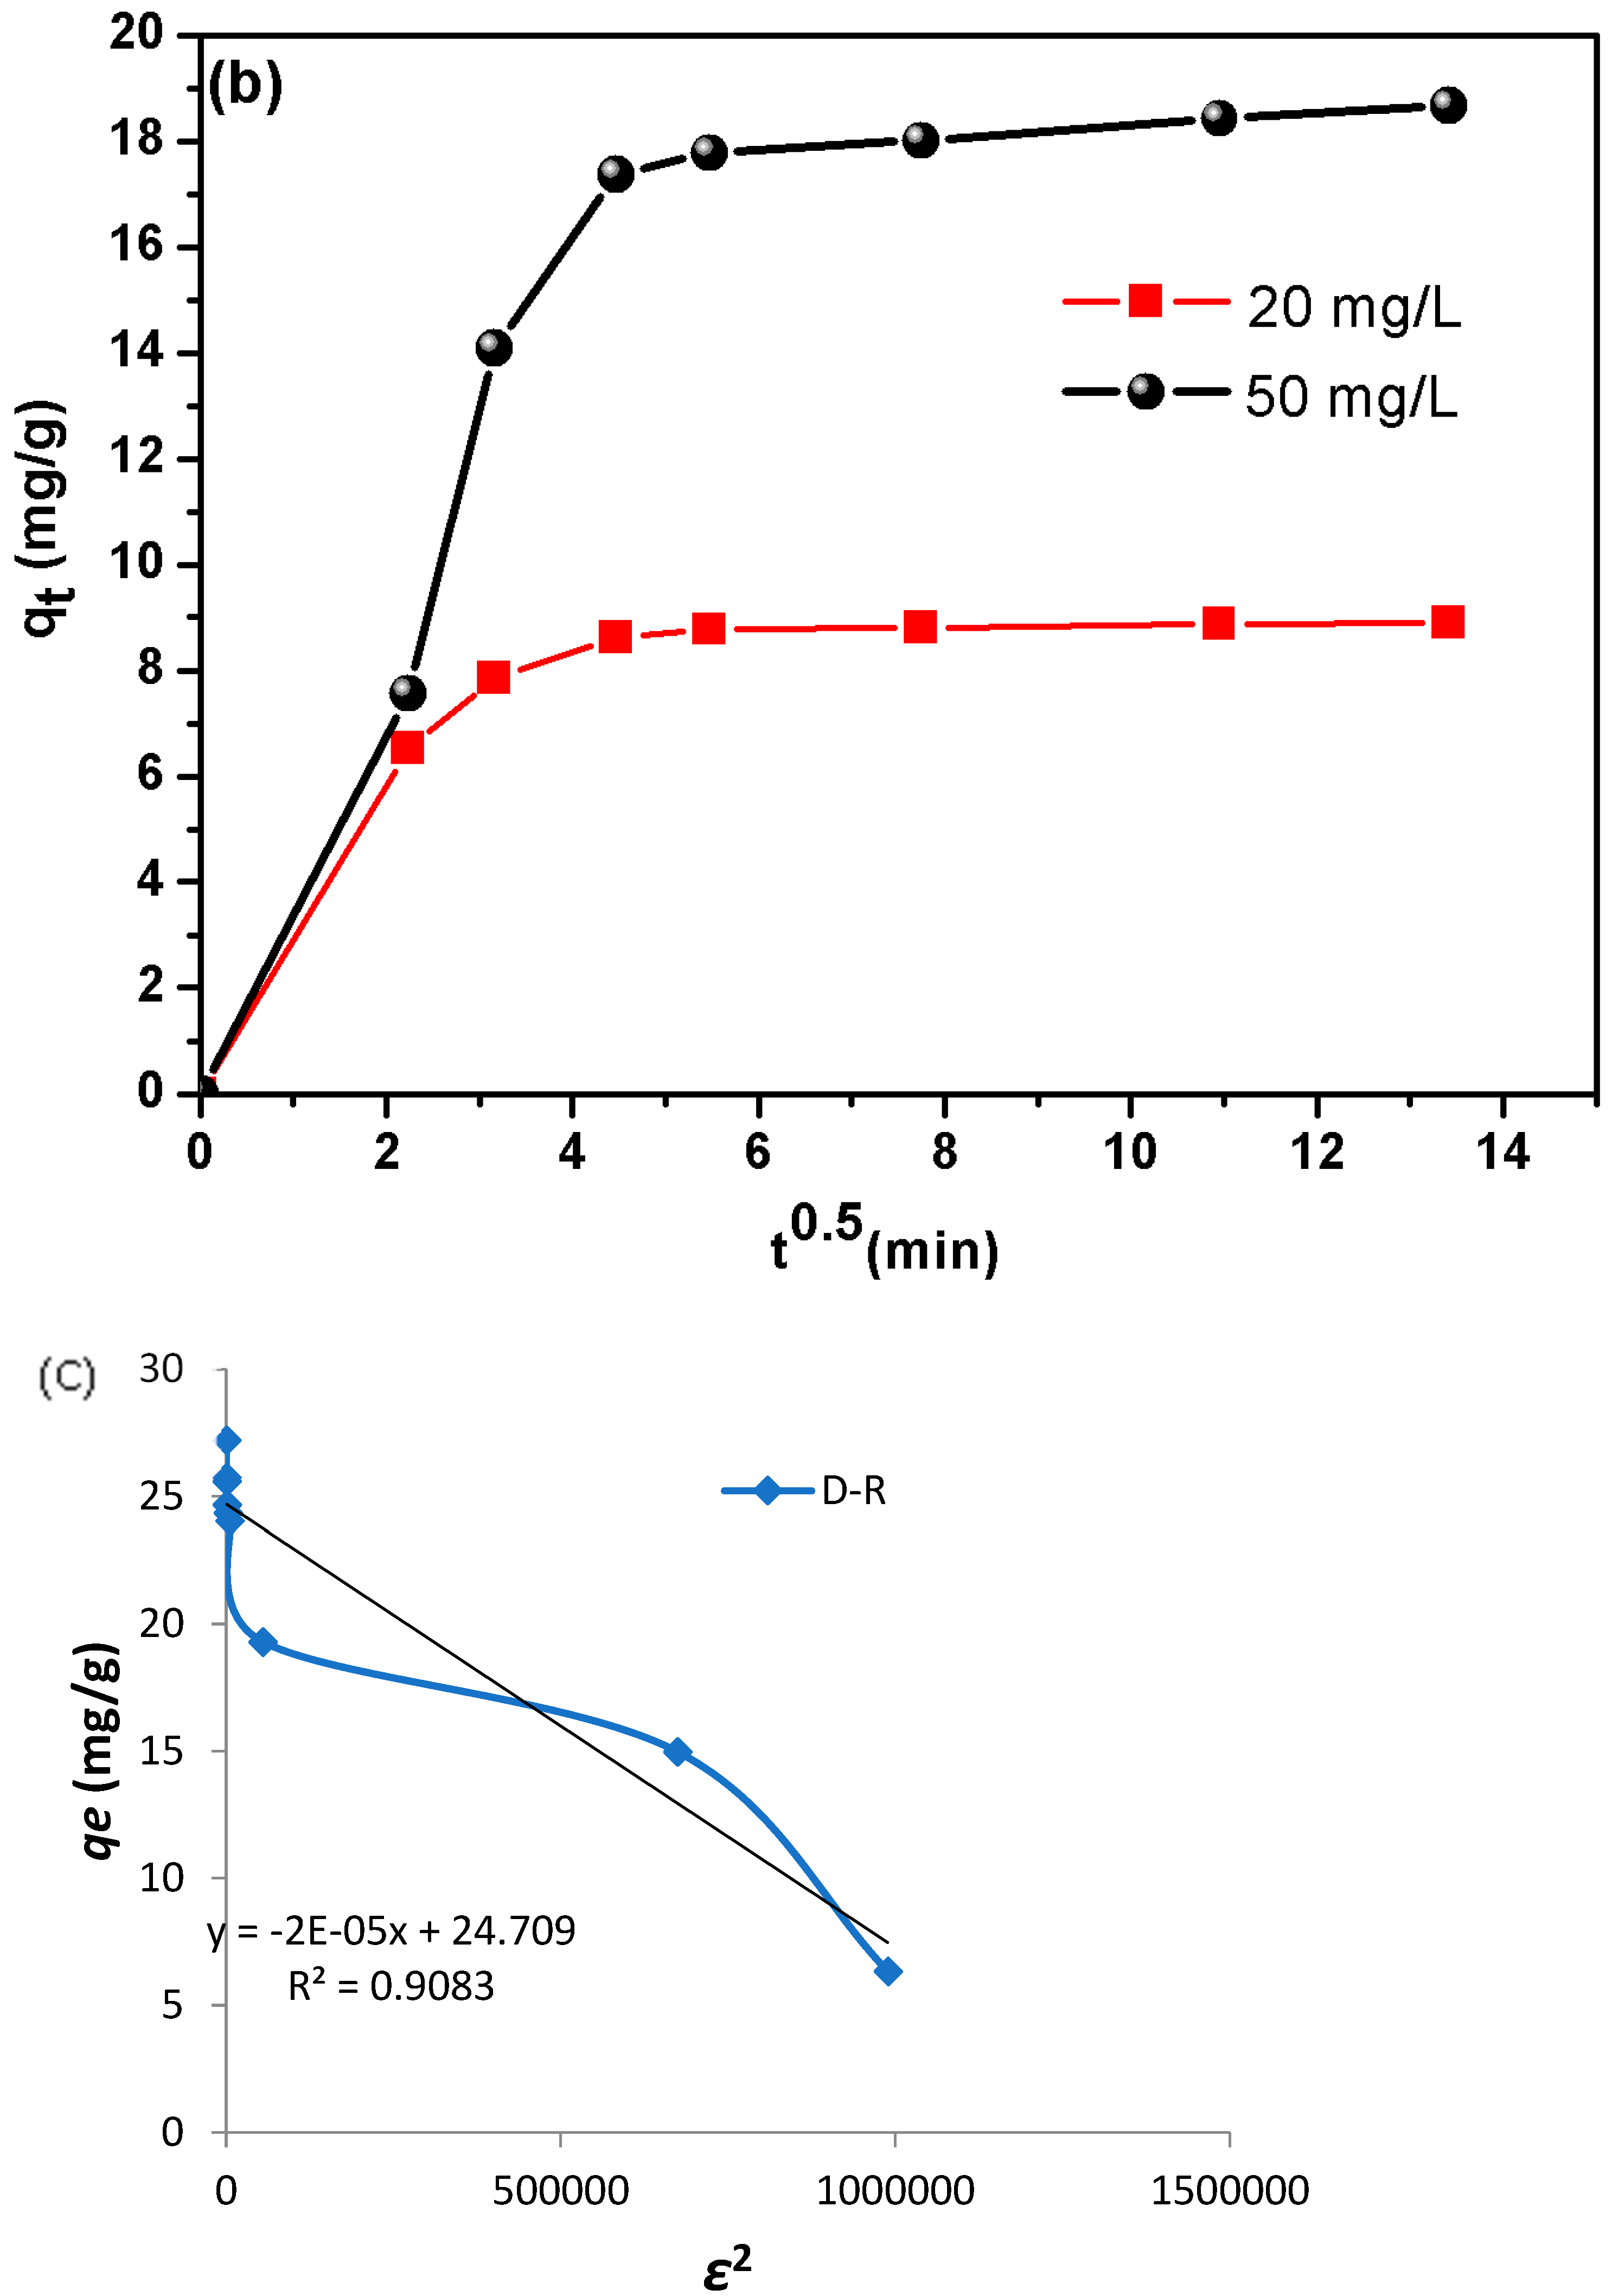
As the plot of
qe vs. ε
2 presents nonlinear graphs (
Figure 4c), the adsorption mean free energy E (kJ mol
−1) is given as:
A literature review highlights that the mean free energy (
E) derived from the D-R model serves as a critical indicator of the adsorption mechanism’s nature. Specifically, an
E value between 8 and 16 kJ mol
−1 suggests a chemically driven process, such as ion-exchange interactions, whereas values below 8 kJ mol
−1 signify physical adsorption (e.g., van der Waals forces or hydrogen bonding) [
82]. This distinction underscores the utility of
E in elucidating whether adsorbent–adsorbate interactions are governed by chemical bonding or weaker physical forces.
Indeed, the four model parameters are illustrated in
Table 6. So, it seems that Langmuir isotherm provides a good model for the sorption system deduced by comparing the correlation coefficient. In fact, we know that the Langmuir model is based on monolayer sorption on a surface made up of a finite number of identical sorption sites. It is worth mentioning that the maximum value capacity adsorption of DSAC for CR is 27.77 mg g
−1 at 25 °C.
Table 7 presents a comparative study of DSAC versus other biosorbents used to remove CR [
5,
83,
84,
85,
86]. Under optimal conditions (maximum adsorption), the DSAC product showed superior adsorption performance compared to all other materials evaluated in
Table 7. This high efficiency, combined with the abundance of raw material in the form of residual biomass and a simple preparation protocol, gives our product an importance and efficiency in industrial applications. Collectively, these findings position DSAC as a highly promising adsorbent for scalable CR remediation.
According to the literature survey, it is commonly recognized that AC can adsorb dyes within electrostatic, van der Waals as well as H-bonding interactions. The adsorption capacity of different adsorbents for Congo red (CR) dye depends on several interrelated factors. These include (1) the surface area and total pore volume of the adsorbent, which vary depending on the material composition; (2) the prevalence of mesopores over micropores, as mesoporous structures are more accessible to larger dye molecules; (3) experimental parameters such as pH, initial dye concentration, and contact time, which influence adsorption kinetics and equilibrium; and (4) the molecular size of Congo red relative to the adsorbent’s pore structure, which determines physical compatibility and diffusion efficiency. Collectively, these factors govern the adsorption performance, with mesopore availability and molecular size matching playing particularly critical roles in CR removal.
According to the experimental results, we conclude that date stone activated carbon could be a potential material to remove CR dye from polluted solution.
Furthermore, the RL values indicate that the adsorption is suitable (0 < RL < 1). In the case of synthesized DSAC composite, the RL values are between 0.256 and 0.029 for all concentrations studied. Furthermore, the mean free energy of adsorption (E) derived from the Dubinin–Radushkevich (D-R) isotherm was less than 8 kJ mol−1, confirming a physically driven adsorption process (physisorption).
These results align with the work of Alharbi et al. (2022), who systematically evaluated activation methods for producing activated carbon from date palm residues (DPRs) [
87]. Their study shows that DPR-derived activated carbon achieves comparable efficiency to commercial activated carbon in adsorbing textile dyes, validating its role as a good ecological and economical alternative for industrial wastewater treatment. All this evidence proved the high potential of DSAC-based materials in sustainable dye removal applications.
- -
Adsorption kinetics study
The study of adsorption kinetics is essential for characterizing the time dependence of the process, using models (such as pseudo-first-order, pseudo-second-order, and intraparticle diffusion) to elucidate the underlying mechanisms, rate-limiting steps, and surface interactions. These models allow for tracking the evolution of adsorption over time.
Table 8 compares the rate constants derived from the pseudo-first-order, pseudo-second-order, and intra-particle diffusion models under varying initial dye concentrations. Kinetic analysis of CR adsorption onto DSAC is essential for optimizing operating parameters in scaled-up batch processes.
Adsorption process scalability and rate behavior are modeled using experimental kinetic parameters for optimized system design. Thus, three kinetic models, intraparticle diffusion, pseudo-first-order (PFO) and pseudo-second-order (PSO), were used to examine the CR adsorption onto DSAC.
The pseudo-first-order kinetic model from Lagergren related to the adsorption of solid/liquid systems is illustrated in the following formula [
88]:
where
qt (mg g
−1) and
qe (mg g
−1) represent the adsorbed dye concentration at the time
t (min) and at the equilibrium time, respectively.
k1 (1/min) represents the constant rate of the pseudo-first-order adsorption, which is obtained from the log (
qe −
qt) against
t plot. Despite that,
Table 8 reveals significant deviations of
qe values, demonstrating that the pseudo-first-order kinetic model is inappropriate for DSAC-CR adsorption systems.
The pseudo-second-order kinetic model with linear form is represented as [
89]:
where
k2 (mg min)
−1 is the rate constant of the pseudo-second-order adsorption, obtained from linear plots of
t/
qt against
t. The experimental and calculated
qe values exhibit close agreement.
Table 8 shows consistently higher R
2 values for pseudo-second-order kinetics, indicating its stronger correlation with experimental adsorption data.
To assess pore diffusion’s role in Congo red (CR) adsorption on DSAC, kinetic data was modeled using the intra-particle diffusion equation [
90]:
where
qt is adsorption capacity (mg g
−1) at time
t,
kid is the diffusion rate constant (mg g
−1·min
−1/2), and
C (mg g
−1) represents boundary layer thickness (
Figure 4b).
If C = 0, intra-particle diffusion acts as the sole rate-controlling step in the adsorption process. The increase in the value of C confirms that there is a greater contribution from the phenomenon of surface adsorption. Although the curves representing the kinetic studies deviate from linearity during the experiment, they can be divided into two or three distinct linear phases, suggesting multiple stages in the adsorption mechanism. The high regression coefficients (R2 = 0.9) across these phases further confirm that intra-particle diffusion plays a dominant role during the Congo red (CR) adsorption phenomenon on the DSAC composite, whereas the plot line does not pass through the origin, which confirms the presence of other steps controlling the adsorption process alongside the intra-particle diffusion.
- -
Thermodynamic parameters
In order to further investigate the adsorption phenomena in our study, the variation of thermodynamic parameters, such as the change in Gibbs free energy (∆
G0), entropy (∆
S0) and enthalpy (∆
H0), was studied. Therefore, an investigation of temperature dependence for the adsorption process gives, undoubtedly, knowledge on whether the reaction is spontaneous or not. The thermodynamics of the adsorption reaction towards spontaneity can be evaluated. We point out that, using the following equations, parameters were calculated.
where
R constitutes the universal gas constant (8.314 kJ. mol
−1),
T represents the absolute temperature (
K) and
K0 is the distribution coefficient equal to
qe/
Ce. The plot of
LnK0 against 1/
T illustrates straight-line form, in which ∆
H0 and ∆
S0 were obtained from the slope and intercept, respectively.
Table 9 recapitulates the thermodynamic parameters obtained from different temperatures.
The negative values of Δ
G0 prove that the adsorption process was established spontaneously. It is worth noting that Δ
G0 values for physisorption ranged from −20 to 0 kJ mol
−1, while that of chemisorption are between −80 and −400 kJ mol
−1 [
91]. For the DSAC composite, the Δ
G0 values ranging from −5.64 to −5.38 kJ·mol
−1 indicate adsorption stronger than typical physisorption. The negative Δ
H0 value of −8.23 kJ mol
−1 confirms the exothermic nature of this process. Comparing the magnitude of this Δ
H0 to characteristic adsorption energies—van der Waals forces (4–10 kJ mol
−1), hydrophobic interactions (~5 kJ·mol
−1), coordination exchange (~40 kJ mol
−1), and chemical bonds (>60 kJ mol
−1)—suggests that van der Waals forces and hydrophobic interactions likely contribute alongside electrostatic attraction. Furthermore, the negative value of Δ
S0 indicates a decrease in randomness at the solid/solution interface [
92].
- -
Proposed adsorption mechanism
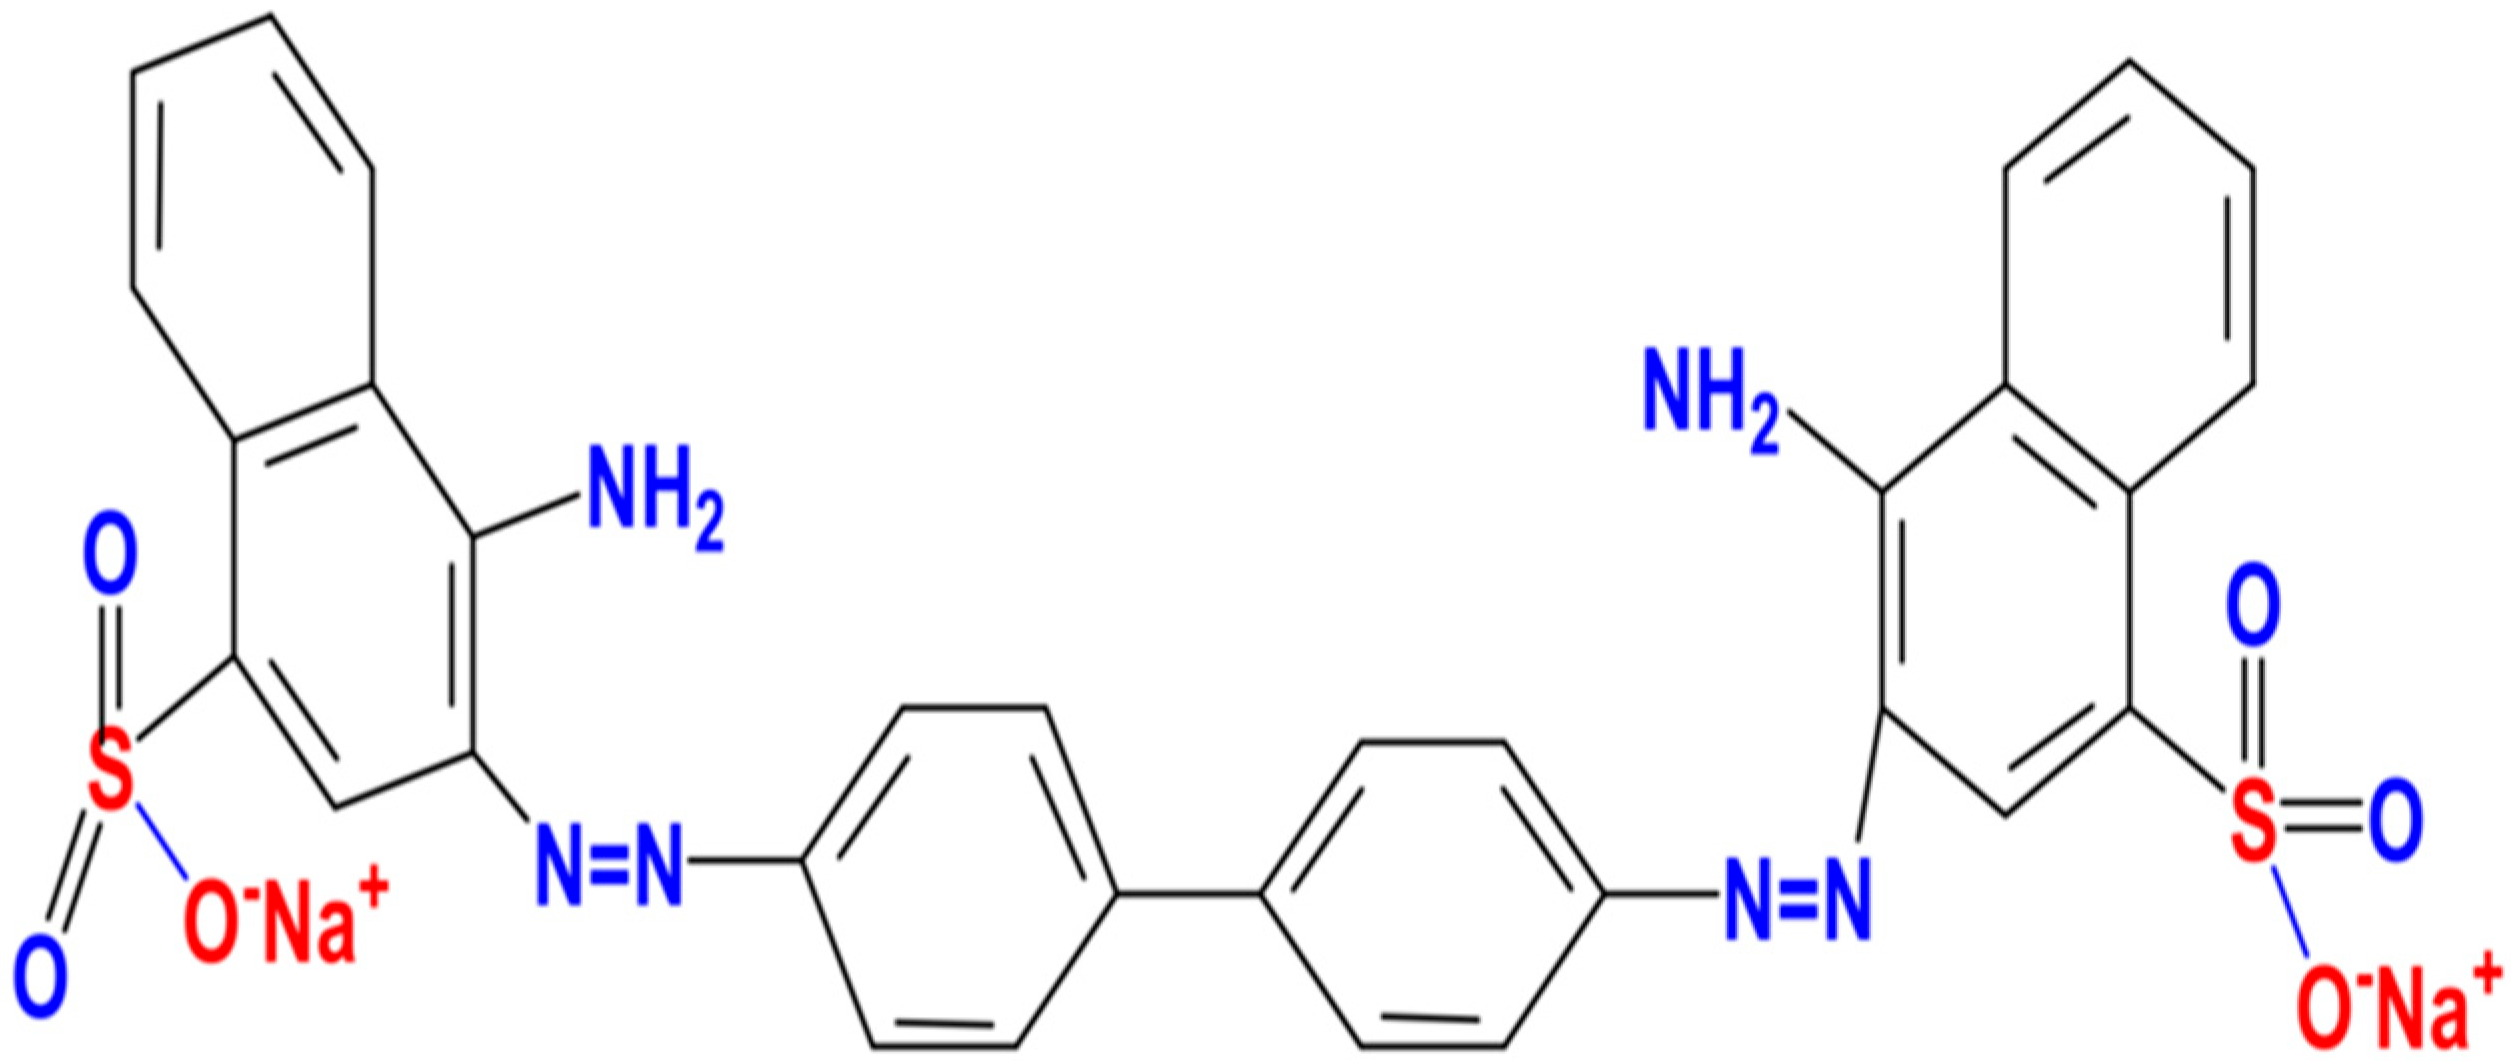
The adsorption mechanism of CR on DSAC composite is influenced by pH-dependent electrostatic interactions and interstitial diffusion. In aqueous solution, CR shows pH-sensitive behavior; at neutral pH (~7), it appears as a solid red, turning dark blue in acidic medium (cationic form), and retaining an anionic sulfonate structure (D–SO
3−) at alkaline pH (10–12). At pH > 5, CR exists as a large, negatively charged molecule due to sulfonate group dissociation (D–SO
3Na → D–SO
3− + Na
+); an aggregation phenomenon may occur in solution [
84]. The DSAC surface charge, governed by its zero-point charge (pH
pzc = 8.2), shifts from positive (pH < 8.2) to negative (pH > 8.2). Below pH 8.2, electrostatic attraction occurs between the positively charged surface of DSAC and the CR sulfonate group, resulting in adsorption. At higher pH, competition with OH
− ions and surface repulsion reduce adsorption efficiency. Despite this, significant adsorption persists in the alkaline range (pH 7–10), supported by pore diffusion after initial rapid surface-site occupancy [
93,
94].
FTIR analysis (
Figure 5) corroborates this mechanism; the appearance of a new S=O stretching peak (1265 cm
−1) in CR-loaded DSAC confirms sulfonate group interaction, while shifts in hydroxyl (3300–3700 cm
−1), alkyl (2927, 2853 cm
−1), and carbonyl (1741 cm
−1) bands suggest additional interactions involving polar and aromatic moieties.
Thus, CR adsorption on DSAC is firstly controlled by electrostatic forces at almost neutral pH (6.8), followed by slower intra-particle diffusion into pores, with a secondary contribution from hydrogen bonding or π-π interactions inferred from spectral changes. The adsorption mechanism can be explained by the electrostatic interaction between the negatively charged SO3− groups and the positive charge of the activated carbon surface.
