Article

Sustainable Wastewater Treatment Through Anaerobic Digestion in the Instant Coffee Industry: A Techno-Economic and Environmental Assessment

by
Rosa Alexandra Córdova-Mosquera
1,
Carlos Augusto Morales-Paredes
2,
Iris B. Pérez-Almeida
3,
María Dolores Saquete
4,
Nuria Boluda-Botella
4,
Deny Oliva-Merencio
5,
José-Manuel Pais-Chanfrau
6,
Joan Manuel Rodríguez-Díaz
1,7,* and
Ileana Pereda-Reyes
5,*
1
Departamento de Procesos Químicos, Biotecnología y Alimentos, Facultad de Ingenierías y Ciencias Aplicadas, Universidad Técnica de Manabí, Portoviejo 130105, Ecuador
2
Facultad de Ciencias Agrarias y Forestales, Universidad Técnica Estatal de Quevedo, Quevedo 120501, Ecuador
3
Center for Sustainable Development Studies (CEDS), Ecotec University, Samborondón 092302, Ecuador
4
Instituto Universitario de Ingeniería de los Procesos Químicos, Universidad de Alicante, E-03080 Alicante, Spain
5
Centro de Estudios de Tecnologías Energéticas Renovables (CETER), Facultad de Ingeniería Mecánica, Universidad Tecnológica de La Habana José Antonio Echeverría (CUJAE), Calle 114. No. 11901, Marianao, La Habana 19390, Cuba
6
Faculty of Engineering in Agricultural and Environmental Sciences (FICAYA), Universidad Técnica del Norte (UTN), Ave. 17 de Julio 5-21 y Gral. José María de Córdova, El Olivo, Ibarra 100104, Ecuador
7
Laboratorio de Análisis Químicos y Biotecnológicos, Instituto de Investigación, Universidad Técnica de Manabí, Portoviejo 130105, Ecuador
*
Authors to whom correspondence should be addressed.
Water 2025, 17(22), 3207; https://doi.org/10.3390/w17223207
Submission received: 7 October 2025 / Revised: 4 November 2025 / Accepted: 5 November 2025 / Published: 10 November 2025
(This article belongs to the Special Issue Physical–Chemical Wastewater Treatment Technologies, 2nd Edition)

Abstract

The coffee industry generates wastewater with high organic loads, which represents both an environmental challenge and a potential resource. This study proposes a novel, integrated solution for an instant coffee plant in Ecuador by incorporating anaerobic digestion into the treatment train. The approach uniquely combines rigorous kinetic analysis with a comprehensive techno-economic and sustainability assessment. Long-term operation of upflow anaerobic filters confirmed the superior stability and performance of the mesophilic regime. Under these conditions, the process achieved a methane yield of 200.5 mLCH4 g−1COD and a chemical oxygen demand (COD) removal efficiency of 64.1%. The experimental data fitted to the modified Stover–Kincannon and Grau second-order kinetic models (R2 > 0.95) validating the robustness of the mesophilic operation. For the technological proposal, a hydraulic retention time of 7.3 days and an organic loading rate of 1.03 kgCOD m−3 d−1 were established. The economic evaluation confirms that a minimum price of USD 171 per 60 kgbag is required to achieve a positive net present value with a payback period of 5.47 years. Furthermore, the system transitions the facility’s energy profile to net-positive status, with an energy recovery ratio of 1.67, and strengthens the environmental sustainability of the proposal. It is concluded that anaerobic digestion is a viable technology from technical, economic, and environmental perspectives, enhancing the performance of the instant coffee industry and generating added value from highly polluting waste.

1. Introduction

The coffee industry has become an important driver of economic development in various regions of the world, mainly due to the high consumption of its products, the low cost of raw materials, and the standardization of production costs [1,2,3]. The International Coffee Organization (ICO) reports that South America grows more than 45% of the coffee traded worldwide, positioning Brazil as the largest producer and consumer globally [4]. In terms of production by country, Brazil is reported to generate a total of 65.9 million bags (60 kg) annually. At the South American level, Ecuador is among the top 5 producers, with a production of close to 0.5 million 60 kg bags. In addition, in 2024, global consumption was reported to be approximately 177 million 60 kg bags, indicating an increase in the consumption rate of around 2.2% compared to the previous year [4].
Despite the constant growth of this industry, there is evidence of high waste generation and poor implementation of efficient and sustainable treatment technologies. Ref. [5] report that approximately 70% of this waste is discharged directly without any treatment, affecting the sustainability of natural resources. Specifically, Ref. [6] established that wastewater from the coffee industry has a high pollution potential due to its high organic load, color, and pH [7], which deepens its impact on the water bodies into which it is discharged. The characteristics of this wastewater have been evaluated by several authors, highlighting the presence of non-biodegradable pollutants and chemical oxygen demand (COD) concentrations in the range of 13 to 29.5 g L−1 [8,9,10]. In countries such as Ecuador, it has been reported that, on average, wastewater from the coffee industry has a COD of 7500 mg L−1 [11]; however, it has been observed that although this country is among the top five coffee producers in the region and has several coffee processing industries, adequate treatment for the decontamination and recovery of this waste is not carried out, which affects the economic and environmental sustainability of these industries.
There is evidence demonstrating the possibility of applying anaerobic digestion (AD) as an effective treatment for various types of industrial wastewater [12,13]. Studies conducted by [14,15,16] converge on the idea of implementing AD as a sustainable alternative in industrial wastewater management and the generation of value-added products such as biogas. In this regard, ref. [17] achieved a 93% removal of COD from industrial coffee wastewater and a yield of 0.33 m3 CH4 kg−1COD through two-stage upflow reactors. For their part, ref. [18] evaluated methane production from brewing and coffee industry waste and reported efficiencies of 0.75 m3 CH4 kg−1 of total volatile solids.
Although AD technology has advantages in wastewater treatment, its implementation in industry depends on large-scale economic feasibility. In this regard, it is necessary to evaluate profitability using models that assess technical aspects based on biophysical sustainability indicators and economic parameters such as the payback period (PB), net present value (NPV), internal rate of return (IRR), and total investment cost [19]. Each of these parameters provides results for the analysis of a novel alternative for wastewater treatment that can be implemented in countries with high industrial coffee activity. Therefore, the objective of this research is to evaluate the technical and economic feasibility of redesigning a real instant coffee processing wastewater treatment plant that incorporates the AD process as an operation for the elimination of organic load and the revaluation of waste. Based on these results, the coffee processing industry will have at its disposal a comparative analysis between conventional treatment (aerobic digestion) and a redesign of the treatment plant through the implementation of AD.

2. Materials and Methods

2.1. Experimental Study of the AD Process: Preparation of the Substrate and Inoculum

The experimental tests were carried out with simulated wastewater prepared in the laboratory. The purpose of this preparation was to homogenize the variable composition of wastewater from the instant coffee industry, thereby ensuring the reproducibility of the results obtained in the research. The simulated wastewater was prepared following the procedure reported by [11,20]. To stabilize the operation of the continuous reactors, a feed COD of 7500 mg L−1 was used. Additionally, real samples of wastewater from the industry were taken. The samples were stored in sterile containers under refrigeration (4 °C) before their use in the experimental tests.
The inoculum was prepared using sludge from a tuna industry located in Manabí, Ecuador, which treats its wastewater using AD. The sludge was degassed and fed with wastewater from the coffee industry for 30 days. Subsequently, it was verified that the inoculum contained at least 50% volatile solids (VS) on a dry basis, in accordance with the techniques reported in previous studies [18].

2.2. Assembly and Operation of Continuous Reactors

The experimental tests were carried out in upflow anaerobic filter (UAF) biological reactors at mesophilic (35 °C ± 2 °C) and thermophilic (55 °C ± 2 °C) temperatures (Figure 1). The reactors were constructed from polyvinyl chloride (PVC) pipes with a height of 0.7 m, an internal diameter of 0.12 m, an effective volume of 3 L, a corrugated plastic packing volume of 0.30 L, and an inoculum that occupied 40% of the total volume of the reactors. The reactors operated for 454 days. The reactors were started at a low organic load (0.75 kgCOD m−3 d−1) during the first 36 days. Subsequently, the organic loading rate (OLR) was progressively increased to 1.02, 1.32, 1.63, 2.23, and 2.63 kgCOD m−3 d−1. This allowed the microorganisms involved in the AD reactions to avoid sudden changes in substrate loading and adapt until the desired OLR was reached.
The peristaltic pumps used for feeding, recirculation, and discharge during the experiment were DP4-4 CHANNEL JECOD pumps (Jebao Co., Ltd., Zhongshan, China). The biogas generated was brought into contact with a 15% (w/v) NaOH solution, which allowed the displacement of the solution to be measured and thus the volume of CH4 generated to be quantified (Figure 1). The volume of methane was reported under standard temperature (0 °C) and pressure (101.3 kPa) conditions. In addition, collection bags were placed to store and subsequently characterize the biogas using Multitec ®545 equipment (Hermann Sewerin GmbH, Gütersloh, Germany).
Methane yield was obtained from the following equation, as reported by [21,22] in studies with similar reactors.
Y C H 4 = t = 0 t = V C H 4 g C O D  
where
Y C H 4 : Methane yield (mL CH4 g−1 COD).
V C H 4 : Volume of methane accumulated during digestion time under standardized conditions (mL).
t: time (d).
gCOD: Mass of chemical oxygen demand contributed by the substrate (g COD).

2.3. Analytical Tests for Process Control

The analytical tests carried out during the experimental study were performed according to standard methods for wastewater analysis [23]. The parameters were evaluated depending on the requirements of each control point (inflow and outflow). All tests and analyses were performed in triplicate (Table 1).

2.4. Kinetic Study Models

The kinetics of the AD process were calculated using the modified Stover–Kincannon model (Equation (2)) and Grau’s second-order multicomponent substrate elimination model (Equation (3)). The linearization of both models has been previously described in [24] and [25], respectively.
d S d t = K B U m a x · V Q S O + 1 U m a x
where
d S d t : substrate removal rate.
K B : saturation constant (kg m−3 d−1).
U m a x : maximum substrate utilization rate (kg m−3 d−1).
V : reactor volume (m3).
Q : volumetric flow rate of wastewater (m3 d−1).
S O : substrate concentration in the influent (kg m−3).
S 0 S 0 S H R T = a + b · H R T
where
S O substrate concentration in the influent (kg m−3).
S : substrate concentration in the effluent (kg m−3).
H R T : hydraulic retention time (d).
a : ratio between So/ksXo.
b : dimensionless constant reflecting the impossibility of reaching zero for the substrate concentration at a given HRT.

2.5. Case Study

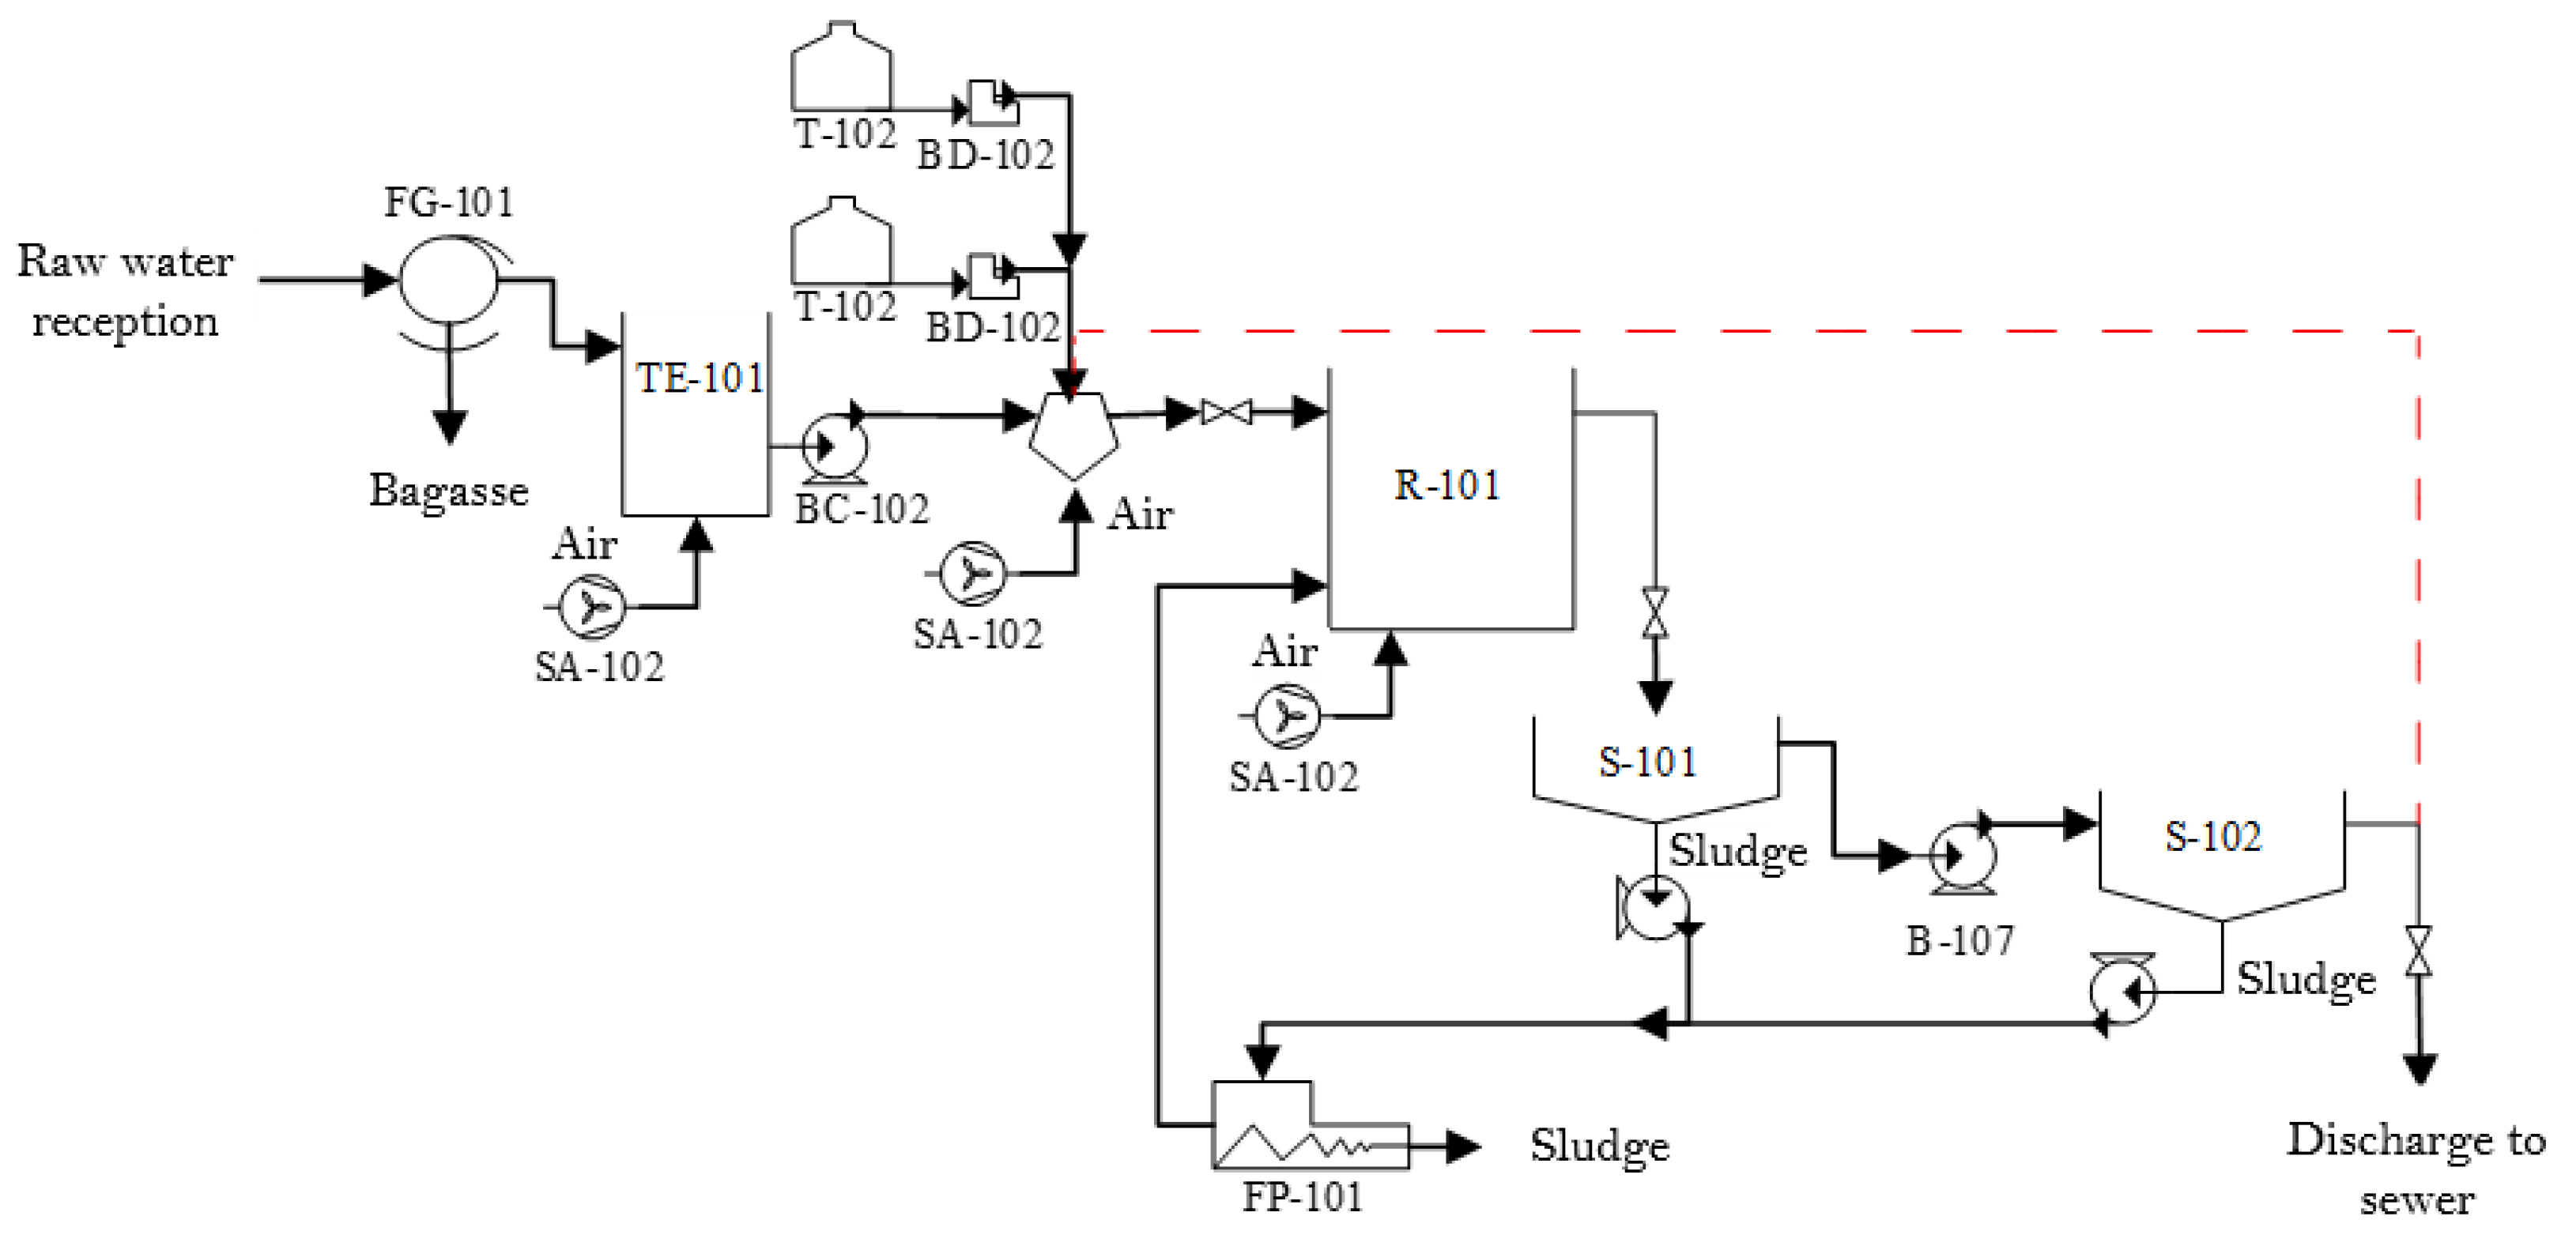
As part of this research, a technological proposal was developed for the anaerobic treatment of wastewater from the coffee industry, along with a technical, economic, and environmental assessment. A coffee production industry located in the province of Guayas, Ecuador, was taken as a case study. The company produces 4913.6 tons of instant coffee per year and generates an average of 210 m3 d−1 of wastewater. Figure 2 indicates the current layout of the plant used by the industry for wastewater treatment, with its respective designation (Table 2). The red line indicates an operation that is enabled on occasions when, even after undergoing the treatment process, the wastewater does not comply with regulations and is returned to the coagulation–flocculation unit.

2.6. Technical and Economic Evaluation and Sustainability of the Proposal

The economic analysis of the integrated process was carried out using the total investment cost (TIC), the total production cost, and the cash flow of a plant that undergoes a modification to its conventional scheme. This plant incorporates an AD operation for the treatment of wastewater from the instant coffee industry. The unit costs for the preliminary design or initial cost estimate of the technological equipment were obtained from information available in industrial catalogs and websites of suppliers worldwide. The Hand method was applied to calculate the TIC, using the factors proposed for each piece of equipment according to Perry’s Chemical Engineers’ Handbook [26]. The economic feasibility of the proposal was evaluated in United States Dollars (USD). Depreciation was considered linear over 10 years for the installed technological equipment, and a discount rate of 15% was used.
The AD process was scaled using the OLR method, which determines the required volume of each reactor, keeping the OLR obtained at the experimental scale constant [27].
As indicators of economic feasibility, the sensitivity of the PB, NPV, and IRR was evaluated according to the equations proposed in the work of [19]. Additionally, a proposal for biophysical sustainability indicators specific to the coffee industry was made, based on the parameters specified in Table 3.
The CO2 emission reduction calculation is based on the stoichiometric conversion of the removed COD load, following established methodologies for accounting avoided emissions from fossil fuel displacement and prevented aerobic decomposition.

3. Results and Discussion

3.1. Characteristics of Wastewater

This study characterized wastewater from a coffee industry located in the province of Guayas, in Ecuador, as well as simulated wastewater prepared in the laboratory. Table 4 points to the results of the physical, chemical, and biological characterization of both types of wastewaters.
The physical and chemical parameters that characterize wastewater from the coffee industry indicate high variability [28]. This is due to the use of different coffee varieties, the harvest season, and the technological alternatives employed [28]. Table 4 specifies the aforementioned difference, since in parameters such as COD and pH, simulated water offers ranges with less variability (and therefore greater stability) [29]. In addition, ref. [10] reports that the COD of wastewater from the instant coffee processing is between 6420 and 8480 mg L−1, which reflects an average COD similar to that of the simulated wastewater in this study. However, the pH of the simulated water differs from the reports of other studies, where the processed effluent has an acidic pH: 4.7–6 [30] and 3.9–4.1 [10]. It should be noted that the contaminant parameter of greatest interest in AD is COD, since it is related to the amount of substrate available to anaerobic microorganisms.

3.2. AD Process Yields

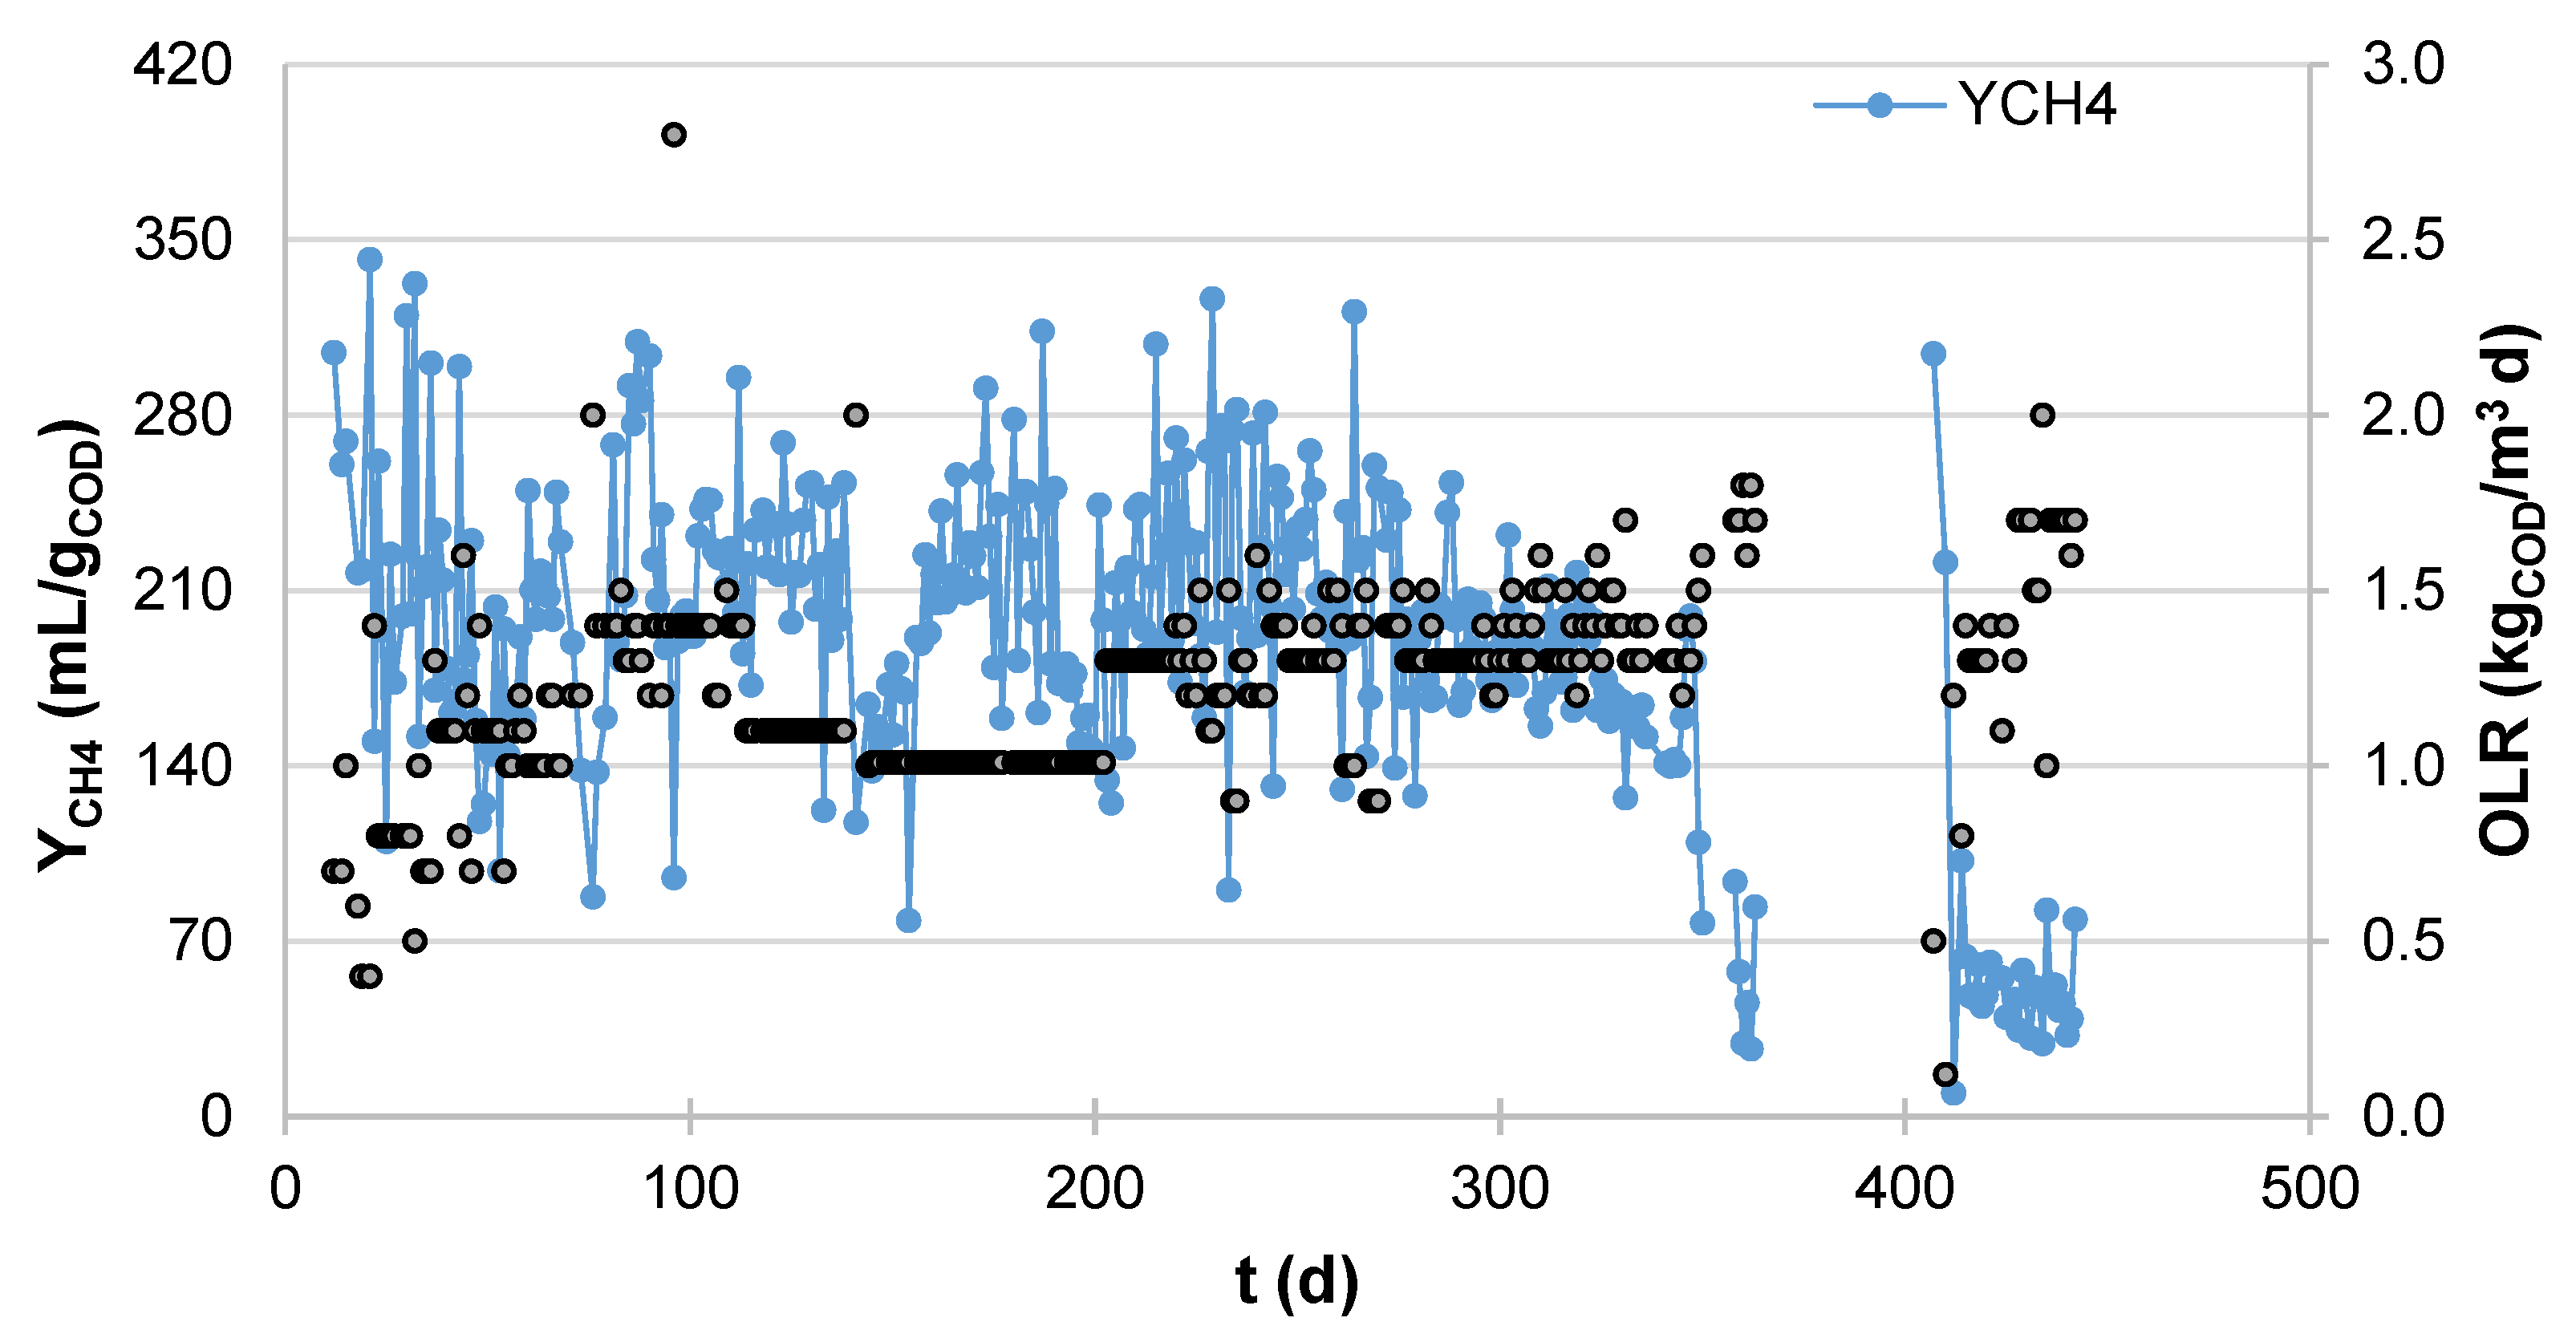
The UAF reactors were continuously monitored based on parameters such as pH and the VFA/Alk ratio, whose values remained within the appropriate ranges for the proper performance of the AD process. Given the differing operational management and stability of the reactors, the performance of the thermophilic and mesophilic systems is detailed separately. In the thermophilic reactor, the pH remained at 7.03 ± 0.21 while it operated stably. During the experiment, it was observed that from day 276 of operation, the methane yield began to decrease, leading to the decision to reduce the organic loading rate. Subsequent increases continued to deteriorate the reactor’s performance, and no reinoculation or shutdown strategy managed to reverse this situation (see Figure 3).
Under these conditions, the pH reached average values of 5.6 ± 0.62, which are considered unsuitable for AD. The VFA/Alk ratio followed a similar trend. During the stable operational period, it maintained an average value of 0.29 ± 0.12, while during the unstable period, values averaged 3.01 ± 0.93. As for the methane yield, the decline was drastic, leading to the decision to stop the process and carry out reinoculation until the expected values for this parameter were achieved.
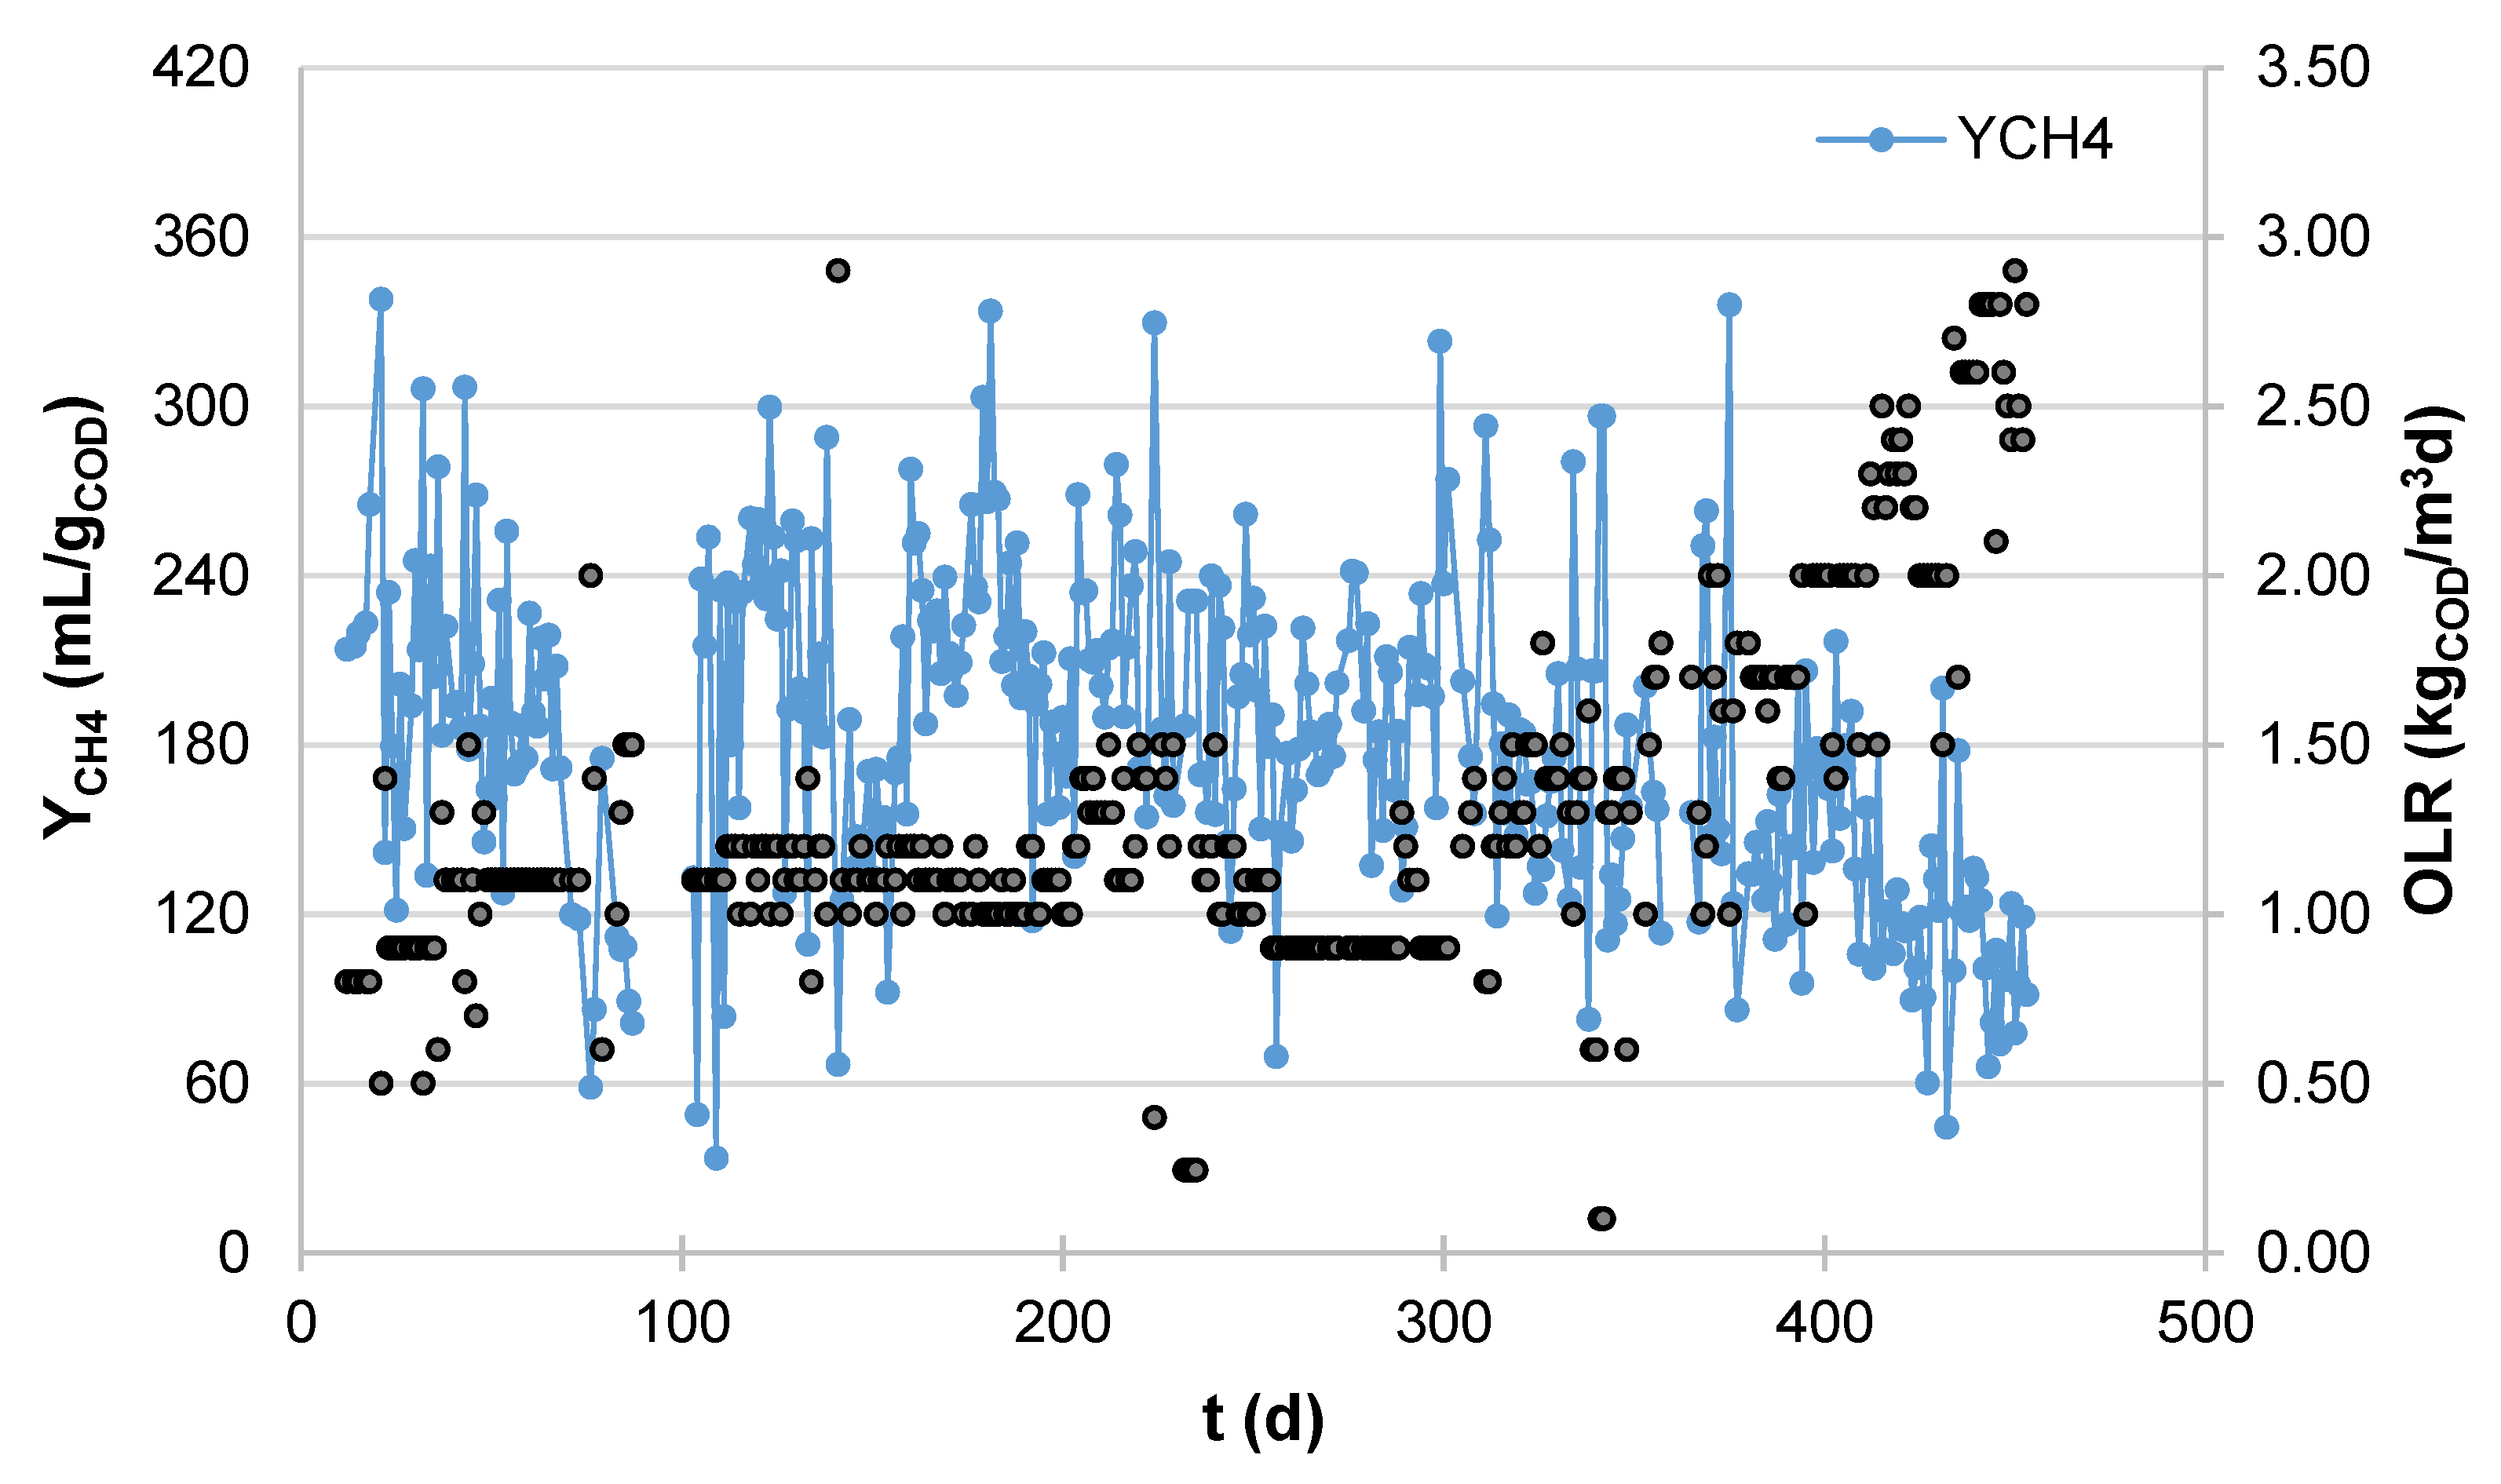
In contrast, the mesophilic reactor operated with similar pH values of 6.95 ± 0.25 throughout its stable operational period, which was much longer than that of the thermophilic reactor. In this system, the process only had to be stopped once, at day 87, for a brief period (see Figure 4).
The volumetric organic loading rate during this period fluctuated within intervals of 1.33 ± 0.17 kgCOD m−3 d−1 for the thermophilic reactor and 1.56 ± 0.48 kgCOD m−3 d−1 for the mesophilic one. The hydraulic retention time (HRT) for these conditions was 7.5 ± 2.5 d and 5.3 ± 2.3 d for the thermophilic and mesophilic regimes, respectively. Increases in the volumetric organic loading rate (OLR) to higher than 1.7 kgCOD m−3 d−1 destabilized the system and necessitated adjustments to the feed. Nevertheless, the mesophilic reactor exhibited greater robustness in the face of these changes, and the sensitivity of the thermophilic system to these variations was confirmed.
This result partially aligns with reports for these wastes or similar ones by other authors treating analogous effluents. Ref. [20] operated at OLRs of 1, 2, and 4 kgCOD m−3 d−1 with an HRT of 1 d at both temperatures; however, to achieve good AD performance, they supplemented the systems with macro and micronutrients. Ref. [31] operated at OLRs of 1.3 and 1.6 kgCOD m−3 d−1 with HRTs of 20–25 d for mesophilic and thermophilic conditions, respectively. In this case, the substrate still contained small particles of coffee beans and was likewise supplemented with macro and micronutrients. In contrast to the present work, these authors managed to achieve a slight increase in the OLR under thermophilic conditions.
At the end of the experimentation, a subsequent increase in the volumetric organic loading rate proved detrimental to the process; however, it was possible to increase it up to 2.9 kgCOD m−3 d−1. In this case, the pH values only decreased to an average of 6.20 ± 0.66. For the VFA/Alk ratio, average values during the stable operational period were 0.27 ± 0.15, while during the unstable period, values of 0.28 ± 0.07 were recorded.
When comparing the behavior between mesophilic and thermophilic reactors, it was confirmed that the mesophilic system had more stable operating periods. The average methane yield ranged from 200.5 ± 45.8 mL CH4 g−1COD for the mesophilic reactor. This value represents 93.6% of the value obtained through mathematical modeling for the mesophilic conditions reported by [11]. In addition, a COD removal efficiency of 64.1% was obtained. This confirms that the yields obtained in the present investigation exceed those reported in previous studies [31] and are similar to those proposed by [17].

3.3. Results of the Kinetic Study Modellation

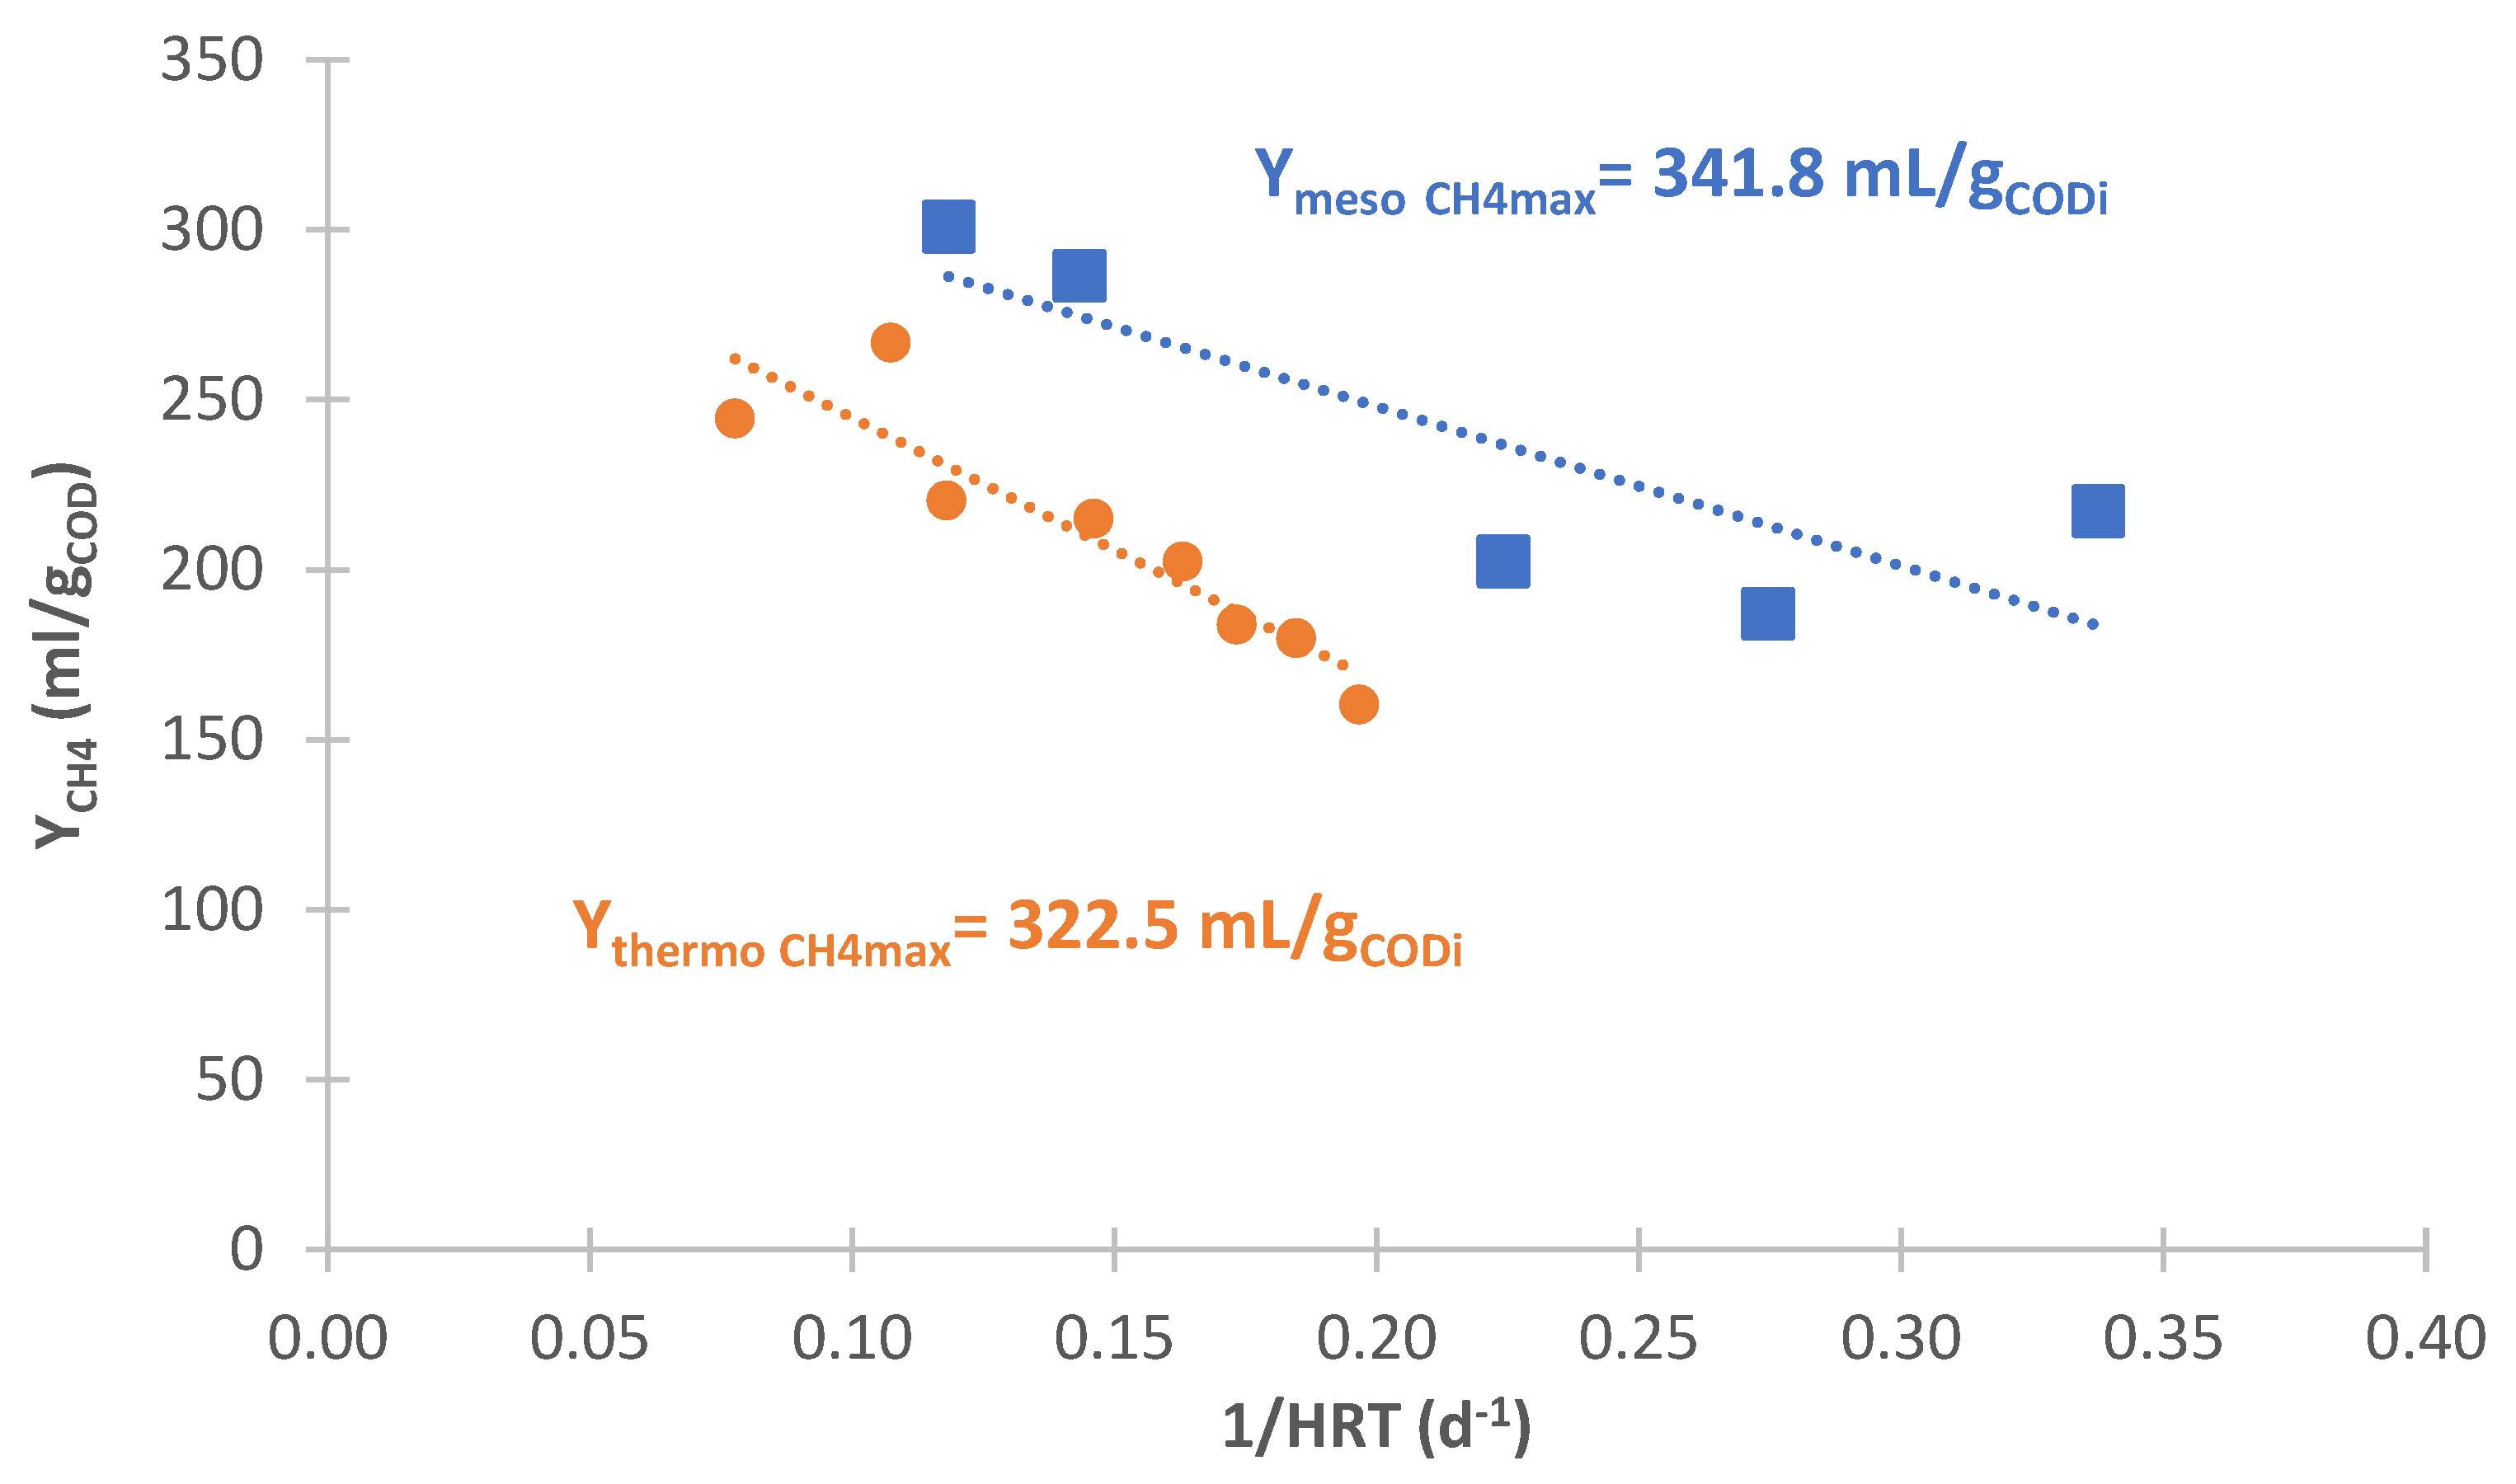
The results of this study consolidate the proposal of the mesophilic regime for a wastewater treatment plant in the instant coffee industry. To consolidate this proposal, a kinetic analysis was performed. For the kinetic analysis, periods in which the HRT was repeated at least three times were selected. In this case, the HRT periods were repeated within an interval of 4 to 7.7 times for both reactors. This same data selection criterion was applied to evaluate the reactor performance in terms of the maximum expected production of the main metabolite (Figure 5).
The analysis of methane yield behavior versus the inverse of the HRT clearly indicates a decrease in yield as the HRT decreases for both reactors. A vertical comparison at similar HRT values indicates that the methane yield under the mesophilic regime was higher than under the thermophilic one. However, at very high HRT values, the trend points to a convergence towards similar methane yields. The maximum methane yields predicted were 341.8 mL g−1CODi and 322.5 mL g−1CODi for the mesophilic and thermophilic reactors, respectively.
Various authors report the effect of decreasing HRT on methane yield and other response variables of the AD system [30,32,33]. These authors, along with many others not cited here, agree that a decrease in HRT reduces the YCH4, even though this response variable is a property of the substrate [21,22,34,35].
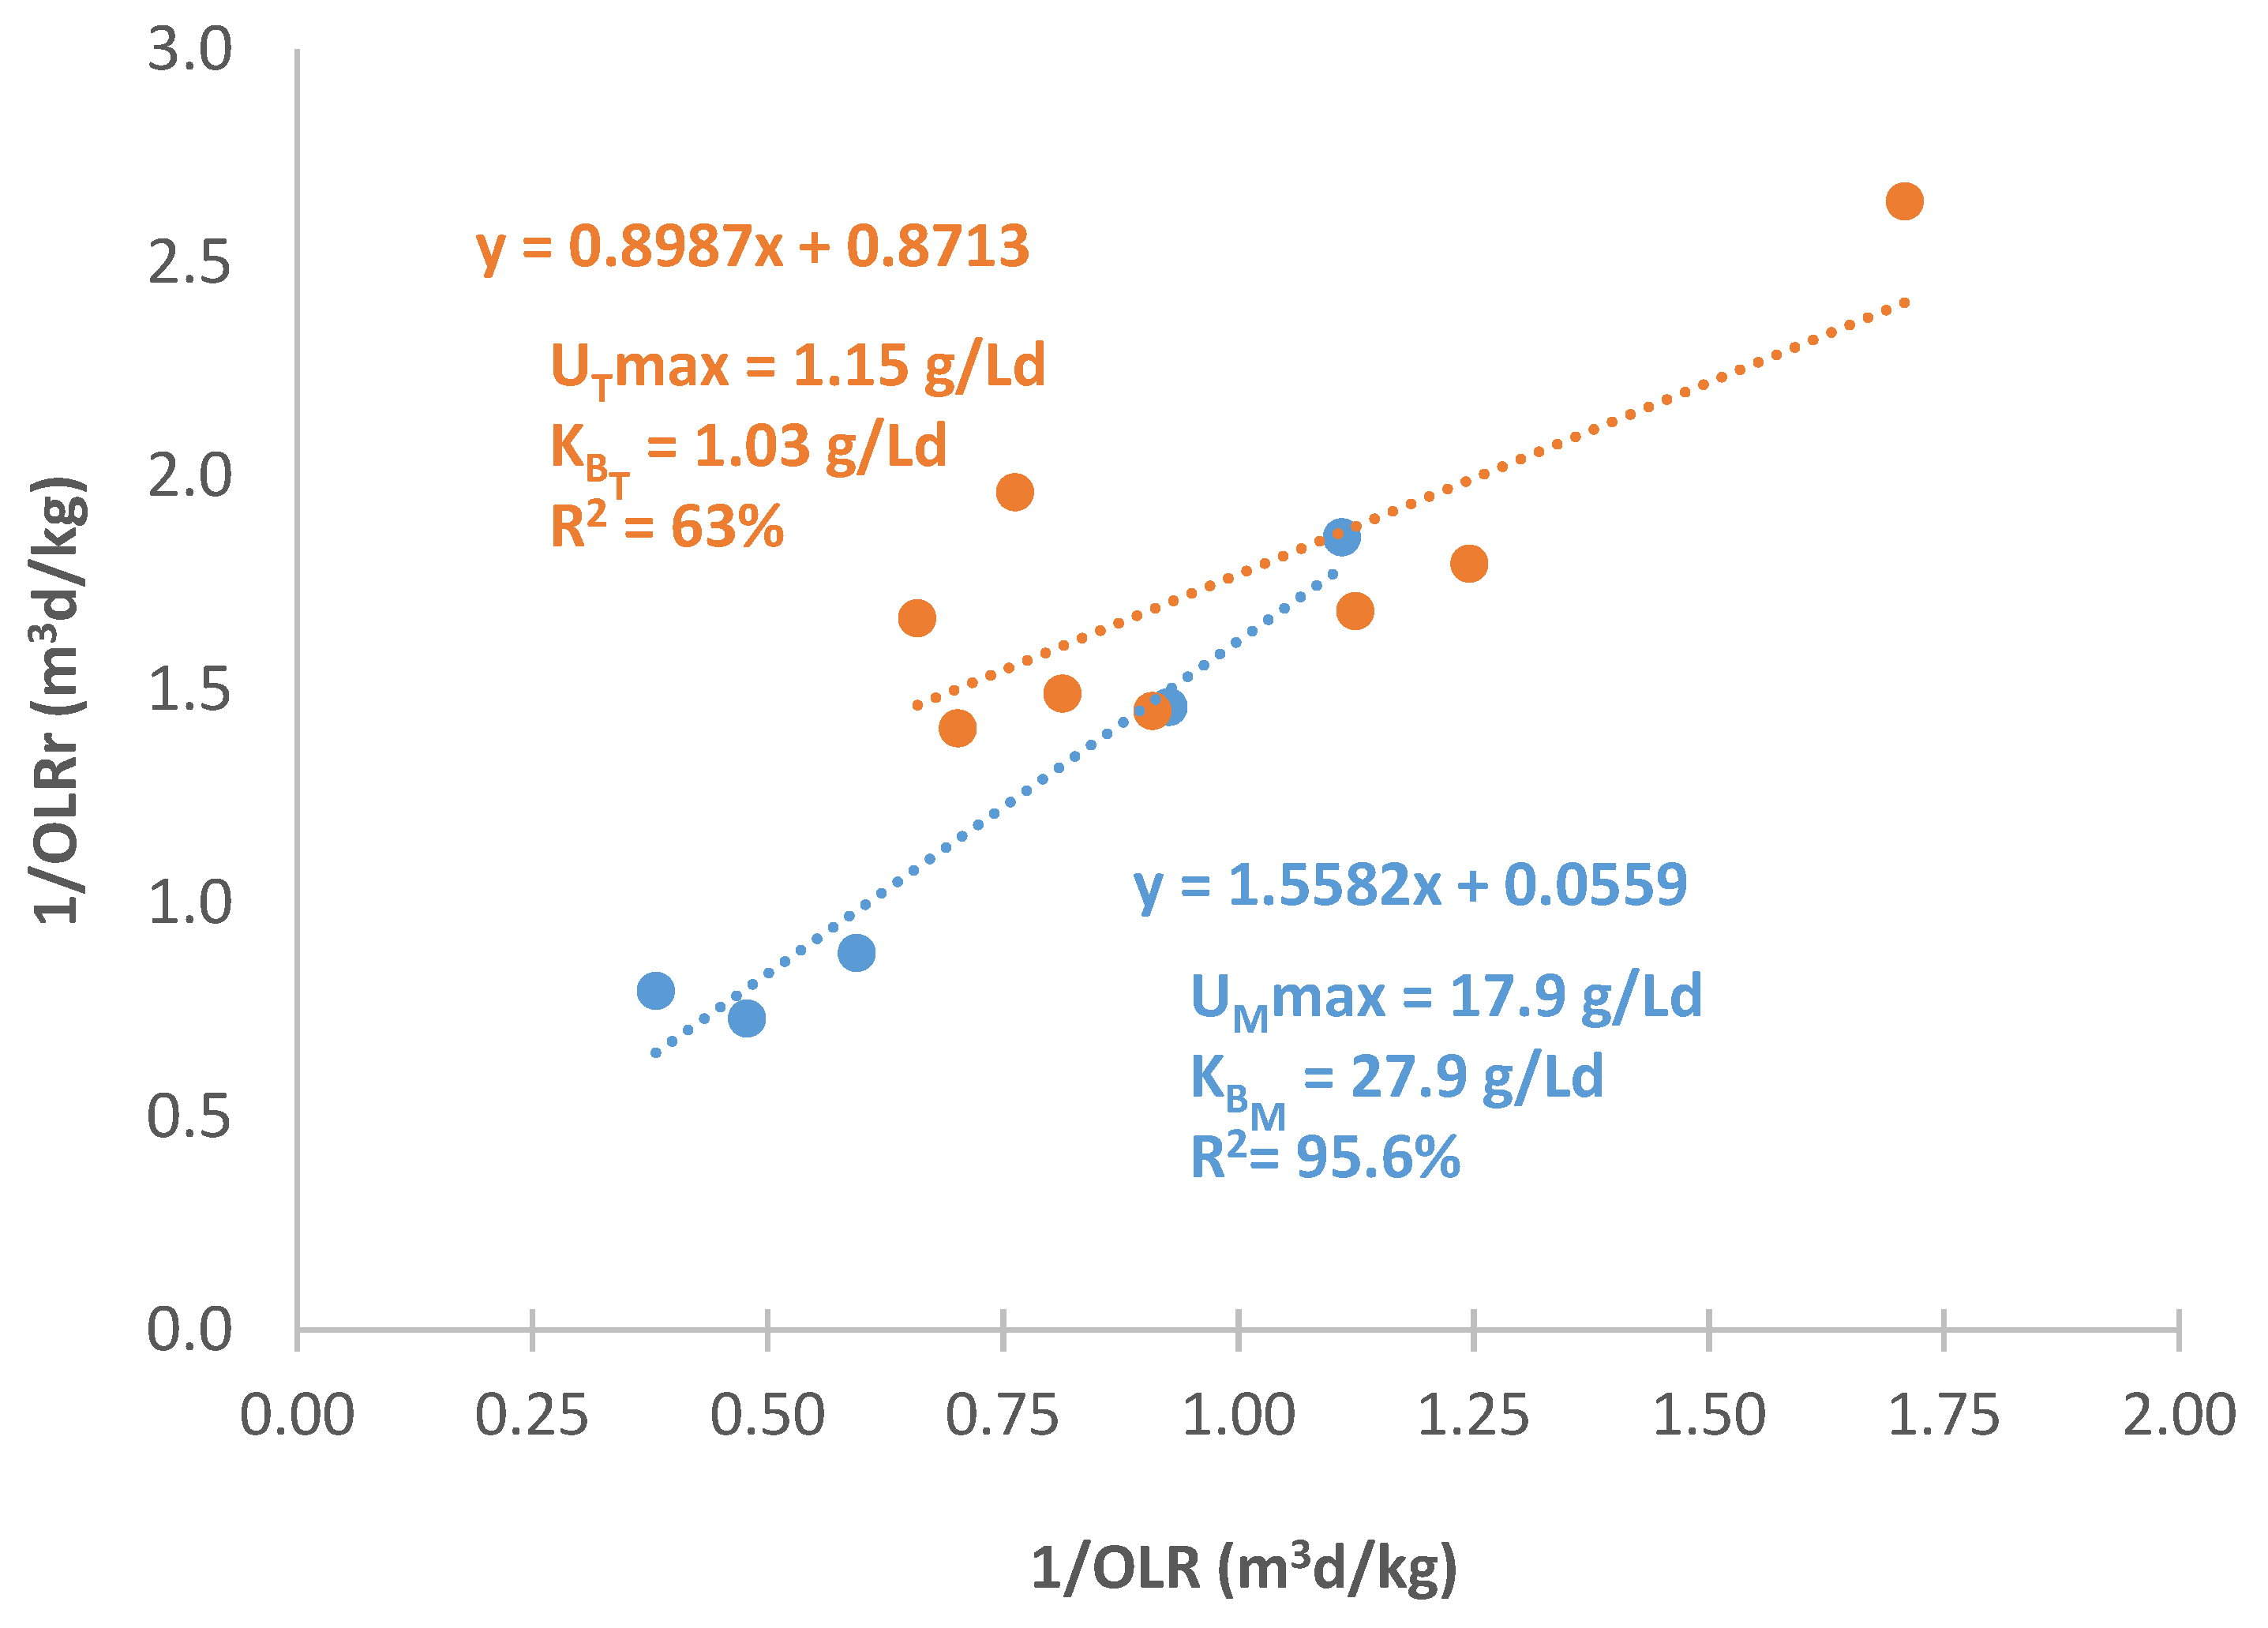
The models applied to the reactors are based on the substrate utilization rate, while observing the production of the main metabolite of the reaction [36]. The behavior of the two widely used models for the biological treatment of wastewater in anaerobic filters or other high-rate reactors is graphed in Figure 6 and Figure 7. These figures indicate the linearization of both the modified Stover–Kincannon (Figure 6) and second-order Grau models (Figure 7).
As showed in the figure, the modified Stover–Kincannon model yielded the following parameters: Umax: 17.9 g L−1 d−1, KB: 27.9 g L−1 d−1, and Umax: 1.15 g L−1 d−1, KB: 1.03 g L−1d−1 for mesophilic and thermophilic systems, respectively. The Umax values reported in this study for mesophilic conditions coincide with those reported by [37] for slaughterhouse wastewater. The difference in Umax confirms the mesophilic reactor’s markedly superior capacity to handle increases in organic loading rate, a decisive advantage for industrial scaling.
As can be observed, both models fit with high coefficients of determination (R2 > 95%, r = 0.975, rc = 0.959 with 99% reliability) for the mesophilic system and with low coefficients for the thermophilic one (60% < R2 ≤ 63%, r = 0.77) compared to the mesophilic system, yet adequate according to the critical correlation coefficient with a 95% confidence level (rc = 0.707). Nevertheless, this is considered appropriate given that these are experimental. Ref. [38] also worked with these kinetic models and achieved a fit to Grau’s second-order multiple substrate removal model with an R2 of 57.1% for brewery wastewater. Ref. [39] evaluated wastewater from the tomato processing industry and fitted the data to the modified Stover–Kincannon model, reporting lower R2 values (42%), thus demonstrating that AD of instant coffee wastewater in a continuous regime fits the modified Stover–Kincannon and Grau second-order kinetic models, preferably at mesophilic temperatures.
The results of the kinetic models under thermophilic conditions suggest a fundamental disruption in the digestion process, likely caused by the inhibitory effect of recalcitrant compounds present in the wastewater (e.g., tannins), which slows down the process and limits microbial activity. Finally, it can be confirmed that the best system for anaerobic treatment of wastewater from the instant coffee industry is based on a mesophilic regime, and the following parameters are set for the design of the anaerobic unit of the treatment plant in the industry: HRT = 7.3 d and OLR = 1.03 kg COD m3 d−1 for a YCH4: 206.7 mL g−1 COD.

3.4. Technological Proposal with the Redesign of the Treatment Plant

The technological process conventionally applied by the instant coffee industry’s wastewater treatment plant is characterized by effluent that often fails to comply with current regulations for discharge into water bodies.
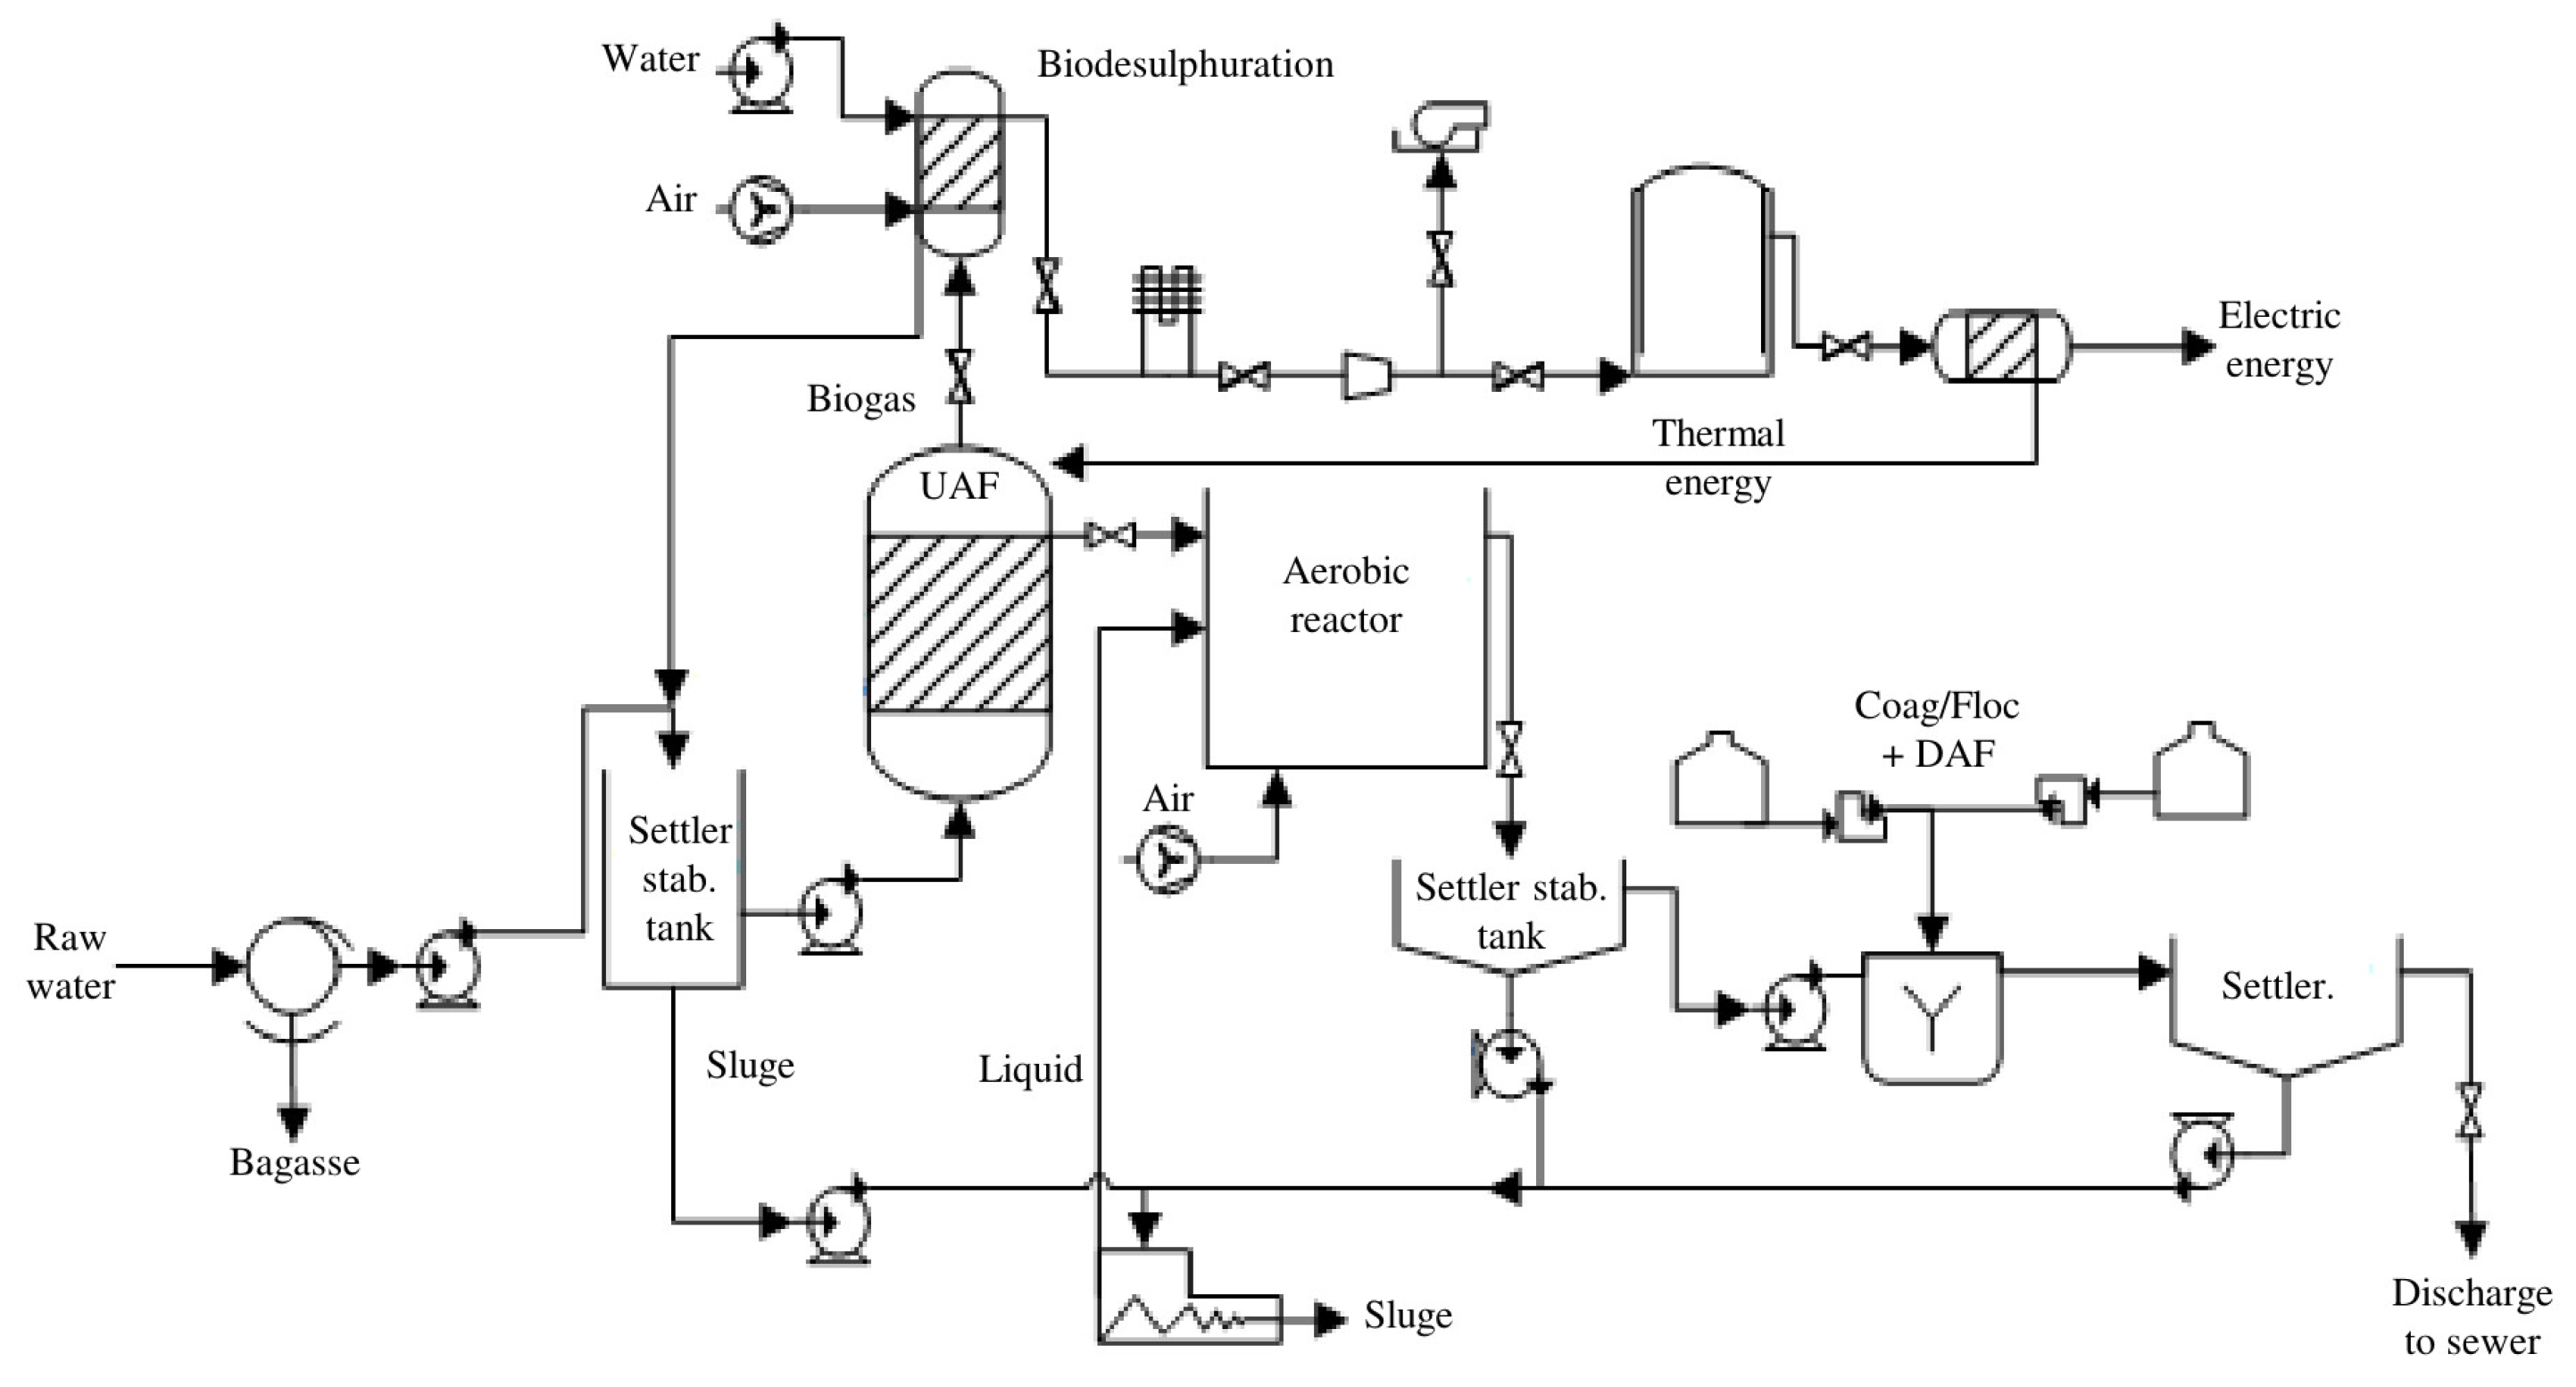
As a result of this work, the incorporation of an anaerobic unit is proposed before the aerobic reactor. Similarly, a modification is suggested at the point where the coagulation–flocculation stage is applied, and the redesigned system is indicated in Figure 8. Taking into account the operational parameters established in the previous sections for the design and sizing of the anaerobic process, the principal mass balance of the redesigned technological proposal is summarized in Table 5.
On the other hand, the items considered as income for the treatment plant for each year of operation were revenues in electrical energy sale for USD 72,365.00, solid digestate sales of USD 13,852.00 for a total revenue of USD 86,216.00

3.5. Economic Evaluation of the Technological Proposal

The Hand method was used to calculate the total investment cost of the processing plant, reporting a TIC of USD 467,392.51. Research such as that by [40] has compared the investment cost in different operating scenarios for AD of agro-industrial waste, reflecting an investment ranging from USD 555,117 to USD 635,396. Consequently, the IRR proposed in this research is lower than that reported in other case studies, which may be related to the installed capacity of the treatment plants, since the studies mentioned [40,41] were carried out in plants with a higher feed flow.
As indicated in the table above, the revenue from sales of the comprehensive anaerobic treatment of wastewater from instant coffee production takes into account the sale of electricity generated from methane and the sale of solid digestate (biofertilizer). The prices for each of these are USD 0.17 per kWh and USD 1.15 per m3, respectively.
The production costs associated with the treatment of this industrial wastewater amount to USD 142,693.00 per year. An analysis of this information indicates that the range of investment that would be generated in the treatment plant does not meet economic expectations, as production costs are higher than the profits obtained from the sale of usable products (USD 86,216.00 per year). This economic trend has also been reported in other studies, in which production costs exceed the income that could potentially be generated by implementing AD as a stage in the treatment process. For example, ref. [40] reports an annual production cost (USD 49,424) that exceeds the annual income from the sale of electricity (USD 22,893) and solid digestate (USD 12,096). In fact, refs. [42,43] report that among the main factors that can affect the feasibility and economic sustainability of these treatment plants are high production and investment costs. For this reason, it is essential to propose price stabilization for the main product of this industry (instant coffee), which would make the proposal in this study profitable.
In recent years, the price of a bag of industrialized coffee (60 kg bags) has varied between USD 150 and USD 192, meaning that this product is subject to high price fluctuations on the international market. There is a trend of instability in the prices of industrialized coffee, which means that the income received by instant coffee processing industries varies constantly and, as a result, the profitability of these companies undergoes periodic variations. Therefore, it is possible to make this technological proposal profitable based on the potential gains that can be obtained by ensuring that the price of instant coffee remains above USD 170.6.
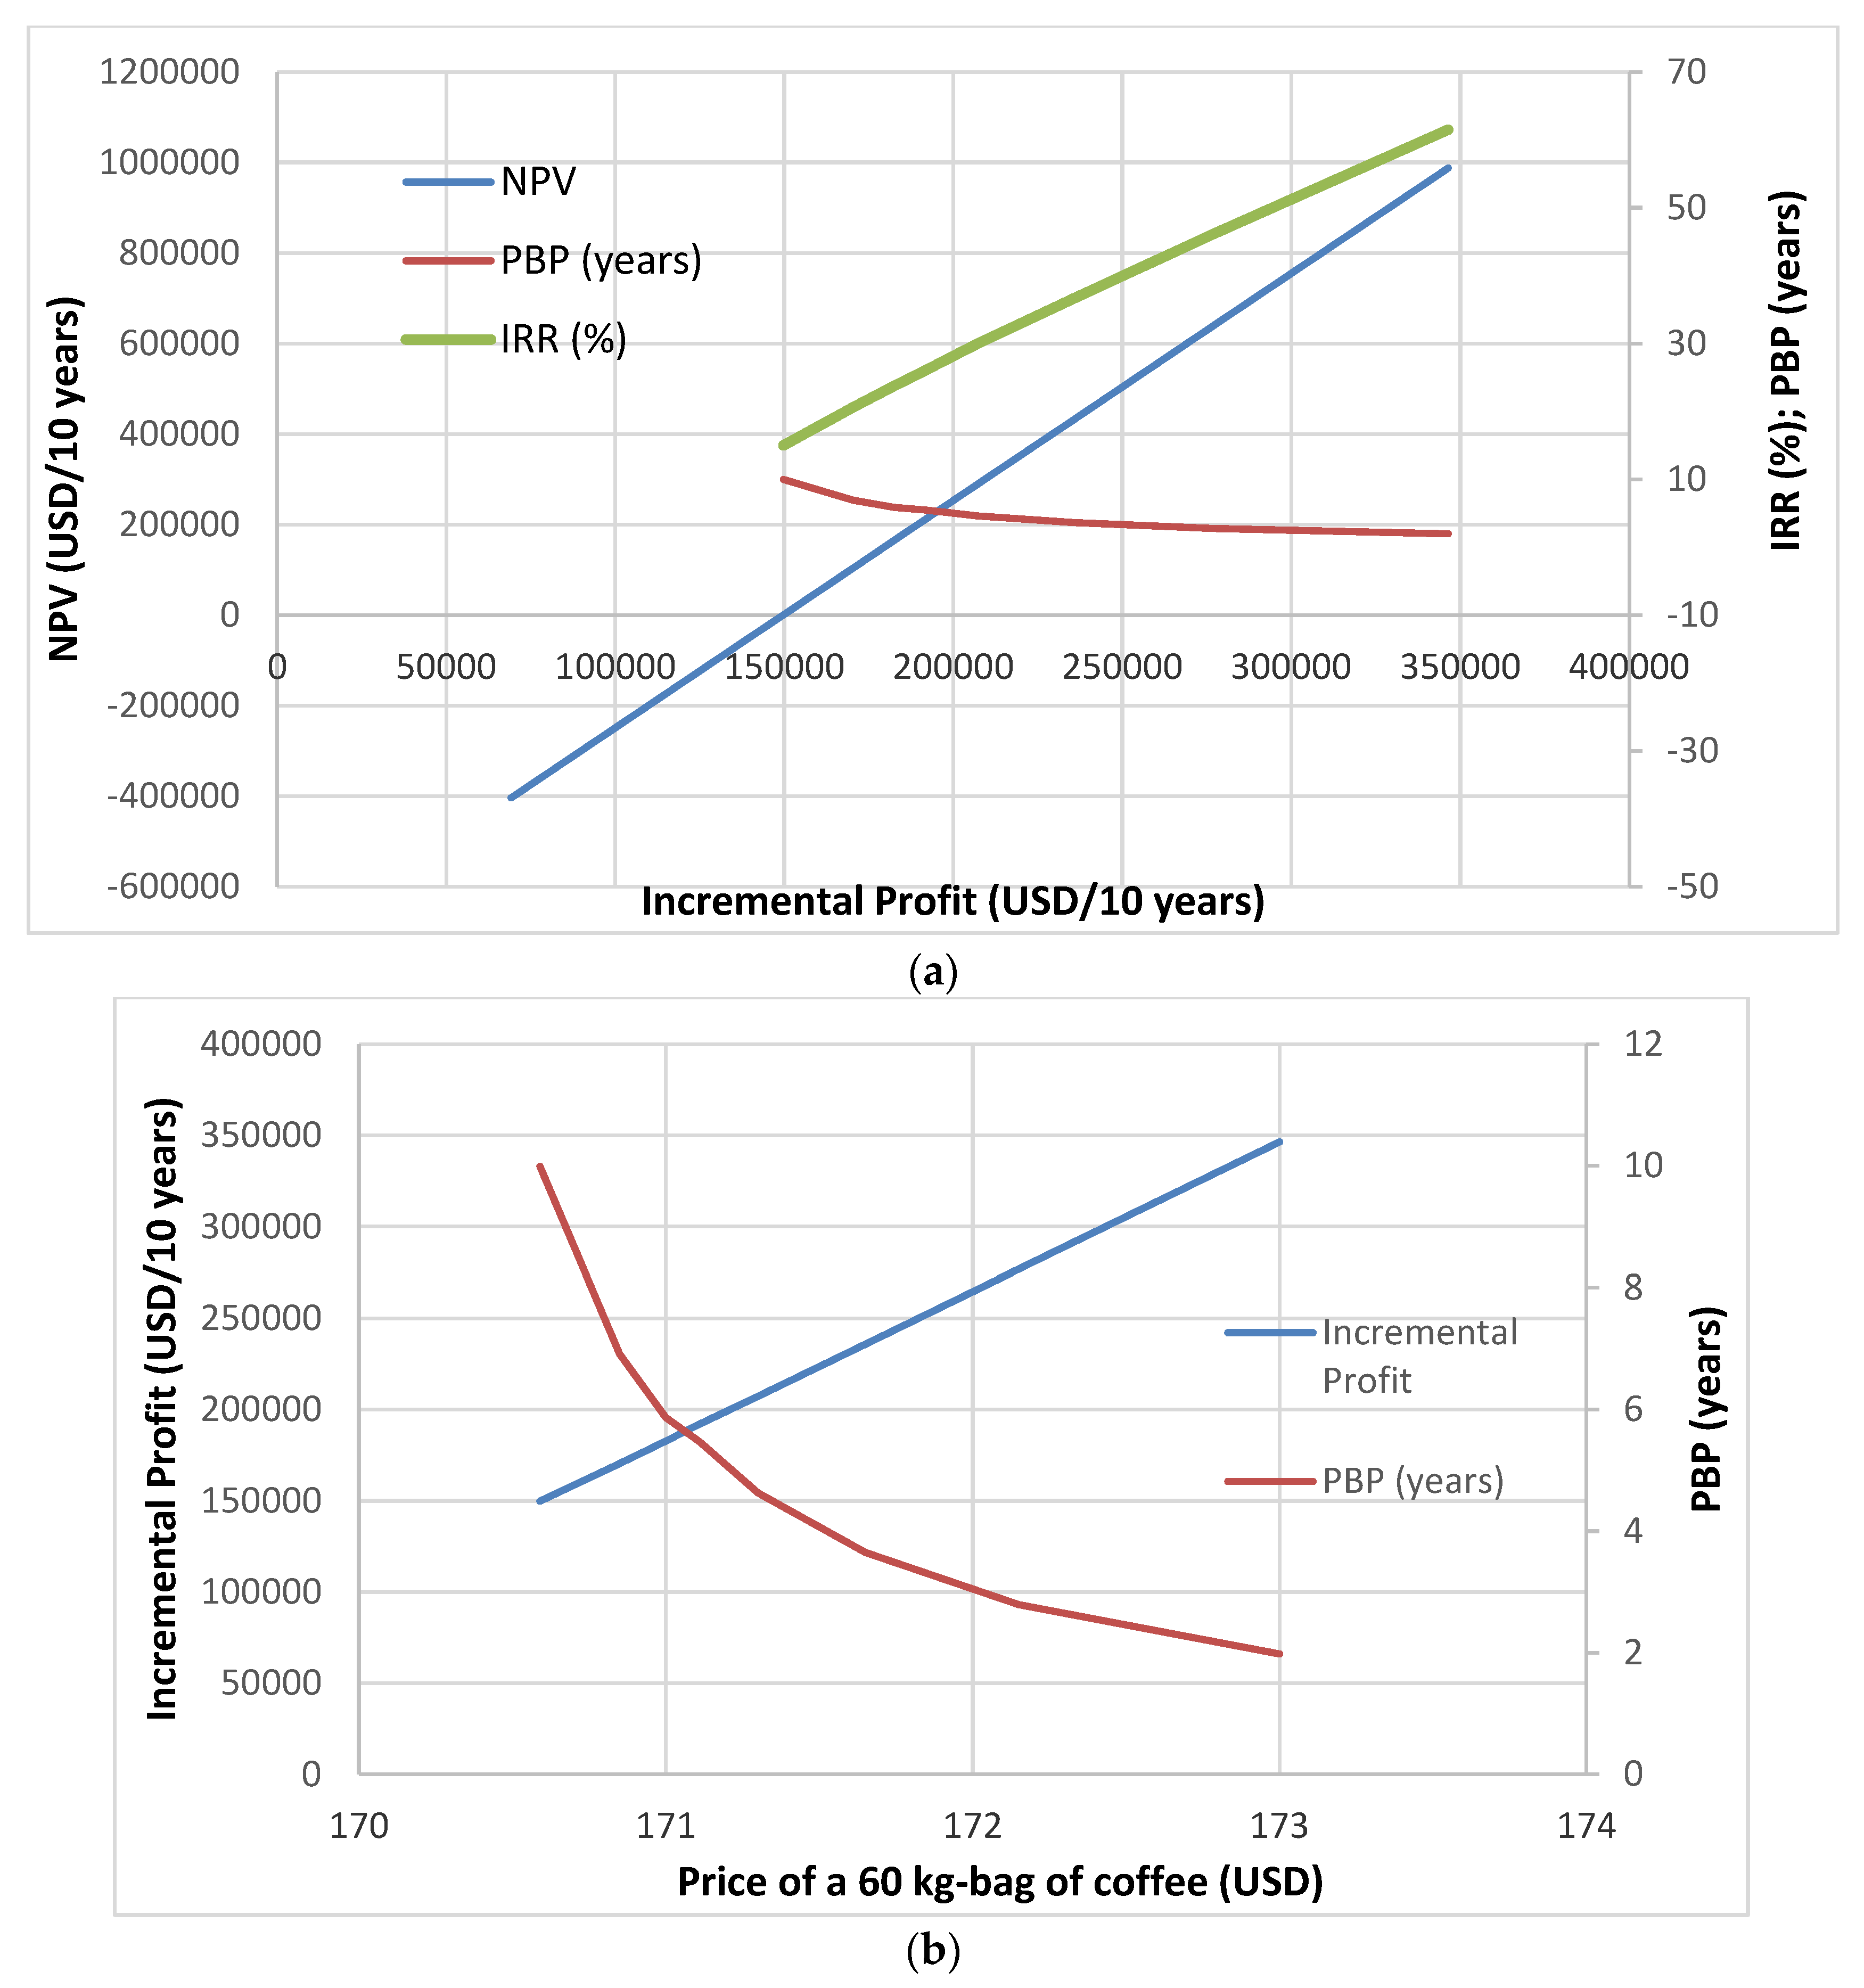
Based on the increase in profits that would be generated for the industry evaluated at USD 171 per 60 kg bag, a positive NPV is obtained after 10 years of investment project planning. Higher increases in profits can lead to a faster return on investment. Taking this into account, a sensitivity analysis was performed to evaluate the effect of the increase in profit from the sale of instant coffee on the main economic indicators. These results are shown in Figure 9.
The behavior of the NPV, IRR, and PBP indicators with the increment in profits is as expected (Figure 9a). As profits increase, both the NPV and IRR increase in value. Conversely, PBP decreases with increasing dividends, tending to demonstrate little variability with respect to the given price of a 60-kg bag of coffee (Figure 9b). By analyzing the curve (Figure 9b), it is possible to determine the price at which the inflection point is reached, beyond which PBP variability is minimal. The inflection point corresponds to a price of USD 171 per 60-kg bag, which leads to an NPV of USD 212,469.00, an IRR of 26.1%, and a PBP of 5.47 years.
When comparing these results with similar research, ref. [41] also informed by favorable economic indicators, with an NPV (USD 600,603) and an IRR (23%) very close to those obtained in the present study, although ref. [41] used anaerobic co-digestion with a combination of substrates with high nutrient content. Similarly, ref. [44] concluded that in an AD plant designed for the treatment of agricultural waste, the investment was recovered after the fourth year of operation, reporting a relatively lower PB than that obtained in this research.

3.6. Biophysical Indicators of Sustainability for the Proposal

In accordance with the general characteristics of the coffee production plant where the proposal to implement AD was made, the biophysical indicators specified in the materials and methods section were developed. Table 6 displays the values of the parameters that were considered in the technological proposal based on the implementation of AD.
In accordance with the above, each of the biophysical sustainability indicators for this instant coffee production plant was calculated. Table 7 specifies the results of the biophysical indicator system. As can be seen in Table 7, these indicators were chosen based on the contributions that the redesign of the treatment plant makes to the sustainability of the coffee industry. In most cases, when sustainability indicators are applied to the instant coffee industry without anaerobic wastewater treatment, the value of each indicator trends to zero, as it does not represent any of the benefits that anaerobic treatment brings to the overall sustainability of the company.
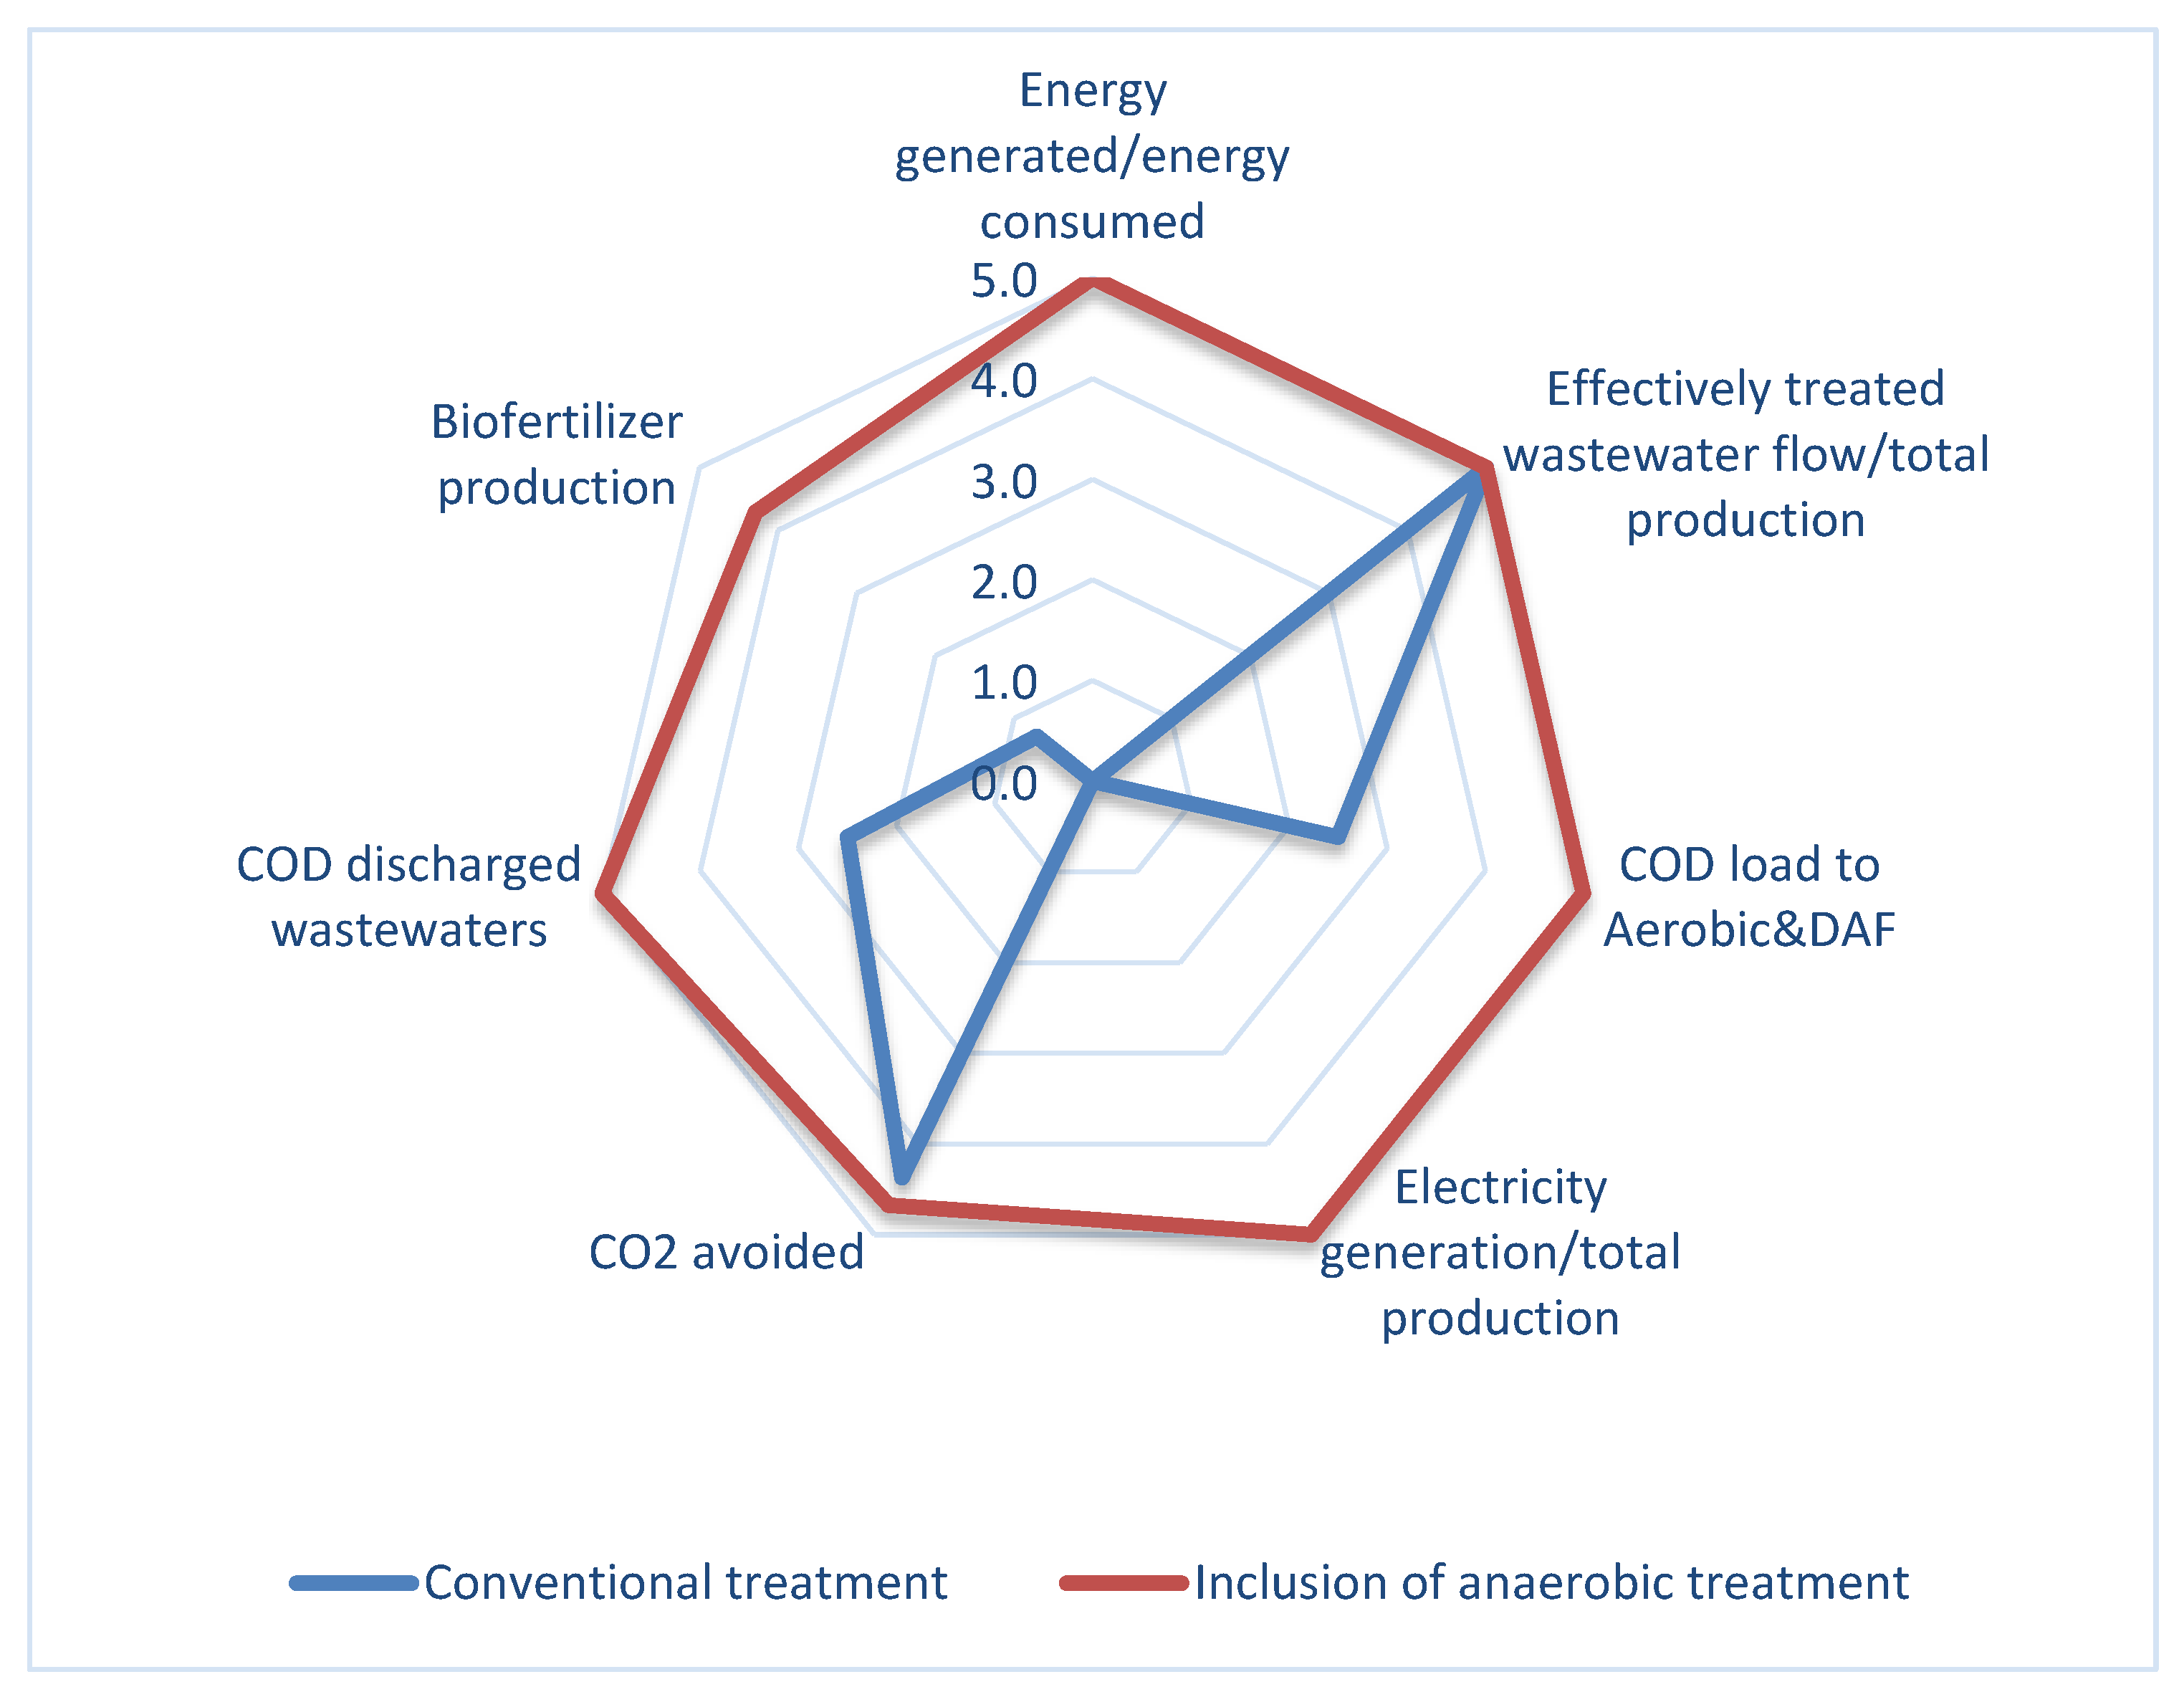
To comprehensively validate these findings and provide an intuitive comparative analysis, a multi-criteria assessment was conducted using a radial graph. This powerful visualization tool allows decision-makers to holistically evaluate system performance across key technical, economic, and environmental dimensions. The graph synthesizes seven normalized indicators, from energy balance and treatment efficiency to carbon mitigation and resource recovery, providing immediate visual confirmation of the anaerobic system’s superiority. This integrated approach quantitatively confirms how the proposed technology, which generates 1.67 times more energy than it consumes, delivers enhanced sustainability across all performance metrics simultaneously (Figure 10).
Moreover, the application of AD allows the effluent generated in the treatment plant to comply with the technical specifications of Ecuador’s environmental regulations, which is not currently the case, and consequently generates economic and legal problems. This is because one of the solutions that these industries have used consists of diluting the effluent with water to comply with the discharge limits according to environmental standards, which is completely untechnical. This aspect is fundamental, since the footprint of industrial activities is altering the composition of water bodies and hindering the operation of water and wastewater treatment systems, which, in accordance with target 6.4 of the Sustainable Development Goals, aim to optimize quality and reduce water scarcity [45,46].
Another important indicator for business sustainability is the impact that implementing an AD stage in wastewater treatment has on air quality. This technological proposal would prevent the emission of 17.93 tons of CO2 per day. This is based on the high CO2 load generated in conventional treatment processes [47]. The amount of CO2 that does not enter the atmosphere is a vital element in the production of low-carbon footprint instant coffee, giving anaerobic treatment competitive advantages [48,49].
The presented indicators, while representing a preliminary process simulation, conclusively confirm the profound potential of integrating anaerobic digestion into the treatment train. The model approximates a 49% reduction in the organic load to the downstream Aerobic/DAF units, a decisive factor for reducing chemical consumption. Furthermore, the system transitions the facility’s energy profile to a net-positive status, with an energy recovery ratio indicating a 67% profit.
This is synergistically coupled with a dramatic enhancement in environmental performance, projecting a 150% increase in net CO2 mitigation and a 500% surge in biofertilizer production. Collectively, these results provide a compelling, quantitatively robust argument for the proposed technological integration. Consequently, the next critical step is the practical implementation and validation of this system at an industrial scale to confirm these transformative gains and optimize the operational parameters.
Additionally, the implementation of the evaluated technological proposal has a potential socio-economic impact, as it would increase the visibility of coffee-producing industries with international certifications and promote a sustainable Ecuadorian coffee economy.

4. Conclusions

This study establishes the viability of anaerobic digestion for the instant coffee industry through a novel methodological framework that integrates kinetic modeling, techno-economic analysis, and sustainability assessment. The superior performance and stability of the mesophilic regime, validated by its fit to the Stover–Kincannon and Grau’s second-order multicomponent substrate elimination models, provided the technical basis for a full-scale redesign. This integrated approach demonstrates that the technology not only achieves significant organic matter removal but also transforms wastewater into a resource, enabling a net-positive energy balance, substantial CO2 mitigation, and biofertilizer production. While economic profitability is conditional on market stability, the combined technical and environmental outcomes confirm that anaerobic digestion can be a cornerstone for implementing circular economy principles, adding tangible value to a traditionally polluting waste stream.
Future research should focus on the pilot-scale validation of this technological proposal to confirm the kinetic and energetic performance under real operational conditions. Furthermore, to mitigate the economic vulnerability identified in the analysis, it is crucial to explore synergistic strategies that combine green incentives like carbon credits with other market-based mechanisms, such as premiums for sustainably produced coffee. This integrated approach would enhance financial viability by stabilizing revenue streams and reducing dependency on volatile commodity prices.

Author Contributions

Conceptualization, R.A.C.-M., D.O.-M., J.-M.P.-C., J.M.R.-D. and I.P.-R.; data curation, R.A.C.-M., C.A.M.-P., D.O.-M. and J.-M.P.-C.; formal analysis, R.A.C.-M., C.A.M.-P., D.O.-M., J.-M.P.-C. and I.P.-R.; investigation, R.A.C.-M., C.A.M.-P., D.O.-M., J.-M.P.-C., J.M.R.-D. and I.P.-R.; methodology, R.A.C.-M., D.O.-M., J.-M.P.-C. and I.P.-R.; validation, D.O.-M., J.-M.P.-C. and I.P.-R.; resources, I.B.P.-A., M.D.S., N.B.-B., J.M.R.-D. and I.P.-R.; writing—original draft preparation, R.A.C.-M. and C.A.M.-P.; writing—review and editing, R.A.C.-M., C.A.M.-P., J.M.R.-D. and I.P.-R.; visualization, C.A.M.-P., D.O.-M., J.-M.P.-C. and I.P.-R.; supervision, J.M.R.-D. and I.P.-R.; project administration, I.P.-R.; funding acquisition, I.B.P.-A., M.D.S., N.B.-B., J.M.R.-D. and I.P.-R. All authors have read and agreed to the published version of the manuscript.

Funding

This research received no external funding.

Data Availability Statement

Data are contained within the article.

Acknowledgments

The authors would like to thank the Universidad Técnica de Manabí (UTM) for its support in conducting this research.

Conflicts of Interest

The authors declare no conflicts of interest.

References

  1. da Cruz Correia, P.F.; Mendes dos Reis, J.G.; Amorim, P.S.; Costa, J.S.d.; da Silva, M.T. Impacts of Brazilian Green Coffee Production and Its Logistical Corridors on the International Coffee Market. Logistics 2024, 8, 39. [Google Scholar] [CrossRef]
  2. de Melo Pereira, G.V.; de Carvalho Neto, D.P.; Magalhães Júnior, A.I.; do Prado, F.G.; Pagnoncelli, M.G.B.; Karp, S.G.; Soccol, C.R. Chapter Three—Chemical composition and health properties of coffee and coffee by-products. In Advances in Food and Nutrition Research; Toldrá, F., Ed.; Academic Press: Cambridge, MA, USA, 2020; pp. 65–96. [Google Scholar]
  3. Kittichotsatsawat, Y.; Tippayawong, N.; Tippayawong, K.Y. Prediction of arabica coffee production using artificial neural network and multiple linear regression techniques. Sci. Rep. 2022, 12, 14488. [Google Scholar] [CrossRef] [PubMed]
  4. International Coffee Organization. Coffee Report and Outlook; International Coffee Organization: Boston, MA, USA, 2023. [Google Scholar]
  5. Bondam, A.F.; Diolinda da Silveira, D.; Pozzada dos Santos, J.; Hoffmann, J.F. Phenolic compounds from coffee by-products: Extraction and application in the food and pharmaceutical industries. Trends Food Sci. Technol. 2022, 123, 172–186. [Google Scholar] [CrossRef]
  6. Said, N.S.M.; Abdullah, S.R.S.; Ismail, N.I.; Hasan, H.A.; Othman, A.R. Phytoremediation of real coffee industry effluent through a continuous two-stage constructed wetland system. Environ. Technol. Innov. 2020, 17, 100502. [Google Scholar] [CrossRef]
  7. Erazo, S.; Agudelo-Escobar, L.M. Determination of Electrogenic Potential and Removal of Organic Matter from Industrial Coffee Wastewater Using a Native Community in a Non-Conventional Microbial Fuel Cell. Processes 2023, 11, 373. [Google Scholar] [CrossRef]
  8. Agudelo-Escobar, L.M.; Cabrera, S.E.; Avignone Rossa, C. A Bioelectrochemical System for Waste Degradation and Energy Recovery From Industrial Coffee Wastewater. Front. Chem. Eng. 2022, 4, 814987. [Google Scholar] [CrossRef]
  9. Campos, R.C.; Pinto, V.R.A.; Melo, L.F.; Rocha, S.J.S.S.D.; Coimbra, J.S. New sustainable perspectives for “Coffee Wastewater” and other by-products: A critical review. Future Foods 2021, 4, 100058. [Google Scholar] [CrossRef]
  10. Selvamurugan, M.; Doraisamy, P.; Maheswari, M. An integrated treatment system for coffee processing wastewater using anaerobic and aerobic process. Ecol. Eng. 2010, 36, 1686–1690. [Google Scholar] [CrossRef]
  11. Córdova Mosquera, A.; Gómez-Salcedo, Y.; Riera, M.A.; Rodríguez-Díaz, J.M.; Pereda-Reyes, I. Influencia de los procesos oxidativos avanzados en la digestión anaerobia de aguas residuales de la industria del café. Cent. Azúcar 2019, 46, 89–100. [Google Scholar]
  12. Bułkowska, K.; Zielińska, M. Enhanced Anaerobic Digestion of Spent Coffee Grounds: A Review of Pretreatment Strategies for Sustainable Valorization. Energies 2025, 18, 4810. [Google Scholar] [CrossRef]
  13. Deng, Z.; Sun, C.; Ma, G.; Zhang, X.; Guo, H.; Zhang, T.; Zhang, Y.; Hu, Y.; Li, D.; Li, Y.-Y.; et al. Anaerobic treatment of nitrogenous industrial organic wastewater by carbon–neutral processes integrated with anaerobic digestion and partial nitritation/anammox: Critical review of current advances and future directions. Bioresour. Technol. 2025, 415, 131648. [Google Scholar] [CrossRef]
  14. Dai, C.; Yang, L.; Wang, J.; Li, D.; Zhang, Y.; Zhou, X. Enhancing anaerobic digestion of pharmaceutical industries wastewater with the composite addition of zero valent iron (ZVI) and granular activated carbon (GAC). Bioresour. Technol. 2022, 346, 126566. [Google Scholar] [CrossRef]
  15. Huang, X. The Promotion of Anaerobic Digestion Technology Upgrades in Waste Stream Treatment Plants for Circular Economy in the Context of “Dual Carbon”: Global Status, Development Trend, and Future Challenges. Water 2024, 16, 3718. [Google Scholar] [CrossRef]
  16. Pérez-Pérez, T.; Pereda-Reyes, I.; Correia, G.T.; Pozzi, E.; Kwong, W.H.; Oliva-Merencio, D.; Zaiat, M.; Montalvo, S.; Huiliñir, C. Performance of EGSB reactor using natural zeolite as support for treatment of synthetic swine wastewater. J. Environ. Chem. Eng. 2021, 9, 104922. [Google Scholar] [CrossRef]
  17. Jung, K.-W.; Kim, D.-H.; Lee, M.-Y.; Shin, H.-S. Two-stage UASB reactor converting coffee drink manufacturing wastewater to hydrogen and methane. Int. J. Hydrogen Energy 2012, 37, 7473–7481. [Google Scholar] [CrossRef]
  18. Rodrigues, C.V.; Camargo, F.P.; Lourenço, V.A.; Sakamoto, I.K.; Maintinguer, S.I.; Silva, E.L.; Varesche, M.B.A. Optimized conditions for methane production and energy valorization through co-digestion of solid and liquid wastes from coffee and beer industries using granular sludge and cattle manure. J. Environ. Chem. Eng. 2023, 11, 111250. [Google Scholar] [CrossRef]
  19. Manthos, G.; Zagklis, D.; Zafiri, C.; Kornaros, M. Techno-Economic Assessment of Anaerobic Digestion for Olive Oil Industry Effluents in Greece. Sustainability 2024, 16, 1886. [Google Scholar] [CrossRef]
  20. Fernandez, N.; Forster, C.F. A study of the operation of mesophilic and thermophilic anaerobic filters treating a synthetic coffee waste. Bioresour. Technol. 1993, 45, 223–227. [Google Scholar] [CrossRef]
  21. Charles, W.; Carnaje, N.P.; Cord-Ruwisch, R. Methane conversion efficiency as a simple control parameter for an anaerobic digester at high loading rates. Water Sci. Technol. 2011, 64, 534–540. [Google Scholar] [CrossRef]
  22. Michaud, S.; Bernet, N.; Buffière, P.; Roustan, M.; Moletta, R. Methane yield as a monitoring parameter for the start-up of anaerobic fixed film reactors. Water Res. 2002, 36, 1385–1391. [Google Scholar] [CrossRef] [PubMed]
  23. Standard Methods for the Examination of Water and Wastewater, 24th ed.; American Public Health Association: Washington, DC, USA, 2022; p. 1536.
  24. Kapdan, I.K. Kinetic analysis of dyestuff and COD removal from synthetic wastewater in an anaerobic packed column reactor. Process Biochem. 2005, 40, 2545–2550. [Google Scholar] [CrossRef]
  25. Grau, P.; Dohányos, M.; Chudoba, J. Kinetics of multicomponent substrate removal by activated sludge. Water Res. 1975, 9, 637–642. [Google Scholar] [CrossRef]
  26. Green, D.W.; Southard, M.Z. Perry’s Chemical Engineers’ Handbook, 9th ed.; McGraw-Hill Education: New York, NY, USA, 2019; p. 1. [Google Scholar]
  27. Van Der Berg, D.J.; Teke, G.M.; Görgens, J.F.; Van Rensburg, E. Predicting commercial-scale anaerobic digestion using biomethane potential. Renew. Energy 2024, 235, 121304. [Google Scholar] [CrossRef]
  28. Ashenafi Hailemariam, F.; Velmurugan, P.; Selvaraj, S.K. Treatment of wastewater from coffee (coffea arebica) industries using mixed culture Pseudomonas florescence and Escherichia coli bacteria. Mater. Today Proc. 2021, 46, 7396–7401. [Google Scholar] [CrossRef]
  29. Novita, E. Biodegradability Simulation of Coffee Wastewater Using Instant Coffee. Agric. Agric. Sci. Procedia 2016, 9, 217–229. [Google Scholar] [CrossRef]
  30. Amani, T.; Nosrati, M.; Sreekrishnan, T.R. Anaerobic digestion from the viewpoint of microbiological, chemical, and operational aspects—A review. Environ. Rev. 2010, 18, 255–278. [Google Scholar] [CrossRef]
  31. Dinsdale, R.M.; Hawkes, F.R.; Hawkes, D.L. The mesophilic and thermophilic anaerobic digestion of coffee waste containing coffee grounds. Water Res. 1996, 30, 371–377. [Google Scholar] [CrossRef]
  32. Aslanzadeh, S.; Rajendran, K.; Taherzadeh, M.J. A comparative study between single-and two-stage anaerobic digestion processes: Effects of organic loading rate and hydraulic retention time. Int. Biodeterior. Biodegrad. 2014, 95, 181–188. [Google Scholar] [CrossRef]
  33. Cruz-Salomón, A.; Ríos-Valdovinos, E.; Pola-Albores, F.; Lagunas-Rivera, S.; Meza-Gordillo, R.; Ruíz-Valdiviezo, V.M. Evaluation of hydraulic retention time on treatment of coffee processing wastewater (CPWW) in EGSB bioreactor. Sustainability 2017, 10, 83. [Google Scholar] [CrossRef]
  34. Cárdenas-Cleves, L.M.; Marmolejo-Rebellón, L.F.; Torres-Lozada, P. Anaerobic Codigestion of Sugarcane Press Mud with Food Waste: Effects on Hydrolysis Stage, Methane Yield, and Synergistic Effects. Int. J. Chem. Eng. 2018, 2018, 9351848. [Google Scholar] [CrossRef]
  35. Raposo, F.; De la Rubia, M.A.; Fernández-Cegrí, V.; Borja, R. Anaerobic digestion of solid organic substrates in batch mode: An overview relating to methane yields and experimental procedures. Renew. Sustain. Energy Rev. 2012, 16, 861–877. [Google Scholar] [CrossRef]
  36. Manchala, K.R.; Sun, Y.; Zhang, D.; Wang, Z.-W. Anaerobic Digestion Modelling. In Advances in Bioenergy; Elsevier: Amsterdam, Netherlands, 2017; Volume 2, pp. 69–141. [Google Scholar]
  37. Padilla-Gasca, E.; López-López, A. Kinetics of Organic Matter Degradation in an Upflow Anaerobic Filter Using Slaughterhouse Wastewater. J. Bioremed. Biodegrad. 2010, 1, 106. [Google Scholar] [CrossRef]
  38. Okoli, C.S.; Okonkwo, P.C. Substrate Reduction Kinetics and Performance Evaluation of Fluidized-Bed Reactor for Treatment of Brewery Wastewater. Niger. J. Technol. 2015, 35, 91–96. [Google Scholar] [CrossRef]
  39. Sumantri, I.; Budiyono, B.; Purwanto, P. Kinetic Study of Anaerobic Digestion of Ketchup Industry Wastewater in a Three-stages Anaerobic Baffled Reactor (ABR). Bull. Chem. React. Eng. Catal. 2019, 14, 326–335. [Google Scholar] [CrossRef]
  40. Li, Y.; Lu, J.; Xu, F.; Li, Y.; Li, D.; Wang, G.; Li, S.; Zhang, H.; Wu, Y.; Shah, A.; et al. Reactor performance and economic evaluation of anaerobic co-digestion of dairy manure with corn stover and tomato residues under liquid, hemi-solid, and solid state conditions. Bioresour. Technol. 2018, 270, 103–112. [Google Scholar] [CrossRef]
  41. Li, Y.; Han, Y.; Zhang, Y.; Luo, W.; Li, G. Anaerobic digestion of different agricultural wastes: A techno-economic assessment. Bioresour. Technol. 2020, 315, 123836. [Google Scholar] [CrossRef]
  42. Mainardis, M.; Flaibani, S.; Mazzolini, F.; Peressotti, A.; Goi, D. Techno-economic analysis of anaerobic digestion implementation in small Italian breweries and evaluation of biochar and granular activated carbon addition effect on methane yield. J. Environ. Chem. Eng. 2019, 7, 103184. [Google Scholar] [CrossRef]
  43. Salsabil, M.R.; Laurent, J.; Casellas, M.; Dagot, C. Techno-economic evaluation of thermal treatment, ozonation and sonication for the reduction of wastewater biomass volume before aerobic or anaerobic digestion. J. Hazard. Mater. 2010, 174, 323–333. [Google Scholar] [CrossRef]
  44. Carlini, M.; Mosconi, E.; Castellucci, S.; Villarini, M.; Colantoni, A. An Economical Evaluation of Anaerobic Digestion Plants Fed with Organic Agro-Industrial Waste. Energies 2017, 10, 1165. [Google Scholar] [CrossRef]
  45. Unver, O.; Bhaduri, A.; Hoogeveen, J. Water-use efficiency and productivity improvements towards a sustainable pathway for meeting future water demand. Water Secur. 2017, 1, 21–27. [Google Scholar] [CrossRef]
  46. Vanham, D.; Mekonnen, M.M. The scarcity-weighted water footprint provides unreliable water sustainability scoring. Sci. Total Environ. 2021, 756, 143992. [Google Scholar] [CrossRef] [PubMed]
  47. Safieddin Ardebili, S.M. Green electricity generation potential from biogas produced by anaerobic digestion of farm animal waste and agriculture residues in Iran. Renew. Energy 2020, 154, 29–37. [Google Scholar] [CrossRef]
  48. Qian, S.; Chen, L.; Xu, S.; Zeng, C.; Lian, X.; Xia, Z.; Zou, J. Research on Methane-Rich Biogas Production Technology by Anaerobic Digestion Under Carbon Neutrality: A Review. Sustainability 2025, 17, 1425. [Google Scholar] [CrossRef]
  49. Simeonov, I.; Chorukova, E.; Kabaivanova, L. Two-Stage Anaerobic Digestion for Green Energy Production: A Review. Processes 2025, 13, 294. [Google Scholar] [CrossRef]
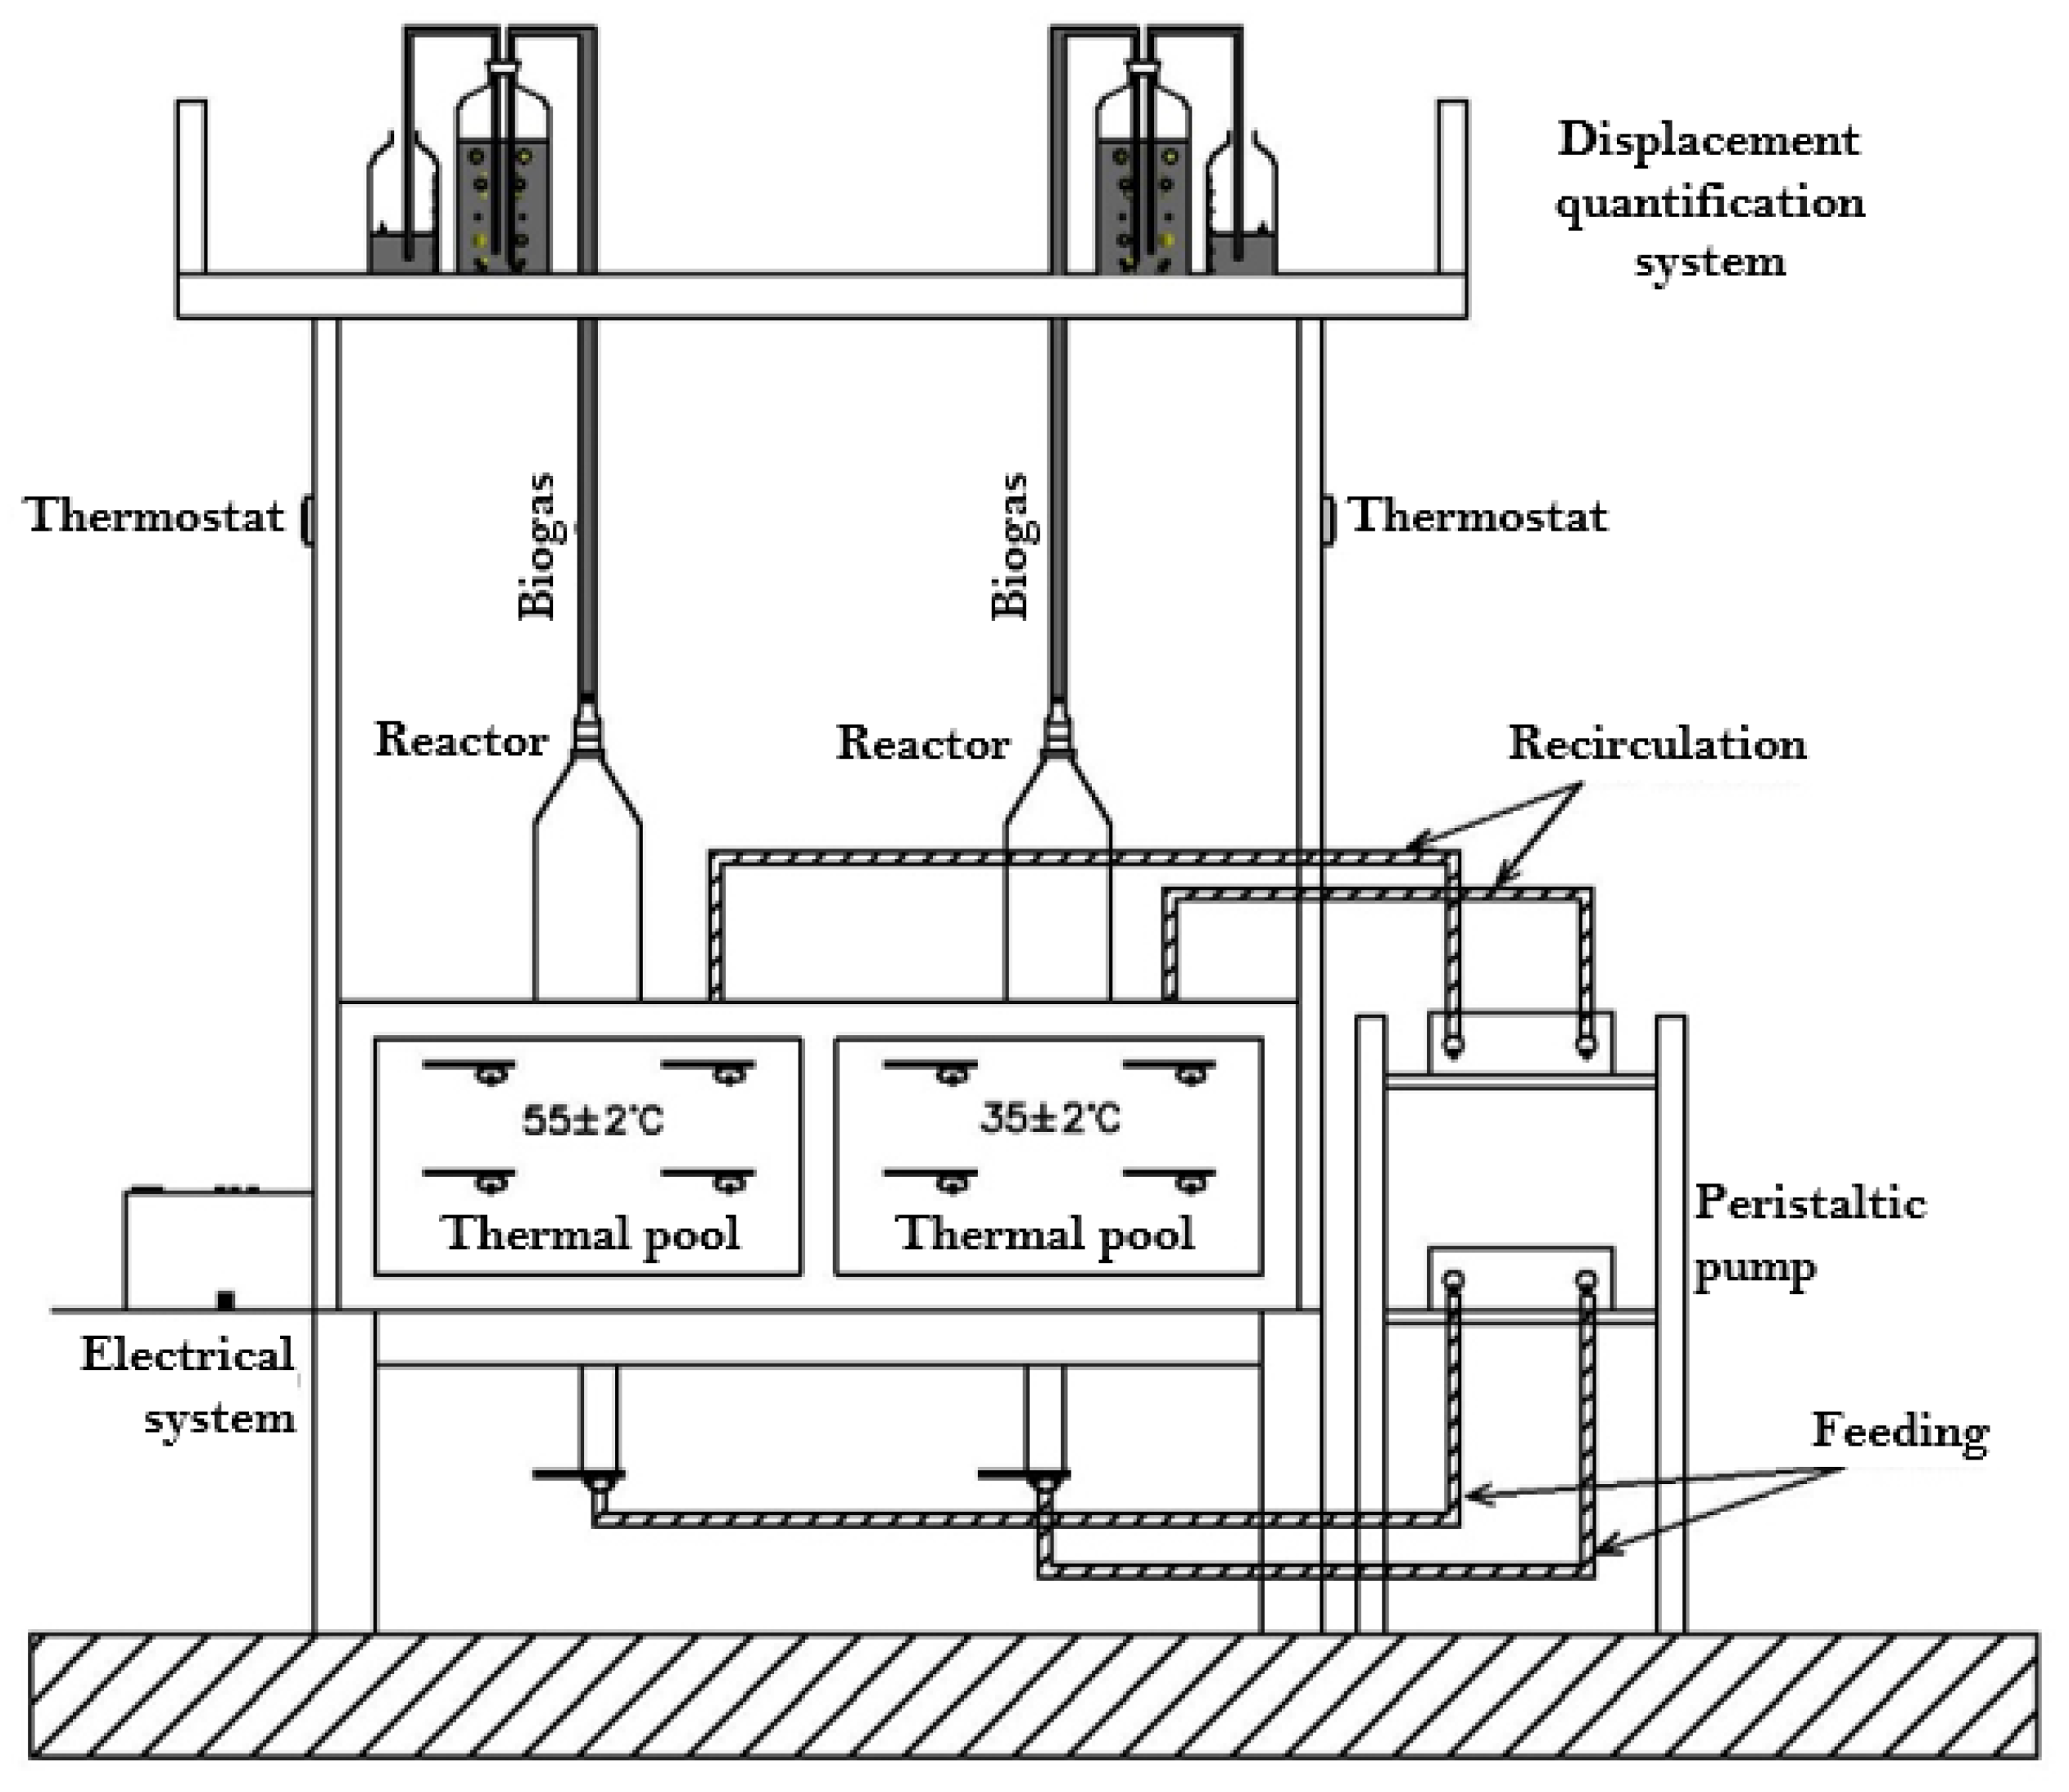
Figure 1. UAF reactor system for anaerobic digestion of instant coffee wastewater.
Water 17 03207 g001
Figure 2. Conventional diagram of conventional wastewater treatment in the coffee industry.
Water 17 03207 g002
Figure 3. Performance of the thermophilic UAF reactor for anaerobic digestion of instant coffee wastewater at 55 ± 2 °C. Gray circles represent the applied OLR.
Water 17 03207 g003
Figure 4. Performance of the mesophilic UAF reactor for anaerobic digestion of instant coffee wastewater at 35 ± 2 °C. Gray circles represent the applied OLR.
Water 17 03207 g004
Figure 5. Methane yield versus Hydraulic Retention Time for mesophilic and thermophilic UAF reactor.
Water 17 03207 g005
Figure 6. Validation of the modified Stover–Kincannon model for the anaerobic digestion of instant coffee wastewater in mesophilic and thermophilic UAF reactors.
Water 17 03207 g006
Figure 7. Validation of the Grau second-order model for the anaerobic digestion of instant coffee wastewater in mesophilic and thermophilic UAF reactors.
Water 17 03207 g007
Figure 8. Technological diagram with the technological proposal for the treatment of wastewater from the instant coffee industry.
Water 17 03207 g008
Figure 9. Sensitivity analysis to assess the effect of increased profits on monetary economic indicators. (a) NPV, IRR, and PBP based on incremental profits. (b) Incremental profits and PBP based on the price per 60-kg bag of coffee.
Water 17 03207 g009
Figure 10. Comparative radial analysis of treatment performance: Conventional vs. Anaerobic reactor-enhanced system.
Water 17 03207 g010
Table 1. Methods and equipment used for the characterization of physical, chemical, and biological parameters.
ParameterMethodEquipment
pHPotentiometricFisher Scientific Accumet AB150 (Thermo Fisher Scientific, Singapore)
Salinity, conductivity, dissolved oxygenMultiparametric measurementHANNA HI98194 (Hanna Instruments, Woonsocket, RI, USA)
CODUV-Vis spectrophotometerThermo Scientific-Evolution 60S (Thermo Fisher Scientific, Waltham, MA, USA)
BOD5RespirometricBOD Hach-BOD Trak II (Hach, Düsseldorf, Germany)
TS, VS, and VSSGravimetricMemmert D-91126 (Memmert GmbH + Co. KG, Schwabach, Germany)
VFA/Alc ratioPotentiometric/titrationFisher Scientific Accumet AB150
Tannin concentrationUV-Vis spectrophotometerThermo Scientific-Evolution 60S
BOD: Biochemical oxygen demand, TS: Total solids, VS: Volatile solids, VSS: Volatile suspended solids, VFA: Volatile fatty acids, Alc: Alkalinity.
Table 2. Names of the equipment and systems described in the diagram of the treatment plant.
CodeDenomination
FGRotary filter
BCCentrifugal pump
TEEqualization tank
RReactor
SAAir blower
SSedimentation tank
TStorage tank
BDDosing pump
FPFilter press
ƳCoagulation–flocculation mixer
COCompressor
QGas burner
AGGas storage tank
RCCombustion unit
Table 3. Biophysical indicators evaluated.
ParameterEquation
Energy generated/energy consumedkWhe generated/kWhe consumed
Effectively treated wastewater flow/total productionm3/tons of coffee
COD load to Aerobic & DAFValue (kgCOD d−1)
Electricity generation/total productionkWhe generated/tons of coffee
CO2 avoidedValue (tons CO2)
COD discharged wastewater/COD initialCOD discharged wastewater/COD initial
Biofertilizer production/total productionBiofertilizer production/tons of coffee
Table 4. Characterization of simulated wastewater and wastewater samples from the coffee industry.
ParameterUnitsWastewater from the Instant Coffee IndustrySimulated Wastewater
pH 5.25 ± 1.255.5 ± 0.5
Salinity%1.17 ± 0.540.35 ± 0.11
Dissolved oxygenmg L−13.3 ± 2.97.46 ± 1.6
BOD5mg L−13397.8 ± 1090.33387.8 ± 139.7
CODmg L−16124.8 ± 2608.27537.96 ± 84.64
Biodegradability index 0.5 ± 0.090.44 ± 0.017
Tanninsmg L−1333.1 ± 45.4416.01 ± 46.9
Table 5. Principal mass balance of the addition of the anaerobic unit with combined heat and power generation as modification to the current treatment regimen.
ProcessPrincipal ParametersOther Remarks
Anaerobic digestion (UAF)Effective volume: 1530 m3, HRT: 7.5 d, COD: 7.5 kgCOD m−3
Biogas generation: 623 m3
It is placed before the existing aerobic reactor
Biogas biodesulphurizationCapacity: 80 m3
Biogas upgraded: 540 m3
Upgrade biogas from 52% to 60% of methane content
CHP unitElectric energy: 1117.9 kWh
Thermal energy: 1441.9 kWh
Revenues for energy sale
Separation processes Semisolid sludge as biofertilizer: 50.6 t d−1Revenues for biofertilizer sale
Table 6. Parameters of the biophysical sustainability indicator system.
ParameterValueUnit
Instant coffee production11.5t d−1
Volume of wastewater generated209m3 d−1
Volume of biogas produced623.13m3 d−1
Volume of methane produced236.79m3 d−1
Amount of CO2 not emitted due to the application of anaerobic treatment17.93t d−1
Amount of CO2 not emitted in the conventional treatment7.17t d−1
Amount of electrical energy consumed in the technological proposal669.96kWhe d−1
Amount of electrical energy generated from the biogas produced1117.92kWhe d−1
COD in affluent7500mg L−1
COD load to the conventional treatment/DAF197.5kg d−1
COD discharged wastewater in the conventional treatment946mg L−1
COD load to the AD + conventional treatment/DAF101.4kg d−1
COD discharged wastewater in the AD + conventional treatment/DAF485mg L−1
Amount of biofertilizer produced in the conventional treatment2.1m3 d−1
Amount of biofertilizer produced in the AD + conventional treatment/DAF12.6m3 d−1
Table 7. Biophysical indicators of sustainability for the instant coffee production study case (with and without anaerobic treatment).
IndicatorsConventional Treatment PlantTreatment Plant with AD
Energy generated/energy consumed0.05.0
Effectively treated wastewater flow/total production5.05.0
COD load to Aerobic & DAF2.55.0
Electricity generation/total production0.05.0
CO2 avoided4.44.7
COD discharged wastewaters2.55.0
Biofertilizer production0.74.3
Disclaimer/Publisher’s Note: The statements, opinions and data contained in all publications are solely those of the individual author(s) and contributor(s) and not of MDPI and/or the editor(s). MDPI and/or the editor(s) disclaim responsibility for any injury to people or property resulting from any ideas, methods, instructions or products referred to in the content.