Article

In Situ Tests on the Flexural Strength and Effective Elastic Modulus of Brackish Ice During Different Ice Periods

1
State Key Laboratory of Structural Analysis, Optimization and CAE Software for Industrial Equipment, Dalian University of Technology, Dalian 116024, China
2
China Ship Scientific Research Center, National Key Laboratory of Science and Technology on Hydrodynamics, Wuxi 214082, China
3
State Key Laboratory of Coastal and Offshore Engineering, Dalian University of Technology, Dalian 116024, China
*
Author to whom correspondence should be addressed.
Water 2025, 17(22), 3189; https://doi.org/10.3390/w17223189
Submission received: 17 September 2025 / Revised: 5 November 2025 / Accepted: 5 November 2025 / Published: 7 November 2025

Abstract

Global warming reduces the thickness and duration of seasonal lake ice, increasing the risk of ice cover failure. To investigate the bending behavior of ice cover, six groups of full-scale cantilever beam tests were conducted on a brackish water lake during the winter of 2023–2024, covering the following three ice periods: growth, stable, and melt. A total of 16 upward-loaded beams and 24 downward-loaded beams were tested. The results showed that the flexural strength of brackish ice was 374.21 ± 99.93 kPa, and the effective elastic modulus was 2.77 ± 0.93 GPa. The square root of bulk porosity, fitted with an exponential function, is the optimal predictor of flexural performance. Both flexural strength and effective elastic modulus systematically decreased with increasing porosity, and empirical regression formulas were established. On average, downward-loaded flexural strength was approximately 17.3% to 38.8% higher than upward-loaded strength, whereas elastic modulus showed no significant difference between the two loading directions. Flexural mechanical properties during the melt period reduced significantly, with a strength and modulus about 33.0% to 61.1% lower than those in the growth and stable periods. Comparisons with existing datasets demonstrate that the mechanical properties of brackish ice are lower than those of freshwater ice but higher than those of sea ice. This study provides new in situ data on the full-scale flexural mechanical properties of brackish ice and offers an important basis for assessing ice loads in lakes and estuarine environments under climate change.

1. Introduction

Global warming has exerted significant impacts on the cryosphere [1,2,3]. For lake ice, both observations and modelings have demonstrated that seasonal-ice-covered lakes exhibit reduced ice duration and thickness [4,5]. In particular, the increasing frequency of winter extreme weather events introduces additional uncertainties to ice conditions [6]. As ice temperature rises, ice cover becomes prone to fracturing under the effects of wave [7]. Such ice break-up can substantially compromise the safety of ice-related activities.
Flexural failure is one of the primary modes of ice fracture. The flexural strength of lake ice serves as a fundamental mechanical parameter that governs the load-bearing capacity and fracture resistance of ice cover [8]. Experiments for determining the flexural strength and effective elastic modulus of ice mainly employ two approaches: simple beam tests and cantilever beam tests, both based on linear elasticity theory [9]. Simple beam tests (three-point and four-point bending) are typically performed on small-scale samples extracted from the ice cover, with tests conducted in situ or under controlled laboratory conditions. However, most of these tests rely on “dry” specimens preserved at uniform subzero temperatures, which fail to reproduce the through-thickness temperature gradients and brine connectivity typical of natural floating ice. To address this limitation, Wei et al. [10,11,12] developed a laboratory freezing model capable of reproducing realistic thermal gradients and liquid brine inclusions, and investigated the fracture toughness and elastic modulus of columnar saline ice under such conditions. Their experiments demonstrated that floating saline ice with vertical temperature gradients and brine interconnectivity exhibited an elastic modulus 21% lower than that of dry, isothermal specimens. Moreover, the fracture toughness and flexural strength of the floating, relatively warm samples were only about 30% of those measured in cold, dry specimens. These findings highlight the significant influence of thermal and brine structures on the mechanical behavior of ice and emphasize the importance of reproducing realistic environmental conditions. However, even laboratory experiments that simulate thermal gradients cannot fully capture the scale effects, crystal textures, and structural heterogeneity inherent to natural ice covers. To capture the mechanical behavior of ice under true in situ conditions, full-scale field methods have been developed [13,14,15,16]. Marchenko et al. [14] and Voermans et al. [15] estimated the effective elastic modulus of sea and lake ice in situ by analyzing the vibration of fixed-end floating ice beams and the low-frequency dispersion of surface waves, respectively. These methods are non-destructive and dynamic, allowing for assessment of the overall elastic response of natural ice covers. Complementary to these techniques, destructive full-scale tests, such as cantilever beam tests, can directly measure both flexural strength and effective elastic modulus. Karulina et al. [16] conducted more than seventy full-scale cantilever beam tests on both sea ice and freshwater ice. Their results showed that the flexural strength of freshwater ice was significantly higher than that of sea ice, and that the loading direction had little influence on the measured strength. In addition to the above methods, some studies have also adopted disc center-loading tests [17,18]; however, this approach is limited to the determination of flexural strength only. Overall, these methods differ not only in environmental realism but also in scale, which exerts a major influence on measured strength. Aly et al. [9] systematically quantified this scale effect through regression analysis of a multi-scale experimental database, establishing a relationship between flexural strength and beam volume. Their results confirmed that larger specimens systematically exhibit lower apparent strength, primarily due to the increased probability of internal flaws and structural heterogeneity.
The flexural strength and effective elastic modulus of ice are dependent on multiple factors, including intrinsic material properties (e.g., temperature, brine volume) and extrinsic testing conditions (e.g., loading configuration, sample size). Timco and O’Brien established a negative exponential relationship between sea ice flexural strength and the square root of brine volume through analysis of considerable data points [19]. Lainey and Tinawi found that both flexural strength and effective elastic modulus of sea ice increased as the temperature decreased [20]. Han et al. further identified distinct strain rate dependencies in the effective elastic modulus of freshwater ice. They observed that the effective elastic modulus showed no significant correlation with strain rate at temperatures above −2 °C, but increased with increasing strain rate at temperatures below −5 °C [21]. Moreover, cyclic loading has been shown to enhance the flexural strength of both freshwater and saline ice [22,23]. In addition to cyclic effects, the internal pore composition also strongly influences ice mechanics. Recent experiments on gas-enriched sea ice showed that both flexural strength and strain modulus decrease with increasing porosity, but brine inclusions cause greater weakening than gas [24]. Gas-dominated ice retained a higher strength and stiffness at comparable porosity levels, indicating that pore composition and connectivity, rather than total porosity alone, govern the bending behavior of natural ice. Despite these advances, most previous studies have focused on freshwater or sea ice, with little systematic attention given to the brackish ice commonly found in estuaries or semi-enclosed lakes. The physical properties of brackish ice (e.g., salinity, density, and porosity) lie between those of freshwater ice and sea ice, yet its mechanical behavior remains poorly understood. Moreover, while many empirical relationships between ice mechanical parameters and physical properties have been established, few studies have systematically explored the optimal predictors of full-scale flexural performance, particularly when considering loading direction and layered ice properties.
To address these gaps, this study conducted full-scale cantilever beam tests on brackish ice at Hanzhang Lake, northern China, during the winter of 2023–2024. This method was chosen for its ability to capture the in situ flexural behavior of the ice cover at full scale while simultaneously determining both flexural strength and effective elastic modulus, thus ensuring direct comparability with previous sea and freshwater ice datasets. In combination with observations of ice physical properties, the tests allowed a systematic evaluation of the relationships between physical conditions and flexural behavior. Special attention was given to the influence of loading direction and ice period, and the results were further compared with existing freshwater ice and sea ice datasets. This approach provides new insights into the flexural mechanical properties of brackish ice and their controlling factors.

2. Materials and Methods

2.1. Research Area

The field experiments were conducted at Hanzhang Lake (Figure 1), a natural lake situated in the northern temperate zone in China. The lake experiences complete freezing during winter, with the ice cover typically persisting from early December to mid-March. Typically, the mean air temperature during the freezing period is −4.4 °C, and the average winter precipitation is 35.7 mm. Notably, the snow accumulation duration accounts for only 20% of the total freezing period. Hanzhang Lake is located near the Bohai Sea estuary and is connected to the sea through a sluice gate, resulting in a water salinity range of 5–7 ppt. During winter, the sluice gate remains closed, isolating the lake from external inflows or outflows. Consequently, ice formation is primarily governed by thermodynamic processes, leading to a flat ice surface devoid of ridges. During the winter of 2023–2024, continuous records of ice thickness and air temperature were obtained at a fixed observation site. The monitoring results indicated a typical three-stage evolution. Figure 1d shows the variations in air temperature and ice thickness during the ice periods. From 9 December 2023 to 25 January 2024, the thickness steadily increased from less than 0.10 m to approximately 0.30 m, with a corresponding mean air temperature of −6.3 °C; this stage was defined as the growth period. From 26 January to 28 February, the thickness further increased to a peak of about 0.40 m and remained relatively stable, with a mean air temperature of −4.8 °C; this stage was defined as the stable period. From 29 February to 15 March, the air temperature rose to around 1.1 °C, the ice thickness gradually decreased to 0.23 m, with surface meltwater and porosity becoming evident. Subsequently, between 16 March and 18 March, the ice cover rapidly disintegrated and disappeared. This stage was defined as the melt period. Based on this ice period evolution, six groups of full-scale cantilever beam tests were conducted across the three ice periods.

2.2. Cantilever Beam Test

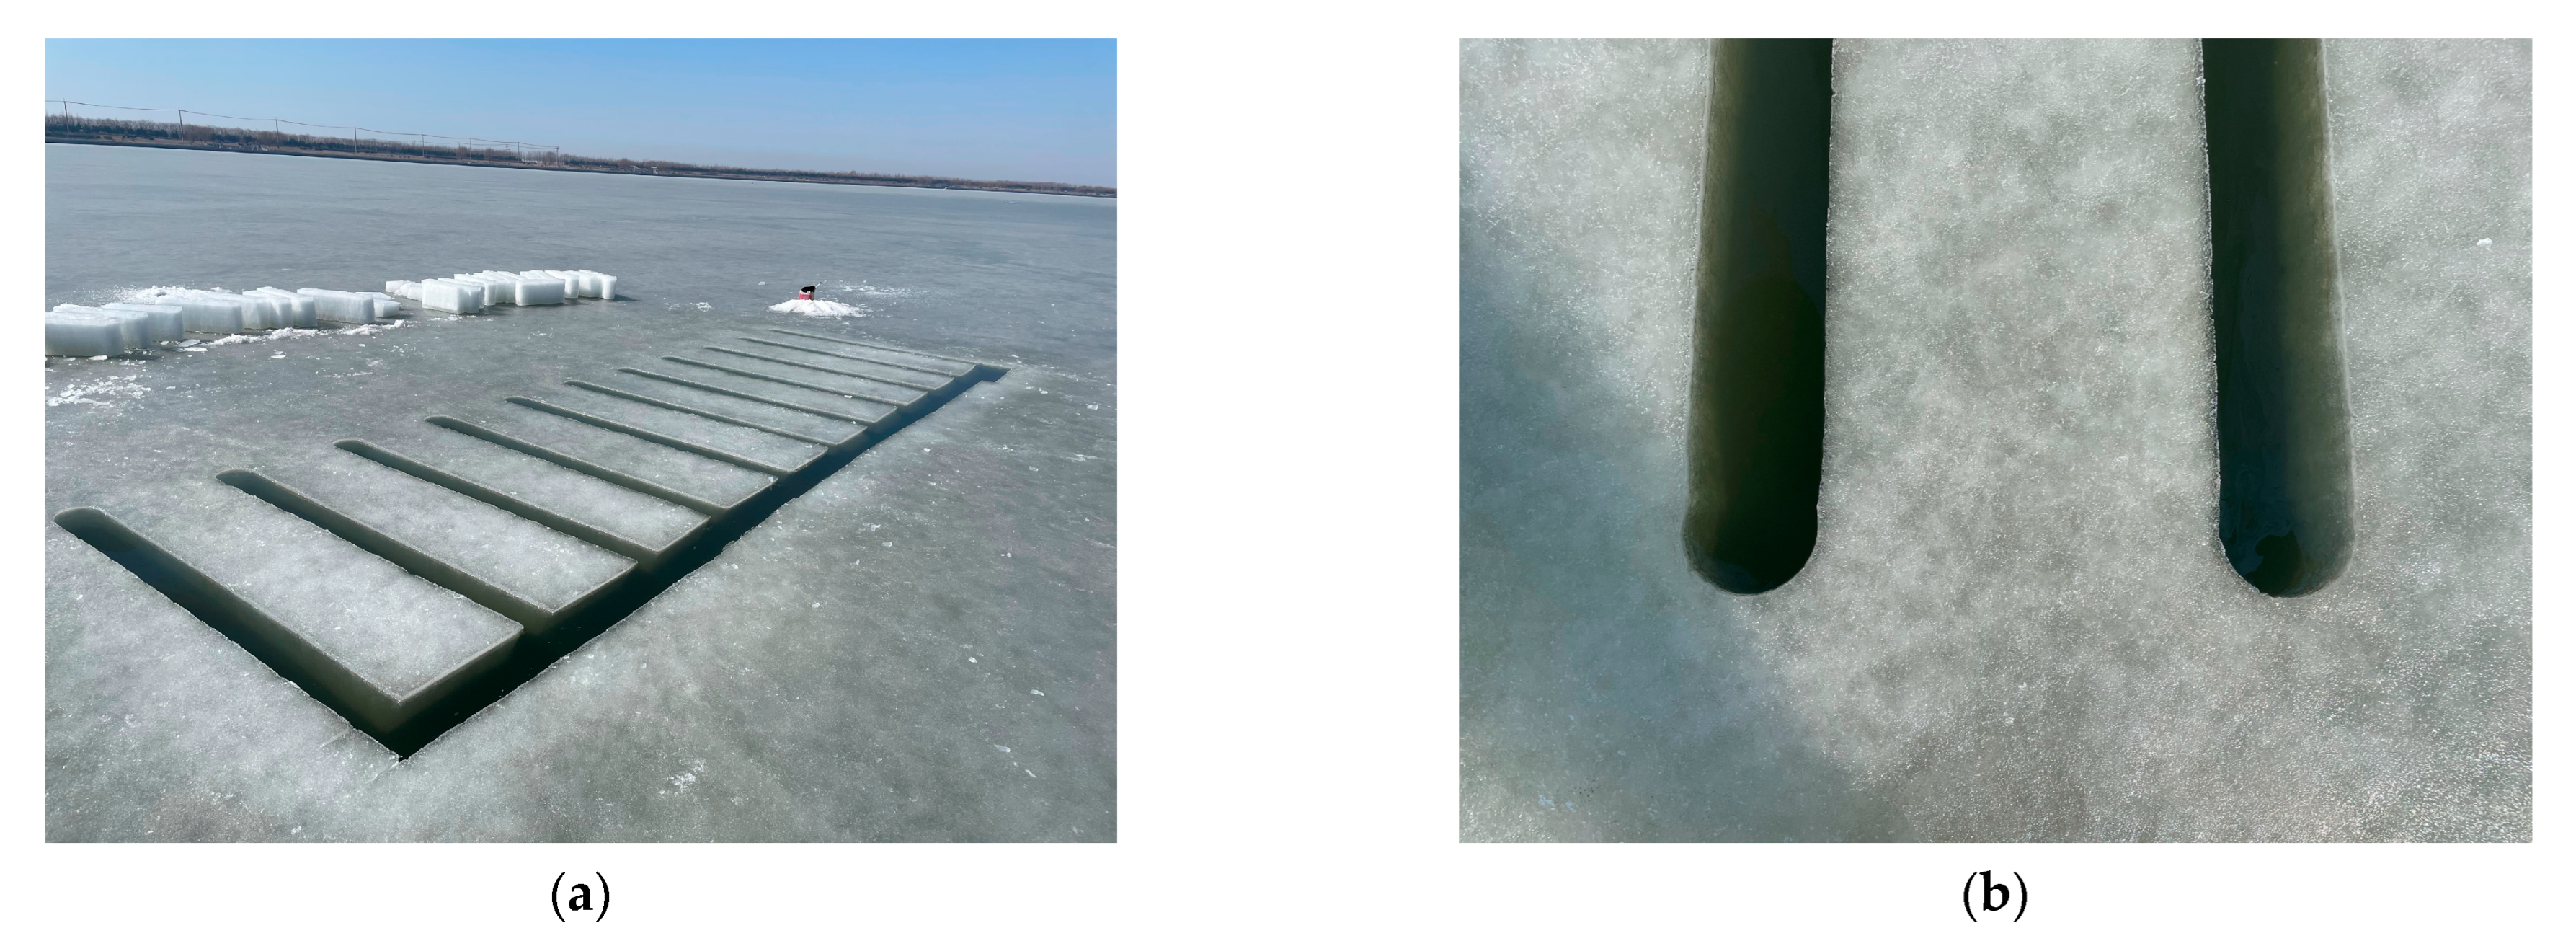
Full-scale cantilever beam tests were conducted to determine the flexural strength and effective elastic modulus of brackish ice during different ice periods. The tests were conducted from 17 January to 12 March, with corresponding ice thicknesses ranging from 0.28 to 0.45 m. All tests were conducted in areas free of visible cracks. If snow cover was present at the test site, it was removed manually using a shovel. During the first four tests, the ice surface was covered by approximately 3 to 4 cm of snow, which revealed a smooth surface after removal. Between the fourth and fifth tests, the surface snow experienced melting and refreezing due to solar radiation, resulting in a rougher ice surface. In the sixth test, conducted during the melting stage, the ice surface appeared porous with visible meltwater, which included both melted ice and water intruding upward from the underlying lake. At each test site, 4–10 cantilever beams were prepared using chainsaws (Dongcheng Power Tools Co., Ltd., Nantong, China), following the dimensional guidelines recommended by the International Association for Hydraulic Engineering and Research (IAHR). Each beam had a width of twice the ice thickness and a length of eight times the ice thickness (Figure 2a). To reduce stress concentrations at the beam root, a 20 cm diameter semi-circular notch was cut using an ice driller (Dongcheng Power Tools Co., Ltd., Nantong, China) [25,26]. Additionally, a spacing of approximately 20 cm was maintained between adjacent beams to prevent fracture propagation and mutual interference (Figure 2b).
The experimental setup integrated sensors, data acquisition devices, and a loading system (Figure 3). A load sensor (10,000 N range, ±5 N accuracy) (Changsha Taihe Electronic Equipment Co., Ltd., Changsha, China) was used to measure the applied force, and a linear variable differential transformer (LVDT)displacement sensor (50 mm range, ±0.05 mm accuracy) (Beijing King Sensor Technology Co., Ltd., Beijing, China) was used to measure the displacement of the cantilever end of ice beams. Both force and displacement signals were synchronously recorded at 1000 Hz. The loading system consisted of a stainless-steel A-frame structure for downward loading and a rake-type frame with four steel bars for upward loading (Dalian Northern Analytical Instruments Co., Ltd., Dalian, China). The steel bars were welded to the A-frame′s horizontal beam at a distance exceeding ice thickness. The load was exerted at the beam end. A hinged connection was implemented between the loading lever and A-frame to ensure consistently vertical downward force application. The loading lever was manually actuated upward and downward. The loading system was stabilized by a support base secured to the ice surface with ice cones to prevent slippage during tests. The loading time from applying force to beam failure was no more than 10 s. After the beam failure, the distance between the beam end to the failure crack was measured. Afterwards, a small ice block was taken through the ice thickness at the beam root to measure the ice temperature, salinity, and density (see section below).
In summary, the cantilever beam tests in this study were conducted under controlled conditions, with strict regulation of beam preparation, loading configuration, and sensor measurements to ensure data reliability. The six groups of tests covered different ice periods, beam dimensions, and loading configurations. The detailed conditions of each group of tests, including test date, ice period, ice thickness, number of beams, and ice surface characteristics, are summarized in Table 1. For each test set, an equal number of upward- and downward-loaded beams was attempted whenever possible. However, in the fifth test, only one upward-loaded test was completed because the vertical cut at the beam end did not perfectly match the rake-type A-frame, leading to hook detachment during upward loading.
In the cantilever beam tests, the flexural strength and effective modulus were determined from Equations (1) and (2), respectively:
σ f = 6 P L c b h 2
E = 4 P L c 3 b h 3 δ c
where σf and E are the flexural strength and effective modulus derived from cantilever beam tests (in Pa), P is the load at the point of beam failure (in N), δc is the deflection at the beam cantilever end (in m), Lc is the distance between the beam end to the failure crack (in m), b is the beam width (in m), and h is the ice thickness (in m).

2.3. Ice Physical Properties

Following the cantilever beam tests, measurements of ice temperature, salinity, and density were conducted by extracting a 10 × 10 cm cross-section ice block through the full thickness at the beam root. Immediately after lifting the ice block, ice temperature measurements were performed using a fast-response probe thermometer (accuracy ±0.2 °C) (Testo Instruments International Trading (Shanghai) Co., Ltd., Shanghai, China) inserted into 2 mm diameter holes drilled to the block center spaced at 5 cm intervals along the ice thickness. The ice block was then rapidly transported to the lakeside low-temperature laboratory for density measurements. Ice density was determined using the mass/volume method. The ice block was first sectioned along the thickness into 5 cm long segments, which were then machined into 4 cm cubes using a band saw (Hangzhou ABCH Intelligent Technology Co., Ltd., Hangzhou, China). The mass of the cube was weighed using a balance (±0.1 g) (Shenzhen Meifu Electronics Co., Ltd., Shenzhen, China), and the volume was calculated based on the dimensions measured using a caliper (±0.02 mm) (Delixi Instruments Co., Ltd., Shanghai, China). The uncertainty of the estimated ice density can be evaluated with an error propagation analysis [27,28]. Here, the accuracy of dimension measurement was ±0.02 mm and an ice cube typically had a mass of 40–70 g, and thus, the uncertainty due to the measurement error was approximately 5%. Subsequently, the ice cubes were melted for salinity measurements using a salinometer (accuracy ±0.1 psu) (Shanghai Bangwo Instrument Equipment Co., Ltd., Shanghai, China) at a room temperature. The brine and gas volume fractions, as well as porosity of the ice beam, were then determined using ice temperature, salinity, and density according to the method of Cox and Weeks for below −2 °C [29], and for the interval (−2, 0) °C, that by Leppäranta and Manninen [30].
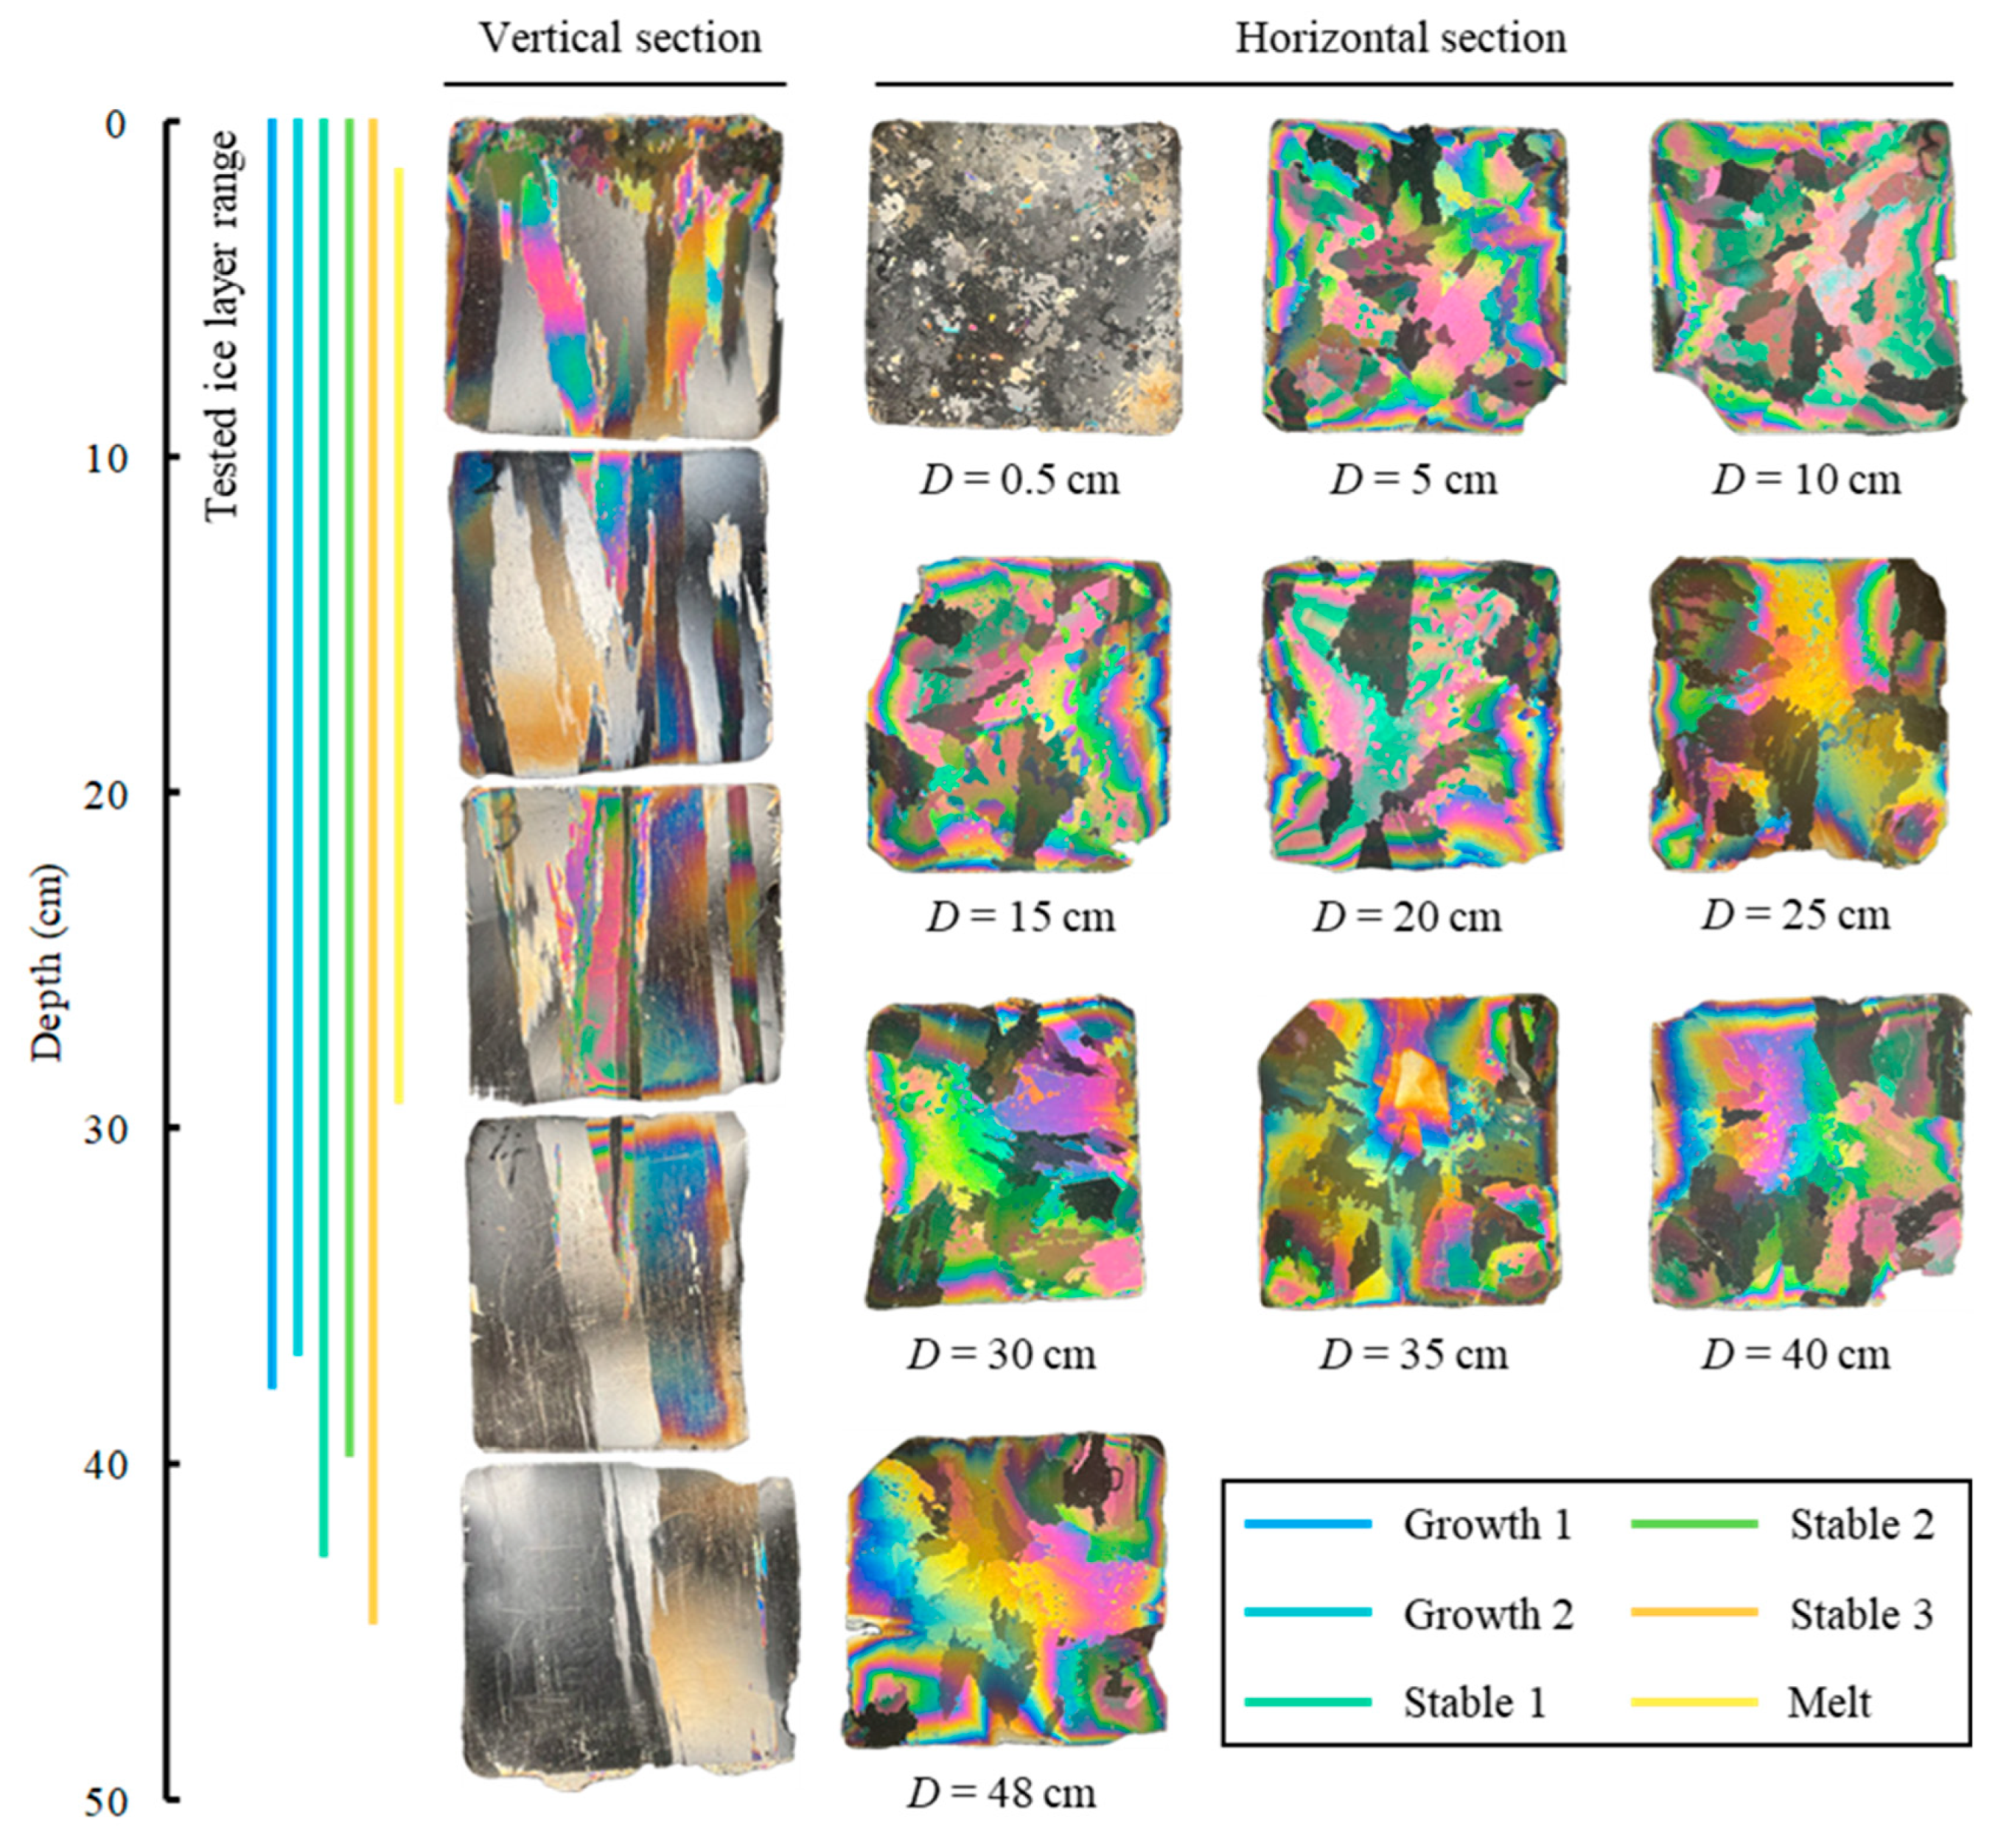
Observations of ice crystal structures were conducted in the low-temperature laboratory during the stable ice period (5 February 2024) when ice thickness reached its maximum. Both vertical and horizontal sections were prepared by first cutting 2 mm thick sections at 5 cm intervals along the ice thickness using a band saw. These thick sections were attached to glass plates and thinned down further to an approximate 0.5 mm thickness using a planer. The thin slices were placed on a universal stage (Dalian Northern Analytical Instruments Co., Ltd., Dalian, China) to observe the crystal structures under crossed polarized light, recorded by photography.

3. Results

3.1. Physical Properties of Ice Layers

3.1.1. Crystal Structure

Figure 4 presents thin-slice observations prepared both parallel and perpendicular to the ice surface. The colored vertical lines on the left indicate the tested ice layer depth ranges of each test. According to Eicken’s classification scheme [31], the upper 0–3 cm of the ice consisted of more than 80% polygonal granular crystals, indicating granular ice, while the section from 3 to 48 cm was composed of vertically aligned columnar crystals typical of columnar ice. The vertical thin sections show that granular ice accounted for only a small fraction of the total thickness, and no distinct transition zone was observed between the granular and columnar ice. In the 3–15 cm layer, the columnar crystals were less than 10 cm long along the ice thickness, tightly packed, and evenly distributed. In contrast, crystals between 15 and 48 cm increased significantly in length (15–30 cm), exhibited larger widths, and showed a marked reduction in the number of complete crystals within the observation area. The horizontal thin slices reveal that at depths of D = 5 cm and D = 10 cm, a larger number of intact crystals with elongated shapes were observed. When D ≥ 25 cm, the crystals became fewer in number and more equant in shape. This stratification indicates a growth transition from an initial rapid freezing stage, with weaker dynamic influences, to a subsequent thermodynamically dominated regime characterized by steady vertical heat flux. The granular-to-columnar interface was sharp, with no visible discontinuities or refrozen boundaries, suggesting uninterrupted in situ growth. The absence of prominent brine channels or sediment inclusions further supports the thermodynamic stability of the ice formation. The tested ice thicknesses and corresponding crystal structure ranges for each experiment are marked by colored vertical lines. It is noteworthy that the locations for different tests were not identical, so the observed ice thickness did not strictly follow the sequence of thickening and thinning. In particular, the depth of tested ice cover during the melt period did not start from the surface (0 cm) because the uppermost layer had already undergone partial melting.

3.1.2. Physical Parameters

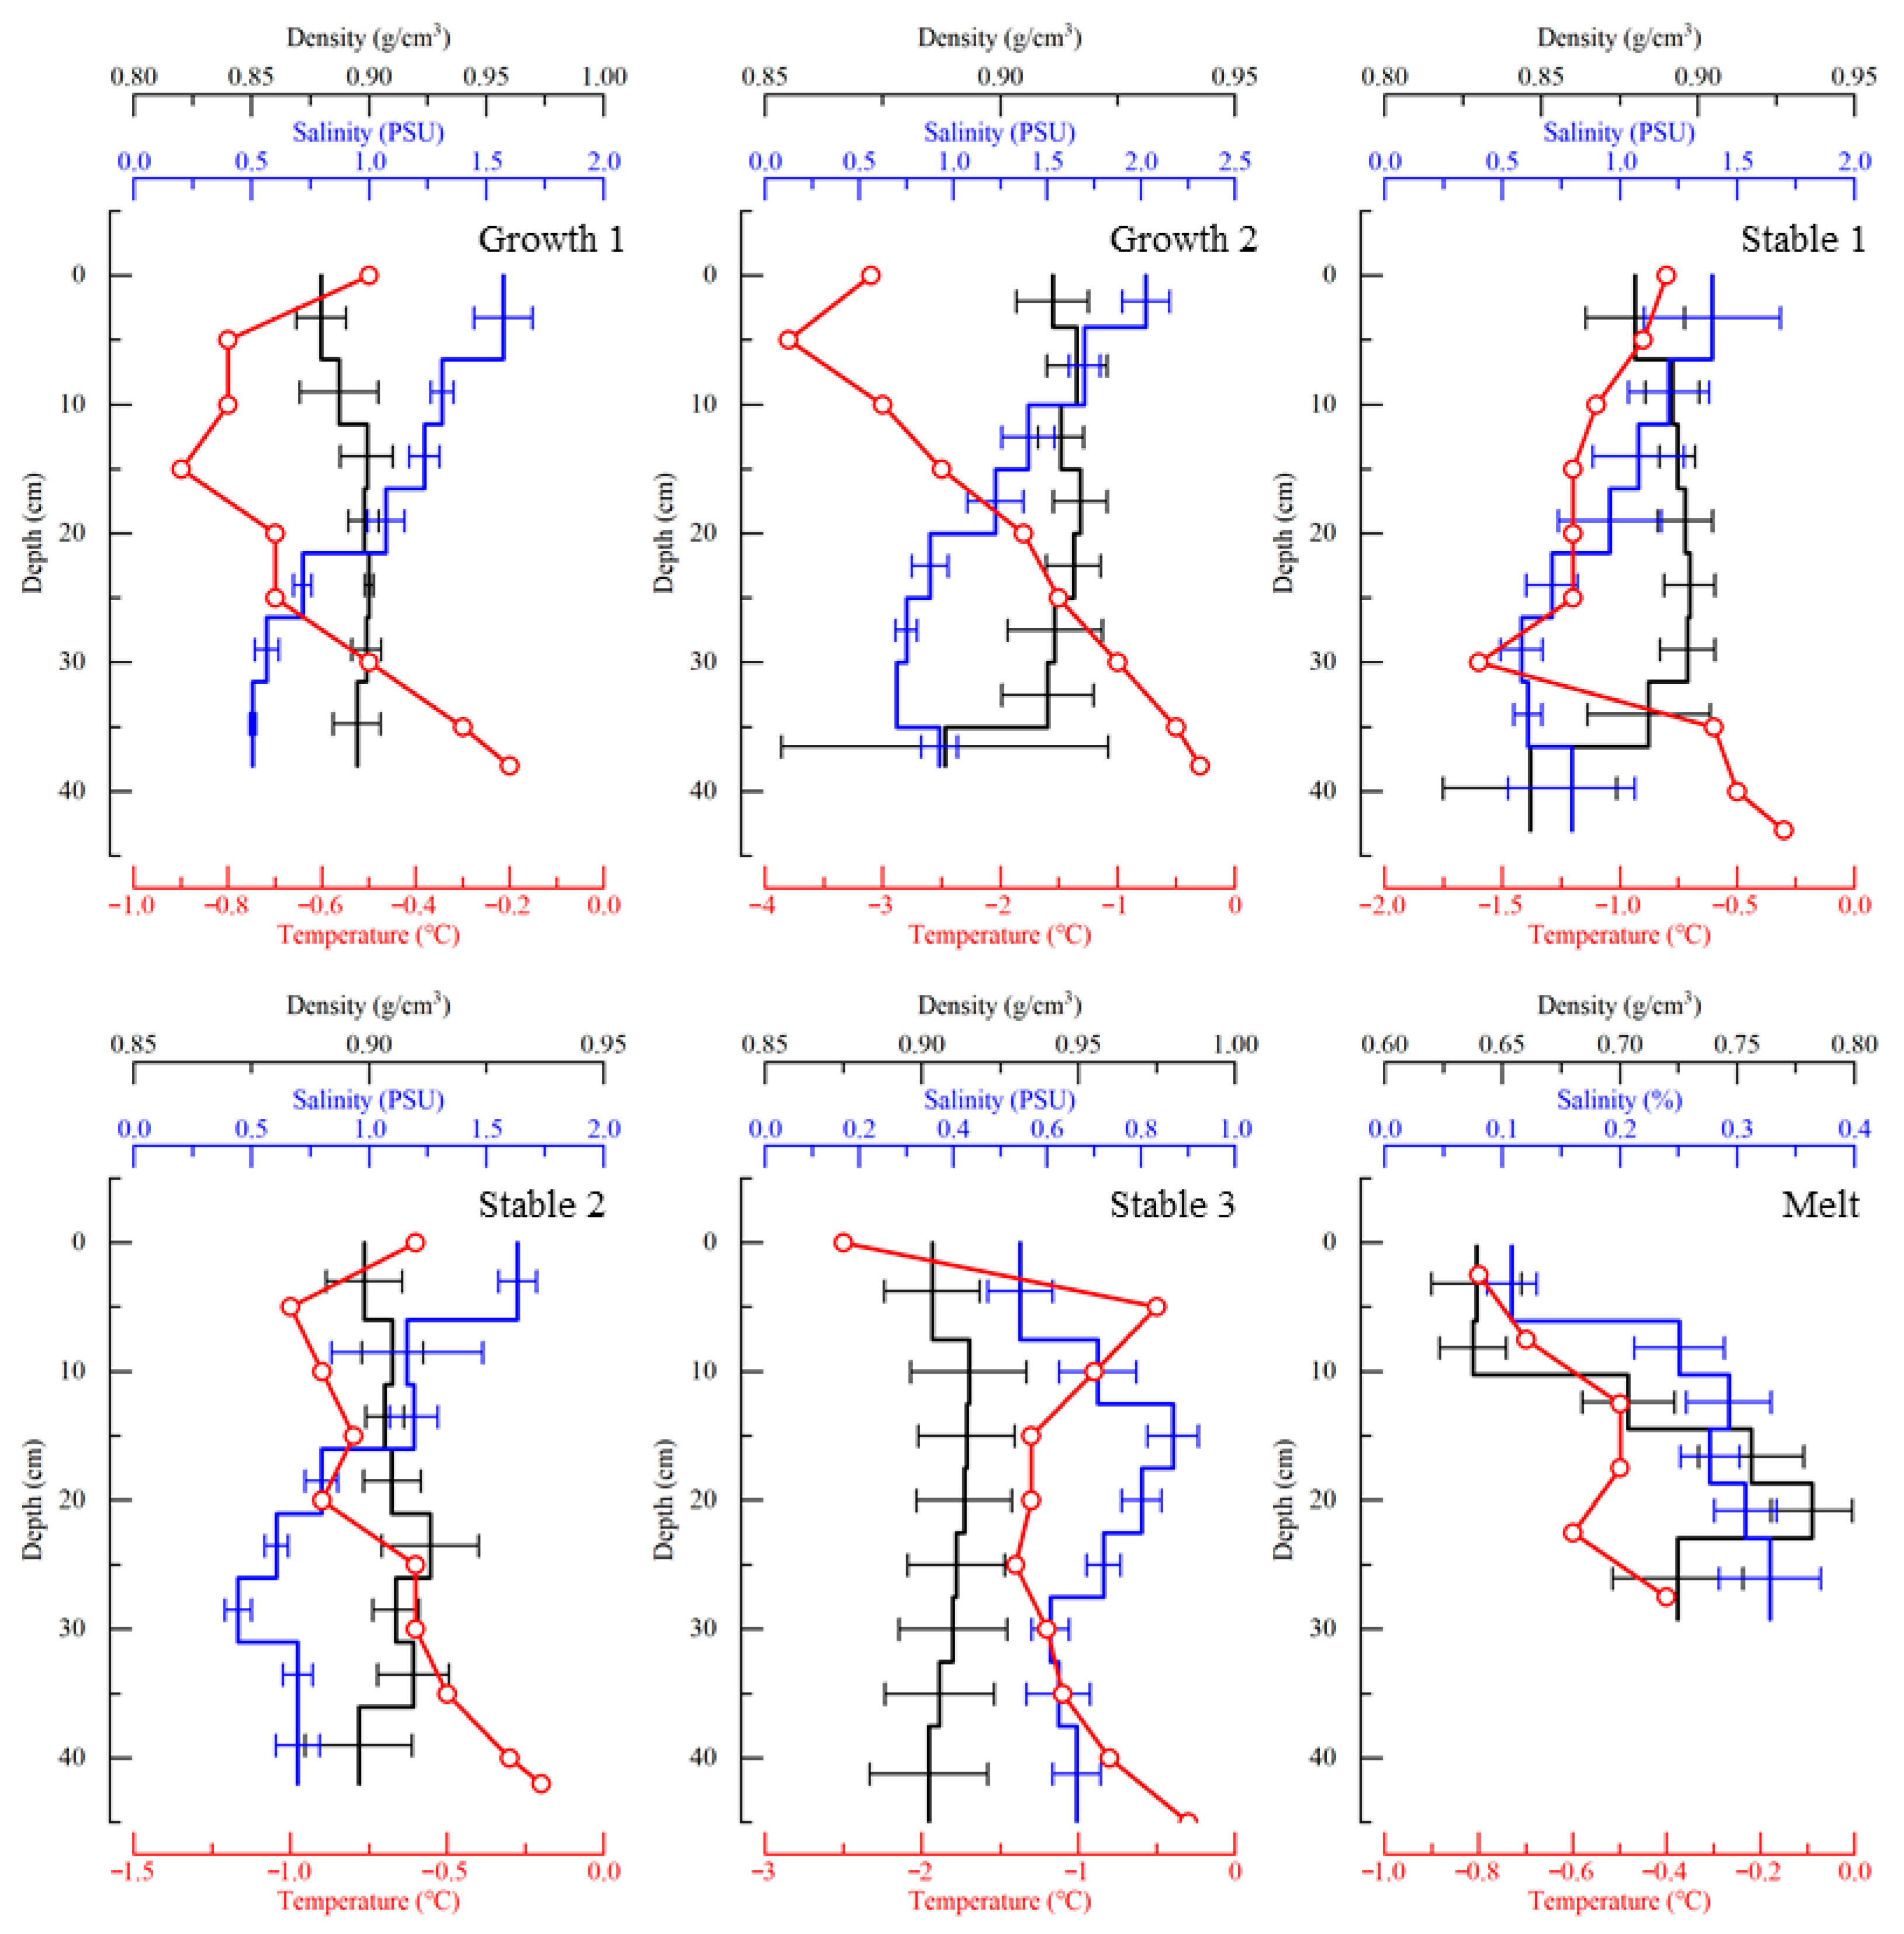
Figure 5 presents the vertical distributions of temperature, salinity, and density for six test groups, where the salinity and density values represent the averages of all beams in each group. During the growth and stable periods, the temperature profiles exhibited a characteristic “C-shaped” distribution: relatively higher temperatures near the ice surface, decreasing with depth, and then increasing again toward the ice bottom, where temperatures approached that of the underlying water. This feature is related to the timing of the experiments. Both growth and stable tests were conducted in the afternoon, following a night without solar radiation, during which the temperature profile was close to a linear or parabolic increase from the cold surface to the warmer bottom. After 8–10 h of solar radiation on the day of testing, the upper ice warmed, resulting in the observed “C-shaped” profile. In contrast, the melt-period test was conducted in the morning, and the temperature profile still displayed a monotonic increase from the surface to the bottom. The salinity profiles generally showed higher values near the ice surface, decreasing with depth, with a slight increase near the bottom due to salt expulsion during freezing. In the Stable 3 test, the surface salinity was reduced because of snowmelt refreezing, but below 10 cm, the profile was consistent with other cases. During the melt period, internal brine channels had become connected and significant brine drainage occurred, producing an overall low-salinity profile. Ice density showed relatively lower values at the surface and bottom, with higher values in the middle section. Similar density magnitudes were observed during the growth and stable periods, whereas the melt-period density was significantly reduced.
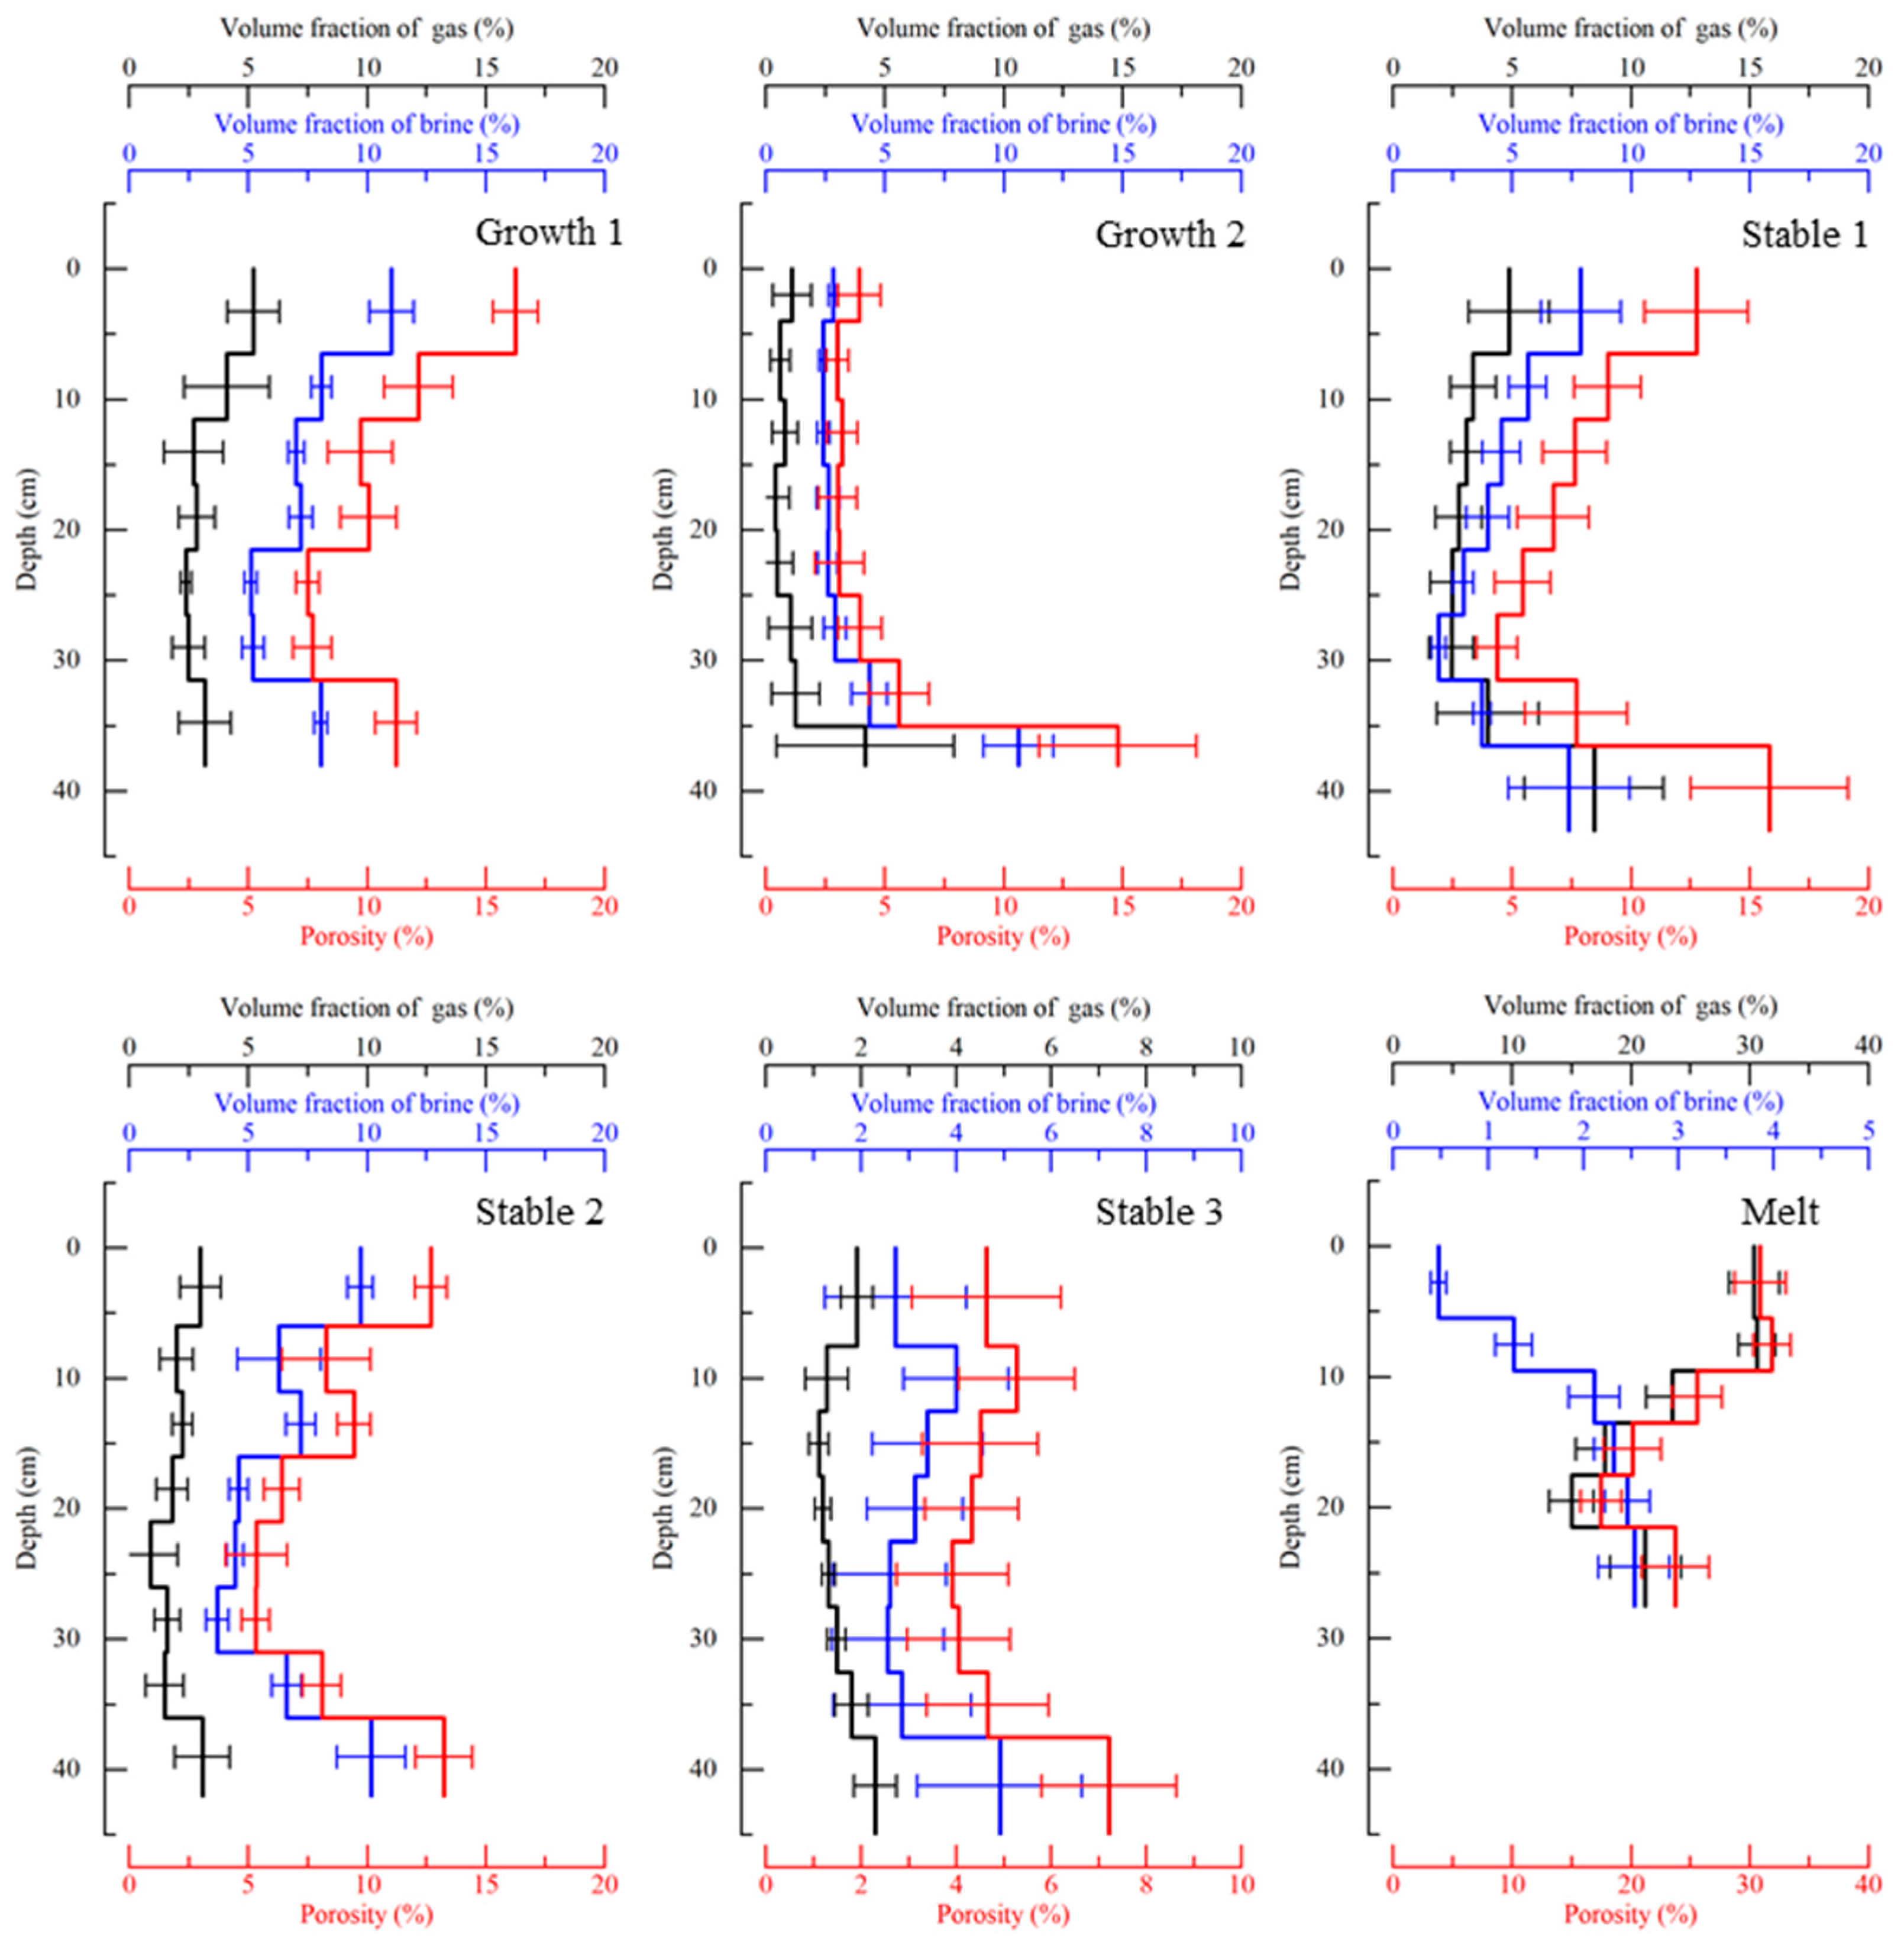
Figure 6 shows the calculated vertical distributions of brine volume fraction, gas volume fraction, and porosity derived from ice temperature, salinity, and density. In the growth and stable periods, these parameters generally decreased with depth in the upper ice and then increased toward the bottom. In the Stable 3 test, snowmelt refreezing led to an overall lower porosity, indicating a more consolidated structure. In contrast, the melt-period ice exhibited lower brine volume fractions and higher gas fractions, as brine loss during melting transformed brine pockets into air bubbles. This effect was most pronounced in the surface layers exposed to strong solar radiation. The porosity profile during the melt stage followed a similar depth-dependent trend to that observed during the growth and stable periods, but with consistently higher values, indicating substantial weakening of the ice matrix.

3.2. Flexural Strength and Effective Modulus Derived from Cantilever Beam Tests

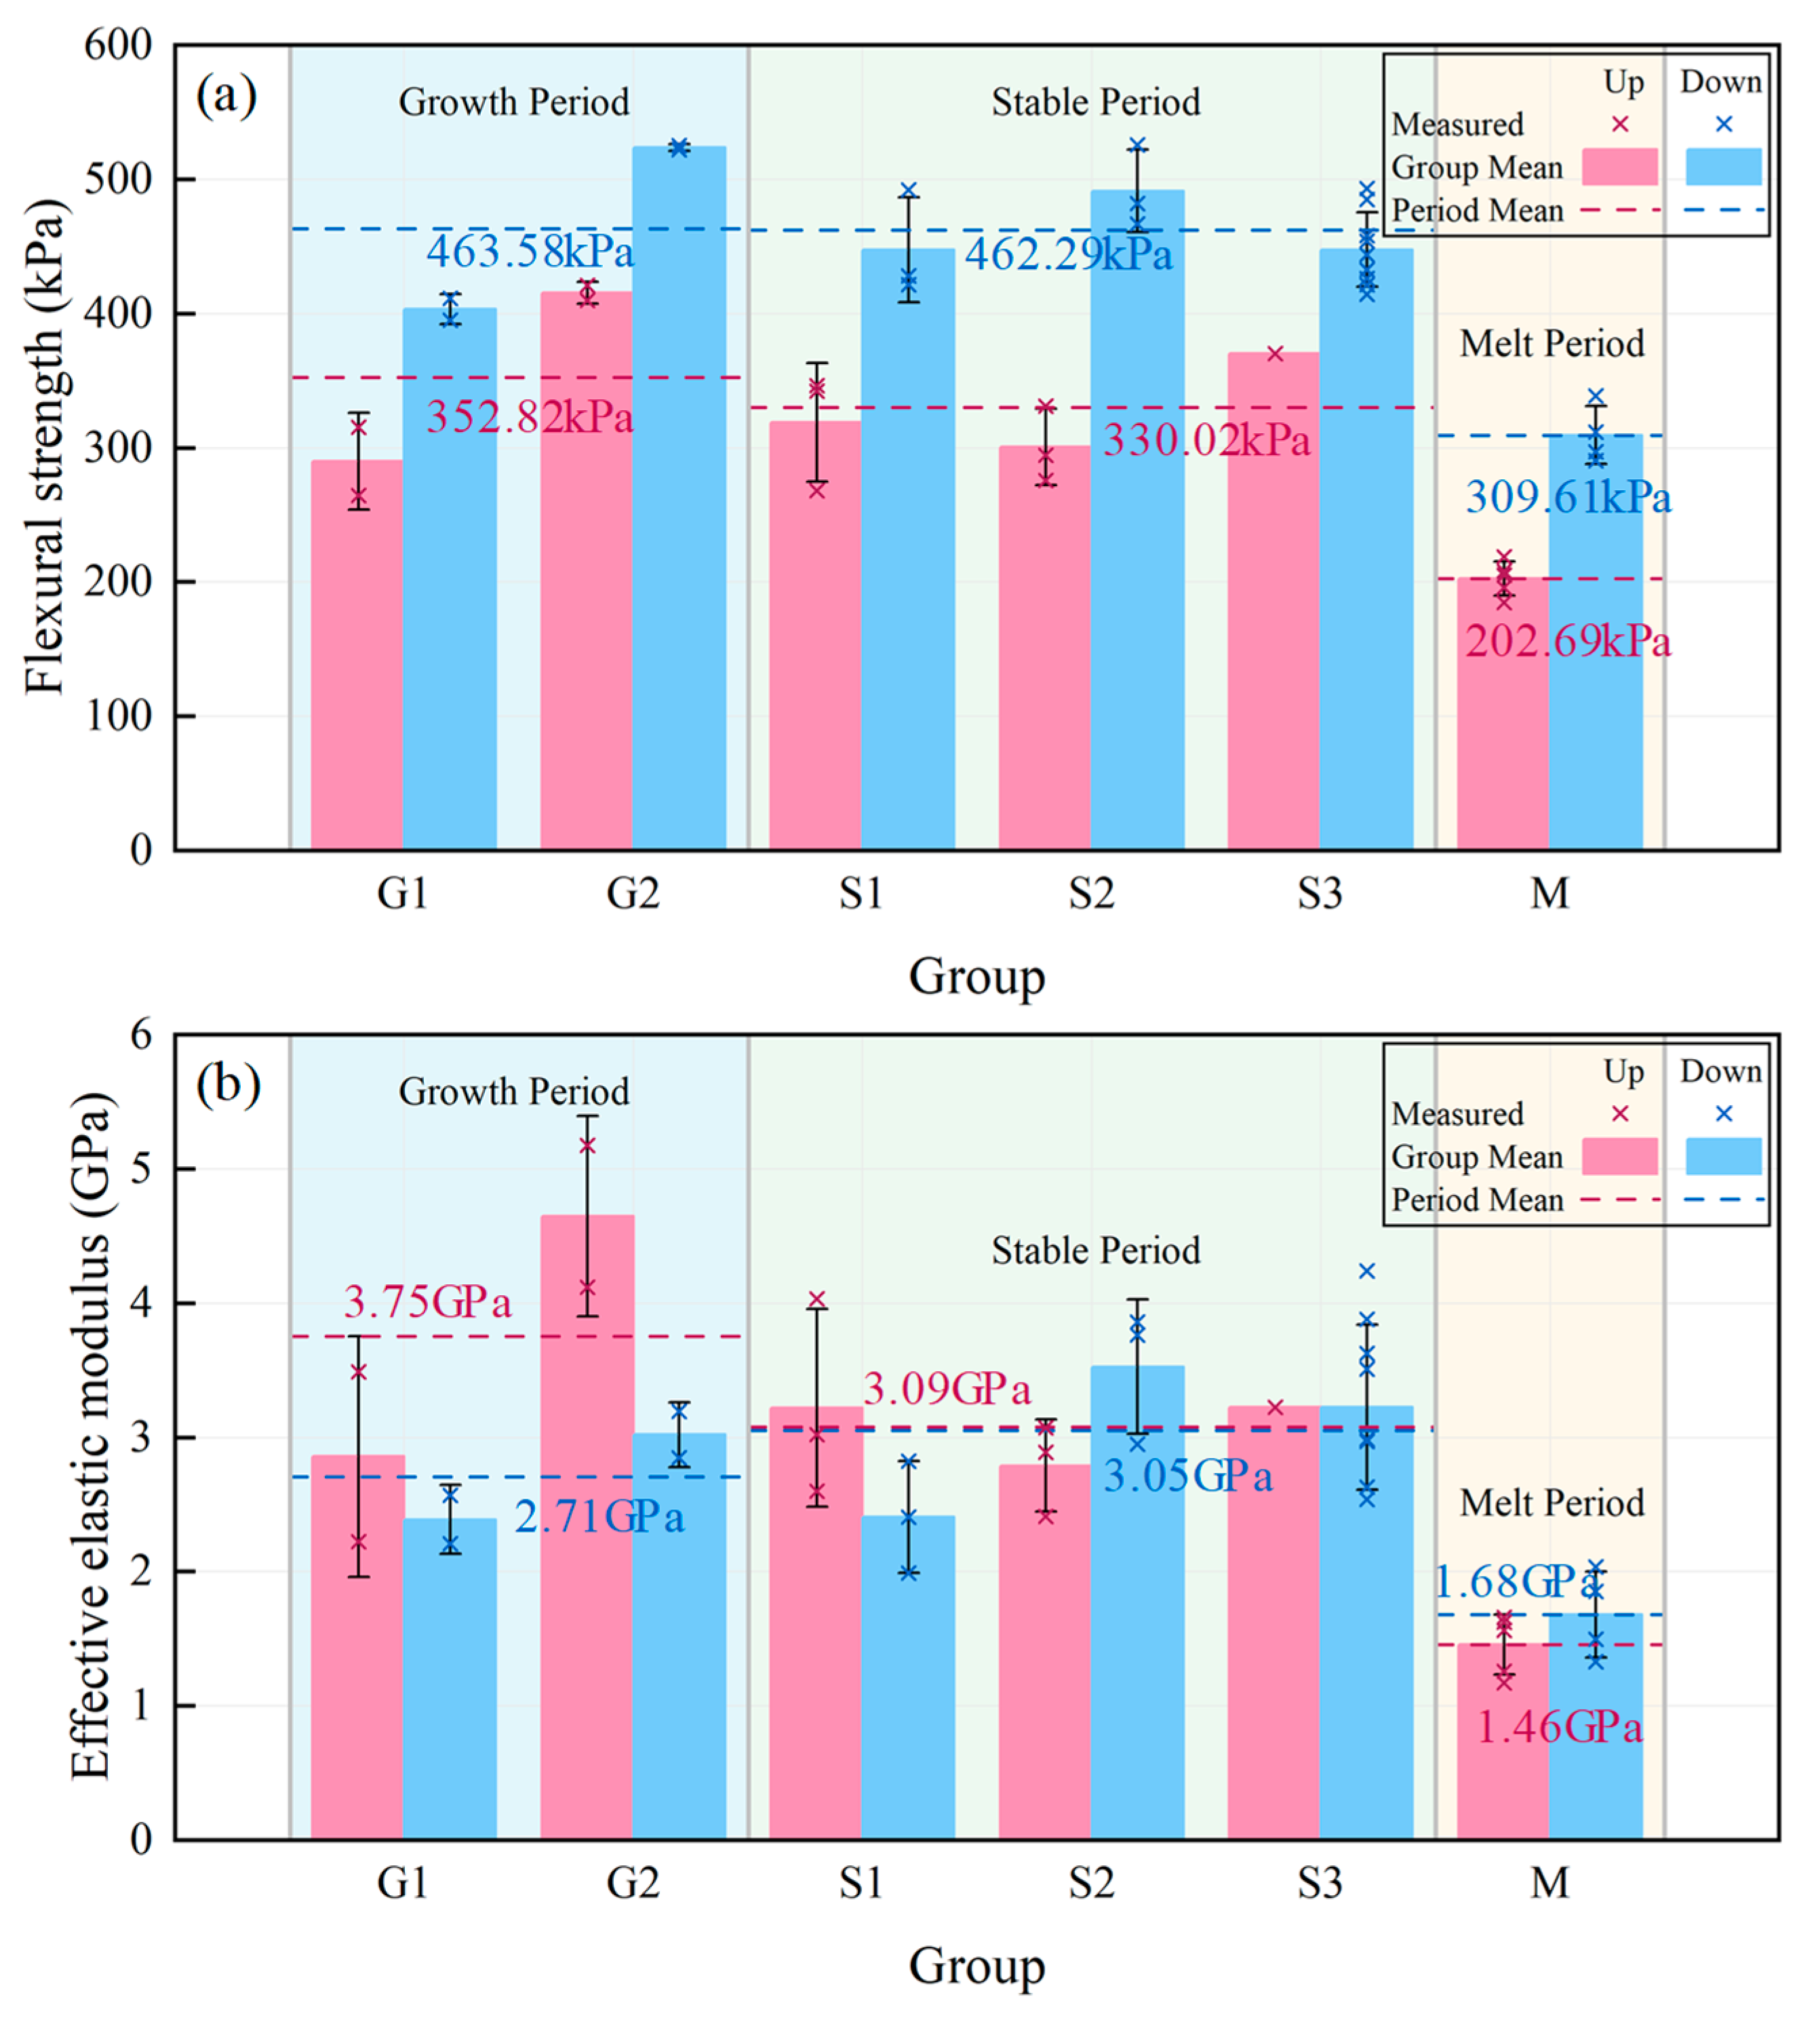
A total of 39 valid datasets were obtained from 40 full-scale cantilever beam tests. Table 2 summarizes the experimental results, including beam volume, flexural strength, and effective elastic modulus. The beam volumes ranged from 0.38 to 1.37 m3, with substantial variations observed among different ice periods, whereas variations within individual groups were negligible. Overall, the flexural strength of upward-loaded beams ranged from 202.69 to 415.52 kPa, with effective elastic moduli between 1.46 and 4.65 GPa. For downward loading, flexural strength varied between 309.61 and 523.78 kPa, and effective elastic moduli ranged from 1.68 to 3.53 GPa. Considerable scatter was observed both within and between groups, reflecting the influence of ice microstructural heterogeneity and testing conditions.

3.2.1. Effects of Physical Parameters

To identify the physical parameters that primarily govern the flexural mechanical behavior of brackish ice, three parameters were considered: brine volume fraction, gas volume fraction, and porosity. In the downward loading configuration, the upper side of the ice beam is subjected to tension while the lower side experiences compression; since the tensile strength of ice is substantially lower than its compressive strength, flexural failure is essentially governed by tensile failure. Therefore, the physical properties of the tensile side, taken from fractional layers between 1/8 and 8/8 (bulk) of the ice thickness, were selected as potential influencing factors. Their relationships with flexural strength were fitted using logarithmic, power-law, linear, and exponential functions. A total of 96 fitting schemes were evaluated, and the coefficients of determination (R2) were summarized in heatmaps for comparison (Figure 7).
The heatmaps indicate that, among different fractions of the tensile side, the use of bulk physical parameters as predictors yielded the highest goodness-of-fit. Among the functional forms, exponential fits consistently produced the best performance. Consequently, the square roots of bulk brine volume fraction, gas volume fraction, and porosity were fitted against flexural strength using exponential models. The results show that brine volume fraction exhibited the weakest correlation, and flexural strength even increased with the square root of brine volume fraction, which contradicts previous findings in the literature. In contrast, flexural strength decreased with the square roots of gas volume fraction and porosity, with porosity presenting the strongest correlation among the three parameters. In a similar manner, the influence of physical parameters on the effective elastic modulus was also examined (Figure 8). Consistent with the results for flexural strength, the square root of bulk porosity yielded the best fits, and its R2 values were even higher than those obtained for flexural strength. The mean flexural strength and effective elastic modulus of each group were fitted against the square root of bulk porosity, yielding the empirical formulas for the full-scale flexural mechanical properties of brackish ice, as shown in Equations (3) and (4).
In the above result analysis, all scatter data were used in the exploratory fitting stage to enable a clear comparison among different parameterizations and functional forms. Using mean values at this stage would result in a uniformly high R2 across all models, obscuring the distinction between fitting types and influencing factors. In contrast, the final empirical formulas for the full-scale flexural mechanical properties of brackish ice (Equations (3) and (4)) were established based on the mean values of each test group, yielding high coefficients of determination (R2 = 0.98 and 0.92), which represent validated relationships applicable to engineering practice.
σ f = 0.703 e x p 2.061 v ,   R 2 = 0.98
E = 6.519 e x p 2.738 v ,   R 2 = 0.92
where v is the bulk porosity.

3.2.2. Effects of Loading Direction

Figure 9 shows the comparison between upward and downward loading for each test group. The bars represent group-mean values of flexural strength and effective elastic modulus, accompanied by scatter points for individual beams and error bars for within-group variability, while the dashed lines indicate the mean values of strength and modulus within each ice period. For flexural strength, a consistent pattern was observed: in all groups, the mean values obtained from downward loaded were higher than those from upward loading. The differences ranged from 17.3% to 38.8%, indicating that downward loading systematically exhibited greater resistance to bending failure. In contrast, the effective elastic modulus did not show a clear or consistent dependence on loading direction. In some groups, downward loading produced slightly higher values, whereas in others, upward loading was higher. Overall, the available data do not provide sufficient evidence to confirm a definitive relationship between loading direction and elastic modulus. These results suggest that flexural strength is more sensitive to loading direction, whereas any directional effect on the elastic modulus remains uncertain.
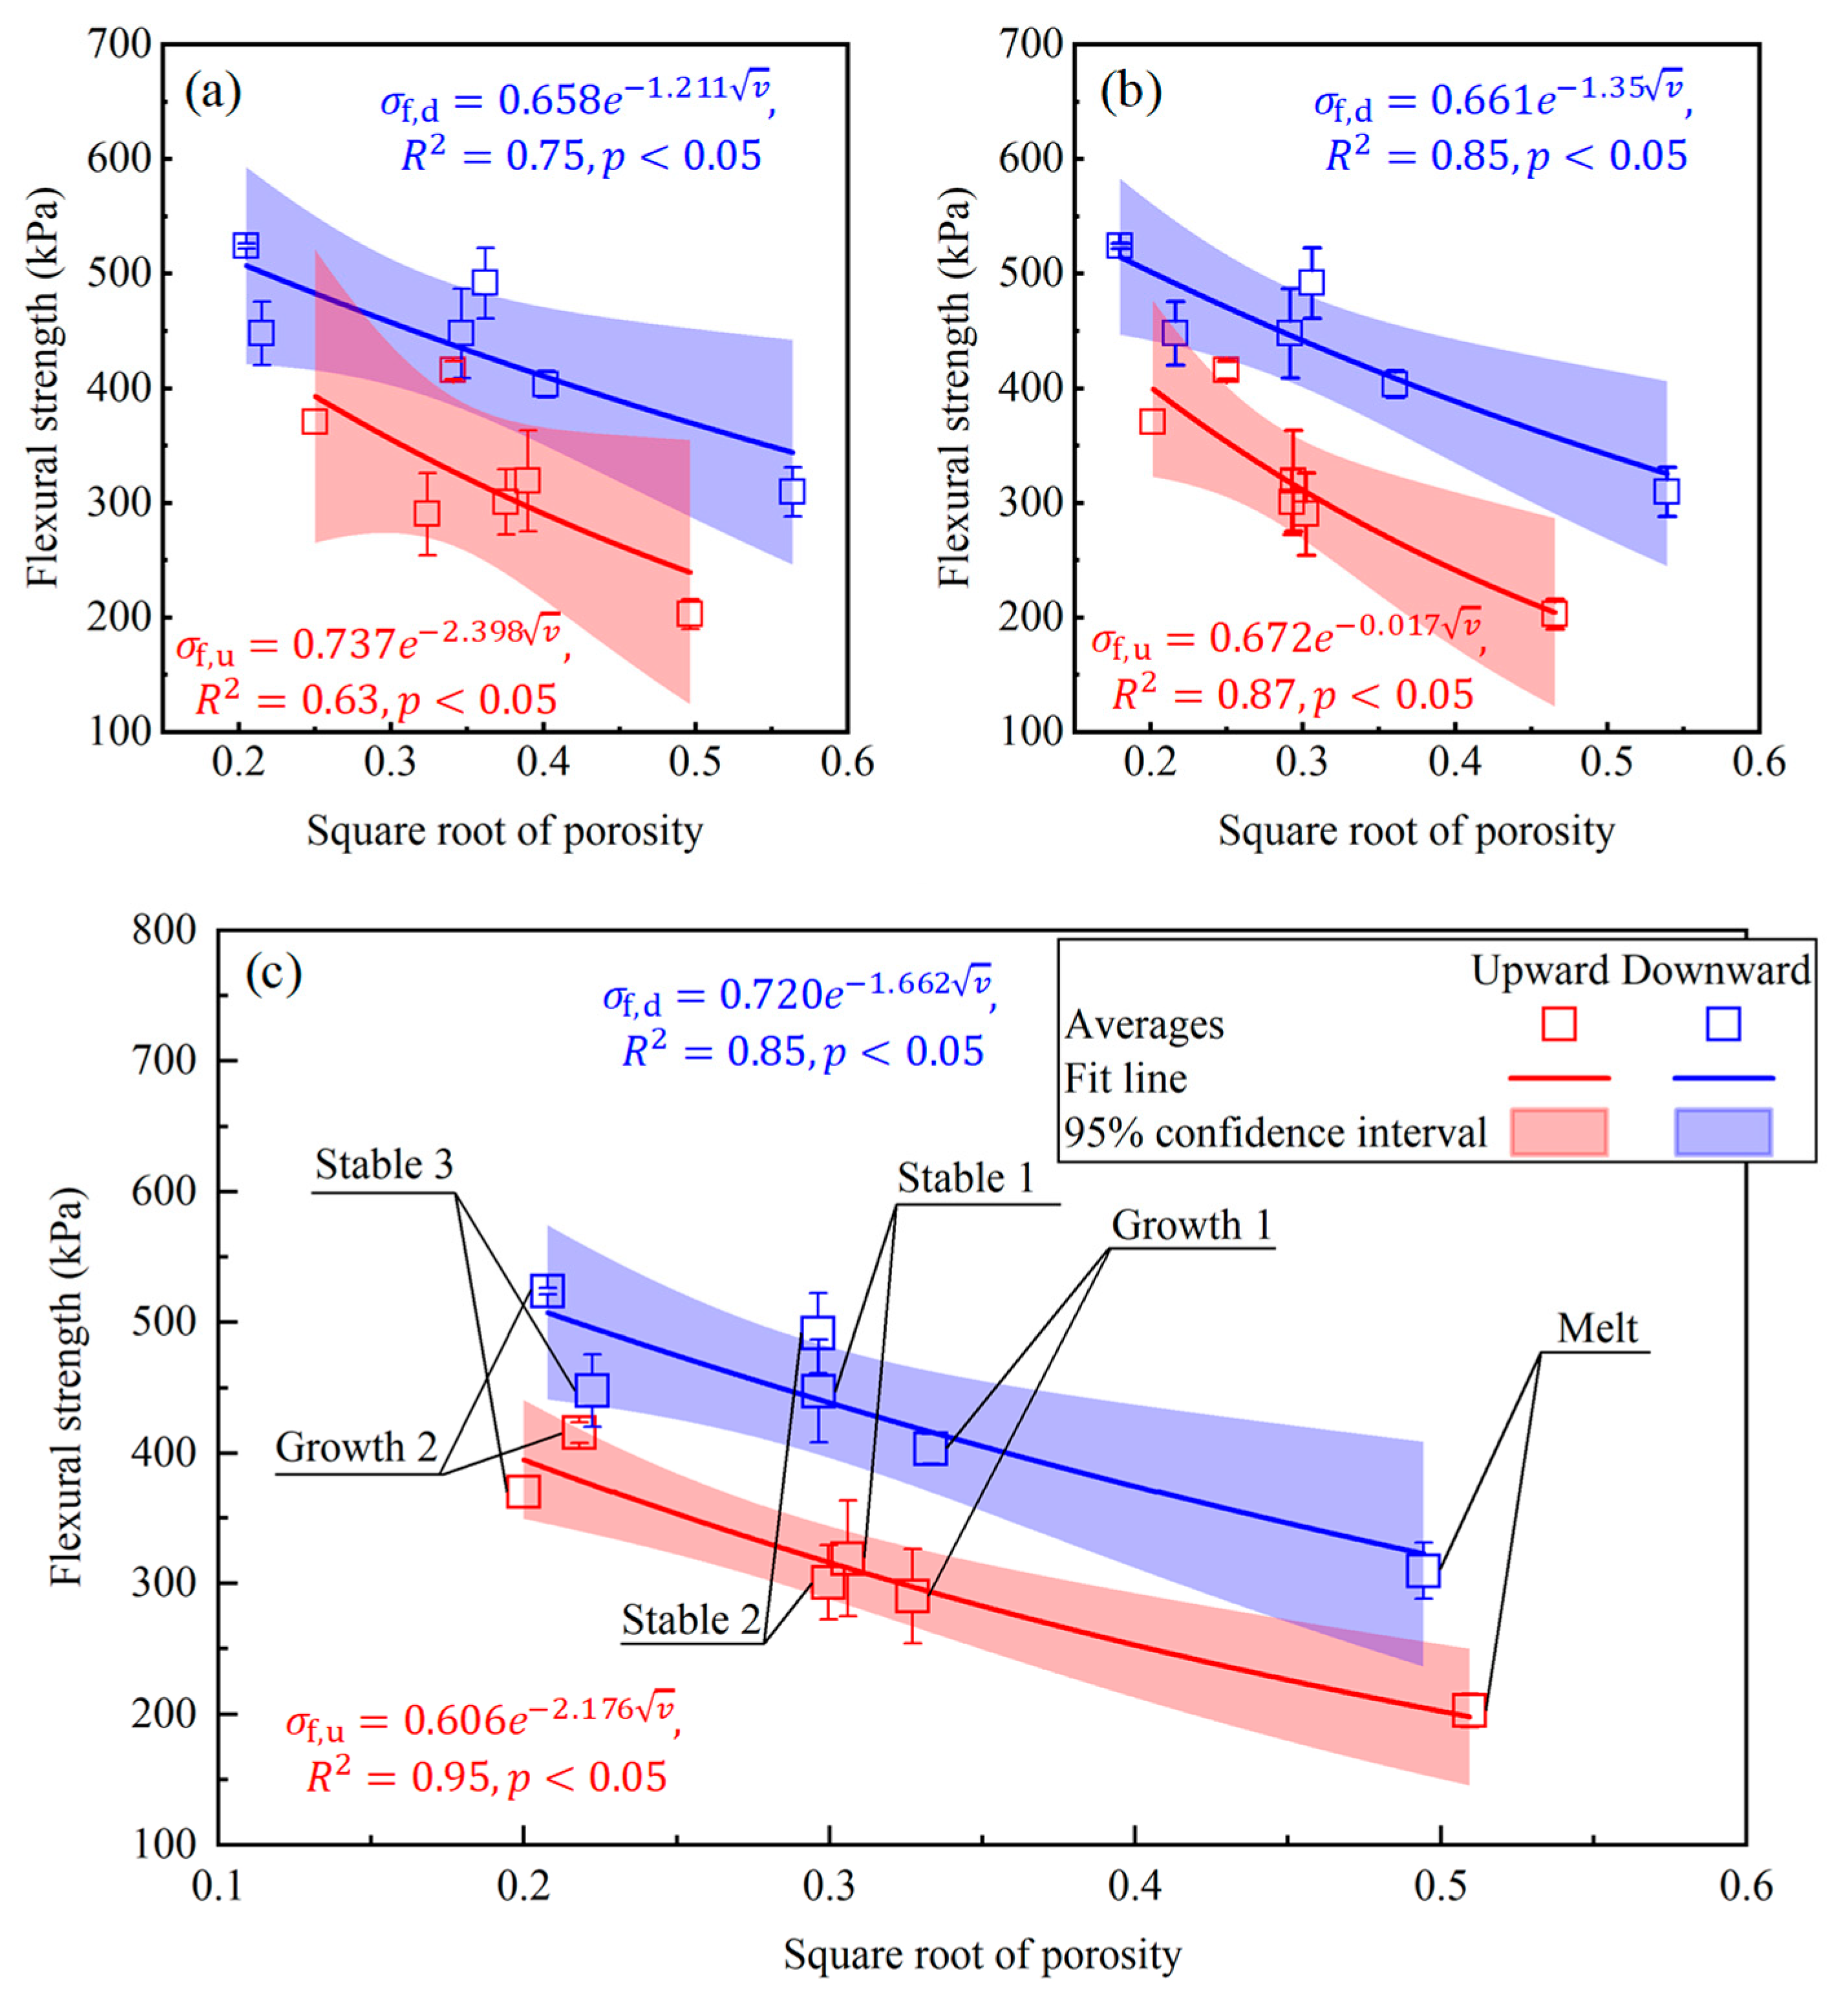
To examine whether the strength difference between upward and downward loading could be attributed to the use of bulk porosity as the influencing factor, which may neglect vertical variations in porosity within the ice, we further compared different porosity parameterizations. Figure 10 presents the regression of upward and downward-loaded flexural strengths against the square root of porosity. In addition to bulk porosity, porosity values taken from different tensile-side depths (1/8, 4/8 of the ice thickness) were also considered as predictors. The results show that, regardless of the porosity parameter used, the flexural strength obtained under downward loading was consistently higher than that under upward loading at the same porosity level. Moreover, using the square root of bulk porosity as the influencing factor yielded the highest goodness-of-fit for both loading directions, outperforming other parameterization approaches. These findings indicate that bulk porosity remains the most effective predictor, and the systematic strength difference between upward and downward loaded cannot be explained solely by the choice of porosity representation.
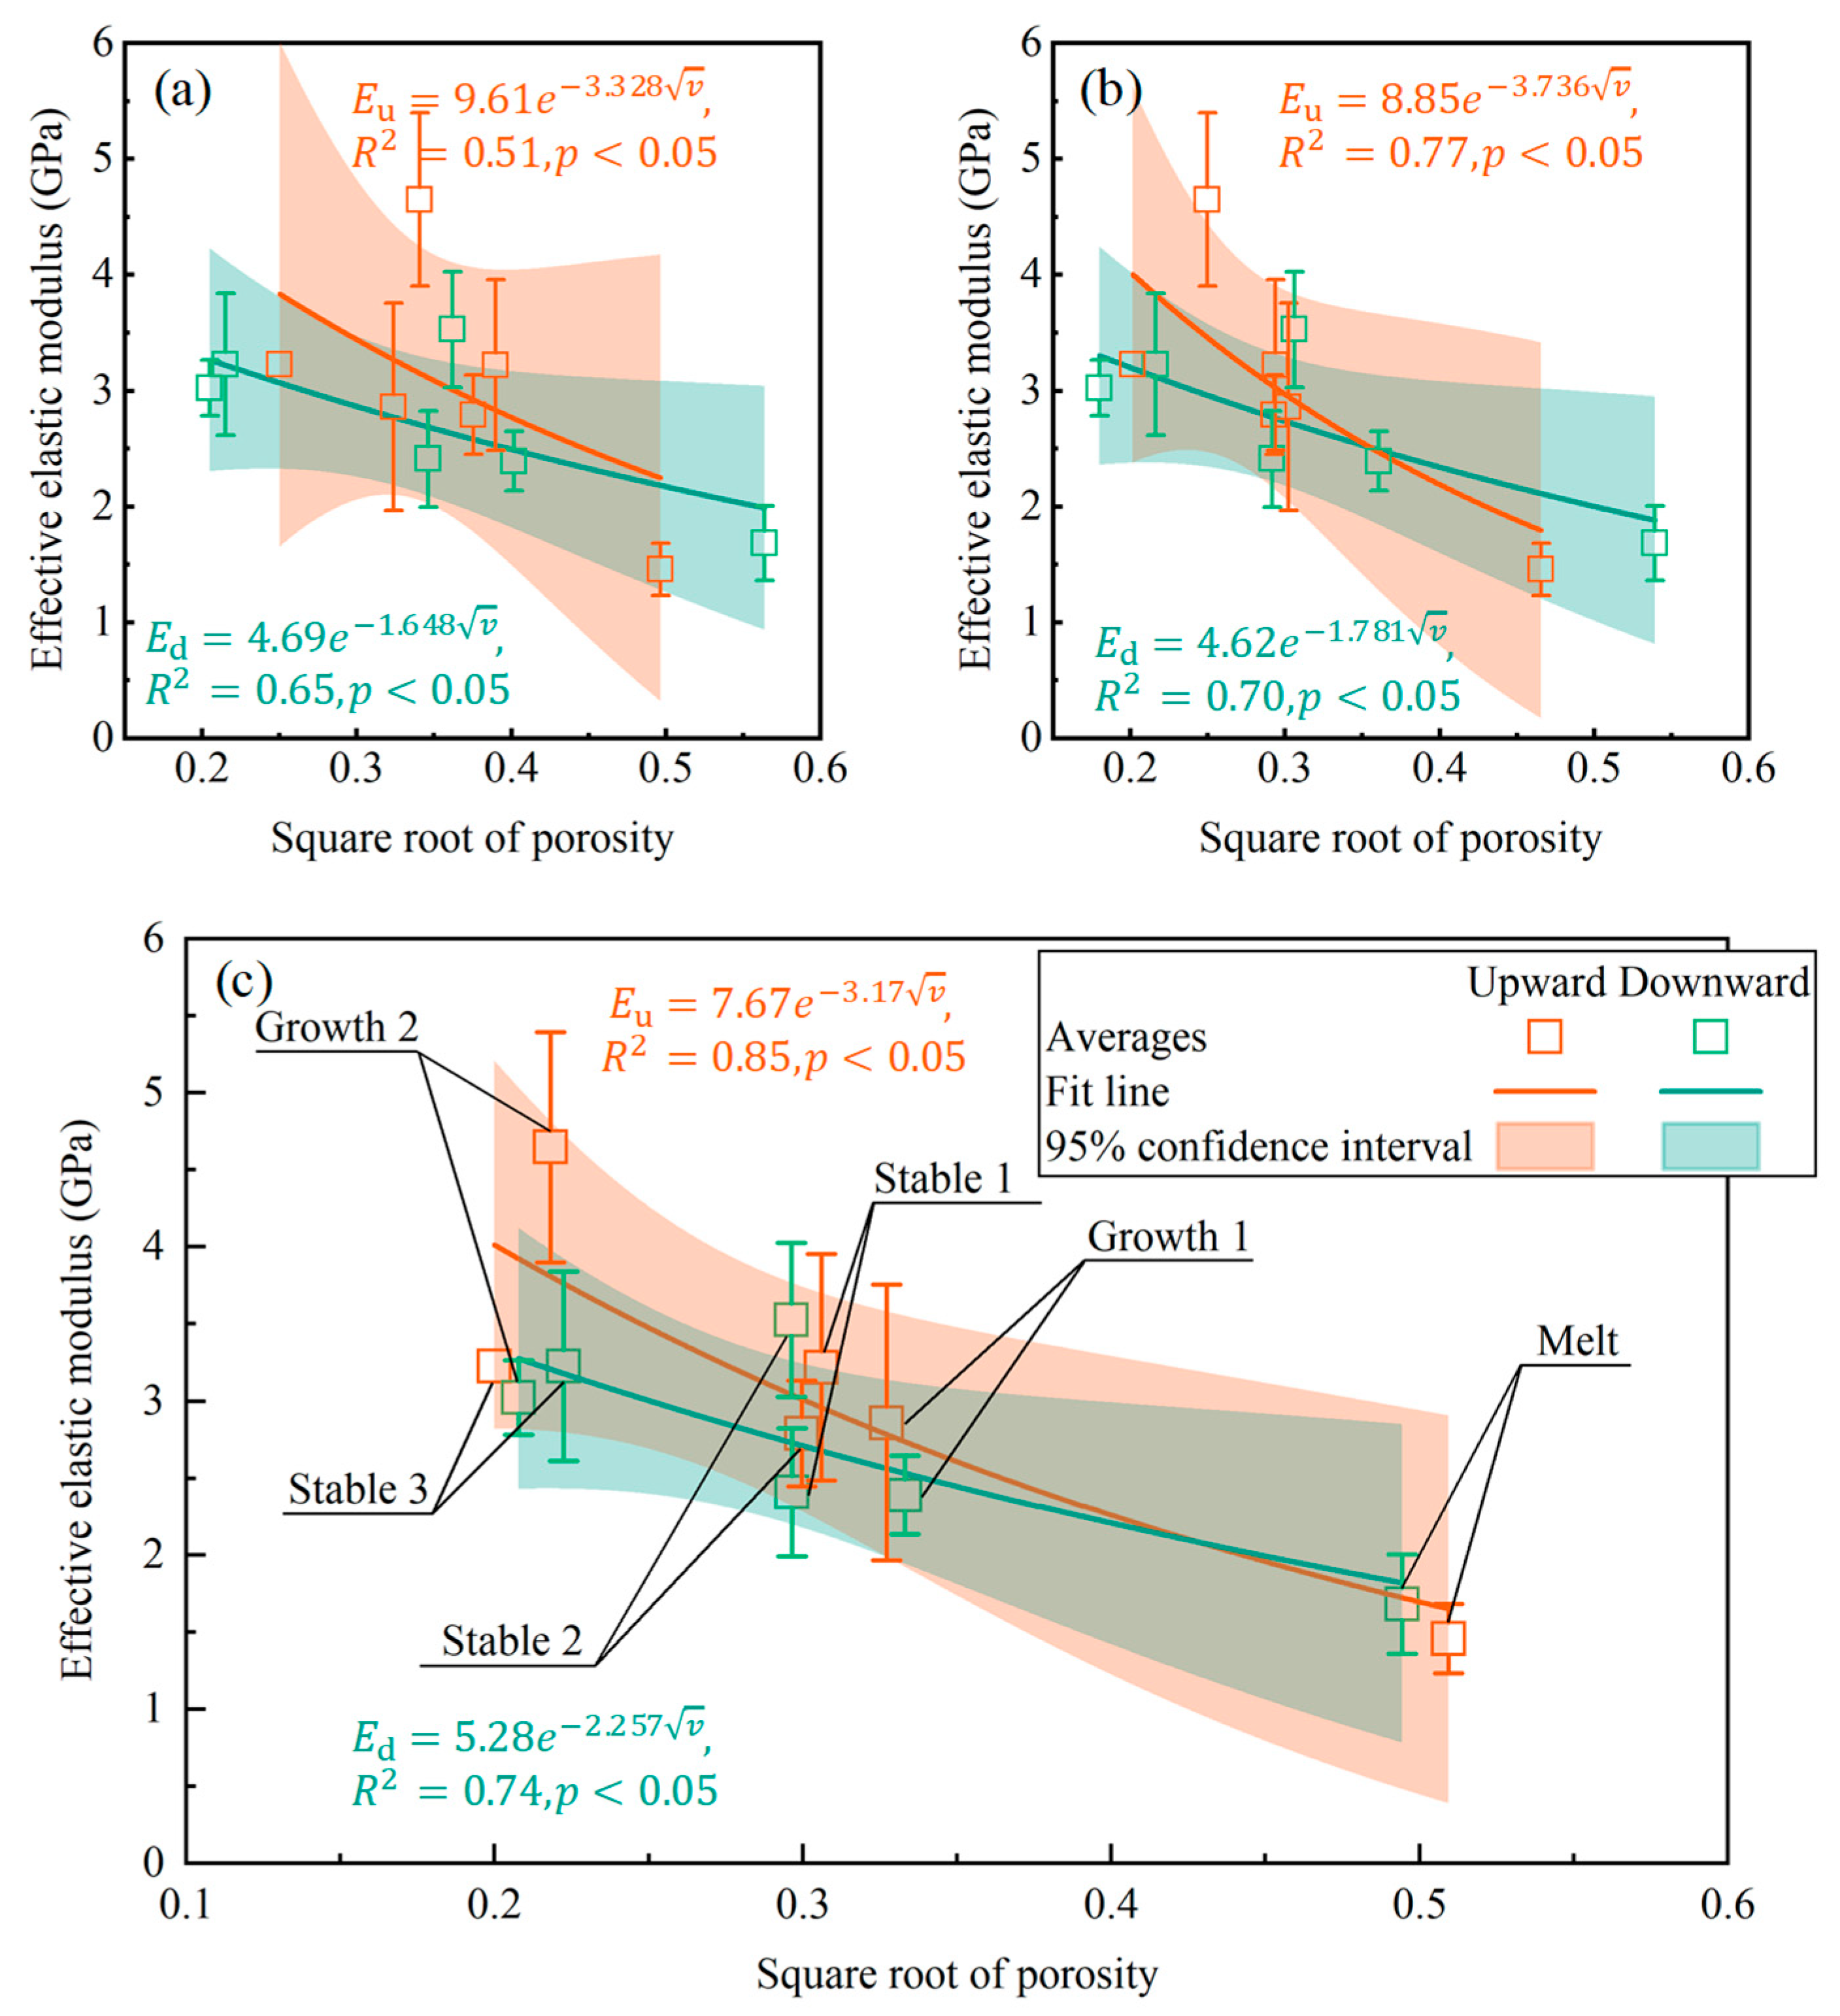
A similar analysis was performed for the effective elastic modulus (Figure 11). Unlike flexural strength, the modulus did not exhibit a consistent magnitude relationship between upward and downward loading. At lower porosity values (√ν ≈ 0.2), the upward modulus was slightly higher than the downward modulus, but the relationship gradually reversed with increasing porosity, and at √ν ≈ 0.5, the upward modulus became lower. Overall, the observed differences between the two loading directions were not systematic, and there is currently insufficient evidence to establish a clear directional dependence for the effective elastic modulus. Nevertheless, consistent with the results for flexural strength, the square root of bulk porosity remained the most effective predictor, yielding the highest goodness-of-fit among the parameterizations.
The systematic difference in flexural strength between downward and upward loading can be rationalized by the crystallographic stratification of the ice cover. The upper fibers are in tension under downward loading. The top 3 cm consists of granular ice with abundant grain boundaries and inclusions, and the columnar crystals beneath exhibit an increase in diameter with depth. This gradient implies fewer effective bonding interfaces and a reduced resistance to tensile cracking as the tensile side migrates downward, thereby promoting earlier crack initiation and unstable propagation. Although the tensile-side porosity was accounted for in the regressions, porosity alone does not capture microstructural attributes such as grain-boundary orientation, grain-size gradients, and columnar connectivity. These factors plausibly explain why, at comparable porosity levels, downward loading still yields higher strengths than upward loading.
By contrast, unlike flexural strength, which reflects the threshold at which failure occurs, the modulus describes the rate of increase in load with deflection, and the two are not governed by the same mechanisms. For example, in the case of upward-loaded cantilever beams, the lower ice in tension has a lower tensile strength, making it more prone to failure than downward-loaded cantilever beams. However, this does not imply that the tensile modulus of the lower ice is lower than that of the upper ice. In other words, the magnitude of the failure threshold does not directly determine the slope of the load–deflection curve. Theoretically, the effective elastic modulus is primarily governed by the overall elastic response of the ice matrix rather than local failure initiation, and therefore its sensitivity to loading direction is expected to be weaker than that of flexural strength. Experimentally, there is currently insufficient evidence to establish a clear relationship between loading direction and elastic modulus. However, due to the inherent variability and scatter in full-scale in situ measurements, it is premature to conclude that the modulus is entirely independent of loading direction. Further accumulation of data from multiple ice conditions is needed to draw a more definitive conclusion.

3.2.3. Effects of Ice Period and Beam Volume

As shown in Figure 9, the mean values for each ice period are indicated by dashed lines, and therefore no additional figures are provided in this section. The flexural mechanical performance during the growth and stable periods was comparable, whereas that of the melt period was markedly lower. Specifically, the average flexural strengths under upward and downward loading were approximately 352.82 kPa and 463.58 kPa in the growth period and 330.02 kPa and 462.29 kPa in the stable period, but decreased to 202.69 kPa and 309.61 kPa in the melt period, representing reductions of about 33–33.2% and 38.6–41.8% relative to the growth and stable periods. The average effective elastic moduli were 3.75 GPa and 2.71 GPa in the growth period, 3.09 GPa and 3.05 GPa in the stable period, and decreased to 1.46 GPa and 1.68 GPa in the melt period, which were approximately 52.8–61.1% and 38.0–44.9% lower than those in the growth and stable periods, respectively. The pronounced weakening of flexural mechanical properties during the melt period is consistent with the physical property results presented in Section 3.1.2: higher gas volume fraction and porosity, together with connected brine channels and surface warming, weakened the effective skeleton of the ice and promoted premature tensile failure. Microstructural degradation, such as grain-boundary wetting, brine drainage, and air-bubble accumulation, further reduced the stiffness, explaining the decrease in strength and modulus compared with the growth and stable periods.
Within each ice period, neither flexural strength nor effective modulus showed a monotonic trend with ice thickness or beam volume. For instance, in the growth period, the two test groups had nearly identical beam volumes (approximately 0.99 m3), yet their group-mean flexural strengths differed considerably (Growth 1: 346.75 ± 68.9 kPa; Growth 2: 469.65 ± 62.69 kPa), as did their effective moduli (Growth 1: 2.62 ± 0.60 GPa; Growth 2: 3.84 ± 1.04 GPa). During the stable period, beam volumes ranged from 1.06 to 1.37 m3, but the corresponding strength values varied non-monotonically (383.24 ± 76.69 to 440.07 ± 35.74 kPa), and the effective modulus fluctuated between 2.81 ± 0.70 and 3.23 ± 0.58 GPa, showing no systematic increase with beam volume. Although the beam size was determined by the in situ ice thickness, the variation in beam volume within each ice period was relatively small, and the limited number of tests makes it difficult to conclusively assess the size effect. According to the empirical relationship proposed by Aly et al. [9], the flexural strength of ice tends to decrease with increasing specimen volume due to a higher probability of internal flaws and cracks. However, in the present study, the observed variation in strength across different beam volumes does not follow this theoretical trend, suggesting that the size effect was not a dominant factor. In the melt period, where the beam dimensions varied more noticeably, the substantial changes in ice physical properties, such as temperature, salinity, and porosity, likely overshadowed the geometric influence, making it challenging to isolate the pure contribution of specimen size to the mechanical behavior.

3.2.4. Evaluation of Buoyancy Effects on Test Results

Taking the cantilever beams from the growth and stable periods as examples (which had comparable beam volumes), the influence of buoyancy during loading on the test results was quantitatively evaluated. The beams were in hydrostatic equilibrium prior to loading, with their self-weight balanced by buoyancy. Therefore, only the additional (or reduced) buoyancy generated during loading due to downward (or upward) deflection could influence the test results. Using the measured group means (water density ρ w   =   1 g / c m 3 ; ice density 0.90 g/cm3; beam length Lc = 3.34 m, width b = 0.85 m, thickness h = 0.42 m; end displacement δc = 3.02 mm; failure load P = 3047.75 N) and assuming a small-deflection parabolic profile δ x   =     δ c ( x L c ) 2   , the incremental submerged volume produces an upward distributed buoyancy ρ w g b δ ( x ) . The corresponding buoyant bending moment about the beam root can be expressed by Equation (5). The equivalent end load induced by buoyancy is then obtained from Equation (6).
M b u o y = ρ w g b 0 L c x δ x d x = ρ w g b δ c L c 2 4 = 70.23   N · m
P e q = M b u o y L c = 21.05   N
As shown by Equation (6), the equivalent buoyant end load Peq is only 21.05 N. Compared with the measured failure load P = 3047.75 N, which corresponds to 0.69% of the total load. Since both flexural strength and effective elastic modulus are linearly proportional to the applied load, the first-order influence of this buoyancy effect on the derived mechanical parameters is also below 1%. Therefore, the buoyancy-induced correction can be regarded as negligible under the present geometric and loading conditions. In practical conditions, the bending behavior of floating ice sheets is also affected by buoyancy; however, its magnitude is inherently small and therefore was not explicitly corrected for in the analysis.

4. Discussion

4.1. Differences in Mechanical Properties of Brackish Water Ice from Saline Water Ice and Freshwater Ice

Table 3 summarizes the literature datasets selected for comparison with the present brackish ice results. Freshwater ice data were taken from Refs. [16,32,33], all of which reported mean ice temperatures, while sea ice data and brackish ice data were collected from Refs. [16,18,19,34] and Ref. [35], each providing mean brine volume fractions of the ice. The table lists ice type, author, test location, test period, number of data points, and the reported statistics of flexural strength and effective elastic modulus; where available, regression relationships with temperature and the square root of brine (porosity) volume fraction are also included. It should be noted that, except for Ref. [19], all entries were specifically obtained from the full-scale cantilever beam test sections of the original studies. In the referenced datasets, Refs. [18,19,32] did not explicitly specify the loading direction of the cantilever beam tests; in Ref. [34], all 12 tests were conducted under downward loading; and in Ref. [16], all 15 freshwater ice tests were downward loaded, while only 10 of 62 sea ice tests were performed under upward loading. The brackish ice dataset in Ref. [35] represents ice with a mean ice salinity of approximately 1‰ and under-ice water-layer salinity of about 4‰, which is comparable to the physical conditions observed in this study. To facilitate a more straightforward comparison across datasets, loading direction was not distinguished in the present analysis. For consistency, the mean values from the six test groups in this study were fitted against the mean ice temperature and brine volume fraction (porosity).
Figure 12 illustrates the relationships between flexural strength and mean ice temperature, comparing the present brackish ice results with several freshwater ice datasets. Both the present data and those of Ref. [33] are presented as group-averaged values. It can be observed that, with the exception of Ref. [16], all datasets show decreasing strength with increasing temperature. Freshwater ice generally occupies a higher range, with flexural strengths of 201 to 807 kPa and effective moduli of 1.25 to 6.71 GPa. In contrast, brackish ice in this study exhibits lower values, with flexural strengths of 250.21 to 469.65 kPa and effective moduli of 1.56 to 3.84 GPa. The regression lines further confirm this offset, as the brackish ice fit consistently lies below that of freshwater ice. Nevertheless, the slopes are similar, indicating that thermal weakening is a common mechanism in both ice types. In Ref. [16], the relationship between mechanical properties and temperature is less clear, likely due to inter-annual variability and differences in ice physical properties across testing years. The dataset of Ref. [33], which is concentrated in a higher temperature range, still shows a mean strength of 438.73 ± 170.36 kPa, exceeding the mean value of 374.21 ± 99.93 kPa obtained for brackish ice in this study. The microstructural context helps explain why brackish ice exhibits lower flexural properties than freshwater ice. Zhang et al. [36] conducted laboratory observations on Hanzhang Lake ice and revealed the presence of brine inclusions and drainage features, indicating partial brine connectivity within the ice. Although Liu et al. [37] focused on under-ice primary productivity rather than physical mechanics, their micrographs nonetheless show air bubbles occurring in proximity to, and in some cases apparently coalescing with, brine pockets. In contrast, freshwater ice from Lake Ulansuhai [38] exhibits bubble layers that are more discrete and less connected. Taken together, these observations suggest that the presence of brine channels and the adjacency of bubble-brine inclusions in brackish ice reduce the effective bonding within the ice skeleton, thereby weakening its strength and stiffness. This interpretation is consistent with Timco and O’Brien [19], who attributed the lower strength of sea ice relative to freshwater ice to the presence and connectivity of brine inclusions.
Figure 13 presents the relationships between flexural strength and effective elastic modulus with the square root of brine (or porosity) volume fraction, comparing the present results with previously published datasets for brackish and sea ice. In the main figure, the present data are plotted against the square root of porosity, as the correlation between the experimental results and brine volume fraction was relatively weak. To maintain consistency with existing literature, however, the other datasets for sea ice and brackish ice are plotted using the square root of brine volume fraction as the influencing factor. Due to the large number of data points, the results from Refs. [18,19] are shown only as fitted curves. To enable a more direct comparison under similar brackish ice conditions, the inset of Figure 13a re-plots the present data using the square root of brine volume fraction as the independent variable, in accordance with the empirical relationship for brackish ice proposed in Ref. [35]. Overall, both flexural strength and modulus decrease with increasing brine volume fraction (porosity) across all datasets. However, at comparable brine levels, brackish ice consistently exhibits higher values than sea ice. For example, at a v b of approximately 0.3, the flexural strength of brackish ice remains 378.82 kPa, whereas sea ice typically ranges between 179.93 and 301.59 kPa. Similarly, the effective elastic modulus of brackish ice falls remains 1.56 to 3.84 GPa, compared to 0.25 to 2.30 GPa for sea ice under the same conditions. The fitted curves further emphasize this offset, with the brackish ice regression consistently lying above those of sea ice. This indicates that, although porosity governs the mechanical weakening of both brackish and sea ice, brackish ice retains higher strength and stiffness due to the absence of extensive brine drainage systems and weaker dynamic forcing during growth, which promote a denser internal structure. The fitted curve for brackish ice reported in Ref. [35] agrees well with the present results during the growth and stable periods, confirming the reliability of the empirical relationship. However, during the melt period, the measured data deviate from this trend due to brine drainage and a concurrent increase in air volume fraction, further demonstrating the limitation of using brine volume fraction alone as the influencing factor.
It should be noted that when the v b is below 0.24, the fitted strength curve of Ref. [19] exceeds that of the present study. This discrepancy arises because the regression in Ref. [19] was not solely based on full-scale cantilever beam tests but also incorporated simply supported beams and small-scale specimens. Previous studies have demonstrated that simply supported beams and cantilever beams exhibit fundamentally different mechanical responses, with the discrepancy being particularly pronounced in floating cantilevers. In such cases, loading is not purely governed by self-weight but instead approaches a “pure bending” condition, where shear stresses induced by lateral forces are minimal. Consequently, cantilever deformation is controlled by a combination of tension and compression, whereas free-beam tests involve significant lateral forces that systematically overestimate flexural strength, even when beam dimensions are identical. In the present study, the fitted curve predicts a flexural strength of 703 kPa at zero brine volume fraction, which is in good agreement with the full-scale freshwater cantilever beam tests reported in Ref. [19]. This further demonstrates that the formula of Ref. [19] tends to overestimate sea-ice full-scale flexural strength in the low-salinity regime.

4.2. Fracture of Ice During Melt Period

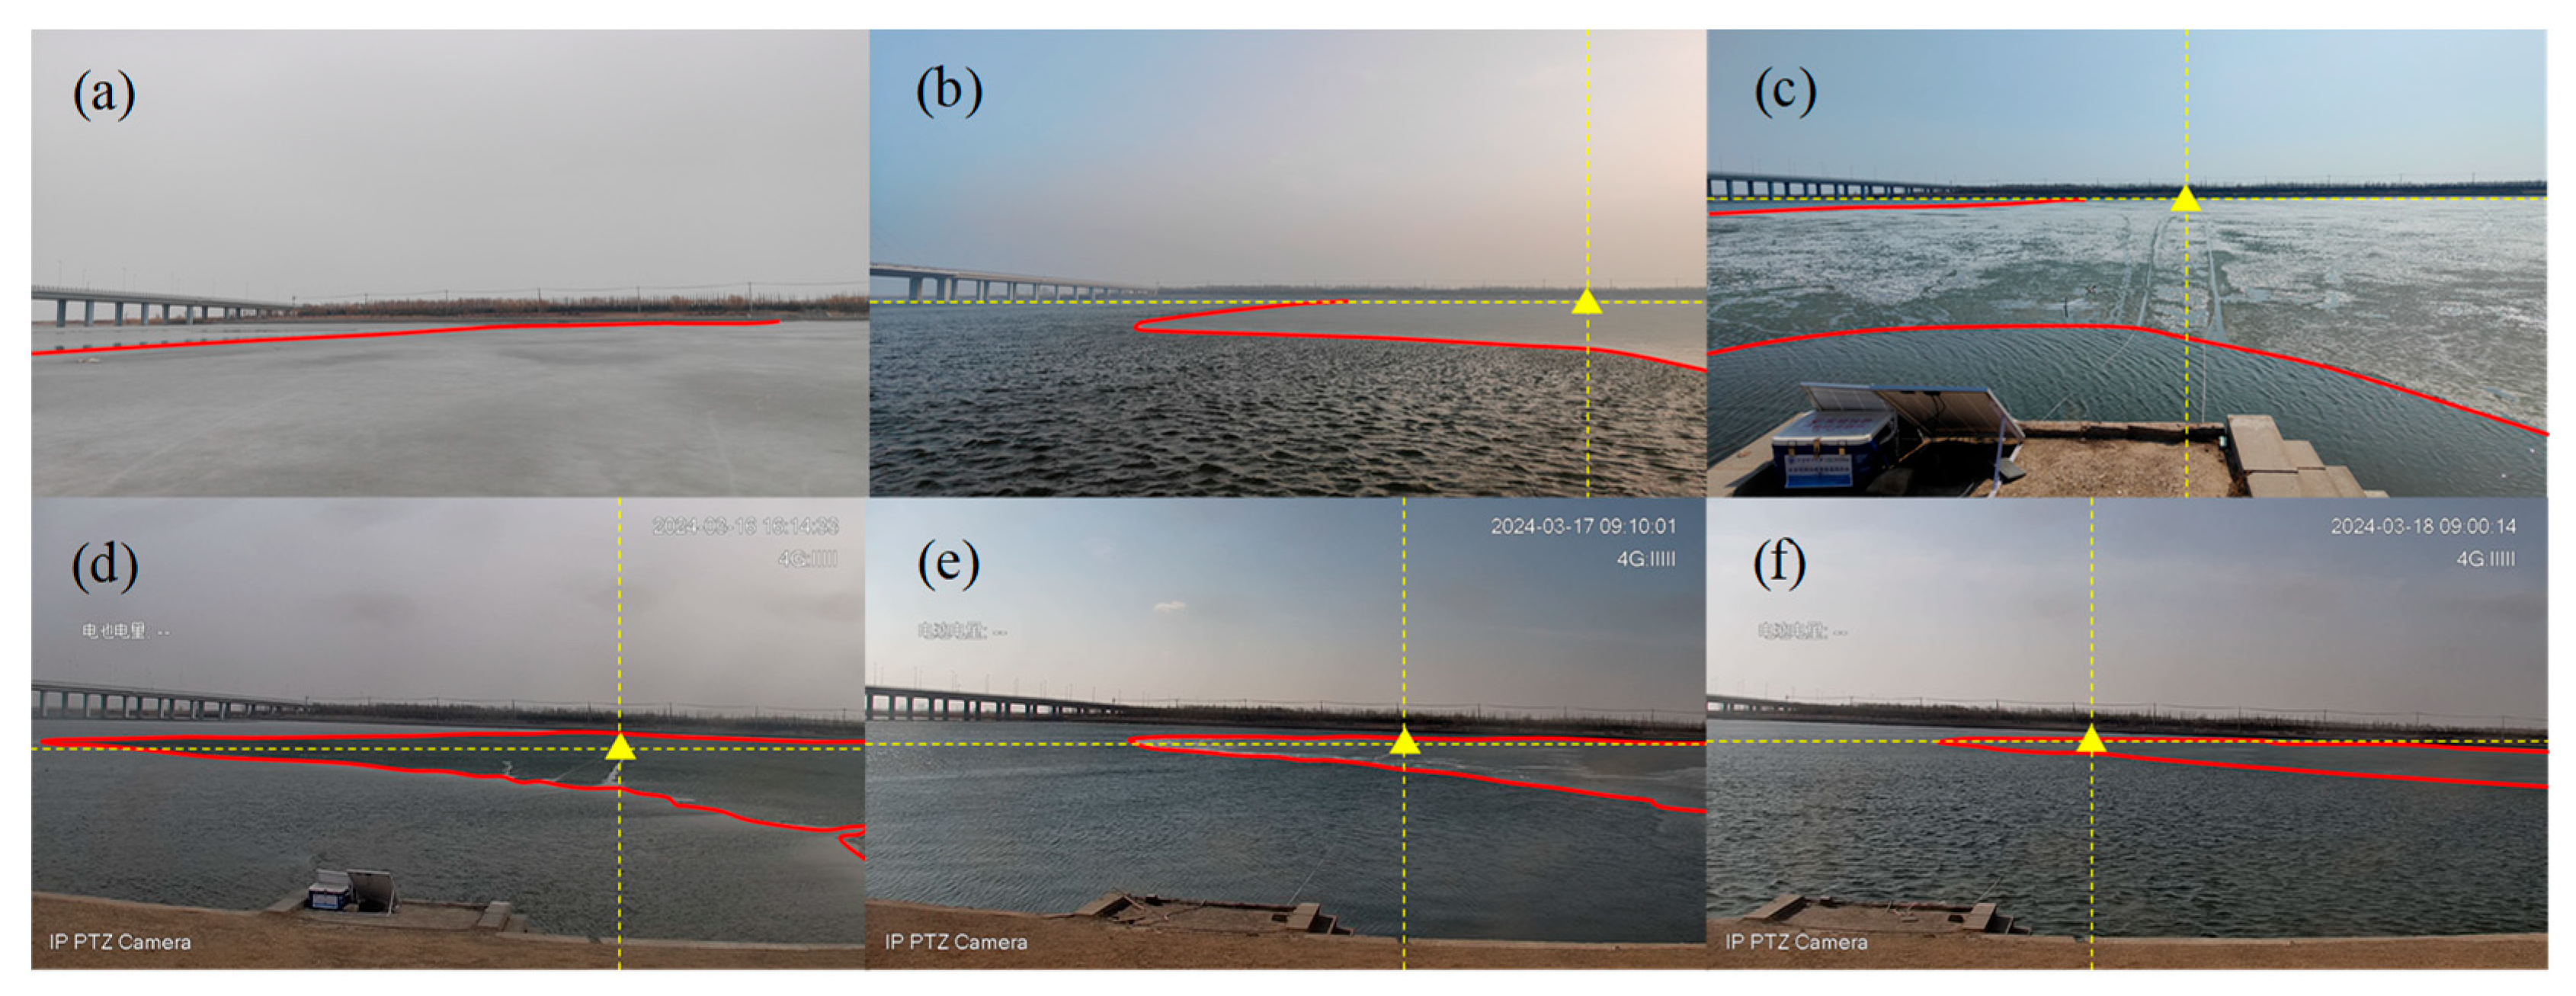
Figure 14 shows the melting of the ice cover on selected dates during the melt period. Figure 14a–c were captured with a mobile phone, while Figure 14d–f were captured by a fixed surveillance camera from the same angle, providing a clear record of the advance of the melt front. The yellow triangle indicates the location of the ice thickness monitoring device, the red line marks the boundary between melting ice and open water, and the yellow dashed line serves as a reference line. Melting typically initiated from the side near the sea outlet and along the shoreline, and then gradually advanced toward the opposite side of the lake. Rising air temperature and solar radiation increased the surface ice temperature and promoted the interconnection of internal brine channels, resulting in a sharp increase in porosity and a substantial weakening of the load-bearing skeleton. At the macroscopic scale, this was manifested as surface meltwater and initial cracks (Figure 14a). As open-water areas expanded (Figure 14b–e), hydrodynamic forcing from waves and lake currents became concentrated along the ice edges, triggering bending failure in the marginal regions. The newly exposed ice–water interfaces further accelerated brine connectivity and gas accumulation, leading to block detachment of the ice cover under continued wave action. Ultimately, the melt front progressively advanced toward the lake center, and by March 18 (Figure 14f), the ice cover at the monitoring site had completely disintegrated. This process explains the markedly reduced flexural strength and effective elastic modulus during the melt period and highlights the mechanism by which the ice cover can rapidly collapse within a short timescale.

5. Conclusions

This study systematically investigated the flexural strength and effective elastic modulus of brackish ice through full-scale in situ tests on ice cover of Hanzhang Lake. The analysis further identified the most effective predictors and regression models, and examined the influences of loading direction and ice period on the mechanical behavior. The main findings are as follows:
(1)
Exponential functions were identified as the most effective form for fitting the relationships between flexural strength, effective elastic modulus, and ice physical properties. Although fracture under different loading modes is governed by the physical properties of different parts of the ice layer, comparison among alternative parameterizations revealed that the bulk mean values of physical properties provided the best predictive performance. Both flexural strength and effective elastic modulus decreased with increasing porosity and gas volume fraction, with porosity yielding the highest goodness-of-fit, highlighting its dominant role in controlling ice mechanical behavior. The empirical formulas for the full-scale flexural mechanical properties of brackish ice, as shown in Equations (3) and (4).
(2)
Flexural strength obtained under downward loading was systematically higher than that under upward loading, with differences ranging from 17.3 to 38.8%. This behavior can be attributed to the presence of granular crystals in the upper ice layer and the progressive increase in columnar crystal diameters with depth, which weakened intergranular bonding in the tensile zone and reduced tensile resistance. In contrast, the effective elastic modulus reflects the overall stress–strain response rather than the failure threshold. Although no clear directional dependence of the modulus was observed in this study, the inherent variability of full-scale in situ measurements suggests that more data are needed before a definitive conclusion can be drawn regarding the relationship between loading direction and elastic modulus.
(3)
No significant differences were observed in flexural strength or effective elastic modulus between the growth and stable periods, as both exhibited comparable mechanical levels. In contrast, the melt period showed a marked reduction: flexural strength decreased by approximately 33–42%, and effective elastic modulus decreased by 49–61% relative to the growth and stable periods. This deterioration is primarily attributed to the interconnection of brine channels and substantial brine drainage during melting, combined with increased gas volume fraction and porosity, which weakened the load-bearing skeleton. Furthermore, grain-boundary wetting and bubble accumulation reduced the overall stiffness, thereby accelerating the degradation of mechanical properties.
(4)
Comparisons with existing datasets indicate that the mechanical properties of brackish ice are lower than those of freshwater ice but higher than those of sea ice. At the same temperature, its flexural strength and effective elastic modulus are about 30–50% lower than freshwater ice, due to brine inclusions and bubbles weakening the load-bearing skeleton. At the same porosity, however, brackish ice outperforms sea ice; for example, at a porosity square root of 0.3, its strength (379 kPa) and modulus (1.56–3.84 GPa) exceed those of sea ice (180–302 kPa, 0.25–2.30 GPa). This difference reflects the denser structure of brackish ice, formed under weaker brine drainage and dynamic forcing.
This study systematically analyzed the flexural strength and effective elastic modulus of brackish ice, bridging the gap between freshwater and sea ice and providing valuable in situ data for ice mechanics databases in both polar and mid-latitude regions. Nevertheless, several limitations remain. First, the preparation of cantilever beams was time-consuming, and the cutting process inevitably altered the thermal state of the beams. Although temperatures were measured immediately after testing, they may not have fully reflected the in situ conditions within the ice. Second, while bulk porosity was statistically identified as the optimal predictor of flexural properties, this conclusion was derived empirically and lacks mechanistic interpretation. Finally, the presence of granular ice near the surface contributed to the higher strength observed under downward loading, yet crystal size was not quantitatively incorporated into the predictive formulations for strength and modulus. In future work, efforts should focus on reducing beam preparation time, improving thermal measurements, clarifying the mechanistic role of porosity, and integrating crystal-scale parameters, thereby enabling a more comprehensive understanding of the mechanical behavior of brackish ice.

Author Contributions

Writing—original draft, investigation, data curation, methodology, S.J.; writing—original draft, investigation, formal analysis, Y.L.; conceptualization, writing—review and editing, supervision, formal analysis, resources, Q.W.; conceptualization, writing—review and editing, supervision, resources, P.L.; investigation, data curation, S.Y. All authors have read and agreed to the published version of the manuscript.

Funding

This research was funded by the Open Fund of State Key Laboratory of Coastal and Offshore Engineering (SL2507); the Hi-Tech Ship Project of the Ministry of Industry and Information Technology (CBG2N21-2-3); the National Natural Science Foundation of China (U24A20582).

Data Availability Statement

The original contributions presented in this study are included in the article. Further inquiries can be directed to the corresponding author.

Conflicts of Interest

The authors declare no conflicts of interest.

References

  1. Blagrave, K.; Sharma, S. Projecting climate change impacts on ice phenology across Midwestern and Northeastern United States lakes. Clim. Change 2023, 176, 119. [Google Scholar] [CrossRef]
  2. Ruan, Y.A.; Zhang, X.; Xin, Q.; Qiu, Y.; Sun, Y. Prediction and analysis of lake ice phenology dynamics under future climate scenarios across the inner Tibetan Plateau. J. Geophys. Res.-Atmos. 2020, 125, e2020JD033082. [Google Scholar] [CrossRef]
  3. Stroeve, J.; Notz, D. Changing state of Arctic sea ice across all seasons. Environ. Res. Lett. 2018, 13, 103001. [Google Scholar] [CrossRef]
  4. Huo, P.; Peng, L.; Cheng, B.; Yu, M.; Wang, Q.; Li, X.; Li, Z. Reconstructing ice phenology of a lake with complex surface cover: A case study of Lake Ulansu during 1941–2023. Cryosphere 2025, 19, 849–868. [Google Scholar] [CrossRef]
  5. Wang, X.; Feng, L.; Qi, W.; Cai, X.; Zheng, Y.; Gibson, L.; Tang, J.; Song, X.; Liu, J.; Zheng, C.; et al. Continuous loss of global lake ice across two centuries revealed by satellite observations and numerical modeling. Geophys. Res. Lett. 2022, 49, e2022GL099022. [Google Scholar] [CrossRef]
  6. Sharma, S.; Richardson, D.C.; Woolway, R.I.; Imrit, M.A.; Bouffard, D.; Blagrave, K.; Daly, J.; Filazzola, A.; Granin, N.; Korhonen, J.; et al. Loss of ice cover, shifting phenology, and more extreme events in northern hemisphere lakes. J. Geophys. Res-Biogeo. 2021, 126, e2021JG006348. [Google Scholar] [CrossRef]
  7. Zhang, C.; Zhao, X. Theoretical model for predicting the break-up of ice covers due to wave-ice interaction. Appl. Ocean Res. 2021, 112, 102614. [Google Scholar] [CrossRef]
  8. Masterson, D.M. State of the art of ice bearing capacity and ice construction. Cold Reg. Sci. Technol. 2009, 58, 99–112. [Google Scholar] [CrossRef]
  9. Aly, M.; Taylor, R.; Dudley, E.B.; Turnbull, I. Scale effect in ice flexural strength. J. Offshore Mech. Arct. 2019, 141, 051501. [Google Scholar] [CrossRef]
  10. Wei, M.; Dai, F. Laboratory-scale mixed-mode I/II fracture tests on columnar saline ice. Theor. Appl. Fract. Mech. 2021, 114 (Suppl. SC), 102982. [Google Scholar] [CrossRef]
  11. Wei, M.; Prasanna, M.; Cole, D.M.; Polojärvi, A. Response of dry and floating saline ice to cyclic compression. Geophys. Res. Lett. 2022, 49, e2022GL099457. [Google Scholar] [CrossRef]
  12. Wei, M.; Polojärvi, A.; Cole, D.M.; Prasanna, M. Strain response and energy dissipation of floating saline ice under cyclic compressive stress. Cryosphere 2020, 14, 2849–2867. [Google Scholar] [CrossRef]
  13. Marchenko, A.; Karulin, E.; Chistyakov, P.; Karulina, M.; Sakharov, A. Meso-scale stress relaxation test on floating sea ice. In Proceedings of the 27th International Conference on Port and Ocean Engineering under Arctic Conditions, Glasgow, UK, 12–16 June 2023. [Google Scholar]
  14. Marchenko, A.; Grue, J.; Karulin, E.; Frederking, R.; Lishiman, B.; Chistyakov, P.; Karulina, M.; Sodhi, D.; Renshaw, C.; Sakharov, A.; et al. Elastic moduli of sea ice and lake ice calculated from in-situ and laboratory experiments. In Proceedings of the 25th IAHR International Symposium on Ice, Trondheim, Norway, 23–25 June 2020. [Google Scholar]
  15. Voermans, J.J.; Rabault, J.; Marchenko, A.; Nose, T.; Waseda, T.; Babanin, A.V. Estimating the elastic modulus of landfast ice from wave observations. J. Glaciol. 2023, 69, 1823–1833. [Google Scholar] [CrossRef]
  16. Karulina, M.; Marchenko, A.; Karulin, E.; Sodhi, D.; Sakharov, A.; Chistyakov, P. Full-scale flexural strength of sea ice and freshwater ice in Spitsbergen Fjords and North-West Barents Sea. Appl. Ocean Res. 2019, 90, 101853. [Google Scholar] [CrossRef]
  17. Tian, Y.; Zhao, W.; Yu, C.; Gang, X.; Lu, P.; Yue, Q. Investigations on flexural strength of a columnar saline model ice under circular plate central loading. Water 2023, 15, 3371. [Google Scholar] [CrossRef]
  18. Krupina, N.A.; Kubyshkin, N.V. Flexural strength of drifting level first-year ice in the Barents Sea. In Proceedings of the 17th International Offshore and Polar Engineering Conference, Lisbon, Portugal, 1–6 July 2007. [Google Scholar]
  19. Timco, G.W.; O’Brien, S. Flexural strength equation for sea ice. Cold Reg. Sci. Technol. 1994, 22, 285–298. [Google Scholar] [CrossRef]
  20. Lainey, L.; Tinawi, R. The mechanical properties of sea ice — A compilation of available data. Can. J. Civ. Eng. 1984, 11, 884–923. [Google Scholar] [CrossRef]
  21. Han, H.; Jia, Q.; Huang, W.; Li, Z. Flexural strength and effective modulus of large columnar-grained freshwater ice. Cold Reg. Sci. Technol. 2015, 30, 04015005. [Google Scholar] [CrossRef]
  22. Murdza, A.; Marchenko, A.; Schulson, E.M.; Renshaw, C.E. Cyclic strengthening of lake ice. J. Glaciol. 2021, 67, 182–185. [Google Scholar] [CrossRef]
  23. Murdza, A.; Schulson, E.M.; Renshaw, C.E. Behavior of saline ice under cyclic flexural loading. Cryosphere 2021, 15, 2415–2428. [Google Scholar] [CrossRef]
  24. Wang, Q.; Liu, Y.; Lu, P.; Li, Z. The mechanical properties of gas-enriched sea ice. Cold Reg. Sci. Technol. 2025, 239, 104576. [Google Scholar] [CrossRef]
  25. Frederking, R.M.W.; Timco, G.W. On measuring flexural properties of ice using cantilever beams. Ann. Glaciol. 1983, 4, 58–65. [Google Scholar]
  26. Frederking, R.M.W.; Svec, O.J. Stress-relieving techniques for cantilever beam tests in an ice cover. Cold Reg. Sci. Technol. 1985, 11, 247–253. [Google Scholar] [CrossRef]
  27. Hutchings, J.K.; Heil, P.; Lecomte, O.; Stevens, R.; Steer, A.; Lieser, J.L. Comparing methods of measuring sea-ice density in the East Antarctic. Ann. Glaciol. 2015, 56, 385–386. [Google Scholar] [CrossRef]
  28. Pustogvar, A.; Kulyakhtin, A. Sea ice density measurements: Methods and uncertainties. Cold Reg. Sci. Technol. 2016, 131, 46–52. [Google Scholar] [CrossRef]
  29. Cox, G.F.N.; Weeks, W.F. Equations for determining the gas and brine volumes in sea ice samples. J. Glaciol. 1983, 29, 306–316. [Google Scholar] [CrossRef] [PubMed]
  30. Leppäranta, M.; Manninen, T. The Brine and Gas Content of Sea Ice with Attention to Low Salinities and High Temperatures; Finnish Institute of Marine Research: Helsinki, Finland, 1988. [Google Scholar]
  31. Eicken, H.; Dieckmann, G.S.; Thomas, D.N. From the microscopic, to the macroscopic, to the regional scale: Growth, microstructure and properties of sea ice. In Sea Ice, 2nd ed.; David, N.T., Gerhard, S.D., Eds.; Blackwell Science Ltd: Oxford, UK, 2003; pp. 22–81. [Google Scholar] [CrossRef]
  32. Wang, J.; Cao, X.; Wang, Q.; Yan, L.; Li, Z. Experimental relationship between flexural strength, elastic modulus of ice sheet and equivalent ice temperature. J. South-North Water Transf. Water Sci. Technol. 2016, 14, 75–380. [Google Scholar] [CrossRef]
  33. Frankenstein, G.E. Strength data on lake ice. In U.S. Army Snow Ice and Permafrost Research Establishment; Corps of Engineers: Wilmette, IL, USA, 1961; p. 20. [Google Scholar]
  34. Ervik, Å. Experimental and Numerical Investigations of Cantilever Beam Tests in Floating Ice Covers. Master’s Thesis, Norwegian University of Science and Technology, Lonyearbyen, Norway, 2013. [Google Scholar]
  35. Bogorodsky, V.V.; Gavrilo, V.P. Ice. Physical properties. In Modern Methods of Glaciology; Gidrometeoizdat: Leningrad, Russia, 1980; p. 384. [Google Scholar]
  36. Zhang, H.; Yu, M.; Lu, P.; Zhou, J.; Zhou, J.; Xie, F.; Wang, Q.; Li, Z. Experimental investigation of the partitioning of radiation in the melt pond–ice–ocean system. Cold Reg. Sci. Technol. 2024, 219, 104107. [Google Scholar] [CrossRef]
  37. Liu, T.; Zhang, Y.; Li, Z.; Yu, M.; Xie, F.; Georgiy, K.; Yang, Z. Optical properties of ice in a shallow Chinese lake (Hanzhang) with consequent impacts on primary production. Sci. Total Environ. 2023, 957, 177512. [Google Scholar] [CrossRef]
  38. Yang, F.; Li, C.; Shi, X.; Zhao, S.; Hao, Y. Impact of seasonal ice structure characteristics on ice cover impurity distributions in Lake Ulansuhai. J. Lake Sci. 2016, 28, 455–462. [Google Scholar] [CrossRef] [PubMed]
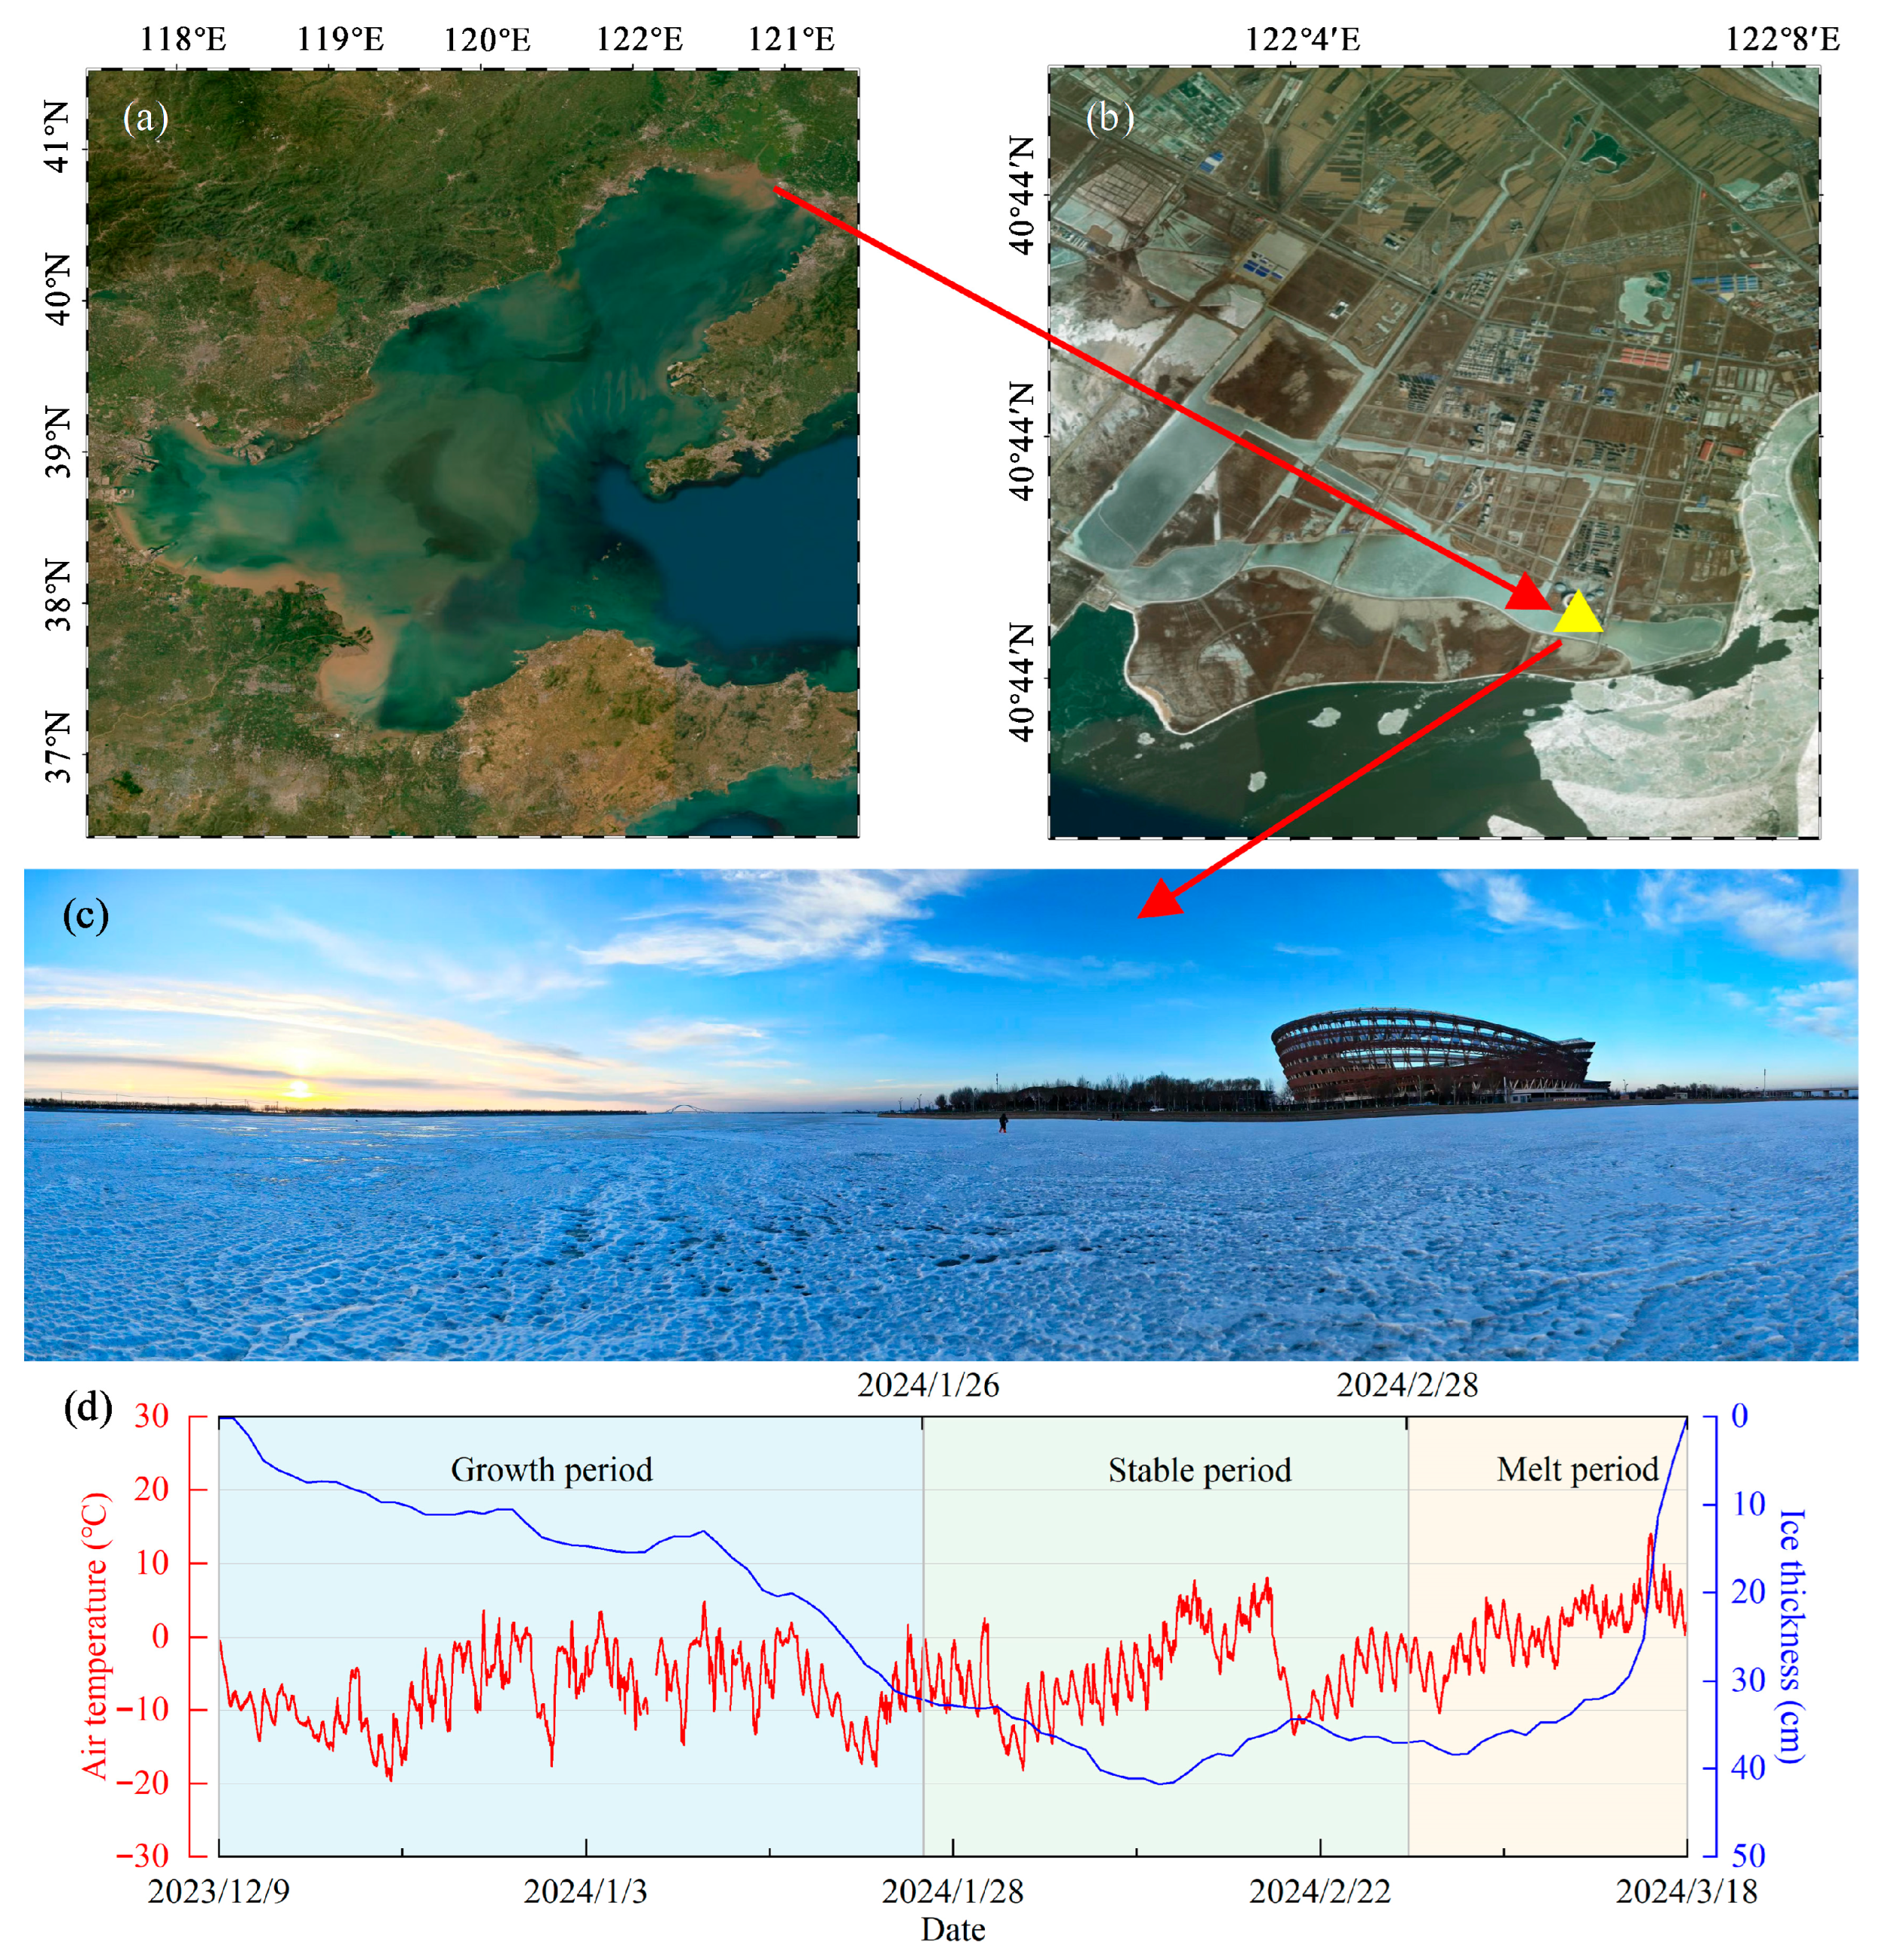
Figure 1. Location and temperature of the study area: (a) Bohai Sea; (b) Hanzhang Lake; (c) Field view of the experimental field; (d) line graph of ice thickness and air temperature changes during the experimental period.
Water 17 03189 g001
Figure 2. Preparation process for cantilever beam samples: (a) Array of cantilever beam samples; (b) Trimming the roots of the beams to a rounded shape.
Water 17 03189 g002
Figure 3. Cantilever beam testing equipment: (a) Two types of loading frames; (b) Collecting data and integrating mechanical components; (c) Load and displacement sensors.
Water 17 03189 g003
Figure 4. Crystal structures of brackish ice with corresponding tested ice layer depth ranges for each test group. Note: The colors observed in the vertical and horizontal thin sections represent the natural birefringence patterns of ice crystals with different growth orientations under cross-polarized light and are not artificially added.
Water 17 03189 g004
Figure 5. Vertical distributions of temperature, salinity, and density of the ice layer for each test group.
Water 17 03189 g005
Figure 6. Vertical distributions of volume fraction of gas, volume fraction of brine, and porosity of the ice layer for each test group.
Water 17 03189 g006
Figure 7. Relationship between ice physical parameters and flexural strength: (a) Goodness-of-fit heat map for different influencing factors (brine volume fraction vb, gas volume fraction va, and porosity v) at various fractional depths from the tensile surface, under four regression models: logarithmic (Log.), power-law (P–L), linear (Lin.), and exponential (Exp.); (bd) Relationships between flexural strength and the square root of brine volume fraction, gas volume fraction, and porosity, respectively, with exponential fits shown.
Water 17 03189 g007
Figure 8. Relationship between ice physical parameters and effective elastic modulus: (a) Goodness-of-fit heat map for different influencing factors at various fractional depths from the tensile surface, under four regression models (notations as in Figure 7); (bd) Relationships between effective elastic modulus and the square root of brine volume fraction, gas volume fraction, and porosity, respectively, with exponential fits shown.
Water 17 03189 g008
Figure 9. Mean flexural strength (a) and effective elastic modulus (b) of brackish ice under different groups, loading directions, and ice periods.
Water 17 03189 g009
Figure 10. Relationships between flexural strength and the square root of porosity under different loading directions with various porosity averaging methods: Porosity averaged over the (a) upper 1/8 tensile side; (b) upper 4/8 tensile side; (c) bulk. Where d means downward loaded and u means upward loaded.
Water 17 03189 g010
Figure 11. Relationships between effective elastic modulus and the square root of porosity under different loading directions with various porosity averaging methods: Porosity averaged over the (a) upper 1/8 tensile side; (b) upper 4/8 tensile side; (c) bulk.
Water 17 03189 g011
Figure 12. Comparison of brackish ice with freshwater ice from previous studies: (a) flexural strength as a function of ice temperature; (b) effective elastic modulus as a function of ice temperature. Note: The references mentioned in the figure legend are [16,32,33] (from top to bottom).
Water 17 03189 g012
Figure 13. Comparison of brackish ice with sea ice and brackish ice from previous studies: (a) flexural strength and (b) effective elastic modulus as a function of square root of brine(porosity) volume fraction. Note: In the main figure, the present brackish-ice data are plotted using porosity, whereas the literature datasets are plotted using brine volume fraction. In the inset figure, the present brackish-ice data are re-plotted as a function of brine volume fraction for direct comparison. Note: The references mentioned in the figure legend are [16,18,19,34,35] (from top to bottom).
Water 17 03189 g013
Figure 14. Photographs showing surface melting conditions of the ice cover at different times during the melt season: (a) 11 March 2024; (b) 14 March 2024; (c) 15 March 2024; (d) 16 March 2024; (e) 17 March 2024; (f) 18 March 2024.
Water 17 03189 g014
Table 1. Summary of cantilever beam tests conducted on brackish ice.
No.Date of TestIce PeriodIce Thickness
(m)
Number of Beams
(Upward/Downward)
Ice Surface Condition
117 January 2024Growth0.38 4 (2/2)Snow-covered and smooth surface
222 January 2024Growth0.374 (2/2)Snow-covered and smooth surface
326 January 2024Stable0.436 (3/3)Snow-covered and smooth surface
430 January 2024Stable0.406 (3/3)Snow-covered and smooth surface
524 February 2024Stable0.4510 (1/9)Rough surface
612 March 2024Melt0.2810 (5/5)Wet surface
Table 2. Summary of flexural strength and effective elastic modulus of brackish ice beams of each test group. Note: One test conducted during the melt period was excluded due to displacement sensor freezing, which prevented valid data recording.
GroupBeam Volume
(m3)
Loading DirectionNumber of Valid Datasets (n)Flexural Strength
(kPa)
Effective Modulus
(GPa)
Mean
Flexural Strength
(MPa)
Mean
Effective Modulus
(GPa)
Growth 10.99 ± 0.005Upward2290.12 ± 35.912.86 ± 0.90346.75 ± 68.92.62 ± 0.60
Downward2403.37 ± 11.332.39 ± 0.26
Growth 20.99 ± 0.004Upward2415.52 ± 7.974.65 ± 0.75469.65 ± 62.693.84 ± 1.04
Downward2523.78 ± 2.343.02 ± 0.24
Stable 11.30 ± 0.009Upward3318.96 ± 44.183.22 ± 0.74383.24 ± 76.692.81 ± 0.70
Downward3447.53 ± 39.062.41 ± 0.42
Stable 21.06 ± 0.011Upward3300.66 ± 28.342.79 ± 0.34396.09 ± 107.823.16 ± 0.56
Downward3491.52 ± 30.633.53 ± 0.50
Stable 31.37 ± 0.031Upward1370.46 3.22 440.07 ± 35.743.23 ± 0.58
Downward9447.81 ± 27.643.23 ± 0.61
Melt0.38 ± 0.022Upward5202.69 ± 12.881.46 ± 0.22250.21 ± 58.581.56 ± 0.28
Downward4309.61 ± 21.471.68 ± 0.32
Table 3. Summary of literature data on flexural strength and effective elastic modulus of freshwater and sea ice, with inclusion of brackish ice results from this study and newly derived regression relationships.
Ice TypeAuthorLocationTest DateNumber of Data PointsFlexural Strength
(kPa)
Effective Modulus
(GPa)
Fit Line
Brackish iceThis studyLake Hanzhang202439374.21 ± 99.932.77 ± 0.93 σ f = 0.029 T + 0.333
E = 0.322 T + 2.23
σ f = 0.703 e x p ( 2.061 v )
E = 6.519 e x p ( 2.738 v )
[35]Gulf of Finland2006/// σ f = 0.7 ( 1 v b 0.202 )
Freshwater ice [16]Spitsbergen
Fjords
2012–201515486.60 ± 149.672.91 ± 1.26/
[32]Lake Ulansuhai20169665.75 ± 93.485.32 ± 1.14 σ f = 0.022 T + 0.564
E = 0.319 T + 3.86
[33]Chassell Bay and Keweenaw Bay1957–195849438.73 ± 170.36//
Sea ice[16]Spitsbergen
Fjords and North-West Barents Sea
2010–201862258.58 ± 85.381.24 ± 0.62 σ f = 0.527 e x p ( 2.804 v b )
E = 3.103 e x p ( 3.385 v b )
[18]South-East Barents Sea and North-East Barents Sea1996–2006138252.00 ± 84.00/ σ f = 0.346 v b + 0.372
[19]Labrador, Greenland, Alaska, Antarctica, Beaufortsea, Baffin, Bothnia, Japan, Spitzbergen1955–19922495// σ f = 1.76 e x p ( 5.88 v b )
[34]North-West Barents Sea201312225.25 ± 81.151.03 ± 0.55 σ f = 0.656 e x p ( 4.312 v b )
Disclaimer/Publisher’s Note: The statements, opinions and data contained in all publications are solely those of the individual author(s) and contributor(s) and not of MDPI and/or the editor(s). MDPI and/or the editor(s) disclaim responsibility for any injury to people or property resulting from any ideas, methods, instructions or products referred to in the content.