Article

Key Controlling Factors and Sources of Water Quality in Agricultural Rivers: A Study on the Water Source Area for the South-to-North Water Transfer Project

1
Shandong Provincial Geo-Mineral Engineering Exploration Institute (801 Institute of Hydrogeology and Engineering Geology, Shandong Provincial Bureau of Geology and Mineral Resources), Jinan 250014, China
2
Shandong Engineering Research Center for Environmental Protectionand Remediation on Groundwater, Jinan 250014, China
3
Shandong Coalfield Geological Planning Research Institute, Jinan 250000, China
4
Shandong Provincial NO. 4 Institute of Geological and Mineral Survey, Weifang 261021, China
5
Huaxin College, HeBei GEO University, Shijiazhuang 050700, China
6
Hebei and China Geological Survey Key Laboratory of Groundwater Remediation, Institute of Hydrogeology and Environmental Geology, Chinese Academy of Geological Sciences, Shijiazhuang 050061, China
*
Authors to whom correspondence should be addressed.
Water 2025, 17(21), 3111; https://doi.org/10.3390/w17213111
Submission received: 20 September 2025 / Revised: 29 October 2025 / Accepted: 29 October 2025 / Published: 30 October 2025

Abstract

River water quality is a direct determinant of both drinking water security and regional economic vitality. However, the hydrochemical trajectories and solute provenance of agricultural streams remain only fragmentarily understood. Here, we examine the Jinqian River—a representative agricultural tributary of the Danjiangkou Reservoir source area for the South-to-North Water Diversion Project—by coupling hydrochemistry with multivariate statistics techniques. The results revealed that the pH values of the river water ranged from 7.55 to 8.30, indicating a weakly alkaline condition. During all three hydrological periods, the concentrations of total nitrogen (TN) exceeded the limits set by the Class Ⅲ surface water quality standards in China, suggesting that the agricultural river has been significantly impacted by human activities. Solute dynamics followed three rainfall-modulated patterns: (i) dilution-driven decreases in the flood season (e.g., Na+), (ii) concentration via flushing or evaporative concentration (e.g., SO42−), and (iii) reservoir-induced damping of seasonal contrasts (e.g., TN), the latter attributable to nitrogen retention behind upstream dams. Geochemical fingerprints reveal that Cl and Na+ originate predominantly from halite dissolution; Ca2+, Mg2+ and HCO3 from coupled carbonate–silicate weathering; and SO42− from evaporite dissolution. Principal component analysis distills four dominant quality controlling factors: agricultural fertilizers, halite weathering, evaporite dissolution, and domestic effluent. These findings provide a quantitative basis for managing nutrient and salt fluxes in agricultural rivers and for safeguarding water sustainability within water-diversion source regions.

1. Introduction

Hydrochemical characterization of river systems underpins both rational water resource management and effective environmental protection [1]. Agricultural tributaries are of particular concern because they must simultaneously sustain ecological functions and support intensive human use. These channels are frequently confronted with multiple challenges, such as agricultural runoff, industrial emissions, and domestic sewage. These factors can alter the chemical composition of the water, thereby leading to water quality degradation [2,3,4]. Accurate and comprehensive investigation of river water chemistry is crucial for assessing the health of aquatic ecosystems, ensuring the safety of drinking water, and guiding sustainable agricultural practices [5,6]. Within the context of large-scale water-diversion schemes such as China’s South-to-North project, maintaining pristine source-water quality is a prerequisite for long-term engineering success and sustainability [7,8].
The composition of river water reflects a dynamic interplay between natural templates and anthropogenic forcings. Natural factors, including geological composition, hydrological conditions, and climatic variability, determine the baseline water quality and natural variations of water bodies [9]. Anthropogenic factors, such as agricultural activities, industrial processes, and urban development, introduce additional substances and pollutants into river systems. For instance, agricultural runoff can introduce nutrients, pesticides, and sediments, while industrial emissions may contain heavy metals and organic compounds [10]. Previous studies have identified a variety of factors that influence river water chemistry. However, the relative importance of these factors may vary significantly across different regions and river systems.
Preventing hydrochemical degradation hinges on the unambiguous identification of solute provenance. Accurate identification and quantification of these sources are essential steps in developing effective pollution control strategies [11,12]. Globally, researchers have exploited chemical fingerprints, stable-isotope tracers, and statistical unmixing models to reconstruct the origin of dissolved and suspended constituents [13,14,15]. However, the current understanding of the patterns of water quality variation and the sources of substances in complex agricultural river systems remains inadequate.
To fill these knowledge gaps, this study focuses on the Jinqian River, a typical agricultural river in the water source area of the South-to-North Water Diversion Project. This study investigates the characteristics and controlling factors of water chemistry in agricultural rivers by conducting periodic sampling and applying hydrochemical and multivariate statistical techniques. The primary objectives of this study were to systematically investigate the water quality characteristics and seasonal variations in agricultural rivers, identify the controlling factors influencing these variations, and elucidate the sources of substances affecting agricultural rivers. The findings of this study provide a scientific basis for understanding and managing water quality in agricultural river systems and can be applied to similar regions worldwide.

2. Materials and Methods

2.1. Description of the Study Region

The Jinqian River, a left-bank tributary of the Hanjiang, drains the southern slopes of the Qinling Mountains (109°09′–110°19′ E, 33°11′–33°52′ N). Originating at Jinjing River in Zhashui County, Shaanxi Province, the river traces a 261 km southeasterly course through Zhashui and Shanyang counties before crossing into Hubei and joining the Han River at Yunxi County (Figure 1). Its 5610 km2 catchment experiences a mean annual air temperature of 13.1 °C, 752 mm of precipitation, and 889 mm of evaporation. Roughly four-fifths of the rainfall is delivered between May and October, imparting a pronounced monsoon signature to the hydrological regime.

2.2. Specimen Collection and Testing

2.2.1. Specimen Collection Strategy

Field campaigns were conducted during three hydrologic windows in 2022—dry season (January), normal season (May), and flood season (August)—with one sampling event per season. Along the Jinqian main stem and its tributaries, 19 stations were established (12 on the trunk, 7 on feeders) and sampled sequentially from headwaters to confluence. Ancillary materials comprised four bulk-rainfall collectors and eight municipal effluent grabs. At each river site, water was withdrawn 0.5 m below the mid-channel surface with a 5-L polyethylene sampler, then transferred to pre-rinsed 2-L HDPE bottles that had been triple-washed with de-ionized water and conditioned three times with on-site river water. Samples were kept in portable coolers at 4 °C, transported to the laboratory, and analyzed within seven days of collection.

2.2.2. Analysis of Water Chemistry

The hydrochemical analysis included pH, total dissolved solids (TDS), major ions (K+, Na+, Ca2+, Mg2+, NH4+, Cl, SO42−, NO3, HCO3, F), total nitrogen (TN), and dissolved organic carbon (DOC).
In the field, pH was assessed with a portable multi-parameter analyzer (Hach-HQ40D, Hach Company, Shanghai, China). The concentrations of cations, including K+, Na+, NH4+, Ca2+, and Mg2+, were quantified using atomic absorption spectrophotometry (Agilent 7500ce ICP-MS, Agilent Technologies, Tokyo, Japan). Meanwhile, anions such as Cl, SO42−, F, and NO3 were evaluated via ion chromatography (CIC-D180, Qingdao Shenghan Chromatography Technology Co., Ltd., Qingdao, China). HCO3 levels were determined through hydrochloric acid titration. The TDS were calculated using the drying-gravimetric technique. For TN analysis, the alkaline potassium persulfate digestion combined with UV spectrophotometry was employed (Spectrophotometer, Jingke L9, Shanghai, China). Lastly, DOC was measured by high-temperature catalytic oxidation with a TOC-VCPH analyzer (Shimadzu Corporation, Kyoto, Japan). The detection limits of the analytical methods are summarized in Supplementary Table S1.

2.3. Data Analytics

2.3.1. Water Quality Index (WQI)

The WQI condenses a suite of hydrochemical variables into a single metric that reflects the suitability of surface water for potable use. Each parameter is assigned a weight (Wi) proportional to its perceived health relevance. Thresholds follow the Chinese Grade-III surface-water standard (GB 3838-2002) [16]; analytes not regulated therein adopt guideline values from World Health Organization published in 2017 were utilized [17].
The procedural steps are as follows:
R W i =   W i i = 1 n W i  
Qi = Ci/Si × 100
SIi = Wi × Qi
WQI = ∑SIi

2.3.2. Statistical Analysis

In this study, we employed the Kolmogorov–Smirnov (KS) test and one-way analysis of variance (ANOVA) to examine the seasonal variations in the concentration values of water quality parameters, including pH, SO42−, Na+, HCO3, NO3, and TN, in river water. Initially, the KS test was utilized to evaluate the normality of the data. The results revealed that the concentration values of all six water chemistry parameters conformed to a normal distribution (p > 0.05). Thereafter, one-way ANOVA was conducted to assess the seasonal differences in these water chemistry parameters. Principal component analysis was used to identify the main controlling factors affecting the water quality of the Jinqian River. All the statistical analyses were performed using R software (version 4.4.1, New Zealand).

3. Result

3.1. The Hydrochemical Characteristics of Jinqian River

Table 1 summarizes the hydrochemical signatures of the Jinqian River across the three hydrologic seasons. pH drifted within narrow, slightly alkaline bands: 7.55–7.99 (dry season), 7.96–8.25 (normal season), and 7.74–8.30 (flood season), with respective means of 7.81, 8.10, and 8.13, respectively. The concentrations of DOC during the three periods ranged from 0.765 to 2.38 mg/L, 0.740 to 4.00 mg/L, and 0.700 to 3.23 mg/L, with mean values of 1.14 mg/L, 1.24 mg/L, and 1.31 mg/L, respectively, exhibiting a pattern of flood season > normal season > dry season. The mean concentrations of TN in the three hydrological periods were 3.32 mg/L, 3.22 mg/L, and 3.23 mg/L, respectively, showing a trend of dry season > flood season > normal season. The concentrations of TN in all three hydrological periods exceeded the limits of Class III surface water quality standards in China, indicating a substantial impact of human activities on the water body. Cationic abundance followed the sequence Ca2+ > Mg2+ > Na+ > K+ >NH4+ in all campaigns, while anions ranked HCO3 > SO42−> NO3 >Cl > F. Cl exhibited substantial spatial variability in all three periods (CV > 50%), suggesting that the river water may have been continuously influenced by localized pollution sources, which caused strong spatial heterogeneity. The mean concentrations of TDS followed the order of normal season (278 mg/L) > dry season (275 mg/L) > flood season (249 mg/L), which further indicates that precipitation has a certain diluting effect on the hydrochemical components of the water body.

3.2. Evaluation of Water Quality in the Jinqian River

Water Quality Index (WQI) screening shows that “good” sites predominate in all campaigns, but their proportion declines temporally from 100% (dry season) to 94.7% (normal season) and 89.5% (flood season). Stations classed as “poor” emerge only during normal and flood season phases (5.3% and 10.5%, respectively) (Table 2), underscoring the dual control of hydrologic dilution and episodic external inputs on river water quality.

3.3. The Hydrochemical Type of the Jinqian River

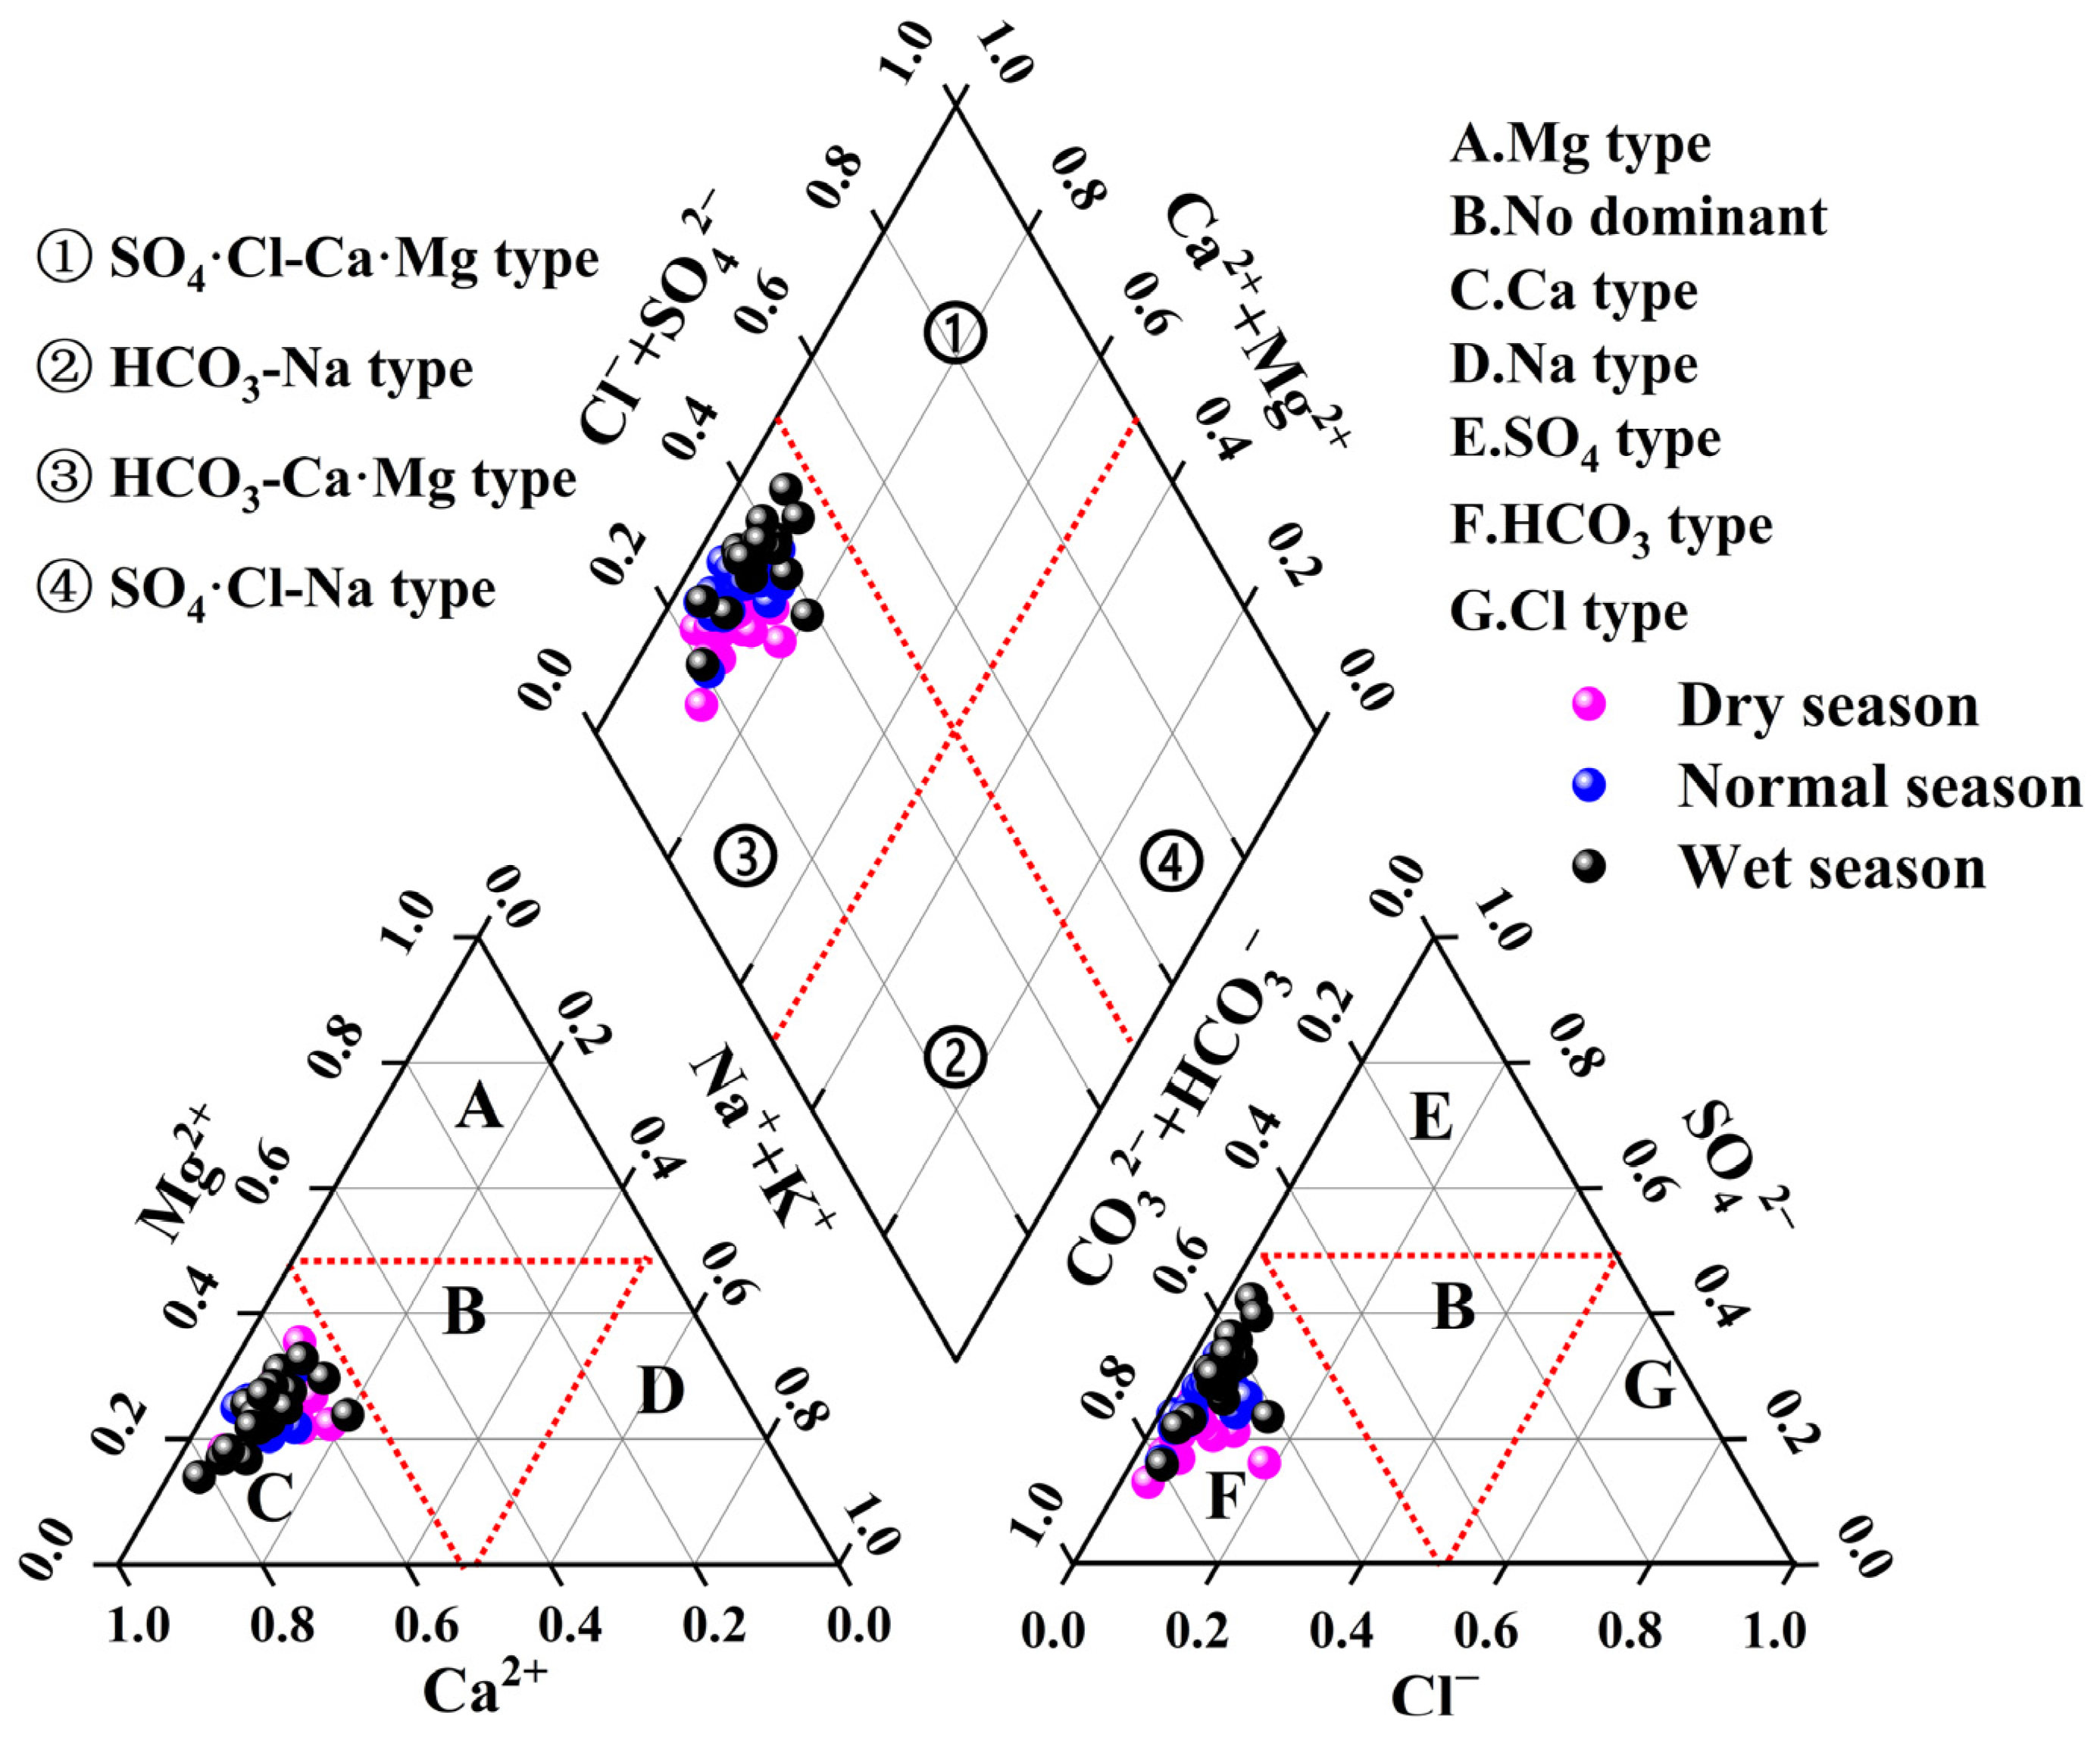
The Piper trilinear diagram classifies the hydrochemical types of river water based on the ionic composition and concentration ratios of the water. As shown in Figure 2, the sample points from all three hydrological periods predominantly fall within the region dominated by HCO3–Ca·Mg type water, indicating that this type is the primary hydrochemical type in the study area. Further analysis of the hydrochemical types using the Schoeller classification method revealed that during the dry season, the water type is mainly HCO3–Ca (accounting for 42.1%), while in the normal and flood seasons, the dominant type is HCO3·SO4–Ca·Mg, with respective proportions of 36.8% and 52.6%. The seasonal variation in hydrochemical types may be related to the increased dissolution of gypsum in the strata due to higher rainfall, as well as the higher evaporation intensity caused by higher temperatures during the flood and normal seasons [18].

4. Discussion

4.1. The Temporal and Spatial Variations of Water Quality in the Jinqian River

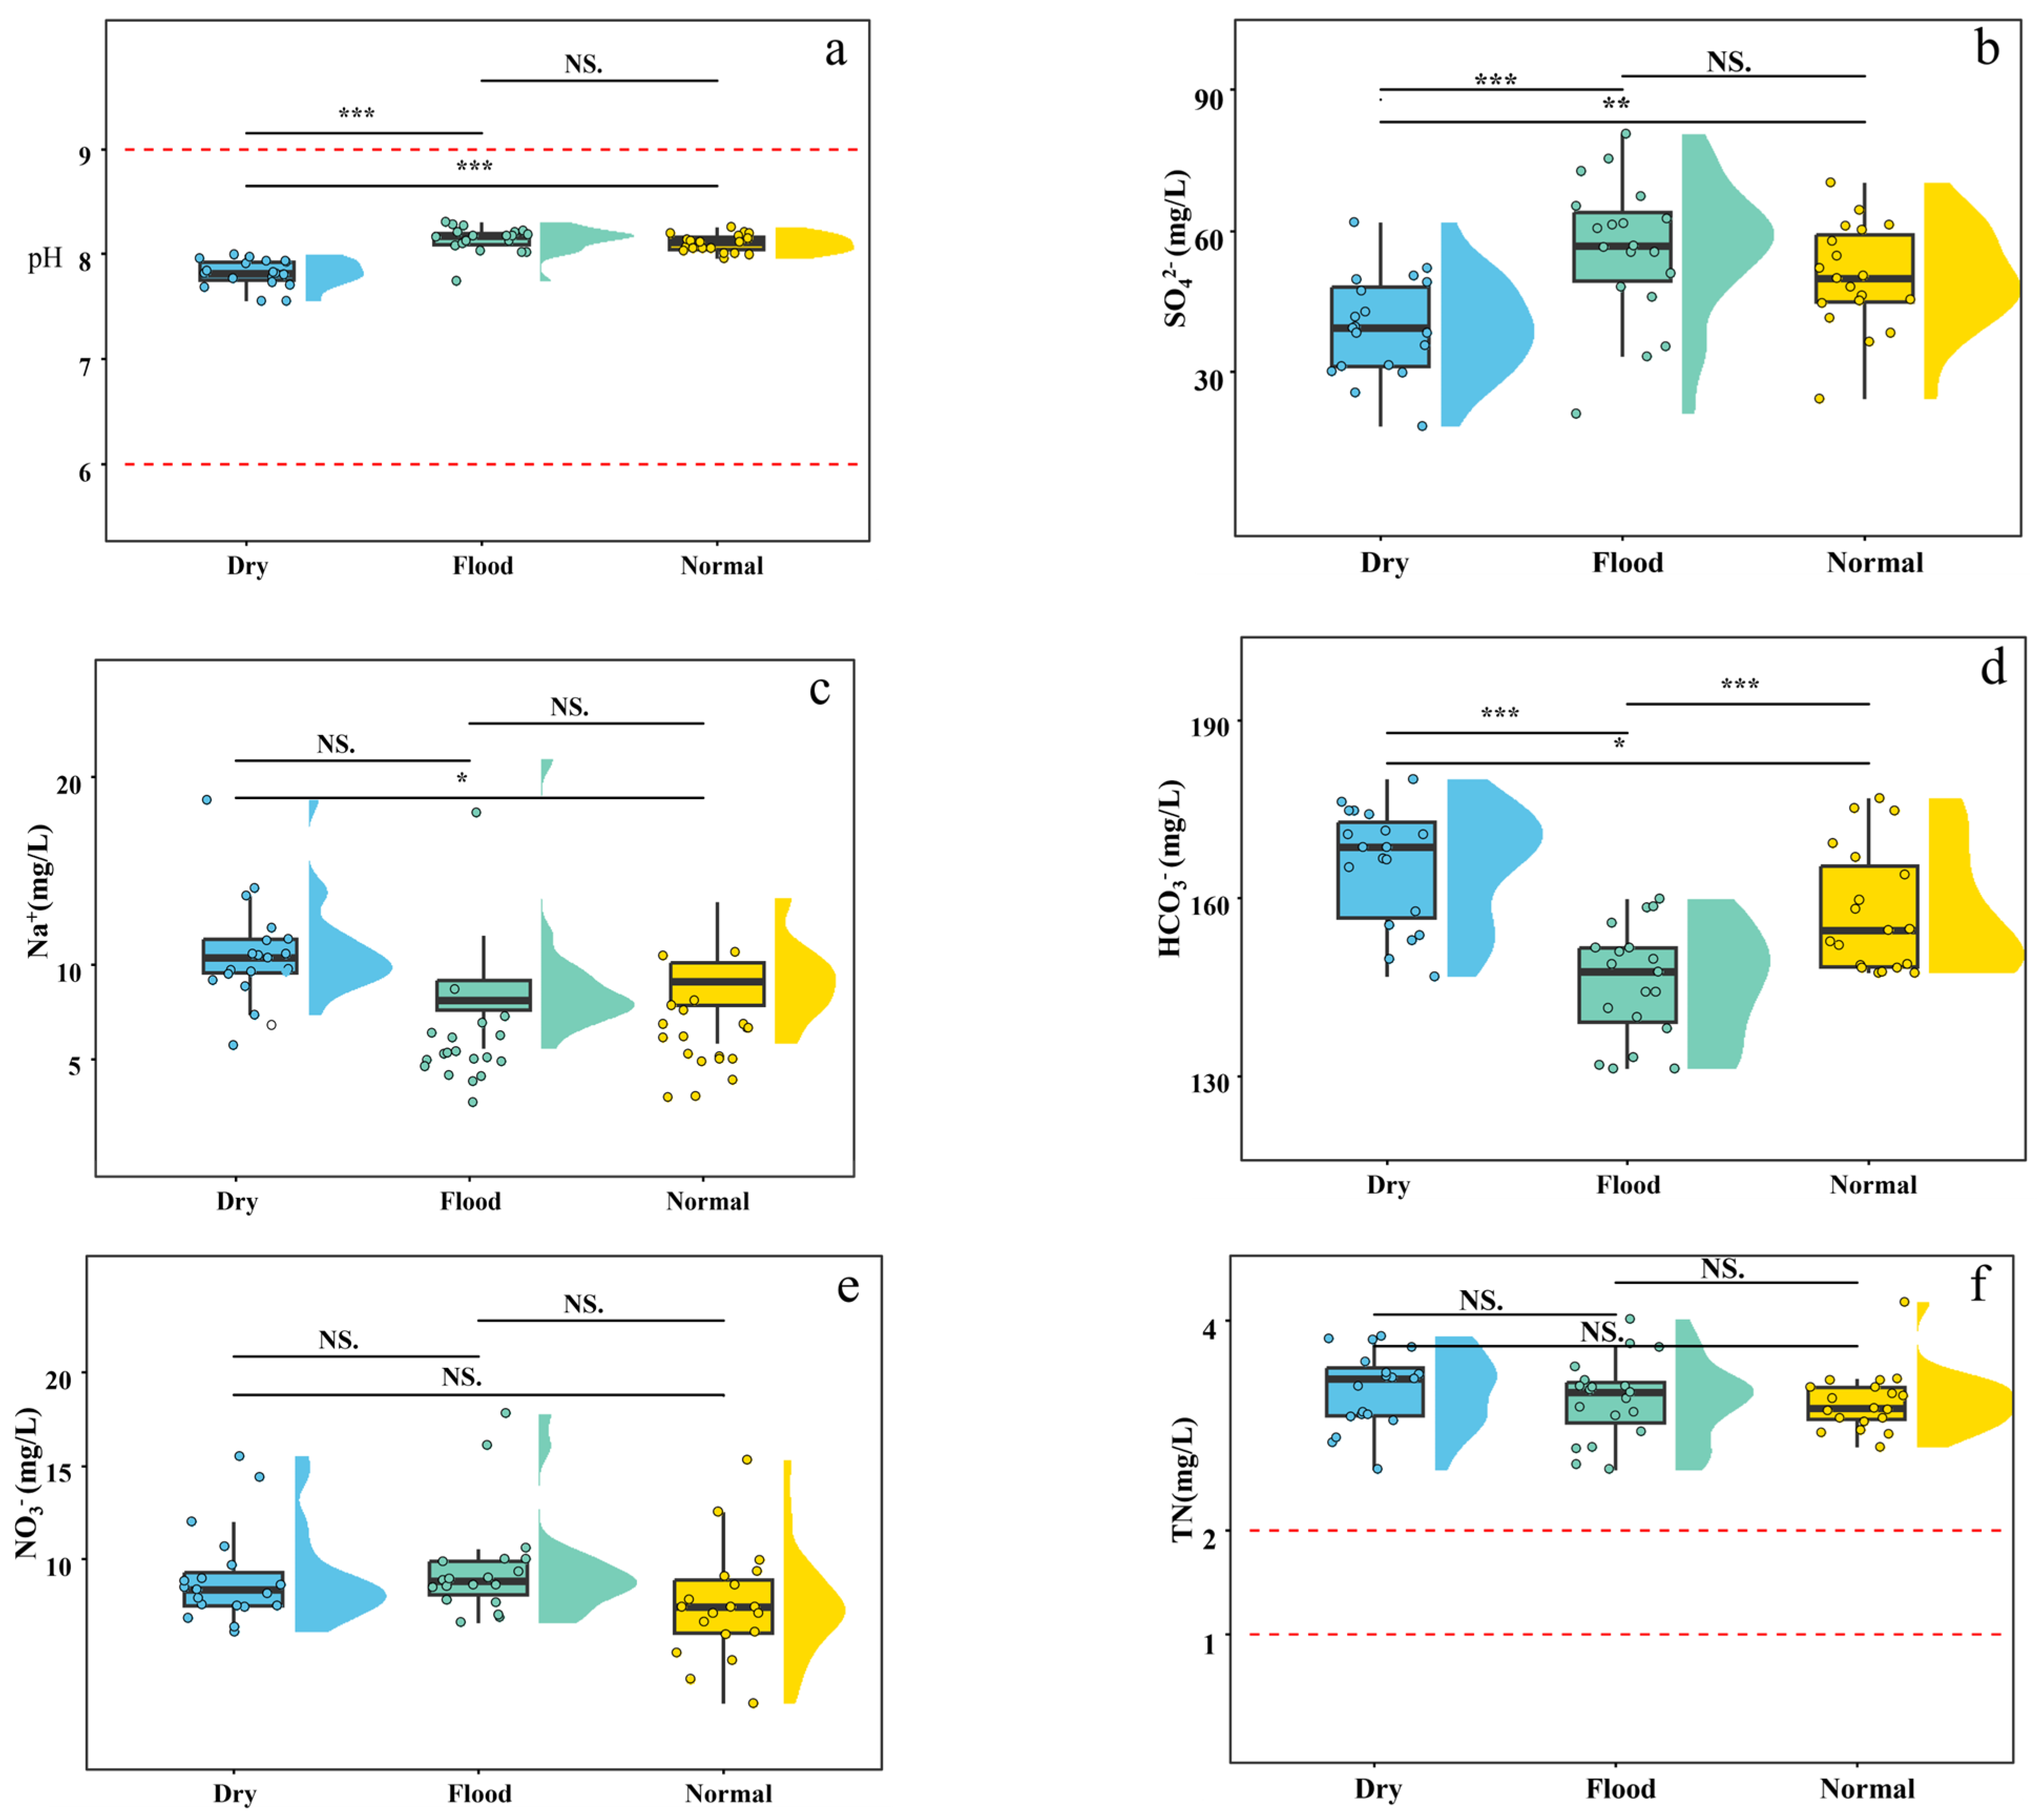
The temporal variation of river water quality is an important aspect in water environment research, as it reflects the impact of natural processes and human activities on river water quality. In this study, we examined the temporal variations of 14 water quality parameters and summarized 4 seasonal variation characteristics of agricultural rivers. The first characteristic is that the dry season has significantly lower values than the flood (p < 0.001) and normal seasons (p < 0.01), as evidenced by the representative indicators of pH and SO42− (Figure 3a,b). This result is consistent with that reported by Esquivel-Hernández et al., who found that during the flood season, storm runoff transports a large number of alkaline substances from roads and soils into the river, thereby causing an increase in the pH of the river [19]. The sulfate exhibited similar variations to pH, mainly due to abundant precipitation and increased surface runoff during the flood and normal seasons. These runoffs carried a large amount of sulfate from the soil strata into the river, leading to an increase in sulfate concentration. As detailed in Section 4.2, the study found that sulfate in the Jinqian River primarily originates from sulfate minerals in the soil. The second variation is that the concentration of water quality parameters is significantly higher only in the dry season than in the flood season, with the representative indicator being Na+ (p < 0.05) (Figure 3c). This is mainly related to the discharge of domestic sewage from surrounding villages during the dry season and the dilution of river water by rainwater during the flood season [20]. The third variation characteristic is that the concentration of water quality parameters in the dry season is significantly higher than that in the flood season (p < 0.001) and normal season (p < 0.05), and the normal season is significantly higher than the flood season (p < 0.001), with the representative indicator being HCO3 (Figure 3d). This is primarily attributed to the dilution effect of rainfall and the transport of residual acidic substances (such as sulfates and nitrates) from agricultural fields into the river by storm runoff during the flood season, which further reduces the concentration of HCO3 in the river water. The fourth seasonal variation is that the concentrations of water quality parameters show no difference in the three hydrological periods (p > 0.05), with representative indicators being NO3 and TN (Figure 3e,f). This indicates that the nitrogen input and transformation processes in the region are relatively stable. In addition, there are multiple hydropower stations built on the Jinqian River, and the reservoirs have a strong buffering and retention capacity for nitrogen, which further weakens the seasonal variation of nitrogen [21].

4.2. Identification of Hydrochemical Component Sources in Agricultural Rivers

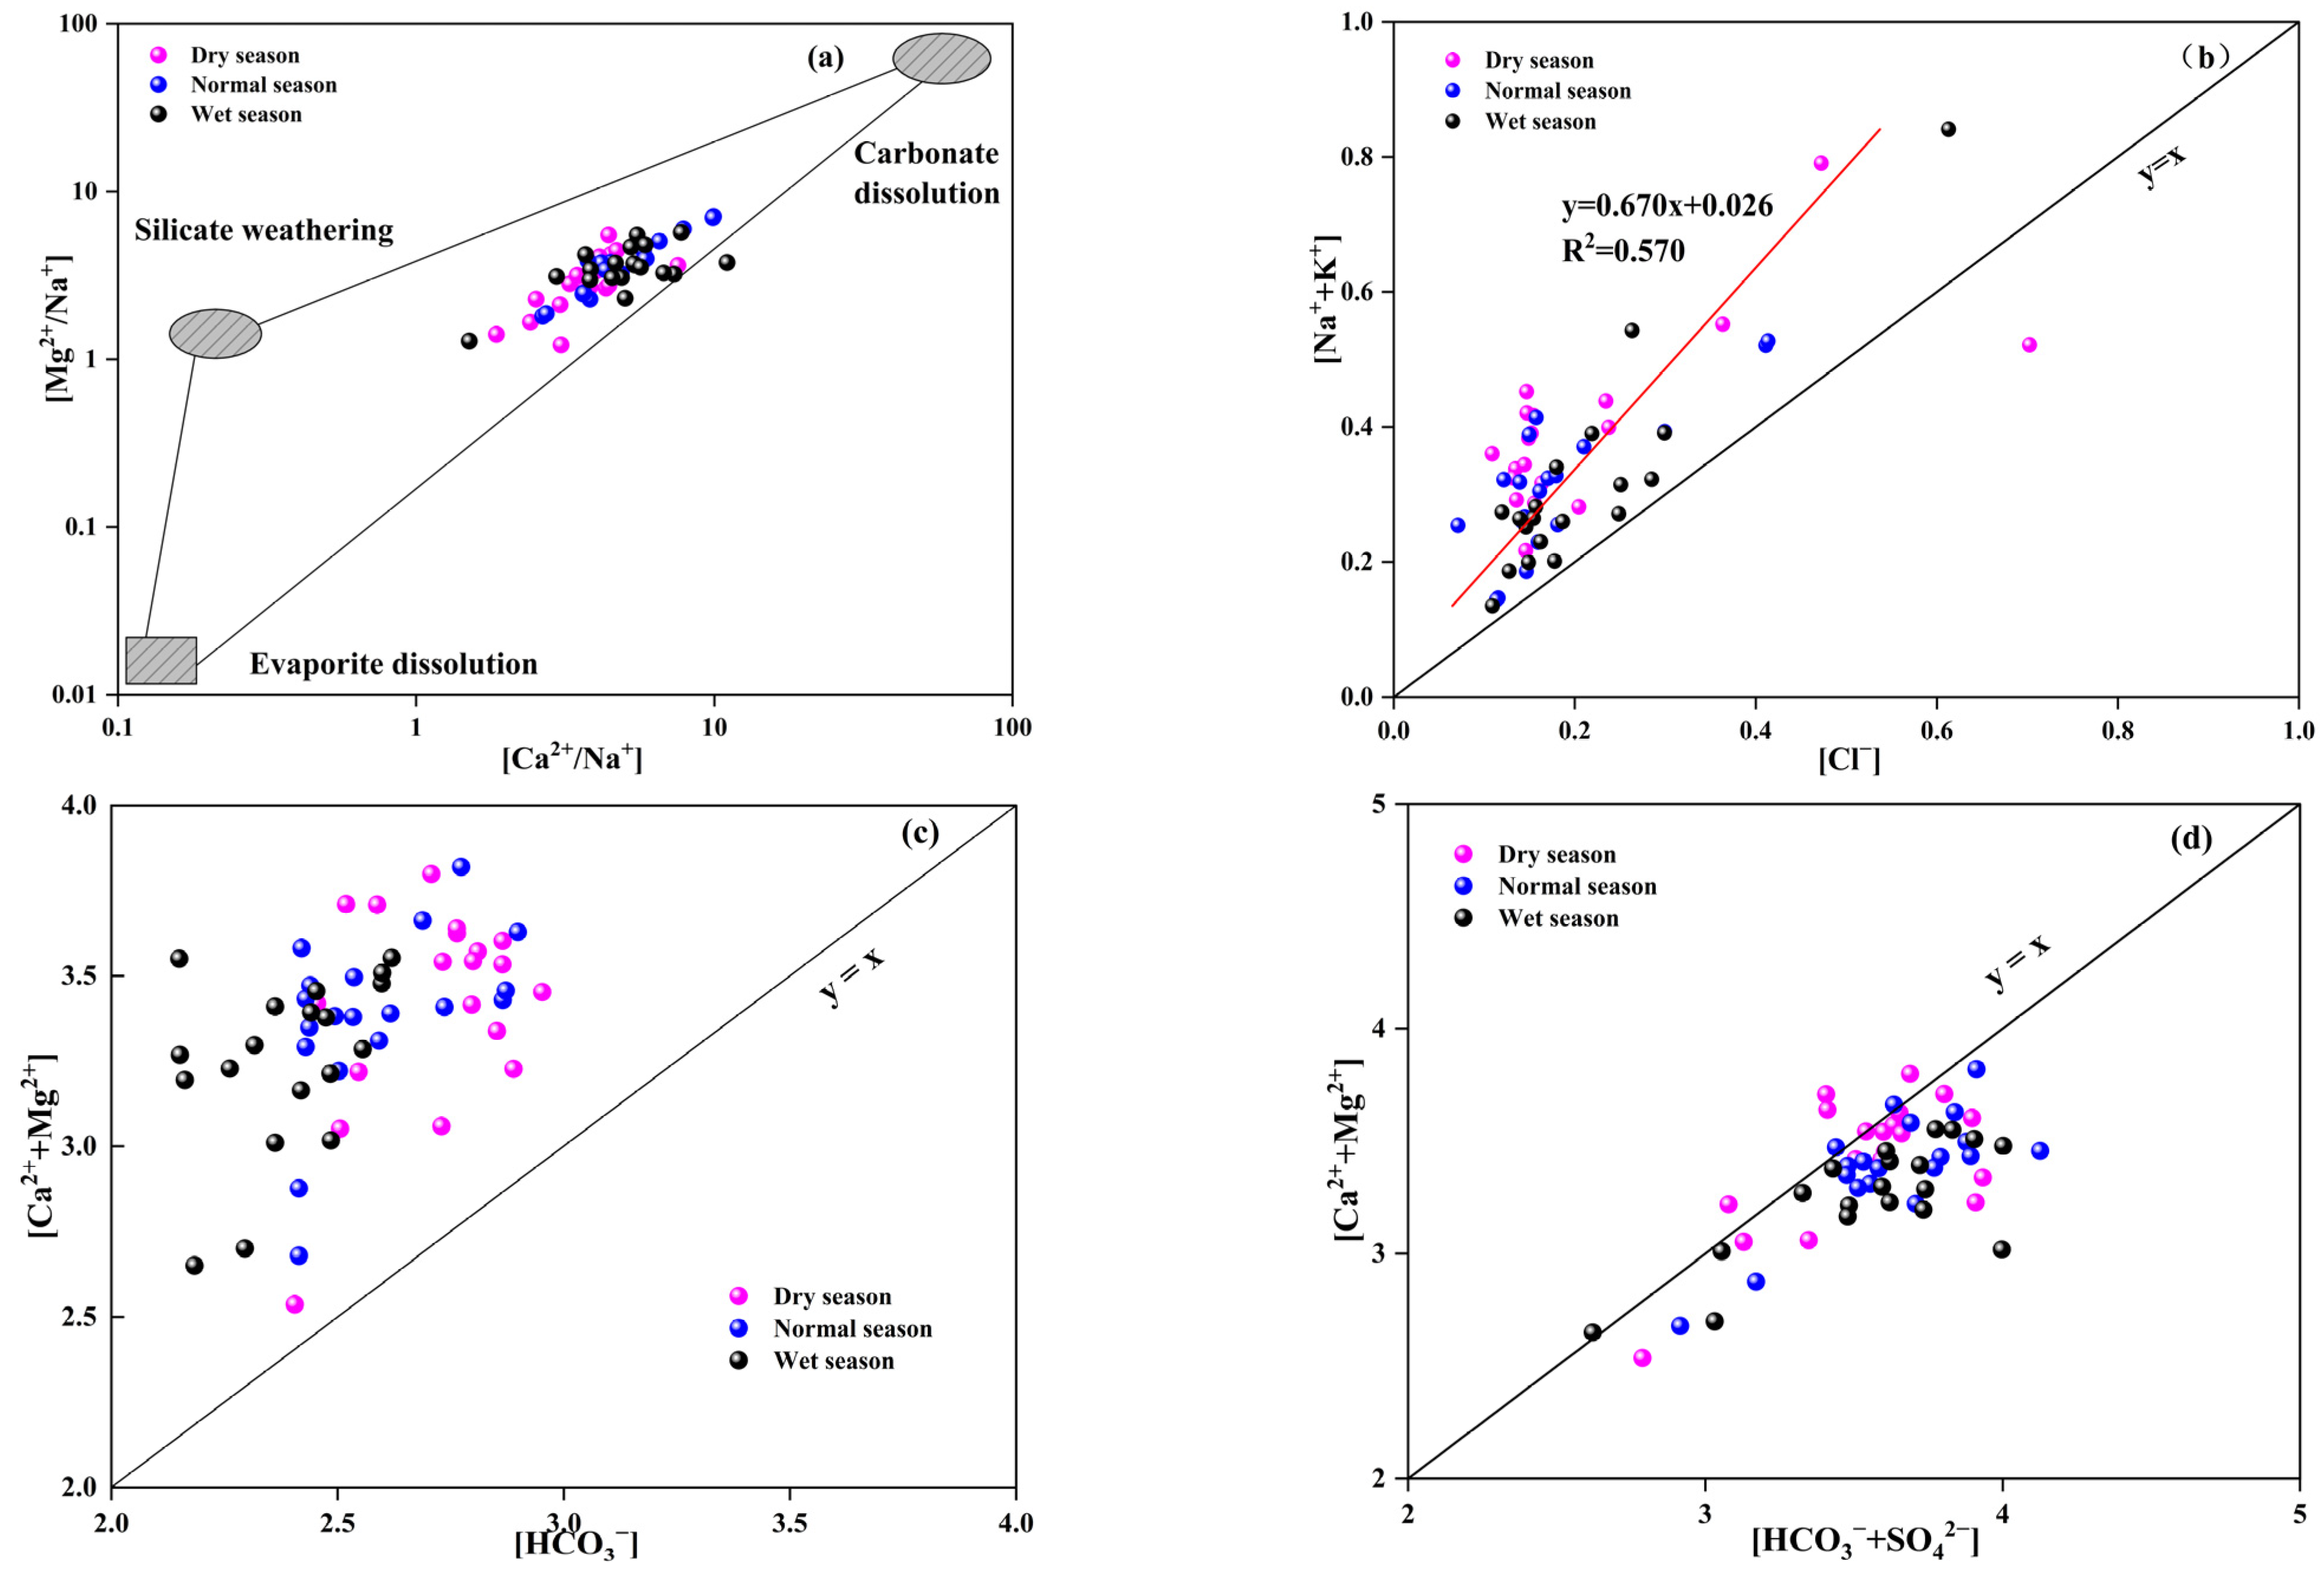
The ion ratio coefficient method is frequently employed to investigate the hydrogeochemical processes of water bodies and the origins of their hydrochemical constituents [22]. The molar ratios of (Ca2+/Na+) and (Mg2+/Na+) are commonly used to distinguish the control of water chemical composition by the weathering and dissolution of carbonate rocks, silicate rocks, and evaporite rocks. Previous studies have shown that the molar concentration ratios of Ca2+/Na+ and Mg2+/Na+ produced by the weathering of silicate rocks are 0.35 ± 0.15 and 0.24 ± 0.12, respectively. For carbonate rock weathering, these ratios are 50 ± 20 and 20 ± 8, and for evaporite rocks, they are 0.17 ± 0.09 and 0.02 ± 0.013 [23]. As shown in Figure 4a, the sample points from the three periods are generally located in the intermediate zone between the weathering dissolution of silicate rocks and carbonate rocks. In combination with the analysis of hydrochemical types mentioned earlier, it is evident that the weathering dissolution of carbonate rocks is the primary source of hydrochemical components in the river water, followed by that of silicate rocks.
The origin of Na+, K+, and Cl was evaluated via the [Cl] versus [Na+ + K+] ratio. Previous studies have found that when rock salt is the primary source, the ratio of [Cl] to [Na+ + K+] should be approximately equal to 1 [24]. Figure 4b shows that all sample points from the three periods are situated above the y = x line and display a significant correlation (R2 = 0.570). This suggests that in addition to the Na+ and K+ contributed by the weathering dissolution of rock salt, the weathering dissolution of silicate rocks also provides a significant portion of Na+ and K+ to the water. This result is consistent with the conclusions of Ren et al., who also found that in the Yellow River, Na+, K+, and Cl are not only derived from the dissolution of rock salt but are also influenced by the dissolution of silicate rocks [20].
Previous work has established that Ca2+ and Mg2+ in natural waters originate predominantly from the dissolution of carbonate, silicate, and evaporite lithologies [25], whereas HCO3 is derived mainly from carbonate and silicate weathering with limited anthropogenic influence. When carbonate dissolution prevails, the equivalent ratio [Ca2+ + Mg2+]/[HCO3] should approximate 1:1; involvement of silicate weathering shifts the expected ratio toward [Ca2+ + Mg2+]/[HCO3 + SO42−] ≈ 1:1 [26]. In Figure 4c, all flood and dry season samples plot above the y = x line for [Ca2+ + Mg2+]/[HCO3], evidencing an additional silicate contribution. After incorporating SO42− (Figure 4d), more than 75.0% of the sample points in all three periods fall below the y = x line, indicating that the weathering-dissolution of evaporite rocks (such as gypsum dissolution) is the primary source of SO42− in the water.

4.3. The Impact of Human Activities on Agricultural Rivers

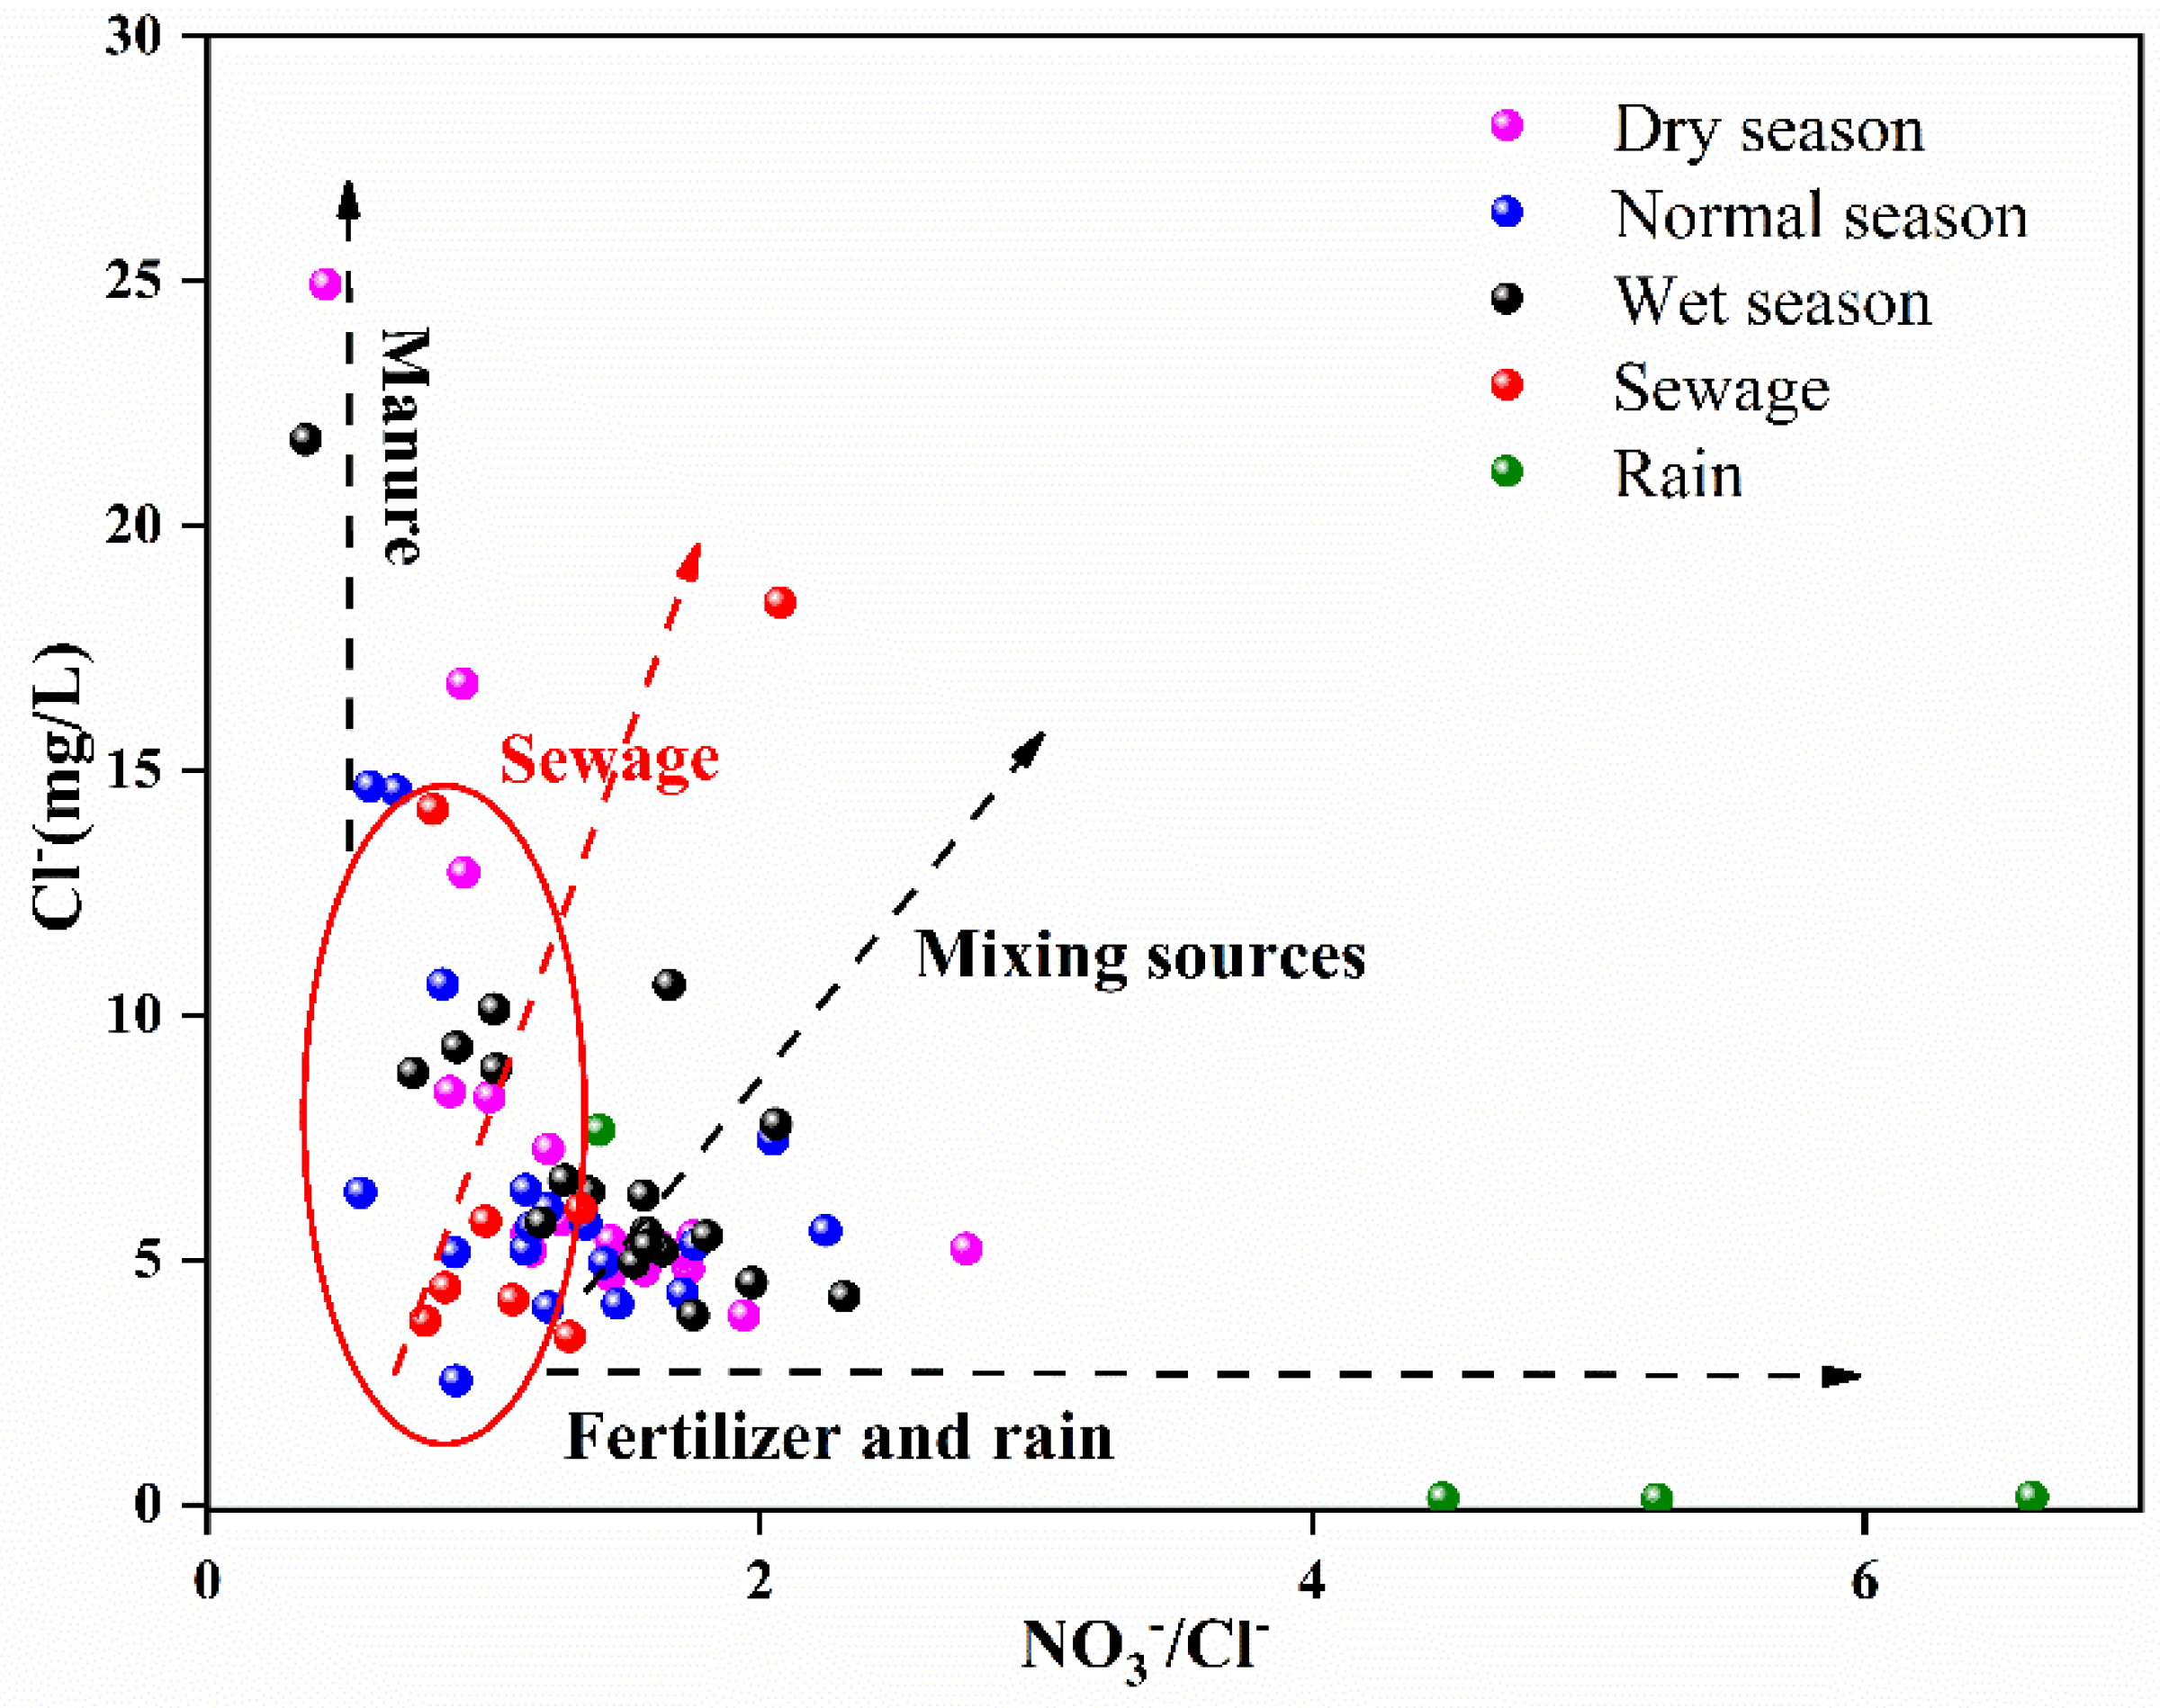
The concentrations of Cl and NO3 in the aquatic environment are closely related to human activities. Therefore, the Cl/NO3 ratio serves as a diagnostic tracer for discriminating different human impacts on river chemistry [27]. Chloride is effectively conservative in surface waters because it is unaffected by common physical, chemical, or microbial transformations. Therefore, the NO3/Cl ratio could as a robust proxy for nitrate provenance [28]. Under normal circumstances, the primary sources of Cl contamination include domestic sewage, feces, industrial wastewater, road salts, and agricultural chemicals (such as potassium chloride or KCl) [29]. Manure and sewage are characterized by elevated Cl concentrations and low NO3/Cl ratios, whereas synthetic fertilizers and atmospheric deposition exhibit the opposite signature [30].
As shown in Figure 5, the rainwater samples (n = 4) exhibited low Cl concentrations (2.01 mg/L) and high NO3/Clratios (4.44), whereas the sewage samples (n = 8) had high Cl concentrations (7.5 mg/L) and low NO3/Cl ratios (1.16), which is consistent with previous studies [30]. In the study area, NO3 in the river is likely primarily derived from a mixture of sewage and fertilizer pollution, as evidenced by the relatively high Cl concentration and moderate to low NO3/Cl ratio. The impact of rainfall on nitrogen in the Jinqian River is minimal, given the low NO3 concentration in precipitation (4.60 mg/L). During the flood season, approximately 58% of the samples are close to the fertilizer pollution endmember. This is a typical characteristic of agricultural rivers [31]. While, during the dry season, 50% of the samples are located at the sewage endmember, with the remaining samples positioned at the mixed endmember.

4.4. Source Apportionment of Pollution in Agricultural Rivers

Effective river-basin management requires unambiguous identification of the factors driving water quality degradation. Multivariate statistics have been extensively applied to source apportionment in aquatic systems. In this study, principal component analysis (PCA) was employed to differentiate seasonal pollution sources in the Jinqian River. Thirteen routinely monitored physicochemical parameters (TDS, TH, Na+, K+, Ca2+, Mg2+, HCO3, SO42−, NO3, Cl, COD, Fe, and Mn) were selected for analysis. Prior to extraction, the data matrix was subjected to Kaiser–Meyer–Olkin (KMO) and Bartlett’s sphericity tests. The resultant KMO value of 0.604 and Bartlett’s χ2 = 364 (p < 0.001) confirm the suitability of the hydrochemical data set for PCA. Four principal components (PCs) with eigenvalues > 1 were retained, collectively explaining 79.9% of the total variance and thereby preserving the information embedded in the original thirteen variables.
Principal component 1 (PC1) accounts for 27.6% of the variance and exhibits strong positive loadings on Na+, Cl, F, K+, and NO3, with moderate positive loadings on NH4+ and TN (Table 3). Na+ and Cl exhibit the strongest correlation with PC1. As demonstrated in Section 4.2, the primary sources of Na+ and Cl in the Jinqian River are the weathering and dissolution of rock salt (NaCl). Therefore, PC1 primarily represents the influence of rock salt dissolution on the river water. Under normal circumstances, NO3, NH4+, and TN in the water environment are unequivocally linked to anthropogenic inputs such as agricultural runoff, domestic effluent, and atmospheric deposition [32,33]. Because elevated NH4+ and TN are robust indicators of sewage, and these variables are most strongly correlated with PC4. In addition, as presented in Supplementary Table S2, a notably significant positive correlation (p < 0.01) is observed between K+ and NO3. This finding suggests that these two ions likely stem from a common origin. Moreover, previous scholars have found that the co-enrichment of K+ and NO3 in the aquatic environment can indicate that the water body is affected by agricultural fertilizer pollution [34]. Since different principal components represent independent sources of pollution [35], thus, PC1 mainly represents the influence of agricultural fertilization and rock salt weathering on the water chemistry of the Jinqian River.
Principal component 2 (PC2) explains 19.4% of the variance and is dominated by SO42− and Ca2+. These ions are diagnostic of gypsum (CaSO4·2H2O) dissolution. And in Section 4.2, it has been confirmed that the SO42− in the Jinqian River water originates from the dissolution of gypsum. Consequently, PC2 represents the control of gypsum weathering and dissolution on the water chemistry of the Jinqian River.
Principal component 3 (PC3) accounts for 17.8% of the variance and is characterized by high positive loadings on Mg2+, TDS, and HCO3, together with a moderate negative loading on DOC. Mg2+ and HCO3 are typical products of both silicate and carbonate weathering [36]; earlier analyses demonstrated that carbonate dissolution dominates their supply in this basin. Therefore, PC3 represents the influence of carbonate weathering and dissolution on the water chemistry of the Jinqian River.
Principal component 4 (PC4) explains 15.1% of the variance and is defined by strong positive loadings on TN and NH4+. As shown in Supplementary Table S2, the two parameters also exhibit a significant positive correlation (p < 0.01), indicating that they originate from a common source [37]. Riverine nitrogen is derived from domestic sewage, synthetic fertilizers, and manure [38]. Because PC1 already encapsulates agricultural fertilization, the segregation of TN and NH4+ on PC4 points to domestic wastewater. Field observations confirm that untreated sewage from riverside villages is discharged directly into the Jinqian River, representing a critical cause of TN exceedances.

5. Research Limitations and Future Prospects

This study provides an in-depth investigation into the hydrochemical evolution and pollution sources of agricultural rivers, offering valuable insights for the protection of water environments in such regions. However, several limitations should be acknowledged and addressed in future research.
Firstly, this study did not include analyses of trace metals, which are often contributed by fertilizers and may have significant environmental impacts. Future research should incorporate assessments of trace metals to provide a more comprehensive understanding of pollution sources and their potential risks to river ecosystems.
Secondly, the study failed to consider emerging contaminants arising from human activities within the catchment area. These contaminants, such as pharmaceuticals, personal care products, and microplastics, can exert complex and long-term effects on water quality and aquatic life. Future investigations should focus on identifying and quantifying these emerging contaminants to better assess the overall health of the river.
Additionally, this study primarily utilized principal component analysis to qualitatively identify pollution sources in the Jinqian River. While the source apportionment results offer some reference value, their accuracy needs further improvement. In recent years, isotope tracing techniques have been widely applied and developed. For instance, using the dual δ15N and δ18O-NO3 in combination with source apportionment models can not only accurately identify the sources of nitrogen in water bodies but also quantify the contribution rates of each source to nitrogen pollution [39,40]. Future research should pay more attention to applying this technique in this region.

6. Research Recommendations

To address the deterioration of water quality in agricultural rivers, we propose the following evidence-based measures:
(1)
Optimize Fertilizer Management
Excessive application of synthetic fertilizers is a primary driver of nutrient pollution. Current local farming practices often involve the broadcast application of chemical fertilizers at excessively high rates. To mitigate agricultural non-point source pollution caused by over-application, it is essential to improve local farmers’ fertilization methods by promoting precision agriculture technologies. These technologies can match nutrient inputs to crop demands and soil fertility, thereby reducing surplus nutrient application. We recommend the application of well-composted organic amendments or slow-release fertilizers to enhance nutrient use efficiency and support sustainable agricultural practices.
(2)
Upgrade Domestic Wastewater Treatment
At present, the domestic wastewater treatment capacity of villages along the Jinqian River is evidently insufficient. Untreated or partially treated sewage from riverside settlements significantly increases the river’s nitrogen and other pollution loads. It is crucial to extend centralized wastewater treatment infrastructure to all villages within the riparian zone. Where connection to a centralized system is not yet feasible, compact package plants or constructed wetlands should be installed to ensure that effluents meet discharge standards before being released into the environment.
(3)
Strengthen long-term monitoring and assessment
A permanent water quality monitoring network should be established and operated across the catchment, with sampling conducted at biweekly to monthly intervals. Key parameters, including TN, NO3, NH4+, chemical oxygen demand, total phosphorus, metal ions, emerging contaminants, and others, must be analyzed under strict quality assurance and quality control (QA/QC) protocols. In addition, more accurate assessments of water quality and pollution sources within the catchment are essential to ensure the sustainable use and scientific protection of water resources in the region.

7. Conclusions

This study systematically analyzed the characteristics of water quality changes, material sources, and main controlling factors of agricultural rivers and conducted a comprehensive assessment using hydrochemical ratio methods and multivariate statistical techniques. The results show that agricultural rivers are significantly affected by agricultural fertilizers and domestic sewage. Based on principal component analysis, the main factors identified that control the water quality of agricultural rivers include the use of agricultural fertilizers, the dissolution of rock salt and evaporites, and the discharge of domestic sewage. Future research should focus more on the issues of heavy metal and emerging contaminant pollution in rivers, as well as the application of more precise source apportionment techniques, such as isotope tracing technology, to accurately identify pollution sources in agricultural rivers. This will provide more accurate technical support for the prevention and control of pollution in agricultural rivers.

Supplementary Materials

The following supporting information can be downloaded at: https://www.mdpi.com/article/10.3390/w17213111/s1, Table S1. Hydrochemical parameters, analytical method, equipment and detection limits; Table S2. Correlation analysis of hydrochemical indicators in the Jinqian River.

Author Contributions

C.Y., investigation, methodology, writing—original draft preparation and editing, Z.Q., investigation, methodology, data curation, supervision. X.S., investigation, methodology, data curation. L.Y., investigation, methodology, software, data curation. N.Y., investigation, methodology, software. F.Y., investigation, methodology, writing—review and editing. Q.Z., supervision, methodology, writing—review and editing. All authors have read and agreed to the published version of the manuscript.

Funding

This work was funded by the National Natural Science Foundation of China (Grant No. 42377232), Natural Science Foundation of Hebei Province of China (Grant No. D2022504015).

Data Availability Statement

The data presented in this study are available from the corresponding author upon request due to privacy restrictions.

Acknowledgments

The authors gratefully acknowledge the editor and anonymous reviewers for their valuable comments on this manuscript. The authors also appreciate the financial support from the different organizations.

Conflicts of Interest

The authors declare no conflicts of interest.

References

  1. Zhang, Q. Water quality assessment of river basins: New insights and practical solutions. Water 2025, 17, 1207. [Google Scholar] [CrossRef]
  2. Li, S.; Gu, S.; Liu, W.; Han, H.; Zhang, Q. Water quality in relation to the landuse and land cover in the upper Han River basin, China. Catena 2008, 75, 216–222. [Google Scholar] [CrossRef]
  3. Zhang, Q.; Liu, W.; Sun, H.; Wang, H.; Wang, L.; Zhang, J.; Xu, Z. Cascade reservoir regulations on nitrogen source and transformation in the Tibetan Plateau river: Constraints from high frequency data of Lancang River. J. Hydrol. 2025, 650, 132563. [Google Scholar] [CrossRef]
  4. Liu, W.; Jiang, H.; Zhang, J.; Xu, Z. Driving forces of nitrogen cycling and the climate feedback loops in the Yarlung Tsangpo River Basin, the highest-altitude large river basin in the world. J. Hydrol. 2022, 610, 127974. [Google Scholar] [CrossRef]
  5. Gandhimathi, G.; Chellaswamy, C.; Thiruvalar, S.P. Comprehensive river water quality monitoring using convolutional neural networks and gated recurrent units: A case study along the Vaigai River. J. Environ. Manag. 2024, 365, 121567. [Google Scholar] [CrossRef]
  6. Mustapha, A.; Aris, A.Z.; Juahir, H.; Ramli, M.F.; Kura, N.U. River water quality assessment using environmetric techniques: Case study of Jakara River Basin. Environ. Sci. Pollut. Res. 2013, 20, 5630–5644. [Google Scholar] [CrossRef]
  7. Zhao, Z.Y.; Zuo, J.; Zillante, G. Transformation of water resource management: A case study of the South-to-North Water Diversion project. J. Clean. Prod. 2017, 163, 136–145. [Google Scholar] [CrossRef]
  8. Zhang, Q. The South-to-North Water Transfer Project of China: Environmental implications and monitoring strategy. J. Am. Water Resour. Assoc. 2009, 45, 1238–1247. [Google Scholar] [CrossRef]
  9. Liu, J.; Han, G.; Liu, M.; Zeng, J.; Liang, B.; Qu, R. Distribution, sources and water quality evaluation of the riverine solutes: A case study in the Lancangjiang River Basin, Tibetan Plateau. Int. J. Environ. Res. Public Health 2019, 16, 4670. [Google Scholar] [CrossRef] [PubMed]
  10. Mbaye, M.L.; Gaye, A.T.; Spitzy, A.; Dähnke, K.; Gaye, B. Seasonal and spatial variation in suspended matter, organic carbon, nitrogen, and nutrient concentrations of the Senegal River in West Africa. Limnologica 2016, 57, 1–13. [Google Scholar] [CrossRef]
  11. Jiang, H.; Liu, W.; Li, Y.; Zhang, J.; Xu, Z. Multiple isotopes reveal a hydrology dominated control on the nitrogen cycling in the Nujiang River basin, the last undammed large river basin on the Tibetan Plateau. Environ. Sci. Technol. 2022, 56, 4610–4619. [Google Scholar] [CrossRef]
  12. Li, Y.; Tu, Y.; Sun, T.; Duan, Y.; Kou, J.; Li, W.; Gao, J. Source apportionment of organic carbon and nitrogen in sediments from river and lake in the highly urbanized Changjiang Delta. J. Hazard. Mater. 2024, 478, 135590. [Google Scholar] [CrossRef]
  13. Xue, D.; Botte, J.; Baets, B.D.; Accoe, F.; Nestler, A.; Taylor, P.; Boeckx, P. Present limitations and future prospects of stable isotope methods for nitrate source identification in surface and groundwater. Water Res. 2009, 43, 1159–1170. [Google Scholar] [CrossRef] [PubMed]
  14. Tian, J.; Yuan, Z.; Mao, X.; Ma, T. Quantifying natural and anthropogenic impacts on riverine total nitrogen concentration and load in the Yellow River Basin. Environ. Pollut. 2025, 382, 126641. [Google Scholar] [CrossRef]
  15. Xu, Y.; Liu, W.; Xu, B.; Xu, Z. Riverine sulfate sources and behaviors in arid environment, Northwest China: Constraints from sulfur and oxygen isotopes. J. Environ. Sci. 2024, 137, 716–731. [Google Scholar] [CrossRef]
  16. GB3838-2002; Environmental Quality Standards for Surface Water. State Environment Protection Bureau of China: Beijing, China, 2002.
  17. WHO (World Health Organization). Guidelines for Drinking-Water Quality, 4th ed.; World Health Organization: Geneva, Switzerland, 2017. [Google Scholar]
  18. Popa, P.; Murariu, G.; Timofti, M.; Georgescu, L.P. Multivariate statistical analyses of water quality of danube river at galati, romania. Environ. Eng. Manag. J. 2018, 17, 1249–1266. [Google Scholar]
  19. Esquivel-Hernández, G.; Sanchez-Murillo, R.; Villalobos-Córdoba, D.; Monteiro, L.R.; Villalobos-Forbes, M.; Sánchez-Gutiérrez, R.; Matiatos, I. Exploring the acid neutralizing effect in rainwater collected at a tropical urban area: Central Valley, Costa Rica. Atmos. Pollut. Res. 2023, 14, 101845. [Google Scholar] [CrossRef]
  20. Ren, C.; Liu, L. Under the strong influence of human activities: The patterns and controlling factors of river water chemistry changes—A case study of the lower Yellow River. Water 2024, 16, 1886. [Google Scholar] [CrossRef]
  21. Jiang, H.; Zhang, Q.; Liu, W.; Zhang, J.; Zhao, T.; Xu, Z. Climatic and anthropogenic driving forces of the nitrogen cycling in a subtropical river basin. Environ. Res. 2021, 194, 110721. [Google Scholar] [CrossRef] [PubMed]
  22. Pant, R.R.; Zhang, F.A.; Rehman, F.U.; Wang, G.; Ye, M.; Zeng, C. Spatiotemporal variations of hydrogeochemistry and its controlling factors in the Gandaki River Basin, Central Himalaya Nepal. Sci. Total Environ. 2017, 622–623, 770–782. [Google Scholar] [CrossRef]
  23. Niu, C.; Zhang, Q.; Xiao, L.; Wang, H. Spatiotemporal variation in groundwater quality and source apportionment along the Ye River of North China using the PMF model. Int. J. Environ. Res. Public Health 2022, 19, 1779. [Google Scholar] [CrossRef]
  24. Fu, C.C.; Li, X.Q.; Ma, J.F.; Ling, X.L.; Ming, G.; Zhan, X.B. A hydrochemistry and multi-isotopic study of groundwater origin and hydrochemical evolution in the middle reaches of the Kuye River basin. Appl. Geochem. 2018, 98, 82–93. [Google Scholar] [CrossRef]
  25. Xing, J.; Long, W.; Jie, Z.; Tian, L. Hydrochemical variation characteristics and driving factors of surface water in arid areas—A case study of Beichuan River in Northwest China. Front. Environ. Sci. 2024, 12, 1493390. [Google Scholar] [CrossRef]
  26. Ye, H.; Han, Z.; Wu, P.; Zha, X.; Li, X.; Hou, E.; Peñuelas, J. Disentangling sources and transformation mechanisms of nitrogen, sulfate, and carbon in water of a Karst Critical Zone. Sci. Total Environ. 2024, 922, 171310. [Google Scholar] [CrossRef] [PubMed]
  27. Zhang, Q.; Sun, J.; Liu, J.; Huang, G.; Lu, C.; Zhang, Y. Driving mechanism and sources of groundwater nitrate contamination in the rapidly urbanized region of South China. J. Contam. Hydrol. 2015, 182, 221–230. [Google Scholar] [CrossRef] [PubMed]
  28. Liu, C.; Li, S.; Lang, Y.; Xiao, H. Using δ15N- and δ18O-values to identify nitrate sources in Karst groundwater, Guiyang, Southwest China. Environ. Sci. Technol. 2006, 40, 6928–6933. [Google Scholar] [CrossRef]
  29. Yue, F.J.; Liu, C.Q.; Li, S.L.; Zhao, Z.Q.; Liu, X.L.; Ding, H. Analysis of δ15N and δ18O to identify nitrate sources and transformations in Songhua River, Northeast China. J. Hydrol. 2014, 519, 329–339. [Google Scholar] [CrossRef]
  30. Meghdadi, A.; Javar, N. Quantification of spatial and seasonal variations in the proportional contribution of nitrate sources using a multi-isotope approach and Bayesian isotope mixing model. Environ. Pollut. 2018, 235, 207–222. [Google Scholar] [CrossRef]
  31. Jiang, H.; Liu, W.; Zhang, J.; Zhou, L.; Zhou, X.; Pan, K.; Zhao, T.; Wang, Y.; Xu, Z. Spatiotemporal variations of nitrate sources and dynamics in a typical agricultural riverine system under monsoon climate. J. Environ. Sci. 2020, 93, 98–108. [Google Scholar] [CrossRef]
  32. Wang, X.; Liu, Z.; Xu, Y.J.; Mao, B.; Jia, S.; Wang, C.; Ji, X.; Lv, Q. Revealing nitrate sources seasonal difference between groundwater and surface water in China’s largest fresh water lake (Poyang Lake): Insights from sources proportion, dynamic evolution and driving forces. Sci. Total Environ. 2025, 958, 178134. [Google Scholar] [CrossRef] [PubMed]
  33. Zhao, X.; Xu, H.; Kang, L.; Zhu, G.; Paerl, H.W.; Li, H.; Liu, M.; Zhu, M.; Zou, W.; Qin, B.; et al. Nitrate sources and transformations in a river-reservoir system: Response to extreme flooding and various land use. J. Hydrol. 2024, 638, 131491. [Google Scholar] [CrossRef]
  34. Iqbal, J.; Su, C.; Abbas, H.; Jiang, J.; Han, Z.; Baloch, M.Y.J.; Xie, X. Prediction of nitrate concentration and the impact of land use types on groundwater in the Nansi Lake Basin. J. Hazard. Mater. 2025, 487, 137185. [Google Scholar] [CrossRef]
  35. Qin, R.; Wu, Y.; Xu, Z.; Xie, D.; Zhang, C. Assessing the impact of natural and anthropogenic activities on groundwater quality in coastal alluvial aquifers of the lower Liaohe River Plain, NE China. Appl. Geochem. 2013, 31, 142–158. [Google Scholar] [CrossRef]
  36. Wang, L.; Zhang, Q.Q.; Wang, H.W. Rapid urbanization has changed the driving factors of groundwater chemical evolution in the large groundwater depression funnel area of northern China. Water 2023, 15, 2917. [Google Scholar] [CrossRef]
  37. Arıman, S.; Soydan-Oksal, N.G.; Beden, N.; Ahmadzai, H. Assessment of Groundwater Quality through Hydrochemistry Using Principal Components Analysis (PCA) and Water Quality Index (WQI) in Kızılırmak Delta, Turkey. Water 2024, 16, 1570. [Google Scholar] [CrossRef]
  38. Zhu, Z.; Ding, J.; Du, R.; Zhang, Z.; Guo, J.; Li, X.; Jiang, L.; Chen, G.; Bu, Q.; Tang, N. Systematic tracking of nitrogen sources in complex river catchments: Machine learning approach based on microbial metagenomics. Water Res. 2024, 253, 121255. [Google Scholar] [CrossRef]
  39. Ji, X.; Shu, L.; Li, J.; Zhao, C.; Chen, W.; Chen, Z.; Shang, X.; Dahlgren, R.A.; Yang, Y.; Zhang, M.J. Tracing nitrate sources and transformations using Δ17O, δ15N, and δ18O-NO3 in a coastal plain river network of eastern China. J. Hydrol. 2022, 610, 127829. [Google Scholar] [CrossRef]
  40. Ren, X.; Yue, F.J.; Tang, J.; Li, C.; Li, S.L. Nitrate transformation and source tracking of rivers draining into the Bohai Sea using a multi-tracer approach combined with an optimized Bayesian stable isotope mixing model. J. Hazard. Mater. 2024, 463, 132901. [Google Scholar] [CrossRef] [PubMed]
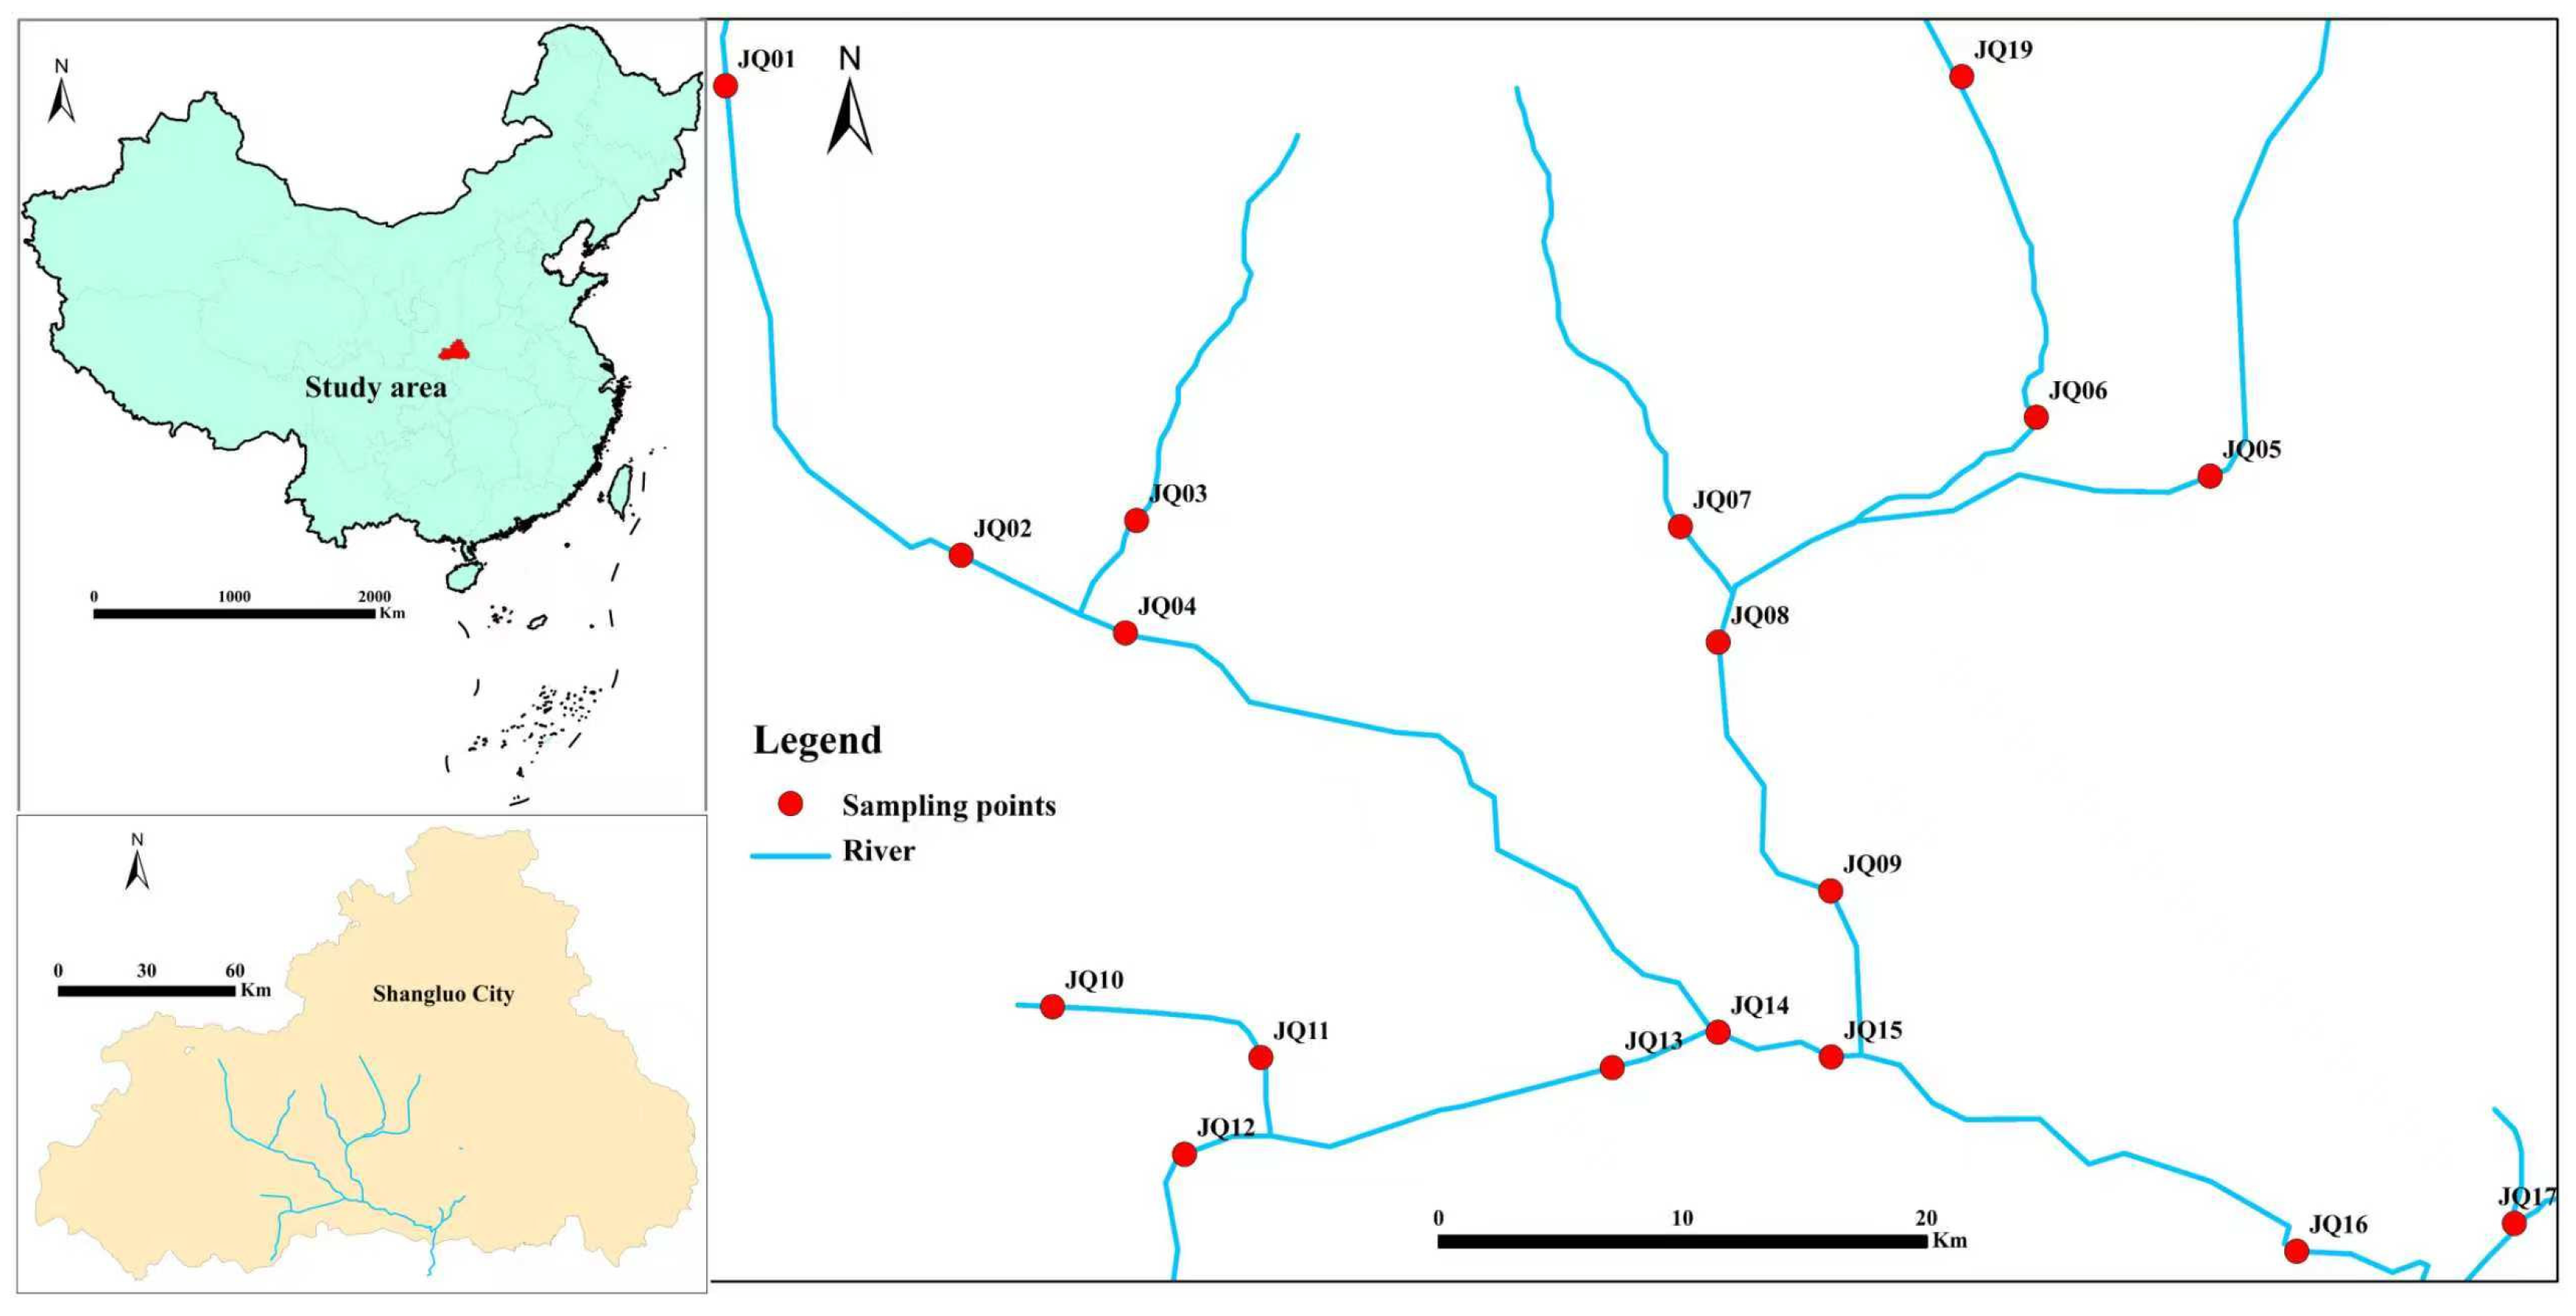
Figure 1. Location of the study area and distribution of sampling sites.
Water 17 03111 g001
Figure 2. Hydrochemical type of the Jinqian River.
Water 17 03111 g002
Figure 3. Seasonal variations of hydrochemical parameters in the Jinqian River (a) pH; (b) SO42−; (c) Na+; (d) HCO3; (e) NO3; (f) TN. Note: *** denotes a p-value < 0.001, ** denotes a p-value < 0.01, * denotes a p-value < 0.05, NS: Not Significant. In (a,f), the red lines represent the limits set by the Chinese Surface Water Quality Standards (GB3838-2002) [16].
Water 17 03111 g003
Figure 4. Source identification of hydrochemical components (a) [Ca2+/Na+] vs. [Mg2+/Na+]; (b) [Cl] vs. [Na+ + K+]; (c) [HCO3] vs. [Ca2+ + Mg2+]; (d) [HCO3 + SO42−] vs. [Ca2+ + Mg2+].
Water 17 03111 g004
Figure 5. Plot of source identification of nitrate.
Water 17 03111 g005
Table 1. Statistical table of characteristics of water quality variation in Jinqian River.
ParametersUnitsStandardDry SeasonNormal SeasonFlood Season
RangeMeanCVRangeMeanCVRangeMeanCV
pH6~97.55–7.997.811.617.96–8.258.101.007.74–8.38.131.51
K+mg/L120.680–3.872.0045.70.650–3.201.6346.50.720–6.442.0163.9
Na+mg/L2004.47–15.97.9330.92.93–10.66.2433.12.68–18.06.0251.9
Ca2+mg/L7536.3–58.748.99.8941.3–55.149.36.5641.0–51.947.66.59
Mg2+mg/L508.44–16.211.618.37.36–13.710.914.05.27–14.110.426.0
Clmg/L≤2503.86–24.97.6367.02.52–14.66.5150.13.86–21.77.4552.5
SO42−mg/L≤25018.3–61.639.426.024.0–70.250.021.620.9–80.656.025.7
HCO3mg/L146–1801655.78147–1761576.43131–1591456.37
NO3mg/L≤44.36.07–15.48.9827.32.27–15.27.5438.76.56–17.79.4529.3
NH4+mg/L≤1.290.352–1.330.71038.70.303–1.200.72036.70.280–1.360.62049.8
TNmg/L≤12.56–3.843.3210.62.79–4.183.229.092.56–4.013.2311.6
Fmg/L≤10.893–1.120.9906.590.399–1.340.81033.60.599–2.261.0238.2
DOCmg/L0.765–2.381.1432.00.740–4.001.2457.50.700–3.231.3144.9
TDSmg/L≤1000160–35727516.6169–34927815.1160–35724916.6
Note: CV: Coefficient of variation; Standard: Class III standard of the national surface water quality standard, Chinese (GB 3838−2002) [16].
Table 2. Water quality evaluation results of the Jinqian River in different seasons.
Water Quality LevelComprehensive Water
Quality Score
Proportion of Sites in 3 Periods (%)
Dry SeasonNormal SeasonFlood Season
Excellent water<50000
Good water50–10010094.789.5
Poor water100.1–20005.2610.5
Very poor water200.1–300000
Water unsuitable for drinking purposes>300000
Table 3. The results of principal component analysis in the Jinqian River.
ParametersPC1PC2PC3PC4
Na+0.8770.0310.1560.233
Cl0.843−0.2040.0910.020
F0.809−0.1510.021−0.234
K+0.8080.370−0.149−0.053
NO30.8030.434−0.0850.245
SO42−0.0310.8380.185−0.109
Ca2+0.1010.8230.0150.044
Mg2+−0.053−0.0020.830−0.213
TDS0.0550.5940.7040.056
HCO3−0.1570.1200.6720.467
DOC0.206−0.593−0.635−0.003
TN0.364−0.136−0.1090.883
NH4+0.214−0.104−0.1800.692
Eigenvalue3.592.522.181.50
Contribution Rate (%)27.619.417.815.1
Cumulative
Contribution Rate (%)
27.647.064.879.9
Disclaimer/Publisher’s Note: The statements, opinions and data contained in all publications are solely those of the individual author(s) and contributor(s) and not of MDPI and/or the editor(s). MDPI and/or the editor(s) disclaim responsibility for any injury to people or property resulting from any ideas, methods, instructions or products referred to in the content.