Abstract
Ensuring the resilience of water distribution networks (WDNs) remains a critical challenge for utilities, as aging infrastructure and inadequate planning can compromise drinking water quality (DWQ) and increase customer dissatisfaction. This study aims to strengthen existing DWQ monitoring schemes utilized by utilities by introducing a GIS-based framework that integrates structured customer feedback into the selection of sampling locations. Using a district metering area in Jūrmala, Latvia, as a case study, consumer-reported complaints were collected through an online survey and geoprocessed to identify problem hotspots. Based on these insights, the sampling program was refined and linked with asset data to improve previously established maintenance routines. Targeted sampling confirmed elevated iron and turbidity levels in several locations, validating the reliability of customer feedback. Embedding spatial context throughout the data pipeline enables systematic evaluation and optimization of sampling locations, enhancing operational awareness and supporting informed decision-making during incidents. The proposed approach can be widely adopted by utilities to develop priority-based monitoring campaigns, particularly in regions with significant seasonal demand fluctuations, such as tourism hubs and vacation destinations.
1. Introduction
The ever-decreasing resilience of urban water networks has been identified as one of the main challenges within the water utilities sector [1,2], posing a substantial financial burden on service providers and local agencies responsible for maintaining underperforming infrastructure [3]. The adverse consequences of aging infrastructure and its continuous deterioration are known to be amplified by the impacts of climate change, rapid urbanization and shifting water demand patterns [4,5,6]. As extensively reported in the literature [7,8], impaired resilience of water distribution networks (WDNs) directly results in the reduced quality of supplied drinking water (DWQ), leading to increased customer dissatisfaction. However, ensuring satisfactory quality of service (QoS) is a complex process involving not only adequate treatment of abstracted water and its subsequent storage and distribution to customers, but also monitoring changes in its quality across the WDN [9,10].
Utilities have partially addressed the latter by planning and conducting DWQ monitoring campaigns, which involve mostly scheduled sample collection at different points throughout the network. Typical approaches for selecting sampling locations are based mainly on WDN layout and various operational considerations, which have been thoroughly documented in both scientific and gray literature [11,12,13].
Even though this traditional top–down approach can provide a general indication of water quality trends across the WDN, its primary intent is often to fulfill formal reporting requirements—with typical sampling frequencies ranging from quarterly to monthly—set by national governing bodies. Consequently, it may be slow to detect—or entirely miss—DWQ fluctuations often caused by operational changes (e.g., asset maintenance activities, repair works, and expansion projects) and incidents (e.g., pipe bursts, improper flushing activities). To this end, a multitude of contamination warning systems (CWSs) with varying degrees of sophistication have been developed and implemented [14,15]. Integrated approaches for DWQ control across the distribution networks by way of hydraulics and water quality modeling have been extensively researched and used to derive an objective-specific sensor placement strategies to detect DWQ shifts and contamination events promptly and cost-effectively [16]. However, the inherent complexity of said systems, combined with significant upfront and recurring equipment costs, as well as the need to recruit and train personnel in order to develop the necessary in-house expertise, has limited their wider uptake in infrastructure and utilities industry [17]. Therefore, an approach that is both quicker to implement and simpler to manage is desired.
Current research indicates that consumers are quick to detect variations in organoleptic properties—meaning sensory characteristics such as color, taste, and smell—of supplied drinking water [18], thus acting as human sensors across the entirety of the distribution network. In addition, flow disturbances within the pipelines have been successfully linked with both spatial and temporal dimensions of customer complaints [19]. Hence, there is potential for a bottom–up, feedback-driven approach to enhance existing DWQ monitoring workflows by introducing rapid, targeted sampling and remedial actions in areas where poor QoS is reported. Such collaboration between utility operators and the general public would foster a sense of cooperation and shared responsibility. Moreover, timely stakeholder involvement and deliberate community engagement could form the foundation of a joint stewardship governance model, guiding the targeted allocation of limited resources where they matter most, in line with the EU Water Framework Directive [20,21] and international guidelines on risk management [22].
In terms of gathering feedback, methods such as direct engagement through cold calls, emails, and surveys have been most common [23], with a growing emphasis on outsourcing data from social media [24,25], custom-built apps and web-experiences [26,27]. Though they approach the funneling aspect of the feedback gathering process differently, all publications agree that existing complaint registries often lack uniform coding and consistent terminology required to explicitly describe issues while also missing crucial spatial reference data needed to pinpoint the exact locations of the encountered problems [28]. These shortcomings inevitably undermine the usefulness of data by complicating its management, analysis, and integration with other data sources.
Yet, despite the relative maturity and widespread implementation in many other industries, there has been hesitancy within the water and wastewater services sector to adopt proactive customer engagement via surveys or other feedback mechanisms, especially concerning perceived DWQ. Apart from being an officially recognized tool in some countries [29,30], efforts to use customer sentiment have been few and far between. Feedback has been used to gauge perceptions of the QoS provided, to better manage the supplied water, and to classify potential causes of problems [23]. The influence of changing raw water quality and the socioeconomic profiles of citizens on perceived DWQ has also been investigated [31].
Unlike previous studies that mainly analyzed the nature of customer complaints without considering their practical application in adjusting utility operations [32], the purpose of this study is to address the previously identified gaps by integrating customer feedback into a utility’s DWQ monitoring and assurance workflows. By proposing a novel, GIS-based approach—designed to enrich utility’s datasets with spatial context—this paper aims to help system operators maximize the value of their data and support the design of priority-based sampling campaigns. This is achieved by streamlining the collection, management, and analysis of user-reported data.
The rest of the paper is structured as follows: Section 2 provides a brief description of the study area, and the GIS-based survey used for gathering customer feedback data in a structured manner. Section 3 presents an overview of the proposed data pipeline and discusses the results. Finally, Section 4 outlines the conclusions of the work and suggests possible future improvements.
2. Materials and Methods
2.1. Study Area
The water distribution system of Jūrmala, a coastal city in central Latvia situated approximately 25 km west of the capital, Rīga (see Figure 1a), was used as a case study and serves as a proof-of-concept for the framework outlined in the following section. Covering an area of 101.4 km2, Jūrmala is geographically positioned between latitudes 23°28′25″ N and 23°58′15″ N, and longitudes 56°55′24″ E and 57°00′35″ E (see Figure 1b). According to the annual data compiled by the Office of Citizenship and Migration Affairs (OCMA), the city’s official population in 2023 stood at 59,159 [33]. The location of the study area within the city limits is depicted in Figure 1b.
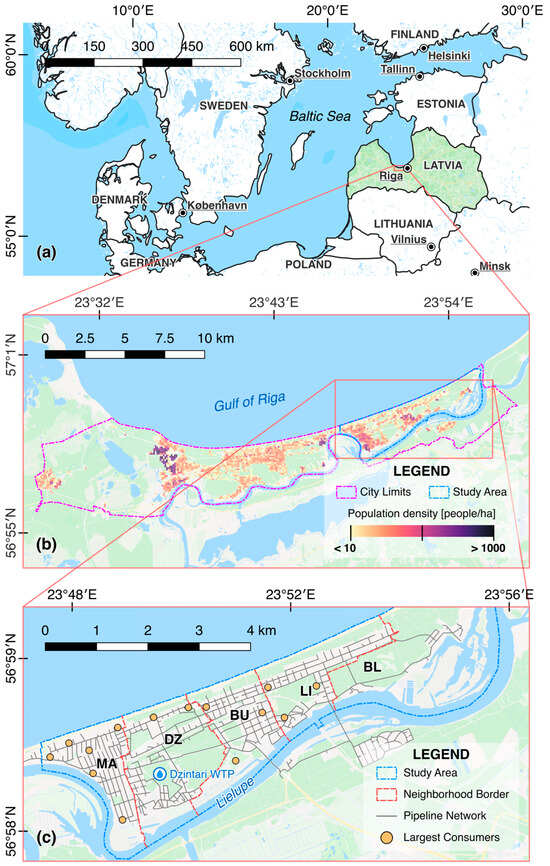
Figure 1.
(a) Location of Jūrmala within the Baltic region. (b) Population density distribution across Jūrmala and the boundaries of the study area. (c) Neighborhood delineation within the study area, including the distribution pipeline network and the largest water consumers.
As illustrated in Figure 1b, when viewed from an urban morphology perspective, Jūrmala exhibits an elongated rectangular configuration. The city stretches approximately 24.2 km along the coastline, with its narrowest section being less than 0.4 km wide. Geographically it is constrained by the Gulf of Rīga to the north and the Lielupe River to the south. These spatial properties, when considered in conjunction with the city’s relatively low population density (575 people per km2; 1.7–4.2 times lower compared to other Latvian cities [34]) and sparsely distributed housing, pose unique challenges for maintaining stable DWQ across the WDN.
Given the excessive length of the existing water distribution pipelines (367 km in 2022 [35] with more than 100 km having been built in the last decade) and new lines under construction, it was necessary to narrow down the extents of investigation. Because of its known operational anomalies and due to the sudden increase in customers reporting poor QoS, the study was conducted within the Dzintari District Metering Area (DMA). This DMA serves 14,154 permanent residents and encompasses 5 neighborhoods: Majori, Dzintari, Bulduri, Lielupe, and Buļļuciems (see Figure 1c). Characteristics of the studied DMA are summarized in Table 1 below.

Table 1.
Population Statistics and WDN Attributes within the Dzintari DMA.
Estimated at approx. 32% or 118.2 km of the total WDN length in Jūrmala, a large portion of the Dzintari DMA (approx. 45%) was constructed more than 40 years ago using ductile iron (DI) pipes, none of which have been renovated or replaced (hereinafter, old pipes). The remainder of the system (approx. 55%) was built during the 2000s, 2010s, and 2020s, using a mix of DI and polyethylene (PE) pipes (hereinafter, new pipes).
The drinking water distribution system was designed to meet firefighting demand requirements outlined in national building codes and fire safety regulations, and it operates as a conventional looped network. This configuration aims to ensure a continuous supply and minimize service interruptions caused by pipe bursts and other irregularities. However, as per Gibson et al. (2019), it does not account for the potential decline in DWQ resulting from low velocities and increased residence times caused by oversized pipes [36].
In terms of land use classification, the study area primarily consists of low/mid-rise residential buildings and green areas, including parks, forests, and vacant land plots. Recreational facilities, and tourism-oriented infrastructure, categorized as mixed-use, are predominantly located along the coastline in the western and central parts of the DMA. Figure 1c also highlights the largest consumers of supplied water: hotels, SPAs, the local hospital, as well as schools and kindergartens. It should be noted that the entire DMA is supplied by a single source, the Dzintari Water Treatment Plant (WTP), located in the western part of the study area (see Figure 1c).
In general, Jūrmala has distinct seasons with wet periods during autumn and spring, dry summers, and cold winters. As a result, especially in the Dzintari DMA, given its heavy emphasis on tourism, a distinct shift (avg. 98%) between summer and winter water demand patterns can be observed (see Figure 2). Figure 2 also illustrates the distinct impacts of the COVID-19 pandemic and the Russia–Ukraine war on total water consumption. Notably, one of the hotels, accounting for 5–10% of the daily water consumption within the studied DMA, ceased its operations as a consequence of being owned by an aggressor state. Similarly, a significant portion of residences located in the northeastern parts of the DMA are now mostly vacant due to their owners being restricted from entering the country.
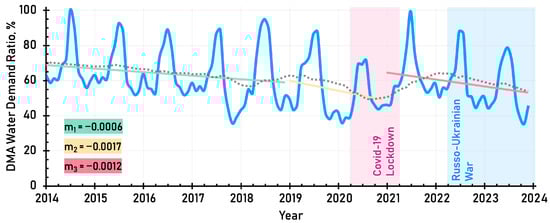
Figure 2.
Normalized monthly water supply fluctuations to the Dzintari DMA (2014–2024). The solid blue line represents the monthly volume of water supplied to the Dzintari DMA over the past decade, normalized to a peak value of 100% (observed in July 2014 at 111,243 m3). The dashed gray line shows a 12-month moving average, highlighting a consistent downward trend in consumption despite an increase in the number of service connections. Linear regression trends are shown for three distinct periods: pre-, during, and post-COVID (green, yellow, and red, respectively), with the pink shaded area marking the nationwide lockdown period. Although demand temporarily surged following the lifting of restrictions, the rate of decline in consumption has remained accelerated twofold in the post-pandemic period—partially attributed to the imposed sanctions related to the Russo-Ukrainian war (blue shaded area).
As a result, annual water consumption in the study area has decreased by 15–20% when compared to the pre-pandemic period. This presents issues relating to DWQ at both ends of the spectrum. On one hand, the combination of low off-season consumption and oversized system components results in extended residence times, adversely affecting the organoleptic properties of the supplied water. On the other hand, seasonal peak demands driven by tourism, along with increased irrigation needs during dry summers, significantly alter the hydraulic conditions within the WDN and lead to the resuspension of particles in pipes. This presents a unique challenge in meeting the water quantity requirements while maintaining an acceptable level of DWQ across the network.
For the purposes of this study, it is essential to clarify the distinction between the terms drinking water ‘safety’ and drinking water ‘quality’. In the case of the local utility, monitoring results from the WTPs outflow—before, during, and after the study period—demonstrate consistent compliance with national regulations (see Table 2). Therefore, the water supplied to the distribution network is considered harmless, i.e., ‘safe’ for human consumption. The parameters listed in Table 2 were selected because they reflect the most commonly applied technological indicators in daily utility operations, ensuring a representative and practical assessment of DWQ.
Table 2.
Physicochemical and microbiological characteristics of water after treatment.
However, despite the consistently safe water leaving the WTP, consumer complaints and confirmed instances of degraded DWQ highlight problems occurring within the WDN. DWQ parameters such as color, odor, taste, turbidity, pressure, and hardness encompass various factors that customers can evaluate to ensure the overall quality of drinking water. Changes in color may indicate the presence of loose deposits in supplied water. Turbidity refers to the cloudiness of water caused by suspended particles. Odor and taste are subjective parameters that customers can readily assess using their senses. Foul odors or unpleasant tastes can signal the presence of organic compounds, chlorine, or microbial contaminants, prompting concern among consumers. Pressure is an operational parameter that affects the delivery of water to consumers’ homes. Inconsistent or low water pressure can hinder daily activities and may indicate underlying issues within the distribution system, such as leaks or pipe blockages. Hardness, determined by the concentration of minerals like calcium and magnesium, influences water’s taste. While not directly harmful to health, excessive hardness can lead to scale buildup and decreased soap effectiveness.
Customers evaluate these parameters through simple observation and sensory perception. By participating in surveys and actively assessing these parameters, consumers provide valuable context that enables system operators to take proactive measures to ensure the suitability of drinking water. While these issues do not render water unsafe for consumption, they indicate a decline in the QoS experienced by the end-user. Based on this knowledge, the primary goal of the presented framework is to adapt existing monitoring strategies to detect and mitigate changes in DWQ throughout the WDN, assuming that the water continues to meet safety criteria at the point of entry.
2.2. Proposed Framework for Dynamic DWQ Monitoring
For the purposes of the study, an iterative workflow for establishing a bottom-up, feedback-driven DWQ monitoring program was developed. The proposed approach is summarized in Figure 3 and includes:
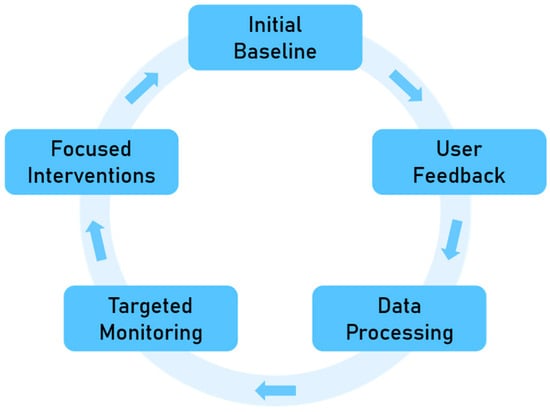
Figure 3.
Flowchart summarizing the proposed DWQ monitoring improvement framework.
- Defining an initial DWQ monitoring program. The existing utility sampling plan was reviewed to identify current sampling locations, frequency, and monitored parameters. This formed a theoretical baseline against which subsequent refinements could be assessed.
- Setting up a data-gathering framework. A survey form was created in ArcGIS Survey123 v3.16 to collect customer feedback on perceived DWQ.
- Performing geospatial processing and analysis. Address-level responses were imported into ArcGIS Pro v3.5.4 for georeferencing, categorization, and hotspot detection.
- Refining the DWQ monitoring program. The identified hotspots were used to revise the initial sampling plan, prioritizing areas with recurring or clustered complaints.
- Resolving customer complaints through proactive interventions. Field inspections and targeted maintenance activities were initiated based on the spatial clustering of feedback. For example, flushing was prioritized in zones where discoloration and turbidity complaints were concentrated, while infrastructure renewal was considered for persistent hotspots associated with aging pipes.
- Deriving a new system baseline. The updated sampling results and maintenance records were reintegrated into the GIS environment to establish a new operational baseline. Following these interventions, customers were asked to provide feedback again through a second survey phase, enabling the comparison of perceptions before and after corrective actions.
Each step is further described in the following subsections.
2.3. GIS-Based Survey for Gathering Structured User Feedback
To fully utilize end-user abilities to sense variations in supplied water characteristics, a data funnel in the form of an online questionnaire was developed for the purposes of this study. During the conceptualization of the survey, specific criteria were established to guide its design and functionality. The survey was crafted to: (1) identify the presence of a problem, (2) add spatial context to submissions and pinpoint reported issues, (3) detect data trends and localize problem hotspots, and (4) assess the effectiveness of remedial actions taken. A flowchart detailing the structure of the survey is provided in Figure 4.
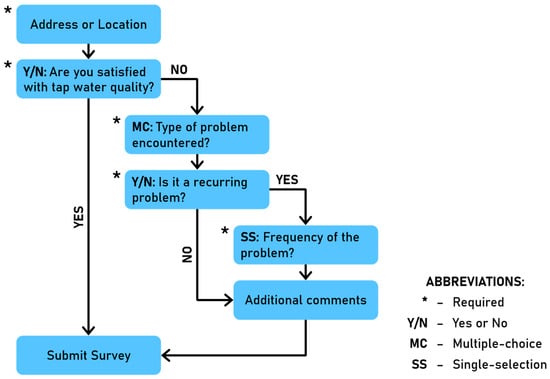
Figure 4.
Survey schema to gauge customer perceptions of DWQ.
The survey enables customers to subjectively rate the quality of tap water at their homes, places of work or other public spaces. From the customer’s perspective, the survey was designed to be straightforward, facilitating easy understanding and selection of relevant responses. Drawing on previously received complaints (primarily via direct phone calls and emails to the utility), a limited set of descriptors indicating dissatisfaction (such as color, odor, taste, turbidity, pressure, hardness, and others) was incorporated into the survey. The aim was to ensure that submissions would take no more than a few minutes, thereby maximizing customer participation. This approach also encouraged customers to leave frequent, anonymous feedback, since longer surveys might result in a higher drop-off rate. In cases where the encountered issue was not predefined, customers had the option to describe the problem in their own words; however, no such instances were recorded during the study period. For multiple-choice questions, each selected category was extracted and treated as a separate record to enable independent spatial and thematic analysis of reported issues. This approach ensured that a single response containing multiple problem types (e.g., discoloration and taste) contributed appropriately to each relevant category in subsequent determination of remedial actions.
On the operator’s side, the survey was structured to consistently categorize responses, ensuring that the data remained contextual over time. The survey limits the selection to specific potential problems, enabling targeted data analysis and visualization. Customers were encouraged not only to identify the nature of the problem but also to report the frequency of its occurrence. They were also given the opportunity to leave additional comments for a more detailed description of the issue. A key priority was integrating the survey results with existing information systems to break down data silos and promote collaborative use of diverse data types. Integration with GIS was identified as essential. To assist in categorizing genuine DWQ problems, filtering types of issues, and focusing on the causes of problems and specific action plans, the survey adhered to a funnel/filter/focus framework, as described by Whelton et al. (2007) [28].
The survey was created using ArcGIS Survey123, launched at the end of November 2022 and distributed among the public via posts on social media as well as the utility’s website. Implemented as a voluntary feedback tool, the survey was designed to allow customers to submit responses at any time. However, they were directly engaged to share their subjective evaluations on two separate occasions: firstly, throughout December 2022 (hereinafter, first phase or Phase I), and subsequently throughout December 2023 (hereinafter, second phase or Phase II). The first phase was used to establish a baseline of customer perceptions and determine problem hotspots throughout the study area before conducting remedial activities. Following the implementation of the new DWQ monitoring sites and targeted interventions in the problem areas, the second phase served to assess the impact of measures implemented based on results obtained during Phase I. This phasing allowed for the temporal comparison of customer feedback concerning utility actions.
To extract the necessary information from the raw survey data, the following data processing steps were performed:
- Data export and pre-processing. Address-level survey responses were exported from ArcGIS Survey123 into ArcGIS Pro for geoprocessing and analysis. Each response was reprojected from the Web Mercator coordinate system (EPSG:3857, WGS84) to the Latvian Transverse Mercator coordinate system (EPSG:3059, LKS-92) to ensure spatial consistency with other datasets. Since no free-text responses were submitted by survey participants (only predefined issue types were used), no extensive data cleaning was required, as the dataset was already uniform.
- Categorization of reported issues. Reported problems were classified into predefined categories based on the type of issue reported by the customers and filtered to isolate distinct types for spatial analysis. In cases where multiple issues were reported in a single response, each complaint type was treated as an individual record to enable independent spatial assessment.
- Hotspot and density mapping. Hotspot analysis was applied to identify spatial clusters of reported water quality issues. Kernel Density Estimation (KDE) was conducted using the ArcGIS Pro Spatial Analyst toolbox with a cell size of 50 m and a search radius of 250 m, balancing spatial sensitivity and data sparsity. Areas exceeding the 90th percentile of density values were classified as hotspots of perceived water quality problems.
- Integration with other datasets. Identified hotspots were linked to the corresponding neighborhood polygons and associated with specific WDN pipe segments based on the utility’s asset data and expert input.
This structured workflow enabled the transformation of customer feedback into spatially explicit insights that could inform operational decision-making. The resulting maps were subsequently used to refine sampling locations and prioritize maintenance actions in collaboration with utility personnel. ArcGIS Pro was employed for all spatial analyses; however, equivalent results can be achieved using open-source GIS platforms. ArcGIS Pro was selected because it is the software solution currently utilized by the participating utility.
3. Results
3.1. Initial Baseline
The initial DWQ monitoring program utilized by the local utility was developed in 2012 and had not been updated since. The original list of 39 monitoring points and their sampling schedule were selected mainly based on ease-of-access. The initial layout of monitoring points within the study area can be seen in Figure 5.
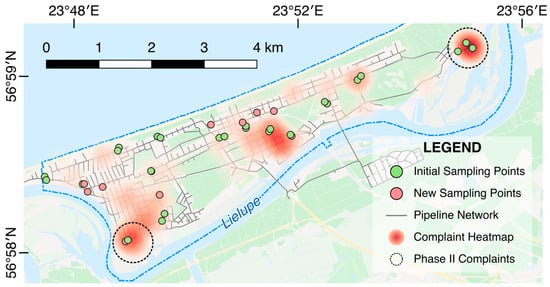
Figure 5.
Initial versus New DWQ monitoring point locations within the study area.
The original selection of monitoring locations was deemed sub-optimal, as it did not cover the entire extent of the WDN, nor did it account for its operational setup, such as dead-end pipes, newly constructed sections, and transit pipelines with low consumption. As a result, several operational blind-spots emerged, i.e., areas from which customer complaints were received but no corresponding DWQ monitoring data were available. In several such cases, targeted sampling directly from water mains supplying the affected areas confirmed the validity of the complaints, revealing elevated iron concentrations and turbidity levels, reaching up to 4000 µg/L and 69 NTU, respectively.
3.2. User Feedback and Problem Hotspots
The study was conducted between November 2022 and January 2024. A total of 425 respondents participated in the survey. Of these, 197 submissions originated from within the study area, with 148 responses received during Phase I and 49 during Phase II. Considering that 24% of the city’s population resides within the study area, the fact that it accounted for 46% of all negative feedback supported the utility experts’ initial concerns regarding local water quality issues. The survey results for different neighborhoods in the Dzintari DMA are summarized in Table 3. This study applied descriptive rather than inferential statistical methods, as the primary aim was to detect patterns of perceived water quality issues and identify potential hotspots. Engagement rates and complaint frequencies were normalized by neighborhood population to enable meaningful comparisons across different areas.
Table 3.
Phase-wise comparison of survey results within the Dzintari DMA.
In Table 3, ‘engagement’ refers to the voluntary participation of customers in the survey and was calculated by dividing the number of responses by the number of households in the respective neighborhoods. The number of ‘complaints’, used to indicate dissatisfaction with the received QoS, was expressed per 1000 declared residents. Unless explicitly stated otherwise, the terms ‘negative feedback’, ‘dissatisfaction’, ‘complaints’, and similar are used interchangeably to represent the subjective opinions expressed by end-users. Formal written complaints, handled through standardized internal procedures established by the utility, were not included in the analysis.
Analysis of the initial feedback data indicates that negative feedback, regardless of the city area, tends to cluster into hotspots and the problems reported within a certain hotspot are of similar nature. Figure 5 shows the hotspots for the Dzintari DMA after the first response phase (prior to any interventions by the utility). When cross-examining the initial configuration of monitoring locations against the identified hotspots, it is evident that prior monitoring activities were concentrated in non-problematic areas of the DMA leading to a distorted perception of the actual DWQ conditions within the WDN.
3.3. Targeted Monitoring
By capturing both the temporal and spatial dynamics of customer reports on perceived quality indicators, it is possible to gauge DWQ fluctuations throughout the WDN as well as improve the existing monitoring network and select appropriate mitigation techniques. While no formal cost–benefit analysis was performed, the proposed approach is expected to improve the efficiency of monitoring and maintenance activities by reducing redundant sampling and optimizing staff allocation, thereby creating opportunities for cost savings in the future.
The preexisting DWQ monitoring program was revised based on recommendations laid out in the standard ISO 5667-1:2023, which provides guidance on the design of sampling programs and sampling techniques [38]. During the selection of monitoring locations, factors such as the required frequency of sampling and the spatial distribution of sampling points were considered. Regarding the latter, the primary aim was to ensure an even coverage across the WDN, with particular attention to areas with dead-end branches and a high volume of customer complaints. In total, 88 monitoring locations were established throughout the entire WDN of Jūrmala city. Of these, 36 sampling points were located within the Dzintari DMA. To minimize bias and avoid incorrect selection of additional monitoring sites, only repeated complaints from different locations within the same area were considered. Before establishing a permanent monitoring site, historical sampling data were reviewed, and grab samples were collected to verify consistency.
To distinguish between issues caused by ill-maintained, customer-owned parts of the system and those related to utility-owned assets, sampling points were selected in pairs to include a: (1) customer-side sample from public spaces (such as local hospitals, schools, kindergartens, train stations, etc.), and (2) utility-side sample from the nearest possible location in the distribution network, which in most cases was the nearest hydrant standpipe. This dual-point sampling approach serves to point out the possible causes of water quality fluctuations and help identify key focus areas. As it pertains to the study area, 20 locations were customer-side samples and 16 were utility-side samples. To evaluate the efficiency of the feedback-supplemented DWQ monitoring framework, a continuous sampling campaign was conducted over 12 months during the 2023 calendar year.
Water quality was assessed by testing physical and chemical parameters at the newly established monitoring locations (see Figure 5). Turbidity and total iron were selected as indicators for on-site testing using portable measuring equipment. In addition, grab samples were tested in a laboratory setting on a monthly basis to ensure regulatory compliance through various physical and organoleptic parameters (pH value, turbidity, color, odor, taste) as well as general chemical parameters (ammonia, total iron, permanganate index, chlorides, sulfates, and total hardness). To facilitate cross-cutting of various datasets, both on-site and laboratory testing results were integrated into utility’s GIS.
During the Phase II study period, exceedances of the maximum permissible value were detected for iron and turbidity in both customer-side and utility-side samples. For customer-side sampling points, out of 122 total samples, high concentrations of total iron (up to 970 µg/L) were found in 17 samples (across 5 locations), and turbidity (up to 12.4 NTU) in 7 samples (across 4 locations), affecting 25% of monitoring points. As for utility-side monitoring, out of 80 total samples, 26 showed high iron concentrations and 19 exhibited high turbidity, impacting 50% of the monitoring locations.
3.4. Focused Interventions
In conjunction with DWQ sampling data, customer feedback not only helped categorize issues but also provided actionable insights for determining suitable remedial measures. In all but one case, elevated concentrations of iron and turbidity in tap water were confirmed through sample analyses from the nearest hydrant standpipe, indicating degradation of DWQ within the WDN and necessitating intervention by the service provider. In response, the utility initiated immediate flushing of the affected network segment. Follow-up sampling conducted after the interventions showed restored water quality, with iron concentrations and turbidity levels returning to compliant values, confirming the effectiveness of the corrective actions.
The sole exception involved Lašu Street in Buļļuciems, where customer complaints about discolored tap water were not corroborated by utility-side sampling. During Phase II, the total iron concentration and turbidity values in utility-side samples from this location did not exceed 70 µg/L and 0.70 NTU, respectively. In contrast, a customer-side sample from Lašu Street 1-47 exhibited an iron concentration of 1830 µg/L and a turbidity of 16.7 NTU, while apartment 48 in the same building showed an iron concentration of 1620 µg/L and a turbidity of 9.9 NTU. An on-site inspection conducted jointly with the customer revealed that the issue originated from aging internal plumbing within the building, underscoring the value of dual-point sampling as a means of stakeholder engagement.
On two occasions at the same monitoring location, utility-side samples failed to meet regulatory requirements, whereas the nearest customer-side samples remained compliant. This discrepancy was attributed to the location of the monitoring point relative to consumers’ taps. In this case, the utility-side sampling point was situated beyond the last consumers, at a pipe endpoint where discoloration and water stagnation are more likely due to prolonged hydraulic residence times. In response, the water utility introduced a regular maintenance schedule to flush this pipeline section, thereby promoting water exchange and proactively addressing the issue.
4. Discussion
The lack of real-life examples showcasing the benefits of resolving fragmented data and subsequently incorporating it into utility’s daily workflows has been often cited as the fundamental barrier to overcome in order to facilitate digitalization in the water utilities sector [39,40,41]. This paper presents a successful integration of purpose-built surveys to assess customer perceptions of tap water quality to complement the existing methods for establishing sampling locations intended for DWQ monitoring. The proposed framework enables a more nuanced understanding and subsequent resolution of potential water quality issues within WDNs by introducing targeted sampling in areas reported to have subpar DWQ. Results indicate that while individual reports of perceived poor water quality may not warrant immediate action by service providers, the aggregation of these reports into problem hotspots reliably identifies relevant areas with actual DWQ issues. While sufficient for establishing a yearly, system-wide DWQ monitoring plan, the irregularity of submissions restricted the successful implementation of a truly “dynamic” framework. This necessitates the need for strategies that encourage regular customer feedback. A possible solution considered by the utility is the inclusion of a survey hyperlink in the monthly service bills. However, this approach might lead to artificial spikes in the data and would require limiting the submission period to avoid misinterpretation, thereby losing the capability to receive real-time reports. The evident tendency for reports to skew towards negative feedback should also be considered when examining the results.
A key limitation of this study is its reliance on voluntary, subjective feedback. Prior research suggests that customers’ perceptions and their motivation to report problems can be influenced by a multitude of factors, including prior experience, socioeconomic status, and the utility’s reputation, among others [31,42,43,44,45]. While aggregating responses into hotspots helps mitigate individual biases, transforming subjective customer feedback into objective indicators remains a challenge, necessitating further research to define adequate, case-specific intervention thresholds for utilities. In addition to the aforementioned factors, these thresholds should also consider variables such as land use type and population dynamics, which have been reported to indirectly cause fluctuations of DWQ [46,47,48]. An important point to note is that this framework is not intended to replace sensor-based monitoring but to complement it. While sensors provide high-frequency, quantitative data on specific water quality parameters, customer feedback offers unique insights into sensory characteristics (e.g., taste, odor) that are otherwise difficult to capture. Combining both approaches can support the development of more holistic and responsive monitoring strategies.
The goal of this study was to facilitate community engagement by means of DWQ reporting via a simple online questionnaire designed to capitalize on end-users’ abilities to sense variations in supplied water characteristics. By limiting the set of descriptors used to characterize abnormal DWQ encounters a consistent, geo-referenced dataset was attained, thereby, enabling the local utility to discern the potential causes of these anomalies. Subsequent investigations within the Jūrmala WDN should refine the list of descriptors by eliminating hardness, which is unrelated to the operation of the distribution network, and turbidity, which may be misunderstood by the end-users. This aligns with Dietrich et al. (2014) who found that while humans can readily notice variations in supplied water quality, articulating the specifics can be challenging without prior training [18]. Future work should incorporate the use of a Likert scale to capture the subtleties of respondents’ perceptions as well as focus on detailed analysis of comments left by users. Findings from Balta Kaç and Eken (2023) suggest that machine learning (ML) and natural language processing (NLP) techniques, which facilitate the automatic analysis and extraction of information from extensive textual datasets, can be effectively utilized for this purpose [24].
The utility applied the feedback-driven framework to identify new water sampling locations within the Dzintari DMA. Site selection was guided by clusters of customer complaints related to taste and odor, the persistence of reported issues over several weeks, and proximity to distinct sub-zones that had limited prior monitoring coverage. This process resulted in the establishment of additional sampling points in the identified hotspots. Laboratory analyses confirmed that these new locations exhibited higher iron concentrations and turbidity than the routinely monitored sites. After targeted flushing, water exchange and partial pipeline renewal were carried out, follow-up sampling showed marked reductions in iron concentration and color, accompanied by a noticeable decline in odor-related complaints. These results demonstrate the advantages of integrating customer feedback into DWQ monitoring, as it enhances site selection, improves the detection of localized issues, and supports more responsive maintenance planning.
It must be acknowledged that the degradation of DWQ from source to tap can be caused by a myriad of factors, including aging infrastructure, overdue maintenance of system components, and inadequate upkeep of private water networks. However, the results of the presented study underscore the importance for utility operators to adapt the operational setups of their WDNs in response to evolving demand patterns, particularly in regions experiencing population decline, seasonal variations, and high commuter mobility. Research performed by Zhuang and Sela (2018, 2020) highlights the fact that residential demand changes, especially due to the widespread adoption of water-saving technologies, can impact overall network DWQ by increasing water stagnation [49,50]. Research conducted by Hatam et al. (2021), Pesantez et al. (2022), and Vizanko et al. (2024) indicates that both short and medium-term demand fluctuations must be considered to minimize trade-offs between WDN operation and DWQ experienced by consumers [50,51,52]. Future work in the field of asset maintenance and rehabilitation planning should incorporate the risk of long-term DWQ decline due to oversized system components as a variable to determine pipeline replacement priorities. As pointed out by Baird (2020) and Okwori et al. (2021), the cost-effectiveness of various proposed interventions should be compared against a zero-intervention scenario [53,54].
It should be emphasized that the results of this study pertain only to the study area and cannot be generalized and directly applied to other parts of the Jūrmala WDN or different WDNs. Although the survey dataset is not statistically representative of the entire WDN, the concentration of negative feedback from the study area highlights the value of such data for operational decision-making. This demonstrates that even small-scale, voluntary datasets can provide actionable insights when integrated with existing monitoring systems. Nevertheless, the underlying framework is transferable and can be adapted by other utilities, provided it is validated against local conditions and feedback dynamics. Future research efforts should focus on: (1) extrapolating the gathered feedback data to model potential customer sentiment in other parts of the WDN based on similarities of network characteristics and operational parameters, and (2) developing a predictive model to forecast potential poor ratings based on historical report data, and water demand projections.
5. Conclusions
The presented study proposes a novel approach to incorporate customer feedback data into a utility’s DWQ monitoring and assurance workflows. By analyzing both the temporal and spatial dynamics of customer reports on perceived quality indicators, it was possible to gauge DWQ fluctuations throughout the WDN and initiate targeted sampling in areas where a surge in poor ratings of similar nature was observed. Implementation of the proposed framework led to the establishment of 36 new monitoring sites within the studied DMA. During the initial sampling phase, exceedances of the maximum permissible values were detected for iron (up to 970 µg/L) and turbidity (up to 12.4 NTU) in both customer-side and utility-side samples. Following targeted maintenance activities, including pipeline flushing and water exchange, all affected sites achieved full regulatory compliance. In parallel, the number of complaints decreased from an average of 12.5 complaints per 1000 residents in Phase I to 3.6 in Phase II (a reduction of approximately 70%), confirming that feedback-based refinement of sampling locations yielded tangible improvements in DWQ and overall operational performance. The integration of the framework into local utility’s GIS database enabled automatic visualization of customer feedback data along with relevant on-site measurement as well as laboratory testing results.
The main advantages of the developed solution are: (1) a predefined set of descriptors ensures structured and consistent categorization of issues experienced by customers, (2) the addition of spatial reference data enables pinpointing of the encountered problems, (3) the proposed methodology is universal and therefore applicable to any GIS system facilitating rapid implementation for utilities. Given the alignment of poor DWQ in both customer-side and utility-side samples across all instances, it is evident that the proposed approach can identify critical areas within the WDN. By narrowing down the scope of further investigations, sizable savings in terms of capital and workforce costs can be achieved.
Main limitations of the proposed framework are: (1) the “dynamic” aspect of the workflow relies heavily on customer participation and willingness to share feedback, (2) the perceptions of DWQ can vary from person to person; therefore, a careful consideration for intervention thresholds must take place, (3) the successful implementation can be hindered by the utility’s willingness to digitize its workflows and address existing data silos. However, the effect of this limitation is mitigated by the inbuilt flexibility of the framework.
Furthermore, this limitation serves as a strong motivator that should encourage utilities and municipalities to prioritize digitalization, thus facilitating cross-cutting data-based decision-making. The results obtained via direct engagement of customers can aid system operators and decision makers in setting the order of renovations, thus facilitating joint stewardship.
Author Contributions
Conceptualization, G.D. and K.K.; methodology, G.D. and K.K.; software, G.D.; validation, G.D. and K.K.; formal analysis, G.D.; investigation, G.D. and K.K.; resources, G.D. and K.K.; data curation, G.D.; writing—original draft preparation, G.D.; writing—review and editing, G.D. and K.K.; visualization, G.D.; supervision, K.K. All authors have read and agreed to the published version of the manuscript.
Funding
This research received no external funding.
Data Availability Statement
Some of the data supporting the findings of this study were obtained from publicly available resources: https://data.gov.lv/lv (accessed on 18 August 2025). The authors confirm that the data supporting the findings are included within this article. Additional data presented in this study are available from the corresponding author upon reasonable request. Certain data cannot be made publicly available due to privacy restrictions.
Acknowledgments
The authors wish to thank SIA Jūrmalas ūdens for willingly sharing information and providing access to their data and facilities.
Conflicts of Interest
Authors G.D. and K.K. were employed by the company SIA Jūrmalas ūdens. The authors declare that the research was conducted in the absence of any commercial or financial relationships that could be construed as a potential conflict of interest.
References
- OECD (The Organisation for Economic Co-operation and Development). Infrastructure to 2030 (Volume 2): Mapping Policy for Electricity, Water and Transport; OECD: Paris, France, 2007; p. 510.
- Water Europe. Socio-Economic Study on the Value of EU Investing in Water; Water Europe: Brussels, Belgium, 2024; p. 324. [Google Scholar]
- Abu-Samra, S.; Ahmed, M.; Amador, L. Asset Management Framework for Integrated Municipal Infrastructure. J. Infrastruct. Syst. 2020, 26, 04020039. [Google Scholar] [CrossRef]
- Semadeni-Davies, A.; Hernebring, C.; Svensson, G.; Gustafsson, L.-G. The Impacts of Climate Change and Urbanisation on Drainage in Helsingborg, Sweden: Combined Sewer System. J. Hydrol. 2008, 350, 100–113. [Google Scholar] [CrossRef]
- Wang, X.; Zhang, J.; Shahid, S.; Guan, E.; Wu, Y.; Gao, J.; He, R. Adaptation to Climate Change Impacts on Water Demand. Mitig. Adapt. Strateg. Glob. Change 2016, 21, 81–99. [Google Scholar] [CrossRef]
- Kourtis, I.M.; Tsihrintzis, V.A. Adaptation of Urban Drainage Networks to Climate Change: A Review. Sci. Total Environ. 2021, 771, 145431. [Google Scholar] [CrossRef]
- Quitana, G.; Molinos-Senante, M.; Chamorro, A. Resilience of Critical Infrastructure to Natural Hazards: A Review Focused on Drinking Water Systems. Int. J. Disaster Risk Reduct. 2020, 48, 101575. [Google Scholar] [CrossRef]
- Kloosterman, R.A.; Herder, P.; van de Hoek, J.P. Enhancing the Resilience of Drinking Water Infrastructures. Int. J. Crit. Infrastruct. 2022, 18, 336–365. [Google Scholar] [CrossRef]
- Mays, L.W. (Ed.) Water Distribution System Handbook, 1st ed.; McGraw-Hill Education: New York, NY, USA, 2000; ISBN 978-0-07-134213-1. [Google Scholar]
- Brandt, M.J.; Johnson, K.M.; Elphinston, A.; Ratnayaka, D.D. Twort’s Water Supply, 7th ed.; Elsevier Ltd.: Amsterdam, The Netherlands; Butterworth-Heinemann: Boston, MA, USA, 2017; ISBN 978-0-08-100025-0. [Google Scholar]
- InfraGuide. Monitoring Water Quality in the Distribution System; A Best Practice by the National Guide to Sustainable Municipal Infrastructure; Federation of Canadian Municipalities and National Research Council: Ottawa, ON, Canada, 2004. [Google Scholar]
- ISO 5667-5:2006; Water Quality—Sampling—Part 5: Guidance on Sampling of Drinking Water from Treatment Works and Piped Distribution Systems. ISO: Geneva, Switzerland, 2006.
- Woo, H.-M.; Yoon, J.-H.; Choi, D.-Y. Optimal Monitoring Sites Based on Water Quality and Quantity in Water Distribution Systems. In Bridging the Gap: Meeting the World’s Water and Environmental Resources Challenges; ASCE: Reston, VA, USA, 2012; pp. 1–9. [Google Scholar] [CrossRef]
- Storey, M.V.; van der Gaag, B.; Burns, B.P. Advances in On-Line Drinking Water Quality Monitoring and Early Warning Systems. Water Res. 2011, 45, 741–747. [Google Scholar] [CrossRef]
- Salcedo, C.; Boccelli, D.L. An Integrated Framework for Supplementing Online Water Quality Monitoring in the Detection of Contamination Events in Water Distribution Networks. Eng. Proc. 2024, 69, 10. [Google Scholar] [CrossRef]
- Agresta, A.; Fattoruso, G.; Lanza, B.; Fabbricino, M.; Trifuoggi, M.; De Vito, S.; Di Francia, G. Applying Numerical Models and Optimized Sensor Networks for Drinking Water Quality Control. Procedia Eng. 2015, 119, 918–926. [Google Scholar] [CrossRef]
- Cahn, A.; Katz, D.; Ghermandi, A.; Prevos, P. Adoption of Data-as-a-Service by Water and Wastewater Utilities. Util. Policy 2023, 81, 101492. [Google Scholar] [CrossRef]
- Dietrich, A.M.; Phetxumphou, K.; Gallagher, D.L. Systematic Tracking, Visualizing, and Interpreting of Consumer Feedback for Drinking Water Quality. Water Res. 2014, 66, 63–74. [Google Scholar] [CrossRef]
- Delpla, I.; Legay, C.; Proulx, F.; Rodriguez, M.J. Perception of Tap Water Quality: Assessment of the Factors Modifying the Links between Satisfaction and Water Consumption Behavior. Sci. Total Environ. 2020, 722, 137786. [Google Scholar] [CrossRef]
- Rolston, A.; Jennings, E.; Linnane, S. Water Matters: An Assessment of Opinion on Water Management and Community Engagement in the Republic of Ireland and the United Kingdom. PLoS ONE 2017, 12, e0174957. [Google Scholar] [CrossRef]
- Mariani, L.; Trivellato, B.; Martini, M.; Marafioti, E. Achieving Sustainable Development Goals Through Collaborative Innovation: Evidence from Four European Initiatives. J. Bus. Ethics 2022, 180, 1075–1095. [Google Scholar] [CrossRef] [PubMed]
- ISO 31000:2018; Risk Management—Guidelines. ISO: Geneva, Switzerland, 2018.
- Sarkar, M.; SP Group LLC. Perceptions of Drinking Water Quality—A Review of the Literature and Surveys Covering the Topic; Office of Policy Development and Research (PD&R): Washington, DC, USA, 2022; p. 41.
- Balta Kaç, S.; Eken, S. Customer Complaints-Based Water Quality Analysis. Water 2023, 15, 3171. [Google Scholar] [CrossRef]
- Lambert, L.H.; Bir, C. Evaluating Water Quality Using Social Media and Federal Agency Data. J. Water Health 2021, 19, 959–974. [Google Scholar] [CrossRef]
- Rapousis, N.; Papadopouli, M. Performance Analysis of a User-Centric Crowd-Sensing Water Quality Assessment System. In Proceedings of the 2016 International Workshop on Cyber-Physical Systems for Smart Water Networks (CySWater), Vienna, Austria, 11 April 2016; pp. 13–18. [Google Scholar] [CrossRef]
- Rapousis, N.; Katsarakis, M.; Papadopouli, M. QoWater: A Crowd-Sourcing Approach for Assessing the Water Quality. In Proceedings of the 1st ACM International Workshop on Cyber-Physical Systems for Smart Water Networks, Seattle, WA, USA, 13–16 April 2015; p. 11. [Google Scholar] [CrossRef]
- Whelton, A.J.; Dietrich, A.M.; Gallagher, D.L.; Roberson, J.A. Using Customer Feedback for Improved Water Quality and Infrastructure Monitoring. J.-Am. Water Works Assoc. 2007, 99, 62–76. [Google Scholar] [CrossRef]
- U.S. Environmental Protection Agency. Response Protocol Toolbox: Planning for and Responding to Drinking Water Contamination Threats and Incidents: Response Guidelines; Environmental Protection Agency: Washington, DC, USA, 2004; p. 69.
- Hasan, J.; Goldbloom-Helzner, D.; Ichida, A.; Rouse, T.; Gibson, M. Technologies and Techniques for Early Warning Systems to Monitor and Evaluate Drinking Water Quality: A State-of-the-Art Review; Environmental Protection Agency: Washington, DC, USA, 2005; p. 236.
- Montenegro, P.; Rodriguez, M.J.; Miranda, L.F.; Joerin, F.; Proulx, F. Occurrence of Citizen Complaints Concerning Drinking Water: A Case Study in Quebec City. J. Water Supply Res. Technol.-AQUA 2009, 58, 257–266. [Google Scholar] [CrossRef]
- Lee, J.; Nam, S.-H.; Koo, J.-W.; Shin, Y.; Kim, E.; Song, J.; Hwang, T.-M. Detecting Clusters and Tracing Management of Water Distribution System Using Space–Time Scan Statistics and Utility Network Modeling. Process Saf. Environ. Prot. 2024, 187, 249–258. [Google Scholar] [CrossRef]
- Oficiālās Statistikas Portāls. Iedzīvotāju Skaits gada Sākumā, tā Izmaiņas un Dabiskās Kustības Galvenie Rādītāji Reģionos, Pilsētās un Novados 2012–2023. Available online: https://data.stat.gov.lv:443/pxweb/lv/OSP_PUB/START__POP__IR__IRS/IRS031/ (accessed on 18 March 2024).
- Oficiālās Statistikas Portāls. Pastāvīgo Iedzīvotāju Blīvums Reģionos, Pilsētās, Novados un Pagastos gada Sākumā 2022–2023. Available online: https://data.stat.gov.lv:443/pxweb/lv/OSP_PUB/START__POP__IR__IRD/IRD062/ (accessed on 18 March 2024).
- Ūdenssaimniecības Pakalpojumu Sniedzēju 2016.–2022.gada Darbības Rādītāju Salīdzinājums. Available online: https://www.sprk.gov.lv/content/nozares-raditaji-0 (accessed on 18 March 2024).
- Gibson, J.; Karney, B.; Guo, Y. Water Quality and Fire Protection Trade-Offs in Water Distribution Networks. J. AWWA 2019, 111, 44–52. [Google Scholar] [CrossRef]
- Latvijas Republikas Ministru kabinets. Dzeramā ūdens Obligātās Nekaitīguma un Kvalitātes Prasības, Monitoringa un Kontroles Kārtība [Mandatory Harmlessness and Quality Requirements for Drinking Water, and the Procedures for Monitoring and Control Thereof]; Latvijas Republikas Ministru kabinets: Riga, Latvia, 2023; Volume OP 2023/188.7.
- Tscheikner-Gratl, F.; Caradot, N.; Cherqui, F.; Leitão, J.P.; Ahmadi, M.; Langeveld, J.G.; Le Gat, Y.; Scholten, L.; Roghani, B.; Rodríguez, J.P.; et al. Sewer Asset Management–State of the Art and Research Needs. Urban Water J. 2019, 16, 662–675. [Google Scholar] [CrossRef]
- Le Gat, Y.; Curt, C.; Werey, C.; Caillaud, K.; Rulleau, B.; Taillandier, F. Water Infrastructure Asset Management: State of the Art and Emerging Research Themes. Struct. Infrastruct. Eng. 2023, 21, 539–562. [Google Scholar] [CrossRef]
- Okwori, E.; Viklander, M.; Hedström, A. Data Integration in Asset Management of Municipal Pipe Networks in Sweden: Challenges, Gaps, and Potential Drivers. Util. Policy 2024, 86, 101689. [Google Scholar] [CrossRef]
- de França Doria, M. Factors Influencing Public Perception of Drinking Water Quality. Water Policy 2009, 12, 1–19. [Google Scholar] [CrossRef]
- Pierce, G.; Gonzalez, S. Mistrust at the Tap? Factors Contributing to Public Drinking Water (Mis)Perception across US Households. Water Policy 2016, 19, 1–12. [Google Scholar] [CrossRef]
- Robak, A.; Robak, A. Perceived vs Measured Water Supply Service: Evidence from New Zealand. Int. J. Water Resour. Dev. 2021, 38, 938–963. [Google Scholar] [CrossRef]
- Karmakar, D.; Sarkar, B.; Islam, N. Drinking Water Quality in Cooch Behar Municipality, West Bengal, India: Assessment Using WQI and Public Perception. Environ. Qual. Manag. 2024, 34, e22226. [Google Scholar] [CrossRef]
- Lucas, S.A.; Coombes, P.J.; Sharma, A.K. The Impact of Diurnal Water Use Patterns, Demand Management and Rainwater Tanks on Water Supply Network Design. Water Supply 2010, 10, 69–80. [Google Scholar] [CrossRef]
- Loureiro, D.; Mamade, A.; Cabral, M.; Amado, C.; Covas, D. A Comprehensive Approach for Spatial and Temporal Water Demand Profiling to Improve Management in Network Areas. Water Resour. Manag. 2016, 30, 3443–3457. [Google Scholar] [CrossRef]
- Faure, J.C.; Faust, K.M. Socioeconomic Characteristics versus Density Changes: The Operational Effects of Population Dynamics on Water Systems. Sustain. Resilient Infrastruct. 2023, 8, 3–16. [Google Scholar] [CrossRef]
- Zhuang, J.; Sela, L. Network Effects of Evolving Water Demand Patterns. In Proceedings of the World Environmental and Water Resources Congress 2018, Minneapolis, MN, USA, 3–7 June 2018; pp. 93–104. [Google Scholar] [CrossRef]
- Zhuang, J.; Sela, L. Impact of Emerging Water Savings Scenarios on Performance of Urban Water Networks. J. Water Resour. Plan. Manag. 2020, 146, 04019063. [Google Scholar] [CrossRef]
- Hatam, F.; Ebacher, G.; Prévost, M. Stringency of Water Conservation Determines Drinking Water Quality Trade-Offs: Lessons Learned from a Full-Scale Water Distribution System. Water 2021, 13, 2579. [Google Scholar] [CrossRef]
- Pesantez, J.E.; Alghamdi, F.; Sabu, S.; Mahinthakumar, G.; Berglund, E.Z. Using a Digital Twin to Explore Water Infrastructure Impacts during the COVID-19 Pandemic. Sustain. Cities Soc. 2022, 77, 103520. [Google Scholar] [CrossRef] [PubMed]
- Vizanko, B.; Kadinski, L.; Ostfeld, A.; Berglund, E.Z. Social Distancing, Water Demand Changes, and Quality of Drinking Water during the COVID-19 Pandemic. Sustain. Cities Soc. 2024, 102, 105210. [Google Scholar] [CrossRef]
- Baird, G.M. New U.S. and International Water Main Break Studies: More Detailed Pipe Analysis but What Are We Doing with the Data? In Proceedings of the Pipelines 2020, San Antonio, TX, USA, 9–12 August 2020; pp. 316–325. [Google Scholar]
- Okwori, E.; Pericault, Y.; Ugarelli, R.; Viklander, M.; Hedström, A. Data-Driven Asset Management in Urban Water Pipe Networks: A Proposed Conceptual Framework. J. Hydroinform. 2021, 23, 1014–1029. [Google Scholar] [CrossRef]


Disclaimer/Publisher’s Note: The statements, opinions and data contained in all publications are solely those of the individual author(s) and contributor(s) and not of MDPI and/or the editor(s). MDPI and/or the editor(s) disclaim responsibility for any injury to people or property resulting from any ideas, methods, instructions or products referred to in the content. |
© 2025 by the authors. Licensee MDPI, Basel, Switzerland. This article is an open access article distributed under the terms and conditions of the Creative Commons Attribution (CC BY) license (https://creativecommons.org/licenses/by/4.0/).