1. Introduction
Arid and semi-arid inland basins, which encompass approximately 41% of the Earth’s terrestrial surface, constitute environmentally sensitive regions where climate–human interactions are particularly pronounced [
1,
2,
3]. These areas are typified by minimal precipitation, elevated evaporation rates, and chronic water scarcity, rendering groundwater dynamics a pivotal determinant of land use configurations and socioeconomic resilience [
4,
5]. In the context of escalating global demands for food security and rapid urban expansion, excessive groundwater extraction has precipitated declining aquifer levels, contraction of oases, and loss of biodiversity [
6]. Such outcomes intensify human–environment tensions, especially under prevailing development models characterized by high water consumption and expansive land use. Land use systems in arid regions have long been trapped in a self-reinforcing “cropland expansion—groundwater overexploitation—ecological degradation” vicious cycle. Compelling evidence from global hotspots illustrates this nexus. Central Asia’s Aral Sea Basin: Irrigation-driven cropland expansion caused an 87.85% shrinkage of the Aral Sea (1960–2018), representing one of the planet’s most severe anthropogenic ecological disasters [
7]. India’s Indo-Gangetic Plain: Policy-subsidized wheat–rice double-cropping has depleted groundwater at unsustainable rates, leading to critical drying of shallow aquifers across 45% of the region and severe drinking water crises in rural communities [
8]. US High Plains Aquifer: Expansion of the Corn Belt has consumed 30% of the aquifer’s storage, disrupting its millennial-scale renewal cycles. This triggered a 40% reduction in river baseflow and degradation of 56,000 km
2 of native grasslands [
9]. China’s Heihe River Basin: Groundwater overexploitation in the northwest has driven widespread vegetation degradation in downstream riparian ecosystems [
10,
11,
12]. These cases highlight the pressing need for integrated and adaptive groundwater–land use management strategies.
Existing studies have explored groundwater–land use relationships but face limitations. For groundwater dynamics, early work predominantly focused on oversimplified linear correlations between extraction intensity and water-level decline [
13], whereas recent advances highlight hydrogeological modulation (e.g., aquifer permeability, recharge pathways) altering system response thresholds to anthropogenic forcing [
2]. Regarding land use transitions, policy interventions (water quotas, eco-compensation) promote cultivated contraction and artificial surfaces intensification, exemplified by Israel’s 40% agricultural water-efficiency gain via drip irrigation [
14] and China’s “Grain-for-Green” program [
2,
15]. However, critical gaps persist: (i) inadequate characterization of coupled “hydrogeological structure—anthropogenic activity—groundwater response” mechanisms, failing to account for spatial heterogeneity under comparable extraction intensities [
16]; (ii) limited analysis linking land use transitions to groundwater system-critical thresholds [
17], hindering targeted management [
18,
19].
China’s northwestern inland basins offer ideal research templates. The Wuwei Basin within the Shiyang River watershed—featuring a complete hydrogeological unit (piedmont recharge → midstream transition → downstream discharge) and undergoing significant changes since the Key Governance Program (2007) [
20]—provides a representative case for deciphering coevolutionary dynamics [
21,
22]. This study addresses three questions: (1) What are the spatiotemporal characteristics and policy drivers of land use transition? (2) Is groundwater spatial differentiation controlled by coupled hydrogeological architecture and anthropogenic activities? (3) How do human activities reconfigure natural water cycling pathways and impact groundwater–land use systems? Answers will advance theoretical frameworks and practical strategies for global dryland sustainability.
2. Study Area Configuration
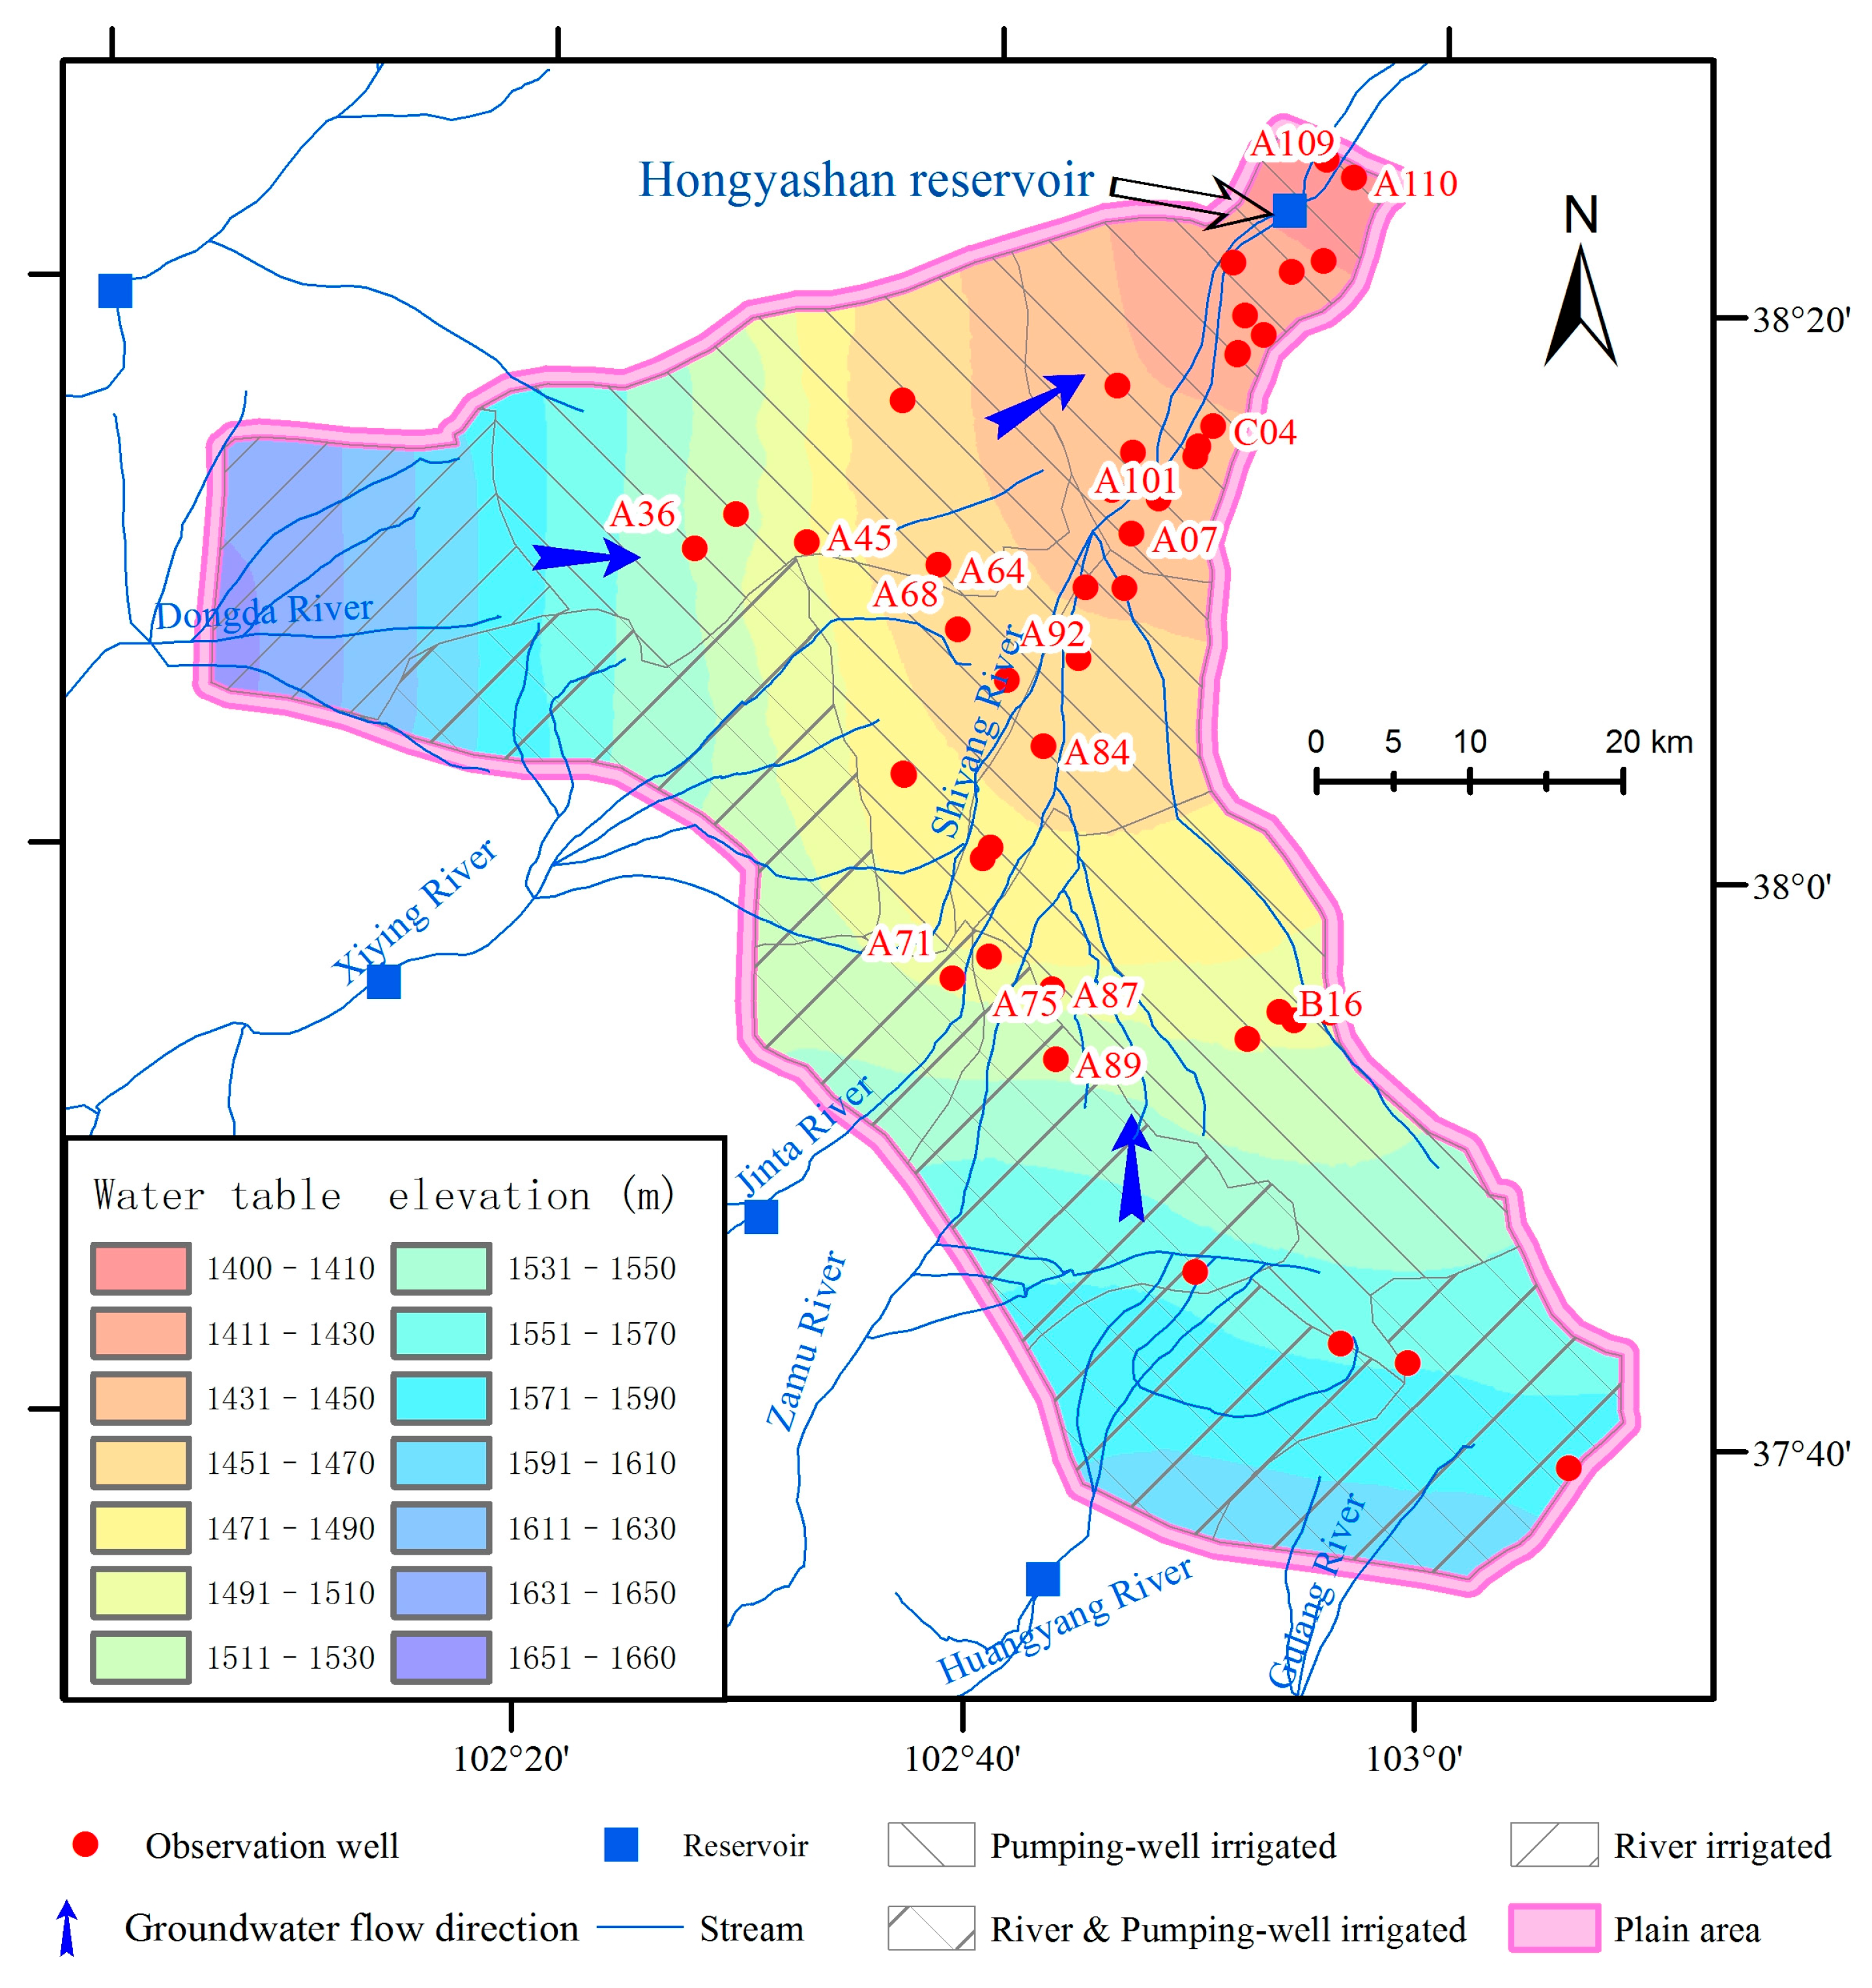
The Shiyang River Basin (101°41′–104°16′ E, 36°29′–39°27′ N), situated in the eastern Hexi Corridor, is bounded by the Wushaoeling Mountains to the east, the northern piedmont of the Qilian Mountains to the west, and the Badain Jaran and Tengger Deserts to the north. Elevations range from 1300 m to 4800 m. The plains are dominated by desert vegetation, with artificial oases concentrated in irrigated areas (
Figure 1), forming a typical “cultivation-impossible-without-irrigation” ecosystem. The region exhibits a pronounced arid continental climate, with a multi-year mean precipitation of 172.8 mm (interannual variation: 134.8 mm–194.4 mm) and mean evaporation of 1236 mm (interannual variation: 1070 mm–1424 mm; observed using E601 evaporimeters at Wuwei National Meteorological Station). Evaporation increases exponentially with decreasing elevation: 800 mm–1200 mm in the Qilian Mountains (2000 m–2400 m), rising to 1400 mm–1800 mm in the plains (1000 m–1500 m), and exceeding 2000 mm in the northern desert.
The basin is divided hydrologically into three independent subsystems: the Dajing River, Six-River, and Xida River subsystems. The Six-River subsystem comprises the Gulang, Huangyang, Zamu, Jinta, Xiying, and Dongda Rivers. These converge at the margin of the Wuwei Basin to form the Shiyang River mainstem, which flows into the Minqin Basin. Groundwater naturally discharges via spring clusters (e.g., Caiqi Township) in foreland fault–depression basins (e.g., Wuwei Basin), sustaining river baseflow as surface runoff.
The groundwater system, governed by neotectonic activity, predominantly consists of Middle-to-Upper Pleistocene sand-gravel aquifers, accompanied by subordinate Lower Pleistocene units composed of weakly cemented conglomerates, sandstones, and sandy loams. The spatial distribution and burial depth of these aquifers are markedly shaped by neotectonic processes. Specifically, concealed Quaternary faults along the piedmont region induce uplift of the southern basement, resulting in shallow phreatic water conditions. Conversely, these tectonic features cause a pronounced increase in aquifer thickness toward the north, giving rise to fault-step zone phreatic systems and plain phreatic-confined aquifer configurations. Pore water in Quaternary sediments dominates the plain aquifer system, underlaid by Tertiary mudstones, sandy mudstones, and argillaceous conglomerates acting as a regional aquitard with negligible hydraulic connectivity. Aquifer parameters exhibit strong spatial heterogeneity: permeability coefficients (K) range from 18 m/d–21 m/d in piedmont alluvial–pluvial fans (coarse gravels), 5 m/d–15 m/d in midstream alluvial–lacustrine plains (sand–gravel/fine-sand interbeds), to 0.5–5 m/d (locally <0.5 m in clay-rich zones) in the downstream Minqin Basin (silt-fine sands and clays). The mid-lower Wuwei Basin exhibits substantial aquifer thickness (80 m–150 m average).
Recharge relies predominantly (>60%) on lateral inflow from the Qilian Mountains piedmont, supplemented by precipitation infiltration, canal leakage, and irrigation return flow. Discharge occurs via spring outflow (e.g., Caiqi), lateral outflow, and dominantly (>85% of total discharge) agricultural abstraction and evaporation. Natural flow converges south-to-north, diverting northeastward along the Shiyang River into the Minqin Basin. Water table depth decreases from 100 to 120 m in the southwestern piedmont to ~3 m in northeastern discharge zones (
Figure 2).
4. Results and Discussion
4.1. Land Use Change Characteristics
4.1.1. Dynamics of Major Land Use Types
The land use pattern in the Wuwei Basin remained relatively stable from 1970 to 1985, with cultivated area fluctuating around 1900 km
2. Continuous cultivated expansion commenced after 1985, peaked around 2005, and subsequently declined [
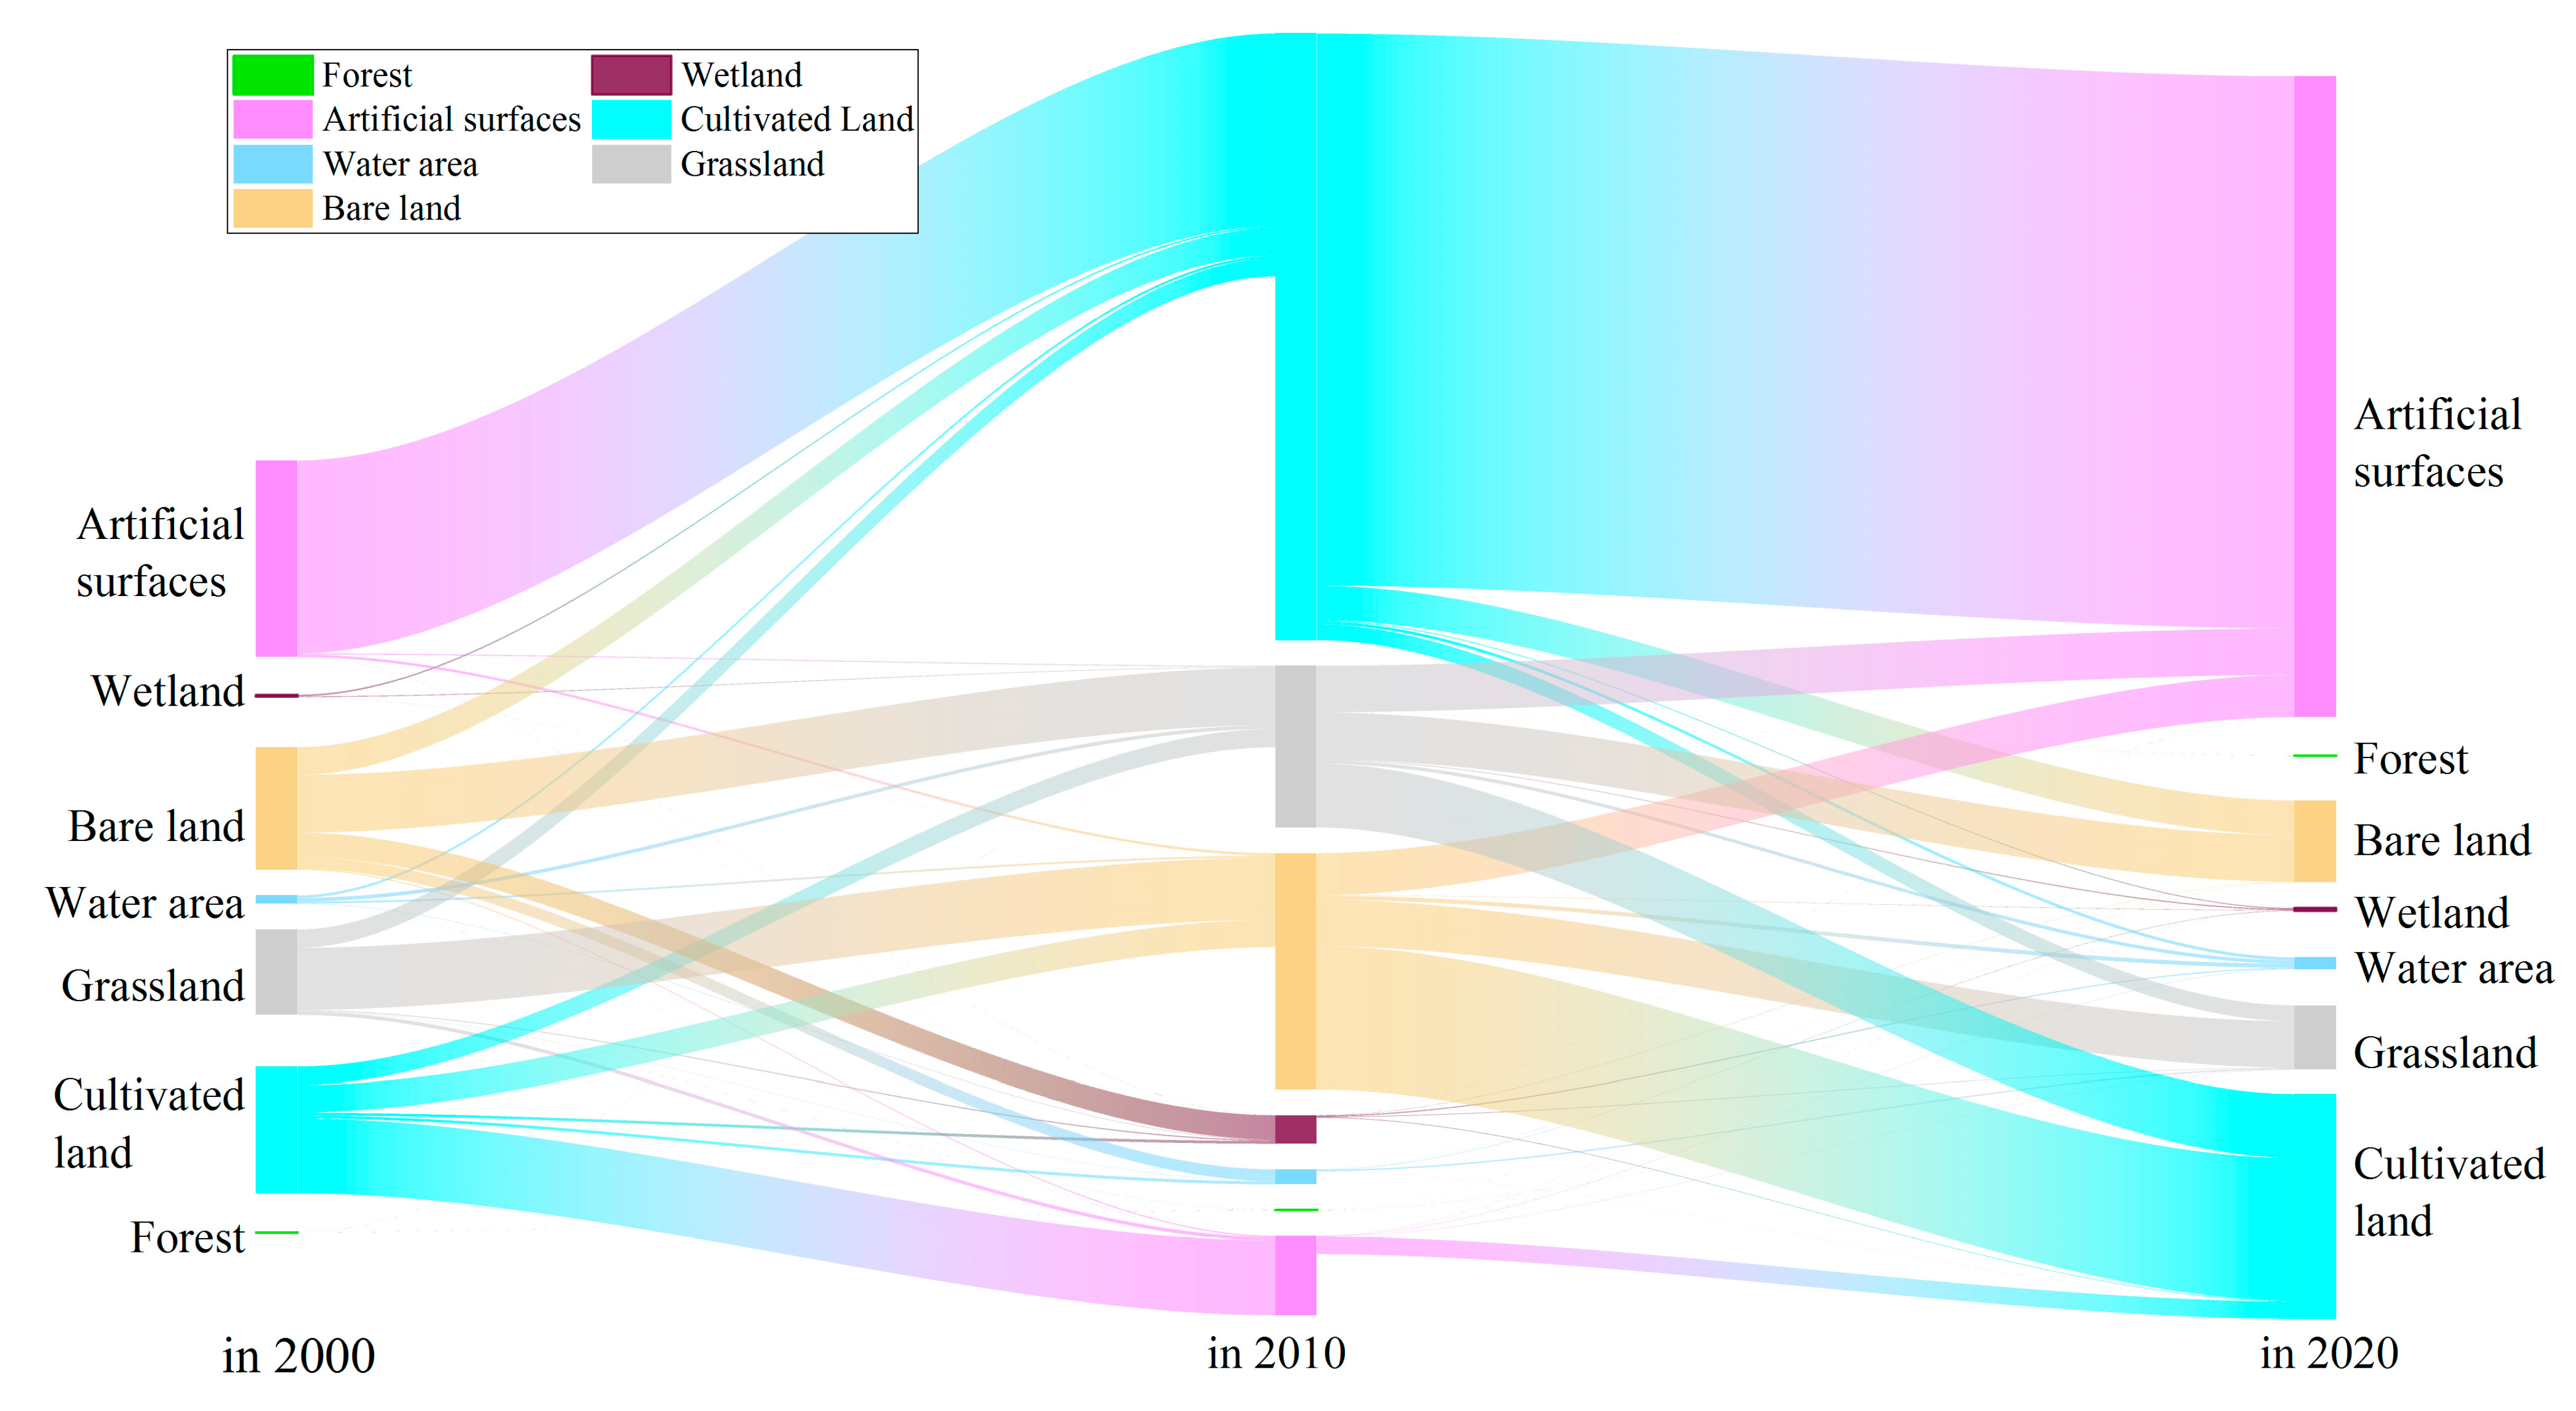
22]. The most pronounced changes occurred over the last two decades. This analysis focuses on the contrasting periods 2000–2010 and 2010–2020 (
Figure 3 and
Figure 4). Land use transition matrices, validated by closure checks (constant total area: 4994.61 km
2 for 2000, 2010, 2020), confirm data integrity. Matrix rows represent initial (T1) land use types, columns represent terminal (T2) types, and elements denote the transition area (km
2) (
Table 1 and
Table 2).
- (1)
2000–2010 Period
Cultivated, bare land, and grassland dominated (61.0%, 27.8%, 7.3%). Key features included cultivated expansion (net increase: +70.34 km2, +2.3%) and bare land reduction (net decrease: −17.22 km2, −1.2%). Cultivated gains primarily originated from artificial surfaces (116.38 km2, 79.4%) and bare land (16.73 km2, 11.4%), while losses were mainly to artificial surfaces (45.19 km2, 59.2%) and bare land (16.50 km2, 21.6%), indicating concurrent agricultural expansion and artificial surfaces reclamation. Artificial surfaces experienced a net decrease (−70.57 km2, −40.4%), dominated by transitions to cultivated (45.19 km2). High cultivated inflow (116.38 km2, 98.1% from cultivated) suggests simultaneous cultivated expansion in suitable areas and abandonment of desertified cultivated. Sensitive ecological types showed substantial changes: wetland area surged (+15.83 km2, +1119.9%) and water bodies increased (+4.00 km2, +21.3%), primarily sourced from bare land (85.3% and 78.0%, respectively), reflecting the synergistic effects of ecological water diversion projects and river channel regulation. Grassland degradation indicated intensifying water stress.
- (2)
2010–2020 Period
Land use underwent a significant structural transition. Artificial surfaces expanded rapidly (net increase: +375.43 km2, +360.4%), with 86.2% of gains originating from cultivated (333.01 km2). Conversely, cultivated shifted to net decrease (−230.20 km2, −7.4%), with 91.0% converted to artificial surfaces. Bare land restoration accelerated (net decrease: −92.83 km2, −6.8%), primarily converted to cultivated (86.20 km2) and grassland (27.96 km2). Ecological land stability improved: wetland area increased marginally (+0.11 km2, +0.7%) and water bodies grew (+6.16 km2, +27.1%).
- (3)
Inter-period Comparison
Cultivated transitioned from “production-priority” expansion (average +7.03 km2/yr, 2000–2010) to “stock optimization” contraction (average −23.02 km2/yr, 2010–2020). Losses later concentrated on artificial surfaces occupation (91.0%), while gains relied on bare land reclamation, reflecting the cultivated land requisition–compensation balance mechanism and ecological redline constraints. Artificial surfaces shifted from disorderly contraction (net decrease: −70.57 km2 earlier) to intensive expansion (average rate surged to +37.54 km2/yr later), marking a transition towards concentrated urbanization. Bare land restoration evolved from mixed natural recovery and reclamation (average +1.72 km2/yr earlier) to predominantly engineered efforts (average +9.28 km2/yr later), indicating enhanced ecological governance efficacy.
4.1.2. Driving Mechanisms of Land Use Change
- (1)
Shift from Natural–Economic to Policy Dominance
Time period 2000–2010: Dominated by natural conditions and spontaneous economic activities. Cultivated expansion driven by precipitation variability and food security policies; bare land reduction stemmed from reclamation driven by profit; artificial surfaces’ “pseudo-shrinkage” reflected discrepancies between statistical systems and on-ground changes.
Time period 2010–2020: Policy intervention became the core driver. Implementation of the Key Governance Program for Shiyang River Basin forced structural adjustment via total water use control (e.g., 30% reduction in cultivated water quotas); eco-compensation mechanisms (e.g., wetland restoration subsidies) enhanced restoration incentives; territorial spatial planning established ecological–agricultural–urban spatial zoning (“Three Zones and Three Lines”), rigidly constraining unplanned artificial surfaces sprawl [
27].
- (2)
Synergistic Effects of Policy Interventions
Rigid water constraints, embodied in water rights trading, drove the shift from agricultural to ecological water use [
28]. This directly reduced water consumption for cultivated-to-artificial surfaces conversion by 42% (2010–2020) and lowered water consumption per unit GDP by 57% [
29]. Urban–rural artificial surfaces linkage policies shifted expansion from “marginal benefit-driven” to “policy benefit-driven,” increasing the efficiency of cultivated-to-artificial surfaces conversion by 3.2 times. Long-term ecological projects (e.g., windbreak and sand fixation) increased the bare land restoration rate to 5.4 times the previous level [
30], enhancing ecological stability.
4.2. Groundwater Depth Variation
4.2.1. Water Level Change Analysis Since the 1980s
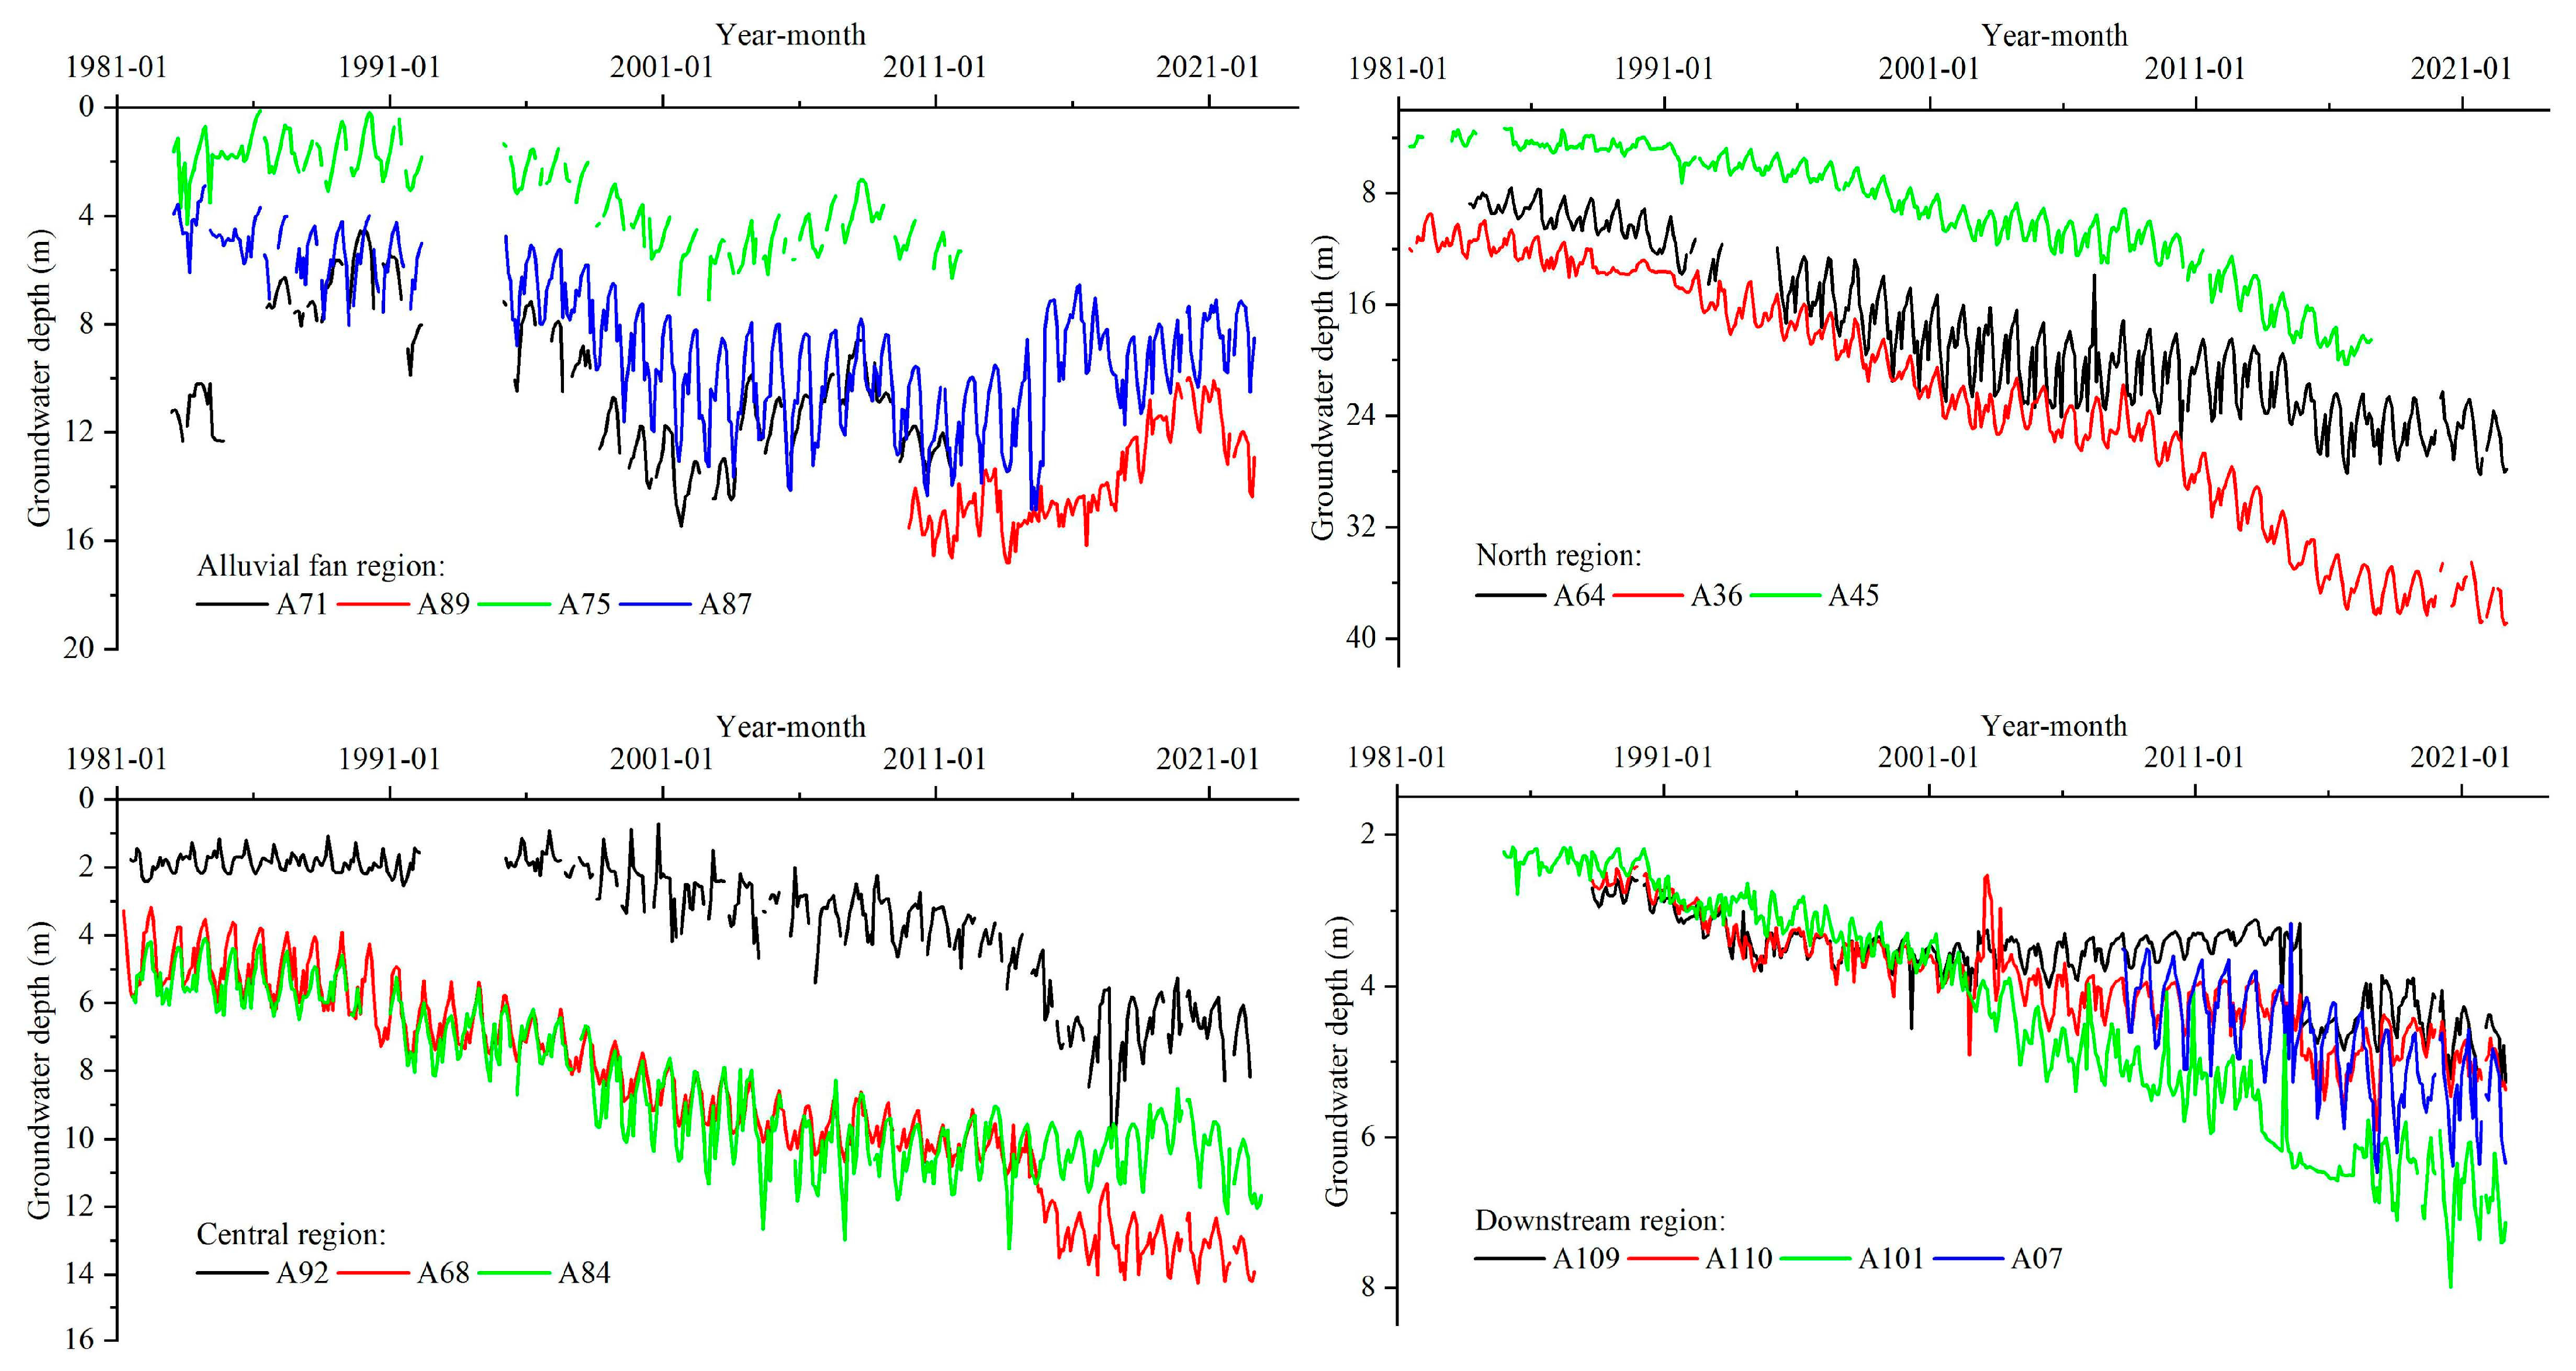
Groundwater dynamics in Wuwei Basin over the past 40 years (1980–2022) exhibited significant spatiotemporal heterogeneity (
Figure 5). The piedmont alluvial–pluvial fans had relatively shallow depths in the early 1980s (e.g., Well A75: 1.13 m; Well A87: 3.57 m, Apr 1983) but experienced persistent, slow declines (avg. rate: 0.15 m/yr–0.18 m/yr). Notably, the decline rate varied: 0.07 m/yr–0.14 m/yr pre-1998 versus 0.03 m/yr–0.05 m/yr post-1999. Despite being a surface water–groundwater conjunctive use area with low extraction, the decline is primarily attributed to dual attenuation of natural recharge pathways: (1) Upstream reservoir interception reduced mountain-pass runoff, diminishing lateral recharge; (2) transfer surface water delivered via highly lined canals directly to fields reduced seepage recharge to <20% of natural conditions [
31]. This recharge attenuation exceeded the buffering capacity of low extraction, driving persistent decline.
The continuous decline in the northern plains directly relates to human activities. Pre-1970, this area was a spring-fed irrigation district with shallow depths (~2.4 m at Well A45, Apr 1978). Transition to a purely well-fed system in the mid-late 1970s triggered sustained overdraft: average decline rates reached 0.42 m/yr–0.71 m/yr (1981–2022), showing acceleration. The first peak decline occurred in 1991–2002 (Well A36: 0.78 m/yr), followed by a further increase to 1.08 m/yr at A36 after 2009, culminating in a depth of 38.83 m by 2022 (cumulative decline >36.4 m). This sharp decline resulted from extraction intensity far exceeding aquifer renewal capacity, highlighting the unsustainability of pure well irrigation in low-recharge zones.
Dynamics in the central plains reveal interactions between anthropogenic activities and hydrogeological structure. The overall average decline rate was 0.13 m/yr–0.23 m/yr (1980–2022), but spatial heterogeneity was marked: Increased extraction intensity at Well A68 (from 35.22 × 10⁴ m3/km2·yr to 39.14 × 10⁴ m3/km2·yr) raised its decline rate from 0.20 m/yr to 0.29 m/yr. Near the discharge zone, Well A92 had a lower initial rate (0.12 m/yr before 2014) due to stronger runoff recharge, rising to 0.22 m/yr later as recharge attenuated. This demonstrates that permeability heterogeneity (K = 5 m/d–15 m/d) significantly modulates the extraction response intensity, with low-permeability zones more vulnerable to overdraft impacts.
The downstream discharge zone exhibited a unique steady-state maintenance mechanism. Depths remained shallow (e.g., Well A07: 3.51 m, Apr 2008), with minimal annual decline rates (0.04 m/yr–0.12 m/yr). Stability stems from dual buffering: (1) sustained lateral runoff recharge, and (2) localized water cycling via irrigation return flow. Despite complete reliance on groundwater for irrigation, these mechanisms effectively offset extraction impacts, establishing this zone as a critical equilibrium area for the basin’s groundwater system.
4.2.2. Water Level Changes over the Past Two Decades
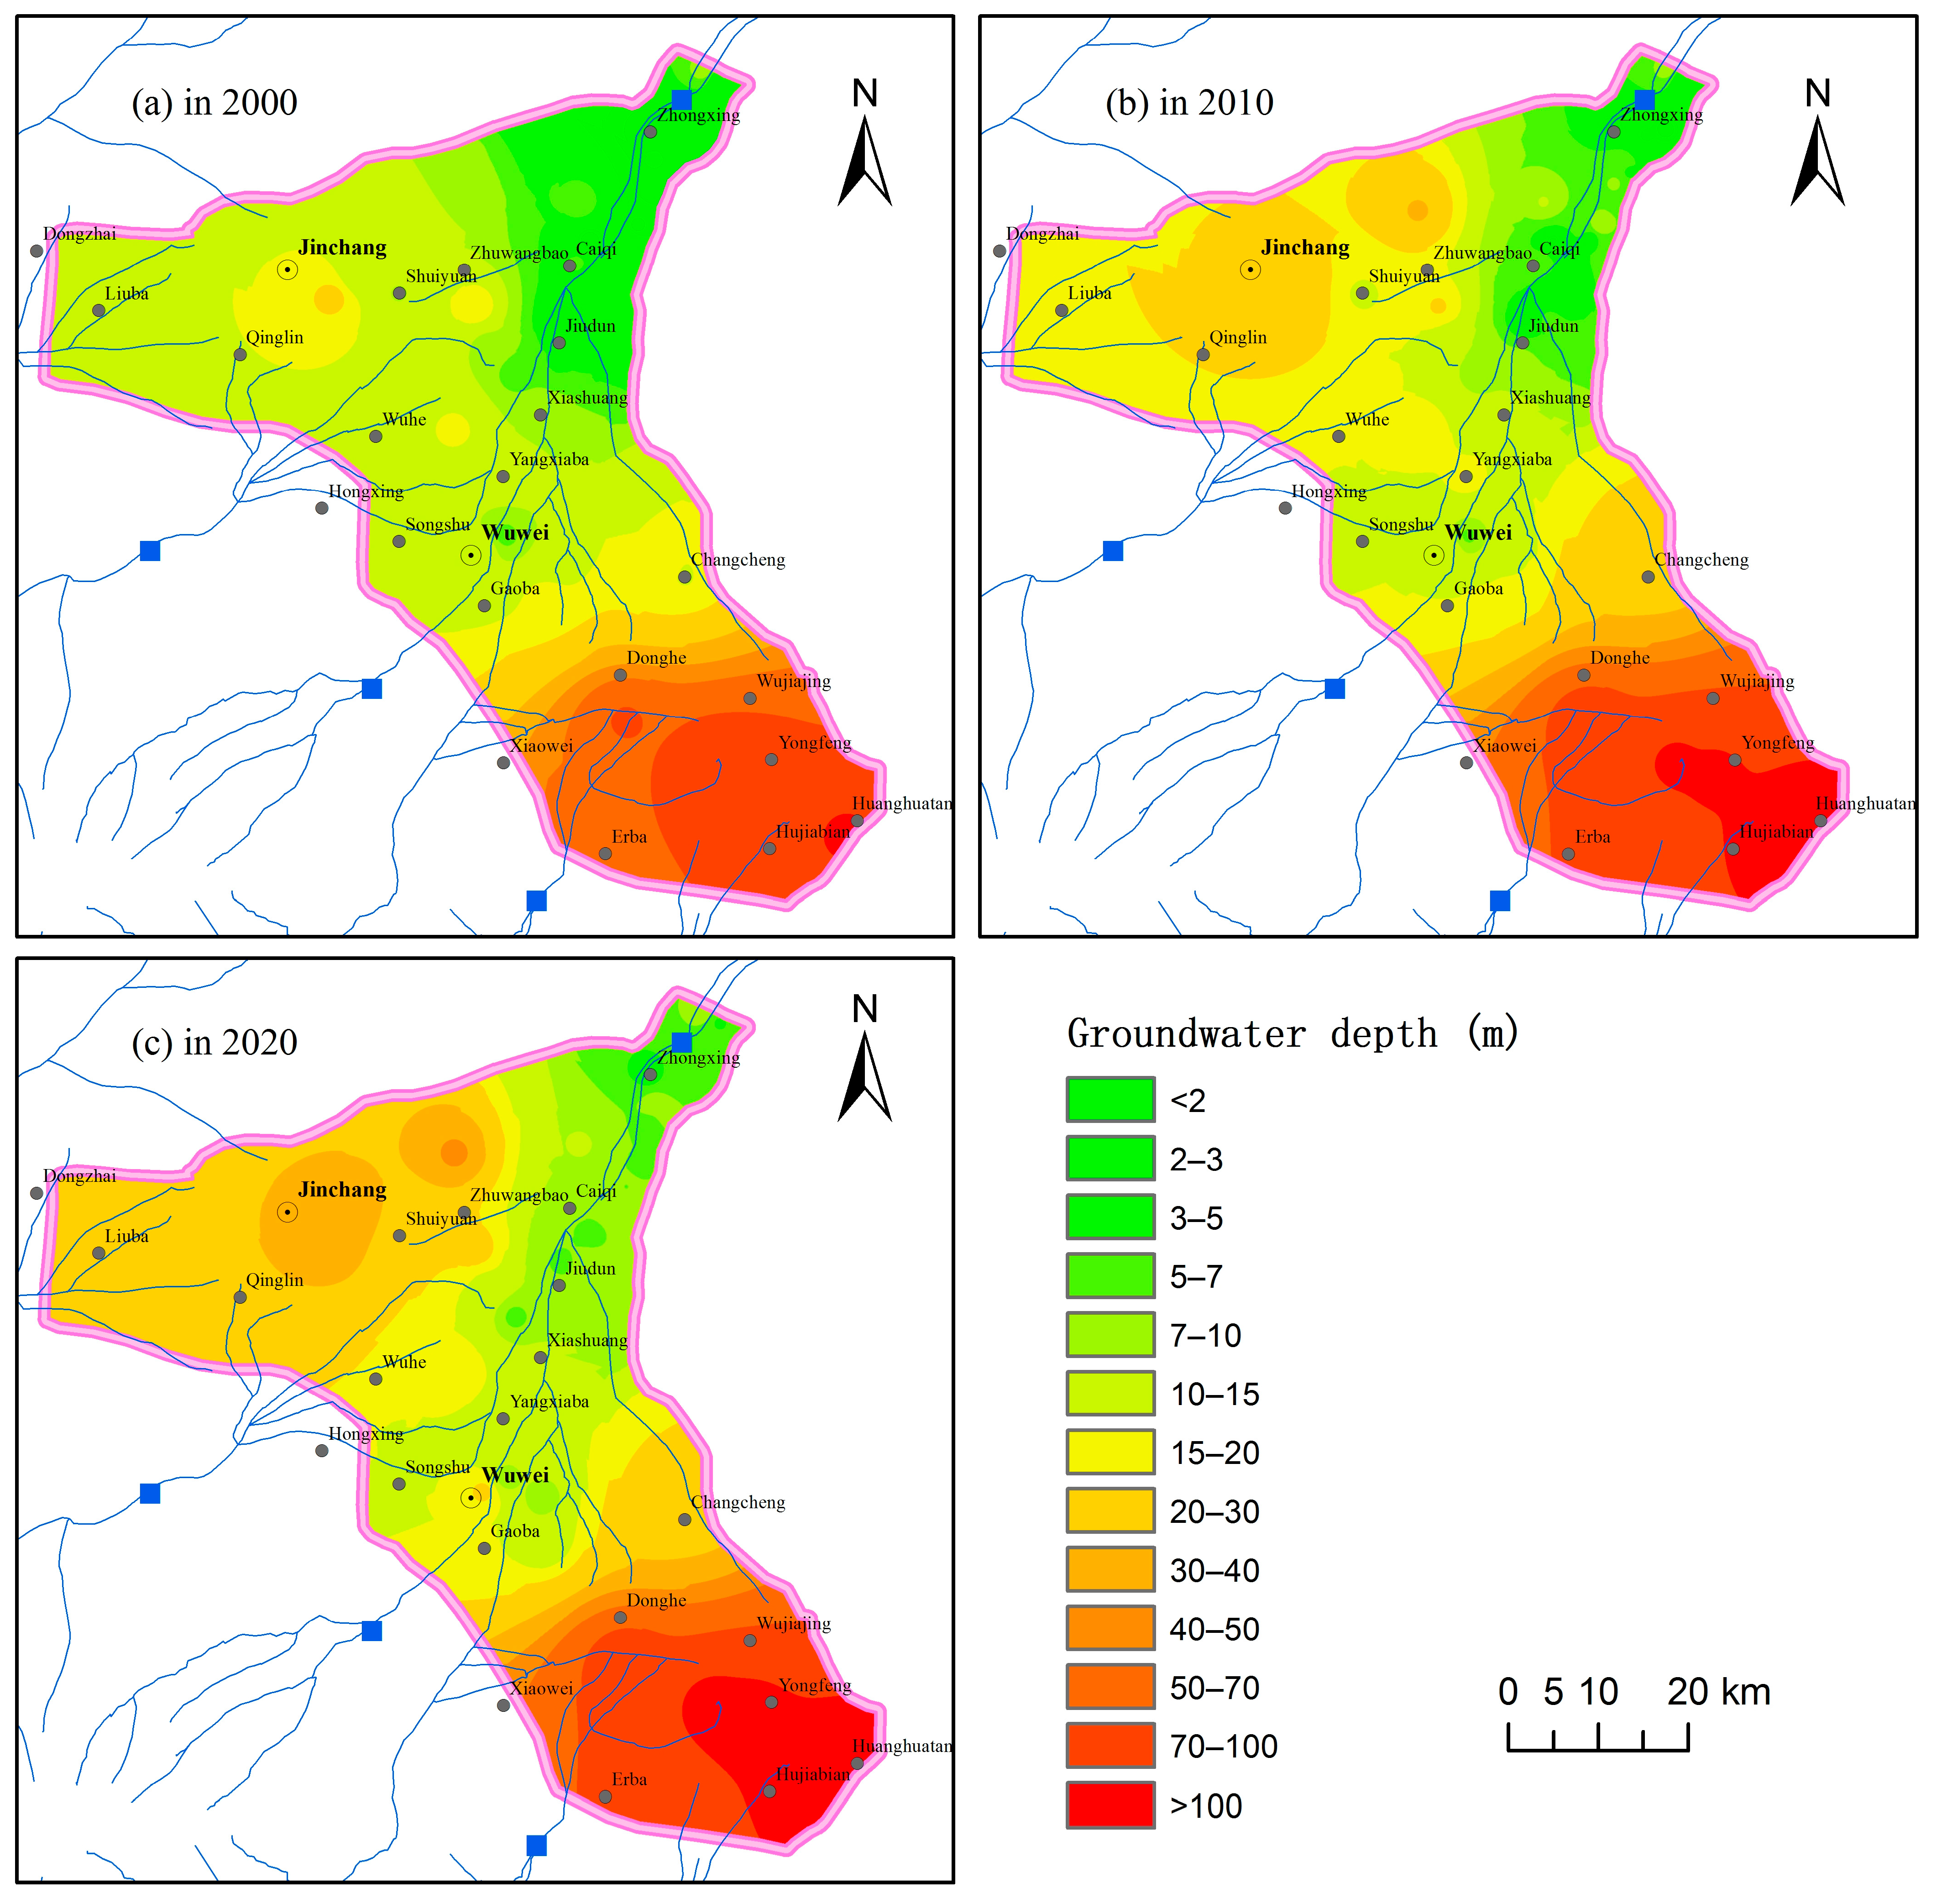
Situated within the transitional zone between the upper and lower reaches of the Shiyang River Basin, the Wuwei Basin displays groundwater depth patterns emblematic of arid inland environments. A prevailing “deep in the south, shallow in the north” gradient characterizes the region: groundwater depths are notably greater in the southern piedmont proluvial fan zone of the Qilian Mountains, where coarse aquifer materials and extended recharge pathways dominate. In contrast, shallower depths are observed in the northern fine-textured plains, including areas such as Jiudun, Caiqi, Zhongxing, and the downstream Minqin Oasis belt (
Figure 6) [
32]. Groundwater depths also exhibit a banded distribution along the river corridor, a pattern consistent with other arid basins such as the Kashgar Delta—where depths range from 10 to 31 m in the upstream north to 0.5–10 m in the downstream center-south—and the Tarim River, which shows shallower depths adjacent to river channels with increasing depth laterally [
33,
34].
- (1)
Changes from 2000 to 2010
Over this decade, groundwater depths increased significantly across the study area, particularly pronounced in the southeast. The 2000 spatial pattern showed “shallow northwest, deep southeast” (
Figure 6a): northwest (Zhongxing, Jinchang, Wuwei) depths ranged mostly between 10 m and 15 m, locally <2 m near Zhongxing; southeast (Yongfeng, Huangghuatan) depths were predominantly 50 m–70 m, forming a regional high-value zone.
By 2010 (
Figure 6b), depths had generally increased by 1–2 intervals basin-wide. The southeastern high-value zone exhibited a “jump-like” deepening: northwest Jinchang and Wuwei depths increased to 15 m–20 m; changes near Zhongxing were minimal (still <2 m); southeast Yongfeng and Huangghuatan depths surged to >100 m, with the high-value zone expanding by ~30% compared to 2000.
Regional differences in depth increase were significant: Smaller increases in the northwest (5 m–10 m, avg. ~0.5 m/yr–1 m/yr), consistent with gradual depletion in plains areas; massive increases in the southeast (>30 m, avg. >5 m/yr). Analysis of typical areas indicates: Jinchang (northern plain) deepened from 10 m to 15 m to 15 m–20 m; Yongfeng (edge of southeastern piedmont proluvial fan) deepened drastically from 50 m to 70 m to >100 m, likely linked to intensive agricultural extraction and upstream reservoir interception drastically reducing piedmont runoff recharge; Zhongxing (near downstream discharge zone) remained stable at <2 m, indicating limited influence of discharge zone recharge during this period.
- (2)
Changes from 2010 to 2020
Depths continued to experience a slow rise in the northwest, while the southeastern high-value zone stabilized in depth but expanded significantly in area. By 2020 (
Figure 6c), northwest Jinchang and Wuwei depths reached 20 m–30 m; Zhongxing depth increased from <2 m to 2 m–3 m; southeast Yongfeng and Huanghuatan depths remained >100 m, but the high-value zone expanded by ~20% compared to 2010, extending northeast towards Donghe and Wujiajing.
Over the past decade, groundwater depth trends in the region have revealed spatially differentiated dynamics. In the northwestern sector, depths have increased gradually, with an average annual rise of approximately 1–2 m. In contrast, the southeastern high-value zone has entered a phase characterized by stable depth yet expanding spatial extent, signaling a critical imbalance wherein groundwater extraction significantly exceeds natural recharge capacity. Specifically, groundwater depth in Jinchang rose from 15 to 20 m to 20–30 m—an average increase of roughly 1 m per year—reflecting sustained extraction pressure across the plains. In Yongfeng, depths remained consistently above 100 m; however, the high-value zone expanded northeastward by approximately 5 km toward southern Donghe, suggesting persistently elevated or intensifying extraction rates. Although Zhongxing exhibited only a modest increase in depth (reaching 2–3 m, with an average annual rise of ~0.2 m), this subtle change indicates early signs of diminished recharge functionality within the groundwater discharge zone.
4.3. Groundwater Level Response to Cultivated Change
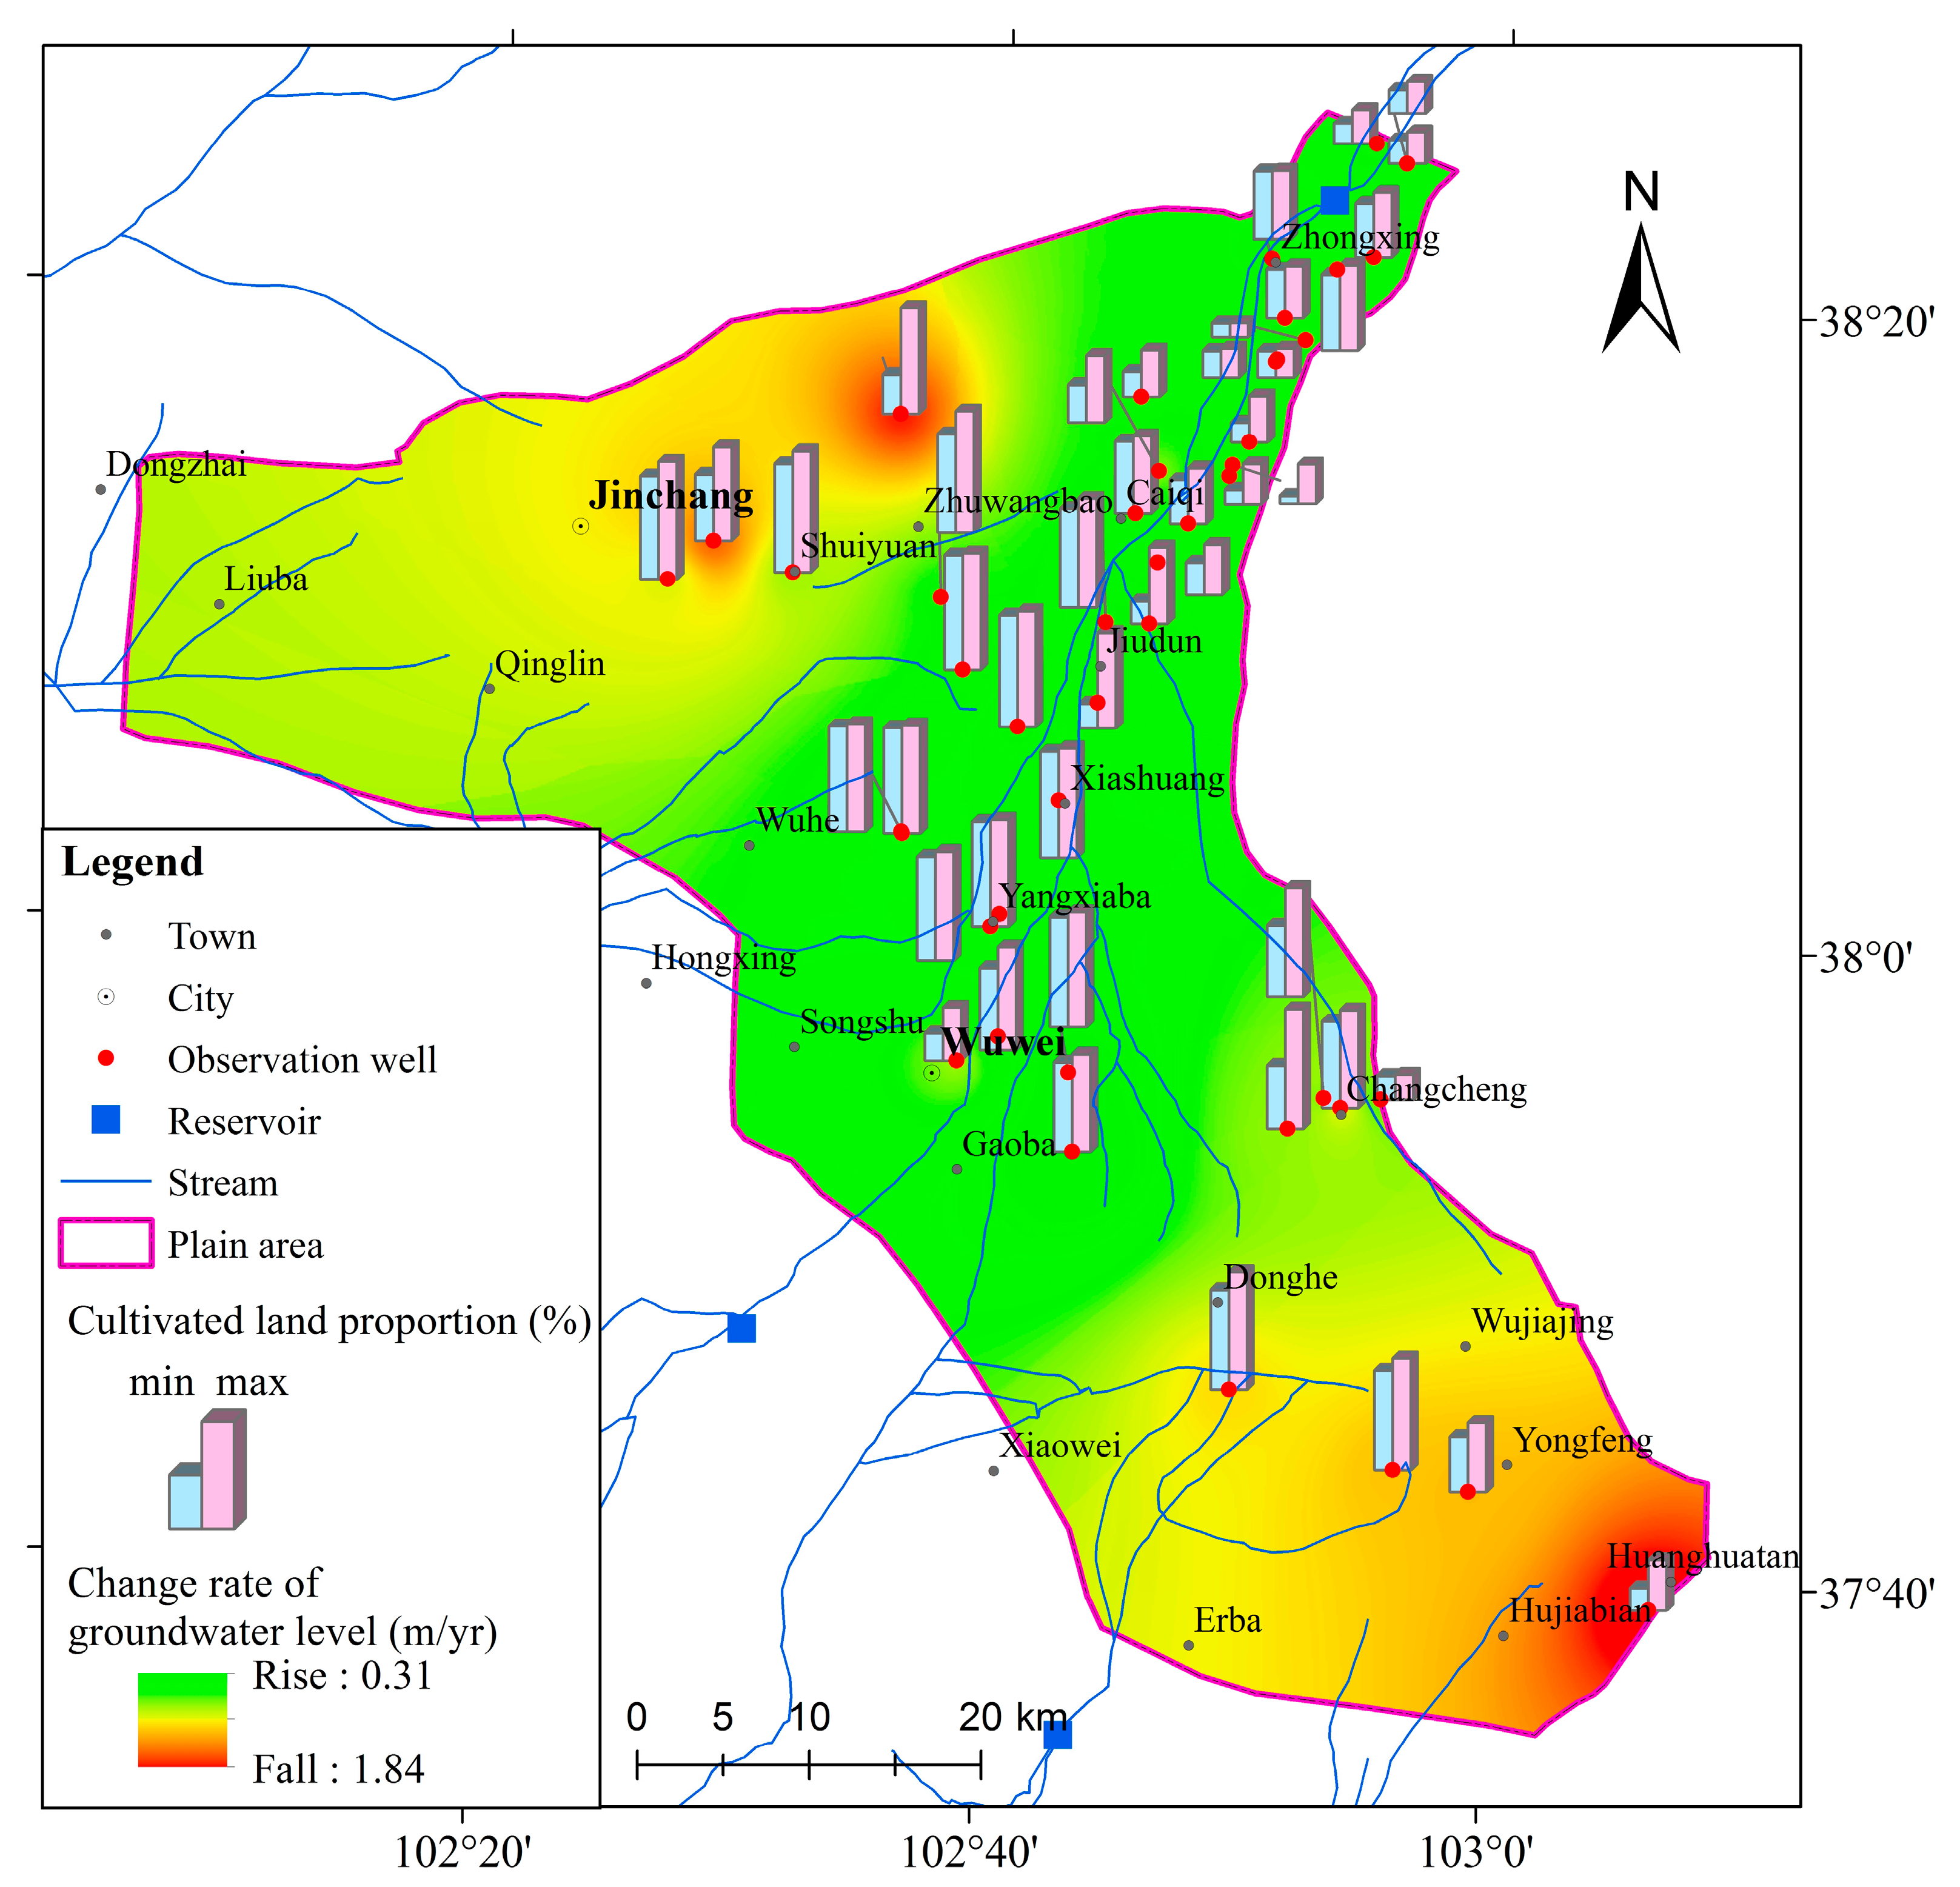
Utilizing spatial statistical analysis centered on 45 observation wells, each encompassed by a 2 km-radius buffer zone, this study quantified the interannual variation in the proportion of cultivated land and its spatial correlation with concurrent groundwater level change rates (m/year) over the period 2000–2020. The resulting spatial distribution maps (
Figure 7 and
Figure 8) reveal a pronounced spatial concordance between the extent of cultivation and the rate of groundwater decline. Both variables exhibit a marked increasing gradient from the southwestern to the northeastern sectors of the study area, underscoring a strong spatial coupling between agricultural expansion and groundwater depletion.
In the piedmont alluvial–pluvial fan zone, which serves as the primary groundwater recharge area, the proportion of cultivated land was consistently high, ranging from 73.8% to 89.6%. Despite this intensive agricultural activity, groundwater levels in the region exhibited minimal decline; in fact, they remained stable or demonstrated a modest rise, with rates between 0.05 and 0.30 m per year. This phenomenon is largely attributable to favorable hydrogeological conditions, characterized by substantial lateral and vertical recharge, as well as a diversified irrigation strategy that integrates diverted surface water with local groundwater sources. The synergy of these factors ensures that groundwater extraction volumes remain well below the regional recharge capacity, thereby sustaining or even enhancing aquifer levels.
Transitioning towards the basin center (transition zone between recharge and discharge), cultivated proportion remained high (60.3–92.0%), but groundwater levels began to decline (rate: 0.02 m/yr–0.71 m/yr). As the core agricultural region, irrigation relies almost entirely on groundwater extraction. Although extraction slightly exceeds local recharge capacity, the relatively high permeability of the aquifer (e.g., coarse-grained material) in the transition zone partially buffers the decline, resulting in a relatively gradual drawdown.
The northern basin region also exhibited extensive cultivated coverage (66.1–92.4%), but groundwater level decline rates intensified significantly (rate: 0.12 m/yr–1.63 m/yr). The southern basin recorded the highest absolute decline rates (0.88 m/yr–1.84 m/yr), despite greater variability in cultivated proportion (37.7–92.1%). Agriculture in both northern and southern regions is highly dependent on groundwater, with greater extraction intensity and longer extraction history. These areas are farther from recharge sources, aquifer materials tend to become progressively finer, leading to reduced permeability, and natural recharge capacity is weakest. High-intensity, exclusively groundwater-dependent irrigation, coupled with extremely limited regenerative water potential (e.g., low precipitation recharge, weak lateral flow), leads to severe, ongoing aquifer depletion and rapid water-level decline. Notably, even areas with relatively low cultivated proportions (e.g., near 37.7%) experienced high decline rates, highlighting the overall fragile water resource carrying capacity of this region.
In stark contrast, the northeastern basin region (adjacent to the natural groundwater discharge zone) showed significantly lower cultivated proportion (11.0–38.9%) and smaller groundwater decline rates (0.06 m/yr–0.27 m/yr). Sustained lateral groundwater flow from upstream converges here and partially discharges via the discharge zone, effectively buffering local extraction effects and maintaining relative dynamic equilibrium.
Throughout the basin, cultivated proportion remained consistently high (>50%) from the piedmont recharge zone (alluvial–pluvial fan) towards the basin interior (transition to discharge zone), with relatively limited spatial variation. Conversely, the groundwater level change rate exhibited strong spatial heterogeneity, characterized by a steep gradient of increasing decline rates along the groundwater flow path. This pattern profoundly reflects systematic shifts in aquifer matrix structure and hydraulic properties: from highly permeable, large-porosity gravels in the piedmont recharge zone (facilitating rapid recharge) transitioning to low-permeability, fine-grained sediments (fine sand, silt) dominating the plains (restricting recharge rates). Accompanying this lithologic transition, hydraulic gradient naturally attenuates, natural recharge flux weakens significantly, and the groundwater system’s buffer capacity against sustained extraction declines sharply. The observed stable water levels near the northeastern basin discharge zone (discharge area) further confirm the classic “recharge-flow-discharge” cycle at the regional scale and underscore the critical control of upstream recharge on maintaining water resource equilibrium downstream. This study clearly demonstrates that in arid/semi-arid inland basins like Wuwei, the spatial differentiation of groundwater dynamics is governed not only by land use intensity (e.g., cultivated proportion) but also more fundamentally by the position within the hydrogeological unit and its inherent recharge–flow–discharge mechanisms [
16].
4.4. Groundwater Level Response to Extraction Intensity
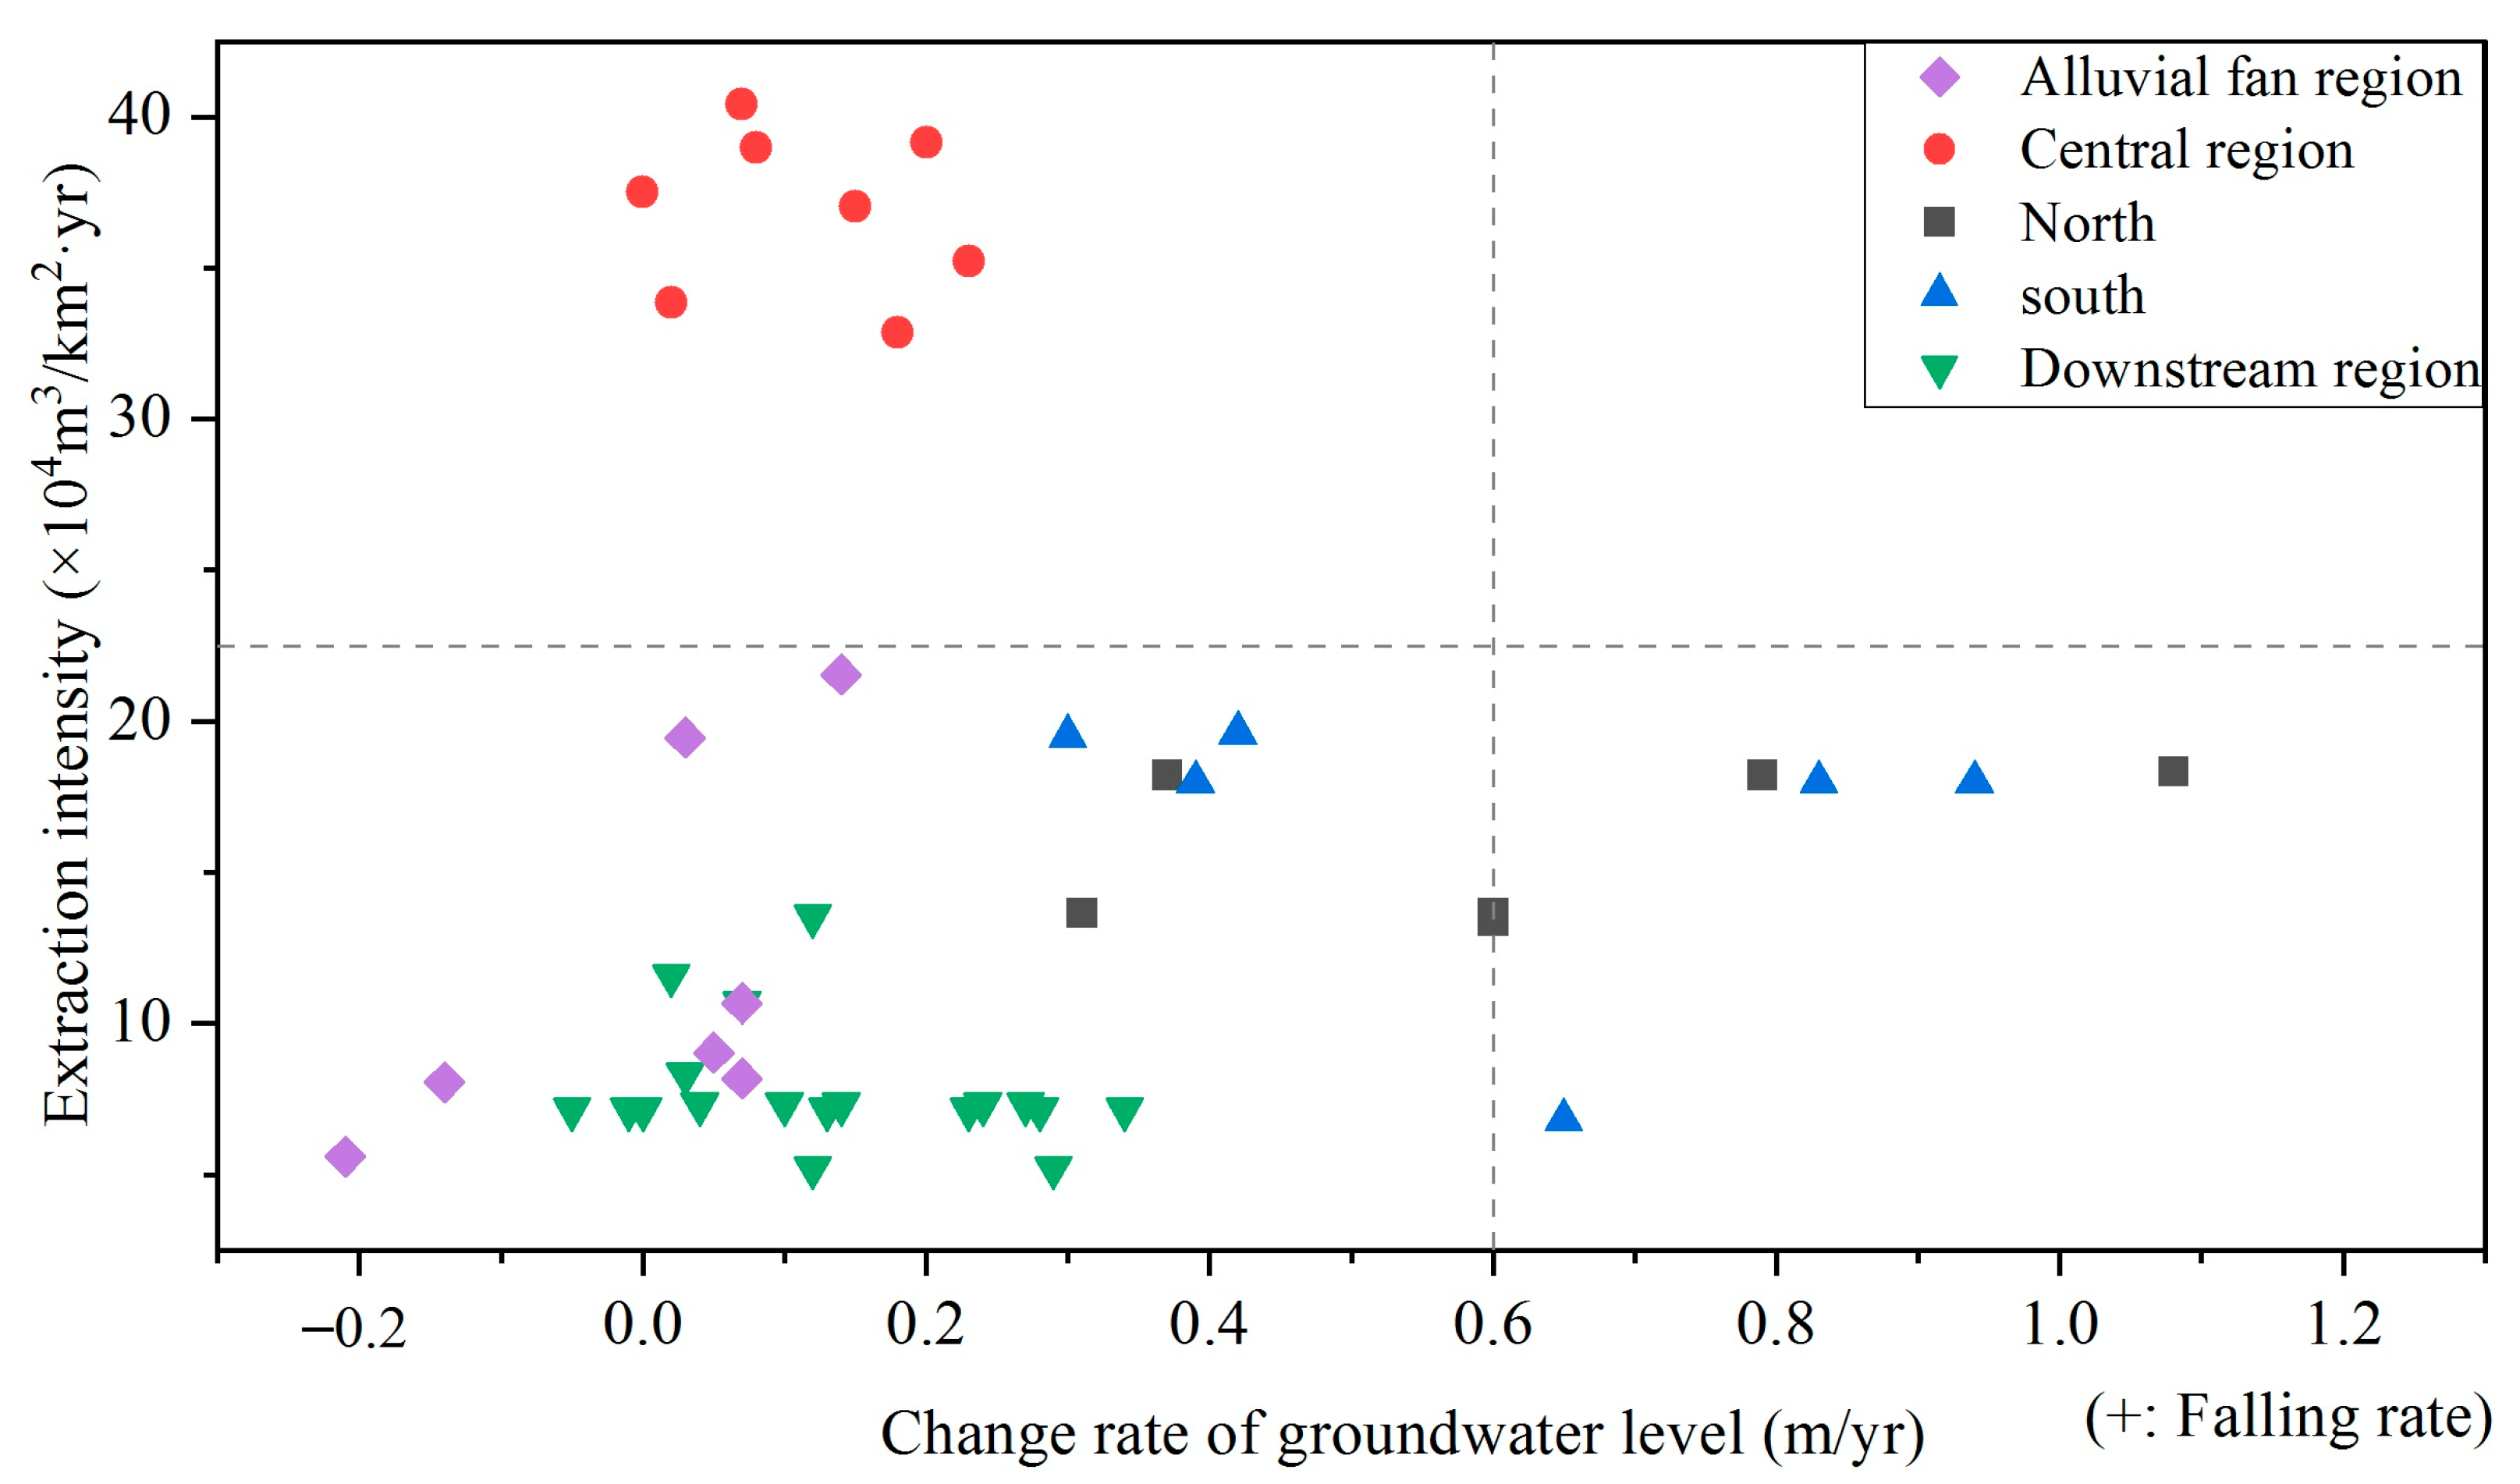
Drawing upon annual groundwater extraction records for irrigation districts spanning 1980 to 2018, alongside contemporaneous groundwater depth measurements, this study computed the multi-year average extraction intensity for each district associated with the observation wells. These calculations were stratified according to periods characterized by either declining or rising groundwater levels. To elucidate the relationship between extraction intensity and groundwater level change rates, scatter plots were generated (
Figure 9). The results reveal pronounced regional heterogeneity in groundwater system responses, underscoring the dominant role of hydrogeological unit characteristics in modulating the relationship between extraction pressure and aquifer dynamics within the Wuwei Basin [
16].
- (1)
Piedmont Alluvial–Pluvial Fan (Recharge Zone): High Recharge Buffers Disturbance, Stable Levels
The core feature of this zone is minimal water-level decline (<0.14 m/yr) despite variable extraction intensities (8.05 × 10⁴ m3/km2·yr–21.54 × 104 m3/km2·yr). Even at moderate intensities (e.g., 19.45 × 10⁴ m3/km2·yr–21.54 × 104 m3/km2·yr), decline rates remained <0.14 m/yr; some wells showed slight rises (e.g., +0.21 m/yr). This is attributed to superior hydrogeological conditions: as the primary recharge zone, it receives abundant piedmont lateral flow and vertical precipitation infiltration. Additionally, partial reliance on diverted surface water for agriculture ensures extraction volumes are substantially smaller than recharge capacity. Consequently, moderate-intensity extraction does not induce significant decline; abundant recharge even allows slight rises in some wells. High recharge capacity is thus the key barrier protecting this zone, maintaining dynamic equilibrium even under moderate extraction.
- (2)
Central Basin (Transition Zone): High Permeability Modulates High Extraction, Gradual Decline
This zone exhibits the most distinctive characteristic: the highest extraction intensities in the basin (32.6 × 10⁴ m3/km2·yr–40.4 × 104 m3/km2·yr), yet only moderate decline rates (0 m/yr–0.23 m/yr), signifying a unique equilibrium state. As the core agricultural area (cultivated proportion 60.3–92.0%), irrigation relies entirely on groundwater. However, its position in the “recharge-discharge” transition zone features an aquifer composed of highly permeable coarse-grained media (e.g., gravel, sandy gravel). Even when extraction slightly exceeds recharge capacity, high permeability accelerates groundwater response and dampens the decline rate. For instance, Well A68 here (extraction 39.14 × 10⁴ m3/km2·yr) had a decline rate of only 0.20 m/yr, significantly lower than responses at similar intensities in the southern zone (>0.5 m/yr). This highlights the critical role of aquifer permeability in regulating the extraction–rate relationship: highly permeable media effectively buffer short-term overdraft impacts, underpinning relative stability in the transition zone.
- (3)
Northern and Southern Basin (Distal Recharge Zones): Attenuated Recharge Coupled with High Extraction, Accelerating Decline
These regions exhibit a synergy of medium–high extraction intensity (13.65 × 10⁴ m3/km2·yr–19.60 × 104 m3/km2·yr) and high decline rates (0.31 m/yr–1.08 m/yr), driven primarily by the compounding effect of attenuated recharge capacity and sustained high extraction.
Hydrogeological Constraints: Greater distance from piedmont recharge sources; aquifer sediments progressively fine (dominated by fine sand, silt), leading to significant recharge attenuation with distance.
Extraction Intensity and Mode: Irrigation relies solely on groundwater (no diverted surface water), especially in the north where cultivated proportion is high (66.1–92.4%); extraction is intense and prolonged. Limited regenerative water potential cannot support long-term extraction, causing continuous depletion of groundwater storage. Consequently, water levels decline at accelerating rates along the flow path (e.g., Well B16 in south: 0.94 m/yr), with decline rate significantly increasing with extraction intensity (R2 = 0.78, p < 0.01).
- (4)
Downstream Basin (Discharge Zone): Upstream Recharge and Low Extraction Synergy, Relative Stability
This zone contrasts sharply with others: the lowest extraction intensities basin-wide (5.21 × 10⁴ m3/km2·yr–13.53 × 104 m3/km2·yr) and minimal decline rates (<0.28 m/yr), clustering in the “low extraction—low decline” quadrant. Some wells showed no decline or even slight rises (e.g., +0.05 m/yr). Key reasons include:
Discharge Zone Hydrogeology: Located at the natural groundwater discharge zone, sustained lateral flow from upstream converges here (>80% of recharge) and discharges via springs/wetlands, effectively buffering local extraction impacts.
Low-Intensity Extraction: Low cultivated proportion (11.0–38.9%) translates to small agricultural water demand and extremely low extraction intensity (only ~1/4 of central basin), minimizing impact on the system. Synergy between upstream lateral recharge and low-intensity extraction thus maintains relative stability in the discharge zone, serving as the pivotal “equilibrium hub” for the basin’s groundwater system.
4.5. Other Influencing Factors on Groundwater Level
Using historical data (1980–2018), Pearson correlation analysis quantitatively assessed the relationship between groundwater depth and precipitation, river discharge, diverted surface water inflow, and extraction volume for representative wells: A71, A75 (located in river discharge recharge zones of Jinta and Zamu Rivers, respectively), and A101, A109, A110 (located downstream of the groundwater discharge zone, where surface runoff converges at the Caiqi section) (
Table 3).
- (1)
Piedmont River Discharge Recharge Zone (A71, A75): Recharge–Extraction Balance
A71 (Jinta River): Depth exhibited a highly significant positive correlation with extraction volume (r = 0.4283, p < 0.001), indicating that extraction is a key driver of level decline. Depth also showed a significant negative correlation with Jinta River discharge (r = −0.2496, p < 0.05), signifying increased river discharge enhances bank infiltration recharge, raising groundwater levels. Notably, Jinta River discharge correlated positively, though weakly, with precipitation (r = 0.38806, p < 0.05), reflecting precipitation’s contribution to runoff.
A75 (Zamu River): No significant correlations were found between depth and the analyzed factors. This is explained by: 78.4–88.7% of irrigation water sourced from diverted surface water since 1980, minimizing groundwater extraction (only 11.3–21.6% of irrigation use); and the highly permeable sandy aquifer facilitating strong recharge from surface water irrigation seepage, counteracting minimal extraction effects.
Human activities have significantly altered the natural water cycle. While precipitation infiltration and surface runoff formation are intrinsically linked (atmospheric precipitation feeds river discharge via surface flow), upstream reservoir regulation (e.g., storing wet-season flow for dry-season release) has weakened this response. Artificially modulated flows diminished the direct effect of precipitation on river discharge, drastically reducing the correlation (r = 0.38806, p < 0.05 for Jinta). This anthropogenic interference further decouples precipitation from the groundwater system. Statistically, groundwater depth showed no significant correlation with precipitation at any observation well.
- (2)
Central Agricultural Basin (A84, A87, etc.): Extraction Dominates Decline
Six wells (A84, A87, A68, A36, A45, A64) in the core agricultural area showed highly significant positive correlations between depth and extraction volume (r between 0.5465 and 0.7388, p < 0.001), higher than the piedmont zone. This confirms high extraction intensity (32.6 × 10⁴ m3/km2·yr–40.4 × 104 m3/km2·yr) as the primary driver of decline. High cultivated proportion (60.3–92.0%), complete reliance on groundwater for irrigation, lower aquifer permeability compared to the piedmont, and limited recharge capacity collectively cause extraction to exceed recharge, driving persistent drawdown.
- (3)
Downstream Discharge Zone (A101, A109, A110): Mechanism for Anomalous Negative Correlation
Three wells downstream of the discharge zone (near Caiqi section) exhibited significant moderate negative correlations between depth and extraction volume (r between −0.8402 and −0.5409, p < 0.001), meaning increased extraction coincided with decreased depth (rising levels)—contradicting conventional groundwater dynamics. This anomaly requires analysis considering specific hydrogeological conditions.
Caiqi section discharge correlated negatively with extraction (r = −0.4936,
p < 0.05), indicating that increased extraction reduces groundwater baseflow contribution to the river. However, as extraction increases and water levels decline, the river stage may reach a higher level than the adjacent groundwater level. This causes the river reach to transition locally from a gaining state (receiving groundwater) to a losing state (recharging the aquifer) [
35,
36]. Consequently, river water infiltrates through the streambed, becoming a significant groundwater recharge source. Impoundment by the Hongyashan Reservoir downstream of the discharge zone elevates river stage, enhancing this induced recharge. Ultimately, this leads to rising groundwater levels (decreasing depth). Increased extraction thus induces river water recharge, creating an anomalous “extraction → elevated river stage → river recharge → rising water level” feedback loop [
37,
38], explaining the negative correlation.
5. Conclusions
This study demonstrates a policy-driven paradigm shift in water–land systems within Wuwei Basin. Post-2010 interventions under the Key Governance Program triggered a transition from “production expansion” to “ecological prioritization,” evidenced by cultivated contraction (net decrease: 230 km
2, 2010–2020 vs. net increase: 70 km
2, 2000–2010), artificial surfaces intensification (expansion rate: +37.54 km
2/yr), and accelerated bare land restoration (rate: +9.28 km
2/yr, +440%). Synergistic policies (30% agricultural water quota reduction, territorial “ecological protection redlines,” eco-compensation) were the primary drivers [
39,
40].
Groundwater dynamics in the region are primarily governed by anthropogenically altered water allocation regimes, while hydrogeological heterogeneity—such as variations in permeability and recharge capacity—plays a critical role in modulating system resilience. In the piedmont zone, attenuation of natural recharge exceeding 80% has led to persistent groundwater declines, despite relatively low extraction volumes. In the northern plains, a transition from spring-fed to well-based irrigation systems has resulted in pronounced overdraft, with cumulative declines exceeding 36.4 m [
41]. Spatially, the discharge zone has remained relatively stable, supported by lateral subsurface flow and irrigation return flows. In contrast, the transitional zone demonstrates heightened vulnerability, attributed to diminishing permeability and reduced recharge potential.
Groundwater depth increased basin-wide (2000–2020), with pronounced spatial heterogeneity: rapid deepening (>30 m) in the southeast (2000–2010), followed by spatial expansion of deep zones; gradual linear increases (0.5 m/yr–2 m/yr) in the northwest; and minor late-stage deepening in the discharge zone [
42]. This reflects critical overdraft in the southeast and systemic supply–demand imbalance [
43].
Hydrogeological zonation (recharge–transition–discharge) outweighed cultivated proportion in controlling drawdown rates. The piedmont maintained stable levels despite high cultivated coverage (73.8–89.6%) due to high permeability and surface water use. The discharge zone exhibited anomalous positive feedback (“gain-loss regime shift”) [
42,
43], where increased extraction induced river seepage, raising water levels [
44]. Human activities decoupled natural hydrologic links: reservoir regulation weakened precipitation–river flow coupling, marginalizing groundwater recharge from rainfall [
41,
43].
These findings transcend simplistic “extraction-depth linear response” models, revealing complex feedback in arid inland basins. They support spatially differentiated management: regulated use in recharge zones (with surface water), strict extraction control in transitional zones, and conservation-focused strategies in distal recharge/discharge zones to sustain long-term equilibrium.

