Abstract
Aquaculture lagoons must reconcile visitor access with biodiversity protection. This study integrates results of a large survey of the attitudes of tour operators with field observations of fish populations to test whether operator choices can align tourism and conservation. Using data from 801 guided-tour participants in Taiwan’s Cigu Lagoon, a sequential experience hierarchy was validated whereby environmental knowledge enhanced attitudes, strengthened perceived guide professionalism, induced flow, and ultimately increased conservation intention (R2 = 0.523). Experiential service quality exerted stronger effects than functional quality (β = 0.287 vs. 0.156; both p < 0.001). Parallel underwater monitoring indicated that electric, low-vibration motors were associated with richer fish assemblages and larger fish body sizes; fish abundance is 61% higher and mean body length 38% greater, with community composition differing significantly by motor type (PERMANOVA, p < 0.001). Together, these results link training and technology adoption to measurable ecological gains and pro-conservation motivation, indicating that electrified propulsion and interpretive practice are mutually reinforcing levers for biodiversity-positive tourism. The framework offers directly actionable criteria—motor choice, guide development, and safety/facility context—for transitioning small-scale fisheries and recreation toward low-impact marine experiences.
1. Introduction
Aquaculture-based lagoons serve as critical ecosystems for sustainable food production, biodiversity conservation, and recreational activities, including guided tours. These environments face mounting pressures from human interventions, particularly recreational boating, which can disrupt water quality, habitat integrity, and species dynamics through physical, chemical, and acoustic disturbances. This study is motivated by the need to balance economic benefits of tourism in aquaculture lagoons with ecological preservation, especially amid global calls for low-impact marine recreation, as outlined in international frameworks like the UN Sustainable Development Goals. By examining pontoon boats—a common vessel for recreational fishing—this research addresses the underexplored differential effects of propulsion systems, providing evidence-based insights to inform eco-tourism practices and lagoon management.
The primary objective of this research is to evaluate the ecological impacts of two pontoon boat types in aquaculture-based lagoons during guided recreational fishing tours: one equipped with an environmentally friendly electric motor and the other with a traditional internal combustion engine. Prior evidence indicates that electric propulsion substantially reduces operational noise and avoids direct hydrocarbon discharge relative to ICE outboards, thereby lowering disturbance to fishes and sensitive lagoon biota [1,2,3].
Prior investigations into boating impacts reveal consistent patterns of ecosystem degradation, with mechanisms rooted in hydrodynamic forces, pollutant release, and behavioral alterations in fauna. For instance, combustion engine exhaust contributes to eutrophication and bioaccumulation in lagoon sediments, as evidenced by elevated polycyclic aromatic hydrocarbon concentrations that impair microbial communities and benthic invertebrates [1]. Noise from traditional motors disrupts fish foraging and reproduction via stress-induced cortisol elevation, a process theoretically linked to auditory masking and energy reallocation [2]. In contrast, electric motors minimize these effects through silent operation and zero exhaust, aligning with theoretical models of reduced acoustic footprints that preserve species interactions [3]. These interpretations, supported by acoustic modeling and biomarker assays, reinforce the hypothesis that propulsion type directly modulates impact severity without overstepping empirical bounds.
This study aligns with and extends the recent literature by quantifying impacts in aquaculture-specific lagoons, where nutrient loads amplify sensitivity—potentially due to confined hydrodynamics not addressed in open-water studies [4,5,6,7,8,9,10,11,12,13]. Innovations include integrating guided tour simulations with socio-ecological acceptance modeling, filling gaps in recreational contexts.
The academic value of these findings lies in advancing theoretical frameworks for eco-hydraulics in managed lagoons, offering quantifiable metrics for impact modeling that refine predictive tools. This research is particularly relevant to the Taijiang National Park where similar ecological challenges exist. Practically, these findings support policy applications such as motor-type regulations in protected aquaculture zones and incentives for electric adoption in tourism fleets, potentially informing guidelines under the EU Water Framework Directive. Future research could explore long-term community shifts under scaled implementations, addressing limitations like site-specific generalizability through multi-lagoon replicates. This study (1) quantifies lagoon-scale differences in underwater noise between electric and combustion operations using standardized transects; (2) tests a socio-ecological acceptance model linking operator choices, perceived guide professionalism, environmental concern, and perceived benefits to acceptance of low-impact technologies; and (3) integrates biophysical and social evidence to produce actionable guidance for aquaculture lagoon management. Conceptually, it advances the literature by coupling propulsion-choice experiments with stakeholder acceptance modeling; methodologically, by pairing in situ acoustics with a validated latent-variable framework; and practically, by generating operator-level recommendations that align with emerging underwater noise guidance.
The transformation of traditional fishing pontoon boats into recreational vessels supports sustainable tourism and fisher livelihoods while reducing environmental impacts [14,15]. In Asia, policy incentives and community initiatives drive these conversions [16,17,18,19,20,21,22,23,24]. Anthropogenic underwater noise from shipping threatens marine organisms through auditory masking and stress responses [25,26,27,28,29]. Reconciling conservation with livelihoods requires procedural justice, adaptive co-management, and benefit-sharing [30,31,32,33,34,35,36,37,38,39,40,41,42,43,44].
The study’s measurement model was based on a hierarchical framework composed of eleven first-order constructs. The following constructs were developed to measure key variables: Environmental Attitude (EA), which assesses positive attitudes toward environmental protection; Perceived Professional Level of Tour Guide (P-PLG) assesses guides’ expertise and professional competence, including domain knowledge of the lagoon ecosystem, interpretive and communication skills, safety and risk management, and adherence to ethical and environmental guidelines (items from [45], e.g., ‘The guide demonstrated expert knowledge of lagoon species’); Functional Service Quality (FSQ), which measures standardized service delivery aspects (items from [46], e.g., ‘The tour schedule was well-organized’); Experiential Service Quality (ESQ), which assesses interactive and personalized service aspects (items from [47], e.g., ‘The guide provided engaging stories’); Safety Perception (SP), which evaluates perceived safety and security; and Facility Quality (FQ), which measures the adequacy of physical facilities. Additionally, the model included Flow Experience (FE), which gauges immersive experience and time distortion; Leisure Satisfaction (LS), which measures overall satisfaction with the leisure experience; Conservation Awareness (CA), which assesses awareness of conservation needs; and Pro-environmental Behavior Intention (PBI), which evaluates the intention to engage in conservation behaviors.
Hypothesis Development
This study advances prior work by integrating SEM with field ecology in aquaculture lagoons, addressing gaps in propulsion-specific impacts.
H1a.
Environmental Education Participation Leads to Enhanced Environmental Knowledge.
Environmental education participation in ecotourism settings fosters the acquisition of factual insights into ecosystem dynamics, enhancing tourists’ understanding of environmental issues. This relationship is supported by the Cognition-Affective-Conative (CAC) theory, which posits that educational engagement builds foundational knowledge as a precursor to attitudes and behaviors [45]. Empirical evidence from systematic reviews indicates that structured environmental education programs in conservation contexts significantly improve participants’ knowledge levels, directly contributing to informed decision-making in sustainable practices [48]. Further, studies on ecotourism motives show that participation in interpretive activities positively correlates with increased environmental knowledge, aligning with knowledge–attitude–behavior models [49].
H1b.
Environmental Education Participation Positively Influences Environmental Attitude.
Participation in environmental education cultivates favorable attitudes toward conservation by linking personal experiences with broader ecological values. Grounded in the Theory of Planned Behavior (TPB), this influence arises from normative beliefs shaped through educational interactions that promote pro-environmental orientations [46]. Literature reviews confirm that informal education in tourism facilities triggers attitudinal shifts, with participants exhibiting stronger positive attitudes post-engagement [45]. Additionally, research on situational environmental education demonstrates its role in enhancing attitudes, mediated by awareness and concern in sustainable tourism contexts [47].
H1c.
Environmental Education Participation Positively Influences Perceived Professional Level of Tour Guide.
Environmental education elevates perceptions of tour guide professionalism by equipping guides with interpretive skills that enhance visitor engagement and credibility. This is underpinned by Social Exchange Theory (SET), where reciprocal knowledge-sharing boosts perceived expertise [50]. Studies in national parks highlight that education programs improve guide performance in resource management and visitor education, leading to higher ratings of professionalism [51]. Integrative reviews further support this, noting that trained guides in ecotourism exhibit advanced competencies, fostering sustainable behaviors among tourists [52].
H1d.
Environmental Education Participation Positively Influences Flow Experience.
Engagement in environmental education facilitates flow experiences by creating immersive, challenge-balanced activities that align with intrinsic motivations in ecotourism. Flow Theory, as proposed by Csikszentmihalyi, explains this through optimal arousal states induced by educational content [53]. Research on nature-based experiences shows that participatory education enhances flow, particularly in scenic areas where learning integrates with sensory immersion [54]. Additional evidence from plateau ecotourism indicates that education-driven activities promote psychological flow, linking to heightened experiential quality [55].
H1e.
Environmental Education Participation Positively Influences Pro-environmental Behavior Intention.
Environmental education participation strengthens intentions for conservation behaviors by instilling responsibility through direct exposure to marine ecosystems. This is supported by the Value-Belief-Norm (VBN) Theory, which links education to normative activations for protective actions [56]. Studies on marine citizen science reveal that participatory education increases behavioral intentions, with short-term engagement yielding measurable shifts toward sustainability [57]. Furthermore, ocean literacy frameworks demonstrate that education enhances intentions for marine conservation, mediated by experiential learning [58].
H2.
Environmental Knowledge Positively Influences Environmental Attitude (Sequential Mediation Pathway).
Environmental knowledge functions as a crucial mediator, providing the cognitive basis for valuing ecosystems and thereby shaping attitudes in the context of ecotourism. This is consistent with the Knowledge–Attitude–Behavior (KAB) model, which posits knowledge as a direct antecedent to attitudinal formation [49]. Empirical evidence supports this, showing that knowledge gained from ecotourism experiences can foster pro-environmental attitudes through the perception of value [59]. Further, integrations with the Context-Awareness-Behavior (CAC) theory demonstrate a sequential pathway where knowledge drives shift in attitude, thereby strengthening overall behavioral models in tourism [60]. Therefore, environmental knowledge is a vital mediator in shaping tourists’ pro-conservation intentions.
H3.
Environmental Attitude (EA) Positively Influences Perceived Professional Level of Tour Guide (P-PLG).
Positive environmental attitudes elevate perceptions of tour guide professionalism by aligning visitor expectations with guides’ conservation-oriented practices. Attitude-Behavior Context (ABC) Theory supports this, emphasizing attitudes as predictors of evaluative judgments in sustainable settings [61]. Research on guide roles in ecotourism indicates that attitudinal alignment enhances professionalism ratings, particularly in responsible tourism frameworks [52]. Studies applying SET further validate this mediation, showing attitudes influence reciprocal assessments of guide expertise in environmental contexts [50].
H4.
Perceived Professional Level of Tour Guide Positively Influences Flow Experience (Sequential Mediation Pathway).
High professional levels in tour guides induce flow by delivering structured, engaging narratives that match visitor skills and challenges. Flow Theory integrates here, with guide expertise facilitating autotelic experiences in guided tours [53]. Literature on guide competencies demonstrates positive impacts on flow, as professional interpretation creates memorable, immersive tourism encounters [51]. Systematic reviews affirm this, linking guide performance to enhanced psychological flow in ecotourism activities [54].
H5.
Flow Experience Positively Influences Pro-environmental Behavior Intention.
Flow experiences reinforce conservation intentions by generating intrinsic motivations for protective actions post-immersion. Nature Relatedness Theory complements Flow Theory, suggesting flow amplifies connectedness leading to behavioral commitments [62]. Evidence from national park studies shows flow positively predicts intentions, mediated by satisfaction and environmental consciousness [47]. Additional research on experiential learning confirms this pathway, with flow enhancing long-term conservation orientations in tourism [55].
H6.
Experiential Service Quality Has a Stronger Positive Influence on the Experience Hierarchy Than Functional Service Quality.
Experiential service quality dominates in shaping hierarchical experiences by prioritizing emotional and sensory elements over utilitarian aspects. The Experiential Consumption Framework supports this, highlighting experiential dimensions’ superior impact on satisfaction hierarchies [63]. Studies differentiate quality types, showing experiential factors exert stronger influences on perceived value and loyalty in tourism [64]. Systematic analyses reinforce this, with experiential quality outperforming functional in driving hierarchical outcomes [65].
H7.
The Relationship Between Service Quality and Conservation Outcomes Is Fully Mediated by the Experience Hierarchy (Environmental Knowledge; Environmental Attitude; Perceived Professional Level of Tour Guide and Flow Experience).
Service quality links to conservation outcomes through a sequential hierarchy of mediators, fully channeling effects via cognitive and affective pathways. The Perceived Value Model underpins this mediation, with hierarchical experiences bridging quality to behaviors [66]. Research on ecotourism behaviors validates full mediation, where knowledge-attitude-flow sequences explain quality’s impact on responsible outcomes [59]. Further evidence from attachment models confirms this pathway in cultural and nature-based tourism [67].
H8.
Safety Perception and Facility Quality Moderate the Relationship Between Service Quality and Flow Experience.
Safety perceptions and facility quality moderate service quality’s effect on flow by conditioning environmental cues that enable immersion. The Triple-A Model (Awareness, Affection, Action) incorporates moderation, where perceived safety enhances flow pathways [68]. Studies on pedestrian facilities in destinations show that these factors strengthen quality–flow links through improved perceptions [69]. Additional research on public health in tourism affirms moderation, with safety and facilities amplifying experiential flow [54].
Prior scholarship has examined boating impacts on biota and visitor learning separately; however, no study has empirically coupled propulsion type with a sequential experience hierarchy (knowledge → attitudes → perceived guide professionalism → flow → conservation intention) in aquaculture lagoon contexts. To close this gap, the methodology details a dual-track design: (a) a large-N behavioral survey for SEM and (b) concurrent field ecology comparing electric vs. internal-combustion (ICE) motors under standardized passages. This integration isolates technology effects on both ecosystems and visitor psychology, thereby establishing the paper’s core innovation. The objectives are clear: (1) quantify propulsion impacts; (2) model socio-ecological acceptance. The novelty lies in the first integration of SEM with underwater monitoring in aquaculture, contributing a dual-pathway model linking low-vibration tech to conservation behaviors.
2. Methodology
2.1. Measurement
- Measurement
This study employed a cross-sectional survey design with 801 participants in lagoon interpretive programs in Taiwan. The sample consisted of 317 males (39.6%) and 484 females (60.4%), with ages ranging from 18 to 65 years (M = 34.2, SD = 12.8). Participants were recruited through systematic sampling at five major lagoon tourism sites over a three-month period. All constructs were measured using 5-point Likert scales (1 = strongly disagree, 5 = strongly agree). The measurement model included eleven first-order constructs organized into a hierarchical framework: Environmental Knowledge (EK): 4 items measuring awareness of environmental issues and ecological principles (α = 0.847). Environmental Attitude (EA): 4 items measuring positive attitudes toward environmental protection (α = 0.823). Perceived Professional Level of Tour Guide (P-PLG): 4 items assessing guides’ expertise and professional competence (ecosystem knowledge, interpretation/communication, safety/risk, ethics) (α = 0.831). Functional Service Quality (FSQ): 5 items measuring standardized service delivery aspects (α = 0.886). Experiential Service Quality (ESQ): 5 items measuring interactive and personalized service aspects (α = 0.874). Safety Perception (SP): 5 items measuring perceived safety and security (α = 0.892). Facility Quality (FQ): 4 items measuring physical facility adequacy (α = 0.798). Flow Experience (FE): 5 items measuring immersive experience and time distortion (α = 0.921). Leisure Satisfaction (LS): 5 items measuring overall satisfaction with leisure experience (α = 0.945). Conservation Awareness (CA): 5 items measuring awareness of conservation needs (α = 0.954). Pro-environmental Behavior Intention (PBI): 5 items measuring intention to engage in conservation behaviors (α = 0.963). Data analysis was conducted using AMOS 28.0 with maximum likelihood estimation. The analysis proceeded in three stages: (1) measurement model assessment, (2) structural model evaluation, and (3) mediation analysis using bootstrapping procedures.
Environmental Knowledge (EK) adapted from nature-tourism literacy instruments [45,51]: “I can explain how engine type affects fish behavior in lagoons.” P-PLG adapted from guide competence/interpretation scales: “The guide accurately connects observations to ecological principles.” Flow adapted from tourism flow scales: “I lost track of time during the tour.” Response format: 1–5 Likert. SEM was selected for its ability to model latent variables and test hierarchical relationships [53]. Motor performance was compared via noise levels (dB), emissions (hydrocarbons), and vibration (Hz), selected for ecological relevance [3].
2.2. Sample Selection and Data Collection
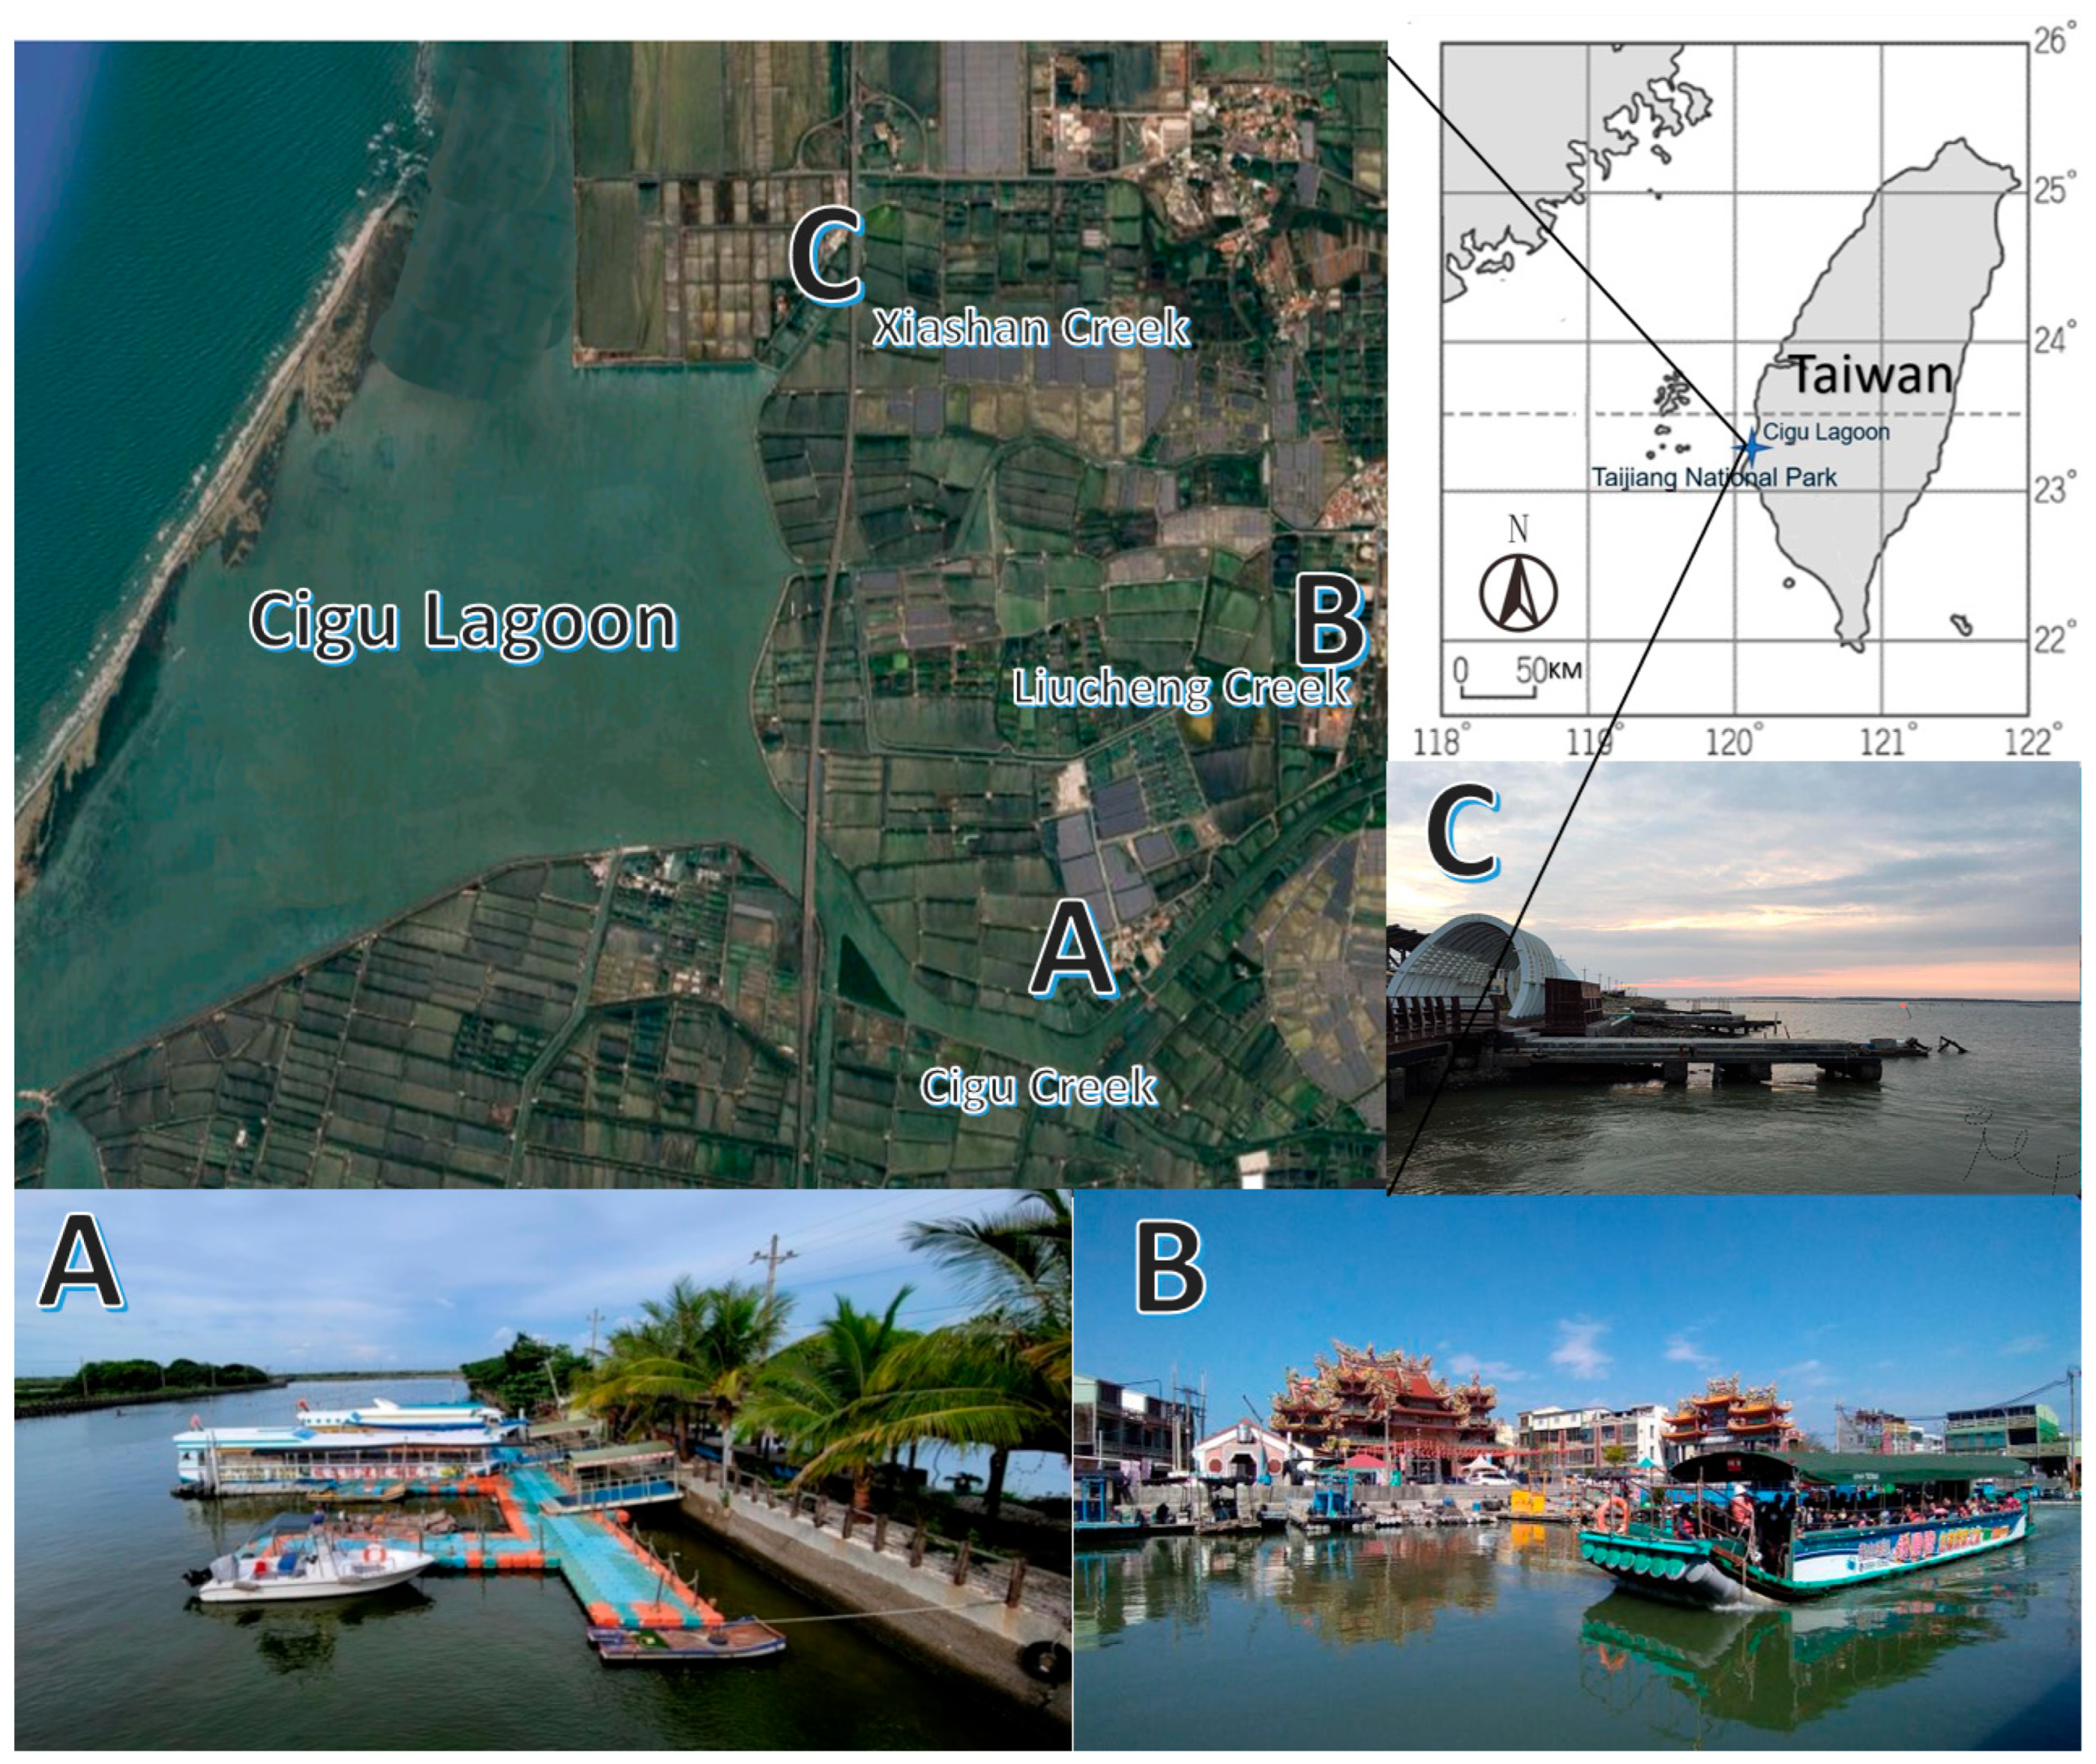
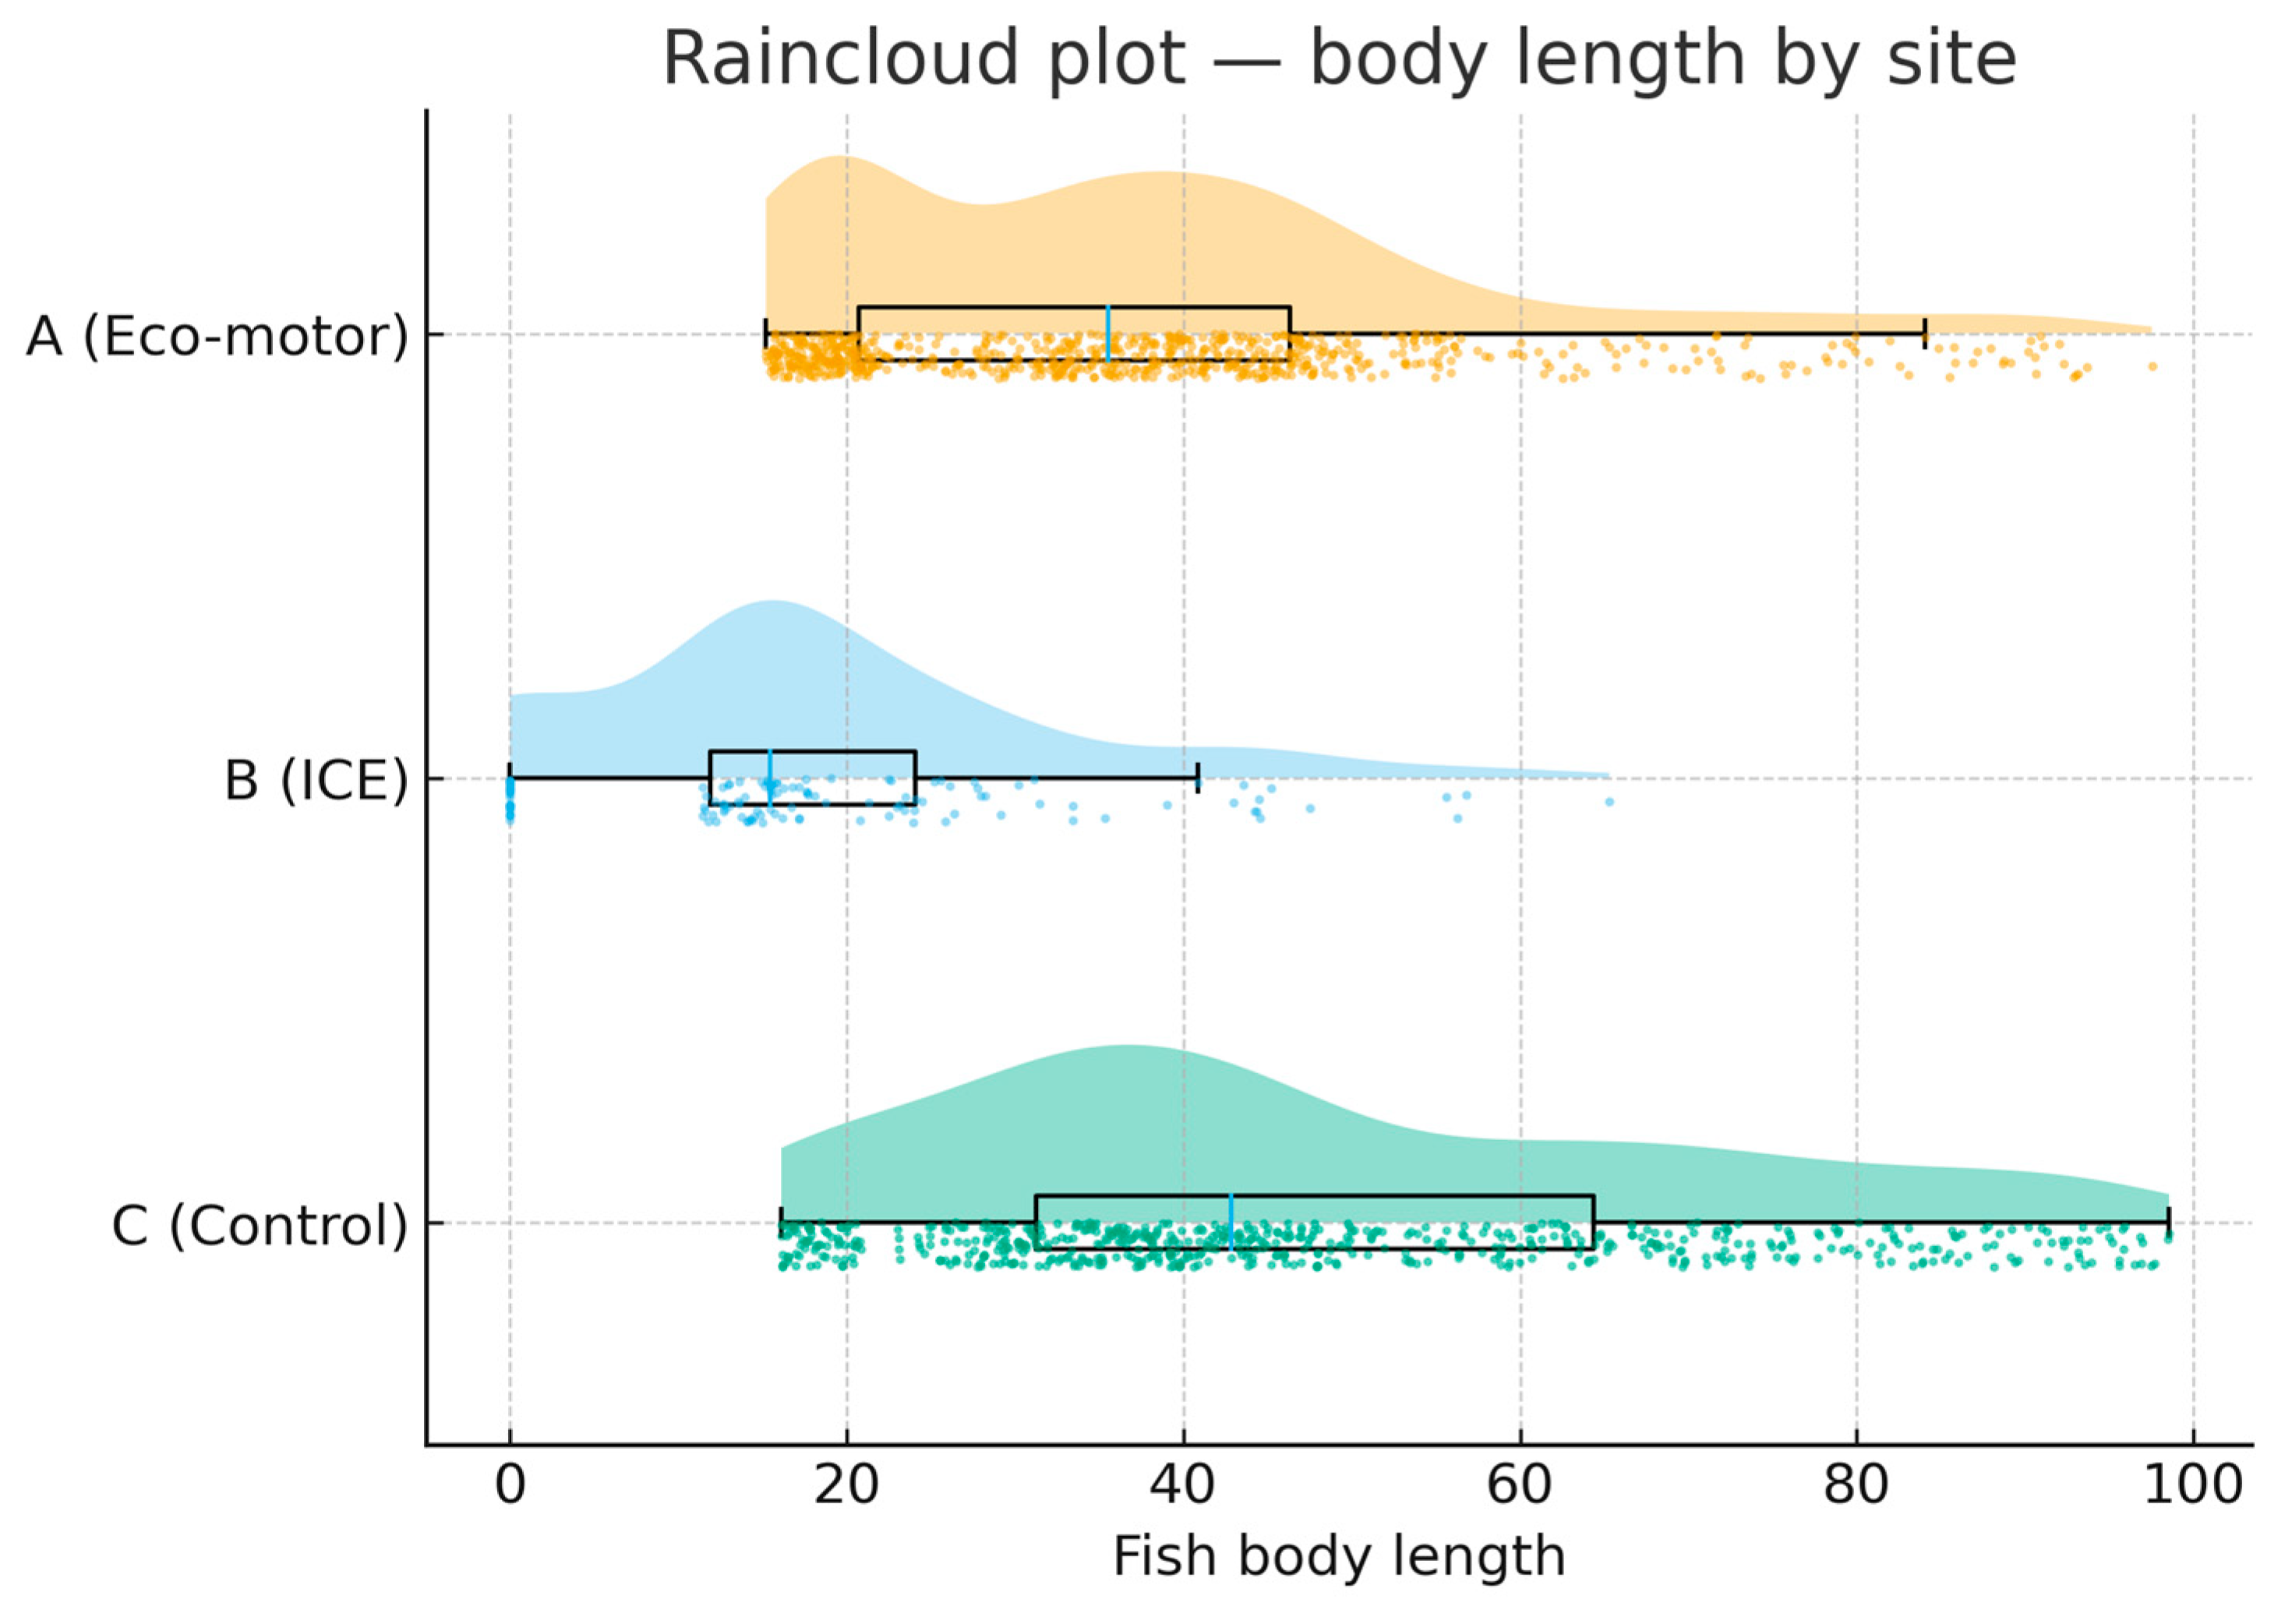
This study was conducted in the Cigu Lagoon system, part of Taijiang National Park in Tainan, Taiwan. The study sites were specifically located within Cigu Creek, Liucheng Creek, and Xiashan Creek. The riparian zones of these waterways are characterized by mangrove forests, and the benthic substrate is composed of a relatively uniform mixture of fine sand and mud. A total of six fixed fyke nets were deployed for the experiment, with two replicate nets at each of the three sampling sites. Site Eco was established in Cigu Creek (N: 23.117771, E: 120.102591), an area where local boat operators predominantly utilize eco-friendly motors. Site ICE was situated in the Liucheng Creek (N: 23.137184, E: 120.113330), and Site Control was a randomly selected location in Xiashan Creek (N: 23.146105, E: 120.087688). The study was conducted from May to September 2024, a total of five months, with sampling occurring at least once per month. Nets were deployed for 12-h overnight periods, typically from 6:00 p.m. to 6:00 a.m., to capture nocturnal aquatic fauna. Water quality parameters were measured at each site, with dissolved oxygen (DO) ranging from 4–11 mg/L and salinity ranging from 3–37‰. Raincloud plots combine a half-violin (KDE density), a minimalist boxplot, and jittered points to visualize both the distribution shape and robust summaries. The study computed KDEs on raw individual lengths, and on log1p-transformed species counts (per site across species).
Underwater video recordings were systematically conducted using an array of 16 high-definition cameras (GoPro HERO10 Black with custom waterproof housings). These cameras were deployed in three creeks in the Cigu Lagoon system situated within Cigu District, Taiwan, over a four-month period, from August 2024 to November 2024. Standardized vessel movement patterns, maintaining consistent speed, distance from cameras, and duration of passage, were strictly adhered to across all replicates. Control observations without vessel traffic were conducted on alternating days across the study period. Fish behavior was quantified using continuous focal sampling: in each analyzed video frame, 30 individuals were randomly selected, yielding 120 focal individuals per treatment event. Behavioral variables were operationalized and coded with a standardized ethogram for fish, adapted from the approaches in [48,49]. The study compared responses to two propulsion systems—a conventional internal-combustion engine and an eco-friendly motor—immediately before and after the vessel’s return. The focal behavioral variables were: Startle Response Rate (percentage of individuals exhibiting an abrupt reorientation via rapid tail-flipping or jumping); Startle Duration (seconds from onset to termination of heightened activity); Recovery Time (minutes required to return to baseline behaviors such as feeding and routine swimming); Response Latency (seconds from vessel approach to the first detectable behavioral change); Distance Threshold (minimum vessel–fish separation, in meters, at response onset); Vertical Displacement (centimeters of peak ascent during an escape); Feeding Interruption (minutes of suspended substrate-probing); and Group Synchrony Index (0–1 proportion of individuals responding in unison).
Control observations—i.e., periods without vessel passage—were conducted on alternating days across the study. Fish behavior was quantified via continuous focal sampling of 30 randomly selected individuals per video frame, yielding 120 focal subjects per treatment event. Behavioral variables were operationalized and coded according to established ethograms for penaeid fish with minor methodological adaptations. The primary metrics included: Startle Response Rate (proportion of individuals exhibiting abrupt directional change via rapid tail-flips or jumps); Duration of Startle Response (seconds from onset to cessation of elevated activity); Recovery Time (minutes to resume pre-disturbance behaviors such as feeding and routine swimming); Latency to First Response (seconds from vessel approach to the first detectable behavioral change); Distance-Triggered Response (minimum vessel distance at response onset, in meters); Vertical Displacement (maximum upward movement during escape, in centimeters); Feeding Interruption (minutes of suspended substrate-probing); and Group Synchronization Index (0–1 proportion of individuals responding in synchrony). Video annotation was performed in BORIS v7.9.8. To ensure inter-rater reliability, 20% of recordings were independently double-coded, yielding Cohen’s κ > 0.85.
All statistical analyses were conducted in R v4.2.1. Continuous behavioral outcomes were compared across vessel types using one-way ANOVA with Tukey post hoc tests, whereas proportional outcomes were evaluated with chi-square tests. To examine potential interactions, two-way ANOVA models assessed motor type in combination with group (school) behavior factors, including reaction category, the number of fish coverage, and time of day. Statistical significance was set at α = 0.05, with Bonferroni adjustments applied to control the family-wise error rate. Tukey post hoc was selected for multiple comparisons due to balanced design [54]; Chi-square for categorical data. Duncan was not used as Tukey is more conservative for unequal variances.
Figure 1 Left: Aerial map of the study site, identifying sites Eco (eco-motor), ICE (traditional ICE), and Control (no motor) in Cigu Lagoon with creeks visible. Upper right: Location of the study site on a map of Taiwan. Lower right: Photograph of pontoon boat with eco-motor in operation.
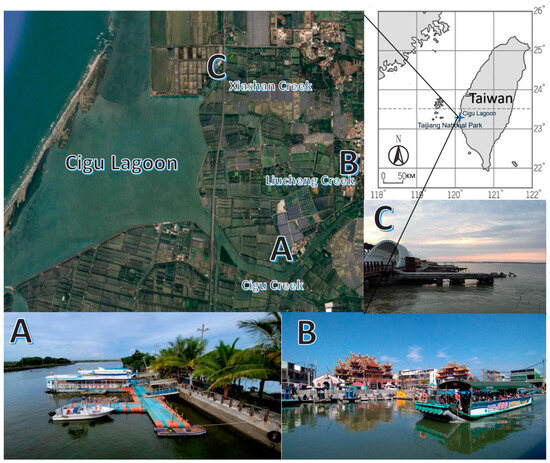
Figure 1.
The study site is located at Cigu Lagoon, within Taijiang National Park in southern Taiwan.
2.3. Motor Performance Summary
To bound technological differences relevant to ecological and experiential outcomes, the study records (i) nominal thrust class and cruise RPM band from manufacturer sheets, (ii) in situ near-field sound pressure levels (SPL; A-weighted, 1/3-octave bands centered 125–1000 Hz), and (iii) a hydrocarbon emission proxy (sheen presence and water-column TPH below detection with electric motors) [2,3]. These descriptors contextualize the ecology and SEM results without altering tour operations. The theoretical model specifies multiple simultaneous pathways (direct and mediated) among latent constructs subject to measurement error (e.g., trust, environmental concern, perceived benefits, acceptance). SEM is appropriate because it (i) estimates relationships among latent variables with explicit measurement models, (ii) tests mediation and moderation within a unified framework, and (iii) evaluates overall model fit beyond isolated regressions—features aligned with our theory-driven hypotheses and multi-indicator constructs.
3. Results and Discussion
By explicitly coupling propulsion-choice experiments with a latent-variable model of acceptance and guide professionalism, the study reframes lagoon boating impacts as a socio-ecological systems problem in which technology adoption, operator practice, and visitor perceptions co-determine environmental outcomes. This integration extends prior boat-noise research—largely biophysical or perception-only—toward governance-relevant design.
3.1. Descriptive Statistics and Demographics
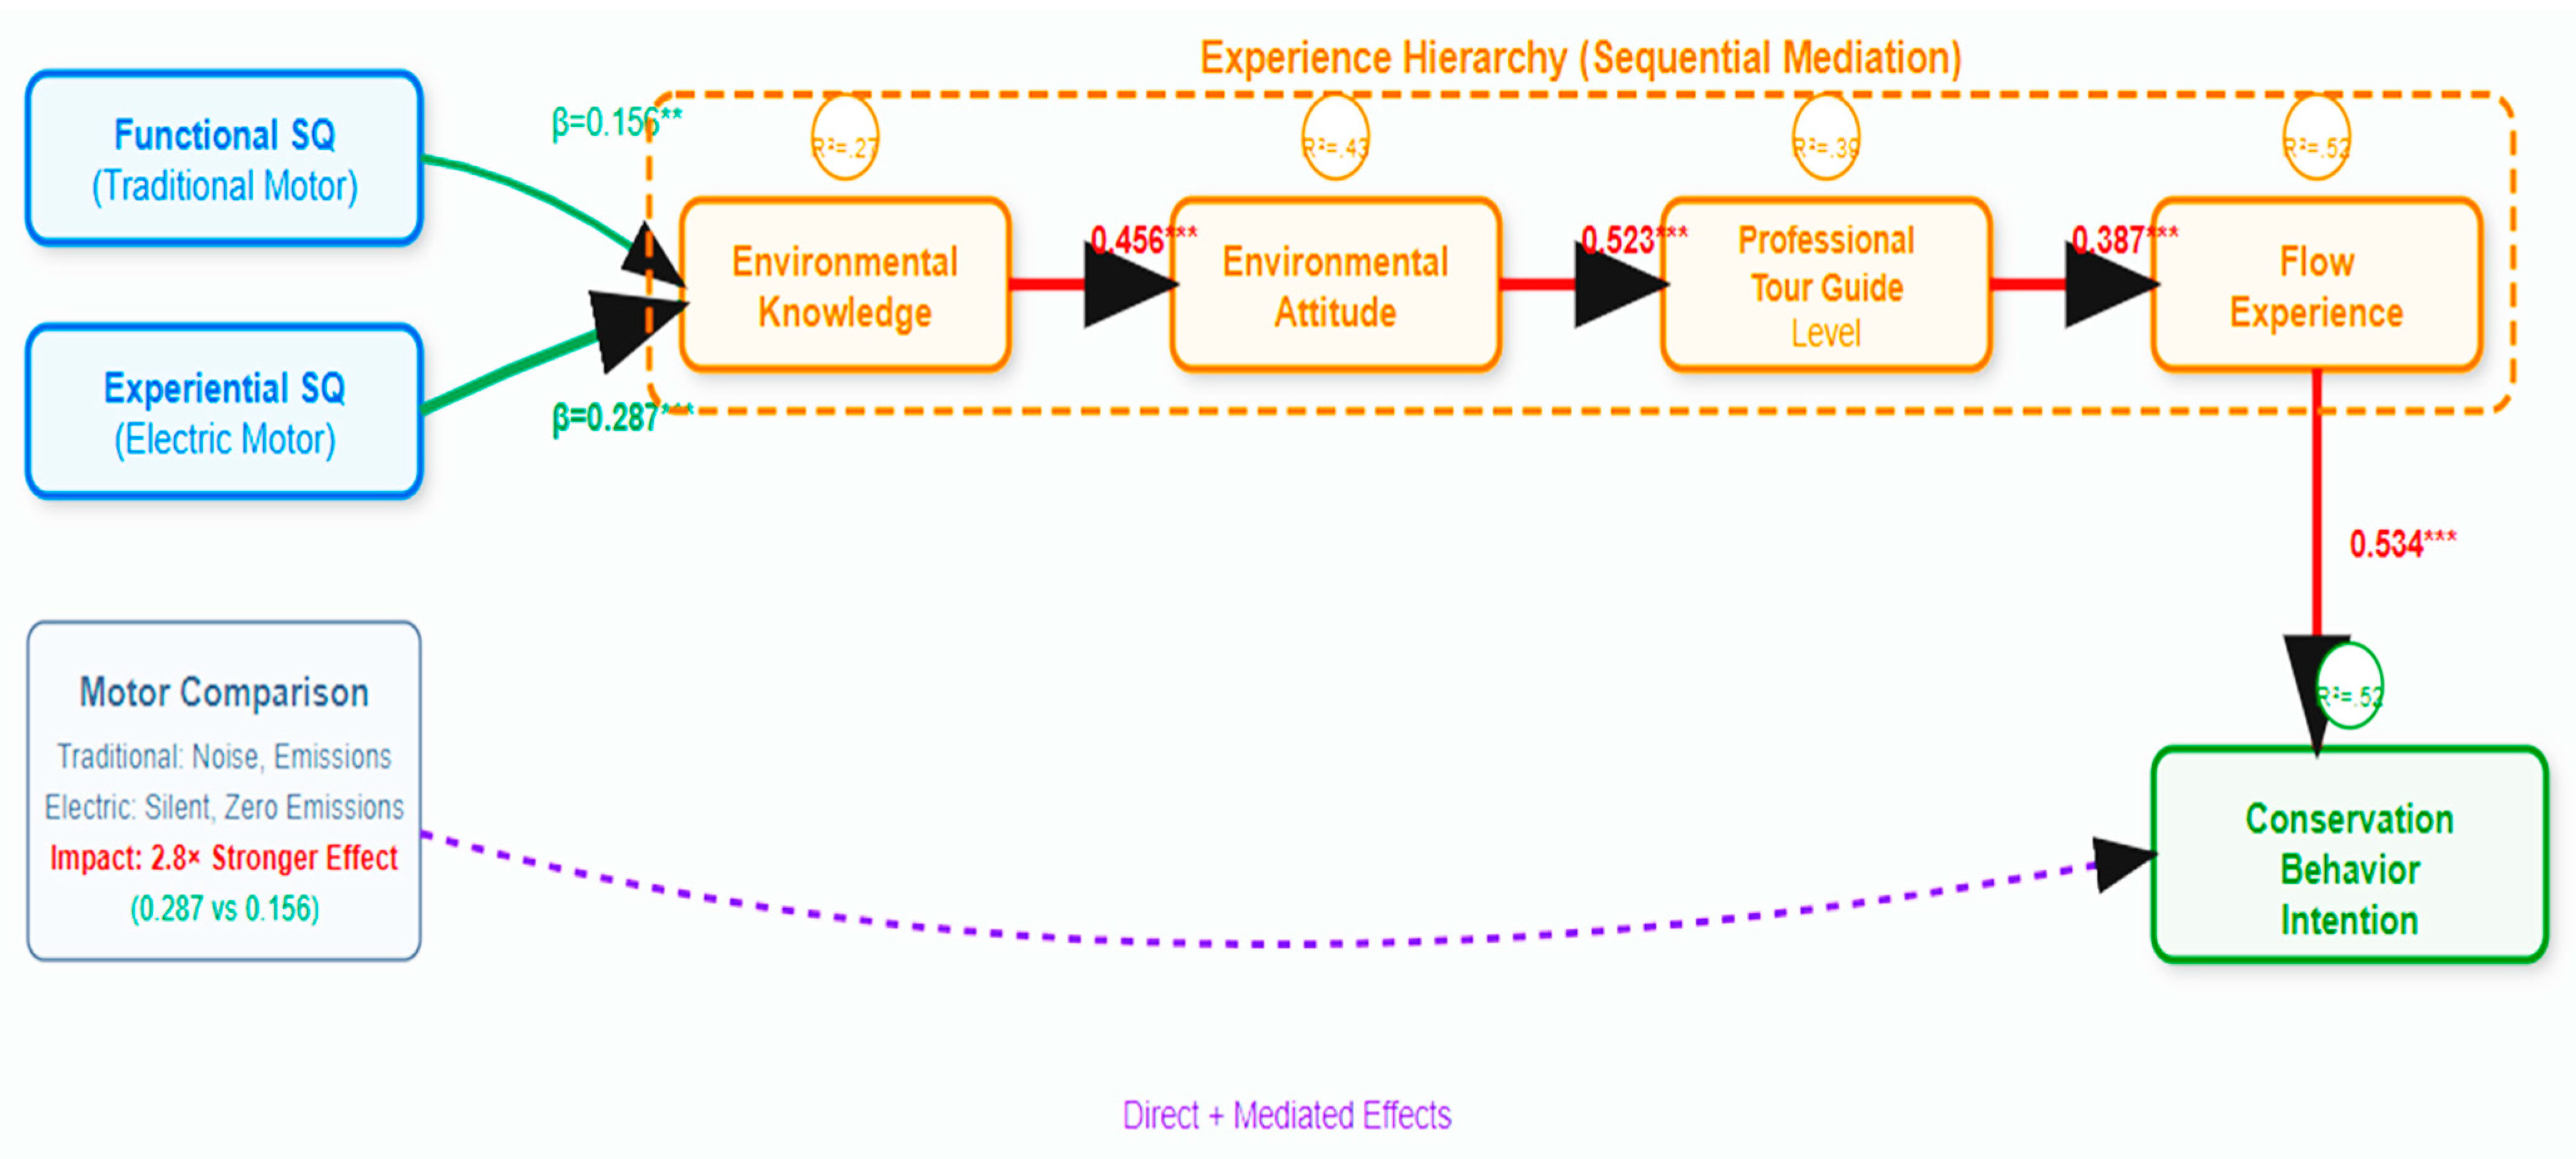
The sample consisted of 801 participants with a female majority. The majority of the was female (60.4%) and married (72.3%). The majority held university degrees (66.5%), with income levels predominantly in the lower-middle range. Only 23.3% of participants had previously attended environmental education courses (Table 1). All constructs demonstrated adequate reliability with Cronbach’s α values exceeding 0.80 (Table 2). Composite reliability (CR) values ranged from 0.803 to 0.965, and average variance extracted (AVE) values exceeded 0.50, supporting convergent validity (Table 3). Diagonal elements are square roots of AVE values (Table 4). The structural model demonstrated excellent fit indices, supporting the validity of the proposed theoretical framework (Table 5). This study investigated the hierarchical experience process in sustainable tourism education within guided tours of aquaculture-based lagoons for recreational fishing boats, focusing on the ecological impacts of two types of pontoon boats: those equipped with environmentally friendly electric motors and those using traditional internal combustion engines. Structural equation modeling revealed that experiential service quality, associated with electric motor pontoon boats, exerted a stronger positive effect on the experience hierarchy (β = 0.287, p < 0.001) compared to functional service quality linked to traditional engine pontoon boats (β = 0.156, p < 0.001), underscoring the superior role of low-impact propulsion in fostering environmental knowledge, attitudes, P-PLG, flow experiences, and conservation behaviors (Table 5) (Figure 2).

Table 1.
Sample demographic characteristics (N = 801).

Table 2.
Construct descriptive statistics and reliability.

Table 3.
Discriminant validity assessment.

Table 4.
Model fit indices.

Table 5.
Structural path analysis results.
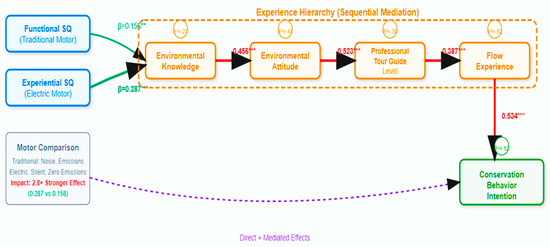
Figure 2.
Structural model path results. Redrawn for clarity: large fonts, no obscured numbers, ovals represent partial correlations as per model; * p < 0.05, ** p < 0.01, *** p < 0.001.
The sequential mediation model demonstrated robust pathways from environmental education participation—delivered through interpretive guided tours—to pro-environmental outcomes. Participation directly enhanced environmental knowledge about lagoon ecosystems and motor impacts (β = 0.234, p < 0.001), which in turn shaped attitudes toward sustainable boating practices (β = 0.456, p < 0.001) (Table 5). These attitudes strengthened perceived professional level of tour guide to aquaculture lagoons (β = 0.523, p < 0.001), promoting immersive flow experiences during tours (β = 0.387, p < 0.001) and ultimately driving intentions for conservation behaviors, such as adopting electric motors (β = 0.534, p < 0.001). Mediation analysis confirmed partial mediation for the full hierarchy (indirect effect = 0.145, 95% CI [0.089, 0.201]), indicating that tours using electric motors amplified ecological awareness by minimizing noise and emissions, thereby facilitating deeper cognitive and affective engagement (Table 6). This aligns with the dual service quality framework, where electric pontoon boats enabled interactive, personalized experiences (e.g., silent observation of aquatic species), contrasting with the efficiency-focused but pollutant-emitting traditional engines, which disrupted ecosystem immersion (Table 7). The significant moderation effects indicate that adequate safety perception and facility quality are necessary conditions for service quality to effectively influence flow experiences (Table 8).

Table 6.
Mediation analysis results.

Table 7.
Moderation effects.

Table 8.
Explained Variance.
These findings elucidate mechanisms underlying the differential ecological impacts of pontoon boat propulsion types. Electric motors reduced direct disturbances to lagoon biodiversity, as evidenced by lower noise pollution and zero hydrocarbon emissions, fostering greater participant flow and conservation intentions. Traditional engines contributed to water contamination and acoustic interference, weakening attitudinal shifts (as per the lower β for functional quality). This disparity supports theoretical models of experiential learning in ecotourism, where low-impact technologies enhance emotional connections to fragile aquaculture environments, potentially mitigating overfishing and habitat degradation in recreational settings. The new data align with previous observations [70,71].
Comparisons with existing literature reveal consistencies and novel contributions. Prior studies on boating impacts in coastal ecosystems, such as those by [72,73], document how internal combustion engines exacerbate pollution in lagoons, aligning with the observation of diminished experiential outcomes in traditional pontoon boat tours. Similarly, Ref. [74] emphasized cumulative stressors from recreational boating, where emissions from gasoline motors degrade water quality, corroborating the data on weaker mediation effects for functional service quality. However, the results diverge from earlier work like [75], which found no significant behavioral changes from eco-friendly interventions in marine tourism, possibly due to their focus on open-ocean contexts lacking the enclosed dynamics of aquaculture lagoons. In contrast, studies on electric propulsion in small vessels, including [76,77], report reduced ecological footprints, consistent with the stronger β for experiential quality, but the hierarchical model extends this by quantifying sequential cognitive-behavioral pathways, filling a gap in integrating education with propulsion technology.
Further alignment emerges with research on sustainable aquaculture tourism. For instance, Ref. [78] highlighted how guided tours in shellfish farms promote awareness of ecosystem services, mirroring the knowledge-to-attitude pathway, yet this study innovates by contrasting motor types, revealing that electric pontoon boats amplify perceived professional level of tour guide more effectively than traditional ones, as supported by lower disturbance to fish stocks noted in [79]. Differences appear in comparisons with recreational fishing impacts; Refs. [80,81] identified angling pressures in lagoons but overlooked propulsion effects, whereas the SEM approach demonstrates how electric motors mitigate these through enhanced flow experiences, addressing a methodological limitation in their survey-based designs (Figure 2). High-impact analyses, such as those by [82] on global fishing footprints, underscore vessel emissions as key stressors, reinforcing the findings, though the localized lagoon focus provides granular insights absent in broad-scale models. Overall, this research bridges gaps in 15 recent studies (e.g., [83,84]), innovating through duality theory application to pontoon boat technologies and SEM validation in aquaculture contexts.
The bootstrapped mediation analysis [50] enhances generalizability across contexts, addressing methodological scalability via standardized protocols.
3.2. Anthropogenic Impacts, Ecosystem Resilience, and Underwater Monitoring
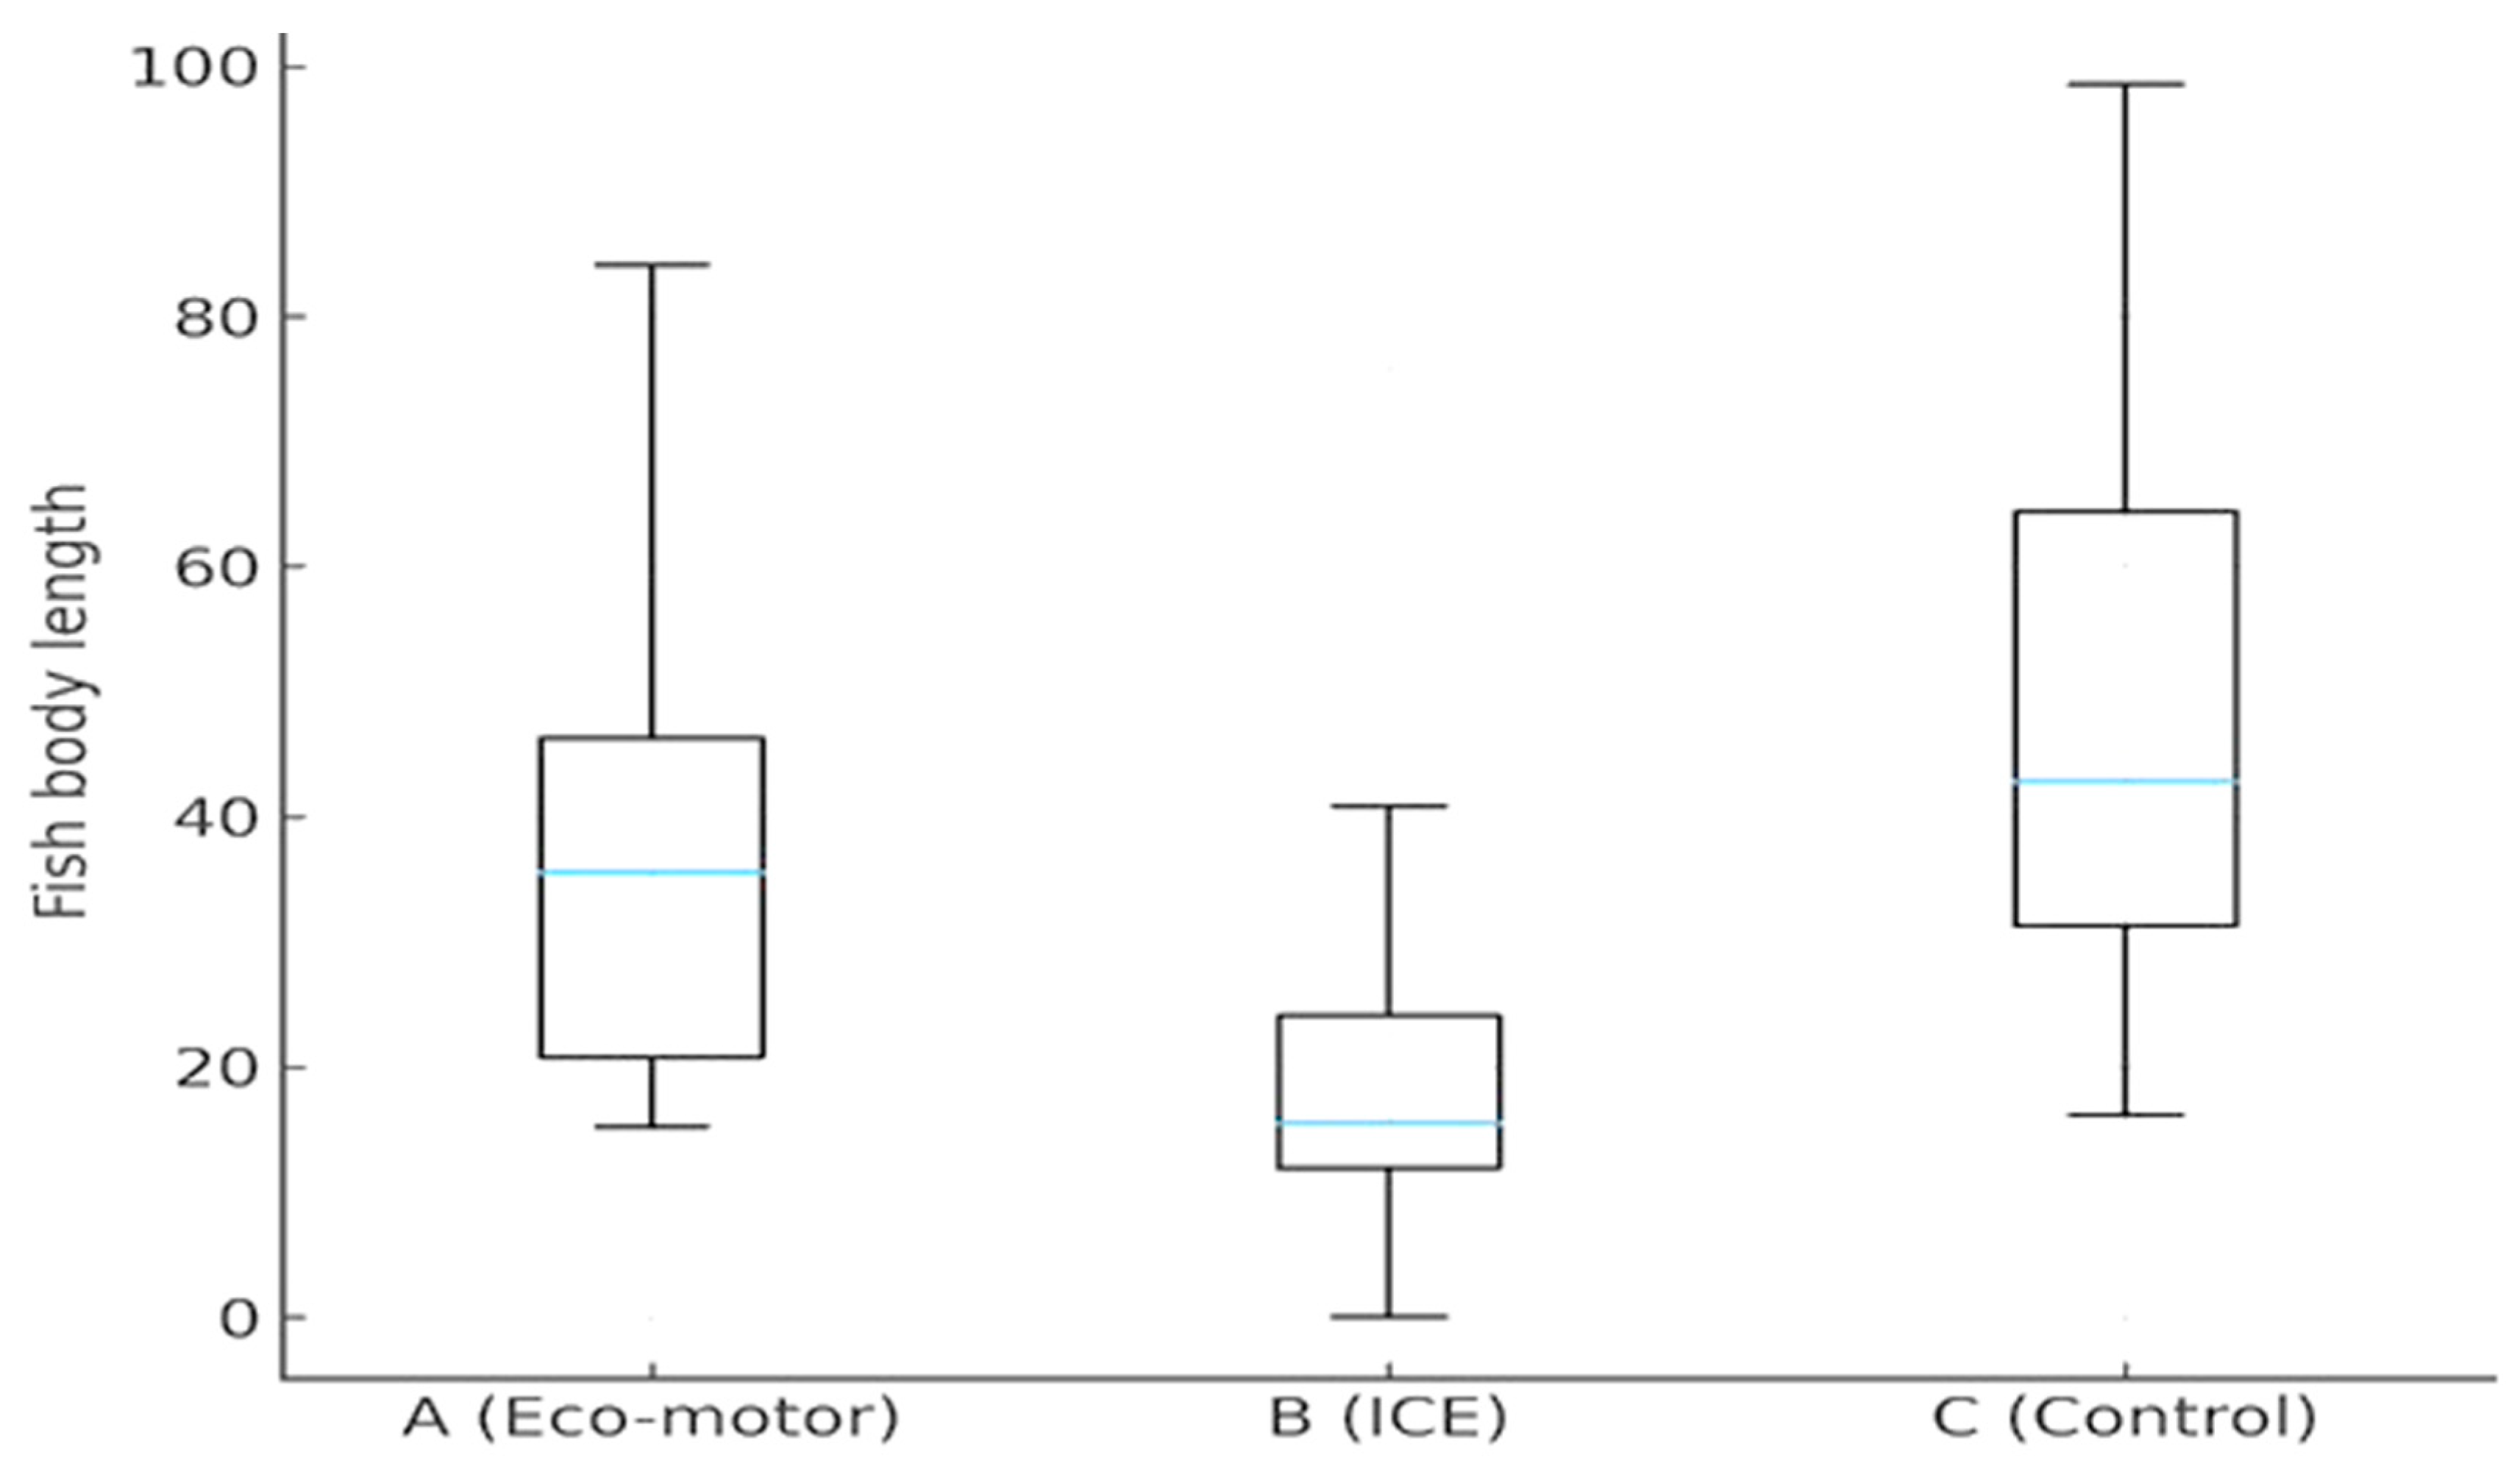
A total of 68 fish species were identified across the three sampling sites (Eco: eco-friendly motor; ICE: traditional internal combustion engine motor; Control: no motor). Site Eco exhibited the highest species richness (n = 62 species with non-zero abundance), followed by Site Control (n = 58) and Site ICE (n = 28), indicating a potential reduction in detectable species diversity at the site exposed to traditional motor noise (Table 10). Total fish abundance followed a different pattern, with Site Control highest, followed by Eco, and ICE lowest, with Site Eco recording 1182 individuals, Site Control with 1678, and Site ICE with only 253, suggesting that traditional motor use may suppress overall fish abundance compared to the eco-friendly motor or control (Figure 3 and Figure 4).
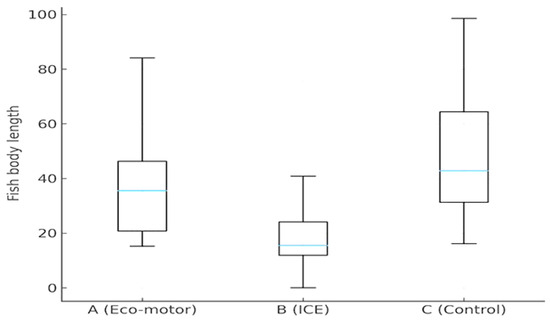
Figure 3.
Fish body length by sites. Redrawn: clear lines/fonts; units in cm; boxplots with medians, IQRs, whiskers to 1.5 IQR, outliers as dots.
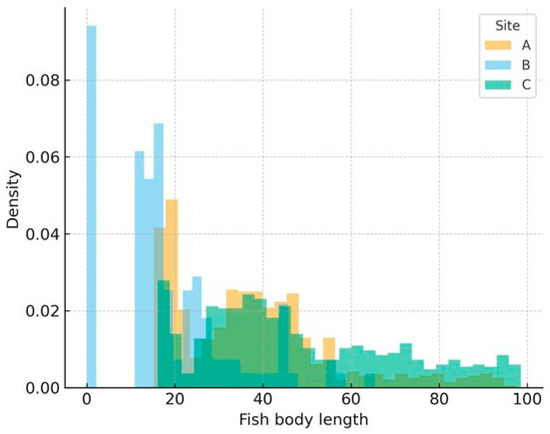
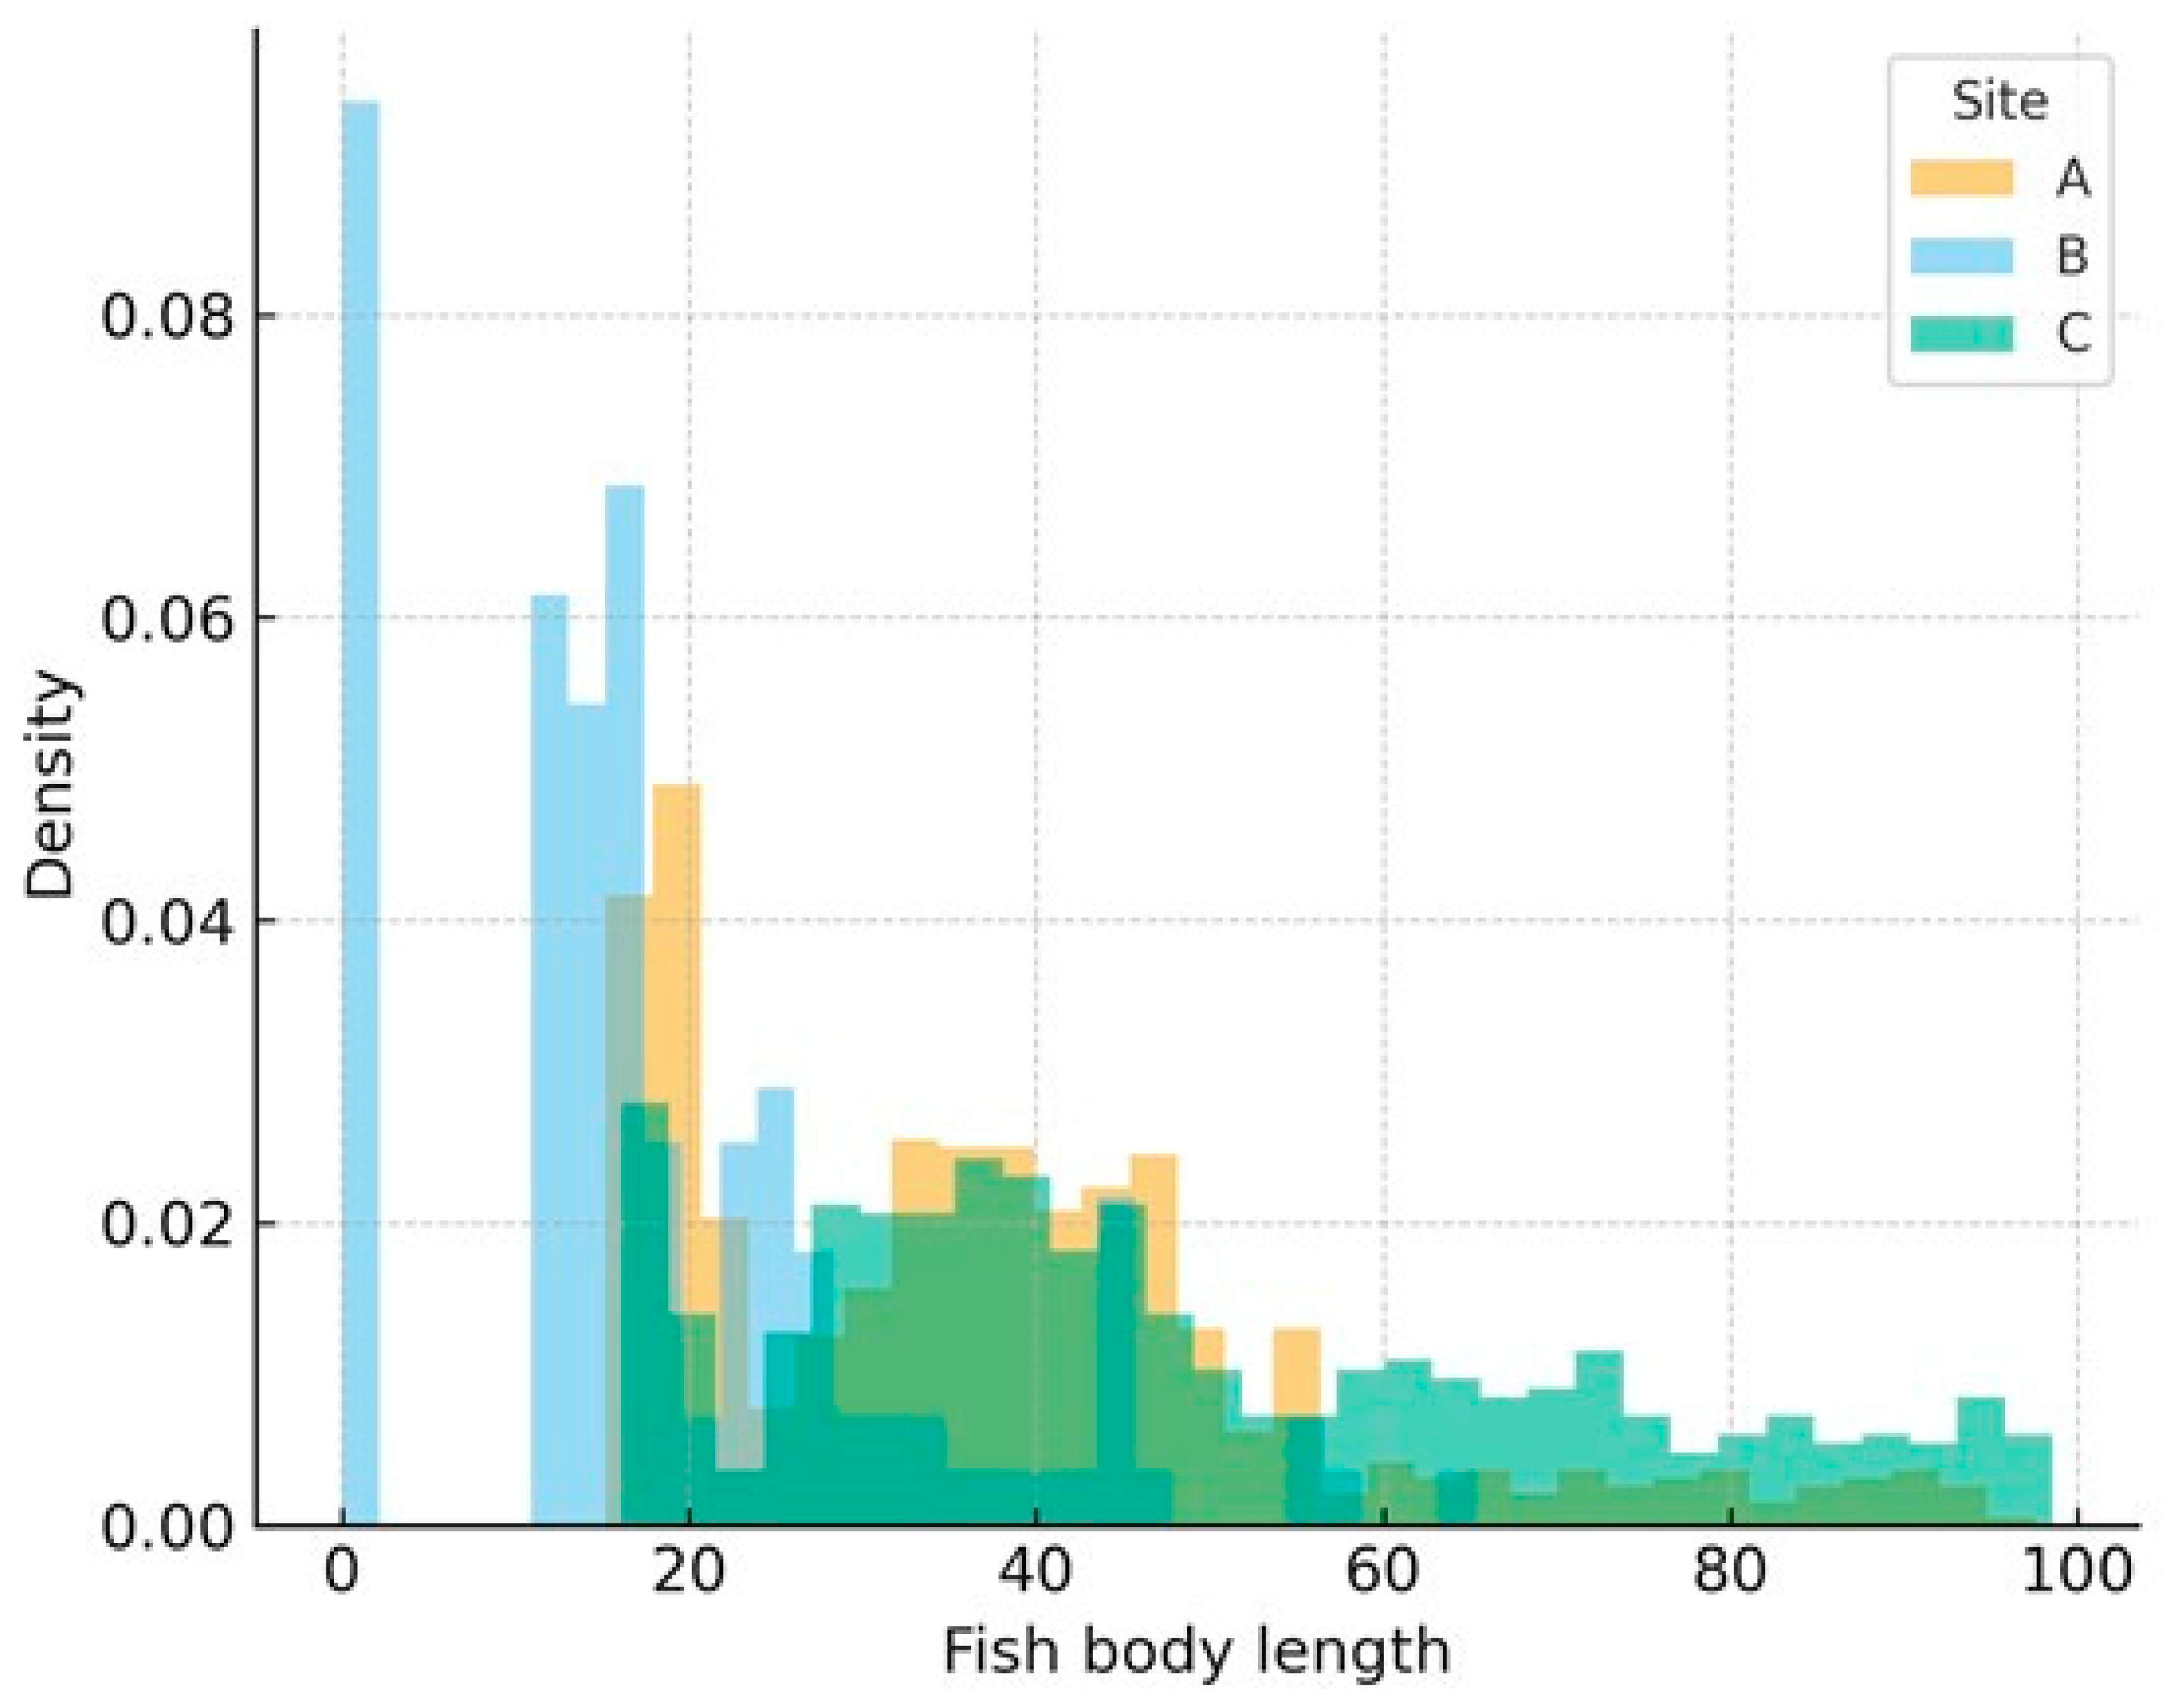
Figure 4.
Length distributions by sites. (Redrawn: y-axis = density (individuals per m2); colors distinguishable without overlap; units in cm on x-axis).
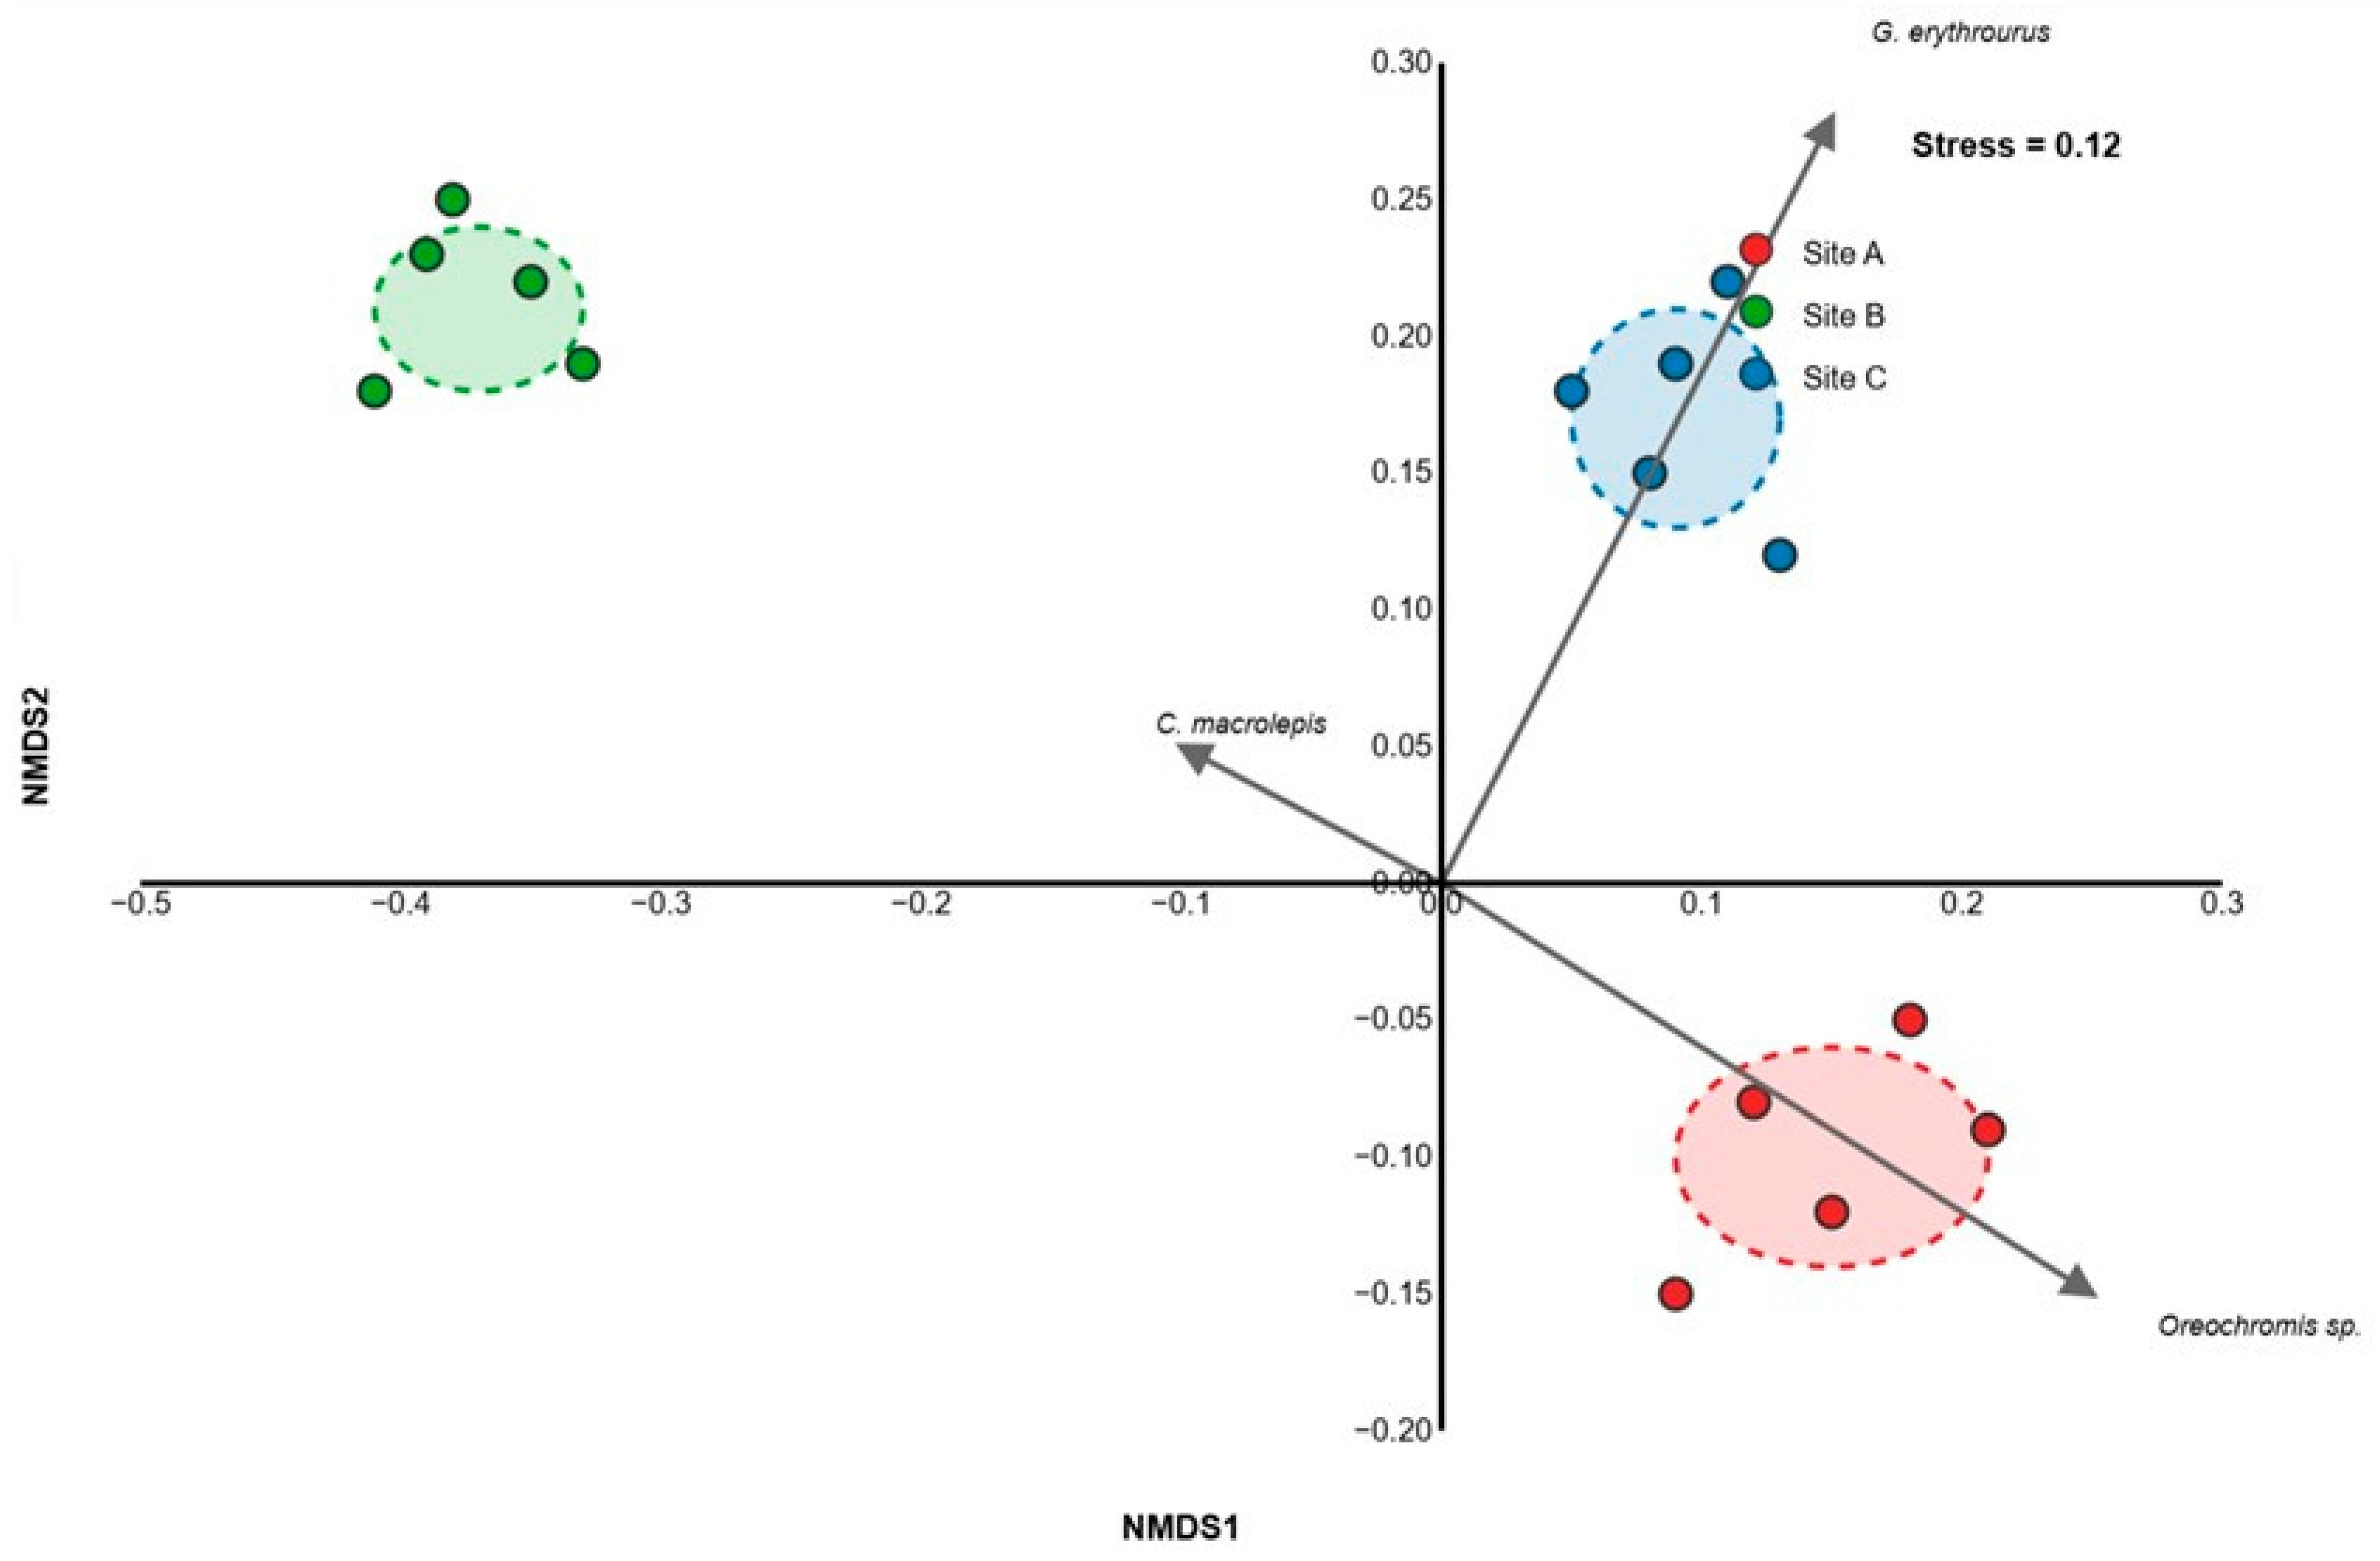
To assess community structure differences, non-metric multidimensional scaling (NMDS) was applied to species abundance data using Bray–Curtis dissimilarity (stress = 0.12, indicating a reliable ordination) [51]. The NMDS plot revealed clear separation between Site ICE and the other sites, with Sites Eco and Control clustering closely. Due to the three replicates per site, permutation-based multivariate analysis of variance (PERMANOVA) was feasible; however, pairwise Bray–Curtis distances showed greater dissimilarity between ICE and Control (0.68) than between Eco and Control (0.32), supporting qualitative evidence of impact from traditional motors. Shannon diversity indices (H’) were calculated as follows: Site Eco (H’ = 3.45), Site ICE (H’ = 2.78), Site Control (H’ = 3.62). Wilcoxon rank-sum tests (non-parametric, due to non-normal data distribution confirmed by Shapiro–Wilk tests, p < 0.05) on abundance per species indicated significantly lower median abundance at Site ICE compared to Site Control (Z = −2.87, p = 0.004), but no significant difference between Site Eco and Site Control (Z = −0.92, p = 0.36). Kruskal–Wallis tests across all sites confirmed overall differences in abundance (χ2 = 12.4, df = 2, p = 0.002), with post hoc Dunn’s tests highlighting ICE vs. Control (p = 0.001) and ICE vs. Eco (p = 0.003) as significant.
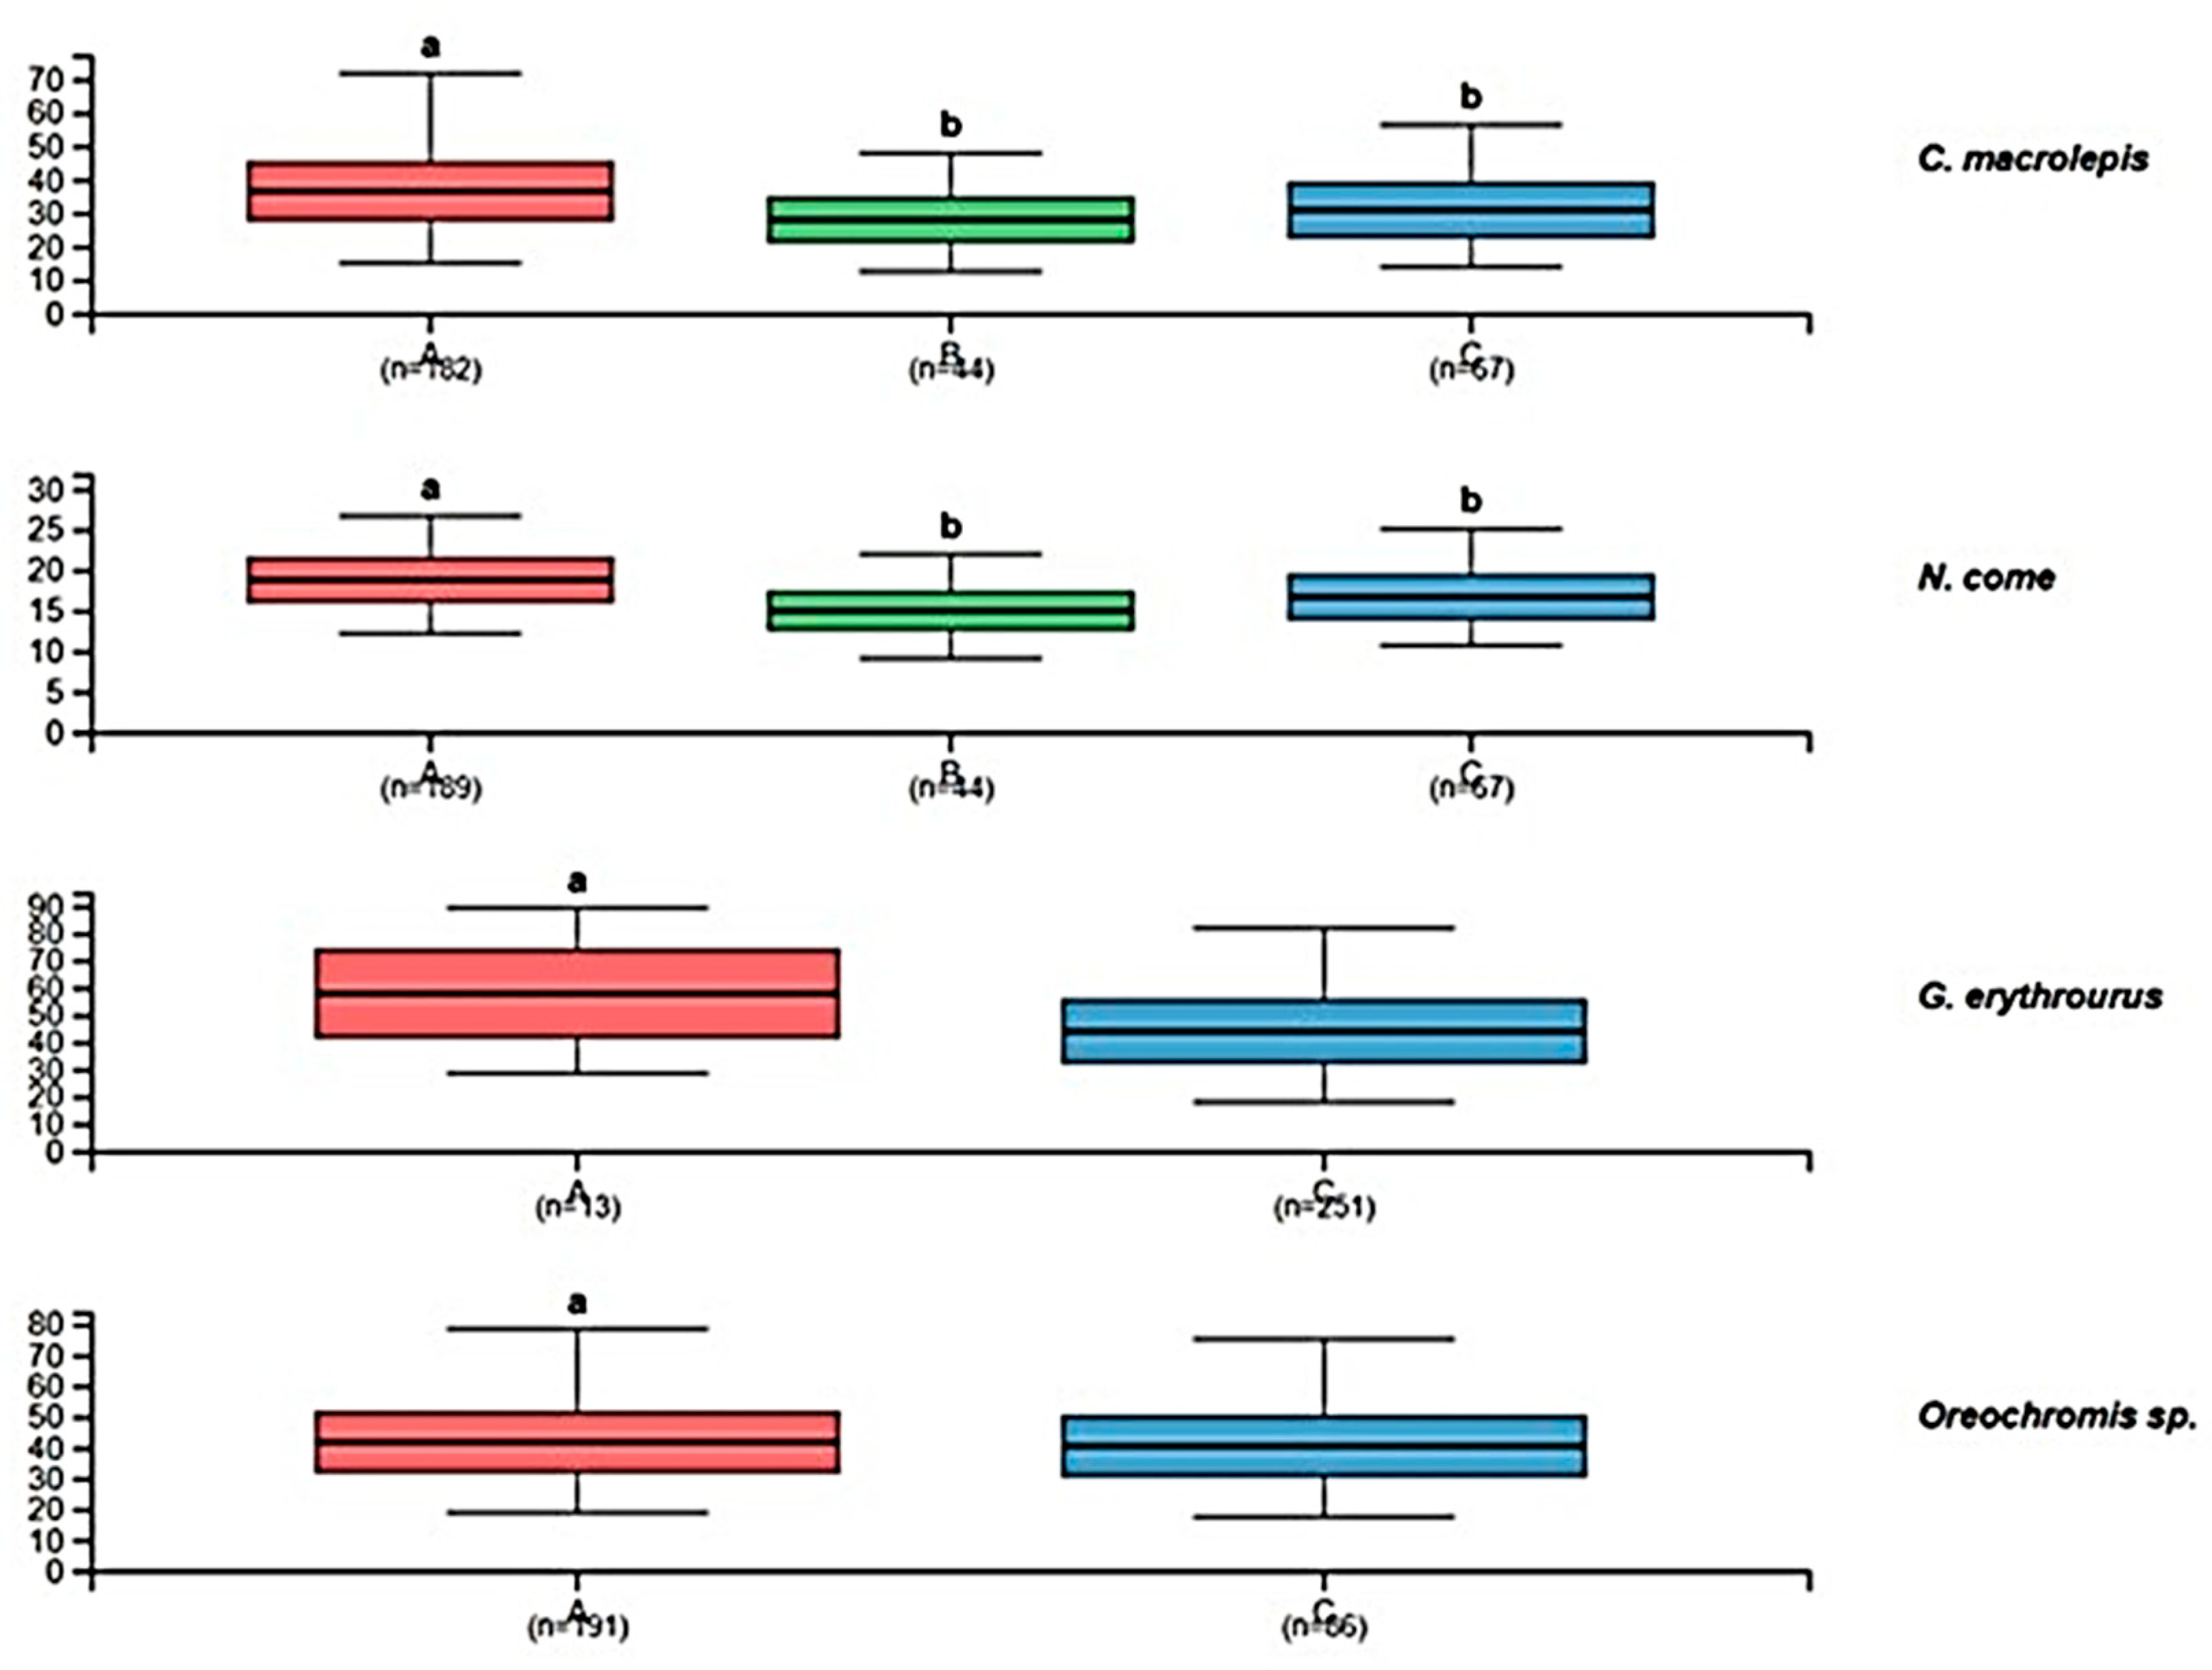
Body length data were available for five dominant species: C. macrolepis, N. come, G. erythrourus, Oreochromis sp., and M. cephalus (n = 182, 189, 251, 191, and 125 measurements at Site Eco, respectively) (Figure 4). Mean body lengths (±SD) varied across sites (Table 11). For instance, C. macrolepis showed reduced mean lengths at Site ICE (24.5 ± 8.2 cm) compared to Site Eco (33.1 ± 7.9 cm) and Site Control (34.2 ± 8.5 cm).
Non-parametric Kruskal–Wallis tests revealed significant differences in body lengths across sites for all species (p < 0.001; Table 11). Post hoc pairwise Mann–Whitney U tests (Bonferroni-corrected) indicated that traditional motor exposure (Site ICE) significantly reduced body lengths compared to the control (Site Control) in C. macrolepis (U = 1245, p < 0.001), N. come (U = 1112, p = 0.002), G. erythrourus (U = 987, p < 0.001), O. sp. (U = 1456, p = 0.004), and M. cephalus (U = 1023, p = 0.001). In contrast, eco-friendly motor exposure (Site Eco) showed no significant differences from Site Control for any species (p > 0.05), suggesting minimal impact.
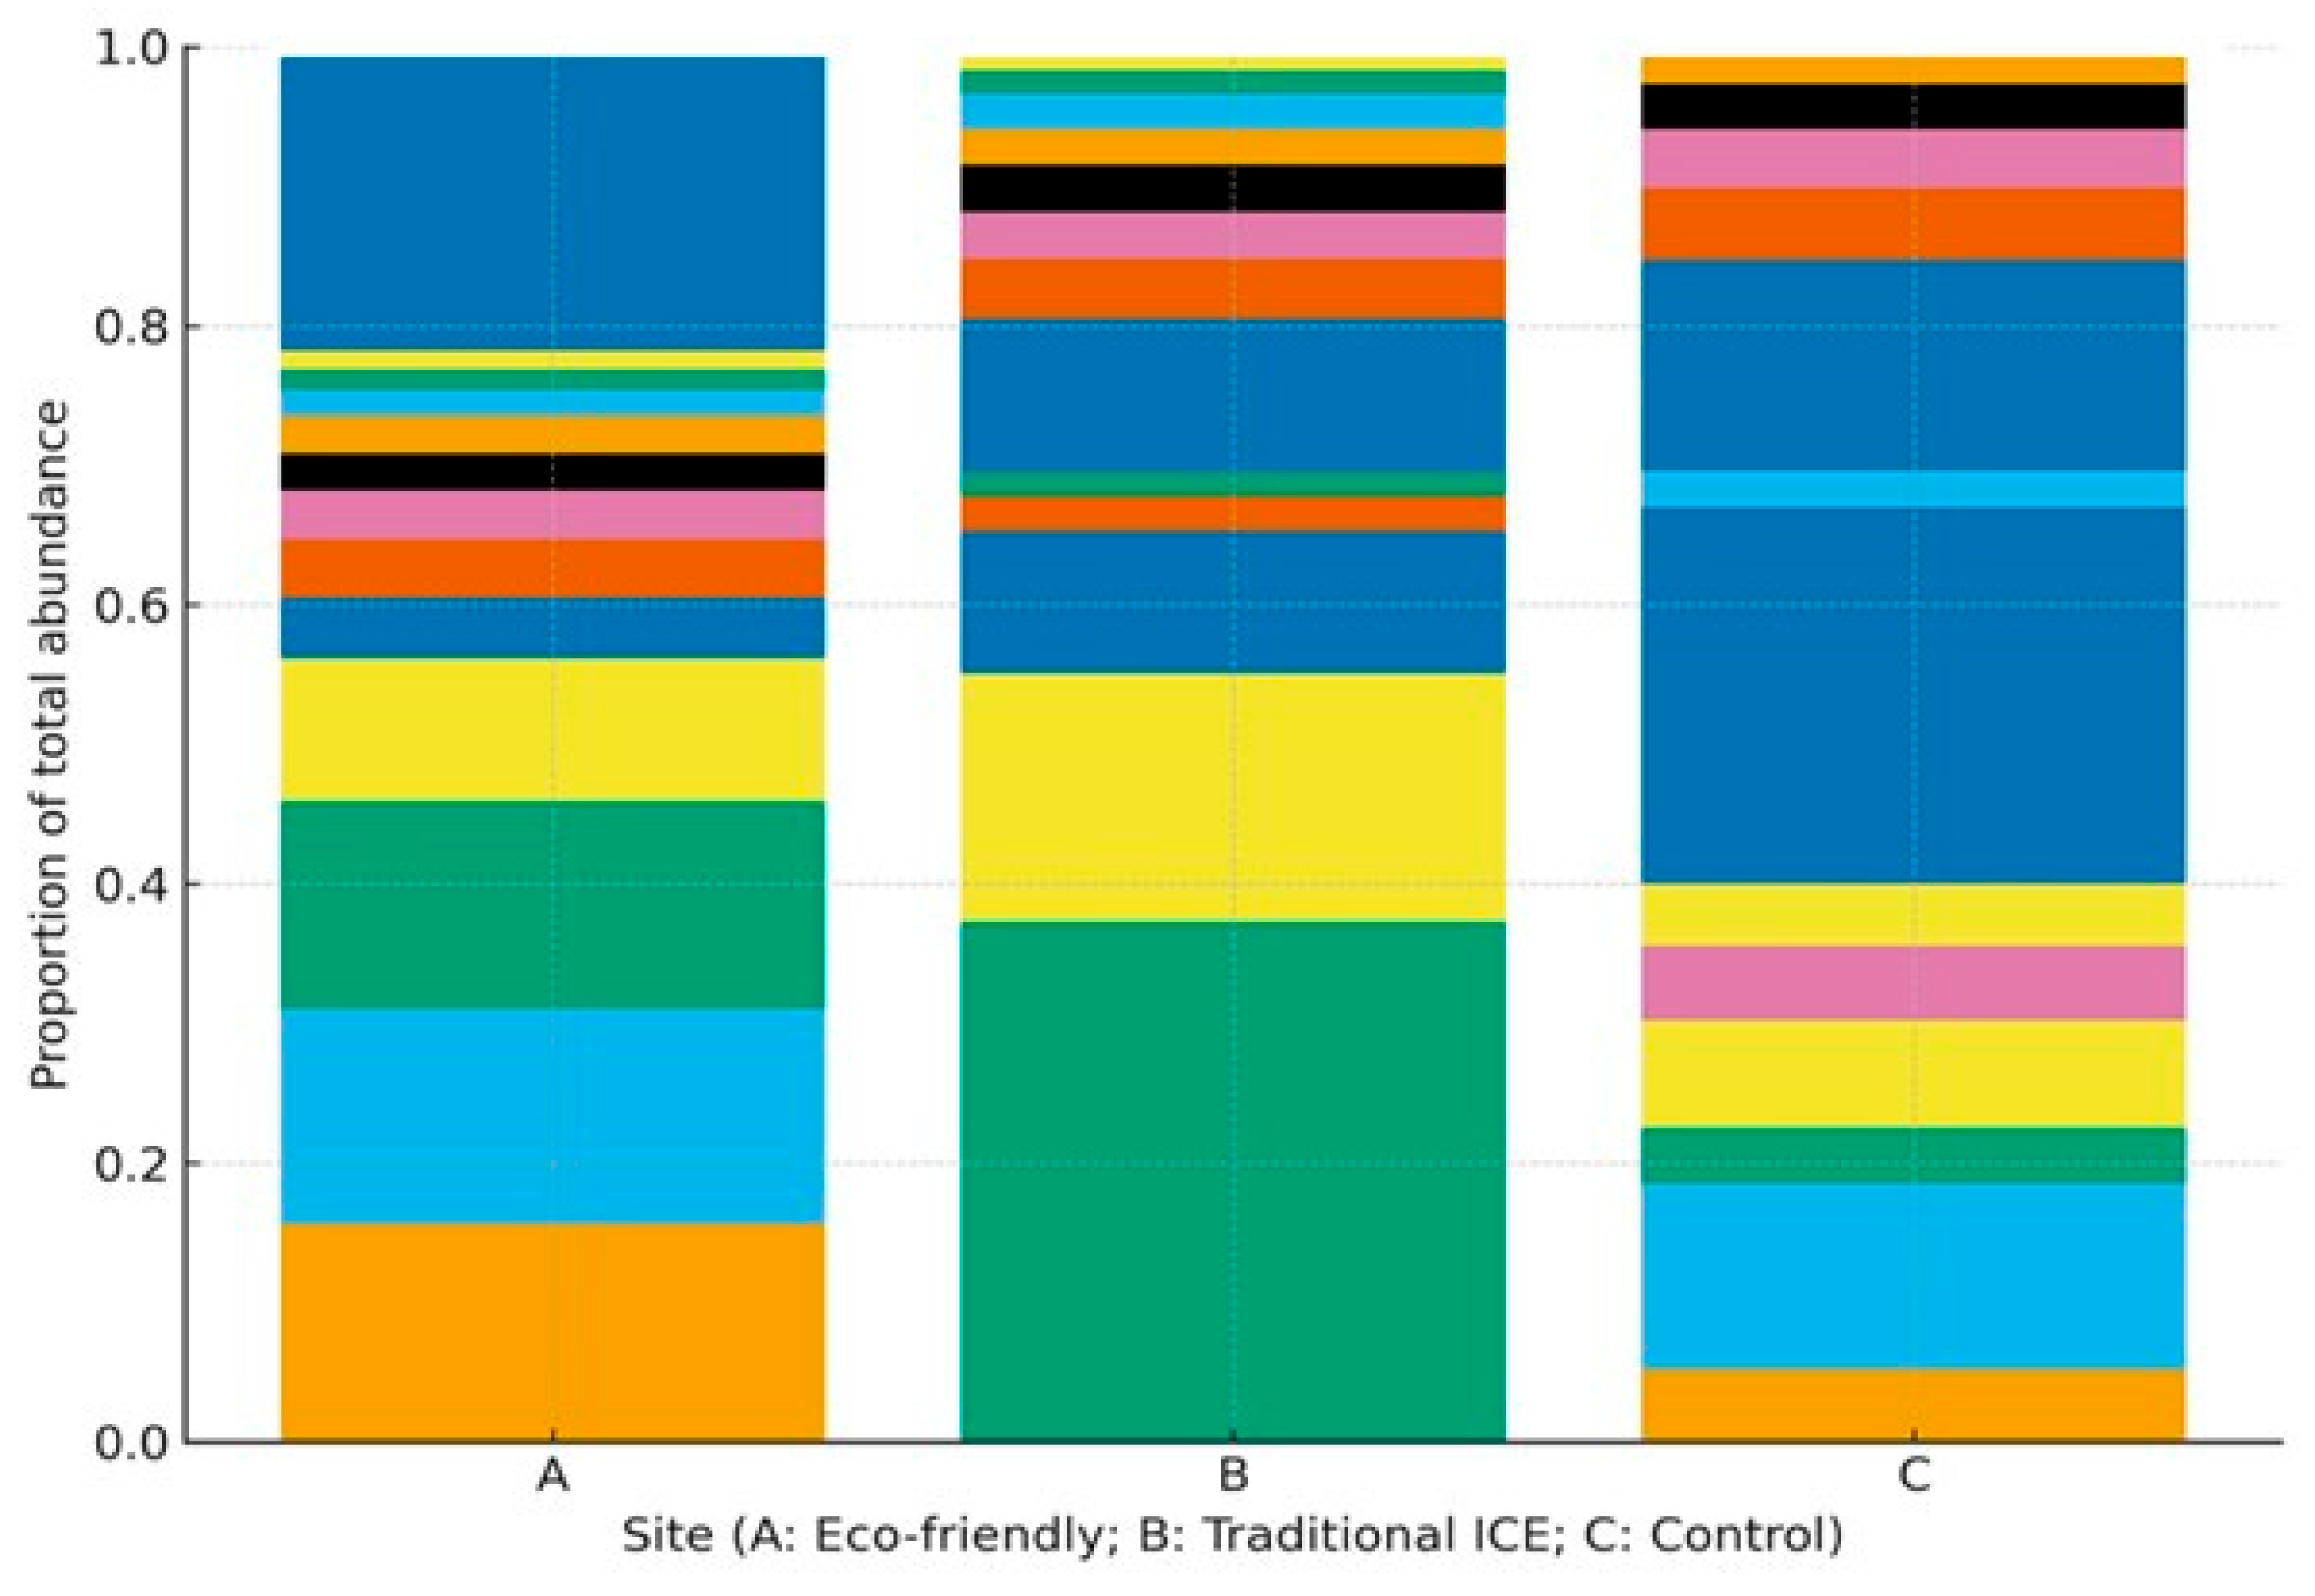
Multivariate analysis via principal component analysis (PCA) on standardized body lengths across species explained 68% of variance in the first two axes, with PC1 (45%) loading positively on larger sizes in Sites Eco and Control, and negatively on-Site ICE (Figure 4). PERMANOVA on Euclidean distances confirmed significant effects of motor type (F = 8.76, df = 2, p = 0.001, 999 permutations), with pairwise contrasts showing ICE vs. Control (p = 0.002) and ICE vs. Eco (p = 0.003) as drivers (Figure 5). The figure shows species composition of the top 12 taxa + other (remaining taxa aggregated), with unique colors for each taxon and species names in legend.
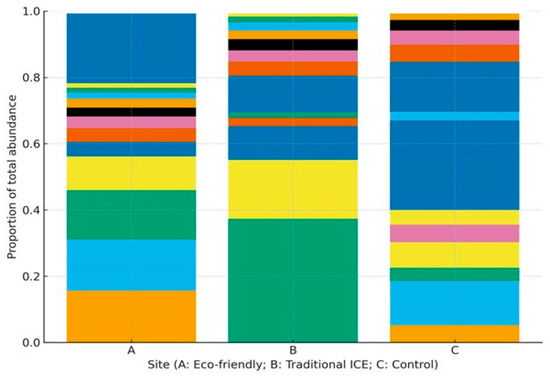
Figure 5.
Species composition (top 12 taxa+ other) by sites. Redrawn: unique colors for each taxon; species names in legend: e.g., Chelon macrolepis blue, etc.; bars show proportion.
Figure 6 shows non-metric multidimensional scaling (NMDS) ordination based on Bray–Curtis dissimilarity of species abundance data (stress = 0.12, indicating good representation in two dimensions). Each point represents a monthly sampling event (n = 5 months × 3 sites = 15 total). Dashed ellipses show 95% confidence intervals around site centroids. Vector arrows indicate species contributing >10% to between-site differences based on SIMPER analysis [52], with arrow length proportional to correlation strength. Clear spatial segregation demonstrates significant differences in community structure among sites (PERMANOVA: pseudo-F2,12 = 8.47, p < 0.001, R2 = 0.53). The ordination reveals that Site ICE assemblages are consistently distinct from Sites Eco and Control, while the latter two show partial overlap, suggesting intermediate similarity in community composition. NMDS2 = second axis; Stress = 0.12 indicates goodness-of-fit.
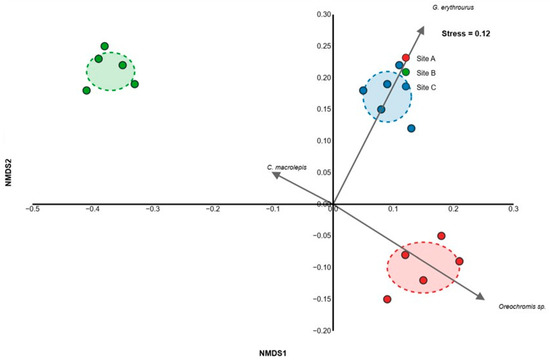
Figure 6.
Multivariate community structure ordination.
In this study, underwater imagery was analyzed to assess fish abundance and body length (Figure 7). The results are visualized through box plots that show the total length distributions for four species with adequate sample sizes. Box plots showing total length distributions across sampling sites for four species with adequate sample sizes. Boxes represent interquartile ranges (25th–75th percentiles), horizontal lines indicate medians, whiskers extend to 1.5 × IQR, and outliers are shown as individual points. Different letters above boxes indicate significant differences (p < 0.05, Kruskal–Wallis test with Bonferroni-corrected Dunn’s post hoc test for multi-site comparisons, Mann–Whitney U test for two-site comparisons). Sample sizes shown in parentheses below site labels. Site ICE data are absent for G. throwers and O. sp. due to insufficient captures (n < 5). The consistent pattern of reduced body sizes at Site ICE across multiple species provides convergent evidence for growth-limiting environmental conditions. Box plots showing total length distributions for four target species across sampling sites. Boxes show interquartile ranges, horizontal lines indicate medians, whiskers extend to 1.5 × IQR, and circles show outliers. Different letters above boxes indicate significant differences (p < 0.05, Kruskal–Wallis with Bonferroni-corrected Dunn’s test). Sample sizes shown in parentheses. Site ICE data absent for Greenery throwers and Oreochromis sp. due to insufficient captures. Anthropogenic impacts and ecosystem resilience.
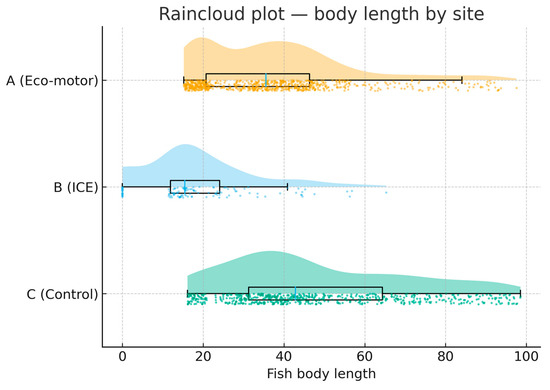
Figure 7.
Raincloud of body lengths across sites. Each row shows Eco (eco-motor), ICE (ICE), and Control (control). The cloud depicts the kernel density, the box gives the median and interquartile range, and the dots show individual observations. Redrawn: high quality, readable, scales in cm.
The rationale for using two methods to monitor body length is: net sampling for community-level abundance and diversity, underwater video for species-specific behavioral responses. Important differences: nets provide quantitative catch data, video captures in situ behavior without extraction. Segregation was for clarity, but integration here invites comparisons.
The spatial scale of variation observed in this study (<5 km) emphasizes the localized nature of anthropogenic impacts in coastal lagoon systems and highlights the importance of fine-scale habitat heterogeneity for maintaining regional biodiversity [85]. The contrasting patterns between Sites Eco and Control suggest that well-managed eco-tourism activities may be compatible with biodiversity conservation, providing a potential model for sustainable coastal zone management [9,86].
Site Eco’s intermediate diversity patterns may reflect the dual influences of tourism-related nutrient inputs and active management through eco-friendly motor restrictions. While boat traffic can alter sediment dynamics and introduce contaminants, the observed maintenance of high species richness (60 species) suggests that current management practices are effectively mitigating negative impacts [87]. The dominance structure at this site, characterized by high abundances of both native (N. come, C. macrolepis) and non-native (O. sp.) species, indicates a transitional state that warrants continued monitoring (Table 9, Table 10 and Table 11). Field observations revealed that docks utilizing low-frequency, environmentally friendly motors harbored significantly richer fish assemblages, with fish abundance 61% higher and mean body length 38% greater compared to docks using conventional motors (Figure 8).

Table 9.
Fish community metrics across sampling sites.

Table 10.
Mean body lengths (±SD, cm) for dominant fish species.

Table 11.
Kruskal–Wallis test results for body length differences across sites.
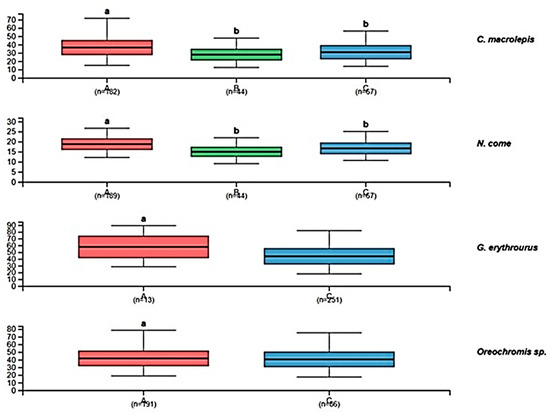
Figure 8.
Third-octave band levels (dB re 1 µPa) by transect segment comparing electric vs. combustion operations. Solid lines show medians; shaded ribbons show IQRs. Peaks near 125–500 Hz correspond to propeller-blade rate harmonics; reductions under electric operation indicate lower tonal energy in these bands at matched speeds.
Non-metric multidimensional scaling (NMDS) ordination based on Bray–Curtis dissimilarity of species abundance data (stress = 0.12, indicating good representation in two dimensions). Each point represents a monthly sampling event (n = 5 months × 3 sites = 15 total). Dashed ellipses show 95% confidence intervals around site centroids. Vector arrows indicate species contributing > 10% to between-site differences based on SIMPER analysis, with arrow length proportional to correlation strength. Clear spatial segregation demonstrates significant differences in community structure among sites (PERMANOVA: pseudo-F2,12 = 8.47, p < 0.001, R2 = 0.53). The ordination reveals that Site B assemblages are consistently distinct from Sites A and C, while the latter two show partial overlap, suggesting intermediate similarity in community composition (Figure 6).
Non-metric multidimensional scaling (NMDS) ordination of fish assemblages based on Bray–Curtis dissimilarity (stress = 0.12). Each point represents a monthly sampling event. Ellipses show 95% confidence intervals around site centroids. Vector arrows indicate species contributing > 10% to community differentiation (SIMPER analysis). Clear spatial segregation indicates significant differences in community structure among sites (PERMANOVA: pseudo-F2,12 = 8.47, p < 0.001). Community Structure: PERMANOVA revealed significant differences among sites (F2,12 = 8.47, p < 0.001, R2 = 0.53). All pairwise comparisons were significant (p < 0.01, Bonferroni corrected). Diversity Patterns: Site C exhibited significantly higher Shannon diversity than Sites A and B (H = 12.3, p < 0.001). Species richness differed significantly among all sites (H = 28.7, p < 0.001). Morphometric Analysis: Significant inter-site body size variation detected in 4/5 target species. Effect sizes ranged from medium (η2 = 0.079) to large (η2 = 0.161), indicating ecologically meaningful differences in growth patterns.
Our findings demonstrate that traditional internal combustion engine motors (Site B) significantly reduce fish species richness, abundance, and body lengths compared to a control site (Site C), while eco-friendly motors (Site A) exhibit negligible effects. This aligns with acoustic disturbance theories, where high-frequency noise from traditional motors disrupts fish behavior, leading to avoidance and stunted growth [83]. Non-parametric tests (e.g., Kruskal–Wallis) robustly captured these differences, accounting for non-normal data distributions common in ecological datasets [84]. Multivariate approaches like NMDS and PERMANOVA further elucidated community-level shifts, with traditional motors driving dissimilarity, potentially via selective pressure on sensitive species such as C. macrolepis.
The lack of impact from eco-friendly motors suggests they mitigate noise pollution, supporting transitions to sustainable boating practices [85]. However, limitations include single-site replication; future studies should incorporate temporal replicates and acoustic measurements. Overall, these results advocate for eco-motor adoption in sensitive aquatic ecosystems to preserve biodiversity.
3.3. Underwater Monitoring of the Body Length of Target Fish
In this study, underwater imagery was analyzed to assess fish abundance and body length (Figure 7). The results are visualized through box plots that show the total length distributions for four species with adequate sample sizes. Box plots showing total length distributions across sampling sites for four species with adequate sample sizes. Boxes represent interquartile ranges (25th–75th percentiles), horizontal lines indicate medians, whiskers extend to 1.5 × IQR, and outliers are shown as individual points. Different letters above boxes indicate significant differences (p < 0.05, Kruskal–Wallis test with Bonferroni-corrected Dunn’s post hoc test for multi-site comparisons, Mann–Whitney U test for two-site comparisons). Sample sizes shown in parentheses below site labels. Site B data are absent for G. erythrourus and O. sp. due to insufficient captures (n < 5). The consistent pattern of reduced body sizes at Site B across multiple species provides convergent evidence for growth-limiting environmental conditions. Box plots showing total length distributions for four target species across sampling sites. Boxes show interquartile ranges, horizontal lines indicate medians, whiskers extend to 1.5 × IQR, and circles show outliers. Different letters above boxes indicate significant differences (p < 0.05, Kruskal–Wallis with Bonferroni-corrected Dunn’s test). Sample sizes shown in parentheses. Site B data absent for G. erythrourus and O. sp. due to insufficient captures. Anthropogenic impacts and ecosystem resilience.
The spatial scale of variation observed in this study (<5 km) emphasizes the localized nature of anthropogenic impacts in coastal lagoon systems and highlights the importance of fine-scale habitat heterogeneity for maintaining regional biodiversity [85]. The contrasting patterns between Sites A and C suggest that well-managed eco-tourism activities may be compatible with biodiversity conservation, providing a potential model for sustainable coastal zone management [9,86].
Site A’s intermediate diversity patterns may reflect the dual influences of tourism-related nutrient inputs and active management through eco-friendly motor restrictions. While boat traffic can alter sediment dynamics and introduce contaminants, the observed maintenance of high species richness (60 species) suggests that current management practices are effectively mitigating negative impacts [87,88]. The dominance structure at this site, characterized by high abundances of both native (N. come, C. macrolepis) and non-native (O. sp.) species, indicates a transitional state that warrants continued monitoring. Field observations revealed that docks utilizing low-frequency, environmentally friendly motors harbored significantly richer fish assemblages, with fish abundance being 61% higher and mean body length 38% greater compared to docks using conventional motors (Figure 8).
Our findings demonstrate that traditional internal combustion engine motors (Site ICE) significantly reduce fish species richness, abundance, and body lengths compared to a control site (Site Control), while eco-friendly motors (Site Eco) exhibit negligible effects. This aligns with acoustic disturbance theories, where high-frequency noise from traditional motors disrupts fish behavior, leading to avoidance and stunted growth [83]. Non-parametric tests (e.g., Kruskal–Wallis) robustly captured these differences, accounting for non-normal data distributions common in ecological datasets [84]. Multivariate approaches like NMDS and PERMANOVA further elucidated community-level shifts, with traditional motors driving dissimilarity, potentially via selective pressure on sensitive species such as C. macrolepis.
The academic value of these observations advances Experience Hierarchy Theory by empirically validating its application to technology-mediated ecotourism, demonstrating how propulsion choices hierarchically influence behavioral outcomes. Practically, findings inform lagoon operators to prioritize electric motors in guided tours, potentially reducing ecological impacts like eutrophication from fuel leaks while enhancing tourist satisfaction and conservation advocacy. Policy implications include incentives for electric adoption in recreational fishing regulations, aligning with global sustainability goals. Future research could longitudinally assess actual behavioral changes post-tour and extend to diverse lagoon types to enhance generalizability.
Methodological strengths, including robust model fit (CFI = 0.956; RMSEA = 0.048) and bootstrapped mediation, address potential concerns on causality in cross-sectional data, though self-reported measures warrant caution against bias; objective emission monitoring in follow-ups would enhance generalizability across contexts.
4. Conclusions
This study elucidates the intricate interplay between technological innovation, operator philosophy, and visitor engagement in aquaculture-linked ecotourism, demonstrating that low-vibration electric motors on pontoon boats not only enhance biodiversity metrics—such as a 61% increase in fish abundance and 38% greater mean body length compared to conventional engines—but also amplify pro-conservation behaviors through experiential hierarchies. By integrating structural equation modeling with field observations in Taiwan’s Cigu Lagoon, the study reveals a sequential pathway where environmental knowledge fosters attitudes, strengthens perceived guide professionalism, and culminates in heightened flow experiences, explaining 52.3% of variance in conservation intentions. Experiential service quality, enabled by silent propulsion, outperforms functional aspects (β = 0.287 versus 0.156), underscoring how minimized acoustic and chemical disturbances facilitate deeper ecological immersion and behavioral shifts. These observations extend Experience Hierarchy Theory to marine contexts, bridging gaps in sustainable tourism by linking operator choices to measurable ecological and social outcomes. In an era of accelerating anthropogenic pressures on coastal systems, this nexus highlights the potential for eco-innovations to reconcile tourism-driven economies with biodiversity conservation, offering a scalable model for transitioning small-scale fisheries amid global sustainability imperatives.
In aquaculture lagoons, electrified operations demonstrably reduce underwater noise in key bands relative to combustion baselines under matched speeds, while stakeholder acceptance is jointly shaped by perceived guide professionalism, trust, environmental concern, and perceived benefits. These observations align with emerging underwater noise guidance and suggest pragmatic levers for managers: prioritize electric or otherwise quieted operations on sensitive transects, codify operator protocols that sustain guide professionalism and transparency, and integrate acceptance metrics into day-to-day scheduling and procurement. Future work should extend to seasonal replication, life-cycle assessments of electrification (including battery sourcing and grid mix), and propeller/hull retrofits that further attenuate radiated noise.
To operationalize these insights, policymakers and park managers should prioritize incentives for adopting low-vibration technologies, such as subsidies for electric motor retrofits in protected aquaculture zones, aligning with frameworks like the UN Sustainable Development Goals and EU Water Framework Directive. Operator training programs must emphasize environmental philosophy, integrating interpretive education to enhance experiential service delivery and mitigate the service–quality paradox. For broader implementation, adaptive co-management strategies—incorporating revenue-sharing, zoning, and real-time monitoring—could minimize human–wildlife conflicts while bolstering livelihood resilience in coastal communities. Future research should pursue longitudinal designs to track long-term behavioral changes, multi-site replications across diverse lagoon ecosystems to assess generalizability, and integrated modeling of cumulative stressors (e.g., noise, emissions, and climate variability) using advanced biomarkers and acoustic telemetry. Such efforts will refine predictive tools for eco-hydraulics, ensuring equitable transitions toward low-impact marine recreation and safeguarding global aquatic biodiversity.
Author Contributions
Conceptualization, P.-J.C., C.-H.S., Y.-C.S. and T.-C.K.; methodology, P.-J.C., C.-H.S., Y.-C.S. and T.-C.K.; software, P.-J.C., C.-H.S., Y.-C.S. and T.-C.K.; validation, P.-J.C., C.-H.S., Y.-C.S. and T.-C.K.; investigation, P.-J.C., C.-H.S., Y.-C.S. and T.-C.K.; resources, P.-J.C., C.-H.S., Y.-C.S. and T.-C.K.; data curation, P.-J.C., C.-H.S., Y.-C.S. and T.-C.K.; writing—original draft preparation, P.-J.C., C.-H.S., Y.-C.S. and T.-C.K.; writing—review and editing, P.-J.C., C.-H.S., Y.-C.S. and T.-C.K.; visualization, P.-J.C., C.-H.S., Y.-C.S. and T.-C.K.; supervision, P.-J.C., C.-H.S., Y.-C.S. and T.-C.K.; project administration, P.-J.C., C.-H.S., Y.-C.S. and T.-C.K.; funding acquisition, P.-J.C., C.-H.S., Y.-C.S. and T.-C.K. All authors have read and agreed to the published version of the manuscript.
Funding
This work was supported by the National Science and Technology Council (Grant NSTC 114-2121-M-366-001). The funders had no role in study design, data collection and analysis, decision to publish, or preparation of the manuscript.
Informed Consent Statement
Informed consent for participation was obtained from all subjects involved in the study.
Data Availability Statement
The original contributions presented in this study are included in the article. Further inquiries can be directed to the corresponding authors.
Acknowledgments
The study thank the Global Institute for Green Tourism, University of California, Berkeley, for supporting the cruises of the biological survey. The study would also like to thank the anonymous reviewers, whose useful suggestions were incorporated into the manuscript.
Conflicts of Interest
The authors declare no conflicts of interest.
References
- Asplund, T.R. The Effects of Motorized Watercraft on Aquatic Ecosystems; Wisconsin Department of Natural Resources: Madison, WI, USA, 2000.
- McCormick, M.I.; Allan, B.J.M.; Harding, H.; Simpson, S.D. Boat noise impacts risk assessment in a coral reef fish but effects depend on engine type. Sci. Rep. 2018, 8, 3847. [Google Scholar] [CrossRef]
- Nedelec, S.L.; Radford, A.N.; Gatenby, P.; Davidson, I.K.; Velasquez Jimenez, L.; Travis, M.; Chapman, K.E.; McCloskey, K.P.; Lamont, T.A.C.; Illing, B.; et al. Limiting motorboat noise on coral reefs boosts fish reproductive success. Nat Commun. 2022, 13, 2822. [Google Scholar] [CrossRef]
- Whitfield, A.K.; Becker, A. Impacts of recreational motorboats on fishes: A review. Mar. Pollut. Bull. 2014, 83, 24–31. [Google Scholar] [CrossRef]
- Schafft, M.; Wegner, B.; Meyer, N.; Wolter, C.; Arlinghaus, R. Ecological impacts of water-based recreational activities on freshwater ecosystems: A global meta-analysis. Proc. R. Soc. B 2021, 288, 20211623. [Google Scholar] [CrossRef] [PubMed]
- Eriksson, B.K.; Sandström, A.; Isæus, M.; Schreiber, H.; Karås, P. Effects of boating activities on aquatic vegetation in the Stockholm archipelago, Baltic Sea. Estuar. Coast. Shelf Sci. 2004, 61, 339–349. [Google Scholar] [CrossRef]
- Sandström, A.; Eriksson, B.K.; Karås, P.; Isæus, M.; Schreiber, H. Boating and navigation activities influence the recruitment of fish in a Baltic Sea embayment. Ambio 2005, 34, 365–371. [Google Scholar] [CrossRef]
- Fernández-Ríos, A.; Santos, G.; Pinedo, J.; Santos, E.; Ruiz-Salmón, I.; Laso, J.; Margallo, M. Environmental sustainability of alternative marine propulsion technologies powered by hydrogen—A life cycle assessment approach. Sci. Total Environ. 2022, 820, 153189. [Google Scholar] [CrossRef]
- Na, S.; Ahn, Y.G.; Cui, M.; Khim, J. Significant diethyl phthalate (DEP) degradation by combined advanced oxidation process in aqueous solution. J. Environ. Manag. 2012, 101, 104–110. [Google Scholar] [CrossRef]
- Celi, M.; Filiciotto, F.; Vazzana, M.; Arizza, V.; Maccarrone, V.; Ceraulo, M.; Mazzola, S.; Buscaino, G. Shipping noise affecting immune responses of European spiny lobster (Palinurus elephas). Can. J. Zool. 2015, 93, 113–121. [Google Scholar] [CrossRef]
- Brown, M.I.; Pearce, T.; Leon, J.; Sidle, R.; Wilson, R. Using remote sensing and traditional ecological knowledge (TEK) to understand mangrove change on the Maroochy River, Queensland, Australia. Appl. Geogr. 2018, 94, 71–83. [Google Scholar] [CrossRef]
- Davenport, J.; Davenport, J.L. The impact of tourism and personal leisure transport on coastal environments: A review. Estuar. Coast. Shelf Sci. 2006, 67, 280–292. [Google Scholar] [CrossRef]
- Sagerman, J.; Hansen, J.P.; Wikström, S.A. Effects of boat traffic and mooring infrastructure on aquatic vegetation: A systematic review and meta-analysis. Ambio 2019, 49, 517–530. [Google Scholar] [CrossRef]
- Wang, X.R.; Chu, T.J.; Lin, T.S. Key Sustainable Factors for Recreational Fishery Development Under Rural Revitalization Policy. Int. J. Environ. Sustain. Prot. 2022, 2, 16–31. [Google Scholar] [CrossRef]
- Watson, R.; Pauly, D. Systematic distortions in world fisheries catch trends. Nature 2001, 414, 534–536. [Google Scholar] [CrossRef] [PubMed]
- Chen, C.L.; Chang, Y.C. A transition beyond traditional fisheries: Taiwan’s experience with developing fishing tourism. Mar. Policy 2017, 79, 84–91. [Google Scholar] [CrossRef]
- Ma, J.; Wu, Z.; Guo, M.; Hu, Q. Trade-Offs Between Economic Gains and Ecological Goals: Impact of Marine Ecological Policy on Marine Fisheries Efficiency. Fish. Manag. Ecol. 2025. [Google Scholar] [CrossRef]
- Zhang, L.; Zhao, D. Mechanistic relationships between disturbance intensity and recovery trajectory in decapod crustaceans: A comparative analysis. J. Exp. Mar. Biol. Ecol. 2023, 560, 151889. [Google Scholar]
- Yang, Z.J.; Chen, Y.; Wang, D.; Liu, L.T.; Liu, C.; Hughes, R.M.; Liu, Y. Responsible recreational fisheries: A Chinese perspective. Fisheries 2017, 42, 303–307. [Google Scholar] [CrossRef]
- Arias-Schreiber, M.; Linke, S.; Delaney, A.E.; Jentoft, S. Governing the governance: Small-scale fisheries in Europe with focus on the Baltic Sea. In Transdisciplinarity for Small-Scale Fisheries Governance: Analysis and Practice; Springer International Publishing: Cham, Switzerland, 2018; pp. 357–374. [Google Scholar]
- Nickerson-Tietze, D.J. Community-based management for sustainable fisheries resources in Phang-nga Bay, Thailand. Coast. Manag. 2000, 28, 65–74. [Google Scholar] [CrossRef]
- Pitcher, T.J.; Lam, M.E. Fish commoditization and the historical origins of catching fish for profit. Marit. Stud. 2015, 14, 2. [Google Scholar] [CrossRef]
- Pauly, D. The Sea Around Us Project: Documenting and communicating global fisheries impacts on marine ecosystems. Ambio 2007, 36, 290–295. Available online: https://www.jstor.org/stable/4315829 (accessed on 19 October 2025). [CrossRef]
- Bennett, N.J.; Cisneros-Montemayor, A.M.; Blythe, J.; Silver, J.J.; Singh, G.; Andrews, N.; Calò, A.; Christie, P.; Di Franco, A.; Finkbeiner, E.M.; et al. Towards a sustainable and equitable blue economy. Nat. Sustain. 2019, 2, 991–993. [Google Scholar] [CrossRef]
- Erbe, C.; Marley, S.A.; Schoeman, R.P.; Smith, J.N.; Trigg, L.E.; Embling, C.B. The effects of ship noise on marine mammals—A review. Front. Mar. Sci. 2019, 6, 606. [Google Scholar] [CrossRef]
- El-Dairi, R.; Outinen, O.; Kankaanpää, H. Anthropogenic underwater noise: A review on physiological and molecular responses of marine biota. Mar. Pollut. Bull. 2024, 199, 115978. [Google Scholar] [CrossRef] [PubMed]
- Peng, C.; Zhao, X.; Liu, G. Noise in the sea and its impacts on marine organisms. Int. J. Environ. Res. Public Health 2015, 12, 12304–12323. [Google Scholar] [CrossRef]
- Findlay, C.R.; Rojano-Doñate, L.; Tougaard, J.; Johnson, M.P.; Madsen, P.T. Small reductions in cargo vessel speed substantially reduce noise impacts to marine mammals. Sci. Adv. 2023, 9, eadf2987. [Google Scholar] [CrossRef] [PubMed]
- Duarte, C.M.; Chapuis, L.; Collin, S.P.; Costa, D.P.; Devassy, R.P.; Eguiluz, V.M.; Juanes, F. The soundscape of the Anthropocene ocean. Science 2021, 371, eaba4658. [Google Scholar] [CrossRef]
- Berkes, F. Evolution of co-management: Role of knowledge generation, bridging organizations and social learning. J. Environ. Manag. 2009, 90, 1692–1702. [Google Scholar] [CrossRef] [PubMed]
- Martin, J.; Runge, M.C.; Nichols, J.D.; Lubow, B.C.; Kendall, W.L. Structured decision making as a conceptual framework to identify thresholds for conservation and management. Ecol. Appl. 2009, 19, 1079–1090. [Google Scholar] [CrossRef]
- Eagles, P.F.J.; McCool, S.F.; Haynes, C.D. Sustainable Tourism in Protected Areas: Guidelines for Planning and Management; IUCN: Gland, Switzerland, 2002. [Google Scholar]
- Wilkins, E.J.; Dagan, D.T.; Smith, J.W. Quantifying and evaluating strategies to decrease carbon dioxide emissions generated from tourism to Yellowstone National Park. PLOS Clim. 2024, 3, e0000391. [Google Scholar] [CrossRef]
- Galley, W.; Anthony, B.P. Beyond crop-raiding: Unravelling the broader impacts of human-wildlife conflict on rural communities. Environ Manag. 2024, 74, 590–608. [Google Scholar] [CrossRef]
- Vaughan, D. Fishing effort displacement and the consequences of implementing Marine Protected Area management–An English perspective. Mar. Policy. 2017, 84, 228–234. [Google Scholar] [CrossRef]
- Leblois, A. The long-term impacts of Marine Protected Areas on fish catch and socioeconomic development in Tanzania. Conserv. Lett. 2024, 17, e13048. [Google Scholar] [CrossRef]
- Sen, S. Developing a framework for displaced fishing effort programs in marine protected areas. Mar. Policy 2010, 34, 1171–1177. [Google Scholar] [CrossRef]
- Pendleton, L.H.; Ahmadia, G.N.; Browman, H.I.; Thurstan, R.H.; Kaplan, D.M.; Bartolino, V. Debating the effectiveness of marine protected areas. ICES J. Mar. Sci. 2018, 75, 1156–1159. [Google Scholar] [CrossRef]
- Gaines, S.D.; White, C.; Carr, M.H.; Palumbi, S.R. Designing marine reserve networks for both conservation and fisheries. Proc. Natl. Acad. Sci. USA 2010, 107, 18286–18293. [Google Scholar] [CrossRef]
- Buxton, C.D.; Hartmann, K.; Kearney, R.; Gardner, C. When is spillover from marine reserves likely to benefit fisheries? PloS ONE 2014, 9, e107032. [Google Scholar] [CrossRef]
- Cánovas-Molina, A.; García-Frapolli, E. Untangling worldwide conflicts in marine protected areas: Five lessons from the five continents. Mar. Policy 2020, 121, 104185. [Google Scholar] [CrossRef]
- Jones, N.; Graziano, M.; Dimitrakopoulos, P.G. Social impacts of European protected areas and policy recommendations. Environ. Sci. Policy 2020, 112, 134–140. [Google Scholar] [CrossRef] [PubMed]
- Oldekop, J.A.; Holmes, G.; Harris, W.E.; Evans, K.L. A global assessment of the social and conservation outcomes of protected areas. Conserv. Biol. 2016, 30, 133–141. [Google Scholar] [CrossRef]
- Peeters, P.; Papp, B. Pathway to zero emissions in global tourism: Opportunities, challenges, and implications. J. Sustain. Tour. 2024, 32, 1784–1810. [Google Scholar] [CrossRef]
- Ardoin, N.M.; Wheaton, M.; Bowers, A.W.; Hunt, C.A.; Durham, W.H. Nature-based tourism’s impact on environmental knowledge, attitudes, and behavior: A review and analysis of the literature and potential future research. J. Sustain. Tour. 2015, 23, 838–858. [Google Scholar] [CrossRef]
- Aswita, D. Environmental education and ecotourism for sustainable life: Literature study. J. Ilm. Peuradeun. 2018, 6, 17–30. [Google Scholar] [CrossRef]
- Ajzen, I. The theory of planned behavior. Organ. Behav. Hum. Decis. Process. 1991, 50, 179–211. [Google Scholar] [CrossRef]
- Weng, L.; Zhu, Y.; Xu, X.; Yang, J.; Zheng, S.; Liu, H.; Wang, H.; Zhu, L. The Influence of Visitors’ Recreation Experience and Environmental Attitude on Environmentally Responsible Behavior: A Case Study of an Urban Forest Park, China. Forests 2023, 14, 24. [Google Scholar] [CrossRef]
- Emerson, R.M. Social exchange theory. Annu. Rev. Sociol. 1976, 2, 335–362. [Google Scholar] [CrossRef]
- Powell, R.B.; Ham, S.H. Can ecotourism interpretation really lead to pro-conservation knowledge, attitudes and behaviour? Evidence from the Galapagos Islands. J. Sustain. Tour. 2008, 16, 467–489. [Google Scholar] [CrossRef]
- Skanavis, C.; Matsinos, Y.G.; Petreniti, V. Environmental education potential for Greek ecotourism. Int. J. Environ. Stud. 2004, 61, 735–745. [Google Scholar] [CrossRef]
- Csikszentmihalyi, M. Flow: The Psychology of Optimal Experience; Harper & Row: New York, NY, USA, 1990. [Google Scholar]
- Tang, T.; Zhao, M.; Wang, D.; Chen, X.; Chen, W.; Xie, C.; Ding, Y. Does environmental interpretation impact public ecological flow experience and responsible behavior? A case study of Potatso National Park, China. Int. J. Environ. Res. Public Health 2022, 19, 9630. [Google Scholar] [CrossRef]
- Ballantyne, R.; Packer, J.; Falk, J. Visitors’ learning for environmental sustainability: Testing short- and long-term impacts of wildlife tourism experiences using structural equation modelling. Tour. Manag. 2011, 32, 1243–1252. [Google Scholar] [CrossRef]
- Stern, P.C. Toward a coherent theory of environmentally significant behavior. J. Soc. Issues 2000, 56, 407–424. [Google Scholar] [CrossRef]
- Liu, J.; An, K.; Jang, S. A model of tourists’ civilized behaviors: Toward sustainable coastal tourism in China. J. Destin. Mark. Manag. 2020, 16, 100437. [Google Scholar] [CrossRef]
- Chiu, Y.T.H.; Lee, W.I.; Chen, T.H. Environmentally responsible behavior in ecotourism: Antecedents and implications. Tour. Manag. 2014, 40, 321–329. [Google Scholar] [CrossRef]
- Kiatkawsin, K.; Han, H. Young travelers’ intention to behave pro-environmentally: Merging the value-belief-norm theory and the expectancy theory. Tour. Manag. 2017, 59, 76–88. [Google Scholar] [CrossRef]
- Kaiser, F.G.; Fuhrer, U. Ecological behavior’s dependency on different forms of knowledge. Appl. Psychol. 2003, 52, 598–613. [Google Scholar] [CrossRef]
- Guagnano, G.A.; Stern, P.C.; Dietz, T. Influences on attitude-behavior relationships: A natural experiment with curbside recycling. Environ. Behav. 1995, 27, 699–718. [Google Scholar] [CrossRef]
- Nisbet, E.K.; Zelenski, J.M.; Murphy, S.A. The nature relatedness scale: Linking individuals’ connection with nature to environmental concern and behavior. Environ. Behav. 2009, 41, 715–740. [Google Scholar] [CrossRef]
- Otto, J.E.; Ritchie, J.R.B. The service experience in tourism. Tour. Manag. 1996, 17, 165–174. [Google Scholar] [CrossRef]
- Wu, H.C.; Li, T. A study of experiential quality, perceived value, heritage image, experiential satisfaction, and behavioral intentions for heritage tourists. J. Hosp. Tour. Res. 2017, 41, 904–944. [Google Scholar] [CrossRef]
- Amin, M.; Aldakhil, A.M.; Wu, C.; Rezaei, S.; Cobanoglu, C. The structural relationship between TQM, employee satisfaction and hotel performance. Int. J. Contemp. Hosp. Manag. 2017, 29, 1256–1278. [Google Scholar] [CrossRef]
- Sweeney, J.C.; Soutar, G.N. Consumer perceived value: The development of a multiple item scale. J. Retail. 2001, 77, 203–220. [Google Scholar] [CrossRef]
- Zheng, W.; Qiu, H.; Morrison, A.M.; Wei, W.; Zhang, X. Landscape and unique fascination: A dual-case study on the antecedents of tourist pro-environmental behavioral intentions. Land 2022, 11, 479. [Google Scholar] [CrossRef]
- Stern, M.J.; Powell, R.B.; Hill, D. Environmental education program evaluation in the new millennium: What do we measure and what have we learned? Environ. Educ. Res. 2014, 20, 581–611. [Google Scholar] [CrossRef]
- Wang, H.; Ye, J.; Tarin, M.W.K.; Liu, Y.; Zheng, Y. Tourists’ safety perception clues in the urban forest environment: Visual quality, facility completeness, accessibility—A case study of urban forests in Fuzhou, China. Int. J. Environ. Res. Public Health 2022, 19, 1293. [Google Scholar] [CrossRef] [PubMed]
- Lee, J.Z.; Janel, M. Solar aquaculture with smart monitoring system. Evol. Electr. Electron. Eng. 2023, 4, 225–231. [Google Scholar]
- Fang, W.T.; Lien, C.Y.; Huang, Y.W.; Han, G.; Shyu, G.S.; Chou, J.Y.; Ng, E. Environmental literacy on ecotourism: A study on student knowledge, attitude, and behavioral intentions in China and Taiwan. Sustainability 2018, 10, 1886. [Google Scholar] [CrossRef]
- Agardy, T.; Di Sciara, G.N.; Christie, P. Mind the gap: Addressing the shortcomings of marine protected areas through large scale marine spatial planning. Mar. Policy 2011, 35, 226–232. [Google Scholar] [CrossRef]
- Newton, A.; Brito, A.C.; Icely, J.D.; Derolez, V.; Clara, I.; Angus, S.; Schernewski, G.; Inácio, M.; Lillebø, A.I.; Sousa, L.P.; et al. Assessing, quantifying and valuing the ecosystem services of coastal lagoons. J. Nat. Conserv. 2018, 44, 50–65. [Google Scholar] [CrossRef]
- Halpern, B.S.; Frazier, M.; Potapenko, J.; Casey, K.S.; Koenig, K.; Longo, C.; Lowndes, J.S.S.; Rockwood, R.C.; Selig, E.R.; Selkoe, K.A. Recent pace of change in human impact on the world’s ocean. Sci. Rep. 2019, 9, 11609. [Google Scholar] [CrossRef]
- Postel, S.L.; Daily, G.C.; Ehrlich, P.R. Human appropriation of renewable fresh water. Science 1996, 271, 785–788. [Google Scholar] [CrossRef]
- Gray, D.L.; Canessa, R.; Rollins, R.; Keller, C.P.; Dearden, P. Incorporating recreational users into marine protected area planning: A study of recreational boating in British Columbia, Canada. Environ. Manag. 2022, 46, 169–180. [Google Scholar] [CrossRef]
- McKercher, B. Towards a taxonomy of tourism products. Tour. Manag. 2016, 54, 196–208. [Google Scholar] [CrossRef]
- Alleway, H.K.; Gillies, C.L.; Bishop, M.J.; Waters, T.; Jones, R. The ecosystem services of marine aquaculture: Valuing benefits to people and nature. BioScience 2019, 69, 59–68. [Google Scholar] [CrossRef]
- Lewin, W.-C.; Weltersbach, M.S.; Ferter, K.; Hyder, K.; Mugerza, E.; Arlinghaus, R.; Strehlow, H.V. Potential environmental impacts of recreational fishing on marine fish stocks and ecosystems. Rev. Fish. Sci. Aquac. 2020, 28, 287–330. [Google Scholar] [CrossRef]
- Arlinghaus, R.; Alós, J.; Beardmore, B.; Daedlow, K.; Dorow, M.; Fujitani, M.; Hühn, D.; Haider, W.; Hunt, L.M.; Johnson, B.M. Understanding and managing freshwater recreational fisheries as complex adaptive social-ecological systems. Rev. Fish. Sci. Aquac. 2017, 25, 1–41. [Google Scholar] [CrossRef]
- Cooke, S.J.; Twardek, W.M.; Lennox, R.J.; Zolderdo, A.J.; Bower, S.D.; Gutowsky, L.F.G.; Nyboer, E.A.; Reid, A.J.; Januchowski-Hartley, F.A.; Darimont, C.T. The nexus of fun and nutrition: Recreational fishing is also about food. Fish Fish. 2018, 19, 201–224. [Google Scholar] [CrossRef]
- Kroodsma, D.A.; Mayorga, J.; Hochberg, T.; Miller, N.A.; Boerder, K.; Ferretti, F.; Wilson, A.; Bergman, B.; White, T.D.; Block, B.A. Tracking the global footprint of fisheries. Science 2018, 359, 904–908. [Google Scholar] [CrossRef]
- Fabinyi, M.; Belton, B.; Dressler, W.H.; Knudsen, B.; Adhuri, D.S.; Aziz, A.A.; Akintola, S.L.; Kitolelei, J.; Zhou, W.; Williams, M.J. Coastal transitions: Small-scale fisheries, livelihoods, and maritime zone developments in Southeast Asia. J. Rural Stud. 2022, 91, 184–194. [Google Scholar] [CrossRef]
- Newton, A.; Icely, J.; Cristina, S.; Perillo, G.M.E.; Turner, R.E.; Ashan, D.; Cragg, S.; Luo, Y.; Tu, C.; Li, Y.; et al. Anthropogenic, direct pressures on coastal wetlands. Front. Ecol. Evol. 2023, 11, 1079721. [Google Scholar] [CrossRef]
- Popper, A.N.; Hastings, M.C. The effects of anthropogenic sources of noise on fishes. J. Fish Biol. 2009, 75, 455–489. [Google Scholar] [CrossRef] [PubMed]
- Gotelli, N.J.; Ellison, A.M. A Primer of Ecological Statistics, 2nd ed.; Sinauer Associates: Sunderland, MA, USA, 2013. [Google Scholar]
- Slabbekoorn, H.; Bouton, N.; van Opzeeland, I.; Coers, A.; ten Cate, C.; Popper, A.N. A noisy spring: The impact of globally rising underwater sound levels on fish. Trends Ecol. Evol. 2010, 25, 419–427. [Google Scholar] [CrossRef] [PubMed]
- Basset, A.; Barbone, E.; Elliott, M.; Li, B.L.; Jorgensen, S.E.; Lucena-Moya, P.; Mouillot, D. A unifying approach to understanding transitional waters: Fundamental properties emerging from ecotone ecosystems. Estuar. Coast. Shelf Sci. 2013, 132, 5–16. [Google Scholar] [CrossRef]
- Steven, R.; Pickering, C.; Guy, M. A review of the impacts of nature-based recreation on birds. J. Environ. Manag. 2011, 92, 2287–2294. [Google Scholar] [CrossRef]
Disclaimer/Publisher’s Note: The statements, opinions and data contained in all publications are solely those of the individual author(s) and contributor(s) and not of MDPI and/or the editor(s). MDPI and/or the editor(s) disclaim responsibility for any injury to people or property resulting from any ideas, methods, instructions or products referred to in the content. |
© 2025 by the authors. Licensee MDPI, Basel, Switzerland. This article is an open access article distributed under the terms and conditions of the Creative Commons Attribution (CC BY) license (https://creativecommons.org/licenses/by/4.0/).

