Abstract
China’s Yangtze and Yellow River Basins exhibit divergent drought patterns, yet the underlying mechanisms driving these differences remain underexplored. This study compares their drought characteristics from 1961 to 2022 using the Standardized Precipitation Index, Standardized Precipitation Evapotranspiration Index, and Palmer Drought Severity Index, and identifies their drivers through attribution models and interpretable machine learning. Our results reveal two distinct paradigms: the Yangtze Basin is characterized by high-frequency, over 14% in all seasons, short-duration droughts, reflecting a rapid hydrological response, while the Yellow River Basin experiences low-frequency, long-duration events indicative of strong soil moisture memory. Quantitative attribution demonstrates that atmospheric evaporative demand (VPD) plays a significantly greater role in the Yellow River Basin, contributing over 20% to soil drought, far exceeding its 14.4% contribution in the Yangtze Basin. Furthermore, their large-scale drivers differ fundamentally: the Yangtze Basin responds primarily to the Atlantic Multidecadal Oscillation (AMO) and Arctic Oscillation (AO), whereas the Yellow River Basin is mainly influenced by solar activity and the El Niño-Southern Oscillation (ENSO). These findings reveal that Yangtze drought is primarily driven by precipitation deficits, while Yellow River drought is a composite phenomenon amplified by evaporative demand. This distinction underscores the need for basin-specific water management strategies.
1. Introduction
Drought, as a recurrent and complex natural hazard, has evolved into a formidable global challenge under the backdrop of climate change [1,2,3,4]. Anthropogenic global warming has altered precipitation patterns. More critically, it raises temperatures and intensifies atmospheric evaporative demand, often quantified by Vapor Pressure Deficit (VPD). These changes have significantly increased the frequency, intensity, and duration of drought events, leading to the phenomenon of hotter droughts [5,6,7]. Within this global context, the East Asian monsoon region stands out as an area of high sensitivity to climate change, where the response of the hydroclimatic system is particularly complex and critical [8,9]. China, as one of the nations most vulnerable to drought, is experiencing profound socioeconomic and ecological impacts across its major river basins [10,11].
The Yangtze and Yellow River Basins, serving as cradles of Chinese civilization and core engines of the nation’s socioeconomic development, collectively support over 40% of the national population and are indispensable to its food security and economic output [12,13,14]. However, these two geographically adjacent mega-basins exhibit contrasting hydroclimatic characteristics. The Yangtze River Basin is characterized by a humid subtropical monsoon climate with abundant water resources, whereas the Yellow River Basin traverses semi-arid to arid continental climate zones, defined by a fragile water resource baseline and high rates of evaporation [15,16,17]. This inherent hydroclimatic gradient suggests that their response pathways to climate change may be fundamentally different [18,19]. A thorough diagnosis of the spatiotemporal disparities in drought characteristics between these two basins is therefore essential for formulating effective water resource management and climate adaptation strategies.
Previous research has extensively documented drought patterns in China using a variety of metrics, including the Standardized Precipitation Index (SPI), the Standardized Precipitation Evapotranspiration Index (SPEI), and the Palmer Drought Severity Index (PDSI) [20,21,22,23]. Studies focusing on the Yangtze River Basin, for instance, have often highlighted the role of monsoon variability in triggering short-term meteorological droughts [24,25,26,27,28], while research on the Yellow River Basin has concentrated more on long-term soil moisture deficits exacerbated by warming-induced evapotranspiration [29,30,31,32]. However, these studies have predominantly focused on individual basins or single drought indices, which has, to some extent, limited a holistic understanding of drought as a multi-faceted phenomenon. More importantly, a comprehensive comparative framework that systematically integrates spatial patterns, temporal trends, seasonal variations, event characteristics, and underlying physical drivers remains notably absent. This knowledge gap hinders our comprehension of why two adjacent basins evolve into distinctly different drought paradigms and the associated hydro-thermal balance and external forcing mechanisms.
The scientific imperative to address these disparities is profound. The Yangtze and Yellow River Basins are not only critical ecological zones but are also intrinsically linked to China’s national strategies, such as the South-to-North Water Diversion Project and the Sustainable Development Goals [33,34,35]. The divergence in their drought patterns can amplify their respective vulnerabilities: the water scarcity in the Yellow River Basin may heighten food security risks, while the increasing frequency of abrupt drought-flood transitions in the Yangtze River Basin poses greater challenges for flood control and reservoir operation [36,37]. By systematically quantifying these differences, this study aims to provide critical observational evidence for the physical mechanisms of drought evolution, particularly the differentiated roles of hydrothermal coupling and teleconnections, which is vital for enhancing predictive modeling and informing targeted policy-making.
To this end, this study conducts a comprehensive and systematic comparison of drought characteristics in the Yangtze and Yellow River Basins from 1961 to 2022, utilizing SPI-3, SPEI-3, and PDSI. The specific objectives are as follows: (1) to characterize the spatiotemporal disparities in drought climatology and long-term trends in the two basins; (2) to systematically compare the core characteristics of drought events and their seasonal variations; (3) to elucidate the differential roles of hydrothermal coupling by analyzing VPD anomalies during drought periods; (4) to identify and compare the key large-scale teleconnection drivers using an explainable machine learning model, SHapley Additive exPlanations (SHAP); and (5) to quantitatively attribute the contributions of precipitation deficits and atmospheric evaporative demand to different types of drought through multiple regression modeling. The findings are expected to deepen the understanding of basin-scale response pathways to global change under different climatic backgrounds and hold significant scientific value for developing differentiated water resource management and climate change adaptation strategies tailored to regional characteristics.
2. Materials and Methods
2.1. Study Area and Data
This study focuses on China’s two major river basins: the Yangtze River Basin and the Yellow River Basin (Figure 1). These basins are vital for the nation’s water resources, agriculture, and economy, supporting over a third of its population and ensuring food and ecological security. However, they are characterized by distinct and increasingly divergent hydroclimatic regimes, making their comparative study critical for understanding regional responses to climate change.
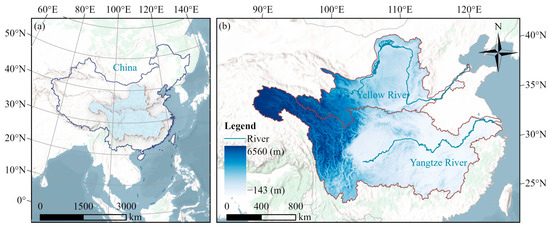
Figure 1.
The geographic location and topography of the study area: (a) the location of the Yangtze River Basin and Yellow River Basin within China; (b) the topography of the two basins.
The Yangtze River Basin, located in southern China, is the nation’s largest river system, with a catchment area of approximately 1.8 million km2. Originating from the Tibetan Plateau, the river flows about 6300 km eastward to the East China Sea. The basin’s topography exhibits a distinct three-step ladder, descending from west to east. Except for the alpine climate in its headwater region, the majority of the YRB is dominated by a humid subtropical monsoon climate. This results in significant spatiotemporal heterogeneity in precipitation, with hot, wet summers and cold, dry winters. Spatially, annual precipitation shows a clear decreasing gradient from the southeastern coastal areas towards the northwestern inland regions. In contrast, the Yellow River Basin, home to China’s second-longest river, spans approximately 5464 km with a catchment area of around 750,000 km2. It primarily traverses northern China, originating from the Tibetan Plateau and emptying into the Bohai Sea. The basin is characterized by an arid to semi-arid climate with sharp seasonal contrasts, featuring cold, dry winters with minimal precipitation. Its climate is predominantly temperate continental monsoon, and compared to the Yangtze River Basin, it receives less annual precipitation, has higher evaporative potential, and is more vulnerable to persistent, long-duration drought events. Topographically, it encompasses the Loess Plateau, a region prone to severe soil erosion and water scarcity. These two basins thus represent starkly different hydrological regimes—a water-abundant, monsoon-dominated system in the Yangtze versus a water-scarce system highly sensitive to climatic variability in the Yellow River—making them an ideal setting for a comparative analysis of drought.
The meteorological data required for this study were sourced from the China High-resolution Multi-source Merged Precipitation (CHM_PRE) gridded dataset, provided by the National Tibetan Plateau Data Center (https://data.tpdc.ac.cn/en/data/e5c335d9-cbb9-48a6-ba35-d67dd614bb8c, accessed on 10 August 2025). This dataset, with a spatial resolution of 0.1°, was selected for its high accuracy in capturing the complex precipitation patterns across the study basins. The remaining meteorological variables, including daily mean, maximum, and minimum air temperature, relative humidity, wind speed, and sunshine duration, were sourced from the extensive ground observation network of the China Meteorological Administration (http://data.cma.cn/, accessed on 10 August 2025). To create spatially continuous fields consistent with the precipitation data, these station-based observations were interpolated onto a 0.1° × 0.1° grid using the Inverse Distance Weighting (IDW) method. Prior to interpolation, the station-based data underwent rigorous quality control, with only stations exhibiting data completeness exceeding 95% over the entire study period being selected. Any minor missing values were imputed using linear regression based on data from the nearest neighboring stations. All gridded datasets, covering the period 1961–2022, were then aggregated to a monthly timescale for the subsequent calculation of the various drought indices and atmospheric demand metrics.
To investigate the influence of large-scale climate teleconnections, eight major circulation indices were selected. These indices represent key modes of oceanic and atmospheric variability known to modulate the East Asian monsoon system, precipitation, and temperature in China [38,39,40,41]. Data on the Arctic Oscillation (AO), the Southern Oscillation Index (SOI), the El Niño-Southern Oscillation (ENSO, Niño 3.4), the Pacific Decadal Oscillation (PDO), the North Atlantic Oscillation (NAO), and the Atlantic Multidecadal Oscillation (AMO) were obtained from the NOAA Physical Sciences Laboratory (https://psl.noaa.gov/gcos_wgsp/Timeseries/, accessed on 15 January 2025). The sunspot number (SS) was sourced from the Solar Influences Data Analysis Center (https://www.sidc.be/SILSO/datafiles, accessed on 16 January 2025), and the Antarctic Oscillation (AAO) was obtained from the homepage of Professor Jianping Li (http://lijianping.cn/dct/page/1, accessed on 16 January 2025).
2.2. Standardized Precipitation Index (SPI)
To characterize meteorological drought, this study utilizes SPI, a widely recognized probabilistic index recommended by the World Meteorological Organization (WMO) for its robustness and spatial comparability [42,43]. The primary strength of the SPI lies in its multi-scalar nature, which allows for the assessment of precipitation deficits over various accumulation periods, thereby reflecting different components of the hydrological system.
The calculation of SPI transforms a time series of aggregated precipitation into a standardized normal distribution. This process begins by fitting a probability distribution to the precipitation data. The two-parameter Gamma distribution is commonly chosen for this task, as its probability density function (PDF) effectively models the skewed nature of precipitation data [44]:
where and are the shape and scale parameters, respectively, and is the gamma function. The shape (α) and scale (β) parameters are estimated for each grid cell and for each month of the year using the Maximum Likelihood Estimation (MLE) method. To handle instances of zero precipitation, which are common in arid and semi-arid regions, the cumulative probability is adjusted using a mixed distribution:
Here, is the cumulative probability from the Gamma distribution, and represents the empirical probability of zero precipitation in the time series. The resulting cumulative probability is then converted to a Z-score (the SPI value) through an inverse normal transformation. This final value quantitatively represents the deviation from the median precipitation in units of standard deviation. For this research, we focused on the 3-month SPI (SPI-3) to capture seasonal drought conditions. The calculation of SPI, as well as SPEI described in the next section, was performed using the SPEI package in the R programming environment [20].
2.3. Standardized Precipitation Evapotranspiration Index (SPEI)
While the SPI effectively captures precipitation deficits, it overlooks the critical role of temperature in modulating drought severity. To address this limitation, we also employed the SPEI, developed by Vicente-Serrano et al. [20]. The SPEI retains the multi-scalar framework and probabilistic nature of the SPI but is based on a climatic water balance () rather than precipitation alone. The climatic water balance is calculated as the monthly difference between precipitation () and potential evapotranspiration ():
In this study, PET was calculated using the Penman–Monteith equation, as standardized by the Food and Agriculture Organization (FAO-56). This physically based method is widely regarded as the standard for estimating reference evapotranspiration, as it comprehensively incorporates thermodynamic and aerodynamic principles by utilizing data on solar radiation, air temperature, humidity, and wind speed [45]. Its application provides a more robust estimate of atmospheric evaporative demand compared to simpler temperature-based models. Since the water balance series () can contain negative values, the Gamma distribution is not appropriate. Therefore, the SPEI calculation utilizes a three-parameter log-logistic distribution to fit the data series. The cumulative distribution function (CDF) is given by the following:
where , , and are the scale, shape, and origin parameters, respectively, which are estimated from the aggregated series. These parameters were estimated using the L-moment method, following the standard procedure for the log-logistic distribution. Similarly to the SPI, the resulting probability was then transformed into a standard normal variable to yield the SPEI value. This allows for a direct comparison of drought severity between the two indices. We calculated the 3-month SPEI (SPEI-3) to assess the impact of temperature on seasonal drought conditions.
2.4. Palmer Drought Severity Index (PDSI)
To assess agricultural drought dynamics, which incorporate the cumulative “memory” of soil moisture conditions, this study utilized the original PDSI. Developed by Palmer [46], the PDSI is a foundational index that quantifies long-term moisture anomalies based on a monthly supply-and-demand water balance model.
The calculation begins by determining the monthly moisture departure (), which is the difference between actual precipitation () and the “Climatically Appropriate For Existing Conditions” (CAFEC) precipitation ():
Here, represents the amount of precipitation required to maintain a normal water balance for a given location and is calculated from the climatically expected evapotranspiration, recharge, and runoff. This departure, , is then weighted by a location-specific climatic characteristic coefficient () to produce the Palmer Z-Index (), a measure of short-term moisture anomaly:
The weighting coefficient is crucial for standardizing the index across different climates and seasons. It is calculated for each month as follows:
Crucially, this equation contains an empirical constant, , which Palmer originally set to 17.67 based on data from nine stations across seven states in the central United States. To better adapt the index to the climatic conditions of our study region, we adopted a modified version of the PDSI specifically calibrated for China. This approach follows the methodology used by Zhong et al. [47], which itself is based on the China National Standard for Classification of Meteorological Drought [48]. According to this standard, the constant a was adjusted to 16.84 using extensive climatological data from China to ensure the index’s appropriate application across the nation. This modification ensures that the weighting of moisture departures is more representative of the hydroclimatic regimes found across China.
The final PDSI value () is derived through a recursive formula that integrates the current month’s moisture anomaly () with the drought/wetness condition of the preceding month (). This gives the index its characteristic long-term memory:
The constants 0.897 and 1/3 are empirical persistence factors originally derived from data for the central United States. While these factors are based on U.S. data, they have been widely adopted in PDSI applications in China, this approach has been validated to effectively capture long-term drought dynamics in China’s diverse climates. It is this recursive structure that allows the PDSI to reflect the cumulative impact of persistent moisture deficits or surpluses, making it a robust indicator for long-term agricultural drought.
2.5. Vapor Pressure Deficit (VPD)
To quantify the atmospheric evaporative demand, a key driver of drought intensification, the VPD was calculated. VPD represents the “drying power” of the atmosphere and is defined as the difference between the mean saturation vapor pressure () and the actual vapor pressure ():
A critical consideration in calculating monthly mean is the non-linear relationship between temperature and saturation vapor pressure (described by the Clausius-Clapeyron relation). Directly using the mean monthly temperature in the calculation can lead to a significant underestimation of the true monthly average . Therefore, following standard climatological practices [45], we first calculated the saturation vapor pressures corresponding to the mean daily maximum () and minimum () temperatures, and then averaged them to obtain a more accurate monthly mean :
The instantaneous saturation vapor pressure, , as a function of temperature ( in °C), was determined using the widely adopted Tetens formula:
The actual vapor pressure () was then derived from the calculated mean saturation vapor pressure () and the monthly mean relative humidity (RH, in %):
This approach ensures a physically robust estimation of VPD, which is crucial for understanding the role of atmospheric demand in exacerbating drought conditions.
To specifically investigate the response of atmospheric evaporative demand during drought events, we calculated the conditional mean VPD anomaly. Specifically, for each grid cell, a “drought period” was first identified based on different drought indices and their respective thresholds: a month was defined as a drought month if SPI-3 or SPEI-3 fell below −0.5, or if PDSI fell below −1.0 [20,42,46]. Subsequently, the VPD anomaly for each month was calculated relative to its long-term (1961–2022) monthly climatology. Finally, for each grid cell, we exclusively extracted all VPD anomaly values occurring within its drought period and computed their arithmetic mean. This resultant value quantifies the average magnitude by which atmospheric demand typically deviates from the norm when a specific type of drought occurs.
3. Results
3.1. Spatiotemporal Distribution and Long-Term Trends of Drought
To characterize the overall spatial patterns and climatological characteristics of drought in the Yangtze and Yellow River Basins, this study calculated the long-term mean values of three drought indices—SPI-3, SPEI-3, and PDSI—for the period 1961 to 2022. Their spatial distributions are presented in Figure 2.
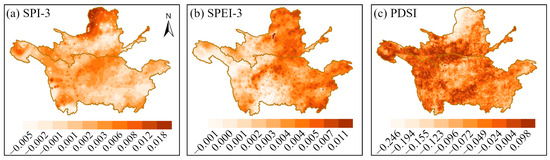
Figure 2.
The spatial distribution of the long-term mean (1961–2022) of drought indices in the Yangtze and Yellow River basins: (a) SPI-3; (b) SPEI-3; (c) PDSI.
The long-term mean spatial distributions of SPI-3 and SPEI-3 (Figure 2a,b) exhibit a high degree of consistency. Across the vast majority of both basins, their values hover close to zero, which is consistent with the theoretical expectation that the long-term mean of standardized indices should approach zero. However, subtle regional nuances emerge upon closer inspection. The northern part of the Yellow River Basin displays faintly positive values, indicating a marginally wetter climatology. In contrast, the Yangtze River Basin exhibits greater homogeneity, with most of its area residing in a state of strict climatological normality. In stark contrast, the long-term mean PDSI (Figure 2c) reveals significant and geographically distinct drought patterns, with pronounced inter-basin disparities. Within the Yangtze River Basin, a persistent climatological drought is highly concentrated in the upstream headwaters, indicating that this region experiences chronic moisture deficit stress. Conversely, the middle and lower Yangtze plains are generally near normal or slightly wet. In the Yellow River Basin, the climatologically drought-prone areas are predominantly located in the Loess Plateau of the middle reaches and the southern parts of the basin. While the drought intensity here is less severe than in the upper Yangtze, its spatial extent is considerably broader. Notably, the headwater region of the Yellow River does not exhibit a comparable drought state to that of the Yangtze source region under PDSI; instead, it remains close to climatologically normal conditions.
The study further investigated the monthly time series of the three drought indices for the Yangtze and Yellow River Basins from 1961 to 2022 (Figure 3).
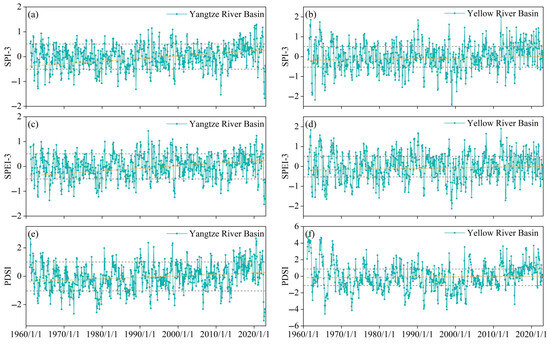
Figure 3.
Monthly evolution and long-term trends of drought indices in the Yangtze and Yellow River basins. (a,c,e) The time series of SPI-3, SPEI-3, and PDSI for the Yangtze River basin, respectively; (b,d,f) the time series for the Yellow River basin.
The results reveal pronounced disparities in the long-term drought trends between the two basins. The drought evolution in the Yangtze River Basin exhibits a discernible wetting trend, suggesting a sustained amelioration of the basin’s overall hydroclimatic conditions. This is particularly evident since the 21st century, with a significant increase in the frequency and intensity of wet events and a corresponding decrease in the occurrence of severe droughts. The basin’s hydroclimatic state is primarily characterized by high-frequency interannual fluctuations oscillating around a relatively stable climatological mean. While notable drought events were observed in the late 1960s and late 1970s, interspersed with periods of varying wetness, these events did not alter the long-term, stable overall pattern. The evolutionary trajectories of SPI-3 and SPEI-3 are highly synchronized, indicating that short-term meteorological droughts in the Yangtze River Basin are predominantly driven by precipitation variability. In contrast, the Yellow River Basin experienced a significant transition from arid to humid conditions during the study period, with more dramatic fluctuations in its drought indices. This transition is most vividly captured by the PDSI (Figure 3f), which not only corroborates this wetting trend but also illuminates the underlying physical processes. From the 1960s to the 1980s, the PDSI in the Yellow River Basin remained persistently in a negative phase, signifying a prolonged and severe period of soil drought. However, a fundamental shift occurred after the turn of the 21st century: the PDSI not only recovered swiftly to above-zero values but also recently reached its peak for the entire study period. This indicates a fundamental and sustained improvement in the basin’s soil moisture conditions. The ability of the PDSI to capture this unique trend likely stems from its comprehensive formulation, which is sensitive not only to precipitation but also integrates the influence of temperature on evapotranspiration and the “memory effect” of soil moisture. Consequently, it provides a more holistic reflection of the long-term, integrated transformation of hydroclimatic conditions in the Yellow River Basin under a changing climate.
Based on run theory, drought events from 1961 to 2022 were identified to analyze the spatial patterns of four core characteristics: duration, frequency, intensity, and peak intensity (Figure 4). The analysis reveals two distinctly different drought regimes in the Yangtze and Yellow River Basins. The Yellow River Basin is characterized by a “long-duration, low-frequency” drought regime. As shown in Figure 4a–c, the average duration of droughts in this basin is generally prolonged, with the upper reaches standing out as the core region with the longest drought durations across the entire study area. Conversely, its drought frequency is the lowest in the study area (Figure 4d–f), indicating that when drought events occur in this region, they tend to be persistent but are not frequent overall. In stark contrast, the Yangtze River Basin exhibits a “short-duration, high-frequency” regime, signifying that its droughts are predominantly characterized by frequent, short-term events. Corresponding to the patterns of duration and frequency, drought intensity also exhibits a clear north–south dichotomy. Drought events in the Yellow River Basin are, on the whole, less intense. Both the average intensity (Figure 4g–i) and peak intensity (Figure 4j–l) are lower than those in the Yangtze River Basin across most of the area. This suggests that the severity of extreme drought events is comparatively milder in the Yellow River Basin. The Yangtze River Basin, therefore, emerges as a hotspot for high-intensity and extreme drought events. All three indices demonstrate a high degree of agreement in revealing the aforementioned macroscopic north–south divergence. The results from SPI-3 and SPEI-3 are highly similar in their spatial detail, collectively characterizing the features of meteorological drought. The spatial patterns derived from PDSI, however, are smoother and more spatially coherent, better reflecting the conditions of long-term, cumulative soil moisture deficits.
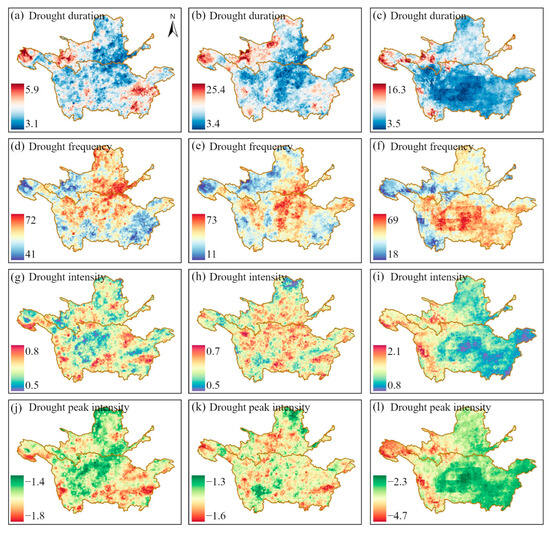
Figure 4.
Spatial differentiation of drought characteristics in the Yangtze and Yellow River Basins. Rows represent four different characteristics: (a–c) mean duration (months); (d–f) frequency (events per 62 years); (g–i) mean intensity; and (j–l) mean peak intensity. Columns correspond to the results derived from the three indices: SPI-3 (left), SPEI-3 (middle), and PDSI (right).
Figure 5 illustrates the spatial distribution of long-term trends in drought conditions across the Yangtze and Yellow River Basins from 1961 to 2022. All three indices consistently reveal significant spatial heterogeneity in these trends. Spatially, a predominant trend towards intensified drought is evident across large portions of the study area. Specifically, a minority area within the Yellow River Basin, primarily concentrated in its upper headwaters, exhibits a wetting trend, with most of this region passing the significance test. This indicates significant alleviation of seasonal meteorological and comprehensive drought conditions in the upper Yellow River over the past six decades. Similarly, the Yangtze River Basin displays significant wetting trends on the eastern margin of the Tibetan Plateau (upstream) and in the Taihu Lake basin (downstream), a phenomenon potentially linked to enhanced monsoonal precipitation. The hotspots with the most severe aridification are primarily located around the Sichuan Basin in the Yangtze River Basin and in parts of the middle and upper reaches of the Yellow River Basin. A comparison of the indices shows that the drying trend indicated by SPEI-3 is more intense than that of SPI-3. Numerous areas that show non-significant or weak trends under SPI-3 exhibit significant aridification when assessed with SPEI-3. This discrepancy unequivocally demonstrates that the exacerbation of evapotranspiration, driven by rising temperatures, plays a critical amplifying role in the desiccation process within both basins. The PDSI exhibits even more pronounced spatial contrasts, suggesting its heightened sensitivity to long-term shifts in the water balance. These inter-index differences offer important insights into the influence of various climatic elements and hydrological processes on the evolution of drought in these basins.
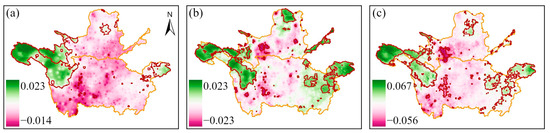
Figure 5.
The spatial distribution of drought index trends in the Yangtze River Basin and the Yellow River Basin during 1961–2022: (a) SPI-3; (b) SPEI-3; and (c) PDSI. Trends were estimated using Sen’s slope, and the outlined areas indicate regions with significant trends (p < 0.05) based on the Mann–Kendall test.
3.2. Seasonal Differences in Drought
To investigate the seasonal differences in drought characteristics between the Yangtze and Yellow River Basins, this study quantitatively evaluated three key dimensions: intensity, affected area, and frequency (Figure 6). The boxplots (Figure 6a,d,g) illustrate the distributional characteristics of the drought indices for the four seasons in both basins. A salient feature is that, across all seasons and for all indices, drought intensity is consistently higher in the Yellow River Basin than in the Yangtze River Basin. The median and lower quartile values of the drought indices in the Yellow River Basin are lower than those in the Yangtze, indicating a more severe average drought state. Furthermore, the wider interquartile and whisker ranges, along with a greater number of extreme low-value outliers, demonstrate that droughts in the Yellow River Basin are not only more intense but also exhibit greater interannual variability and a higher propensity for extreme events.
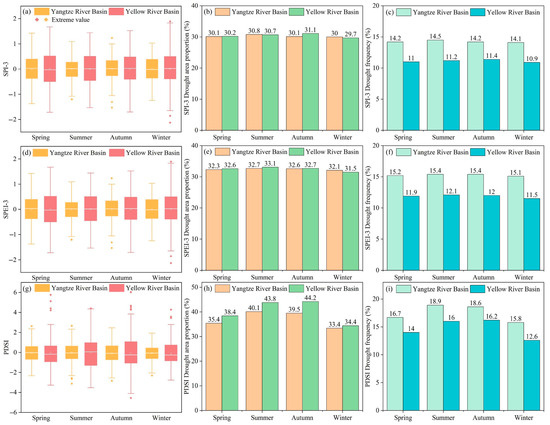
Figure 6.
Seasonal comparison of drought characteristics in the Yangtze River Basin and the Yellow River Basin. Panels (a,d,g) show the boxplots of SPI-3, SPEI-3, and PDSI, respectively. Panels (b,e,h) represent the seasonal drought area proportion for each index. Panels (c,f,i) illustrate the seasonal drought frequency for each index.
The analysis of the drought-affected area reveals divergent patterns among the indices. Based on SPI-3 and SPEI-3 (Figure 6b,e), the proportion of area affected by drought at the seasonal scale shows little difference between the two basins, hovering around 30–33% for both. This suggests that the spatial extent of short-term meteorological and comprehensive droughts is comparable. In stark contrast, the PDSI-based analysis yields distinctly different results (Figure 6h). The area affected by long-term drought in the Yellow River Basin is significantly larger than in the Yangtze River Basin across all seasons. This is especially pronounced in summer and autumn, when its drought-affected area proportions reach as high as 40.1% and 44.2%, respectively, far exceeding the 39.5% and 33.4% in the Yangtze River Basin. While the PDSI-defined drought areas are similar in winter, the Yellow River Basin still shows a significantly larger affected area in spring (38.4% vs. 35.4%). This indicates that, despite having a similar extent of short-term droughts, droughts in the Yellow River Basin are more prone to accumulating and evolving into more spatially extensive, long-term soil droughts.
Contrary to the findings on intensity and area, drought frequency is systematically higher in the Yangtze River Basin than in the Yellow River Basin (Figure 6c,f,i). Across all indices and seasons, the drought frequency in the Yangtze River Basin consistently surpasses that of the Yellow River Basin. For instance, according to SPEI-3 (Figure 6f), the drought frequency in the Yangtze River Basin exceeds 15% in all four seasons, whereas it remains between 11.5% and 12.1% in the Yellow River Basin. The PDSI results (Figure 6i) further accentuate this difference, with the summer drought frequency in the Yangtze River Basin reaching as high as 18.9%, compared to only 16.0% in the Yellow River Basin. This result demonstrates that the Yangtze River Basin is more frequently impacted by drought events, particularly during summer and autumn.
3.3. VPD Atmospheric Evaporative Demand Response During Droughts
To further investigate the physical driving mechanisms underlying different types of drought, this study analyzed the frequency of positive Vapor Pressure Deficit (VPD) anomalies during drought periods (Figure 7).
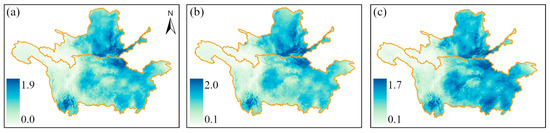
Figure 7.
Spatial distribution of VPD anomaly during drought periods in the Yangtze and Yellow River Basins. (a) SPI-3; (b) SPEI-3; (c) PDSI.
A higher frequency of positive VPD anomalies indicates a greater probability of co-occurrence between drought and atmospheric conditions of high evaporative potential, such as high temperatures and low humidity. Under short-term drought scenarios, the Yellow River Basin exhibits a stronger “hot-dry” coupling characteristic. As shown in Figure 7a, when drought is defined by SPI-3, the high-frequency regions of VPD anomalies are primarily concentrated in the middle and lower reaches of the Yellow River Basin, with local frequency values reaching up to 1.9. This indicates that the occurrence of short-term meteorological drought in the Yellow River Basin is highly synchronized with sharp increases in atmospheric demand. In contrast, the VPD anomaly frequency in the Yangtze River Basin under this scenario is generally lower, exhibiting localized high values only around the Sichuan Basin and in its southwestern corner. This spatial pattern is further corroborated under short-term comprehensive droughts defined by SPEI-3 (Figure 7b), demonstrating the robustness of this finding for short timescales. This suggests that seasonal droughts in the Yellow River Basin are more inclined to manifest as “hot” droughts, characterized by a strong coupling of precipitation deficits and high-temperature stress.
However, under long-term drought scenarios, the spatial pattern undergoes a significant shift, and the “hot-dry” coupling effect in the Yangtze River Basin is accentuated. When drought is defined by PDSI (Figure 7c), the overall VPD anomaly frequency across the Yangtze River Basin is significantly enhanced compared to the short-term scenarios, indicating that its drought state is strongly associated with persistent, high atmospheric evaporative demand. Although high-VPD-response zones still exist in the Yellow River Basin, the overall thermal characteristic of the Yangtze River Basin becomes more pronounced. This shift reveals a key phenomenon: while short-term droughts in the Yellow River Basin are more readily accompanied by high temperatures, once a drought in the Yangtze River Basin develops into a far-reaching, long-term event, the underlying high-temperature drivers and the amplifying effect of atmospheric demand play a more critical and persistent role. This implies that long-term drought in the Yangtze River Basin is a type of cumulative “hot drought” that is more dependent on persistent anomalies in thermal conditions.
3.4. Identification of Large-Scale Drivers of Drought
To investigate the non-linear impacts and relative contributions of large-scale climate teleconnections on drought in the Yangtze and Yellow River Basins, we employed the SHAP model to interpret the trained Random Forest models. The results (Figure 8) not only quantify the importance of each factor but, more critically, reveal their directional and complex influences, highlighting significant differences in the drought driving mechanisms between the two basins.
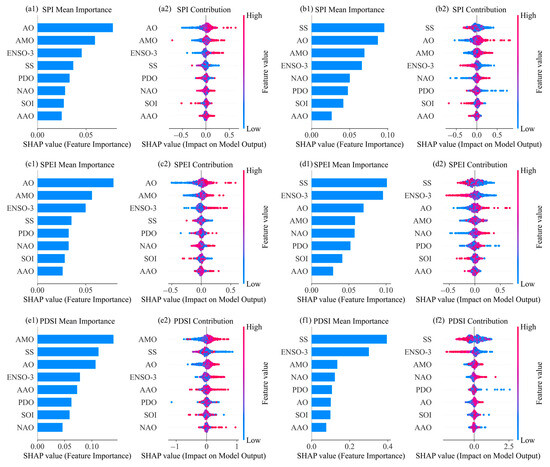
Figure 8.
The relative importance and contribution of large-scale climate factors to drought, as revealed by the SHAP model. The left column (a,c,e) displays results for the Yangtze River Basin, and the right column (b,d,f) displays results for the Yellow River Basin. The rows represent different drought indices: (a,b) for SPI-3, (c,d) for SPEI-3, and (e,f) for PDSI. For each panel, (a1,b1,c1,d1,e1,f1) show the SHAP mean importance, and (a2,b2,c2,d2,e2,f2) show the SHAP summary contribution.
The drought conditions in the Yangtze River Basin are predominantly modulated by circulation systems originating from the Atlantic and high latitudes. This conclusion demonstrates high consistency and robustness across all three drought indices: SPI-3, SPEI-3, and PDSI (Figure 8(a1,c1,e1)). The AMO emerges as the most critical driver of drought in the Yangtze River Basin, with its importance far exceeding that of other factors. The contribution plots (Figure 8(a2,c2,e2)) clearly elucidate its mechanism: the positive phase of the AMO is almost exclusively associated with positive SHAP values. This provides strong evidence that a warm AMO phase mitigates drought risk in the Yangtze River Basin through specific ocean-atmosphere teleconnection pathways. Conversely, its negative phase contributes mainly to negative SHAP values, thereby exacerbating drought conditions. Following the AMO, the AO and the ENSO-3 index, also play important roles. Similarly to the AMO, the positive phases of both the AO and ENSO-3 tend to alleviate drought. Notably, from the perspective of long-term drought, the importance of SS elevates it to one of the top two drivers (Figure 8(e1)). The SHAP contribution plot reveals that high values of SS (indicative of an active solar period, shown as red dots) are significantly associated with the exacerbation of drought. This suggests that the long-term soil drought conditions in the Yangtze River Basin are profoundly modulated by both the decadal variability of Atlantic sea surface temperatures and long-term solar activity.
In the Yellow River Basin, SS stands out as the primary driver of drought evolution. For both SPI-3 and SPEI-3, the mean SHAP value of SS is significantly higher than that of all other factors (Figure 8(b1,d1)). The contribution plots (Figure 8(b2,d2)) reveal a strong negative relationship, unequivocally demonstrating that enhanced solar activity is a key factor in intensifying short-term droughts in the Yellow River Basin. This relationship becomes even more pronounced for long-term drought (Figure 8(f1,f2)), where the mean SHAP importance of SS (exceeding 0.3) is substantially greater than that of the secondary driver, ENSO-3 (approximately 0.2). This indicates that the persistent, cumulative droughts in the Yellow River Basin are highly coupled with the cyclical variations in solar activity. Apart from SS, ENSO-3 is the second most important driver for the Yellow River Basin. In this case, El Niño events tend to exacerbate drought conditions.
Furthermore, a comparison of the results across the different drought indices reveals that from the precipitation-only SPI, to the SPEI which considers temperature effects, and finally to the PDSI which incorporates soil moisture memory, the magnitude of the SHAP values for the dominant drivers (SS and ENSO-3) shows a significant increasing trend. This suggests that the impact of solar activity and El Niño events on the Yellow River Basin is not merely a function of reduced precipitation; rather, their influence is dramatically amplified when the effects of warming-induced evapotranspiration and antecedent soil moisture deficits are included. This finding holds significant scientific merit for understanding how external forcings can exacerbate regional drought through hydrothermal coupling processes under a global warming context.
4. Discussion
4.1. Differences in Drought Patterns Between the Yangtze River Basin and the Yellow River Basin
This study reveals, through a multi-dimensional analysis, two distinctly different drought paradigms in the Yangtze and Yellow River Basins. The Yangtze River Basin is predominantly characterized by “short-duration, high-frequency” drought events, whereas the Yellow River Basin exhibits a pattern of “long-duration, low-frequency” events. To investigate the physical mechanisms underlying these patterns, we quantified the propagation from short-term droughts, as characterized by SPI-3 and SPEI-3, to long-term soil drought, represented by PDSI, through a lagged correlation analysis (Figure 9). The results clearly elucidate two different modes of drought evolution. In the Yangtze River Basin (Figure 9a), the correlation between both SPI-3 and SPEI-3 and PDSI peaks at lag 0 before undergoing a rapid, exponential decay. This signifies that the Yangtze River Basin functions as a classic “pulse-response” system. Its humid climate and robust vegetation cover render the basin’s soil moisture extremely sensitive to short-term precipitation and evapotranspiration anomalies, with a nearly instantaneous feedback loop and virtually no lag. The system possesses a short hydrological memory, where the impact of a meteorological drought is quickly attenuated by new moisture inputs, thus preventing the formation of long-term cumulative effects. This provides a direct physical explanation for the observed pattern of frequent yet short-lived drought events in the basin.
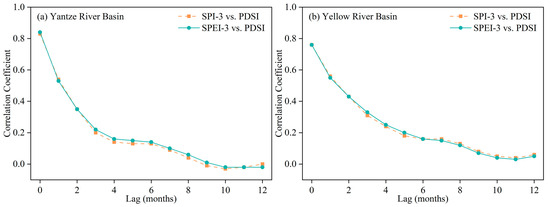
Figure 9.
Lagged response of drought propagation in (a) the Yangtze River Basin and (b) the Yellow River Basin. Approximately 83% of the lagged correlations are statistically significant (p < 0.05).
In stark contrast, the drought propagation process in the Yellow River Basin (Figure 9b) exhibits significant characteristics of cumulative memory. Although the correlation also peaks at lag 0, the subsequent attenuation of the curve is far more gradual than in the Yangtze River Basin. The impact of a short-term meteorological drought does not dissipate quickly; a relatively high correlation with PDSI is maintained at lags of 2–3 months. This pronounced lagged effect provides direct evidence of the stronger soil moisture memory in the Yellow River Basin, particularly within its semi-arid regions. The moisture deficit from a single meteorological drought event has a more profound and lasting impact on soil moisture conditions, accumulating with antecedent and subsequent meteorological conditions, which facilitates its evolution into a far-reaching, long-term drought. This process of slow accumulation and recovery provides the core physical explanation for the basin’s macroscopic characteristic of “long-duration, low-frequency” droughts.
4.2. Contribution of Precipitation Deficits and Atmospheric Evaporative Demand to Drought
To quantitatively partition the relative contributions of precipitation deficits and atmospheric evaporative demand in the formation of different drought types, this study constructed a multiple linear regression model. The model uses standardized SPI-3 and VPD anomalies as independent variables to explain the variance in the standardized SPEI-3 or PDSI (dependent variable). Contributions are calculated as the product of each standardized regression coefficient and its correlation with the dependent variable, normalized to percentages of the total explained variance. The model uses SPI-3 and VPD anomalies as independent variables to explain the variance in the comprehensive short-term drought index, SPEI-3, and the long-term soil drought index, PDSI, respectively. The attribution results (Table 1) clearly reveal the different roles of the thermal factor in the drought driving mechanisms of the two basins and quantify its amplified role in the propagation of drought from short-term to long-term.

Table 1.
Relative contribution of SPI-3 and VPD anomaly to different drought indices.
First, a significant divergence in the role of the thermal factor is evident between the two basins. For short-term SPEI-3, although precipitation deficit is the absolutely dominant contributor, the contribution of VPD in the Yellow River Basin is nearly threefold that in the Yangtze River Basin. This result provides strong quantitative evidence for this study’s core finding—that the Yellow River Basin exhibits a stronger hot-dry coupling characteristic—indicating that short-term droughts in this basin are not merely precipitation-driven events but rather composite droughts driven by both water and thermal factors. Furthermore, the contribution of the thermal factor shows a consistent and significant increase from SPEI-3 to PDSI in both basins. In the Yangtze River Basin, the contribution of VPD to PDSI (14.43%) is more than double its contribution to SPEI-3. In the already more thermally sensitive Yellow River Basin, this amplification effect is even more pronounced, with the contribution of VPD to PDSI increasing to 20.74%. This demonstrates that persistent anomalies in atmospheric evaporative demand act as a critical amplifier, propelling the accumulation of short-term meteorological droughts into more profound, long-term soil droughts. By continuously depleting soil moisture, it hinders the system’s recovery, thereby reinforcing the soil moisture memory effect, an impact that is particularly prominent in the Yellow River Basin.
4.3. Causal Mechanisms and Implications of Drought Differences Between the Basins
A systematic dissection of the differences in drought characteristics, evolutionary trends, and driving factors between the Yangtze and Yellow River Basins is a scientific prerequisite for revealing their underlying physical causes, elucidating their divergent response pathways to global change, and formulating differentiated coping strategies. The comprehensive analysis in this study demonstrates that the disparities between the two basins are not a mere collection of isolated phenomena but are instead rooted in two fundamentally different drought paradigms: the Yangtze River Basin functions as a responsive system primarily driven by moisture supply, whereas the Yellow River Basin operates as a cumulative system driven by hydrothermal composite stress.
The formation of these two paradigms originates from the intrinsic differences in the hydrological systems of the two basins. The semi-arid climatic background and unique underlying surface conditions of the Yellow River Basin have shaped a cumulative system with long-term memory. The impact of a single precipitation deficit event can be superimposed upon subsequent conditions, making its drought processes more prone to evolving into long-duration events with a more gradual propagation process. In contrast, the humid and active water cycle of the Yangtze River Basin establishes it as a short-term memory response system. Its response to and recovery from climatic perturbations are rapid, which prevents the long-term accumulation of drought but also renders it more sensitive to the high-frequency moisture fluctuations brought by the monsoon.
Furthermore, these intrinsic properties determine the different dimensions of sensitivity to external drivers, thereby shaping distinctly different driving mechanisms. As a “moisture-sensitive” system, the drought risk in the Yangtze River Basin is principally dependent on long-range moisture transport; consequently, large-scale circulation patterns that directly modulate these moisture pathways become its dominant drivers. The Yellow River Basin, however, is a “hydrothermally sensitive” system, with its water balance being extremely sensitive to both the precipitation “input” and the evapotranspiration “output”.
Finally, while this study systematically reveals the causal mechanisms of drought disparities, our findings also highlight several critical areas for future research. First, the “pulse-response” paradigm of the Yangtze River Basin, characterized by its rapid hydrological response and high-frequency droughts, suggests it may be particularly susceptible to flash droughts. The strong coupling we observed between atmospheric evaporative demand and long-term PDSI droughts in the Yangtze implies that sudden spikes in temperature and VPD could rapidly deplete soil moisture, triggering these abrupt events. Future research should therefore focus on using high-frequency, multi-source remote sensing data to investigate the specific mechanisms and predictability of flash droughts within this responsive system. Second, the “cumulative memory” system of the Yellow River Basin, where droughts are long-lasting and driven by a hydrothermal composite, points to a higher risk of compound drought and heatwave events. Our attribution analysis, which quantified a >20% contribution from VPD to soil drought, provides a direct quantitative basis for this risk. A critical future direction is to explore how antecedent soil moisture deficits precondition the land surface for more intense and prolonged heatwaves. Lastly, our analysis did not explicitly account for human activities, which can significantly modulate these natural paradigms. For instance, the extensive network of reservoirs in the Yangtze River Basin may alter its natural “pulse-response” dynamics, while large-scale irrigation and ecological restoration projects in the Yellow River Basin could influence its soil moisture memory and response to evaporative demand. Therefore, future studies should aim to integrate human activity data into attribution frameworks to disentangle their effects from climate-driven changes, leading to a more holistic understanding of drought in these heavily managed basins. This is particularly relevant for understanding key hydroclimatic shifts, such as the pronounced wetting trend observed in the Yellow River Basin during the 21st century. While our analysis links the basin’s drought variability to large-scale natural modes like ENSO and solar activity, this recent wetting is likely a complex interplay of such natural decadal oscillations and the aforementioned human activities (e.g., ecological restoration). Acknowledging this complexity, we recognize the limitation of our climate-focused study in fully explaining this trend. A quantitative separation of these drivers remains a critical challenge and a priority for future research.
5. Conclusions
This study, through a systematic and comparative analysis of the spatiotemporal evolution, core characteristics, physical processes, and driving mechanisms of drought in the Yangtze and Yellow River Basins from 1961 to 2022, reveals that despite their geographical proximity, the two basins represent two fundamentally different drought paradigms in terms of their intrinsic properties and response mechanisms. The main conclusions of this study are summarized as follows:
- The two basins exhibit significant and systematic disparities in the spatiotemporal evolution and seasonal characteristics of drought. In terms of temporal evolution, the hydroclimatic conditions in the Yangtze River Basin are characterized by high-frequency interannual fluctuations with a relatively stable long-term trend. In contrast, the Yellow River Basin has undergone a profound decadal shift, transitioning from a state of persistent drought in the 20th century to significant wetting in the 21st century. Spatially, the climatologically drought-prone areas in the Yangtze River Basin are primarily concentrated in the upstream headwaters, whereas in the Yellow River Basin, they are located in the Loess Plateau of the middle reaches. As clearly illustrated in our analysis (Figure 6), seasonal comparisons further accentuate these differences: drought intensity is higher and the area affected by PDSI is larger in the Yellow River Basin, especially in summer and autumn, while the drought frequency is systematically higher in the Yangtze River Basin.
- The differences in drought event characteristics are rooted in distinct physical processes. Droughts in the Yangtze River Basin are characterized by “high-frequency, short-duration, and high-intensity” events. Its humid climatic background dictates that the basin’s hydrological system is extremely sensitive to short-term meteorological fluctuations, which prevents the effective accumulation of drought impacts and results in a weak soil moisture memory effect. In contrast, droughts in the Yellow River Basin are characterized by “low-frequency, long-duration” events. This is closely related to its stronger soil moisture memory effect under a semi-arid climate, where the impact of a single moisture deficit event lingers longer in the soil, allowing the drought process to accumulate and propagate over time.
- The role of the thermal factor in drought formation shows a significant regional divergence. Quantitative attribution analysis reveals, based on a multiple linear regression model using standardized variables, that drought in the Yangtze River Basin is typically “moisture-driven,” with the formation of short-term droughts almost entirely dependent on precipitation deficits. In the Yellow River Basin, however, the contribution of VPD to drought formation is substantially higher, making it a distinctly “hydrothermal composite” system, where VPD contributes over 20% to the variance of long-term soil drought. This finding quantitatively confirms the high sensitivity of the Yellow River Basin to thermal conditions and reveals that warming has become a key amplifying factor in exacerbating drought severity in the basin.
- Droughts in the two basins respond to different large-scale climate systems. The drought conditions in the Yangtze River Basin primarily respond to the Atlantic and high-latitude circulation systems that modulate East Asian moisture transport. In contrast, drought in the Yellow River Basin is highly coupled with external forcing factors such as solar activity and ENSO, which can simultaneously influence both water and thermal conditions. This dichotomy has critical implications for water resource management. For example, long-range drought forecasts for the Yangtze could be improved by incorporating AMO phase predictions, while seasonal to interannual water allocation strategies in the water-scarce Yellow River Basin should closely monitor ENSO forecasts and solar cycle activity to anticipate potential shifts in water availability.
Author Contributions
Conceptualization, L.Y.; Data curation, H.L. and Y.W.; Formal analysis, D.W.; Funding acquisition, L.Y.; Investigation, D.W.; Methodology, L.Y. and Y.W.; Project administration, L.Y.; Resources, L.Y.; Software, L.Y. and T.W.; Supervision, L.Y.; Validation, H.Z.; Visualization, H.Z. and X.W.; Writing—original draft; L.Y., T.W. and H.L.; Writing—review and editing, L.Y. and H.L. All authors have read and agreed to the published version of the manuscript.
Funding
This research was funded by the Key Projects of Natural Science Research in Universities of Anhui Province, grant number 2024AH051178, 2024AH051172, 2023AH052941, the Key Projects of Natural Science Research in the University of Bengbu, grant number 2024ZR04zd, and the University-Enterprise Cooperative Project 00013387, 00014110, 00014127.
Data Availability Statement
The original contributions presented in this study are included in the article. Further inquiries can be directed to the corresponding authors.
Conflicts of Interest
The authors declare no conflicts of interest.
References
- Intergovernmental Panel on Climate Change. Climate Change 2022–Impacts, Adaptation and Vulnerability: Working Group II Contribution to the Sixth Assessment Report of the Intergovernmental Panel on Climate Change; Cambridge University Press: Cambridge, UK, 2023. [Google Scholar] [CrossRef]
- Walsh, J.E.; Ballinger, T.J.; Euskirchen, E.S.; Hanna, E.; Mard, J.; Overland, J.E.; Tangen, H.; Vihma, T. Extreme weather and climate events in northern areas: A review. EARTH-Sci. Rev. 2020, 209, 103324. [Google Scholar] [CrossRef]
- Cook, B.I.; Mankin, J.S.; Anchukaitis, K.J. Climate Change and Drought: From Past to Future. Curr. Clim. Change Rep. 2018, 4, 164–179. [Google Scholar] [CrossRef]
- Spinoni, J.; Naumann, G.; Vogt, J.V.; Barbosa, P. The biggest drought events in Europe from 1950 to 2012. J. Hydrol. Reg. Stud. 2015, 3, 509–524. [Google Scholar] [CrossRef]
- Cook, B.I.; Mankin, J.S.; Marvel, K.; Williams, A.P.; Smerdon, J.E.; Anchukaitis, K.J. Twenty-First Century Drought Projections in the CMIP6 Forcing Scenarios. Earth’s Future 2020, 8, e2019EF001461. [Google Scholar] [CrossRef]
- Mishra, A.K.; Singh, V.P. A review of drought concepts. J. Hydrol. 2010, 391, 204–216. [Google Scholar] [CrossRef]
- Yuan, W.; Zheng, Y.; Piao, S.; Ciais, P.; Lombardozzi, D.; Wang, Y.; Ryu, Y.; Chen, G.; Dong, W.; Hu, Z.; et al. Increased atmospheric vapor pressure deficit reduces global vegetation growth. Sci. Adv. 2019, 5, eaax1396. [Google Scholar] [CrossRef]
- Chen, F.; Xu, Q.; Chen, J.; Birks, H.J.B.; Liu, J.; Zhang, S.; Jin, L.; An, C.; Telford, R.J.; Cao, X.; et al. East Asian summer monsoon precipitation variability since the last deglaciation. Sci. Rep. 2015, 5, 11186. [Google Scholar] [CrossRef]
- Huang, J.; Yu, H.; Guan, X.; Wang, G.; Guo, R. Accelerated dryland expansion under climate change. Nat. Clim. Change 2015, 6, 166–171. [Google Scholar] [CrossRef]
- Xu, K.; Yang, D.; Yang, H.; Li, Z.; Qin, Y.; Shen, Y. Spatio-temporal variation of drought in China during 1961–2012: A climatic perspective. J. Hydrol. 2015, 526, 253–264. [Google Scholar] [CrossRef]
- Wang, A.; Lettenmaier, D.P.; Sheffield, J. Soil Moisture Drought in China, 1950–2006. J. Clim. 2011, 24, 3257–3271. [Google Scholar] [CrossRef]
- Piao, S.; Ciais, P.; Huang, Y.; Shen, Z.; Peng, S.; Li, J.; Zhou, L.; Liu, H.; Ma, Y.; Ding, Y.; et al. The impacts of climate change on water resources and agriculture in China. Nature 2010, 467, 43–51. [Google Scholar] [CrossRef]
- Varis, O.; Kummu, M.; Lehr, C.; Shen, D. China’s stressed waters: Societal and environmental vulnerability in China’s internal and transboundary river systems. Appl. Geogr. 2014, 53, 105–116. [Google Scholar] [CrossRef]
- Yu, M.; Liu, X.; Li, Q. Responses of meteorological drought-hydrological drought propagation to watershed scales in the upper Huaihe River basin, China. Environ. Sci. Pollut. Res. 2020, 27, 17561–17570. [Google Scholar] [CrossRef]
- Cai, W.; Li, K.; Liao, H.; Wang, H.; Wu, L. Weather conditions conducive to Beijing severe haze more frequent under climate change. Nat. Clim. Change 2017, 7, 257–262. [Google Scholar] [CrossRef]
- Liu, L.; Liu, Z.; Ren, X.; Fischer, T.; Xu, Y. Hydrological impacts of climate change in the Yellow River Basin for the 21st century using hydrological model and statistical downscaling model. Quat. Int. 2011, 244, 211–220. [Google Scholar] [CrossRef]
- Zhang, Q.; Gu, X.; Singh, V.P.; Kong, D.; Chen, X. Spatiotemporal behavior of floods and droughts and their impacts on agriculture in China. Glob. Planet. Change 2015, 131, 63–72. [Google Scholar] [CrossRef]
- Liu, Q.; Yang, Y.; Liang, L.; Jun, H.; Yan, D.; Wang, X.; Li, C.; Sun, T. Thresholds for triggering the propagation of meteorological drought to hydrological drought in water-limited regions of China. Sci. Total Environ. 2023, 876, 162771. [Google Scholar] [CrossRef] [PubMed]
- Liu, Q.; Liang, L.; Sun, T.; Wang, X.; Li, C.; Yan, S. Assessment of the shift in the precipitation-streamflow relationship influenced by multiyear drought, Yellow River basin, China. Sci. Total Environ. 2023, 903, 166203. [Google Scholar] [CrossRef] [PubMed]
- Vicente-Serrano, S.M.; Beguería, S.; López-Moreno, J.I. A Multiscalar Drought Index Sensitive to Global Warming: The Standardized Precipitation Evapotranspiration Index. J. Clim. 2010, 23, 1696–1718. [Google Scholar] [CrossRef]
- Sheffield, J.; Wood, E.F.; Roderick, M.L. Little change in global drought over the past 60 years. Nature 2012, 491, 435–438. [Google Scholar] [CrossRef]
- Sun, F.; Mejia, A.; Zeng, P.; Che, Y. Projecting meteorological, hydrological and agricultural droughts for the Yangtze River basin. Sci. Total Environ. 2019, 696, 134076. [Google Scholar] [CrossRef]
- Lu, J.; Qin, T.; Yan, D.; Zhang, X.; Jiang, S.; Yuan, Z.; Xu, S.; Gao, H.; Liu, H. Drought and wetness events encounter and cascade effect in the Yangtze River and Yellow River Basin. J. Hydrol. 2024, 639, 131608. [Google Scholar] [CrossRef]
- Bai, W.; Zhang, C.; Xiao, X.; Zou, Z.; Liu, Z.; Li, P.; Tang, J.; Li, T.; Zhou, X.; Peng, C. Characteristics of Meteorological Drought Evolution in the Yangtze River Basin. Water 2024, 16, 3391. [Google Scholar] [CrossRef]
- Tang, S.; Qiao, S.; Wang, B.; Liu, F.; Feng, T.; Yang, J.; He, M.; Chen, D.; Cheng, J.; Feng, G.; et al. Linkages of unprecedented 2022 Yangtze River Valley heatwaves to Pakistan flood and triple-dip La Niña. npj Clim. Atmos. Sci. 2023, 6, 44. [Google Scholar] [CrossRef]
- Jiang, L.; Gao, W.; Zhu, K.; Zheng, J.; Ren, B. Why Did the Extreme Drought in the Yangtze River Basin in 2022 Break the 2019 Record? Earth Space Sci. 2025, 12, e2024EA003972. [Google Scholar] [CrossRef]
- Chen, S.; Qiu, R.; Chen, Y.; Gong, W.; Han, G. Impacts of Drought and Heatwave on the Vegetation and Ecosystem in the Yangtze River Basin in 2022. Remote Sens. 2024, 16, 2889. [Google Scholar] [CrossRef]
- Duan, A.; Zhong, Y.; Xu, G.; Yang, K.; Tian, B.; Wu, Y.; Bai, H.; Hu, E. Quantifying the 2022 extreme drought in the Yangtze River Basin using GRACE-FO. J. Hydrol. 2024, 630, 130680. [Google Scholar] [CrossRef]
- Xiang, K.; Song, W.; Lu, J.; Zhao, A.; Lu, Y.; Feng, T.; Liu, H.; Gui, R.; Chen, L. Investigating the drought propagation dynamics between meteorological and groundwater drought in the Yellow River Basin, China. J. Hydrol. 2025, 660, 133446. [Google Scholar] [CrossRef]
- Xu, D.; Wang, M.; Zhang, Q.; Wu, S.; Zhang, L. Spatiotemporal characteristics and meteorological driving factors of flash droughts in the Yellow River Basin, China. Ecol. Indic. 2025, 177, 113745. [Google Scholar] [CrossRef]
- Li, Q.; Cao, Y.; Miao, S.; Huang, X. Spatiotemporal Characteristics of Drought and Wet Events and Their Impacts on Agriculture in the Yellow River Basin. Land 2022, 11, 556. [Google Scholar] [CrossRef]
- Ding, Y.; Zhang, L.; He, Y.; Cao, S.; Wei, X.; Guo, Y.; Ran, L.; Filonchyk, M. Spatiotemporal evolution of agricultural drought and its attribution under different climate zones and vegetation types in the Yellow River Basin of China. Sci. Total Environ. 2024, 914, 169687. [Google Scholar] [CrossRef]
- Cai, X. Water stress, water transfer and social equity in Northern China—Implications for policy reforms. J. Environ. Manag. 2008, 87, 14–25. [Google Scholar] [CrossRef]
- Liu, S.; Wang, D.; Wu, M.; Ma, Y.; Yang, Z.; Liu, X. Study on the Spatiotemporal Evolution of Evapotranspiration and the Integration of Multi-Source Data in the Water Source Area of the Middle Route of the South-to-North Water Transfer Project. Atmosphere 2025, 16, 396. [Google Scholar] [CrossRef]
- Shen, J.; Nie, Y.; Huang, X.; Ma, M. Comprehensive Assessment of Water Resource Carrying Capacity Based on Improved Matter–Element Extension Modeling. Water 2025, 17, 1197. [Google Scholar] [CrossRef]
- Chen, Y.; Yan, Y.; Zhu, T. Water Market Development in the Yellow River Basin: Challenges and Opportunities. Water 2024, 16, 894. [Google Scholar] [CrossRef]
- Zhou, C.; Wang, G.; Jiang, H.; Li, S.; Shi, X.; Hu, Y.; Cabral, P. Spatio-temporal patterns of compound dry-hot extremes in China. Atmos. Res. 2025, 314, 107795. [Google Scholar] [CrossRef]
- Wang, C.; Yao, Y.; Wang, H.; Sun, X.; Zheng, J. The 2020 Summer Floods and 2020/21 Winter Extreme Cold Surges in China and the 2020 Typhoon Season in the Western North Pacific. Adv. Atmos. Sci. 2021, 38, 896–904. [Google Scholar] [CrossRef]
- Jin, T.; Zhou, Y.; Zhou, P.; Zheng, Z.; Zhou, R.; Wei, Y.; Zhang, Y.; Jin, J. Spatiotemporal Evolution of Precipitation Concentration in the Yangtze River Basin (1960–2019): Associations with Extreme Heavy Precipitation and Validation Using GPM IMERG. Remote Sens. 2025, 17, 2732. [Google Scholar] [CrossRef]
- Xu, K.; Zhu, C.; He, J. Linkage between the dominant modes in Pacific subsurface ocean temperature and the two type ENSO events. Chin. Sci. Bull. 2012, 57, 3491–3496. [Google Scholar] [CrossRef]
- Wang, B.; Wu, R.; Fu, X. Pacific–East Asian Teleconnection: How Does ENSO Affect East Asian Climate. J. Clim. 2000, 13, 1517–1536. [Google Scholar] [CrossRef]
- Mckee, T.B.; Doesken, N.J.; Kleist, J.R. The relationship of drought frequency and duration to time scales. In Proceedings of the 8th Conference on Applied Climatology, Anaheim, CA, USA, 17–22 January 1993. [Google Scholar]
- Hayes, M.; Svoboda, M.; Wall, N.; Widhalm, M. The Lincoln Declaration on Drought Indices: Universal Meteorological Drought Index Recommended. Bull. Am. Meteorol. Soc. 2011, 92, 485–488. [Google Scholar] [CrossRef]
- Guttman, N.B. Accepting the standardized precipitation index: A calculation algorithm. JAWRA J. Am. Water Resour. Assoc. 1999, 35, 311–322. [Google Scholar] [CrossRef]
- Allan, R.; Pereira, L.; Smith, M. Crop Evapotranspiration-Guidelines for Computing Crop Water Rrequirements-FAO Irrigation and Drainage Paper 56; FAO: Rome, Italy, 1998; Volume 56. [Google Scholar]
- Palmer, W. Meteorological Drought; Research Paper No. 45; US Department of Commerce, Weather Bureau: Silver Spring, MD, USA, 1965; 58p.
- Zhong, R.; Chen, X.; Lai, C.; Wang, Z.; Lian, Y.; Yu, H.; Wu, X. Drought monitoring utility of satellite-based precipitation products across mainland China. J. Hydrol. 2019, 568, 343–359. [Google Scholar] [CrossRef]
- GB/T 20481-2006; Classification of Meteorological Drought. Standards Press of China: Beijing, China, 2006.


Disclaimer/Publisher’s Note: The statements, opinions and data contained in all publications are solely those of the individual author(s) and contributor(s) and not of MDPI and/or the editor(s). MDPI and/or the editor(s) disclaim responsibility for any injury to people or property resulting from any ideas, methods, instructions or products referred to in the content. |
© 2025 by the authors. Licensee MDPI, Basel, Switzerland. This article is an open access article distributed under the terms and conditions of the Creative Commons Attribution (CC BY) license (https://creativecommons.org/licenses/by/4.0/).