Article

Characterization of Non-Constant Flow in the Recession Process of Pressurized Pipelines with Air Valves

1
School of Water Resources and Hydroelectric Engineering, Xi’an University of Technology, Xi’an 710048, China
2
Shaanxi Hanjiang-to-Weihe River Water Diversion Project Construction Co., Ltd., Xi’an 710010, China
3
Powerchina Northwest Engineering Co., Ltd., Xi’an 710100, China
*
Author to whom correspondence should be addressed.
Water 2025, 17(20), 3022; https://doi.org/10.3390/w17203022
Submission received: 18 June 2025 / Revised: 28 September 2025 / Accepted: 16 October 2025 / Published: 21 October 2025
(This article belongs to the Special Issue Hydrodynamics in Pressurized Pipe Systems)

Abstract

Emptying pressure pipelines is a routine operation during pipeline maintenance. This study investigates the emptying characteristics of pressurized pipelines with air valves under unsteady flow conditions. A mathematical model for the emptying process is developed using the rigid water column theory, exploring the influence of drain valve opening, initial air pocket length, and valve opening patterns on the transient flow behavior. The results indicate that, compared with the linear valve opening pattern, a nonlinear power function opening increases the minimum air pocket pressure head by 0.1014 m and delays its occurrence by 0.655 s. The maximum emptying velocity rises by 0.48 m/s when the opening is increased from 10% to 30%, thereby shortening the emptying time by 65.4%. However, the pressure head inside the air pocket decreases accordingly. When the air valve diameter is enlarged from 0.003 mm to 0.008 mm, the pressure recovery time is markedly reduced and the initial pressure fluctuations are attenuated. Numerical simulations based on the Heihe emptying case demonstrate that a well-planned layout of multiple air valves effectively shortens the duration of negative pressure heads. Replacing the first air valve with a 50 cm diameter circular orifice significantly raises the minimum pressure head of the pipeline and dramatically enhances the stability of emptying pressurized pipeline.

1. Introduction

Long-distance water transfer projects constitute a direct and effective means of mitigating the spatio-temporal imbalance of water resources and alleviating urban water shortages. Thanks to their high efficiency and low leakage rates, pressurized pipelines have been widely deployed in such projects as well as in municipal distribution networks. Accelerated urbanization and growing worldwide demand for hydraulic infrastructure have driven these conveyance systems towards ever-larger scales and increasingly complex configurations, rendering the transient phenomena encountered during pipeline emptying operations more intricate and variable. During emptying, the failure of air valves, overly rapid opening of drain valves, or excessive emptying velocities can readily induce sub-atmospheric pressures and severe pressure surges, potentially triggering catastrophic events such as pipeline collapse [1]. Consequently, an in-depth investigation of transient flow in the emptying of pressurized pipelines is of paramount importance.
Compared with the emptying process, the transient behavior during the filling of water transmission pipelines has hitherto received more extensive attention in the literature [2,3]. Currently, studies on the draining process of pressurized pipelines are primarily based on the filling process [4], and the specification of parameters such as draining velocity and the degree of drain valve opening during draining also draws from pipeline filling procedures. Zhang et al. [5] compared several rapid empty-pipe filling schemes, analyzing the impact of filling velocity on the hydraulic characteristics of hump pipes with air valves, and concluded that filling schemes for long-distance pipeline systems with velocities not exceeding 0.3 m/s are overly conservative and inefficient. Zhou et al. [6] developed a numerical simulation model for rapid pipeline filling with multiple entrapped air pockets to investigate the hydraulics-pneumatics transient flow during water conveyance system filling. Liang et al. [7] investigated the filling process under different pipeline inclination angles, analyzing variations in flow velocity, pressure, and gas-liquid two-phase distribution. Their findings indicate that when the pipeline inclination is less than 30°, appropriately increasing the filling velocity can effectively shorten the filling cycle. Ling et al. [8] conducted a numerical analysis of the rapid filling process in bypass pipelines based on an elastic model combined with the polytropic gas law, identifying the rate of air expulsion as the key factor affecting filling efficiency. Yan et al. [9] utilized Fluent for three-dimensional numerical simulation of the filling process in pressurized pipelines, finding that high-flow-rate filling causes intense pressure variations in trapped gas and recommending the adoption of a “low-flow-rate filling principle”. Lin et al. [10] employed a three-dimensional computational fluid dynamics model to study the evolution of the air-water interface in horizontal pipes during filling, observing that residual air can induce severe pressure oscillations leading to violent fluctuations at the interface. Collectively, research on the filling process of pressurized pipelines has revealed the influence of pipeline characteristics, trapped air pockets, filling velocity, air valves, and other factors on unsteady flow during filling, providing a theoretical foundation for studying the draining process.
The draining of pressurized pipelines generally falls into two scenarios: one involves emptying the fluid for pipeline maintenance and repair, and the other requires diverting excess flow through a bypass pipeline or drain outlet when the pipeline flow rate is too high. Coronado-Hernández et al. [11] designed an experimental setup to study two typical draining scenarios, with air valves either failing or functioning normally. They complemented this with computational fluid dynamics (CFD) simulations to investigate the influence of trapped air pocket size, valve opening rate, and valve opening time on pressure variations within the pipe. Their results identified the amount of reverse airflow as the primary factor affecting draining stability. Paternina-Verona et al. [12] proposed a 3D model to simulate the emptying process in a single pipeline, incorporating a PVOF model and a two-equation turbulence model. The model is used to capture more detailed flow characteristics—such as pressure and velocity patterns of discrete air pockets, contours of air and water velocity distributions, and temperature variations during air pocket expansion. Laanearu et al. [13] analyzed the movement of the air-water interface within pipes through experiments and simple numerical modeling. Experimental measurements of flow rate, water level changes, and pressure variations during draining were compared with results from a control volume model, revealing that the draining velocity is determined collectively by cavity pressure, siphon outflow, pipe friction resistance, and leakage at the pipe tail. Besharat et al. [14] proposed a computational model based on the rigid water column model to simulate transient phenomena in single pipes, validating it with experimental results. They concluded that the model could accurately predict experimental outcomes such as pressure variations and negative pressure values. Coronado-Hernández et al. [15] developed a mathematical model to simulate the emptying process in water supply networks. They applied it to a case study, highlighting negative pressure as a critical cause of pipeline collapse. Tijsseling et al. [16] proposed an improved one-dimensional model for rapid pipe draining and filling. This model considered pressure, gravity, friction, the air content at the tail of the water column, and aeration at the front, enabling predictions of the water column’s velocity, length, and position during rapid operations; however, experimental validation was not performed. Fuertes-Miquel et al. [17] reviewed various mathematical models for the water phase, air-water interface, and gas phase during the filling and draining of water pipelines, proposing that computational fluid mechanics offers a better explanation for cavitation dynamics during draining. Tasca et al. [18] developed a one-dimensional Method of Characteristics (MOC) transient flow model incorporating dynamic boundary conditions for air valves and evaluated the model with test data. The model’s key control parameters include the air valve orifice area, the discharge coefficient, and the pipe friction factor. Bian et al. [19] applied a three-action air valve in tandem with a two-stage valve closure to a highly undulating gravity-flow pipeline, raising the minimum pressure head from −10 m to −1.19 m and thereby eliminating the risk of column-separation water hammer. Wu et al. [20] developed a novel staged-exhaust air valve that reduced the pressure peak of water hammer by 29.72% compared with an unprotected case, effectively damping pressure surges. Li et al. [21] provided a combined air-vessel and over-pressure relief-valve strategy that lowered the maximum transient pressure from 1.343 MPa to 1.087 MPa, while simultaneously reducing the air-vessel volume by 20% relative to stand-alone air-vessel protection.
In summary, current research on unsteady flow during pressurized pipeline emptying has primarily focused on analyzing the pressure within the air pocket, the air–water interface, and the evolution of the water level, as shown in Table 1. However, a systematic and quantitative investigation of how key boundary conditions—such as air-valve characteristics (diameter and number) and drain-valve opening—govern critical hydraulic parameters during emptying (e.g., transient discharge, negative-pressure extremes, and emptying efficiency) is still lacking. Consequently, this study develops a two-phase mathematical model of the emptying process for a pressurized pipeline, grounded in an actual engineering case. The study was conducted to quantitatively investigate the effects of the valve operation scheme, valve opening, initial empty segment length, air valve diameter, and the number of air valves on key performance metrics, including drainage velocity, cavity pressure head, and flow rate.
Unlike previous work that relied on piece-wise linear valve opening laws and suffered from abrupt velocity changes, the present study introduces a nonlinear power-law opening schedule. Furthermore, by innovatively coupling the optimisation of air-valve quantity and diameter, a “circular orifice + multi-valve coordination” layout is proposed. This approach enables the quantitative, system-level elucidation of how these specific boundary conditions affect the core hydraulic parameters of the emptying process, thereby providing more accurate theoretical guidance for optimizing emptying operations and ensuring both safety and efficiency.

2. Mathematical Model

2.1. Schematic Diagram of Emptying in Pressurized Pipelines

To analyze the emptying process of a pressurized pipeline, a geometric model of a single-pipe system equipped with air valves is established, as illustrated in Figure 1, for simulating the pipeline emptying procedure.

2.2. Mathematical Model of the Emptying Process

In engineering practice, heat exchange between the fluid and the surroundings is generally neglected; hence, the model considers only the conservation of momentum and mass of the fluid motion. To simplify the analysis, the following basic assumptions are adopted [22]:
(1)
The wall shear stress acting on the water column is assumed constant and is evaluated using the Darcy–Weisbach equation;
(2)
The air–water interface is well-defined and remains parallel to the horizontal plane;
(3)
The characteristic time of the thermodynamic process within the air pocket during emptying is much shorter than the heat-exchange time scale, so the process is treated as adiabatic;
(4)
The pipeline possesses sufficient structural strength to withstand the sub-atmospheric pressures developed during emptying without significant deformation or collapse.

2.2.1. Liquid Phase Model

Based on the principles of momentum and mass conservation, the governing equation for the liquid phase during the emptying process is derived. Under the rigid water column assumption, the entire water body within the pipeline is considered the control volume, indicated by the blue color, with the x-coordinate aligned in the direction of flow. The corresponding free-body diagram is shown in Figure 1.
The force at the upstream end of the control volume is p A s i n θ ; the force at the downstream valve side is p a t m A s i n θ ; the component of the gravity of the water body along the x-axis is L w A s i n θ 2 ρ w g ; the force between the water body and the pipe wall is τ π D L w s i n θ ; the local loss of fluid at the valve is h f . Applying the momentum conservation principle [23]:
p A s i n θ p a t m A s i n θ + L w A s i n θ 2 ρ w g τ π D L w s i n θ h f = A s i n θ L w ρ w d v w d t
In the equation, p represents the absolute pressure of the gas in the cavity (Pa); p a t m represents the standard atmospheric pressure (Pa); A is the interfacial area (m2); θ is the angle between the pipeline and the horizontal plane (rad); L w is the length of the water column (m); ρ w is the density of the fluid (kg/m3); g is the acceleration due to gravity (m/s2); D is the diameter of the pipeline (m); h f is the local head loss of the fluid at the valve (m); v w is the instantaneous average velocity of the fluid in the pipeline (m/s); τ is the shear stress (Pa), which is typically calculated using the Darcy-Weisbach equation [24]:
τ = f ρ w v w v w 8
1 f = 2.0 lg ε 3.7 D + 2.51 Re f
In the equation, f represents the friction coefficient of the pipe wall, calculated using the Colebrook-White formula [25]; ε is the equivalent wall roughness (mm); D is the pipe diameter (mm); and Re is the Reynolds number.
By substituting Equation (2) into Equation (1), and dividing both sides of the equation by A s i n θ L w ρ w , it can be simplified to Equation (4):
p p a t m ρ w L w + g sin θ f v w v w 2 D h f A s i n θ L w ρ w = d v w d t
From mass conservation, the water-column length satisfies [26]:
  L w = L L 0 v w d t
where L represents the total length of the pipeline (m); L 0 represents the initial length of the air pocket (m).
Differentiating Equation (5) with respect to time gives the continuity differential equation:
d L w d t = v w

2.2.2. Gas Phase Model

During emptying, water is treated as an incompressible fluid; hence, over Δt the increase in the empty pipe-section volume equals the volume of water discharged. The air-pocket mass-conservation equation reads [12]:
d m a d t = ρ a 0 v a A a 0
where ρ a 0 is the atmospheric density (kg/m3), v a is the velocity of the gas entering the air valve (m/s), A a 0 is the inlet area of the air valve (m2) and m a is the mass of the gas in the empty section of the pipe (kg), which can be expressed as:
m a = ρ a A s i n θ ( L L w )
where ρ a is the air-pocket density (kg/m3).
Combining Equations (7) and (8) yield the rate of change of the air-pocket density:
d ρ a d t = ρ a 0 v a A a 0 ρ a v w A s i n θ A s i n θ ( L L w )
The air-pocket pressure evolution follows the ideal-gas law together with the expansion–compression equation [27,28,29]:
d p d t = k p V a d V a d t + k p m a d m a d t
where V a is the air-pocket volume ( m 3 ), and k is the polytropic exponent; for an adiabatic process, k = 1.4.

2.2.3. Air Valve Model

To describe the air inflow through the air valve, a dynamic air valve model is established under the following assumptions:
(1)
The air inflow is isentropic;
(2)
The air temperature inside the pipeline is assumed equal to the water temperature;
(3)
Variations in the air volume within the pipeline depend solely on the water outflow.
During emptying, the air pocket expands, and the absolute pressure inside the pipe falls below the ambient atmospheric pressure. Two flow regimes must therefore be considered [30,31]:
Sub-critical flow ( 0.53 p a t m p p a t m ):
d m a d t = C i n A a 0 7 p a t m ρ a 0 p p a t m 1.4286 p p a t m 1.714
Choked flow ( p < 0.53 p a t m ):
d m a d t = C i n A a 0 0.686 R T p
where C i n is the air-inflow discharge coefficient; R is the gas constant (J/(kg·K)); T is the absolute temperature (K).

2.2.4. Drain Valve Operation Model

Linear opening: The valve opening varies piece-wise linearly with time t,
a = k 1 t , 0 a < n k i t , n < a m
where a is the valve opening (%); ki is the slope of segment i; t is the actuation time (s); n is the intermediate opening degree (%); m is the preset opening degree (%).
Nonlinear power-law opening: Based on the valve’s head-loss characteristics, a 10 s power-law schedule is designed that opens slowly at the beginning and accelerates towards the end,
a = 0.3 t 2
From the manufacturer-supplied valve-opening–flow–head-loss curve, the local loss coefficient ζ at any opening is defined as [32]:
ζ = 2 h f g v 2
where v is the fluid velocity at the valve ( m / s ).

2.3. Initial and Boundary Conditions

Initial Conditions: Before the commencement of water drainage, the initial drainage velocity is vw(0) = 0, the initial water column length is LW(0) = LL0 (where L0 denotes the length of the vented pipe section), the initial absolute pressure in the vented section is p 0 = 101,325   Pa , the initial air density in the vented section is ρa(0) = 1.205 kg/m3, and the initial air intake velocity at the air valve is va(0) = 0.
Boundary Conditions: The upstream boundary condition is governed by the absolute pressure P* within the vented pipe section. At the air valve and the outlet of the downstream water drainage valve, the flow is a free outflow to the atmosphere.
Using the specified initial and boundary conditions, the fourth-order Runge–Kutta method is employed to solve Equations (1)–(15) simultaneously for the time-dependent variations of the pressure in the vented pipe section, the water drainage velocity, the air intake mass flow rate at the air valve, and the water column length.

2.4. Model Verification

The accuracy of the present emptying model is evaluated against the experimental dataset reported by Coronado-Hernández et al. [11,15]. The test pipe is constructed of Methacrylate (Aminnth Pipe Systems, Dammam, Saudi Arabia). The pipeline geometry is characterized as follows: length 4.36 m, internal diameter 0.042 m, relative roughness 0.018, and inclination to the horizontal 30°. The ambient conditions were: local absolute atmospheric pressure 101.325 kPa, and absolute temperature 293.15 K.
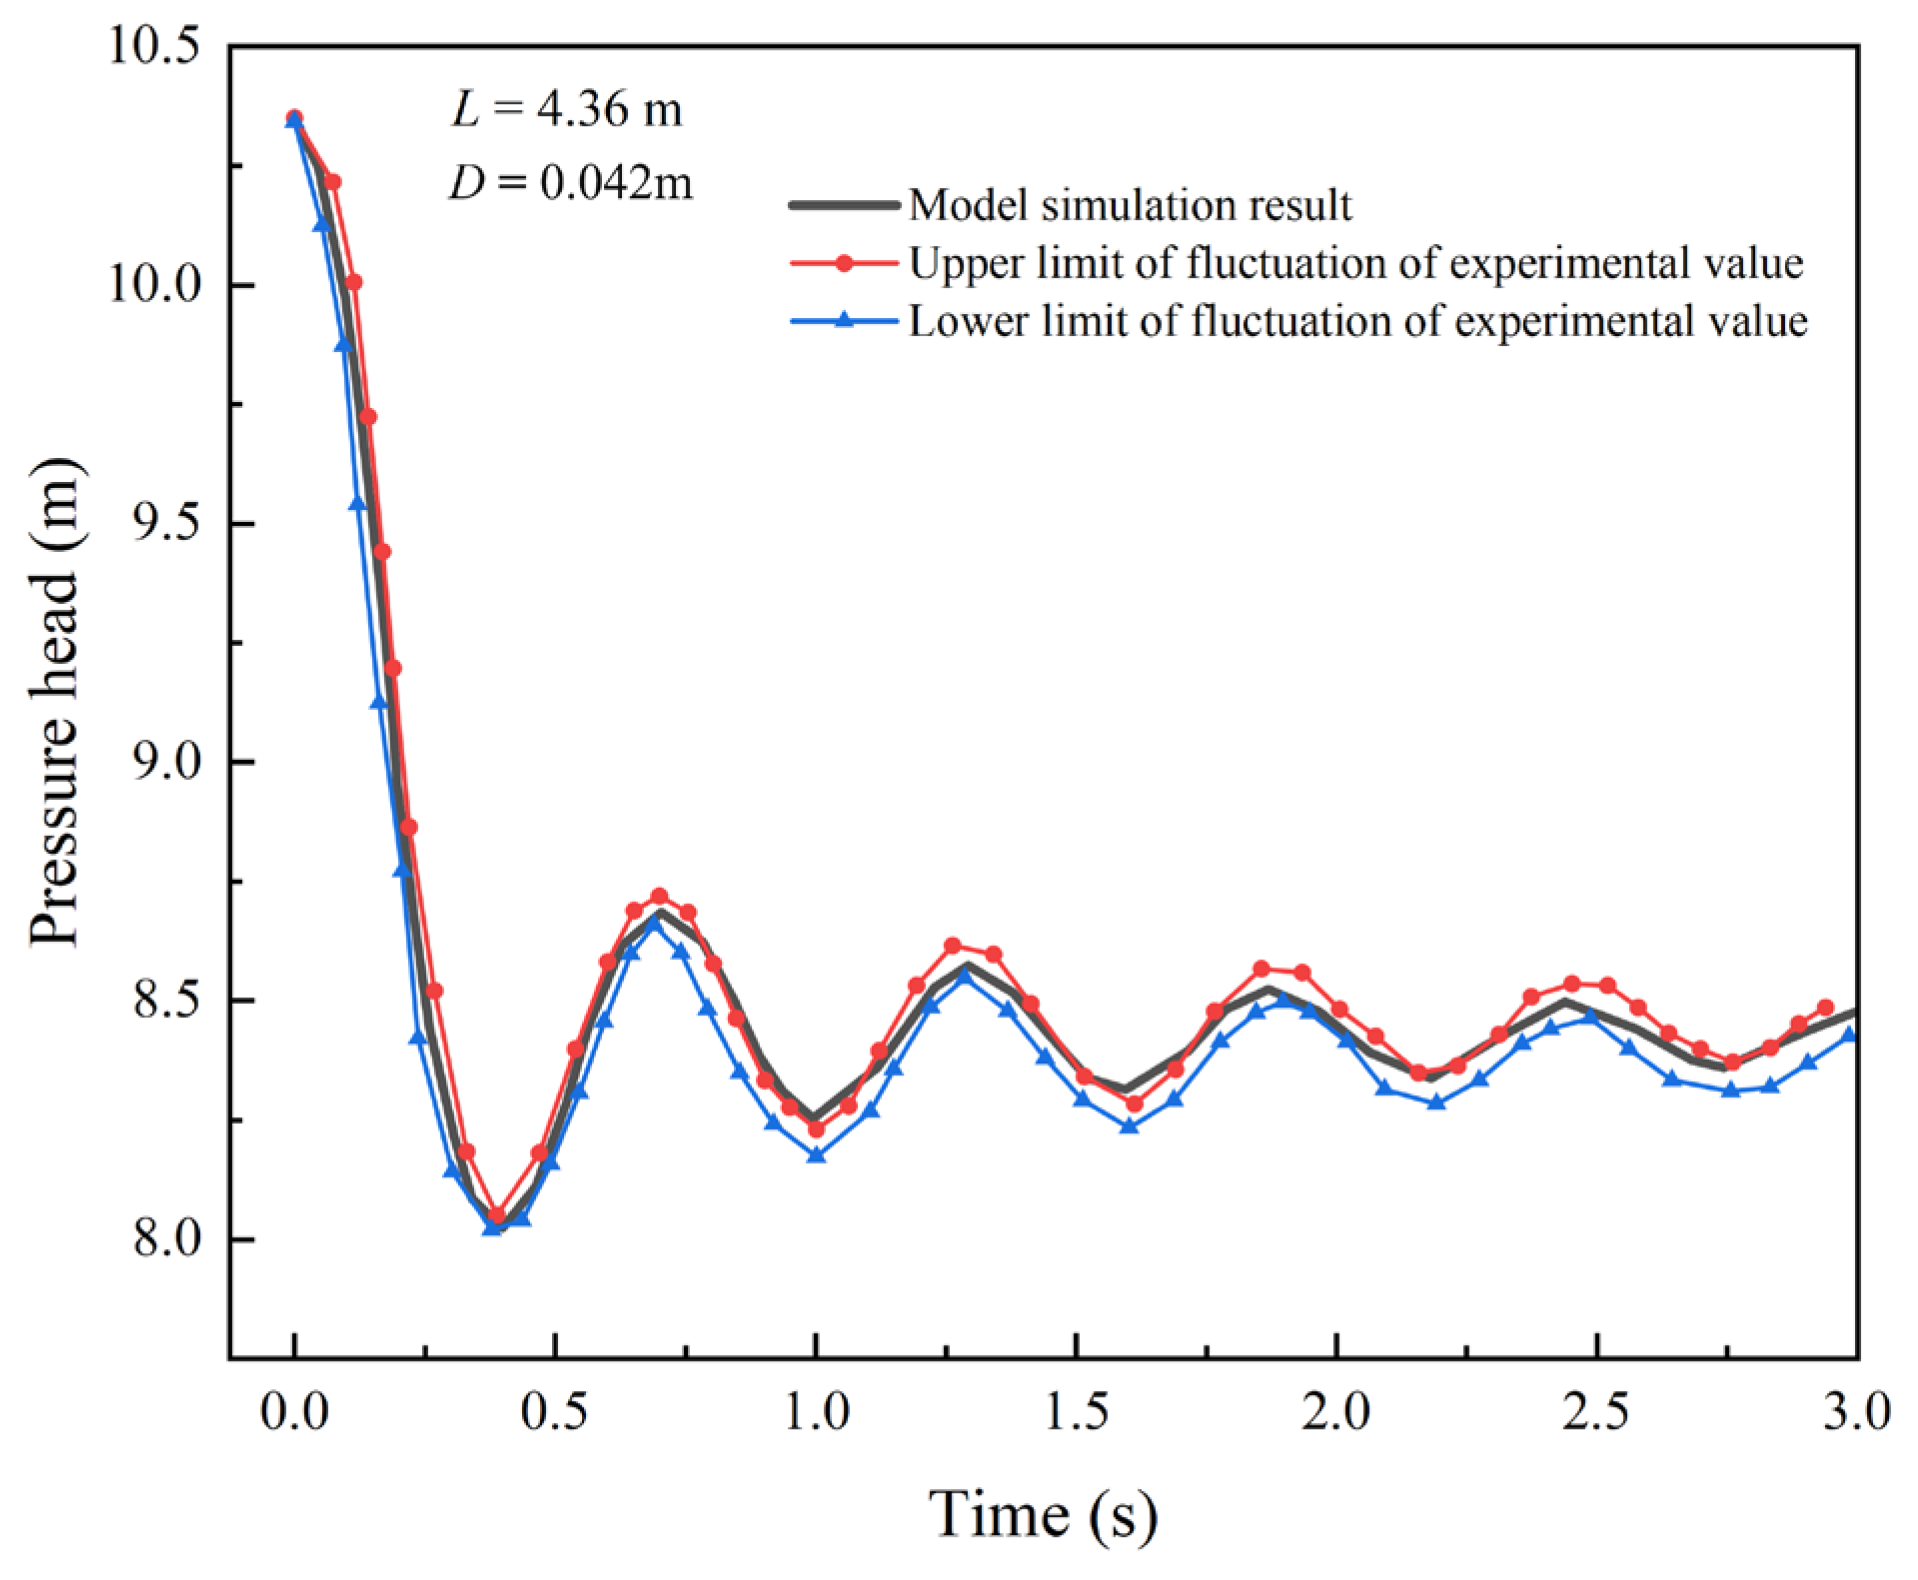
The mathematical model presented in Section 2.2 is employed to simulate the emptying sequence of this pipeline, and the computed results are compared with the experimental measurements. The comparison, illustrated in Figure 2, shows that the predicted pressure oscillations within the air pocket closely agree with the experimental traces, with a maximum discrepancy of 3.59%. This confirms that the proposed model is capable of accurately reproducing the hydraulic behavior during the emptying process.

3. Analysis of Transient Flow in Pressurized Pipelines During Water Drainage

For the water drainage process under normal conditions, rapid air admission through the air valve is particularly critical. Efficient air replenishment enables faster balancing of the negative pressure generated during drainage, thereby ensuring safe operation. Table 2 presents the calculation cases for water drainage under regular air valve operation, investigating the influence of the initial vented pipe section length, valve opening degree, and air valve inlet orifice diameter on the drainage process, respectively.

3.1. Impact of the Water Drainage Valve Opening Strategy on the Drainage Process

The opening strategy of the water drainage valve plays a crucial role in ensuring the stable operation of the fluid within the pipeline. Figure 3 presents a comparison of the pressure head variations in the vented cavity under different opening strategies. As evident from the figure, compared to the instantaneous opening (0-s strategy), both the linear and nonlinear power-function opening strategies mitigate the sudden drop in pressure head observed in the no-strategy scenario. These strategies increase the minimum pressure head in the vented cavity during drainage by 0.5369 m and 0.6383 m, respectively, and delay the time of its occurrence. Furthermore, the partially enlarged view reveals that the nonlinear power-function strategy increases the minimum cavity pressure head by 0.1014 m and delays its occurrence time by 0.655 s compared to the linear strategy. However, it also increases the water drainage completion time by 3.371 s.
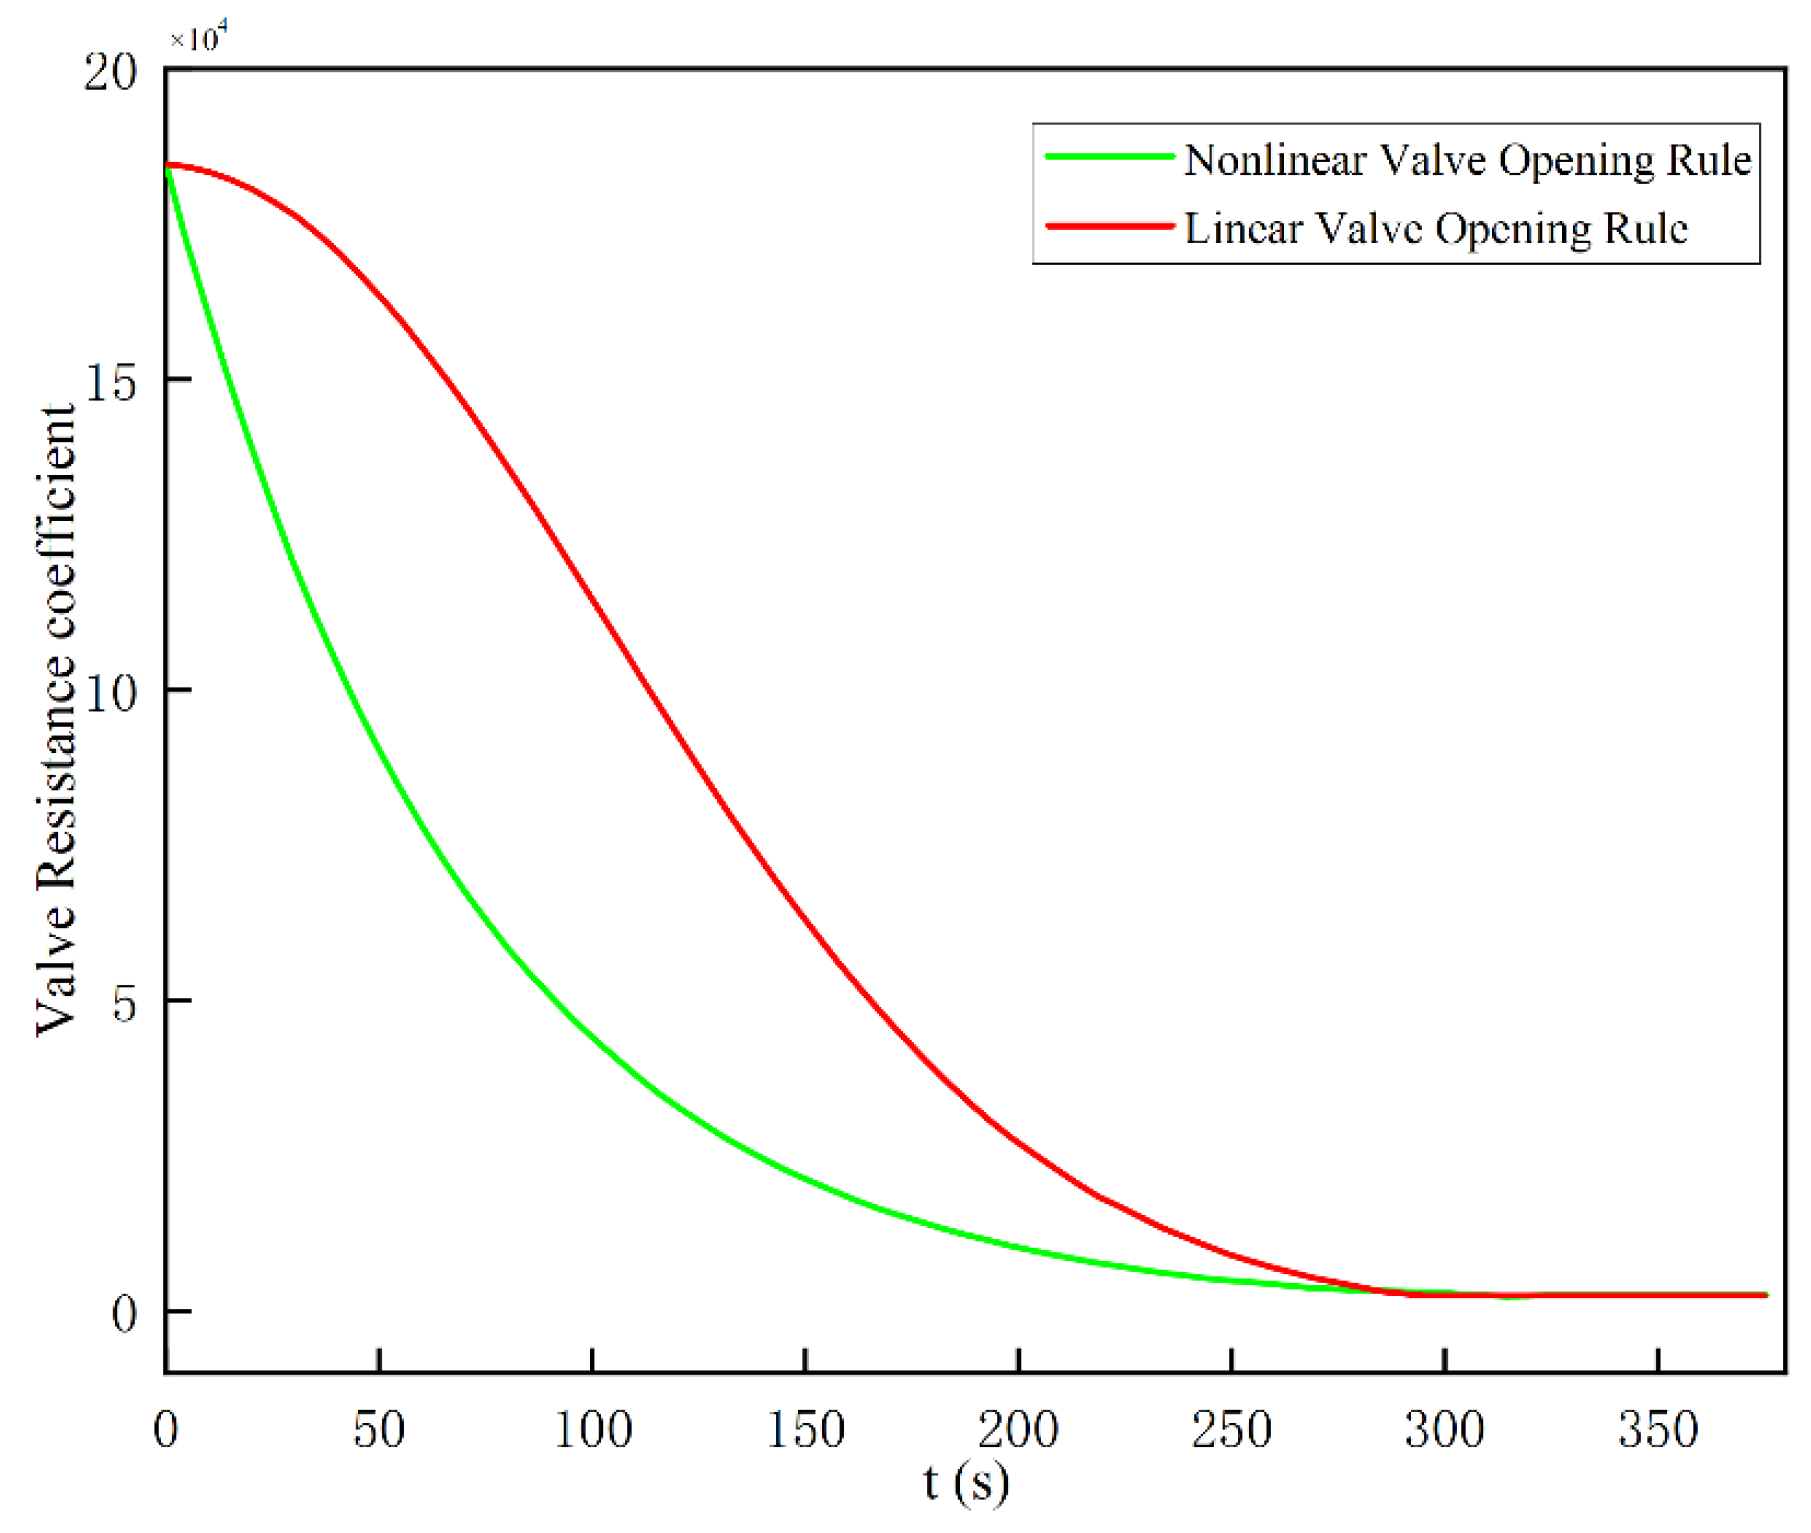
Figure 4 further compares the variation of the valve resistance coefficient versus drainage time for the linear and nonlinear power-function opening strategies. During the initial drainage phase, the resistance coefficient corresponding to the nonlinear power-function strategy at any given time is significantly higher than that of the linear approach. Consequently, the valve resistance is greater at corresponding time points, effectively restraining the excessive increase in drainage velocity during the early stage and enhancing the safety of the drainage process. Therefore, the nonlinear power-function opening strategy is adopted for all water drainage calculations in pressurized pipelines presented in this study.

3.2. Impact of Different Boundary Conditions on Water Drainage Velocity

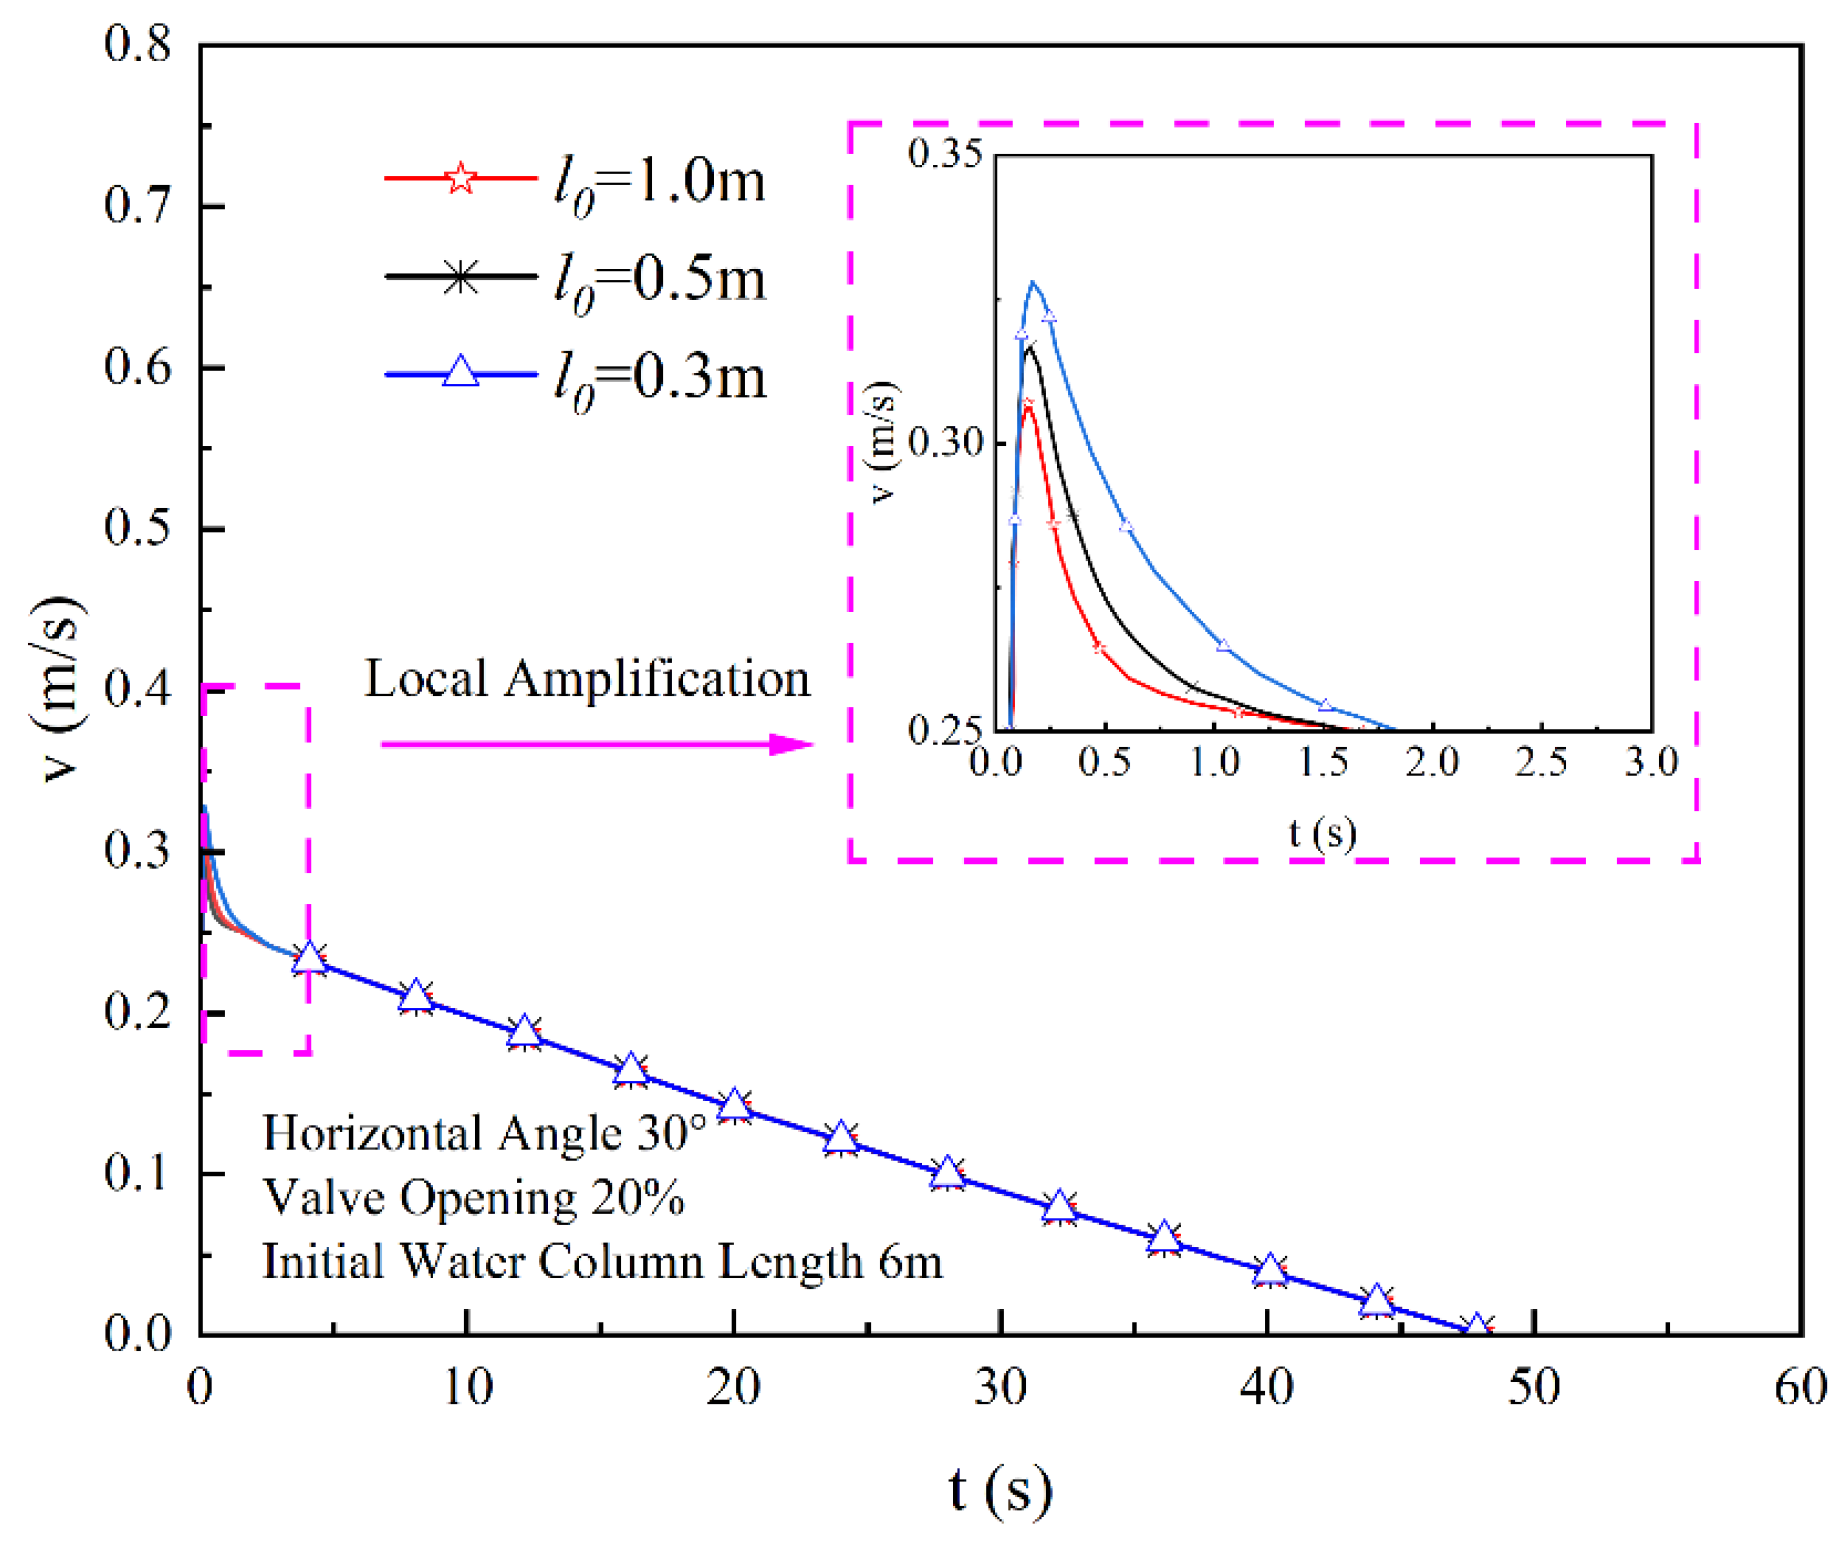
Figure 5 shows that the drainage flow velocity increases sharply during the initial drainage phase. This is attributed to unstable air intake through air valves and the gradual opening of the drainage valve at this stage. As the drainage process progresses, the drainage valve opening remains constant, and air intake stabilizes, resulting in a gradual decrease in flow velocity. The partially enlarged view indicates that a smaller initial cavity length corresponds to a higher peak drainage flow velocity, although the magnitude of change is relatively minor. Under ideal fluid conditions, where energy is conserved along streamlines, a longer water column results in a higher hydraulic head and, consequently, greater flow velocity.
Figure 6 shows the influence of the opening degree of the backwater valve on the flow velocity of the backwater inside the pipeline. During the water withdrawal process, the maximum water withdrawal flow velocity corresponding to a 10% opening degree was 0.11 m/s. With the increase in the opening degree, the maximum water withdrawal flow velocities increased by 0.2 m/s and 0.48 m/s, respectively. Meanwhile, the water withdrawal times for a 20% opening degree and a 30% opening degree were shortened by 52 s and 72 s, respectively, compared to a 10% opening degree. However, the corresponding initial velocity fluctuations during water withdrawal increased accordingly. This is because when the valve opening increases, due to the relatively high water withdrawal speed, the air intake volume of the air valve is insufficient.
Figure 7 illustrates variations in drainage flow velocity with different air valve diameters. At an air valve diameter of 0.003 m, the required drainage time was 104.7 s. As the air intake orifice diameter increased, drainage time decreased by 54% and 63.3%, respectively. When air valve diameters measured 0.003 m and 0.005 m, significant flow velocity fluctuations were observed during the initial drainage phase, with more pronounced oscillations occurring at smaller intake areas. These fluctuations primarily resulted from limited air inflow through smaller orifices at the onset of drainage. Insufficient air replenishment reduced the minimum pressure head in the pipeline, consequently decreasing drainage velocity. As air intake gradually increased over time, the pressure head rose and drainage velocity increased again. This cyclical pattern persisted until the required air replenishment diminished, after which the drainage process progressively stabilized.

3.3. The Influence of Different Boundary Conditions on Cavity Pressure

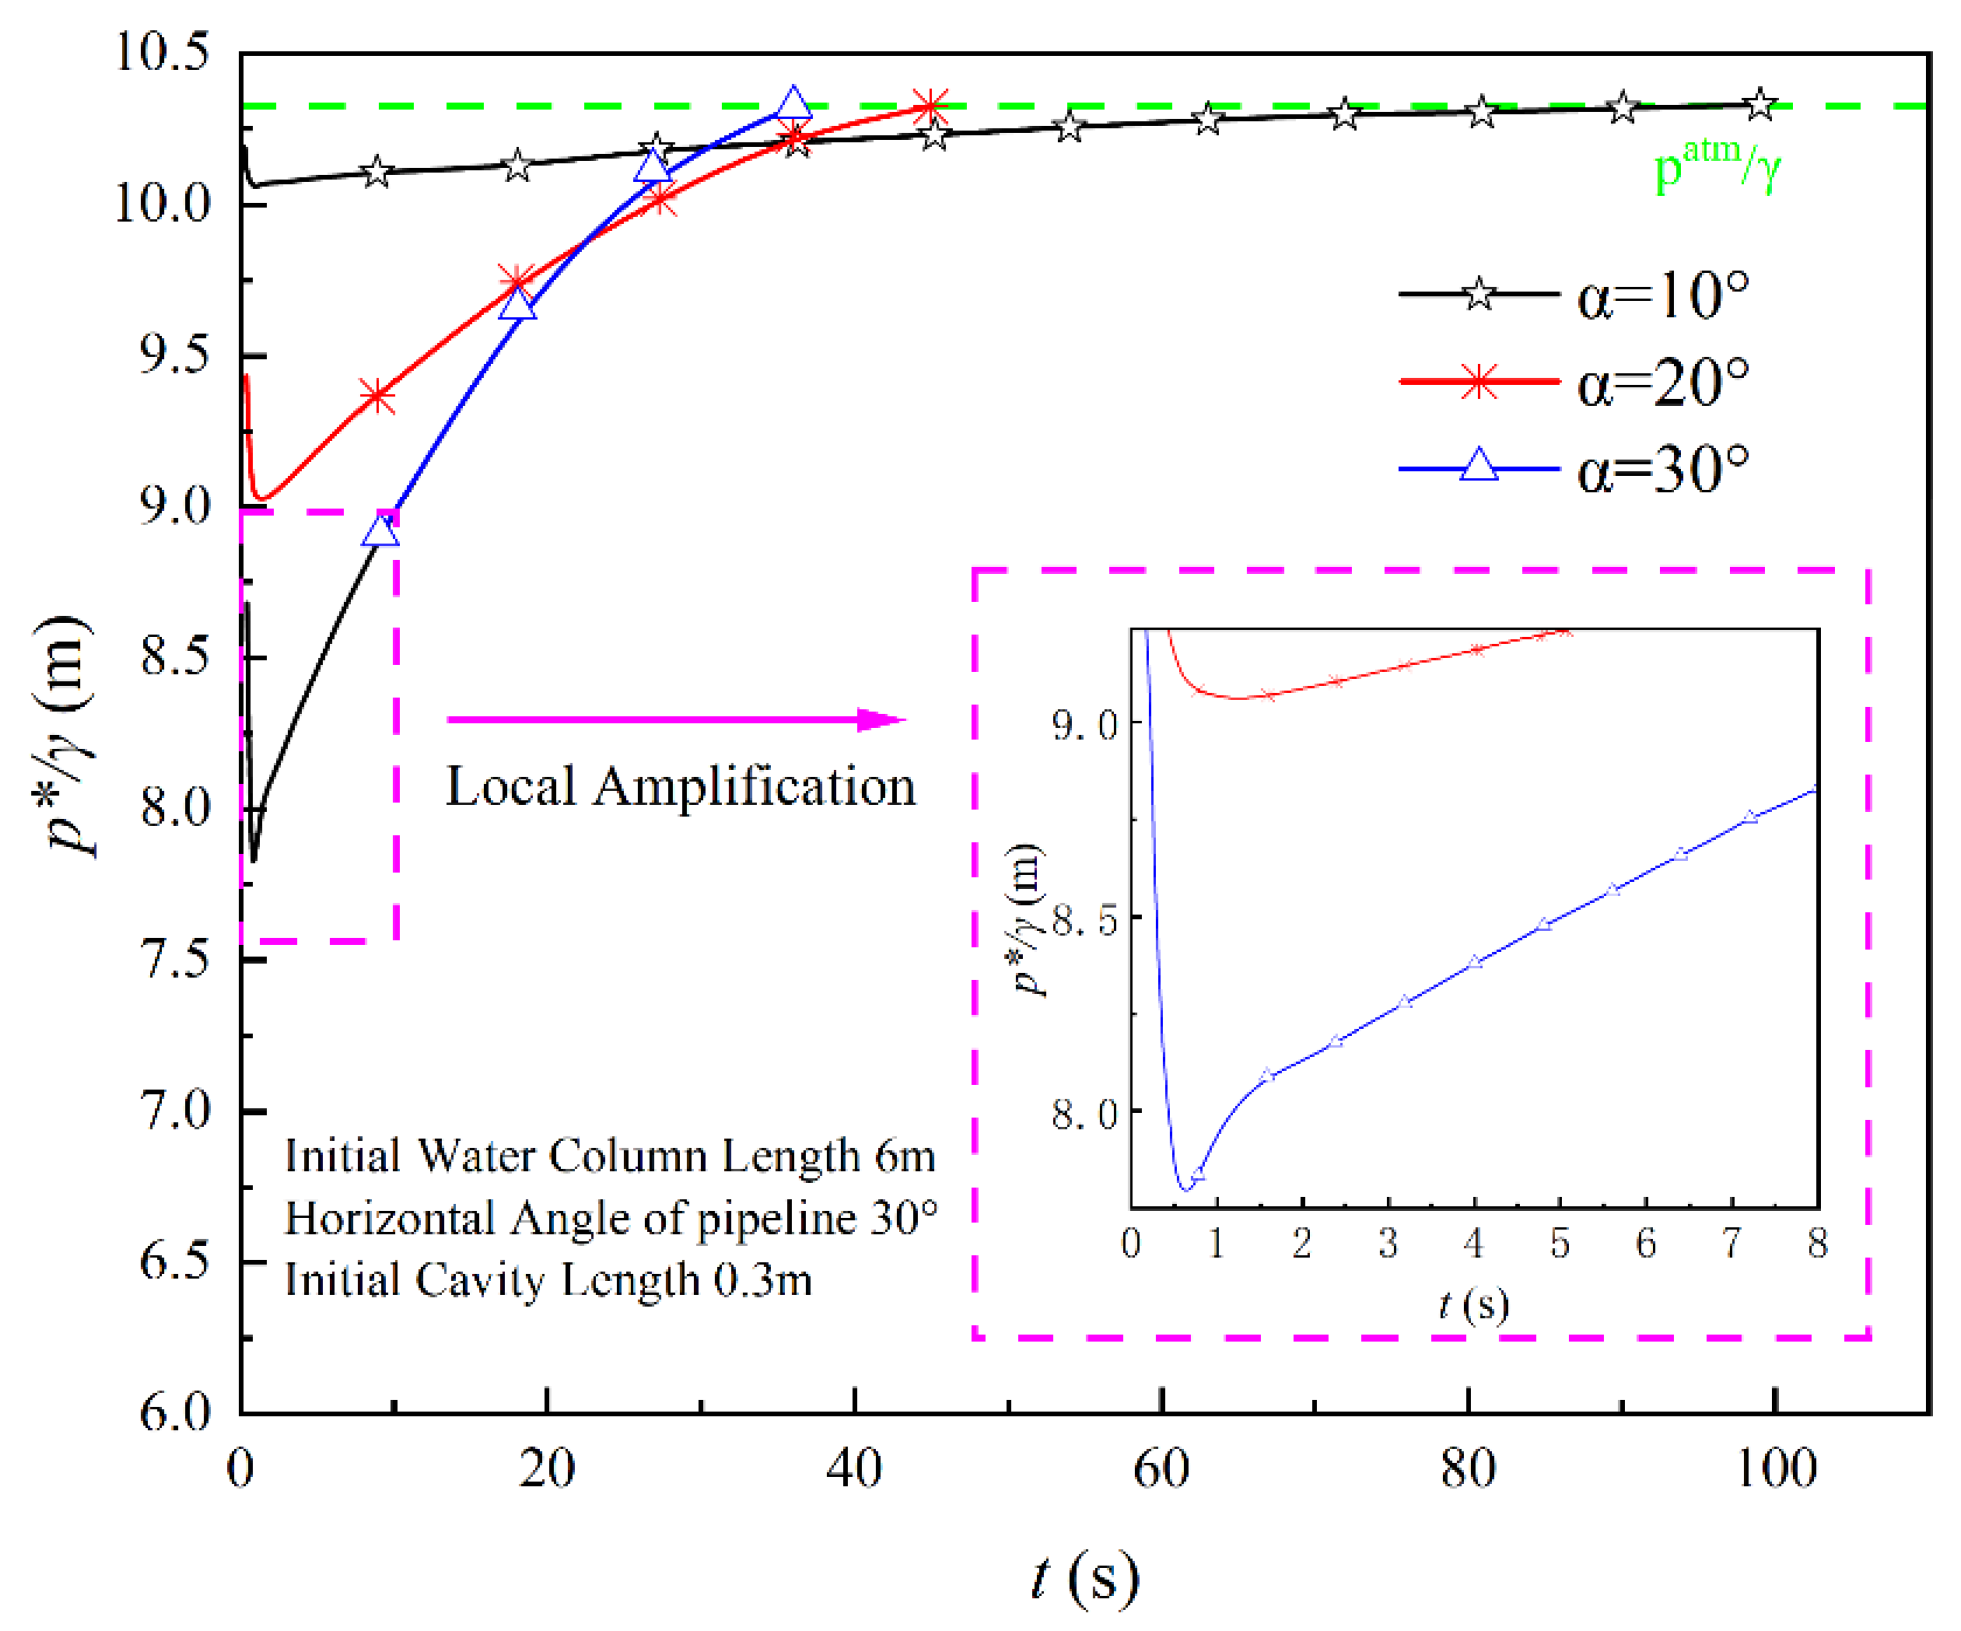
Figure 8 illustrates the temporal variation of pressure head under different initial cavity lengths. During the initial drainage phase, the cavity pressure head plunges to its minimum before gradually recovering as drainage progresses. Upon completion of drainage, the cavity pressure equilibrates with the local atmospheric pressure. As the cavity length increases, the minimum pipe pressure rises from 8.994 m to 9.065 m. This occurs because longer initial cavity lengths provide greater cavity volume available for expansion at drainage onset, thereby elevating the minimum internal pressure.
Figure 9 reveals similar trends in cavity pressure head variation across three valve openings. At the onset of drainage, the pressure head plunges rapidly before gradually recovering to its initial state. The minimum pressure heads corresponding to 10%, 20%, and 30% openings measure 10.069 m, 9.019 m, and 7.783 m, respectively. As valve opening increases, the minimum pressure head during initial drainage decreases by 1.05 m and 2.286 m incrementally. However, at the 30% opening, the cavity pressure head recovers to its initial conditions 62.85% faster than at the 10% opening, despite a longer drainage duration.
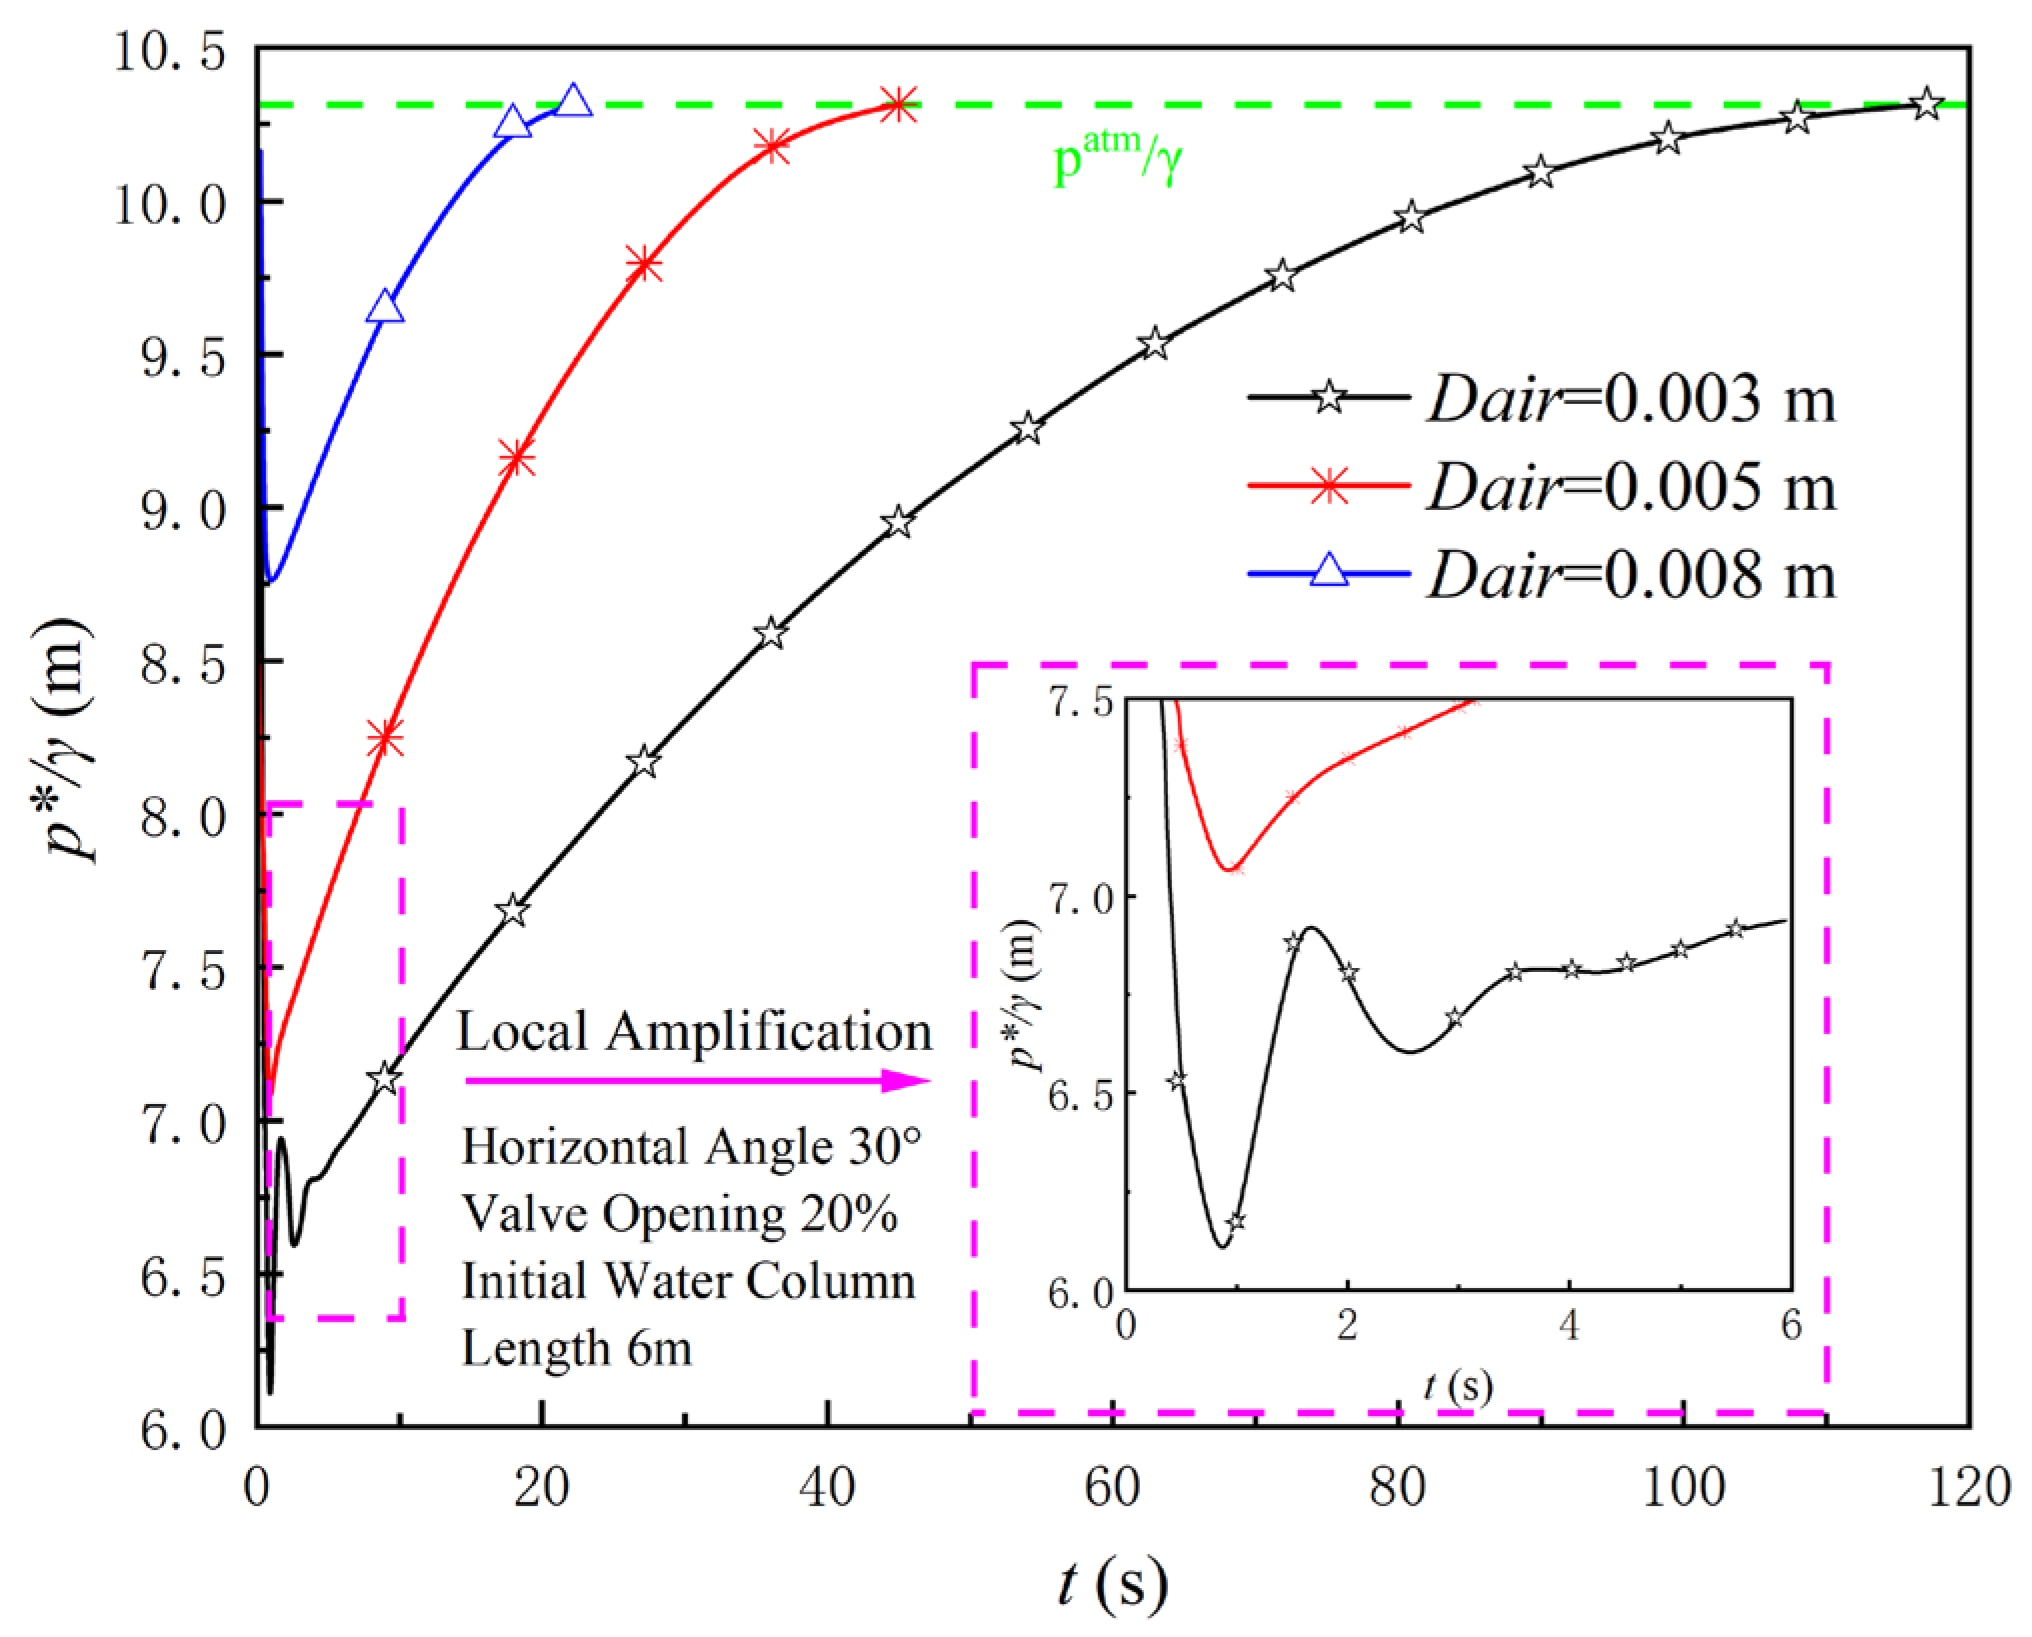
Figure 10 demonstrates that the minimum cavity pressure heads for three air valve diameters measure 6.13 m, 7.05 m, and 8.61 m, respectively. Increasing the air valve diameter reduces the pressure recovery time to initial values by 69.3 s and 98.5 s incrementally. Notably, at smaller diameters (particularly 0.003 m), significant pressure head fluctuations occur during initial drainage due to insufficient air intake. These oscillations are substantially mitigated with larger air intake orifice diameters. Consequently, increasing the air valve diameter significantly enhances drainage stability in pressurized pipelines.
In summary, during pressurized pipeline drainage, the nonlinear power-law valve opening elevates the minimum cavity pressure head and delays its occurrence compared to linear valve operation, while simultaneously suppressing excessive growth in flow velocity during the initial drainage phase. Altering the initial cavity length exerts a limited influence on hydraulic parameters throughout the drainage process. Increasing the drainage valve opening significantly enhances flow velocity and reduces drainage duration—for instance, at a 20% opening, velocity increases by 0.2 m/s, and drainage time decreases by 55.7% compared to a 10% opening. Furthermore, appropriately enlarging the air valve diameter (e.g., from 0.003 m to 0.005 m and 0.008 m) substantially improves drainage stability by mitigating pressure fluctuations induced by air deficiency. Collectively, these strategies effectively optimize the drainage process and accelerate the recovery of pressure head within the pipeline.

4. Case Study: Heihe River Drainage Section of the Hanjiang-to-Weihe River Diversion Project

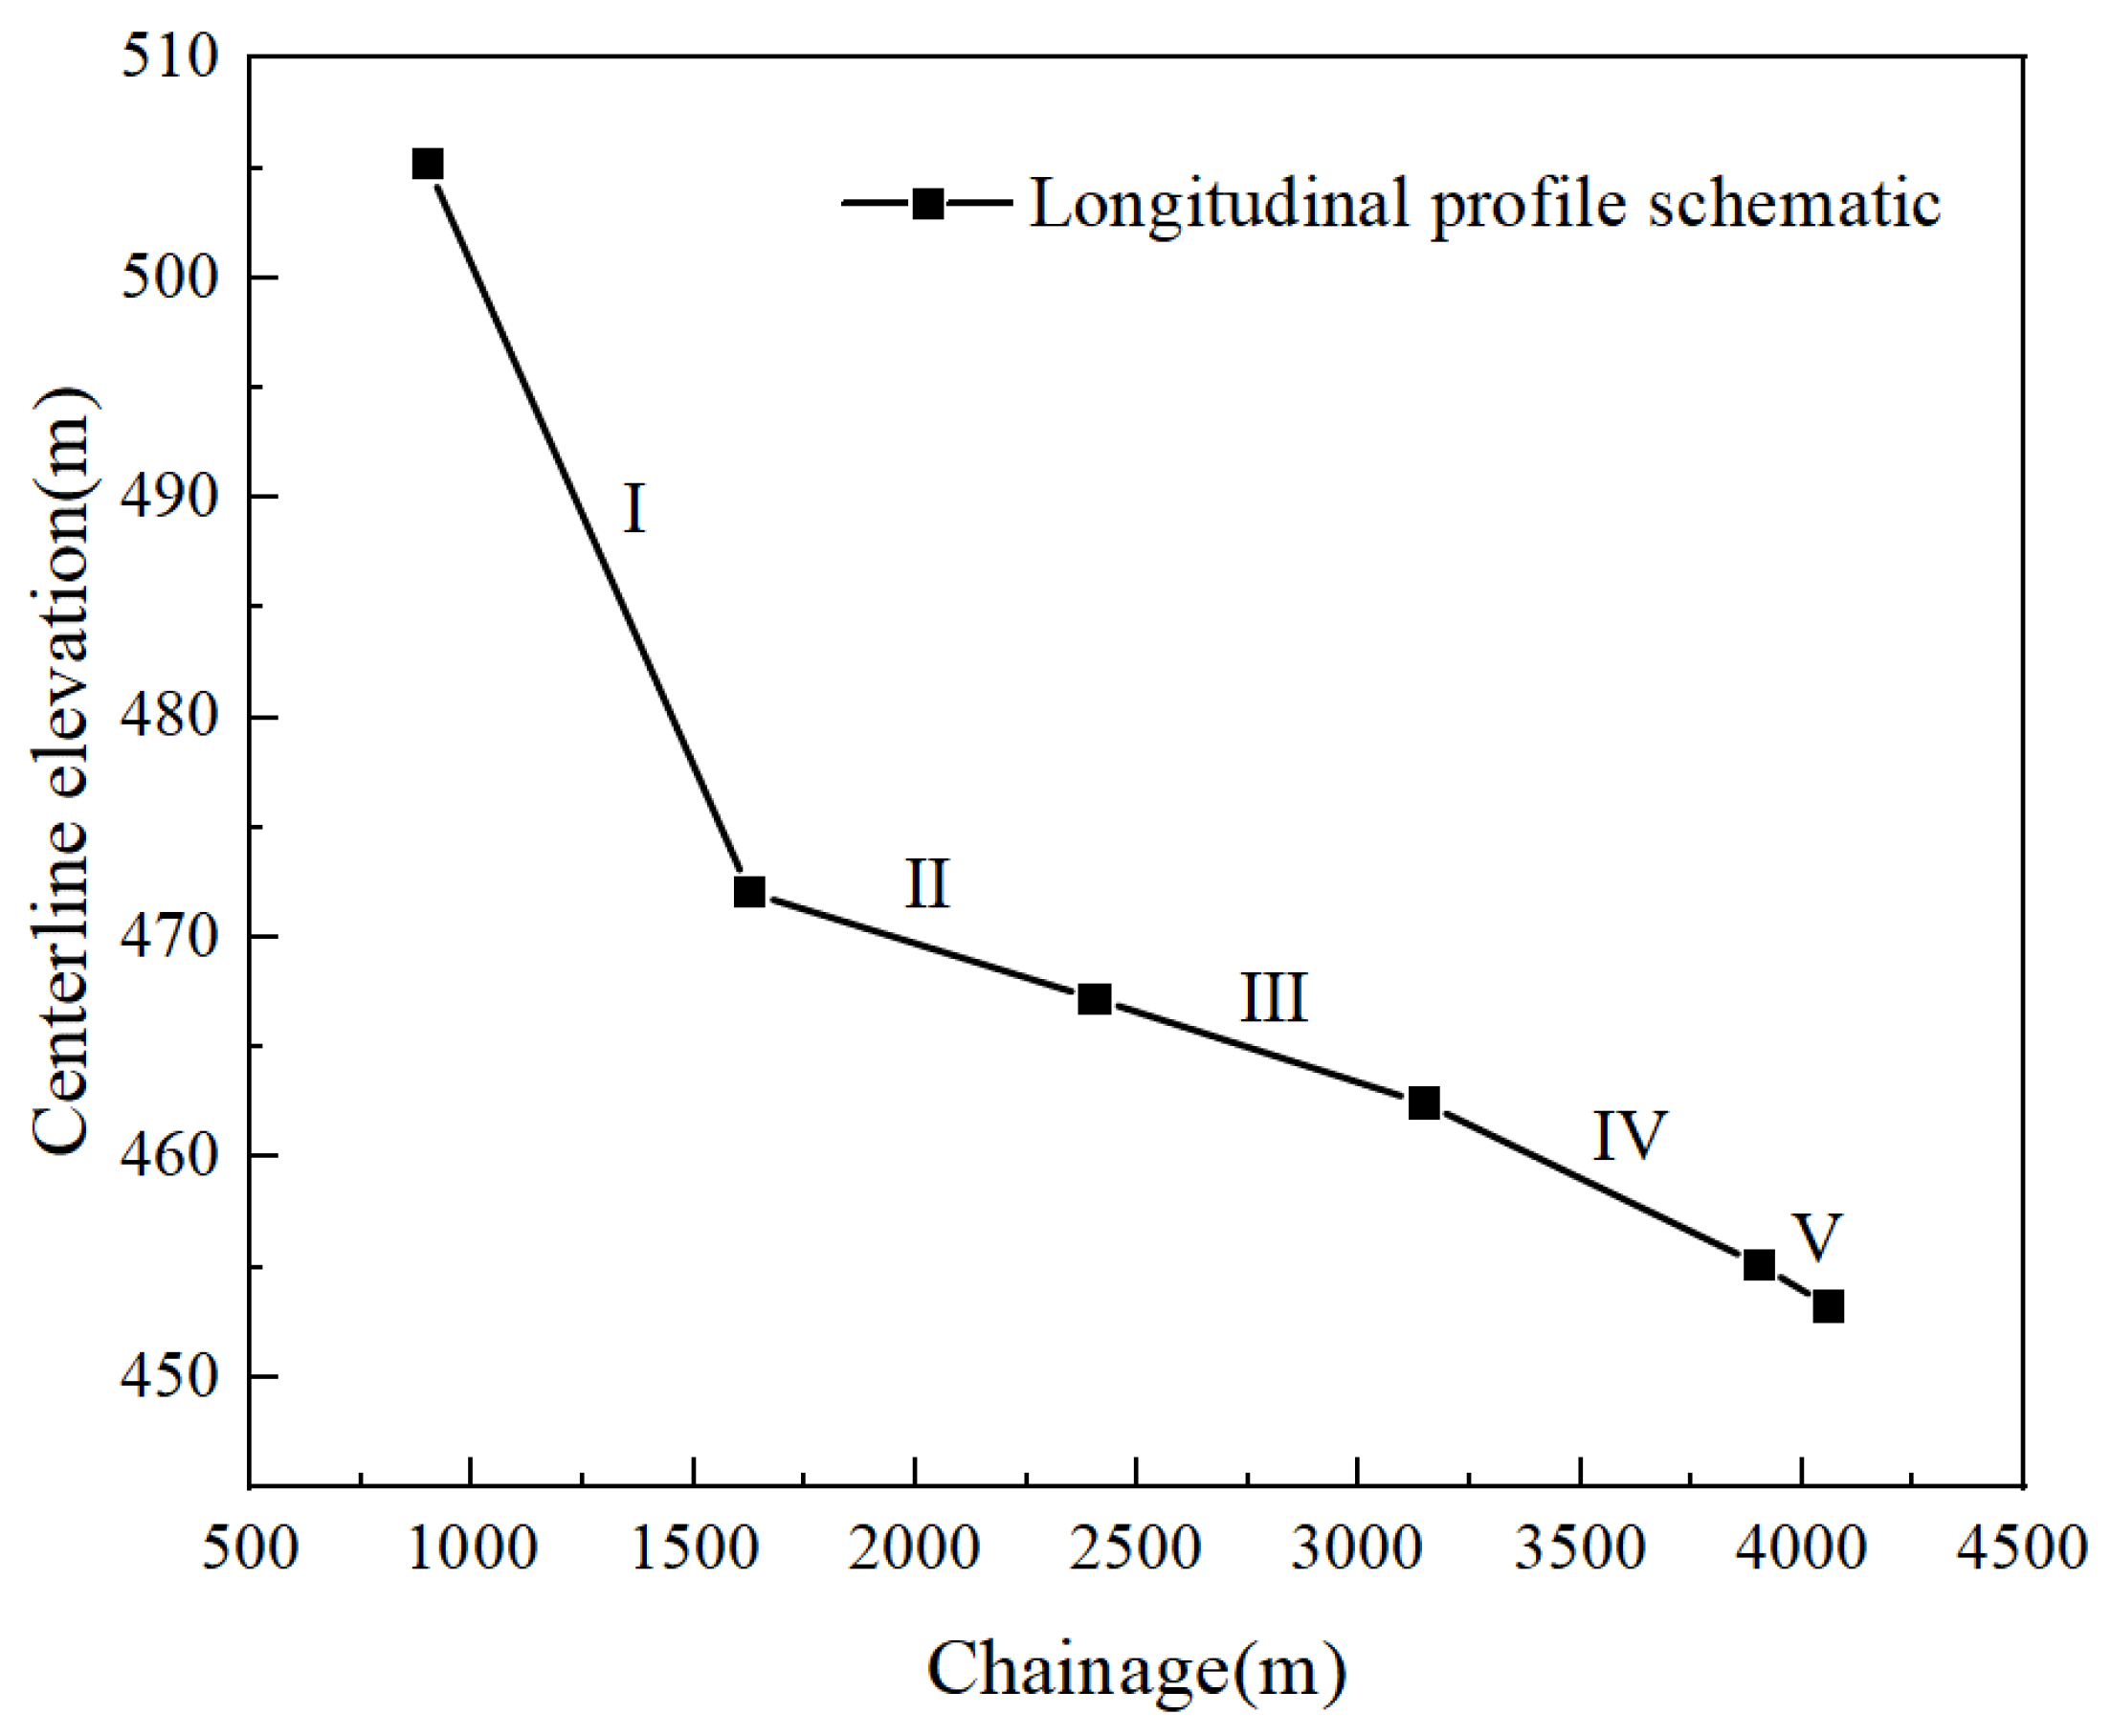
The second-phase project of the Han-to-Wei Water Transfer Scheme constitutes a key component of the overall conveyance system. Located in Zhouzhi County, Xi’an City, Shaanxi Province, the project comprises a southern and a northern main line. The north line utilises pressurised pipelines; during routine inspection and maintenance, emptying operations are required. This case study focuses on the Heihe emptying reach, which is designed as a pair of parallel pipelines. Each pipeline has an internal diameter of 3.4 m and a total length of 3168.43 m, with a maximum elevation difference of 51.94 m. The longitudinal profile of the pipeline is illustrated in Figure 11. The pipe length, elevation difference, and s i n θ with respect to the horizontal for each pipe segment (I–V) are calculated and presented in Table 3.
The drainage pipeline was subdivided into five segments based on elevation differentials. As illustrated in Figure 12, four operational scenarios were designed for comparative analysis. Scenario 1 incorporates a single air valve at the pipeline inlet. Scenario 2 deploys air valves at chainages 0 + 862.12 and 1 + 468.69. Scenario 3 installs five air valves positioned at chainages 0 + 862.12, 1 + 468.89, 2 + 389.19, 3 + 139.17, and 3 + 889.17. Building on the findings in Section 3, which demonstrate that increasing the air valve diameter enhances flow velocity and minimizes cavity pressure, Scenario 4 modifies Scenario 3 by replacing the first air valve with a 0.5 m diameter circular orifice. All scenarios employ DN300 air valves (Bensv Valve Stock Co., Ltd., Tianjin, China) configured for gas exchange exclusively when the water–air interface descends below valve elevation.
Initial Conditions: At time t = 0, the cavity pressure p*(0) = 101,325 Pa, the drainage water velocity vw(0) = 0 m/s, the air density within the cavity ρw(0) = 1.205 kg/m3, and the air valve intake velocity vair(0) = 0 m/s. The maximum preset opening of the drainage valve is specified as 12%, achieved through a linear valve opening process over 5 min. The drainage flow rate must not exceed 3.63 m3/s, and the air valve intake velocity must not exceed the critical velocity. Since the mathematical drainage model established in this study requires the cavity in the emptied pipe section to possess a certain initial length at time t = 0 to satisfy the computational prerequisites, an initial cavity length of 5 m is assumed at t = 0.
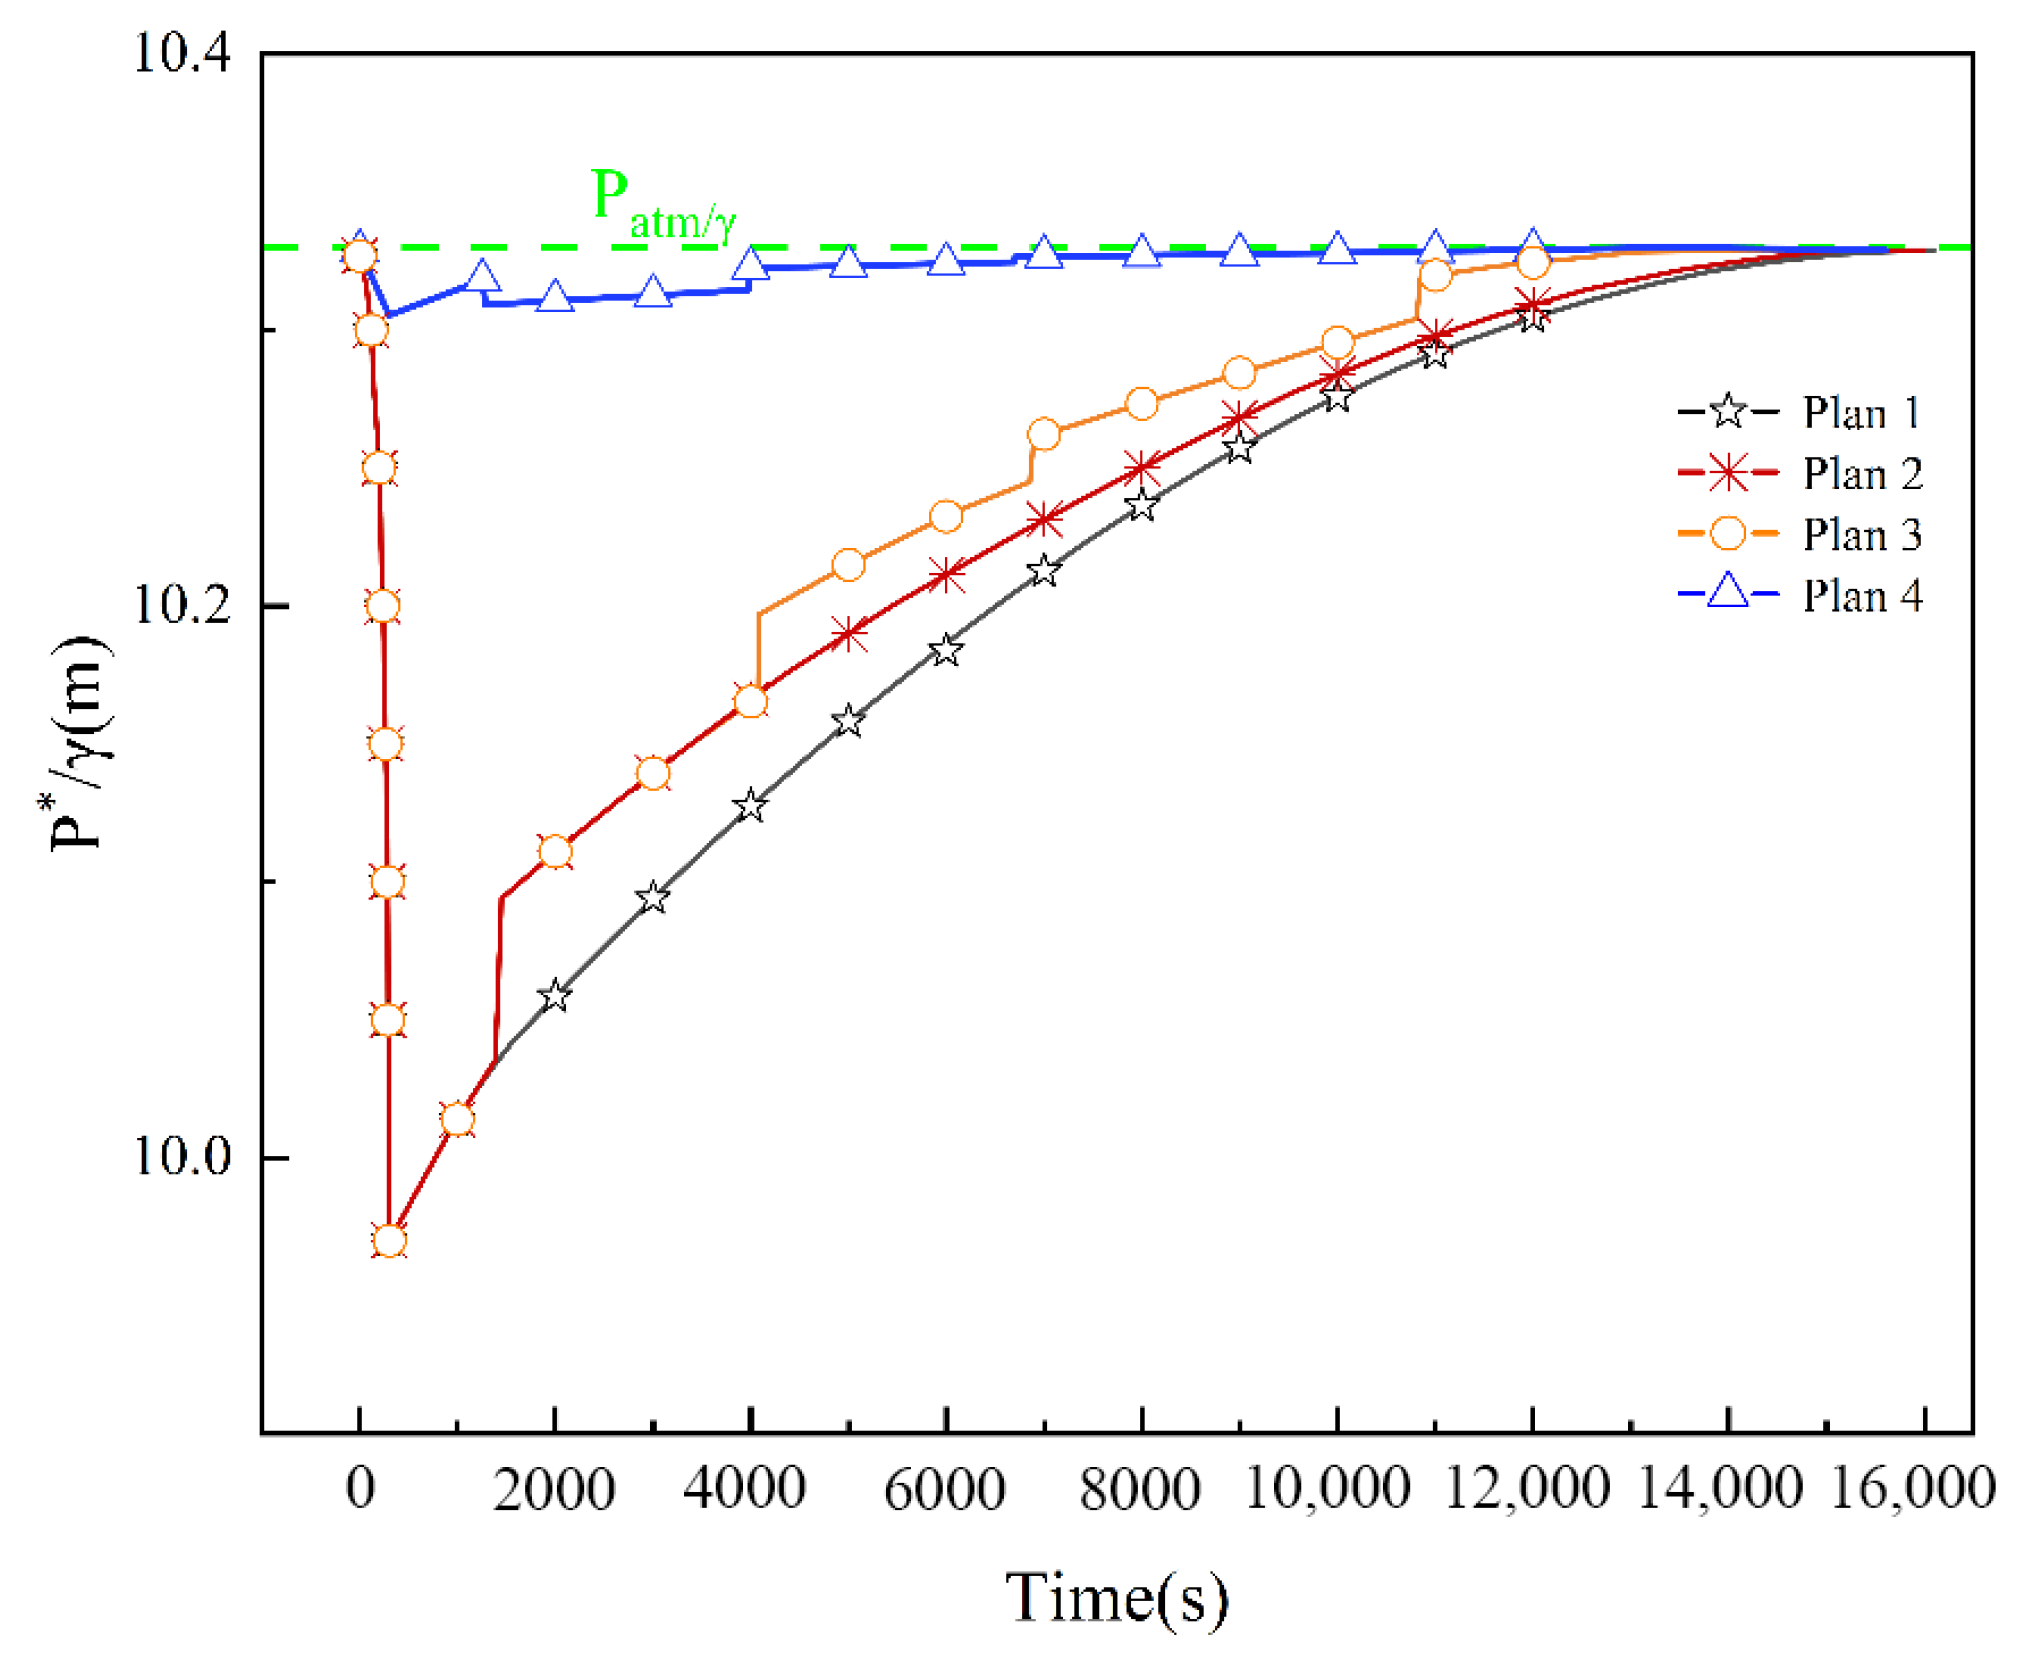
The variation of the cavity pressure water head of the Black River water return pipe section under different calculation schemes is shown in Figure 13. It can be seen from the figure that the models of the hollow air valves in Schemes 1 to 3 are the same, and the minimum cavity pressure water head is 9.97 m. The time at which the minimum value occurs is 299.1 s, when the water return valve is fully open. As the water return process proceeds, the cavity pressure water head gradually increases. Scheme 1 features a single air valve for air replenishment throughout the process. When the water withdrawal process reaches 1131.56 s, due to insufficient air replenishment, the rate of increase of the cavity pressure water head gradually slows down. At the same time, in Schemes 2 and 3, the second air valve begins to supply air, and the cavity pressure water head in the pipe section increases by 0.06 m over the next 40.3 s. Compared with Schemes 1 and 2, at 12,992.81 s, the pressure water head inside the pipe of Scheme 3 reaches 10.326 m, which is essentially close to the standard atmospheric pressure water head. The part of the empty pipe pressure water head that is lower than the standard atmospheric pressure water head is defined as the negative pressure water head. By comparing schemes 1, 2 and 3, it can be observed that the reasonable arrangement of multiple air valves along the drainage pipeline can significantly reduce the duration of negative pressure water head in the pipe; however, the minimum pressure water head in the pipe remains unchanged at the beginning of drainage. By comparing Scheme 4 with Scheme 3, the minimum pressure water head in the hollow cavity of Scheme 4 is 10.305 m, and the occurrence time is 345.2 s. Compared with the previous three schemes, it increases by 0.335 m, the occurrence time is 345.2 s, and the occurrence is delayed by 46.1 s. Meanwhile, the cavity pressure water head in Scheme 4 has recovered to the atmospheric pressure water head at 10,786.32 s.
Figure 14 shows a comparative schematic of the drainage flow rates under different schemes. As the drainage time increases, the flow rates in all schemes exhibit a trend of initially increasing and then decreasing. Comparing the four schemes, the overall drainage process is relatively stable. The maximum drainage flow rate observed in Schemes 1–3 was 3.55 m3/s, which is 0.06 m3/s lower than that in Scheme 4. The drainage flow rates did not exceed the preset flow rate limit; however, oscillations in the flow rate occurred upon the opening of the air valves. Upon completion of the drainage process, Scheme 1 required 16,098.85 s (approximately 4.47 h), while Schemes 2–4 achieved completion 105.71 s, 273.5 s, and 498.62 s faster, respectively.

5. Conclusions

This paper establishes a mathematical model for the drainage process in a pressurized pipeline with a single air valve. The model was validated using existing experimental data. The study focused on the relationships between the opening strategy, valve opening degree, and air valve diameter, as well as key hydraulic parameters such as pipeline drainage velocity and cavity pressure head. The drainage model with multiple air valves was also applied to the Hehe drainage section pipeline of the North Main Line in the “Hanjiang-to-Weihe River Diversion Project” Phase II. Drainage calculations and analyses for this section led to the following main conclusions:
(1)
A mathematical model for the drainage process was developed using the rigid water column assumption and validated by experiments. The results show that the model matches experimental data well, with a maximum error of 3.59%.
(2)
During drainage in pressurized pipelines with air valves, both linear and nonlinear power-function valve opening strategies improve the process. The nonlinear opening strategy increased the minimum cavity pressure head by 0.1014 m and delayed its occurrence by 0.655 s compared to the linear strategy. It also effectively reduced the rapid increase in drainage water velocity at the start of drainage.
(3)
As the valve opening degree increases, drainage water velocity rises significantly and drainage time shortens. At 20% opening, velocity increased by 0.2 m/s and drainage time dropped by 55.7%. At a larger opening, velocity increased by 0.48 m/s and drainage time fell by 65.4%. However, the minimum cavity pressure head fell by 1.05 m and 2.286 m, reducing drainage stability. Increasing the valve opening degree speeds up drainage but may reduce process stability.
(4)
Increasing the air valve diameter improves drainage stability in pressurized pipelines. Small air valves (0.003 m) caused pressure fluctuations due to low air intake, but these weakened when the diameter increased to 0.005 m or more. At 0.005 m and 0.008 m, the drainage time was reduced by 54% and 63.3%, respectively, compared to the small valves.
(5)
Well arrangement of multiple air valves can reduce negative pressure head duration without changing the minimum pressure value. All schemes showed drainage flow rates that first rose then fell, reaching a maximum of 3.61 m3/s. Compared to Scheme 1, drainage times for Schemes 2, 3, and 4 were reduced by 105.71 s, 273.5 s, and 498.62 s.
The rigid water column model adopted in this study simplifies the actual drainage process by neglecting water elasticity and spatial variations, and assumes that submerged air valves remain closed. To more accurately unravel the complex dynamics of pipeline drainage, future work should incorporate more sophisticated hydraulic models, such as elastic models, and rigorously investigate the complex gas-liquid two-phase flows triggered by the intrusion of air through submerged air valves.

Author Contributions

Data curation, S.S.; software, validation, J.M.; formal analysis, investigation, resources, B.Z.; writing—original draft preparation, J.M.; writing—review and editing, J.J. and J.L. All authors have read and agreed to the published version of the manuscript.

Funding

This work was supported by the research project of Shaanxi Natural Science Basic Research Program-Yin Han Ji Wei Joint Fund (No. 2021JLM-55), the Young Innovation Team Project of the Education Department of Shaanxi Province (24JP118), and the Innovation Capability Support Program of Shaanxi (No. 2024RS-CXTD-31). The support is gratefully acknowledged.

Data Availability Statement

The original contributions presented in this study are included in the article. Further inquiries can be directed to the corresponding author.

Acknowledgments

During the preparation of this manuscript, we have utilized DeepSeek-R1 Chat to verify grammatical accuracy and refine academic expressions. All AI-generated content has been rigorously reviewed and manually edited by us, and we take full responsibility for the publication’s originality, validity, and integrity. We confirm that all our academic viewpoints, experimental data, and conclusions originate exclusively from our independent research, in full compliance with MDPI’s publication ethics policies.

Conflicts of Interest

Author Jinyang Ma was employed by the company Shaanxi Hanjiang-to-Weihe River Water Diversion Project Construction Co., Ltd. Author Bo Zhang was employed by the company Powerchina Northwest Engineering Co., Ltd. The remaining authors declare that the research was conducted in the absence of any commercial or financial relationships that could be construed as a potential conflict of interest.

References

  1. Dong, H.K.; Tian, R.; Wang, Q.G. Calculation of Hydraulic Transient Process in Long-Distance Water Conveyance Pipelines. Water Resour. Dev. Manag. 2022, 42, 32–38. [Google Scholar]
  2. Wang, Q. Study on Filling Test of Long-Distance, Large-Section, Pressurized Water Conveyance Tunnel. Water Resour. Dev. Manag. 2021, 41, 41–45. [Google Scholar]
  3. Tang, X.L.; Liu, Z.K.; Zhang, L.; Li, X.Q. Experimental investigations on characteristics of water-air two-phase flows during water-fillings in undulation pipelines. J. Hydrodyn. 2024, 12, 706–724. [Google Scholar] [CrossRef]
  4. RolandoYezid, P.; Arman, R.; Musandji, F. Experimental Investigation of the Emptying Process and Air Cavity Dynamic in Pipelines. J. Irrig. Drain. Eng. 2022, 148, 04022040. [Google Scholar] [CrossRef]
  5. Zhang, H.Z.; Li, Y.H.; Jiang, J.; Wang, Y.C.; Luo, S. Influence of filling velocity on the hydraulic characteristics of the air valve hump section. China Rural Water Hydropower 2019, 11, 172–187. [Google Scholar]
  6. Zhou, L.; Cai, B.H.; Hu, C.Z.; Lu, Y. Simulation of Hydraulic Transients during Pipeline Filling with Multiple Air Pockets. J. Huazhong Univ. Sci. Technol. 2025, 53, 158–165. [Google Scholar]
  7. Liang, X.; Wang, Y.L.; Cui, S.J.; Zhou, B.; Wang, L.; Cao, W. Analysis of Pipeline Filling Characteristics under Different Inclination Angles. Water Resour. Power 2024, 42, 60–62. [Google Scholar]
  8. Ling, W.F.; Bryan, K.; Ahmad, M. Numerical investigation of filling transients in small-scale pipelines with submerged outlet. J. Hydraul. Res. 2016, 55, 647–656. [Google Scholar]
  9. Yan, J.S.; Liao, G.L. Three-dimensional numerical simulation of hydraulic characteristics during the filling process of pressurized pipelines. Water Resour. Hydropower Eng. 2015, 46, 110–114. [Google Scholar]
  10. Lin, L.; David, Z.; Biao, H. Analysis of pressure transient following rapid filling of a vented horizontal pipe. Water 2018, 10, 1698. [Google Scholar] [CrossRef]
  11. Coronado-Hernández, E.O.; Fuertes-Miquel, V.S.; Iglesias-Rey, L.P.; Martínez-Solano, F.J. Rigid water column model for simulating the emptying process in a pipeline using pressurized air. J. Hydraul. Eng. 2018, 144, 06018004. [Google Scholar] [CrossRef]
  12. Paternina-Verona, A.D.; Coronado-Hernández, E.O.; Aguirre-Mendoza, M.A.; Espinoza-Román, H.G.; Fuertes-Miquel, V.S. Three-Dimensional Simulation of Transient Flows during the Emptying of Pipes with Entrapped Air. J. Hydraul. Eng. 2023, 149, 13302. [Google Scholar] [CrossRef]
  13. Laanearu, J.; Annus, I.; Koppel, T.; Bergant, A.; Vučković, S.; Hou, Q.; Tijsseling, A.S.; Anderson, A.; van’t Westende, J.M. Emptying of large-scale pipeline by pressurized air. J. Hydraul. Eng. 2012, 138, 1090–1100. [Google Scholar] [CrossRef]
  14. Besharat, M.; Coronado-Hernández, O.E.; Fuertes-Miquel, V.S.; Viseu, M.T.; Ramos, H.M. Backflow air and pressure analysis in emptying a pipeline containing an entrapped air pocket. Urban Water J. 2018, 15, 769–779. [Google Scholar] [CrossRef]
  15. Coronado-Hernández, O.E.; Fuertes-Miquel, V.S.; Angulo-Hernández, F.N. Emptying operation of water supply networks. Water 2018, 10, 22. [Google Scholar] [CrossRef]
  16. Tijsseling, A.S.; Hou, Q.; Bozkuş, Z.; Laanearu, J. Improved one-dimensional models for rapid emptying and filling of pipelines. J. Press. Vessel Technol. Trans. ASME 2016, 138, 031301. [Google Scholar] [CrossRef]
  17. Fuertes-Miquel, V.S.; Coronado-Hernández, E.O.; Iglesias-Rey, L.P.; Mora-Meliá, D. Transient phenomena during the emptying process of a single pipe with water–air interaction. J. Hydraul. Res. 2019, 57, 318–326. [Google Scholar] [CrossRef]
  18. Tasca, E.S.A.; Karney, B. Improved Air Valve Selection through Better Device Characterization and Modeling. J. Hydraul. Eng. 2023, 149, 142–156. [Google Scholar] [CrossRef]
  19. Bian, S.K.; Zhang, X.Y.; Li, G.; Li, L. Study on valve-closure law and air-valve optimization in gravity flow pipelines. Adv. Sci. Technol. Water Resour. 2025, 45, 55–61. [Google Scholar]
  20. Wu, F.; Liu, W.Y.; Zai, S.M.; He, R.; Gao, X.J.; Huang, J.; Nie, M.M. Airflow characteristics and water hammer elimination effect of the staged exhaust air valve. J. Drain. Irrig. Mach. Eng. 2025, 1–9. Available online: https://link.cnki.net/urlid/32.1814.th.20250620.1730.004 (accessed on 17 June 2025).
  21. Li, N.; Zhang, J.; Shi, L.; Chen, X.Y.; Zhang, X. Water Hammer Protection Characteristics of a Combined Air Vessel and Overpressure Relief Valve. J. Drain. Irrig. Mach. Eng. 2020, 38, 254–260. [Google Scholar]
  22. Bashiri-Atrabi, H.; Hosoda, T. The motion of entrapped air cavities in inclined ducts. J. Hydraul. Res. 2015, 53, 814–819. [Google Scholar] [CrossRef]
  23. Izquierdo, J.; Fuertes, V.S.; Cabrera, E.; Iglesias, P.L.; Garcia-Serra, J. Pipeline start-up with entrapped air. J. Hydraul. Res. 1999, 37, 579–590. [Google Scholar] [CrossRef]
  24. Brunone, B.; Karney, B.W.; Mecarelli, M.; Ferrante, M. Velocity profiles and unsteady pipe friction in transient flow. J. Water Resour. Plan. Manag. 2000, 126, 236–244. [Google Scholar] [CrossRef]
  25. Huang, H.; Guo, P.C.; Yan, J.G.; Li, B. Progress in the study of friction models for unsteady flow in pressurized pipelines. J. Hydrodyn. 2025, 40, 274–296. [Google Scholar]
  26. Fuertes-Miquel, V.S. Hydraulic Transients with Entrapped Air Pockets. Ph.D. Thesis, Polytechnic University of Valencia, Valencia, Spain, 2001. [Google Scholar]
  27. Lee, N. Effect of Pressurization and Expulsion of Entrapped Air in Pipelines. Ph.D. Thesis, School of Civil and Environmental Engineering, Georgia Institute of Technology, Atlanta, GA, USA, 2005. [Google Scholar]
  28. Leon, A.S.; Ghidaoui, M.S.; Schmidt, A.R. A robust two-equation model for transient-mixed flows. J. Hydraul. Res. 2010, 48, 44–56. [Google Scholar] [CrossRef]
  29. Martin, C. Entrapped air in pipelines. In Proceedings of the Second International Conference on Pressure Surges, London, UK, 22–24 September 1976. [Google Scholar]
  30. Iglesias-Rey, L.P.; Fuertes-Miquel, V.S.; García-Mares, F.J. Comparative study of intake and exhaust air flows of different commercial air valves. In Proceedings of the 16th Conference on Water Distribution System Analysis, Bari, Italy, 13–16 July 2014. [Google Scholar]
  31. Wylie, E.; Streeter, V. Fluid Transients in Systems; Prentice Hall: Hoboken, NJ, USA, 1993. [Google Scholar]
  32. Liu, X.M.; Xie, Y.B. Study on calculation methods for the friction resistance coefficient in long-distance district heating networks. Fluid. Mach. 2022, 50, 100–104. [Google Scholar]
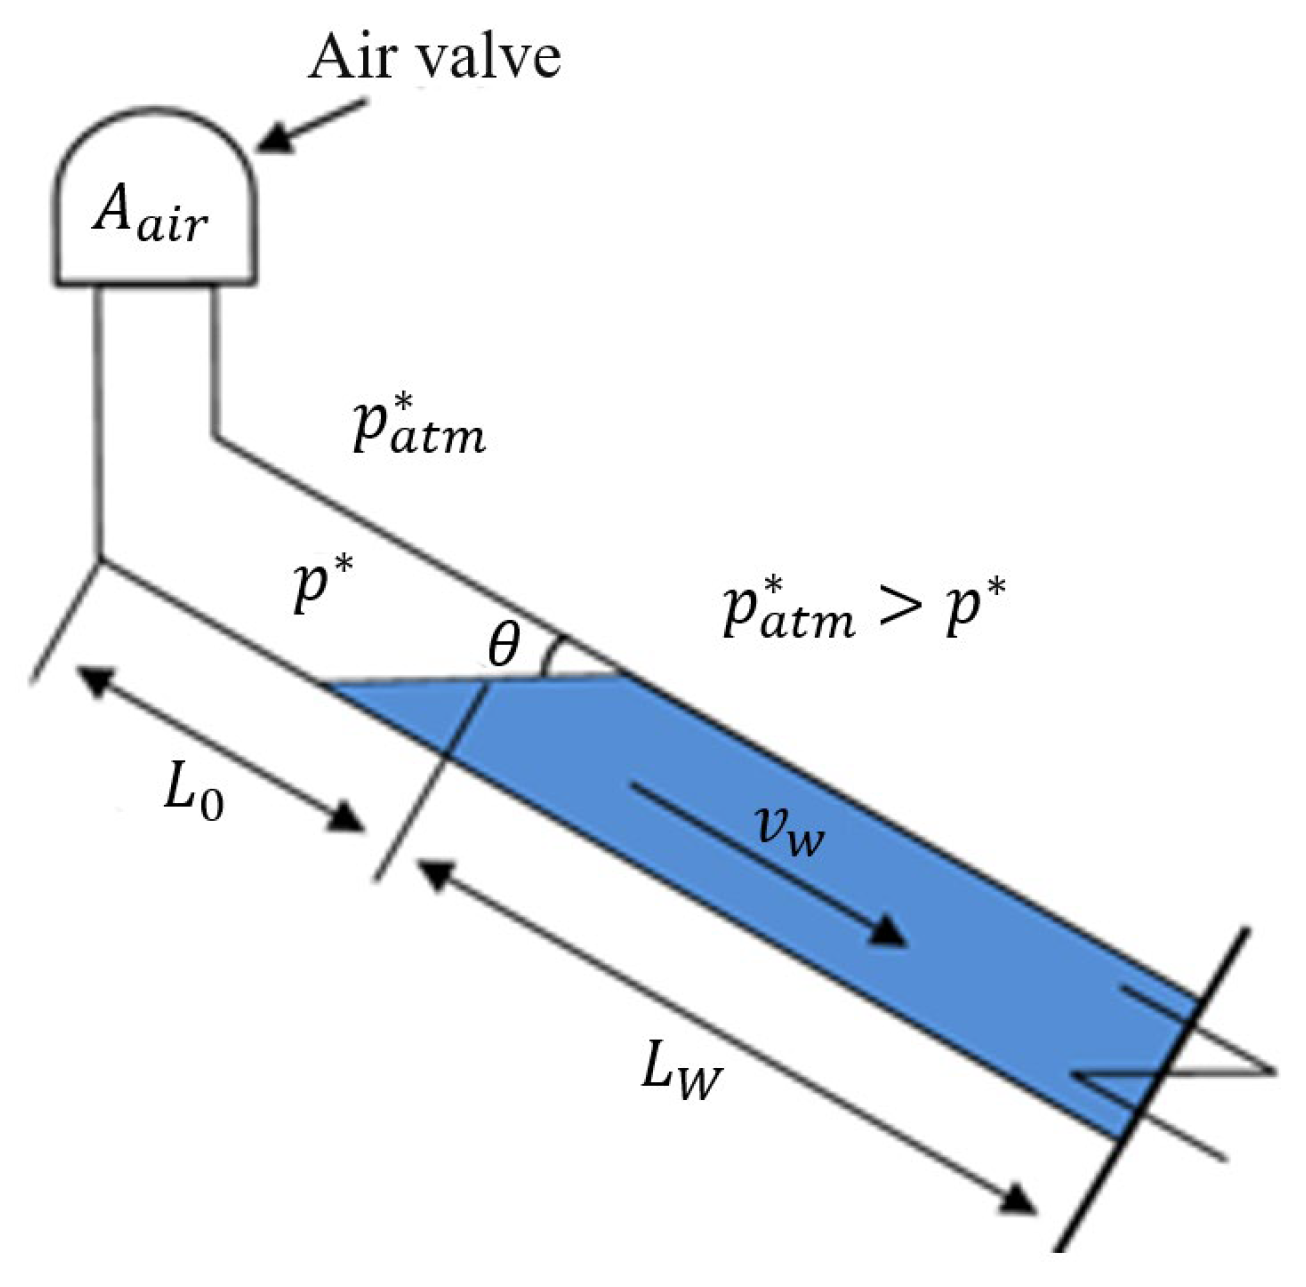
Figure 1. Schematic Diagram of Water Drainage in a Pressurized Pipeline.
Water 17 03022 g001
Figure 2. The comparison results between the simulation results and the experiments.
Water 17 03022 g002
Figure 3. Influence of Different Valve Opening Strategies on Vented Cavity Pressure Head.
Water 17 03022 g003
Figure 4. Changes in Resistance Coefficient under Various Valve Opening Strategies.
Water 17 03022 g004
Figure 5. Effect of Cavity Length on Drainage Flow Velocity.
Water 17 03022 g005
Figure 6. Effect of Drainage Valve Opening on Drainage Flow Velocity.
Water 17 03022 g006
Figure 7. Effect of Air Valve Diameter on Drainage Flow Velocity.
Water 17 03022 g007
Figure 8. The influence of the initial length of the cavity on the pressure head.
Water 17 03022 g008
Figure 9. Effect of Drainage Valve Opening on Pressure Head.
Water 17 03022 g009
Figure 10. The influence of air valve diameter on the pressure water head.
Water 17 03022 g010
Figure 11. Longitudinal profile of the Heihe emptying pipeline.
Water 17 03022 g011
Figure 12. Research plan.
Water 17 03022 g012
Figure 13. The variation of cavity pressure water head in different drainage schemes.
Water 17 03022 g013
Figure 14. Variation of Drainage Flow Rate under Different Drainage Schemes.
Water 17 03022 g014
Table 1. Summary of relevant studies.
Research SourceMathematical ModelKey Control ParametersValve Opening LawAir Valve Arrangement
Coronado-Hernández and Fuertes-Miquel et al. [11,15,17] Rigid water column model for single-pipe systemsValve opening time, air valve orifice size, pipe slopeLinear openingSingle air valve
Tasca and Bian et al. [18,19] One-dimensional transient flow modelBreak-point opening, air valve orifice sizeTwo-stage linear closingOrdinary, three-action or improved dual-orifice air valve
Wu et al. [20]Coupled 3D CFD & MOC transient flow modelBuffer plate orifice sizeStaged exhaust triggered by pressure differenceStaged exhaust air valve
Li et al. [21]Combined air vessel–relief valve transient model (MOC)Valve opening/closing lawTwo-stage linear closingIntegrated air vessel & over-pressure relief valve
Table 2. Calculation Cases for Water Drainage with an Air Valve.
Working Condition NumberInitial Length of the Emptying ColumnMaximum Valve OpeningDiameter of the Air Inlet Hole of the Air Valve
Test 10.3 m20%0.005 m
Test 20.5 m20%0.005 m
Test 31.0 m20%0.005 m
Test 40.5 m10%0.005 m
Test 50.5 m20%0.005 m
Test 60.5 m30%0.005 m
Test 70.5 m20%0.003 m
Test 80.5 m20%0.005 m
Test 90.5 m20%0.008 m
Table 3. Pipeline parameters.
Pipe Section NumberIIIIIIIVV
Pipe length (m)732.12777.07749.98750.00159.26
Elevation difference (m)33.114.834.757.341.91
s i n θ 0.04520.00620.00630.00980.0120
Disclaimer/Publisher’s Note: The statements, opinions and data contained in all publications are solely those of the individual author(s) and contributor(s) and not of MDPI and/or the editor(s). MDPI and/or the editor(s) disclaim responsibility for any injury to people or property resulting from any ideas, methods, instructions or products referred to in the content.