Abstract
Hydrogen and oxygen isotopes in atmospheric water vapor (δv) and precipitation (δp or δr) were continuously measured using a laser-based water isotope spectrometer in Guangzhou, southeastern China, from March 2016 to February 2018. The measurements were conducted to investigate the variations in water isotopes in the hydrological cycle under the subtropical monsoon climate. The isotopic composition ranged from −24.4‰ to −11.1‰ for δ18O in water vapor (δ18Ov) and from −11.5‰ to 2.3‰ for δ18O in precipitation (δ18Or). The values of δv and δr were enriched during the dry season and depleted during the wet season, exhibiting systematic seasonal variation. A negative correlation was observed between monthly δv and precipitation amount, indicating that the values of δv exhibits an ‘amount effect’. However, a corresponding amount effect was not observed in the values of δr. The mean difference between δv and δr was −9.7‰ for δ18O and −76‰ for δD, suggesting that equilibrium fractionation is the dominant process during precipitation. The local meteoric vapor line (LMVL) for Guangzhou (δD = 6.6δ18O − 6.4) exhibited a slope similar to that of the equilibrium local meteoric vapor line (ELMVL) but with an intercept difference of 8.6. This difference in intercepts can be attributed to the vertical profile of δv. The δD-q (q refers to water vapor concentration) relationship is useful for identifying water vapor sources and tracking isotopic changes during atmospheric transport and precipitation. The local water vapor was found to originate primarily from the mixing of oceanic air masses. Data points falling between the oceanic source mixing line and the Rayleigh curve likely reflect post-condensation processes, such as raindrop re-evaporation or mixing with surrounding ambient vapor. Short periods of heavy precipitation were observed to cause severe depletion in δv, resulting in values falling below the Rayleigh curve.
1. Introduction
Stable isotopes of oxygen and hydrogen in water (δ18O, δD) are well-established tracers for studying the atmospheric water cycle at a range of spatial and temporal scales [1,2,3]. Due to their stability, they are widely utilized not only for identifying water sources, the investigation of surface and groundwater formation conditions and hydrological processes, but also for paleoclimate reconstruction and the validation of global circulation models (GCMs) [4,5,6]. Traditional interpretations of precipitation isotopic ratios rely on the temperature effect, amount effect, altitude/elevation effect and continental effect [1,2]. However, the isotopic composition of atmospheric water vapor (δv) contains additional information on evaporation, large-scale mixing and kinetic fractionation that is not captured by precipitation alone.
The transport of atmospheric water vapor is a process with spatiotemporal continuity. Consequently, the analysis of δv allows for a more comprehensive investigation of the redistribution and replenishment components within the water cycle, facilitating a specific understanding of the characteristics and history of water vapor across various spatiotemporal scales. Over the past decade, the development of laser spectrometer technology has facilitated rapid advancements in the observation of δv from the surface to the troposphere [7]. Isotopic data from water vapor have been introduced to refine GCMs [6], to enhance the understanding of hydrological cycles at different scales (e.g., evapotranspiration partitioning) [8], and to verify and evaluate satellite-based observations of δv [9]. The volume of δv datasets has increased tremendously over the past decade, and various explanations for the observed isotopic variations have also been proposed. On a seasonal scale, the monthly values of δ18O and δD in water vapor have been shown to exhibit a unimodal trend [10], and diurnal cycles in δv have also been documented [11]. The spatiotemporal variations of δv have been found to be influenced by monsoon activity [12], extreme climatic events [13], air mass trajectories [14], tropical depressions [15], and local geographical conditions [16]. Furthermore, diurnal variations in δv have been linked to processes such as local evapotranspiration [10] and convection [12].
Research on precipitation isotope ratios (δp or δr) in the Southeast Asian monsoon region has a long history, notably through the Global Network of Isotopes in Precipitation (GNIP), which was initiated in 1960 by the International Atomic Energy Agency (IAEA) and the World Meteorological Organization (WMO). Through the GNIP program, long-term datasets of δr, spanning over 50 years, have been established for locations such as Hong Kong, Diego Garcia Island, and Mumbai. However, few long-term observations of δv in the Southeast Asian monsoon region, as well as concurrent measurements of both δv and δr in its coastal areas, have been published. Nevertheless, some short-term measurements, such as a month-long study of δv within a mangrove ecosystem, have been reported [17]. Given that South China is one of the world’s most climatically complex regions, influenced by both the southeast and southwest monsoons, the study of δv in this area can provide crucial information for paleoclimatic interpretations derived from stable water isotope records. Therefore, the present study was undertaken in Guangzhou to investigate the δv of near-surface water vapor and δr. The primary objectives were: (1) to characterize the local isotopic signatures of atmospheric water; (2) to analyze the meteorological variables influencing δv; (3) to compare the differences between δv and δr; (4) to determine the dominant isotopic fractionation process during precipitation; and (5) to assess the utility of water vapor isotopes for identifying moisture sources.
2. Method
2.1. Measurements and Calculations
The monitoring site for δv and δr was established at the Panyu Campus of Sun Yat-sen University in Guangzhou, China (113.32° E, 23.13° N; elevation ~6 m a.s.l.). The site is characterized by a typical subtropical monsoon climate, with a mean annual temperature of 22.8 °C. The mean annual precipitation over the past three decades is 1797.9 mm (The average meteorological data of Guangzhou from 1974 to 2014 is obtained from the website of China Meteorological Data Service Center (CMDC, http://data.cma.cn/, accessed on 1 January 2019)). The coastal region of Southern China is primarily influenced by three main moisture source pathways: the Indian Ocean, the South China Sea, and the western Pacific Ocean (Figure 1). Four meteorological parameters (air temperature, relative humidity, wind speed, and precipitation) were continuously measured and recorded by an on-site automatic meteorological station. See the supplementary information for more on the sample collection process.
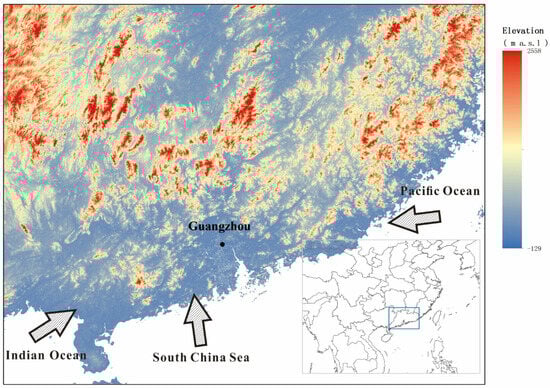
Figure 1.
Location of samples (black dot) and the possible water vapor sources in Guangzhou. The arrows roughly indicate the directions for the moisture transport.
A shielded air inlet was installed on the building’s roof at an elevation of 30 m above ground level. This inlet was connected to an ultra-high precision isotope analyzer (Picarro L2130-i, Picarro Inc., Sunnyvale, CA, USA). Water vapor was continuously sampled and measured at a rate of 34 L/min by means of a vacuum pump. A minimum of 20 s was required to obtain values of δv, and to mitigate memory effects, a 30-min average value was chosen to represent hourly vapor isotopes. When the relative humidity exceeded 95%, high-purity Perfluoroalkoxy (PFA) tubing was carefully monitored for condensation. If condensation occurred, the affected section of the tube was immediately heated. Instrument calibration was performed annually using Chinese National Standards, which are traceable to the IAEA scale as detailed in the supplementary material. Furthermore, Working Standards were employed to calibrate the water samplers and verify the instrument’s status. Additional details regarding the calibration process are provided in the supplementary file [18,19,20,21,22,23,24,25].
In total, 239 daily rain samples were collected. These samples were sealed in 50 mL plastic bottles with Parafilm and stored at 4 °C prior to analysis using the ultra-high precision isotope analyzer. The isotope analyzer is capable of measuring up to 100 liquid samples per run, including four standard samples. Typically, isotopic measurements of liquid samples are performed within one week of their collection. However, during periods characterized by infrequent precipitation, the samples are held and analyzed only after a collection period of one month has been completed.
The simultaneous observation period for both water vapor and precipitation spanned 128 days. The isotope ratios of water are presented in parts per thousand, as follows:
where and denote the ratios of stable isotopes of oxygen or hydrogen (18O/16O or D/H) for the sample and Vienna Standard Mean Ocean Water (V-SMOW), respectively. Following processing with the SICalib program, provided by the IAEA and incorporating memory correction, drift correction, calibration, and uncertainty calculation, the precision for liquid water was determined to be 0.04‰ for δ18O and 0.4‰ for δD. Similarly, the precision for water vapor was 0.30‰/60 s for δ18O and 1.11‰/60 s for δD. The monthly weighted average of δr is calculated using the following equation:
where , i and represent the isotope ratio of precipitation and the amount of precipitation on rainy day i, respectively. Here, n signifies the number of rainy days. Precipitation isotopes can include those from both rainwater and snow. For this study, only rainwater samples were collected. Therefore, the subscript label for isotope ratio of precipitation is set to “r” instead of “p”.
Assuming that precipitation adheres to equilibrium isotope fractionation during precipitation, the equilibrium isotope value (δe) in water vapor can be estimated from δr and the equilibrium fractionation factor () [26]. Subsequently, an equilibrium local meteoric vapor line (ELMVL) can be established. If the ground elevation is known, the isotope ratios of water vapor and liquid water can be estimated for a given height, such as the cloud base level [27]. The isotope ratio of water vapor () at a specific height (z) can then be calculated using the following formula [7]:
where represents the surface groundwater isotope ratio of water vapor, denotes the equilibrium fractionation factor at the specific temperature, and is the height of the water vapor scale (the average cloud base height).
When the value of δv is positively correlated with temperature, δv can be described as a function of specific humidity for Rayleigh fractionation. The following equation was used to represent the value of δv [7]:
In this equation, and refer to the initial and final isotope ratios of water vapor, respectively. Similarly, (25 mmol/mol) and are the initial and final specific humidities, respectively. The term (at 25 °C) is defined as previously stated.
2.2. Moisture Source Diagnostic
A characterization of the water vapor transport reaching the study site was performed using humidity source diagnostic calculations. These calculations were based on the Hybrid Single-Particle Lagrangian Integrated Trajectory (HYSPLIT) model, a tool developed jointly by the Air Resources Laboratory (ARL) of the National Oceanic and Atmospheric Administration (NOAA) and Australia’s Melbourne Meteorological Research Institute. Global Data Assimilation System (GDAS) meteorological data, with a horizontal resolution of 1° × 1°, were utilized as input. HYSPLIT provides specific meteorological variables as outputs, including hourly pressure, altitude, temperature, and specific humidity along each trajectory.
Trajectories of air masses arriving at the observation point at the same daily time (18:00 UTC) were calculated separately. To identify the vapor transport sources contributing to terminal precipitation, an analysis of the hourly position and humidity variation in air masses was conducted. This analysis focused on parcels with humidity <0 in the high-altitude sink area at a starting point of 1500 m. Subsequently, eligible moisture trajectories were selected for clustering analysis. The total number of air mass trajectories clustered over a three-month period was used as a proxy for one season.
3. Results
3.1. Meteorological Measurements
Air temperature ranged from 3.3 °C to 37.0 °C, with an average of 21.9 °C (Table 1). Relative humidity varied from 36% to 100%, averaging 85%. Relative humidity exceeded 77% for more than 270 days annually. Monthly average relative humidity was observed to be higher than 80% from March to September, with the lowest value recorded in February. The total precipitation during the study period was 6213.4 mm, 75% of which occurred from April to September. Consequently, the wet season is defined as April to September, and the dry season as November to February. March and October were considered transition periods for seasonal change. Wind speed varied from 0.04 m/s to 8.70 m/s, with an average of 2.00 m/s. Lower values were observed during the wet season, while higher values were recorded in the dry season, with a maximum fluctuation of 5.82 m/s.

Table 1.
Monthly mean values of temperature, relative humidity, precipitation amount and the isotopes values of vapor (δv), precipitation (δr) and equilibrium vapor (δe).
3.2. The Isotopic Composition of Water Vapor and Precipitation
The daily δ18Ov values in the wet season ranged from −24.6‰ to −9.9‰, with an amplitude of 14.6‰. In contrast, during the dry season, values ranged from −19.9‰ to −11.1‰, with an amplitude of 8.9‰. The variability of δv during the wet season was greater than that observed in other periods. This observation is consistent with findings from Beijing [10], New Haven [28], and Japan [29]. Similar variations were observed for δD compared to δ18O during the study period.
Monthly δ18Ov values exhibited an increase prior to the onset of the wet season (Table 1). A continuous decrease was observed from −12.1‰ in April to −18.6‰ (−13.1‰) in September 2016. Subsequently, an increase was noted from October to December, followed by another decrease during the early summer monsoon period. Similar systematic seasonal variations in δv were also observed for 2017 and 2018. The values of δv also exhibit enrichment during the dry season in high-latitude regions, such as the Antarctic Plateau [30] and the Tibetan Plateau [31].
Monthly δ18Or values decreased from −1.3‰ in April to −5.1‰ in September, subsequently increasing from October 2016. Consistent with previous studies, depletion of light isotopes in precipitation during summer and enrichment during winter have been observed in Guangzhou [32,33].
Both δv and δr exhibited systematic seasonal changes, which were influenced by monsoonal patterns. The isotopic characteristics of water vary considerably across different regions. Seasonal variations in δv have been observed across a wide range of climatic zones, from tropical savanna climates (e.g., Darwin, Australia) [16] to humid continental climates (e.g., Kourovka, Russia) [34].
The δ18Oe values ranged from −23.5‰ to −7.5‰, with an average of −15.0‰. The variability during the wet season (−14.6‰) was approximately 1.5 times greater than that observed during the dry season (−10.8‰).
3.3. Characteristics of LMWL and LMVL
The Local Meteoric Water Line (LMWL) was estimated based on the daily values of δr (Figure 2) and is expressed by the equation δD = (7.9 ± 0.1) δ18O + (9.4 ± 0.8) (N = 239, R2 = 0.95). The slope and intercept of this LMWL were consistent with the isotopic characteristics typically observed in low-latitude regions characterized by high temperatures, high relative humidity, and low altitudes. The Local Meteoric Vapor Line (LMVL), derived from daily isotope ratios of water vapor, was δD = (6.5 ± 0.1) δ18O − (9.5 ± 16.5) (N = 386, R2 = 0.90). The LMVL exhibited a smaller slope and a negative intercept when compared to the LMWL. The negative intercept of the LMVL diverges from the simulations of several general circulation models, including ECHAM, GISS, LMDZ, and isoGSM [14,15,35,36]. Presently, isotopic data for water vapor provided by GNIP and other published works consistently show negative intercepts for LMVLs, such as −1.43 for Vienna, −10.81 for Rehovot, and −3.13 for Beijing. The Equilibrium Local Meteoric Vapor Line (ELMVL) was determined to be δD = (7.1 ± 0.1) δ18O − (0.9 ± 1.6) (N = 239, R2 = 0.95). The intercept of the ELMVL was also found to be negative.
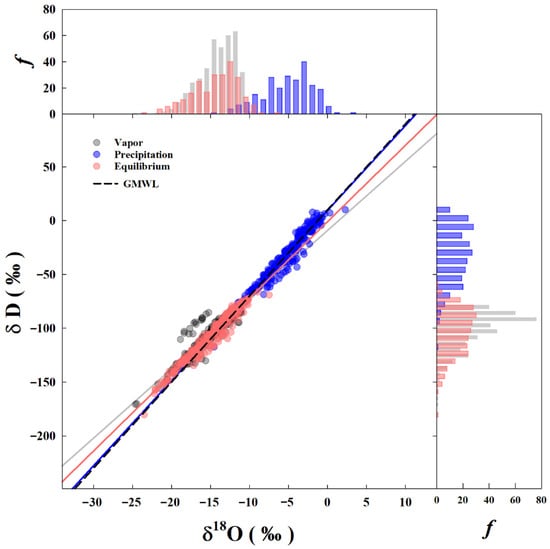
Figure 2.
Distribution and frequency of isotope ratios of precipitation, water vapor and equilibrium water vapor.
4. Discussion
4.1. Isotope Effect of Precipitation and Water Vapor
A negative correlation was observed between the daily value of δ18Or and precipitation amount (P) during the wet season (r = −0.21, p < 0.01), whereas a positive correlation (r = 0.11) occurred in the dry season (Table 2). On an annual scale, a negative correlation was observed between δ18Or and P (r = −0.22, p < 0.01). These results suggested that the daily values of δr in Guangzhou do not exhibit a pronounced amount effect. Interestingly, an “inverse amount effect” during the wet season has been reported for certain subtropical and tropical regions, such as observations from Guam and New Delhi [37]. Conventional interpretations of the amount effect have often failed to adequately explain isotopic variations in these climates. In such regions, precipitation is predominantly derived from deep convection, where vertical movement dominates over horizontal transport. Consequently, the amount effect can be modified by convection or large-scale advection processes [35,38].
Table 2.
Pearson correlation analysis for isotope ratios of water vapor and precipitation.
A significant negative correlation between δ18Or and temperature (T) was consistently detected throughout the year, as well as in both the wet and dry seasons. This relationship is in opposition to the anticipated temperature effect. This finding is contrary to the expected temperature effect. This pattern is similar to that observed for summer precipitation isotope ratios in middle- latitude and low-latitude coastal or monsoon regions in eastern China [39]. Spatial variations in the temperature effect may be attributed to eddy diffusion and large-scale advection influencing water vapor transport [38].
The intensity of kinetic fractionation during evaporation is primarily controlled by relative humidity (RH) and wind speed (V). Low relative humidity provides the driving force for evaporation, whereas high wind speed enhances and sustains this fractionation by disrupting the saturated vapor layer above the liquid surface [40]. These factors jointly determine the isotopic composition of source-region water vapor and ultimately influence the isotopic ratios observed in precipitation. In New Haven, RH, rather than T, has been identified as a superior predictor for changes in δ18Or on short timescales (e.g., less than a few weeks) [28]. But no significant correlation was demonstrated between δ18Or and either RH or V in Guangzhou.
During the wet season, the correlation between the daily values of δ18Ov and P was relatively weak (r = −0.16, p < 0.05). On the annual scale, the negative correlation between δ18Ov and P was even weaker (r = −0.10, p < 0.05). Similarly to the δr, no clear amount effect was detected for δv in Guangzhou. However, when the monthly weighted average values of δv were utilized, the correlation coefficient between them increased to −0.23 (p < 0.05). Previous studies have also reported amount effects in δv, although these can be modified by convection [41,42]. This suggests that the amount effect between the δv and δr needs to be established at a scale longer than the monthly scale. Long-term observations of δv are required to establish the relationship between δv and atmospheric processes such as condensation, convection, and atmospheric circulation.
At both the annual scale and during the wet season, the daily values of δ18Ov showed weak correlations with T (r = −0.08 and −0.01, respectively). The δ18Ov values in the dry season were positively correlated with T (r = 0.33, p < 0.01), indicating that the temperature effect on the values of δv is active during the dry season in Guangzhou. It is recognized that the relationship between the δv and T exhibits both temporal and spatial variability [37,43]. One explanation is that temperature effect can be altered by mixing processes along trajectories and by isotope exchange with the lower surface [44]. During the wet season, the extensive scouring by large amounts of precipitation, coupled with the mixing of surface evaporation under high T and high RH conditions, appears to obscure the temperature effect. An alternative explanation is that the values of δv is likely related to the last saturation temperature, rather than the local temperature [45,46].
A weak but significant positive correlation was observed between δ18Ov and RH (r = 0.18, p < 0.01) on an annual scale. This relationship reflects the influence of local weather conditions in dry season [40,47]. A correlation between RH and δv has been observed in both subtropical and high-latitude regions. For instance, a significant correlation exists between δv and RH in Greenland [48]. This suggests that the seasonal variations in δv are related to local weather conditions. In East Asia, the relationship between δv and RH is attributed to vertical moisture mixing, which can induce changes in water vapor mixing concentration, consequently leading to variations in near-surface δv [7]. Under conditions of low RH, the depletion of heavy isotopes from surface evapotranspired water vapor would decrease the overall δv, leading to a significant positive correlation between dv and RH (r = −0.30, p < 0.01).
The correlation coefficient between V and δ18Ov was −0.27 (p < 0.01) throughout the year, but it weakened to −0.18 (p < 0.01) in the wet season. For coastal regions, V may represent one of the most critical factors influencing δv. High V can enhance turbulent mixing within the atmospheric boundary layer, promoting cyclical variations in δv [49]. Strong convective are also a significant factor that limits variations in δv in coastal areas. Increased subsidence from high-pressure systems facilitates the transport of dry air from the upper atmosphere to the surface, which is typically associated with calm or low-wind conditions [30]. Changes in water vapor mixing concentration occur under these conditions, leading to variations in δv.
4.2. Relationship and Deviation Between Isotope Ratio of Water Vapor and Precipitation
4.2.1. Correlation Controlled by Equilibrium Fractionation
Both equilibrium and kinetic fractionation play critical roles in the variability of stable isotopes in water [1,2,3]. In this study, three complementary approaches were employed to assess whether equilibrium fractionation prevailed during precipitation: (1) the isotopic difference between precipitation and water vapor; (2) the intercept difference between the LMWL and LMVL; and (3) the deviation of observed vapor isotopic composition from its theoretical equilibrium value.
First, the values of δv were observed to be substantially lower than those of δr. On the annual scale, the deviations between δv and δr (δ18O = −9.6‰, δD = −75‰) were found to be very close to the liquid–vapor equilibrium fractionation values under 25 °C conditions (δ18O = −9.3‰, δD = −74‰). This indicates that the isotopic fractionation signals recorded locally are consistent with those predicted by the equilibrium fractionation process. Furthermore, it would be expected that if kinetic fractionation were a dominant process, considering the mass difference between hydrogen and oxygen isotopes, the deviation between δv and δe would be expected to exceed that between δv and δr. However, measurements conducted in Guangzhou during 2016~2018 demonstrated the opposite, as the mean deviations between δv and δe were only δ18O = −0.22‰ and δD = −2‰.
Second, the slopes of LMWL and LMVL were found to be 7.90 and 6.45, with intercepts of 9.35 and −9.51, respectively. A key expectation under conditions of ideal equilibrium fractionation is that the intercept of the LMVL would be predicted to be consistent with the intercept of the LMWL, assuming complete vapor saturation accompanies precipitation. In this study, the absolute difference in the intercepts was found to be only 0.06, and the slopes were similar. This minimal deviation indicates that non-equilibrium fractionation during the precipitation process is not the dominant controlling factor, and the system is operating close to ideal equilibrium fractionation. This suggests that the kinetic fractionation experienced by precipitation during its fall, particularly re-evaporation, is a very weak process.
Third, the scatter plot of the δv and the δe indicates that most samples are distributed near the 1:1 line. This distribution suggests that the local isotopic composition of atmospheric water vapor is in good agreement with the values predicted by equilibrium fractionation.
Deviations from the 1:1 line were found to be primarily associated with precipitation events of less than 5 mm or greater than 50 mm. This observation is consistent with previous research, which has shown larger deviations between δv and δe occurring during cold months without P and during months with low P [8]. Additional research has further demonstrated that the values of δv are sensitive not only to sub-cloud processes during periods of limited precipitation but also to heavy rainfall events [12]. The greater deviations that occur during low-precipitation and high-precipitation events suggest that the values of δv near-surface cannot be accurately predicted using the values of δe under these conditions. To investigate the potential relationship, an analysis was performed between the values of δv and δe and P to determine if the deviation would increase or decrease with varying P. However, it was determined that P is not the primary cause of these observed deviations (Figure 3). Instead, the differences between δv and δe are likely attributable to additional processes, such as shallow convection or turbulence, reversible adiabatic processes, convective entrainment, re-evaporation of raindrops, or post-condensation isotopic exchange, all of which influence local variations in δv [7].
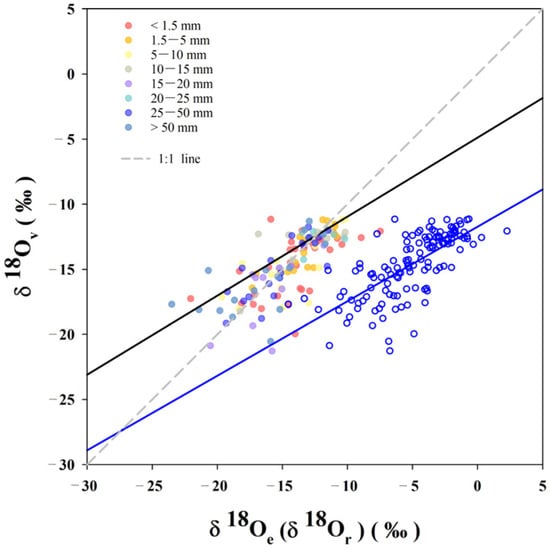
Figure 3.
Relationship of δ18O in precipitation, water vapor and equilibrium vapor. The blue hollow regression line of vapor and precipitation is δ18Ov = 0.9δ18Or + 8.2 (N = 128, R2 = 0.54), and the black regression line of water vapor and equilibrium vapor is δ18Ov = 0.7δ18Oe − 5.2 (N = 128, R2 = 0.54). Different colored dots indicate different amounts of precipitation.
4.2.2. Mixing of Ground-Level Water Vapor into the Cloud Base
The observed difference in the intercept (8.6) between the LMVL and the ELMVL, while maintaining similar slope values, can potentially be attributed to the vertical profile of the isotope ratio in water vapor. A water vapor concentration gradient exists between near-surface water vapor and the free atmospheric layer, with varying temperatures at different altitudes. Changes in temperature influence the saturated vapor pressure, leading to the development of a vertical profile of vapor isotopes [42].
Previous studies have verified the altitude effect on the isotope ratio in precipitation [2,50]. Obtaining high-resolution data on the altitude effect of the isotope ratio in water vapor typically necessitates the use of aircraft and remote sensing instruments. Given the limitations of the available sampling equipment, it was assumed that the isotope ratio of water vapor exhibits an altitude effect similar to that of precipitation. The measured isotope ratio of near-surface water vapor was utilized as the basis for a simplified estimation of the water vapor isotope ratio at different heights, which can be calculated using Equation (3). Figure 4a illustrates the differences in δ18O and δD between upper-tropospheric water vapor and near-surface water vapor, expressed as Δδ18O and ΔδD, respectively. For every 500 m increase in height/altitude, the change in δ18Ov was approximately −0.05‰, while the change in δDv was about −4‰. As height increases, the absolute value of ΔδD progressively increases, resulting in a corresponding increase in the absolute value of the LMVL intercept. In other words, the discrepancy in the intercept between the LMVL and ELMVL was caused by the differential variation of δ18O and δD with height.
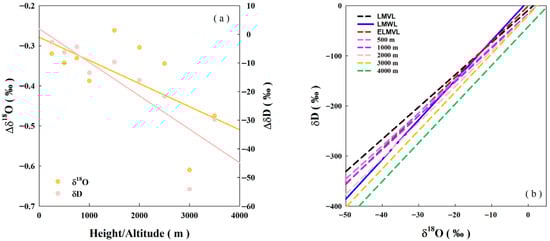
Figure 4.
(a) Differences in δ18O and δD between upper-tropospheric water vapor and near-surface water vapor, expressed as Δδ18O and ΔδD, respectively (b) relationship between δD and δ18O in different height/altitude.
The LMVL at different heights is presented in Figure 4b. As height increases, the difference between the intercept of the LMVL and ELMVL becomes more pronounced. The intercept decreased from −9.5 at an altitude of 500 m to −16.5 at 3000 m, which is consistent with other reported results [3,51]. A steep vertical gradient of δv is known to exist, primarily due to the background thermal structure and its influence on condensation history [42]. Consequently, the distinct intercepts of the LMVL and ELMVL are considered to result from differences in the vertical profiles of δv.
Furthermore, it can be observed that the ELMVL was most closely aligned with the LMVL corresponding to altitudes of 750–1000 m. When the equilibrium isotope ratio of water vapor matches the isotope ratio of water vapor below the cloud base, it can be interpreted that the deviation between δe and δv is a result of the mixing of water vapor from the surface to the cloud base. This suggests that local precipitation typically occurs at an altitude of 750–1000 m. In fact, the average cloud base height during summer in South China ranges approximately from 400 to 1000 m, with convective precipitation being predominant in spring and summer. In contrast, multi-layer cloud precipitation is dominant in winter, with average cloud base heights exceeding 1000 m [52].
4.3. Identification of Local Water Vapor Sources
The relationship between water vapor concentration (q) and the isotope ratio of water vapor (δD) is considered a fundamental aspect of the two-end-member mixing model in water vapor isotope research [53]. The combination of the Rayleigh curve, the mixing curve, and the δD − q relationship can be employed to identify the sources of atmospheric water vapor. The δD − q relation (Figure 5a) was derived from Equation (4) and water vapor measurements obtained from space-borne platforms [5,9]. Both the Rayleigh curve and the mixing curves were established as functions of water vapor concentration.
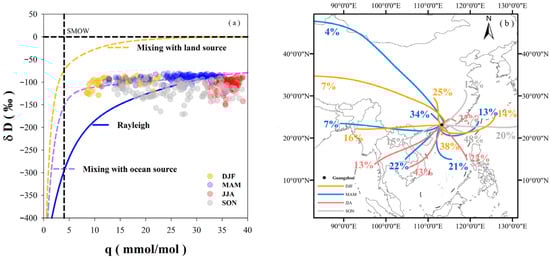
Figure 5.
(a) Isotope ratio (δD) as a function of the water vapor concentration or mixing ratio (q). The blue theoretical line represents the evolution of the air mass undergoing Rayleigh fractionation (δD = −100‰, q = 25 mmol mol−1, T = 20 °C), where all condensate is immediately removed from the vapor phase. Theoretical mixing is assumed to occur with air masses evaporating from the ocean surface, leading to moistening (purple line, δD = −84‰, q = 20 mmol mol−1), and with air masses originating from the free troposphere, resulting in drying (yellow line, δD = −400‰, q = 4 mmol mol−1) [42,53]. (b) Results of water vapor backward trajectories in four seasons.
Water vapor concentration (q) within the 500–825 hPa layer typically ranged between 0 and 10 mmol/mol [53,54]. The total vertical structure of δD in tropical regions has been characterized, showing a minimum value of −675‰ near 15 km and nearly constant values maintained above the stratosphere [53,54]. Unlike the satellite-derived results, q in Guangzhou were considerably higher, often exceeding 20 mmol/mol and, in some cases, even 30 mmol/mol, with δD values predominantly around −100‰. In Guangzhou, the values of δv during the wet season has been observed to closely follow the Rayleigh curve, owing to its proximity to oceanic moisture sources. By contrast, in the dry season, when water vapor is primarily derived from a mixture of both oceanic and continental sources, the isotopic signatures tend to deviate from the Rayleigh curve. In a mixed state with the same q, the values of δv resulting from mixing is expected to be significantly larger than that predicted by Rayleigh fractionation/distillation [53].
Over 38% of the values of δv exhibited characteristics consistent with mixing with oceanic sources, falling near the mixing curve for such sources. Water vapor characterized by high temperature and high humidity plotted on the oceanic source mixing curve, indicating either rapid movement after evaporation from the ocean or significant turbulent mixing [7]. Most subtropical areas experience reversible adiabatic exchange, and water vapor within the oceanic boundary layer is dominant before mixing with local water vapor [47,53,54].
Points falling between the oceanic source mixing curve and the Rayleigh curve, which accounted for 8% of the observations, could be attributed to post-condensation processes such as re-evaporation or mixing with surrounding air. The subtropical region near the ocean is characterized as an active convection area. The transport and mixing processes of vertical air masses can change within 1–3 days. Such short-term variations may be caused by water vapor interference with local or other regional atmospheric masses [47,53]. Condensed precipitation is a process during which water vapor undergoes dramatic changes. Evaporation occurring below the cloud base would lead to changes in q. Furthermore, strong convection in subtropical and tropical regions often results in mixing with surrounding air [35].
For values falling below the Rayleigh curve, predominantly observed during June-July-August (JJA) and September-October-November (SON), the amount effect associated with remoisture processes occurring below the cloud base is understood to produce a δv value lower than that expected by Rayleigh fractionation [53,54]. Satellite observations have indicated that an increase in precipitation rate can cause a portion of the values of δv to fall below the Rayleigh curve [7], a finding consistent with our observations. As Guangzhou is characterized by an East Asian monsoon climate with two flood seasons (MAM and JJA), typhoons frequently occur during the JJA, contributing to 36% of the total precipitation. A short period of heavy precipitation is known to cause severe depletion of heavy isotopes in water vapor, resulting in values falling below the Rayleigh curve.
During the dry season, 7% of the δv values were located in the region indicative of mixing between land and ocean water vapor sources. The distribution of air trajectories simulated by HYSPLIT was found to be consistent with the δD−q relationship. Although the contribution from winter continental vapor trajectories increased to 39%, this was insufficient to diminish the predominance of the oceanic vapor source. Furthermore, strong winter winds are known to facilitate post-condensation processes, such as the re-evaporation of raindrops and their mixing with ambient air. These processes enhance isotopic kinetic fractionation, which contributes to greater deviations between the observed δv and the values predicted by the Rayleigh fractionation model.
The points situated between the oceanic source mixing curve and the Rayleigh curve originated from months marking the transition between the rainy and dry seasons. During these transitions, air trajectories from the ocean sharply declined, while those from westerlies and the northern mainland increased, and vice versa. It is important to note that the local δD−q relationship did not feature points indicative of mixing with land sources. This absence is attributed to the fact that only values of δv collected during precipitation events were selected, a period when the contribution from land water vapor sources was minimal.
5. Conclusions
Measurements were presented for hydrogen and oxygen stable isotopes in atmospheric water vapor (δv) near-surface and precipitation (δr). Combined with simultaneous meteorological data, precipitation processes and isotopic fractionation during phase transitions were explored. The variations in the values of δv are consistent with those observed in the values of δr, exhibiting systematic seasonal pattern characterized by heavy isotope depletion during the wet season and heavy isotope enrichment during the dry season.
Atmospheric circulation serves as the underlying control for the temporal variations in the values of δv and δr. The variability in the values of δv during the wet season was found to be smaller than that in the dry season, whereas the opposite trend was observed for the variability in values of δr. The values of δv are significantly influenced by meteorological factors, with the dominant factors varying across seasons. Among these, wind speed was found to have the most significant impact on the values of δ18Ov, whereas relative humidity was identified as a secondary factor influencing the variations of δ18Ov in coastal regions. Subsidence of water vapor within the boundary layer under conditions of low humidity and low wind speed can lead to the depletion of light isotopes in water vapor.
A monthly amount effect was observed for δv, but no such effect was evident for δr. The observed amount effect on the values of δv is more likely attributable to water vapor mixing under conditions of strong convection, high humidity, and high wind speed. Long-term observations of δv are required to establish the relationship between δv and atmospheric processes.
On an annual scale, the deviations between δv and δr (−9.7‰ for δ18O and −76‰ for δD) was found to be very close to the liquid–vapor equilibrium fractionation values under 25 °C conditions (δ18O = −9.3‰, δD = −74‰). This finding indicates a high degree of consistency between the δv and the predictions of equilibrium fractionation in Guangzhou.
The slopes of the Local Meteoric Vapor Line (LMVL) and Local Meteoric Water Line (LMWL) are very similar, but the negative intercept of the LMVL represents a distinctive feature of δv in this region. These results present a contrast to those from isoGSM models, which typically predict a positive LMVL intercept.
The Equilibrium Local Meteoric Vapor Line (ELMVL) exhibited a similar slope to the LMVL but with an intercept difference of 8.6. The vertical distribution of δv is governed by the gradient of water vapor concentration between the near-surface and the free atmosphere, in combination with temperature variations at different altitudes. These factors collectively result in the differences between δv and δe, as well as the difference between the intercepts of the ELMVL and the LMVL.
Rayleigh fractionation typically considers changes only in the horizontal direction, without accounting for vertical variations. Utilizing the δD − q relationship, it was determined that the majority of water vapor (75%) originates from mixing with oceanic sources during the two local flood seasons. This finding is consistent with HYSPLIT simulations, which indicated that the sum of water vapor trajectories originating from the Indian Ocean, the South China Sea, and the Pacific Ocean constituted 71%. Points situated between the oceanic source mixing curve and the Rayleigh curve are indicative of the interaction between land and ocean water vapor, representing the outcome of water cycle processes during post-condensation. Heavy precipitation and rapid remoisture processes over short periods promote the depletion of water vapor isotope ratios, causing them to fall below the Rayleigh curve.
These results address existing gaps in the understanding of water vapor isotope ratios in East Asia. Furthermore, they contribute to diagnosing deficiencies in isoGSM models concerning stable water isotopes and facilitate the comparison with atmospheric vapor isotopic observations obtained from satellites.
Supplementary Materials
The following supporting information can be downloaded at: https://www.mdpi.com/article/10.3390/w17203011/s1, Figure S1: Isotopic measurement calibration of national standard samples and working standard samples; Figure S2: The deviation between isotope value of liquid water and standards under different water vapor concentrations; Figure S3: Before and after Six-hour correction, one correction & daily correction in five days and 3 m tube correction & 30 m tube correction; Figure S4: The precision of isotope composition in liquid water and water vapor; Figure S5: The relation between precipitation amounts and the isotopic deviations of water vapor and equilibrium water vapor; Table S1: Isotope ratios (‰) of the standard reference materials used to calibrate the results of Picarro isotopic analyzer.
Author Contributions
Conceptualization, X.L.; methodology, X.L.; formal analysis, X.L. and W.Q.; investigation, X.L. and Z.L.; data curation, X.L.; writing—original draft preparation, X.L.; writing—review and editing, X.L., Y.C. and C.T. All authors have read and agreed to the published version of the manuscript.
Funding
This work was financially supported by the Science and Technology Plan Project of Guangdong Province, China (Grant No. 2021B1111610001 and No. 2021B1212100003) and the Research and Development Plan of Key Areas in Guangdong Province (Grant No. 2023B1111050013).
Data Availability Statement
The data that support the findings of this study are available from the corresponding author upon reasonable request.
Acknowledgments
We appreciate constructive comments from anonymous reviewers that helped us improve our manuscripts.
Conflicts of Interest
The authors declare no conflicts of interest.
References
- Craig, H. Isotopic variations in meteoric waters. Science 1961, 133, 1702–1703. [Google Scholar] [CrossRef]
- Dansgaard, W. Stable isotopes in precipitation. Tellus 1964, 16, 436–468. [Google Scholar] [CrossRef]
- Gat, J.R. Oxygen and hydrogen isotopes in the hydrologic cycle. Annu. Rev. Earth Planet. Sci. 1996, 24, 225–262. [Google Scholar] [CrossRef]
- Malov, A.I.; Tokarev, I.V. Using stable isotopes to characterize the conditions of groundwater formation on the eastern slope of the Baltic Shield (NW Russia). J. Hydrol. 2019, 578, 124130. [Google Scholar] [CrossRef]
- Brown, D.; Worden, J.; Noone, D. Comparison of atmospheric hydrology over convective continental regions using water vapor isotope measurements from space. J. Geophys. Res. Atmos. 2008, 113, 15124. [Google Scholar] [CrossRef]
- Yoshimura, K.; Kanamitsu, M.; Noone, D.; Oki, T. Historical isotope simulation using Reanalysis atmospheric data. J. Geophys. Res. Atmos. 2008, 113, D19108. [Google Scholar] [CrossRef]
- Galewsky, J.; Steen-Larsen, H.C.; Field, R.D.; Worden, J.; Risi, C.; Schneider, M. Stable isotopes in atmospheric water vapor and applications to the hydrologic cycle. Rev. Geophys. 2016, 54, 809–865. [Google Scholar] [CrossRef]
- Wen, X.; Yang, B.; Sun, X.; Lee, X. Evapotranspiration partitioning through in-situ oxygen isotope measurements in an oasis cropland. Agric. For. Meteorol. 2016, 230–231, 89–96. [Google Scholar] [CrossRef]
- Randel, W.J.; Moyer, E.; Park, M.; Jensen, E.; Bernath, P.; Walker, K.; Boone, C. Global variations of HDO and HDO/H2O ratios in the upper troposphere and lower stratosphere derived from ACE-FTS satellite measurements. J. Geophys. Res. Atmos. 2012, 117, D06303. [Google Scholar] [CrossRef]
- Wen, X.; Zhang, S.; Sun, X.; Yu, G.; Lee, X. Water vapor and precipitation isotope ratios in Beijing. J. Geophys. Res. Atmos. 2010, 115, 133–134. [Google Scholar] [CrossRef]
- Lee, X.; Sargent, S.; Smith, R. In situ measurement of the water vapor 18O/16O isotope ratio for atmospheric and ecological applications. J. Atmos. Ocean. Technol. 2005, 22, 1305. [Google Scholar] [CrossRef]
- Gupta, P.; Noone, D.; Galewsky, J.; Sweeney, C.; Vaughn, B.H. Demonstration of high-precision continuous measurements of water vapor isotopologues in laboratory and remote field deployments using wavelength-scanned cavity ring-down spectroscopy (WS-CRDS) technology. Rapid Commun. Mass Spectrom. 2009, 2, 2534. [Google Scholar] [CrossRef]
- Steen-Larsen, H.C.; Sveinbjörnsdottir, A.E.; Peters, A.J.; Masson-Delmotte, V.; Guishard, M.P.; Hsiao, G.; Jouzel, J.; Noone, D.; Warren, J.K.; White, J.W.C. Climatic Controls on Water Vapor Deuterium Excess in the Marine Boundary Layer of the North Atlantic Based on 500 Days of in Situ, Continuous Measurements. Atmos. Meas. Tech. 2014, 14, 2363–2401. [Google Scholar] [CrossRef]
- Risi, C.; Bony, S.; Vimeux, F. Influence of convective processes on the isotopic composition (delta O-18 and delta D) of precipitation and water vapor in the tropics: 2. Physical interpretation of the amount effect. J. Geophys. Res. Atmos. 2008, 113, D19306. [Google Scholar] [CrossRef]
- Yoshimura, K.; Kanamitsu, M.; Dettinger, M. Regional downscaling for stable water isotopes: A case study of an atmospheric river event. J. Geophys. Res. Atmos. 2010, 115, 311–319. [Google Scholar] [CrossRef]
- Guan, H.; Zhang, X.; Skrzypek, G.; Sun, Z.; Xu, X. Deuterium excess variations of rainfall events in a coastal area of South Australia and its relationship with synoptic weather systems and atmospheric moisture sources. J. Geophys. Res. Atmos. 2013, 118, 1123–1138. [Google Scholar] [CrossRef]
- Aemisegger, F.; Pfahl, S.; Sodemann, H.; Lehner, I.; Seneviratne, S.I.; Wernli, H. Deuterium excess as a proxy for continental moisture recycling and plant transpiration. Atmos. Chem. Phys. 2013, 14, 4029–4054. [Google Scholar] [CrossRef]
- Steen-Larsen, H.C.; Sveinbjörnsdottir, A.E.; Jonsson, T.; Ritter, F.; Bonne, J.-L.; Masson-Delmotte, V.; Sodemann, H.; Blunier, T.; Dahl-Jensen, D.; Vinther, B.M. Moisture sources and synoptic to seasonal variability of North Atlantic water vapor isotopic composition. J. Geophys. Res. Atmos. 2015, 120, 5757–5774. [Google Scholar] [CrossRef]
- Welp, L.R.; Lee, X.; Griffis, T.J.; Wen, X.-F.; Xiao, W.; Li, S.; Sun, X.; Hu, Z.; Martin, M.V.; Huang, J. A meta-analysis of water vapor deuterium-excess in the midlatitude atmospheric surface layer. Glob. Biogeochem. Cycles 2012, 26, 1–12. [Google Scholar] [CrossRef]
- Schmidt, M.; Maseyk, K.; Lett, C.; Biron, P.; Richard, P.; Bariac, T.; Seibt, U. Concentration effects on laser-based δ18O and δ2H measurements and implications for the calibration of vapour measurements with liquid standards. Rapid Commun. Mass Spectrom. 2010, 24, 3553–3561. [Google Scholar] [CrossRef]
- Steen-Larsen, H.C.; Johnsen, S.J.; Masson-Delmotte, V.; Stenni, B.; Risi, C.; Sodemann, H.; Balslev-Clausen, D.; Blunier, T.; Dahl-Jensen, D.; Ellehøj, M.D.; et al. Continuous monitoring of summer surface water vapor isotopic composition above the Greenland Ice Sheet. Atmos. Chem. Phys. 2013, 13, 4815–4828. [Google Scholar] [CrossRef]
- Aemisegger, F.; Sturm, P.; Graf, P.; Sodemann, H.; Pfahl, S.; Knohl, A.; Wernli, H. Measuring variations of δ18O and δ2H in atmospheric water vapour using two commercial laser-based spectrometers: An instrument characterisation study. Atmos. Meas. Tech. 2012, 5, 1491–1511. [Google Scholar] [CrossRef]
- Bailey, A.; Noone, D.C.; Berkelhammer, M.; Steen-Larsen, H.C.; Sato, P. The stability and calibration of water vapor isotope ratio measurements during long-term deployments. Atmos. Meas. Tech. 2015, 8, 4521–4538. [Google Scholar] [CrossRef]
- Tremoy, G.; Vimeux, F.; Cattani, O.; Mayaki, S.; Souley, I.; Favreau, G. Measurements of water vapor isotope ratios with wavelength-scanned cavity ring-down spectroscopy technology: New insights and important caveats for deuterium excess measurements in tropical areas in comparison with isotope-ratio mass spectrometry. Rapid Commun. Mass Spectrom. 2011, 25, 3469–3480. [Google Scholar] [CrossRef] [PubMed]
- Bonne, J.L.; Massondelmotte, V.; Cattani, O.; Delmotte, M.; Risi, C.; Sodemann, H.; Steen-Larsen, H.C. The isotopic composition of water vapour and precipitation in Ivittuut, southern Greenland. Atmos. Chem. Phys. 2014, 14, 4419–4439. [Google Scholar] [CrossRef]
- Majoube, M. Fractionnement en oxygène 18 et en deutérium entre l’eau et sa vapeur. J. Chim. Phys. 1971, 68, 1423–1436. [Google Scholar] [CrossRef]
- Horita, J.; Wesolowski, D.J. Liquid-vapor fractionation of oxygen and hydrogen isotopes of water from the freezing to the critical temperature. Geochim. Cosmochim. Acta 1994, 58, 3425–3437. [Google Scholar] [CrossRef]
- Lee, X.; Smith, R.; Williams, J. Water vapour 18O/16O isotope ratio in surface air in New England, USA. Tellus B Chem. Phys. Meteorol. 2006, 58, 293–304. [Google Scholar] [CrossRef]
- Sunmonu, N.; Muramoto, K.; Kurita, N.; Yoshimura, K.; Fujiyoshi, Y. Characteristics of Seasonal Variation of Near-Surface Water Vapor D/H Isotope Ratio Revealed by Continuous in situ Measurement in Sapporo, Japan. SOLA 2012, 8, 5–8. [Google Scholar] [CrossRef]
- Casado, M.; Landais, A.; Masson-Delmotte, V.; Genthon, C.; Kerstel, E.; Kassi, S.; Arnaud, L.; Picard, G.; Prie, F.; Cattani, O.; et al. Continuous measurements of isotopic composition of water vapour on the East Antarctic Plateau. Atmos. Chem. Phys. 2016, 16, 8521–8538. [Google Scholar] [CrossRef]
- Yu, W.; Tian, L.; Ma, Y.; Xu, B.; Qu, D. Simultaneous monitoring of stable oxygen isotope composition in water vapour and precipitation over the central Tibetan Plateau. Atmospheric Meas. Tech. 2015, 15, 10251–10262. [Google Scholar] [CrossRef]
- Zhang, S.C.; Sun, W.Z.; Liu, J.M. Stable isotopes in precipitation in the vapor transport path in Kunming of Southwest China. Resour. Environ. Yangtze Basin 2005, 14, 665–669. [Google Scholar]
- Xue, J.B.; Zhong, W.; Zhao, Y.J. Stable Oxygen Isotope in Precipitation in Guangzhou in Relation to the Meteorological Factors and the Monsoon Activity. J. Glaciol. Geocryol. 2008, 30, 761–768. [Google Scholar]
- Bastrikov, V.; Steen-Larsen, H.C.; Masson-Delmotte, V.; Gribanov, K.; Cattani, O.; Jouzel, J.; Zakharov, V. Continuous measurements of atmospheric water vapour isotopes in Western Siberia (Kourovka). Atmospheric Meas. Tech. 2014, 7, 1763–1776. [Google Scholar] [CrossRef]
- Hourdin, F.; Musat, I.; Bony, S.; Braconnot, P.; Codron, F.; Dufresne, J.-L.; Fairhead, L.; Filiberti, M.-A.; Friedlingstein, P.; Grandpeix, J.-Y.; et al. The LMDZ4 general circulation model: Climate performance and sensitivity to parametrized physics with emphasis on tropical convection. Clim. Dyn. 2006, 27, 787–813. [Google Scholar] [CrossRef]
- Werner, M.; Langebroek, P.M.; Carlsen, T.; Herold, M.; Lohmann, G. Stable water isotopes in the ECHAM5 general circulation model: Toward high-resolution isotope modeling on a global scale. J. Geophys. Res. 2011, 116, D15109. [Google Scholar] [CrossRef]
- Rahul, P.; Ghosh, P.; Bhattacharya, S.K.; Yoshimura, K. Controlling factors of precipitation and water vapor isotope at Bangalore, India: Constraints from observations in 2013 Indian monsoon. J. Geophys. Res. Atmos. 2016, 121, 13936–13952. [Google Scholar] [CrossRef]
- Galewsky, J.; Hurley, J.V. An advection-condensation model for subtropical water vapor isotopic ratios. J. Geophys. Res. Atmos. 2010, 115, D16116. [Google Scholar] [CrossRef]
- Zhang, X.; Liu, J.; Sun, W.; Huang, Y.; Zhang, J. Relations between oxygen stable isotopic ratios in precipitation and relevant meteorological factors in southwest China. Sci. China Ser. D Earth Sci. 2007, 50, 571–581. [Google Scholar] [CrossRef]
- Benetti, M.; Reverdin, G.; Pierre, C.; Merlivat, L.; Risi, C.; Steen-Larsen, H.C.; Vimeux, F. Deuterium excess in marine water vapor: Dependency on relative humidity and surface wind speed during evaporation. J. Geophys. Res. Atmos. 2014, 119, 584–593. [Google Scholar] [CrossRef]
- Winnick, M.J.; Chamberlain, C.P.; Caves, J.K.; Welker, J.M. Quantifying the isotopic ‘continental effect’. Earth Planet Sci. Lett. 2014, 406, 123–133. [Google Scholar] [CrossRef]
- Lawrence, J.R.; Gedzelman, S.D.; Dexheimer, D.N.; Cho, H.; Carrie, G.D.; Gasparini, R.; Anderson, C.R.; Bowman, K.P.; Biggerstaff, M.I. Stable isotopic composition of water vapor in the tropics. J. Geophys. Res. Atmos. 2004, 109, 6115. [Google Scholar] [CrossRef]
- Zhang, S.; Sun, X.; Wang, J.; Yu, G.; Wen, X. Short-term variations of vapor isotope ratios reveal the influence of atmospheric processes. J. Geogr. Sci. 2011, 21, 401–416. [Google Scholar] [CrossRef]
- Brown, D.; Worden, J.; Noone, D. Characteristics of tropical and subtropical atmospheric moistening derived from Lagrangian mass balance constrained by measurements of HDO and H2O. J. Geophys. Res. Atmos. 2013, 118, 54–72. [Google Scholar] [CrossRef]
- Samuels-Crow, K.E.; Galewsky, J.; Hardy, D.R.; Sharp, Z.D.; Worden, J.; Braun, C. Upwind convective influences on the isotopic composition of atmospheric water vapor over the tropical Andes. J. Geophys. Res. Atmos. 2014, 119, 7051–7063. [Google Scholar] [CrossRef]
- Galewsky, J. Constraining supersaturation and transport processes in a South American cold-air outbreak using stable isotopologues of water vapor. J. Atmospheric Sci. 2015, 72, 2055–2069. [Google Scholar] [CrossRef]
- Guilpart, E.; Vimeux, F.; Evan, S.; Brioude, J.; Metzger, J.-M.; Barthe, C.; Risi, C.; Cattani, O. The isotopic composition of near-surface water vapor at the Maïdo observatory (Reunion Island, southwestern Indian Ocean) documents the controls of the humidity of the subtropical troposphere. J. Geophys. Res. Atmos. 2017, 122, 9628–9650. [Google Scholar] [CrossRef]
- Steen-Larsen, H.C.; Masson-Delmotte, V.; Sjolte, J.; Johnsen, S.J.; Vinther, B.M.; Bréon, F.-M.; Clausen, H.B.; Dahl-Jensen, D.; Falourd, S.; Fettweis, X.; et al. Understanding the climatic signal in the water stable isotope records from the NEEM shallow firn/ice cores in northwest Greenland. J. Geophys. Res. Atmos. 2011, 116, 161–165. [Google Scholar] [CrossRef]
- Benetti, M.; Aloisi, G.; Reverdin, G.; Risi, C.; Sèze, G. Importance of boundary layer mixing for the isotopic composition of surface vapor over the subtropical North Atlantic Ocean. J. Geophys. Res. Atmos. 2015, 120, 2190–2209. [Google Scholar] [CrossRef]
- Gonfiantini, R.; Roche, M.-A.; Olivry, J.-C.; Fontes, J.-C.; Zuppi, G.M. The altitude effect on the isotopic composition of tropical rains. Chem. Geol. 2001, 181, 147–167. [Google Scholar] [CrossRef]
- Worden, J.; Bowman, K.; Noone, D.; Beer, R.; Clough, S.; Eldering, A.; Fisher, B.; Goldman, A.; Gunson, M.; Herman, R.; et al. Tropospheric Emission Spectrometer observations of the tropospheric HDO/H2O ratio: Estimation approach and characterization. J. Geophys. Res. Atmos. 2006, 111, D1639. [Google Scholar] [CrossRef]
- Li, X.; Tang, C.; Cui, J. Intra-event isotopic changes in water vapor and precipitation in South China. Water 2021, 13, 940. [Google Scholar] [CrossRef]
- Noone, D. Pairing Measurements of the Water Vapor Isotope Ratio with Humidity to Deduce Atmospheric Moistening and Dehydration in the Tropical Midtroposphere. J. Clim. 2012, 25, 4476–4494. [Google Scholar] [CrossRef]
- Noone, D.; Galewsky, J.; Sharp, Z.D.; Worden, J.; Barnes, J.; Baer, D.; Bailey, A.; Brown, D.P.; Christensen, L.; Crosson, E.; et al. Properties of air mass mixing and humidity in the subtropics from measurements of the D/H isotope ratio of water vapor at the Mauna Loa Observatory. J. Geophys. Res. Atmos. 2011, 116, 898–908. [Google Scholar] [CrossRef]
Disclaimer/Publisher’s Note: The statements, opinions and data contained in all publications are solely those of the individual author(s) and contributor(s) and not of MDPI and/or the editor(s). MDPI and/or the editor(s) disclaim responsibility for any injury to people or property resulting from any ideas, methods, instructions or products referred to in the content. |
© 2025 by the authors. Licensee MDPI, Basel, Switzerland. This article is an open access article distributed under the terms and conditions of the Creative Commons Attribution (CC BY) license (https://creativecommons.org/licenses/by/4.0/).