Abstract
Using five years of field monitoring data, this study compares two types of roof systems that combine green roofs, cisterns, and real-time control (RTC) strategies: one optimized to reduce stormwater runoff (a fully vegetated roof with cisterns operating under a “smart detention” [SD] logic that fully empties within 24 h), and one designed to balance architectural, economic, and structural tradeoffs (a half vegetated, half bare roof with cisterns operating under a “rainwater harvesting” [RWH] logic that partially drains in anticipation of rainfall while maintaining a reserve for green roof irrigation). Both configurations demonstrated strong stormwater performance, with cisterns improving roof retention by 10.2 to 13.0% over five years. For small to medium storms (under 25 mm), representing 71.2% of events, both strategies prevented more than 95% of runoff, while forecast accuracy primarily influenced larger events. Even with modest cistern sizing, the SD system captured 96.7% and the RWH system 95.8% of runoff from small to medium storms, approaching 100% assuming perfect weather forecasts. Irrigation analysis showed that RWH cisterns supplied ~51% of irrigation demand, increasing to ~70% under perfect forecasts. This study is among the first to compare stormwater and irrigation outcomes from side-by-side RTC-managed roof systems over multiple years. The results underscore that the mixed green/bare roof with RWH logic provides nearly equivalent stormwater benefits while offering added value through irrigation supply, reduced structural loading, and design flexibility.
1. Introduction
Rooftops comprise up to 50% of impervious surfaces in urban areas but remain underutilized for stormwater management [1]. Rainwater harvesting (RWH), the collection and storage of rooftop runoff for reuse, is a longstanding practice, particularly in regions lacking reliable freshwater supplies [2]. In urban settings, RWH reduces reliance on centralized water infrastructure [3] and, in capturing rainfall, can also reduce stormwater runoff. However, traditional RWH systems frequently encounter issues with cistern overflow when storage cisterns remain full from previous storms, limiting their effectiveness in managing stormwater runoff [4,5]. Recent studies highlight overflow and undersized storage as challenges for RWH implementation [6,7].
To address this problem, real-time control (RTC) rainwater storage systems that integrate weather forecasting have emerged. These systems proactively drain cisterns based on program logic. Smart detention (SD) logic fully empties storage cisterns 24 h after a storm event to maximize rainfall detention for upcoming storms [8]. In this instance, the water is released into a sewer system or landscape that has the capacity to absorb it and is thus less likely to contribute to a combined sewer overflow (CSO) event. The aim of SD logic is to reduce the negative impacts of rooftop stormwater runoff; there is no endeavor to store rainwater for later use. Conversely, rainwater harvesting (RWH) logic empties cisterns prior to an anticipated storm event by an amount based on predicted rainfall, thereby seeking to optimize the balance between the volume of water that can be retained during a storm and that stored for later use [9,10]. Despite the many advances in RTC logic, uncertainty remains regarding the optimal frequency and volume for cistern drainage to maximize the efficiency of the different systems for various urban sustainability goals, including stormwater management and water supply needs [9,11].
Another rooftop stormwater management strategy, green or vegetated roofs, can capture 30% to 86% of rainfall falling on the rooftop area [12]. However, practical limitations frequently restrict the incorporation of vegetation across entire rooftops. High upfront installation costs often constrain the total planted area; Waickowski et al. (2024) demonstrated that although green roofs can have a positive net present value, initial expenses limit widespread adoption [1]. Structural constraints can also restrict green roof installations; Chen et al. (2019) identified building construction as the second most common barrier to green roof construction in China [13]. In practice, these cost and loading constraints often lead designers to implement partial green roofs, balancing stormwater performance with budget and structural feasibility. Building owners may prioritize multifunctional rooftop designs, opting for partial green coverage to accommodate additional uses such as rooftop solar or occupiable spaces [14]. Because partial green roofs are increasingly common, it is important to understand how reducing planted area affects stormwater outcomes and how these perform relative to fully vegetated roofs under real-world conditions.
Combining green roofs with rainwater storage systems provides complementary benefits, supplying water for reuse while enhancing stormwater management. However, tradeoffs exist, as green roofs reduce runoff volumes available for rainwater storage. Almeida et al. [15] found that a 50/50 mix of green and conventional roofing balances stormwater retention and water reuse, though optimal configurations vary by priority. Other studies highlight the need for research into the performance of hybrid roof designs that might incorporate both a vegetated and non-vegetated component linked to an RWH system [16]. These trends underscore the need to quantify stormwater and irrigation trade-offs in hybrid systems, aligning with recent calls for integrated, multi-objective approaches to urban stormwater management [17]. Nonetheless, few real-world studies have monitored such systems over multiple years, and even fewer have included direct measurement of irrigation demand, leaving an important gap in understanding how hybrid roofs perform in practice.
In order to improve understanding of the trade-offs between green roof coverage and smart RWH system operation, this study presents a rare multi-year field comparison of two RTC-managed roof systems on a single rooftop: a fully planted green roof draining to cisterns with smart detention (SD) logic optimized solely for runoff reduction, and a hybrid green roof (half vegetated, half bare) draining to cisterns with smart RWH logic that partially drains in advance of storms while reserving water for irrigation. Unlike many previous modeling or short-term pilot studies, this work uses five years of field monitoring data, including direct measurements of runoff and irrigation water use, enabling a uniquely comprehensive evaluation of hydrologic performance and irrigation reliability under identical climate conditions. This study quantifies stormwater retention, cistern detention, and irrigation contributions for each system, examines forecast accuracy and its impact on system operation, and estimates performance under a hypothetical perfect forecasting scenario.
2. Materials and Methods
2.1. Study Roof
The study involved a roof located at Ranaqua, the Bronx headquarters of the New York City Department of Parks & Recreation (40˚50′50″ N, 73˚52′13″ W). Constructed in October 2012 on the second floor, the Ranaqua roof covers 638 m2 and is divided into four quadrants, each draining a separate catchment area. A pre-construction topographic survey confirmed a mean roof slope of approximately 1.0% toward each quadrant’s drain, directing runoff to individual downspouts leading to ground-level cisterns (nominal capacity of 1893 L [500 gallons] each). Non-vegetated walkways (61 cm wide) surround each quadrant and rooftop HVAC unit, surfaced with Delaware River gravel, and aluminum barriers were installed along high points with roofing cement to ensure that no runoff flows between quadrants. Each cistern includes an overflow pipe that discharges to the local combined sewer system.
Quadrants 1 (180 m2), 2 (139 m2), and 4 (179 m2) were designed as green roof systems and planted with vegetation native to the New York City region, while Quadrant 3 (139 m2) remained bare (Figure 1). The independent drainage and overflow configuration allowed each quadrant to be monitored separately for stormwater performance.
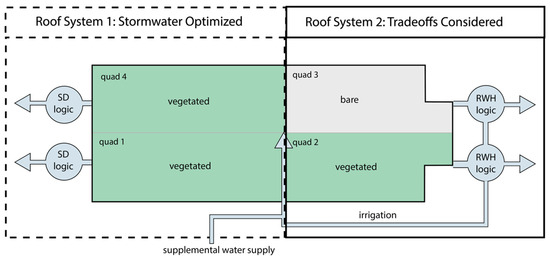
Figure 1.
The Ranaqua roof was split into two system types for analysis. Roof System 1, optimized to reduce the stormwater runoff (fully vegetated, with cistern logic favoring stormwater capture) and Roof System 2, designed to balance the practical tradeoffs between architectural, economic, and structural concerns (half vegetated, with cistern logic favoring storage of water for irrigation).
The cisterns were all equipped with automatic drainage guided by real-time controls (RTCs) using OptiRTC technology (Continuous Monitoring and Adaptive Control [CMAC], OptiRTC, Inc., Boston, MA, USA) [18]. Forecasting employed the National Weather Service’s Quantitative Precipitation Forecast (QPF) and Probability of Precipitation (POP) models. 24 h forecasted rainfall greater than the QPF and POP thresholds, or 1.3 mm and 60%, respectively, were used to drive the RTC logic. These thresholds were selected based on OptiRTC’s standard configuration and NYC Parks’ operational preferences, which aimed to avoid unnecessary pre-storm drains during low-confidence forecasts while ensuring capacity was created for most measurable rainfall events. A threshold of 1.3 mm was chosen to match the smallest rainfall depth reliably captured by the rooftop rain gage, and 60% POP was used to balance false positives and missed events.
2.1.1. Roof System 1: Fully Vegetated with Smart Detention Cistern Logic
Quadrants 1 and 4, analyzed as Roof System 1, measure 359 m2, with two 1892 L cisterns with the effective capacity able to store the equivalent of 8 mm of runoff depth from the roof quadrant, after considering the height of the overflow and unusable cistern volume. This runoff depth is termed the “normalized cistern depth.” Due to identical runoff amounts between these two quadrants [19], this study used the green roof data from quadrant 1 alone.
In a typical storm, with no additional rainfall predicted in the next 24 h, the smart detention (SD) logic dictated that the cisterns would completely empty 24 h after a rainfall event to reduce cistern overflow during the next storm (Figure 2a). In the event of another storm being predicted in the following 24 h, the cistern would partially empty based on the expected runoff volume of the following storm (forecast rainfall × roof quadrant area × runoff coefficient), as completely emptying could contribute to CSOs. A runoff coefficient of 0.3 was used, selected from the literature values [20].
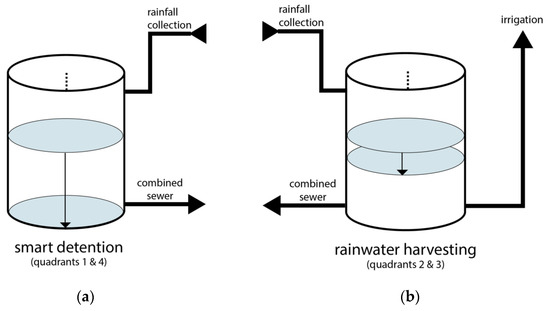
Figure 2.
(a) Smart detention logic (cisterns 1 and 4): cisterns emptied completely 24 h after rain events. (b) Rainwater harvesting logic (cisterns 2 and 3): if forecast chance of rainfall exceeded 60%, cisterns drained only forecasted runoff volume, saving remaining water for irrigation. Overflow from the cisterns emptied into NYC’s combined sewer system.
2.1.2. Roof System 2: Half Vegetated with Rainwater Harvesting Logic
Quadrants 2 and 3, combined, and analysed as Roof System 2, measure 278 m2 with a cistern capacity able to store 10.5 mm, rather than 8 mm as Roof System 1, due to a smaller drainage area. To provide an accurate comparison of the two systems, these cistern sizes were numerically standardized. Specifically, Roof System 2 cistern performance was recalculated assuming 8 mm storage depth, with overflow beyond this threshold considered additional runoff.
The cisterns for Roof System 2 were plumbed together to operate as a single unit under the principle of connected vessels. This configuration was selected to equalize water levels across quadrants 2 and 3 and simplify irrigation pumping, allowing all three green roof quadrants to draw from the shared water volume. In contrast, the cisterns in Roof System 1 were left hydraulically separate to isolate runoff and performance from each quadrant for experimental comparison.
The Rainwater Harvesting (RWH) logic dictated that the cisterns be partially drained before an upcoming storm based on forecasted rainfall (forecast rainfall × roof quadrant area × runoff coefficient). The runoff coefficient of 0.6 (averaged from 0.3 green roof and 0.9 bare roofs, selected from literature values [21]) was used as the cisterns were hydraulically connected. In order to preserve adequate water for irrigation, the partial drainage was capped to leave one-third of the cistern volume (equivalent of a 3.5 mm storm) for irrigation purposes (Figure 2b).
2.2. Green Roof Vegetation
Each vegetated quadrant contained a growing substrate of Norlite Expanded Shale aggregate mixed with We Care Compost (5–8% organic content, maximum water retention of 38%) at a depth of 127 mm. Vegetation selected from rocky summit grassland and Hempstead Plains grassland communities was divided into three irrigation zones: a “wet” zone, a “medium” zone, and a “dry” zone [22].
The planted quadrants (1,2, and 4) were seasonally irrigated between mid-June to mid-November, with irrigation occurring almost daily from June to August (up to 19 mm/week in wet zones, 13 mm/week in medium zones, and 8 mm/week in dry zones). Irrigation was triggered when volumetric moisture content dropped below the allowable depletion threshold of 14% (measured using a 10HS Decagon Devices soil moisture sensor). Because irrigation was soil-moisture controlled, events occurred almost daily during hot, dry periods and much less frequently following rain. During the 2014 monitoring season, irrigation was applied on 128 days, with a total of approximately 69,800 gallons, with an average of ~545 gallons per event. Irrigation water was first drawn from the hydraulically connected cisterns serving quadrants 2 and 3, and switched automatically to municipal potable water when cisterns were empty. For additional roof details, see Shetty et al. (2022) [19].
2.3. Storm Selection
The green roof was monitored from February 2013 to December 2017. Continuous rainfall data were discretized into storm events separated by at least 24 h dry period, identifying 358 storms. Storms with sensor errors (9) and freezing conditions indicating potential snow (61 storms) were removed, leaving 288 storms for forecasting accuracy analysis (Table 1). To assess the impact of perfect forecasting, storms with an antecedent dry period of less than 48 h (60 storms) were removed, leaving 228 storms for analysis. To assess stormwater retention (on rooftop) and detention (within cistern) metrics, storms with cistern turbulence resulting in unreliable readings (60 storms) were excluded, leaving 166 storms suitable for detailed analysis.

Table 1.
Number of storms used in each analysis after applying the selection criteria.
While five years of stormwater runoff data were available, irrigation and RWH contributions were only monitored for approximately 1.5 years (most of the 2014 season and the first half of 2015).
2.4. Rainfall & Cistern Volume Measurements
Rainfall was recorded at a five-minute logging frequency using an Onset Hobo U30 weather station located on Quadrant 3, while cistern water levels were monitored at one-minute intervals via HRXL-MaxSonar-WR acoustical sensors and a V-notch weir.
In order to distinguish between rainfall that was retained on the roof and that held in a cistern, roof retention was calculated as the percentage of total incident rainfall neither increasing cistern volume nor overflowing, indicating “permanent” capture via evapotranspiration:
Cistern detention was calculated as the percentage of rainfall that did not overflow the cistern, representing temporary storage released post-storm:
The sum of roof retention and cistern detention represents the stormwater runoff averted from discharging into the combined sewer system during a storm event. Rainfall depth is used in the denominator, rather than runoff, to normalize results to total precipitation input, which is standard practice in the green roof and stormwater literature [19,23]. This approach allows results to be compared across studies with different runoff coefficients or roof types.
2.5. Perfect Forecasting
Recognizing inherent forecasting uncertainty for rainfall, a hypothetical “perfect forecasting” scenario was modeled to understand stormwater management improvements gained by increased forecast accuracy. For SD cisterns, perfect forecasting assumed cisterns were fully emptied prior to each storm (subtracting an 8 mm storage depth from runoff).
For RWH cisterns, the ideal initial cistern levels at storm onset were calculated by taking the cistern level 48 h before each storm (excluding storms with <48 h antecedent dry period) and subtracting a “perfect” forecast drainage amount (rainfall × runoff coefficient). Actual cistern levels were compared against these ideals, and cistern detention was adjusted accordingly.
Assuming
3. Results and Discussion
3.1. Storm Size
Storm size analysis revealed similar frequencies (approximately 25% each) across categories (very small [<2 mm], small [2–10 mm], medium [10–25 mm], large [>25 mm]), over both the five-year monitoring period and historical data from LaGuardia Airport (10 km from site) (Figure 3).
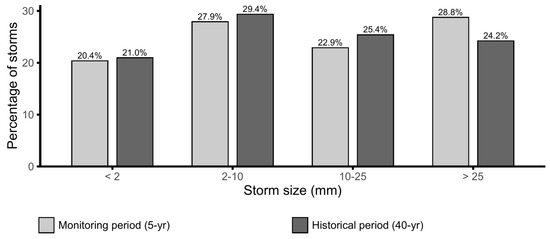
Figure 3.
Frequency of storm size groupings during the 5 yr monitoring period <2013 to 2017> and a historical 40 yr period <1977 to 2017>.
3.2. Forecast Reliability
Forecast accuracy analysis showed balanced outcomes overall, with 81 underestimates, 77 accurate predictions, and 70 overestimates. Mean absolute error (MAE) and root mean square error (RMSE) across all storms were 1.7 mm and 2.7 mm, respectively. Although some variation in error was observed across groups (e.g., fall had the lowest MAE at 1.1 mm, while winter reached 2.6 mm; storms < 2 mm averaged 0.9 mm MAE, while 10–25 mm storms averaged 2.4 mm), no consistent trends were identified relative to storm size, season, year, or antecedent dry weather period. Full error statistics are provided in the Supplementary Materials.
Although forecast errors did not show systematic biases, they directly affect how much water is available for reuse versus stormwater detention. Because forecast outcomes shape tank operations across seasons, the following section examines monthly cistern dynamics to highlight how storage and irrigation demands interact.
3.3. Monthly Analysis of Cistern Water Levels
Monthly plots of cistern water levels illustrate distinct operational behaviors between the SD and RWH cisterns (Figure 4 and Figure 5). Normalized cistern water level refers to the equivalent rainfall depth (mm) that the cistern can store when converted to a depth over the drainage area, allowing results to be compared across different quadrant sizes. SD cisterns consistently emptied fully within 24 h after storms, while RWH cisterns maintained higher baseline storage levels, reflecting operation that included irrigation demands and thus maintained a minimum reserve level. Daily irrigation events created clear cyclical fluctuations in summer and fall. Larger storms triggered pre-storm partial drainage for the RWH logic. Figure 4 includes irrigation depths shown as bars above rainfall and cistern water levels. In contrast, Figure 5 shows only cistern water levels and rainfall because no irrigation occurred during March 2016.
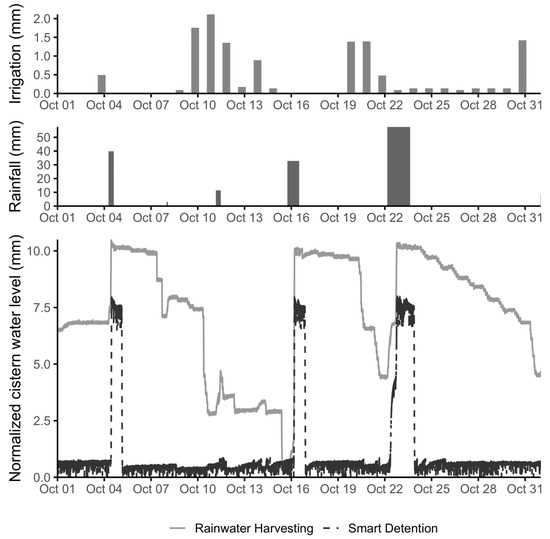
Figure 4.
Normalized cistern water level, rainfall, and irrigation depths during October 2014.
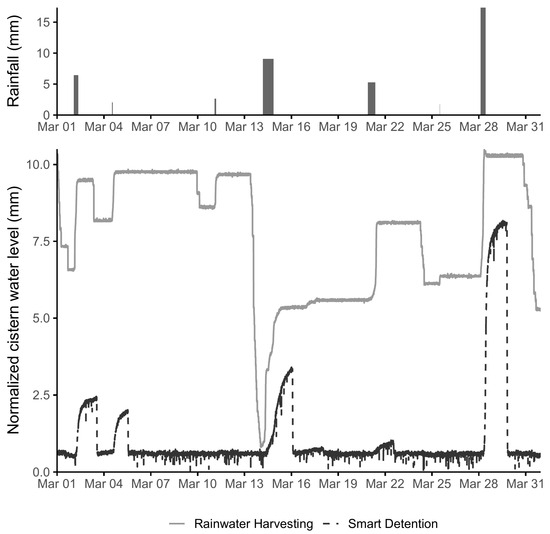
Figure 5.
Normalized cistern water level and rainfall depths during March 2016.
3.3.1. Example: October 2014 (Figure 4)
On 5 October, both cistern types overflowed during a large storm (40 mm). The SD cistern drained completely after 24 h; the RWH cistern remained full. RWH accurately forecasted and partially drained ahead of a small storm (8 October—3 mm), slightly increasing cistern levels. However, on 11 October (11 mm), the RWH logic unnecessarily drained down to its reserve water (equivalent to a 3 mm storm) due to an overestimate of anticipated rainfall. Despite minor rainfall (14 October—1 mm), irrigation quickly reduced the RWH cistern to its 3.5 mm reserve. On 16 October (33 mm) overflow occurred despite an accurate forecast and full pre-storm. Subsequent low evapotranspiration limited irrigation needs, and for the 23 October storm (57 mm), forecasting underestimated drainage needs, causing overflow. SD cisterns fully drained by 24 October; RWH levels fluctuated due to irrigation cycles. As shown by the irrigation bars in Figure 4, irrigation activity was frequent early in the month but tapered after major storms, when elevated soil moisture reduced irrigation demand.
3.3.2. Example: March 2016 (Figure 5)
In early March, small rainfall events on 2 March (6 mm) and 4 March (2 mm) resulted in minor increases in both SD and RWH cistern levels, with SD cisterns promptly draining within 24 h. The RWH cistern remained full until accurately anticipating a small event on 11 March (3 mm). However, the RWH system incorrectly predicted a large event on 14 March (9 mm), but only a small event occurred, unnecessarily draining the cistern fully despite minimal runoff, demonstrating overestimation. Subsequently, the system correctly anticipated negligible runoff from the storm on 21 March (5 mm), retaining stored water. An additional storm on 26 March (2 mm) was again overestimated, resulting in excessive pre-storm drainage. Interestingly, this storm event was completely retained by the 100% green roof area feeding the SD cistern, indicating differences in runoff generation between partially bare and fully green roof quadrants. Runoff from the partially impervious area connected to the RWH cistern began immediately, even in minor events, showing how roof configuration influences retention. Finally, the medium storm on 28 March (17 mm) was underestimated by the RWH system, resulting in overflow, underscoring ongoing forecast challenges.
These seasonal dynamics establish the operational contrasts between SD and RWH logics. To evaluate their hydrologic outcomes, this study quantifies rainfall retained by the roof surfaces and detained within cisterns.
3.4. Roof Stormwater Performance
Over five years, the roofs alone (without the benefit of the cisterns) retained significant rainfall, with the fully planted green roof retaining 70.6% of rainfall volume, and the half green/half bare roof configuration retaining 62.6%. Adding smart cistern management improved stormwater capture: SD logic increased it from 70.6% retention to 80.9% retention, plus cistern detention, while RWH logic increased it from 62.6% retention to 75.6% retention, plus cistern detention (72.9% normalized to an 8 mm cistern). Performance varied by storm size (Figure 6), with small to medium storms experiencing nearly complete stormwater capture via retention and/or detention.
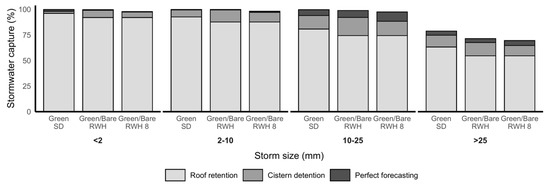
Figure 6.
Stormwater capture by storm size for Smart Detention (SD) and RWH (RWH) roof configurations. Here and throughout, RWH cisterns are shown both at their actual 10.5 mm capacity and standardized to 8 mm to allow direct comparison with SD cisterns.
Both RWH and SD effectively managed over 95% of runoff from 71.2% of storms (<25 mm). Focusing specifically on storms < 25 mm, the SD logic increased stormwater capture from 86.1% (green roof alone) to 96.7%, and RWH from 80.7% (green/bare alone) to 95.8% (93.6% normalized). With perfect forecasts, values approached full runoff management (99.9% for SD and 99.3% for RWH). Thus, both systems effectively manage most storms, while cistern size and forecast accuracy govern performance in larger events.
3.5. Smart Detention vs. Rainwater Harvesting Logics for Stormwater Management
For storms < 25 mm, both logics performed similarly, with SD slightly outperforming RWH. For larger storms (>25 mm), cistern size became the dominant factor, with RWH performance approaching SD due to effectively larger storage per drained area. The relatively modest cisterns used here (8–10.5 mm depth) captured most storms and align with literature on optimal sizing, which emphasizes avoiding frequent overflow while minimizing capital cost; most previous studies have examined larger systems (13–90 mm depth) [2,3,11,24,25].
Because both logics depend on forecasts for pre-storm drainage, the following section quantifies how forecast accuracy influenced stormwater system performance.
3.6. Effect of Forecast Accuracy on Performance
Forecast accuracy played a minimal role for small to medium storms (<25 mm) due to the high inherent retention plus detention capacity of both green roofs and cisterns. Conversely, for storms larger than 25 mm, accurate forecasting significantly influenced performance. Under real forecasts, SD captured an average of 80.9% of rainfall across all storms, compared to 72.9% for RWH given the same size cistern. With perfect forecasts, capture increased to 83.9% for SD and 77.4% for RWH. For storms below 25 mm, both strategies approached complete rainfall capture (>95%) regardless of forecast accuracy (Figure 6). These results confirm that forecast errors, particularly underestimations in larger events, reduced effective detention capacity. The forecast error statistics (MAE, RMSE) presented in Section 3.2 further quantify these differences, aligning with other RTC studies, and reinforcing that forecast accuracy is most critical for large storms [11]. To compare performance across configurations, we next evaluated runoff coefficients.
3.7. Runoff Coefficient Analysis
Runoff coefficients for both the fully planted green roof with smart detention (Green SD) and the half green/bare roof with rainwater harvesting logic (Green/Bare RWH) are shown in Figure 7. For storms less than 25 mm, runoff coefficients from the roofs alone were low (<0.24) across both roof configurations. With smart sensors implementing either SD or RWH detention logic, coefficients decreased substantially (0.11), and further declined to 0.02 under conditions of perfect forecasting. The numerical 8 mm RWH cistern showed runoff coefficients that were close to those of the full green SD cistern, particularly under perfect forecasts for storms less than 25 mm. In fact, perfect forecasting allowed the Green SD roof to achieve near-zero runoff coefficients for storms up to 25 mm.
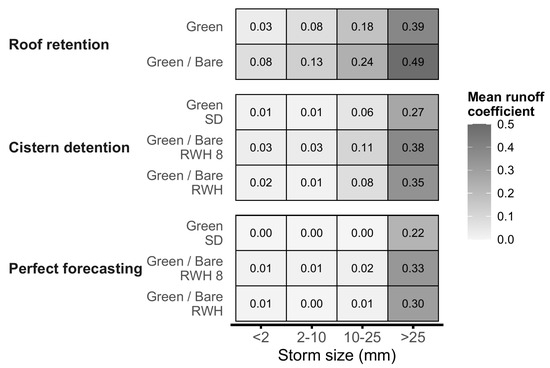
Figure 7.
Runoff coefficients (-) by storm size (mm) for the green roof with smart detention logic (Green SD), green/bare roof with rainwater harvesting logic (Green/Bare RWH), and numerically adjusted RWH cistern configurations (Green/Bare RWH 8). Values are dimensionless runoff coefficients, calculated as observed runoff depth divided by rainfall depth.
The observed runoff coefficients indicate dependency on storm size [26]. While the forecast logic for SD and RWH used a constant 0.3 and 0.6 runoff coefficient for forecasting, these assumed values were drawn from literature-reported averages for green and partially impervious roofs. Our observed coefficients differed because they were based on actual measured storm responses, which varied with storm size as well as factors such as antecedent soil moisture and evapotranspiration. Smaller storms, in particular, generated lower effective runoff than the assumed constants. Although the Green/Bare RWH 8 cistern did not fully replicate the Green SD performance across all storm sizes, its coefficients were consistently close, particularly under perfect forecasts for storms less than 25 mm. This result emphasizes the significant potential for urban roofs, even those only partially planted, to achieve high stormwater retention and detention performance when properly managed.
While both systems demonstrate strong stormwater capture, an important tradeoff emerges: the RWH logic retains water for irrigation, which reduces available capacity for new storms. The next section examines initial water levels at storm onset to illustrate this tradeoff.
3.8. Cistern Storage at Storm Onset
The smart detention (SD) cisterns were frequently near-empty at the onset of storms (median initial storage < 1 mm across all seasons), maximizing capacity to capture stormwater runoff. Conversely, the RWH cisterns usually retained several millimeters of stored water for irrigation, with seasonal medians of 4.5 mm in spring, 3.3 mm in summer, 3.5 mm in fall, and 7.6 mm in winter (Figure 8). This reduced stormwater capture capacity but ensured reserves for irrigation supply.
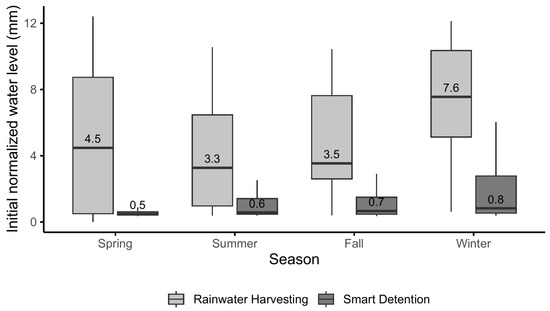
Figure 8.
Initial normalized water level at storm onset for smart detention and rainwater harvesting cisterns.
These results show a clear tradeoff: SD maximized detention by beginning storms almost empty, while RWH typically preserved 30–70% of its effective 10.5 mm storage volume as an irrigation reserve. The extent of this tradeoff shifted seasonally depending on the irrigation demand, underscoring that operational objectives, not just hardware sizing, drive system performance in practice.
3.9. Irrigation Supply from RWH Cisterns
Having shown how residual storage reduces detention capacity in smart cisterns, we now assess how much irrigation benefit those reserves actually provide. The rainwater harvesting (RWH) cisterns supplied, on average, 51% of the total roof irrigation demand across the monitoring period, though contributions varied substantially at daily (Figure 9) and seasonal (Figure 10) time scales. Note that because the 2014 dataset is more complete than the 2015 dataset, daily and seasonal results reported here emphasize that year.
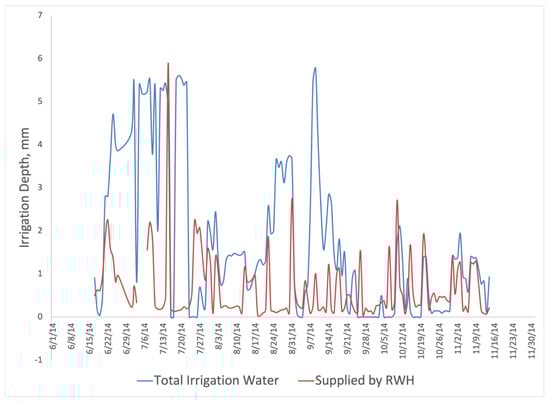
Figure 9.
Daily patterns of total green roof irrigation and irrigation provided by the RWH cisterns for the 2014 irrigation season. Irrigation volume is divided by green roof area to provide an equivalent irrigation depth.
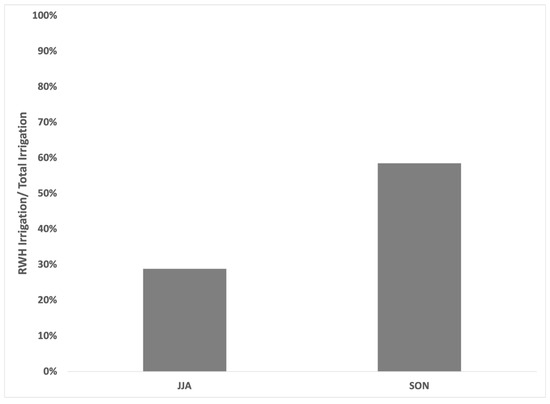
Figure 10.
Fraction of total irrigation provided by the RWH for heavier irrigation months (JJA) and lower irrigation months (SON) during 2014.
During the peak-demand summer months of June, July, and August (JJA), RWH covered approximately 30% of irrigation needs in 2014, whereas in the lower-demand autumn months of September, October, and November (SON), it supplied roughly 60% of needs in 2014. In other words, with current sizing, the system reliably offsets one-third of summer irrigation and more than half of autumn irrigation.
The seasonal imbalance is also apparent in the 2014 cumulative record (Figure 11). Cumulative irrigation demand rose sharply in summer and plateaued in autumn, while the RWH contribution increased more gradually and consistently. This indicates that the cisterns provide a steady supply but are insufficient to meet extreme summer peaks without supplemental potable water.
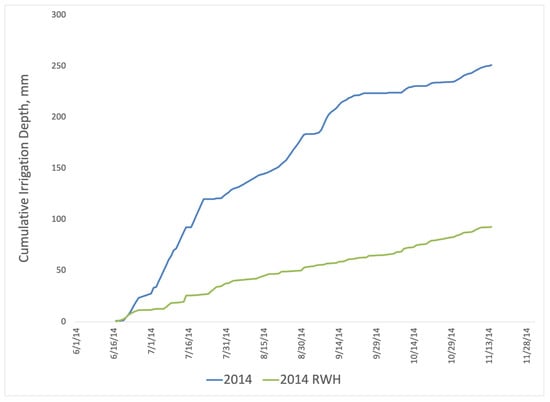
Figure 11.
Cumulative total irrigation for the year 2014 and the amount supplied by the RWH cisterns. Irrigation volume is divided by green roof area to provide an equivalent irrigation depth.
We also examined a hypothetical “perfect forecast” scenario to assess the influence of forecast uncertainty on irrigation reliability. With perfect pre-storm drainage decisions, the annual fraction of irrigation supplied by the RWH cisterns increased from 51% to ~70%, with monthly values varying between high- and low-demand periods. This ~20% gain suggests that forecasting accuracy could be nearly as important as tank size in determining irrigation (or other water use) benefits for smart-logic RWH cisterns. To consolidate these results, Table 2 summarizes irrigation coverage under real and perfect forecast scenarios: under real forecasts, RWH supplied ~30% of summer demand, ~60% of autumn demand, and 51% annually; under perfect forecasts, annual coverage rose to ~70%.
Table 2.
Fraction of irrigation demand supplied by RWH cisterns (2014 dataset).
These findings highlight that the green/bare roof with RWH logic provides distinct advantages compared to a fully planted roof with smart detention (SD) logic. While both strategies perform similarly in stormwater detention, only the mixed configuration delivers a meaningful non-potable irrigation source, covering up to two-thirds of demand in cooler months and more with improved forecasting. This multifunctional value makes the mixed configuration particularly attractive in climates with less pronounced summer peaks or where irrigation demand aligns more evenly with storage capacity. Beyond stormwater benefits, RWH systems also advance water resource efficiency and reduce reliance on potable supplies, extending their significance to sustainability and cost reduction. Thus, the study indicates that hybrid green/bare roof designs can deliver high-value co-benefits and deserve greater consideration in urban stormwater and water supply planning.
3.10. Design Implications and Recommendations
Our results demonstrate that a half green/bare roof equipped with an RWH cistern sized to capture 8 mm of rainfall provides nearly equivalent stormwater performance compared to a fully planted green roof using smart detention logic. This configuration emerges as a highly effective alternative, providing significant stormwater management performance alongside additional practical advantages such as reduced installation and maintenance costs, decreased structural loading, and enhanced architectural versatility. Moreover, because RWH logic retains water for irrigation and other non-potable onsite uses, it offers added utility beyond stormwater retention alone, an important consideration for cities seeking to reduce potable water demand and comply with sustainability targets. This practical benefit could outweigh the marginal differences in stormwater capture observed for large storms.
For urban practitioners, these findings suggest that stormwater crediting and green infrastructure incentive programs should account for hybrid roof configurations and the co-benefits of water reuse, rather than evaluating green coverage or runoff reduction in isolation. Incorporating these systems into stormwater regulations could expand adoption by lowering costs and providing more flexible design options.
However, performance during large storm events (>25 mm) underscores the importance of adequate cistern sizing and accurate forecasting, as even advanced RTC systems cannot fully compensate for insufficient storage capacity. Thus, while partial green roofs combined with smart RWH systems effectively manage most urban storm events, careful attention to cistern sizing and forecasting strategies remains critical, particularly in climates with frequent large storms, such as New York City. These findings also reinforce broader urban sustainability goals, showing that multifunctional roof systems can reduce potable water demand while meeting stormwater compliance targets, and support the design of incentive programs that account for water reuse alongside runoff reduction.
4. Conclusions
This study compared the stormwater management performance of a fully planted green roof connected to a rainwater cistern operated using smart detention (SD) logic to that of a hybrid green roof (half green, half bare) connected to a cistern with rainwater harvesting (RWH) logic over a five-year period. Both approaches achieved strong stormwater performance: SD logic increased overall stormwater capture from 70.6% (green roof alone) to 80.9%, while the RWH system improved capture from 62.6% (mixed roof alone) to 72.9% given the same size cistern. For storms smaller than 25 mm, both strategies effectively retained on the roof or detained within the cistern over 95% of the rainfall. Modeled scenarios with perfect forecasting indicated the potential to achieve nearly 100% stormwater capture for small (<10 mm) and medium-sized (10–25 mm) storms. Beyond stormwater, irrigation analysis revealed that the RWH cisterns supplied approximately 51% of total irrigation demand, rising to about 70% under perfect forecasting. This added benefit highlights that hybrid green/bare roof designs not only provide comparable stormwater retention to fully vegetated systems but also deliver significant co-benefits in water supply, structural efficiency, and design flexibility. Taken together, the results advocate for further investigation into hybrid configurations, focusing on cistern sizing, forecasting accuracy, and optimal proportions of green roof coverage to maximize both stormwater and irrigation performance in urban environments.
Supplementary Materials
The supporting information can be downloaded at: https://www.mdpi.com/article/10.3390/w17202987/s1. Table S1. Forecast error statistics. Table S2. Irrigation data. Table S3. Storm event dataset.
Author Contributions
Conceptualization, N.H.S., M.W., R.M.E. and P.J.C.; methodology, N.H.S., M.W., R.M.E. and P.J.C.; investigation, N.H.S., M.W., R.M.E. and P.J.C.; writing—original draft preparation, N.H.S.; writing—review and editing, M.W., R.M.E. and P.J.C. All authors have read and agreed to the published version of the manuscript.
Funding
This work was funded, in part, by National Science Foundation grant CMMI-1325676.
Data Availability Statement
All data used in the study can be found in the Supplementary Materials.
Acknowledgments
We thank the New York City Department of Parks & Recreation for constructing and monitoring the Ranaqua green roof through a grant from the National Fish and Wildlife Foundation and the New York State Office of the Attorney General.
Conflicts of Interest
The authors declare no conflicts of interest.
References
- Waickowski, S.E.; DeGaetano, S.; Anderson, A.; Amatya, D.M.; Hunt, W. Plot Scale Evaluation of the Hydrologic and Water Quality Benefits of Blue Roofs Compared to Green and Conventional Roofs. J. Nat. Resour. Agric. Ecosyst. 2024, 2, 91–102. [Google Scholar] [CrossRef]
- Shoja Razavi, N.; Prodanovic, V.; Zhang, K. Advancing Stormwater Harvesting: A Comprehensive Review of Current Drivers, Implementation Advancements, and Pathways Forward. Environ. Technol. Rev. 2024, 13, 478–501. [Google Scholar] [CrossRef]
- Cristiano, E.; Farris, S.; Deidda, R.; Viola, F. How Much Green Roofs and Rainwater Harvesting Systems Can Contribute to Urban Flood Mitigation? Urban Water J. 2023, 20, 140–157. [Google Scholar] [CrossRef]
- Debusk, K.M.; Hunt, W.; Quigley, M.; Jeray, J.; Bedig, A. Rainwater Harvesting: Integrating Water Conservation and Stormwater Management. In Proceedings of the World Environmental and Water Resources Congress 2012, Albuquerque, NM, USA, 20–24 May 2012. [Google Scholar]
- Shannak, S.A.; Jaber, F.H.; Lesikar, B.J. Modeling the Effect of Cistern Size, Soil Type, and Irrigation Scheduling on Rainwater Harvesting as a Stormwater Control Measure. Water Resour. Manag. 2014, 28, 4219–4235. [Google Scholar] [CrossRef]
- Liang, R.; Maier, H.R.; Thyer, M.A.; Dandy, G.C. A Practical, Adaptive, and Scalable Real-Time Control Approach for Stormwater Storage Systems. Water 2024, 16, 2844. [Google Scholar] [CrossRef]
- Xu, W.D.; Burns, M.J.; Cherqui, F.; Duchesne, S.; Pelletier, G.; Fletcher, T.D. Real-Time Controlled Rainwater Harvesting Systems Can Improve the Performance of Stormwater Networks. J. Hydrol. 2022, 614, 128503. [Google Scholar] [CrossRef]
- Shetty, N.; Wang, M.; Elliott, R.; Culligan, P. Examining How a Smart Rainwater Harvesting System Connected to a Green Roof Can Improve Urban Stormwater Management. Water 2022, 14, 2216. [Google Scholar] [CrossRef]
- Kerkez, B.; Gruden, C.; Lewis, M.; Montestruque, L.; Quigley, M.; Wong, B.; Bedig, A.; Kertesz, R.; Braun, T.; Cadwalader, O.; et al. Smarter Stormwater Systems. Environ. Sci. Technol. 2016, 50, 7267–7273. [Google Scholar] [CrossRef]
- Goodman, J.A.; Quigley, M. Active Hydromodification Control. In Proceedings of the International Low Impact Development Conference 2015, Houston, TX, USA, 19–21 January 2015; pp. 1–10. [Google Scholar]
- Xu, W.D.; Fletcher, T.D.; Burns, M.J.; Cherqui, F. Real Time Control of Rainwater Harvesting Systems: The Benefits of Increasing Rainfall Forecast Window. Water Resour. Res. 2020, 56, e2020WR027856. [Google Scholar] [CrossRef]
- Shafique, M.; Kim, R.; Rafiq, M. Green Roof Benefits, Opportunities and Challenges—A Review. Renew. Sustain. Energy Rev. 2018, 90, 757–773. [Google Scholar] [CrossRef]
- Chen, X.; Shuai, C.; Chen, Z.; Zhang, Y. What Are the Root Causes Hindering the Implementation of Green Roofs in Urban China? Sci. Total Environ. 2019, 654, 742–750. [Google Scholar] [CrossRef]
- Cook, L.M.; Larsen, T.A. Towards a Performance-Based Approach for Multifunctional Green Roofs: An Interdisciplinary Review. Build. Environ. 2021, 188, 107489. [Google Scholar] [CrossRef]
- Almeida, A.P.; Liberalesso, T.; Silva, C.M.; Sousa, V. Combining Green Roofs and Rainwater Harvesting Systems in University Buildings under Different Climate Conditions. Sci. Total Environ. 2023, 887, 163719. [Google Scholar] [CrossRef]
- Dong, J.; Li, C.; Guo, R.; Guo, F.; Zheng, X. Assessing the Potential for Green Roof Retrofitting: A Systematic Review of Methods, Indicators and Data Sources. Sustain. Cities Soc. 2025, 123, 106261. [Google Scholar] [CrossRef]
- Wang, M.; Jiang, Z.; Ikram, R.M.A.; Sun, C.; Zhang, M.; Li, J. Global Paradigm Shifts in Urban Stormwater Management Optimization: A Bibliometric Analysis. Water 2023, 15, 4122. [Google Scholar] [CrossRef]
- Braga, A.; O’Grady, H.; Dabak, T.; Lane, C. Performance of Two Advanced Rainwater Harvesting Systems in Washington DC. Water 2018, 10, 13. [Google Scholar] [CrossRef]
- Shetty, N.H.; Elliott, R.M.; Wang, M.; Palmer, M.I.; Culligan, P.J. Comparing the Hydrological Performance of an Irrigated Native Vegetation Green Roof with a Conventional Sedum Spp. Green Roof in New York City. PLoS ONE 2022, 17, e0266593. [Google Scholar] [CrossRef] [PubMed]
- Pimentel-Rodrigues, C.; Silva-Afonso, A. Determination of Runoff Coefficients with a View to Integration of Green Roofs with Rainwater Harvesting Systems. Int. J. Environ. Sci. 2017, 2, 366–372. [Google Scholar]
- Lee, J.Y.; Moon, H.J.; Kim, T.I.; Kim, H.W.; Han, M.Y. Quantitative Analysis on the Urban Flood Mitigation Effect by the Extensive Green Roof System. Environ. Pollut. 2013, 181, 257–261. [Google Scholar] [CrossRef] [PubMed]
- Edinger, G.J.; Evans, D.J.; Bebbauer, S.; Howard, T.G.; Hunt, D.M.; Olivero, A.M. Ecological Communities of New York State, 2nd ed.; A Revised and Expanded Edition of Carol Reschke’s Ecological Communities of New York State; New York Natural Heritage Program: Albany, NY, USA, 2014. [Google Scholar]
- Czemiel Berndtsson, J. Green Roof Performance towards Management of Runoff Water Quantity and Quality: A Review. Ecol. Eng. 2010, 36, 351–360. [Google Scholar] [CrossRef]
- Semaan, M.; Day, S.D.; Garvin, M.; Ramakrishnan, N.; Pearce, A. Optimal Sizing of Rainwater Harvesting Systems for Domestic Water Usages: A Systematic Literature Review. Resour. Conserv. Recycl. 2020, 6, 100033. [Google Scholar] [CrossRef]
- Burns, M.J.; Fletcher, T.D.; Duncan, H.P.; Hatt, B.E.; Ladson, A.R.; Walsh, C.J. The Performance of Rainwater Tanks for Stormwater Retention and Water Supply at the Household Scale: An Empirical Study. Hydrol. Process 2015, 29, 152–160. [Google Scholar] [CrossRef]
- Zhao, H.; Kam, K.A.; Kymissis, I.; Mailloux, B.J.; Culligan, P.J. A LoRaWAN-Based Environmental Sensing Network for Urban Green Space Monitoring with Demonstrated Application for Stormwater Management. Sustain. Cities Soc. 2024, 115, 105852. [Google Scholar] [CrossRef]
Disclaimer/Publisher’s Note: The statements, opinions and data contained in all publications are solely those of the individual author(s) and contributor(s) and not of MDPI and/or the editor(s). MDPI and/or the editor(s) disclaim responsibility for any injury to people or property resulting from any ideas, methods, instructions or products referred to in the content. |
© 2025 by the authors. Licensee MDPI, Basel, Switzerland. This article is an open access article distributed under the terms and conditions of the Creative Commons Attribution (CC BY) license (https://creativecommons.org/licenses/by/4.0/).