Article

Identifying Fresh Groundwater Potential in Unconfined Aquifers in Arid Central Asia: A Remote Sensing and Geo-Information Modeling Approach

by
Evgeny Sotnikov
1,
Zhuldyzbek Onglassynov
1,
Kanat Kanafin
2,
Ronny Berndtsson
3,
Valentina Rakhimova
1,*,
Oxana Miroshnichenko
1,
Shynar Gabdulina
4 and
Kamshat Tussupova
5
1
Institute of Hydrogeology and Geoecology Named After U.M. Ahmedsafin, Satbayev University, Valikhanov str. 69/94, Almaty 050010, Kazakhstan
2
Hydrogeology Consulting Group LLP, 410/78 Seifullin Avenue, Almaty 050020, Kazakhstan
3
Division of Water Resources Engineering & Centre for Advanced Middle Eastern Studies, Lund University, 221 00 Lund, Sweden
4
Department of Hydrogeology, Engineering and Petroleum Geology, Kazakh National Research Technical University named after K. I. Satbayev, Almaty 050000, Kazakhstan
5
Department of Science, Kazakh National University of Water Management and Irrigation, Taraz 080000, Kazakhstan
*
Author to whom correspondence should be addressed.
Water 2025, 17(20), 2985; https://doi.org/10.3390/w17202985
Submission received: 4 August 2025 / Revised: 29 September 2025 / Accepted: 9 October 2025 / Published: 16 October 2025
(This article belongs to the Special Issue Regional Geomorphological Characteristics and Sedimentary Processes)

Abstract

Arid regions in Central Asia face persistent and increasing water scarcity, with groundwater serving as the primary source for drinking water, irrigation, and industry. The effective exploration and management of groundwater resources are critical, but are constrained by limited monitoring infrastructure and complex hydrogeological settings. This study investigates the Akbakay aquifer, a representative area within Central Asia with challenging hydrogeological conditions, to delineate potential zones for fresh groundwater exploration. A multi-criteria decision analysis was conducted by integrating the Analytical Hierarchy Process (AHP) with Geographic Information Systems (GIS), supported by remote sensing datasets. To address the subjectivity of weight assignment, the AHP results were further validated using Monte Carlo simulations and fuzzy logic aggregation (Fuzzy Gamma). The integrated approach revealed stable high-suitability groundwater zones that consistently stand out across deterministic, probabilistic, and fuzzy assessments, thereby improving the reliability of the groundwater potential mapping. The findings demonstrate the applicability of combined AHP–GIS methods enhanced with uncertainty analysis for sustainable groundwater resource management in data-scarce arid regions of Central Asia.

1. Introduction

The scarcity of fresh groundwater in arid and semi-arid regions is a pressing global challenge, as it directly impacts water security, agriculture, and sustainable development. Remote sensing and Geographic Information Systems (GIS) have emerged internationally as indispensable tools for groundwater exploration, offering cost-effective and time-efficient solutions for mapping groundwater potential zones (GWPZ) in areas with limited hydrogeological data [1,2]. The effective management of groundwater resources requires not only exploration, but also continuous monitoring of both quality and quantity, particularly in environments where natural recharge is low and demand is rising [3]. By integrating remote sensing with hydrogeological and geophysical information in GIS frameworks, researchers worldwide have demonstrated the potential of geo-information models to delineate new areas for groundwater development [4].
A wide body of international literature confirms the effectiveness of these methods in arid and semi-arid regions. Remote sensing techniques—including aerial and satellite photography, multispectral and thermal imagery, and radar—provide valuable datasets for hydrogeological investigations [5,6,7,8]. GIS-based thematic layers derived from digital elevation models (DEMs), land use, and geologic structures further enhance mapping accuracy and efficiency [9,10,11]. Numerous studies have highlighted that groundwater occurrence is strongly controlled by lithology, structures, and landforms, which can be systematically integrated using GIS to assess groundwater potential [12,13,14].
Building on this foundation, multi-criteria decision analysis (MCDA) has become a widely adopted approach to groundwater assessment. Among these, the Analytic Hierarchy Process (AHP) has proven to be particularly effective for weighting thematic layers and producing GWPZ maps. For example, Alshehri et al. [15] demonstrated the utility of AHP in Saudi Arabia by integrating twelve thematic layers, while Masoud et al. [16] compared AHP with the Frequency Ratio method in Egypt, showing that both produced reliable predictions (AUC ≈ 0.8). Other applications of MCDA include rainwater harvesting and aquifer recharge planning: Ashraf et al. [17] in Pakistan combined AHP with PROMETHEE-II, Rawat et al. [18] in India demonstrated indigenous rainwater harvesting scalability, and Halder et al. [19] integrated SWAT modeling with the VIKOR method to evaluate recharge potential. These examples, along with broader research on urban resilience in water-stressed zones [20,21], highlight the adaptability of weighted overlay approaches while underscoring the importance of transparent weighting, consistency checks, and validation.
Despite these advances, criticisms of GIS–AHP approaches persist, particularly regarding the reliance on fixed expert-derived weights and the lack of uncertainty analysis [22,23]. To overcome these limitations, methodological innovations have been introduced, including probabilistic and fuzzy approaches. Monte Carlo simulations provide insights into model robustness by quantifying uncertainty in weighting schemes [24], while fuzzy logic with the Gamma operator enables flexible representation of suitability, emphasizing favorable conditions [25]. Together, these methods enrich the decision-making framework and strengthen the reliability of groundwater potential mapping. To address these challenges, we apply a novel integration of AHP, Monte Carlo simulation, and fuzzy logic in the Akbakay region of Kazakhstan. The region was selected as the study area because its extreme aridity, low precipitation (<200 mm/year), high evapotranspiration, and the lack of research caused by the complexity of the terrain, thereby providing a critical setting to test and validate the robustness of AHP, Monte Carlo, and fuzzy logic methods under conditions of severe water scarcity and high uncertainty. To our knowledge, this is the first time these methods have been systematically applied in Central Asia for groundwater exploration. Despite the region’s severe water scarcity, transboundary water problems, and climate-induced water stress, there have been very few systematic groundwater suitability assessments in Central Asia. Our study provides the first comprehensive multi-criteria groundwater suitability mapping at the regional scale, using updated hydrogeological and climatic datasets that have previously been unavailable or unintegrated.

2. Materials and Methods

The methodological framework of this study comprised several sequential steps, beginning with the acquisition and pre-processing of remote sensing data from multiple sources, including satellite imagery (e.g., Landsat, Sentinel) and digital elevation models (DEMs). These datasets were used to extract relevant thematic layers such as land use/land cover, geology, geomorphology, lineament density, drainage density, and slope, which are recognized as key indicators of groundwater potential [26].
Thematic maps derived from remote sensing—representing slope, relief, soil type, geology, geomorphology, drainage patterns, land use, and the Normalized Difference Vegetation Index (NDVI)—were integrated within a GIS environment using spatial analysis tools and weighted overlay methods to delineate groundwater potential zones (GWPZ) [27]. To enhance this process, a combination of GIS and the Analytic Hierarchy Process (AHP) was applied, incorporating thematic layers such as geology, geomorphology, land use/land cover, lineament density, drainage density, rainfall, soil, slope, roughness, topographic wetness index, topographic position index, and curvature [28]. Each layer was assigned a weight based on its relative importance in influencing groundwater occurrence, as determined through pairwise comparisons within the AHP framework.
Remote sensing analysis enabled the identification of correlation between groundwater occurrence and surface features such as vegetation cover, soil moisture, and surface temperature, thereby contributing to the estimation of groundwater conditions [29]. To complement and validate the remote sensing and GIS-derived results, geophysical surveys (e.g., electrical resistivity) were employed to obtain subsurface information on aquifer characteristics and groundwater depth [30]. Furthermore, hydrogeological investigations, including well inventory and water-level measurements, were conducted to provide ground-truth data and support the calibration of the geo-information model.
To address the limitations of fixed expert-derived weights in AHP, two complementary approaches were incorporated into the methodology. First, Monte Carlo simulations were applied to the AHP weighting scheme, generating multiple realizations of the assigned weights to assess uncertainty and provide probabilistic insights into model robustness. Second, fuzzy logic aggregation using the Gamma operator was employed to represent groundwater suitability more flexibly by amplifying the contribution of favorable conditions while moderating less influential ones. Together, these extensions strengthened the methodological framework, ensuring both reliability and adaptability in delineating groundwater potential zones in the Akbakay region.

2.1. Study Area

Given the critical need for sustainable groundwater management in this arid region, characterized by low precipitation and high evapotranspiration rates, a study area of 14.9 thousand sq. km was selected for detailed analysis. The boundaries were defined in relation to the Sarybulak-2 unconfined aquifer, a key source of freshwater for irrigation, drinking, and technical water supply, vital for supporting local communities and agricultural activities. The Akbakay region (Figure 1) is characterized by low annual precipitation (<200 mm) [31], high evapotranspiration rates, limited surface water availability, and increasing demand for water in agriculture and rural communities. These factors make groundwater the primary reliable water source, and unsustainable use could lead to rapid depletion, water quality deterioration, and socioeconomic stress.
The study area is located within the semi-desert and desert zones, characterized by a sharply continental and arid climate. The mean annual air temperature recorded at the Akbakay meteorological station is 7.1 °C [32]. Summers are hot and prolonged, with maximum air temperatures reaching 40 °C, while frost-free periods extend over 210–230 days. July is the warmest month, with average monthly temperatures ranging from 25 to 30 °C. Winters are severe, lasting 90–110 days, with minimum temperatures occasionally dropping to −40 to −45 °C. Snow cover is generally shallow, with average maximum depth of 10–15 cm and a water reserve of 30–60 mm. Snowmelt typically begins in March, and autumn is notably dry, with September being the driest month of the year (Appendix A).
Wind conditions are severe, especially in winter, with average speeds of 5–6 m/s and extremes up to 20–25 m/s. Blizzards are common, lasting for several days, with 20–25 blizzard days per season. Prevailing winds blow from the northeast and east in winter, and from the northeast, east, north, and northwest in summer, at mean speeds of 3.0–3.5 m/s.
Annual precipitation averages approximately 153 mm, with 112 mm falling during the effective moisture period (November–May). Precipitation is distributed relatively evenly, though spring rains are most abundant, often occurring as heavy showers. The lowest precipitation occurs in August–September, and in some dry years, rainfall may be absent during these months. The region receives high solar radiation (130–150 kcal/cm2 annually) and long sunshine duration (2700–3000 h), which enhances evaporation and reduces soil moisture availability. Absolute humidity follows the annual temperature cycle, and overall, the area is classified as one of insufficient moisture supply.
By focusing on this area, the study aims to address the challenges of water scarcity exacerbated by climate change and increasing demand through the application of remote sensing and geo-information modeling techniques. Specifically, this research investigates the potential of AHP strategies to enhance groundwater storage and resilience. The approach uses GIS and remote sensing data to identify potential sites for AHP implementation, contributing to the long-term sustainability of water resources in the region, where groundwater is essential for agriculture in arid and semi-arid conditions. The novelty of our work does not lie in the methods alone, but in how we have adapted and extended them to the specific hydrogeological and socio-environmental context of Central Asia. To date, there have been very few systematic groundwater suitability assessments in Central Asia, despite the region’s acute water scarcity, reliance on transboundary resources, and climate-induced variability. The entire Central Asia is of major hydropolitical concern and great interest from several aspects, e.g., transboundary hydropolitics.

2.2. Processing of Radar Topographic Survey Data

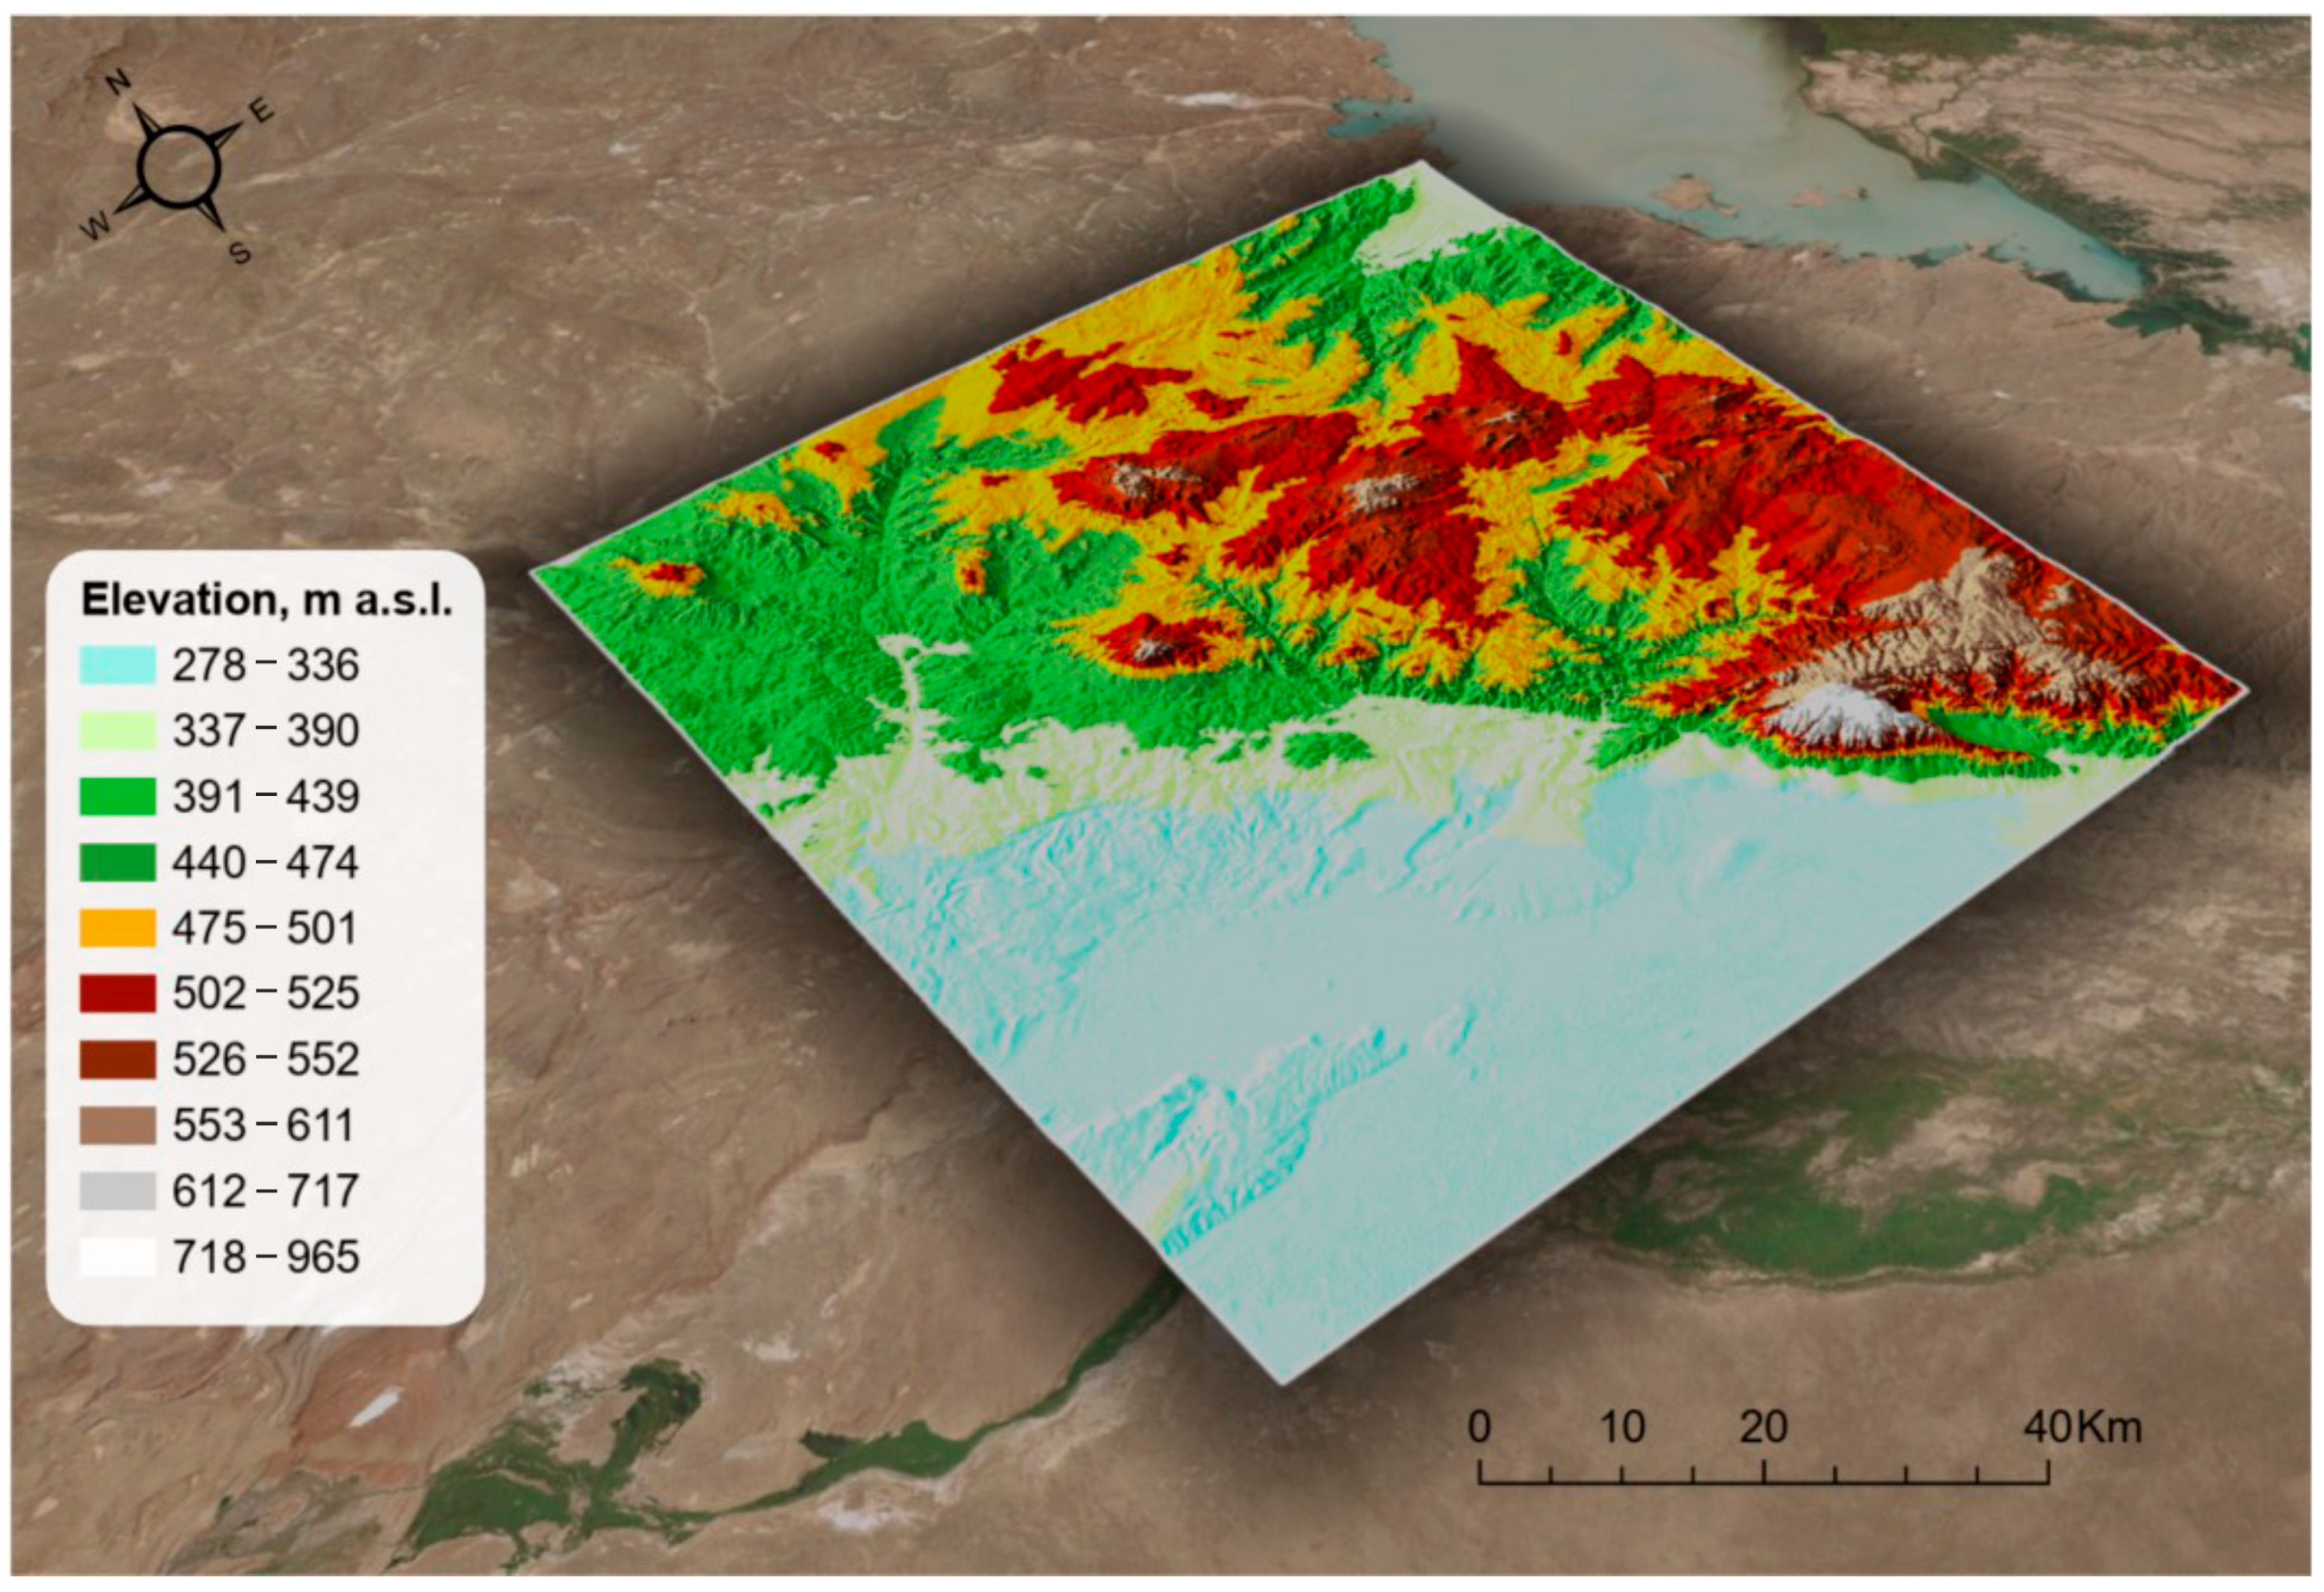
Radar topographic data were analyzed and processed to generate a Digital Elevation Models (DEM). The DEM (Figure 2) was used to delineate local catchment basins and erosional patterns within the study area, with the primary objective of mapping potential groundwater storage zones. The DEM for the study area, with a resolution of 30 m, derived from GLO-30 data, is presented in Figure 2.
Based on the generated DEM, local catchment basins and the erosional pattern of the study area were delineated using the ArcHydro Tool in the ArcGIS environment, specifically its water resources analysis module. The resulting map is shown in Figure 3.
Radar topographic survey data processing utilized six images from the Copernicus GLO-30 Digital Elevation Model, which fully covers the study area. Copernicus is the European Union’s Earth observation program, providing freely and openly accessible information services based on satellite Earth observation data for monitoring our planet and its environment. Copernicus is the Earth observation component of the European Union’s space programme, aimed at monitoring our planet and its environment. It provides information services based on Earth observation satellite data. The services offered are free of charge and openly accessible to users.
TanDEM-X is a civilian Earth remote sensing radar satellite developed by the German Aerospace Centre (DLR) in cooperation with EADS Astrium GmbH. It was launched into orbit on 21 June 2010 using a Ukrainian-Russian Dnepr conversion rocket from Launch Pad No. 109 at the Baikonur Cosmodrome. The satellite’s primary purpose is the creation of a global digital elevation model known as WorldDEM™.
The Copernicus DEM is a digital surface model that represents the Earth’s surface, including buildings, infrastructure and vegetation. The DEM is available in three variants: EEA-10, GLO-30 and GLO-90. The data were acquired during the TanDEM-X mission conducted from 2011 to 2015.

2.3. Processing of Satellite Imagery

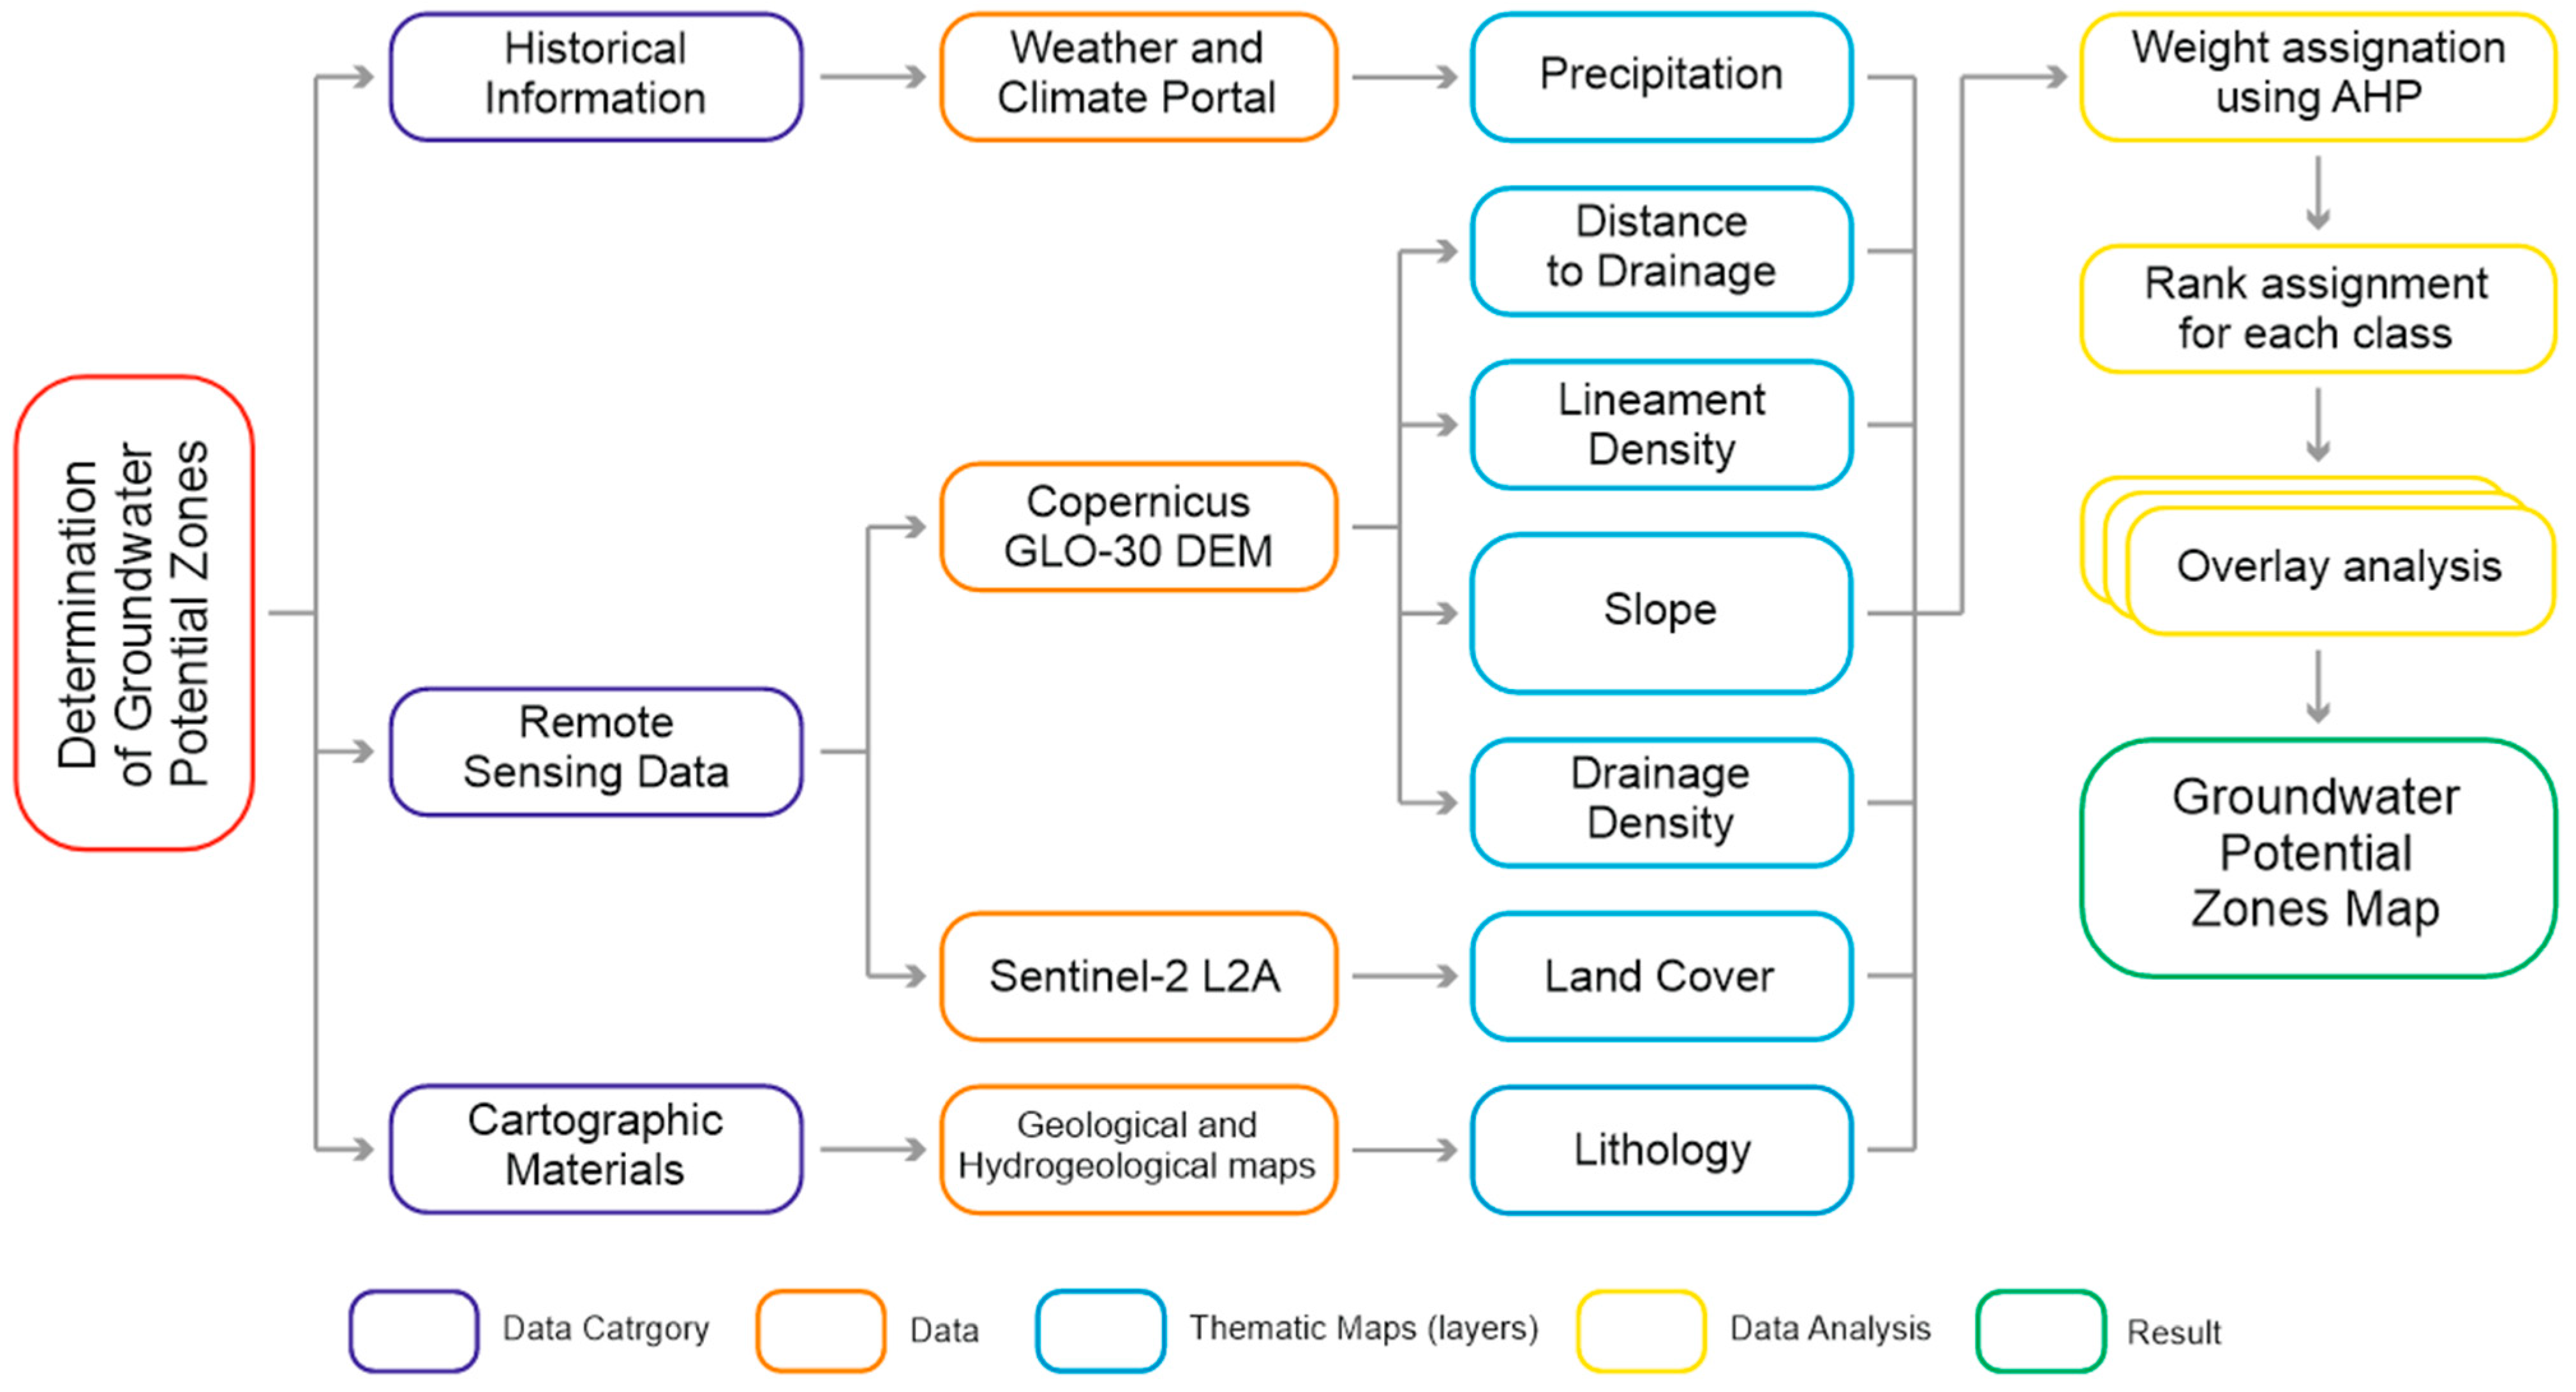
The analysis and processing of satellite imagery for the study area were conducted to generate specialized thematic maps for the identification of potential groundwater storage zones. To delineate these zones, several data categories were selected and weighted using the AHP. The methodology and input datasets are illustrated in Figure 4.
Using remote sensing data, integrated with the PCI Geomatica platform and the ArcGIS environment, the following specialized raster maps were produced:
  • Lithological map;
  • Lineament density map;
  • Erosion network density map;
  • Daylight surface slope map;
  • Distance-to-erosion map;
  • Precipitation map;
  • Land cover map.
The importance (weight) of each map layer was assigned using the AHP method, resulting in a final map of potential groundwater storage zones.

2.4. Analytic Hierarchy Process and Weight Assignment

The AHP is a widely recognised tool in systems analysis for addressing complex hierarchical, multi-criteria, and multi-alternative decision-making problems. It was developed in the 1970s by Saaty [32]. The Saaty relative importance scale (see Table 1) formed the basis of the methodology, enabling expert assessments to be formalised and qualitative judgements to be converted into quantitative values. AHP was used to derive ratio scales from both discrete and continuous paired comparisons within multi-level hierarchical structures (Table 1). Based on this scale, a matrix of thematic map pairwise comparisons was compiled (Table 2).
This matrix includes the key hydrogeological and geomorphological parameters that have the greatest impact on infiltration formation conditions and the potential suitability of areas for managed aquifer recharge (MAR) measures. These parameters are as follows: lithology, lineament density, drainage network density, surface slope, distance to the drainage network, amount of precipitation and land use.
The comparisons may be based on actual measured values or subjective estimates that reflect potential preferences. AHP is particularly suitable for the analysis of non-linear structures, enabling both deductive and inductive reasoning without relying on syllogisms, while simultaneously accounting for the interrelations between multiple factors and finding compromise in the decision-making process [33]. The assignment of weights was carried out using a pairwise comparison matrix of the generated map layers employing the AHP Template with Multiple Inputs (BPMSG) [34], as shown in Table 2. Further details on the AHP method and the formulae used for weight (importance) assignment can be found in the works of Saaty [35].
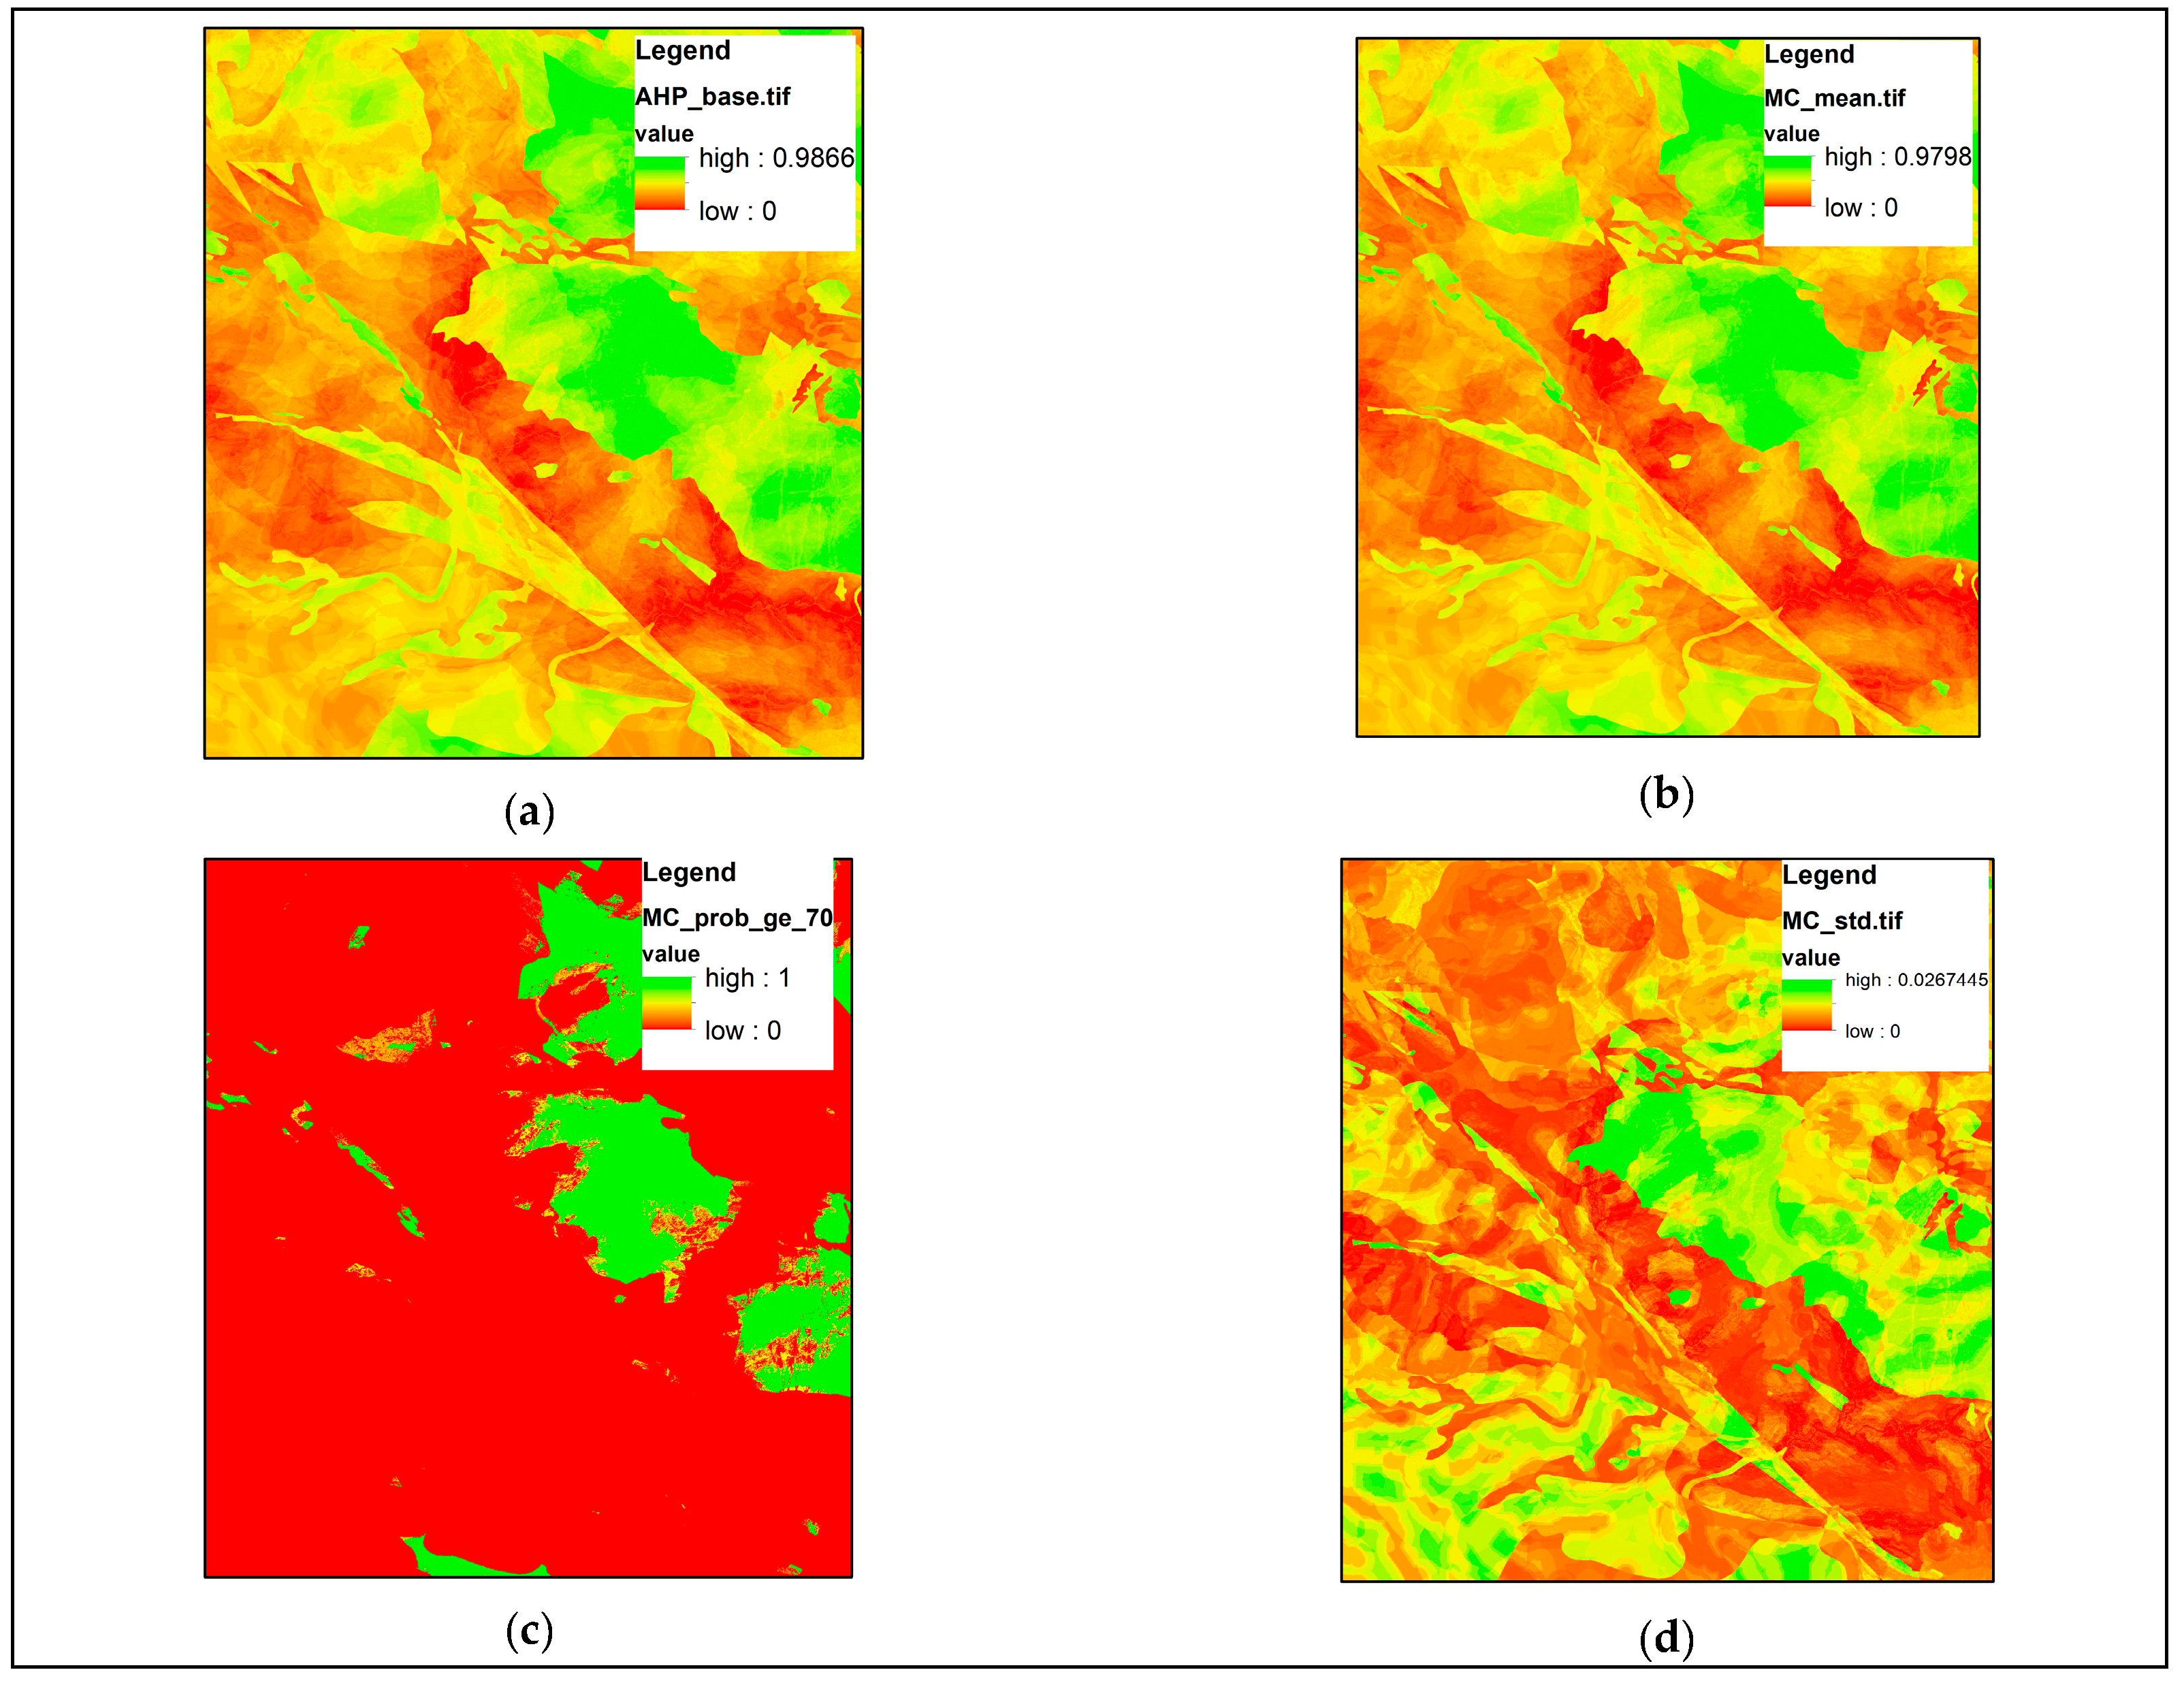
Beyond the baseline AHP procedure, weights were perturbed randomly within ±10% across 200 Monte Carlo simulations to assess the sensitivity of the suitability model. From these simulations, mean suitability (MC_mean), standard deviation (MC_std), and the probability of exceeding the 0.70 suitability threshold (MC_prob ≥ 0.70) were derived.
Additionally, fuzzy membership functions were applied to all normalized criteria, and the Fuzzy Gamma operator (γ = 0.9) was employed to combine them. This approach balances the algebraic product and sums of fuzzy memberships, emphasizing zones with consistently favorable conditions. The outputs were compared with the baseline AHP results to evaluate both robustness and shifts in suitability distribution.

2.5. Field Observations and Chemical Analyses

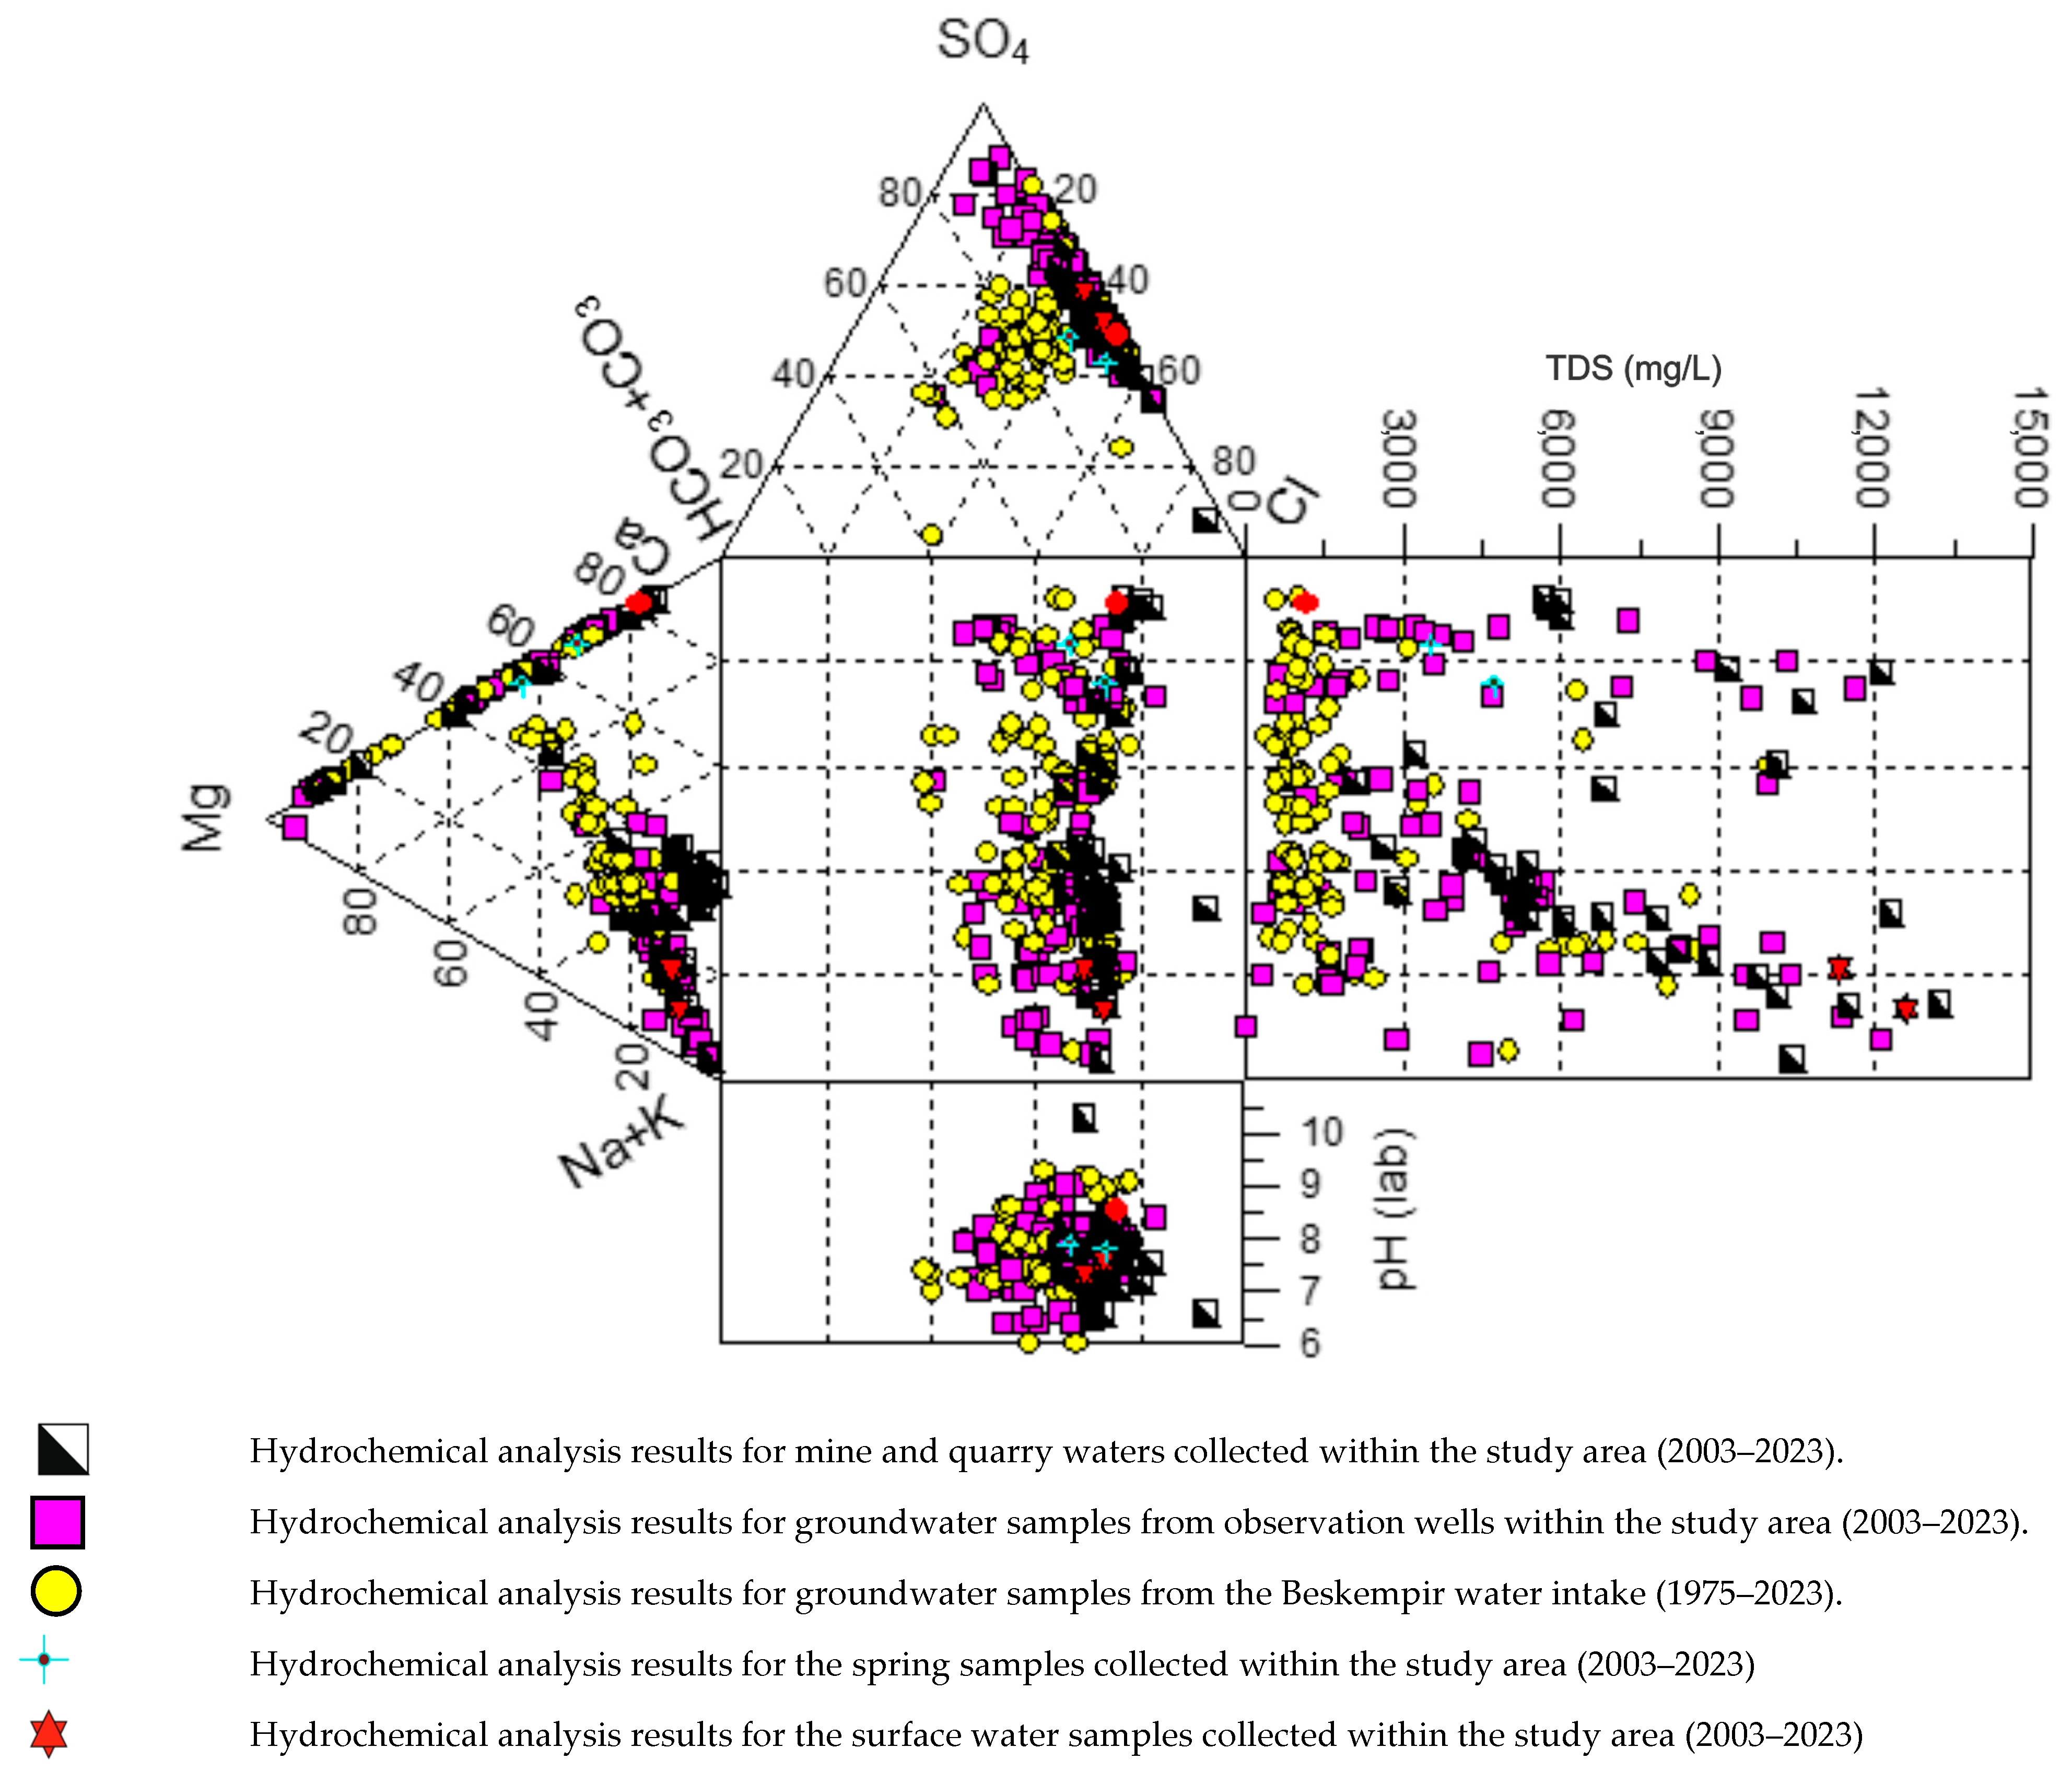
At the preliminary stage of the study, all available data from previously conducted investigations were collected and systematically analyzed [36]. The results of the historical chemical analyses of groundwater sampling points are summarized in the Durov diagram in Figure 5.
These earlier hydrogeological surveys and groundwater sampling campaigns were primarily undertaken to support the water supply requirements of mining enterprises operating within the study area (Appendix B).
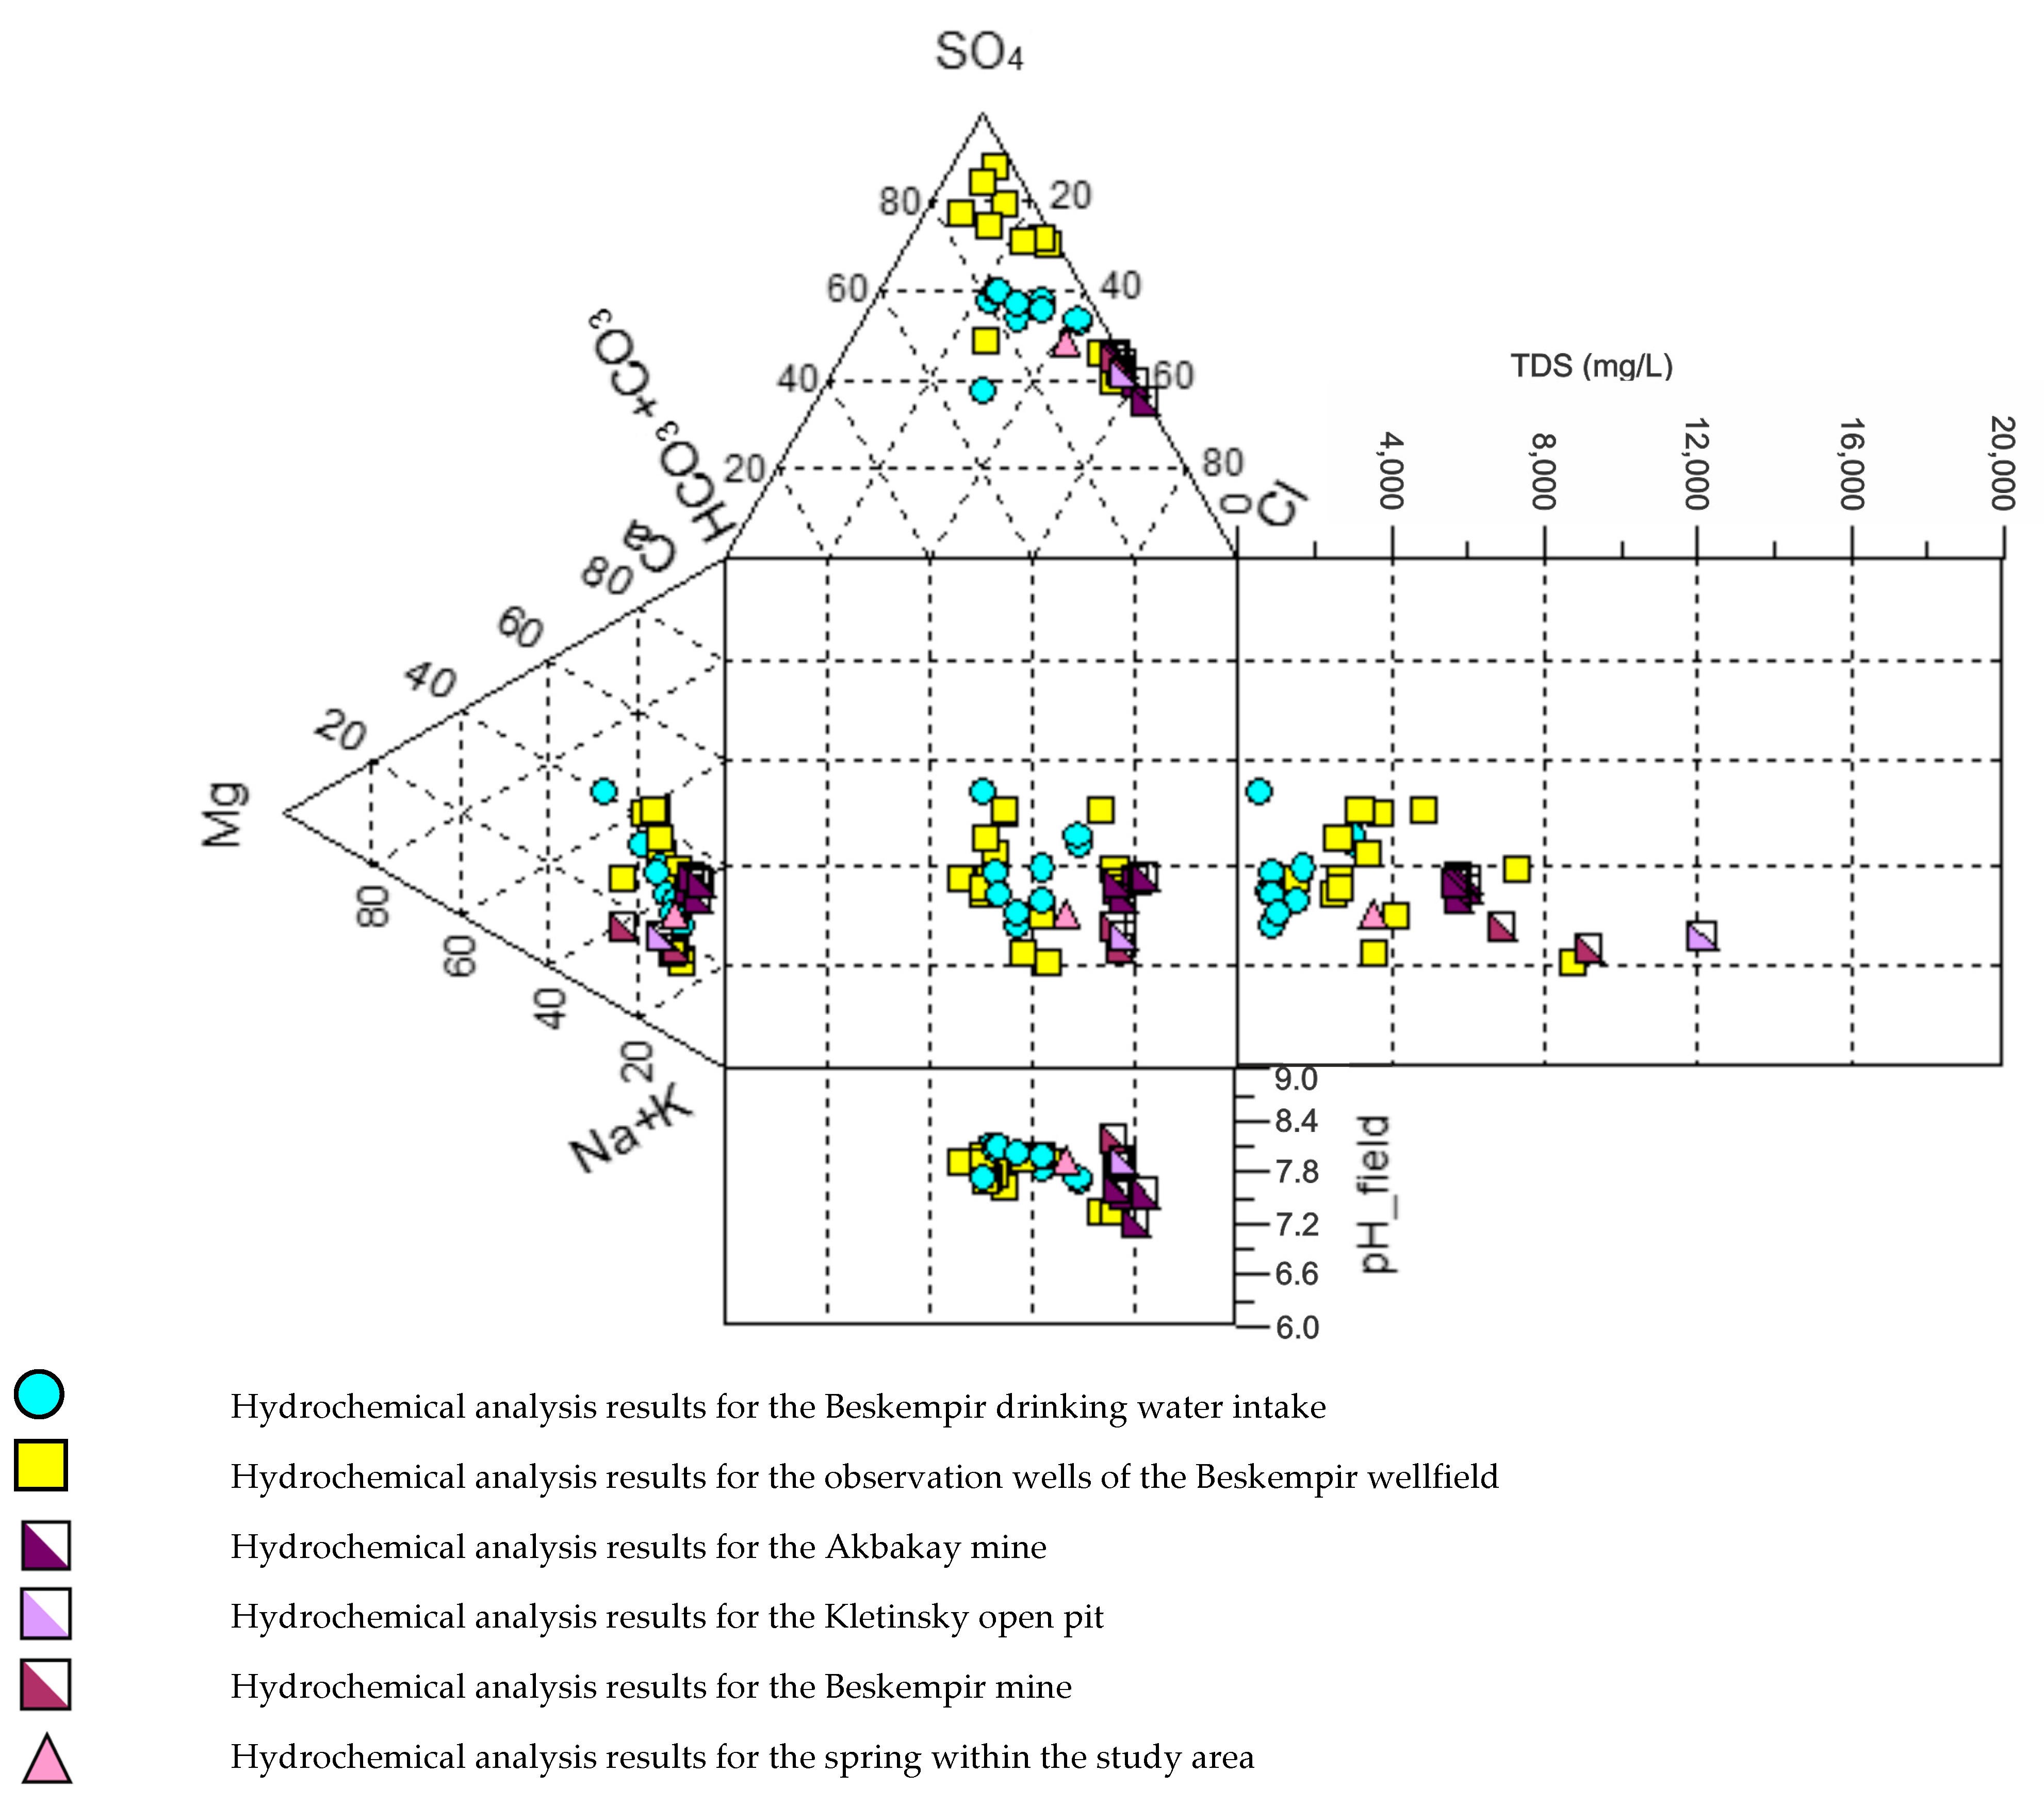
To assess the prevailing hydrogeological conditions, verify the findings of previous studies, and establish an up-to-date understanding of the chemical composition of groundwater, field investigations were conducted (Figure 5 and Figure 6). These investigations included site inspections and hydrochemical sampling from various observation points: historical, monitoring, and production wells, subsurface mine workings (Akbakai and Beskempir mines), tailings pond areas, and zones of groundwater discharge.
A total of 34 water samples were collected. This comprised 3 samples from surface water sources, 24 from wells (including 19 primary and 5 control samples), and 7 from mine water. The underwent chemical analysis for major ions (HCO3, Cl, SO42−, Na+, K+, Ca2+, Mg2+), general water quality indicators (pH, total dissolved solids, suspended solids, total hardness), nutrients (phosphates, ammonium, nitrites, nitrates), organic contaminants (petroleum hydrocarbons, phenols, chemical oxygen demand, biological oxygen demand, anionic surfactants), and trace elements/heavy metals (iron, copper, cadmium, lead, zinc, mercury, manganese, cobalt, chromium (Cr3+ and Cr6+), nickel, aluminum, fluoride, boron, total/free/WAD cyanides, and xanthates) [37]. The analyses provided a comprehensive dataset for evaluating current groundwater conditions (Figure 6). Furthermore, the consistency of these results with earlier hydrochemical data validated the current sampling and analytical procedures.

3. Results

3.1. Creation of Specialised Maps

All generated maps were projected using the WGS 84/UTM Zone 43N coordinate system, with a spatial resolution of 30 × 30 m. To ensure consistency, all maps were converted into a single raster format with uniform pixel values, and their contours and spatial references were aligned to coincide. This preliminary processing stage was undertaken to ensure compatibility and precise overlay of the thematic layers within the GIS environment.
Lithology Map. The geological structure and hydrogeological conditions significantly influence the occurrence, movement, and storage of groundwater. Variations in lithology—specifically, the porosity, permeability, and degree of fracturing of different rock types—play a key role in controlling infiltration rates, subsurface flow pathways, and the formation of aquifers. Consequently, a detailed understanding of the geological framework is crucial for delineating zones with high groundwater storage potential and for implementing sustainable water management practices. Figure 7 presents a comprehensive lithological map of the study area, developed in the ArcGIS environment using digitized geological and hydrogeological base maps at a scale of 1:200,000. This scale provides a suitable balance between spatial resolution and regional overview, allowing for accurate mapping of lithological boundaries and heterogeneity.
The thematic vector data were subsequently converted into a classified raster format to facilitate spatial analysis and integration within a multi-criteria decision-making framework. Lithological units were systematically classified and assigned weights and ranks based on their hydrogeological relevance, primarily their ability to store and transmit groundwater. For instance, unconsolidated sediments such as sands, gravels, and loams received higher rankings due to their favorable infiltration characteristics, while igneous and metamorphic formations with lower permeability were ranked accordingly. The map employs the standardized USGS Lithclass polygon color scheme [38], ensuring visual consistency and interpretability across lithological categories. This facilitates both expert analysis and stakeholder communication, allowing geologists, hydrogeologists, and planners to rapidly assess the spatial distribution of aquifer-prone formations.
Overall, this lithological map serves as a critical input for hydrogeological modeling, groundwater potential assessment, providing a foundational layer for integrated groundwater resource management in the region.
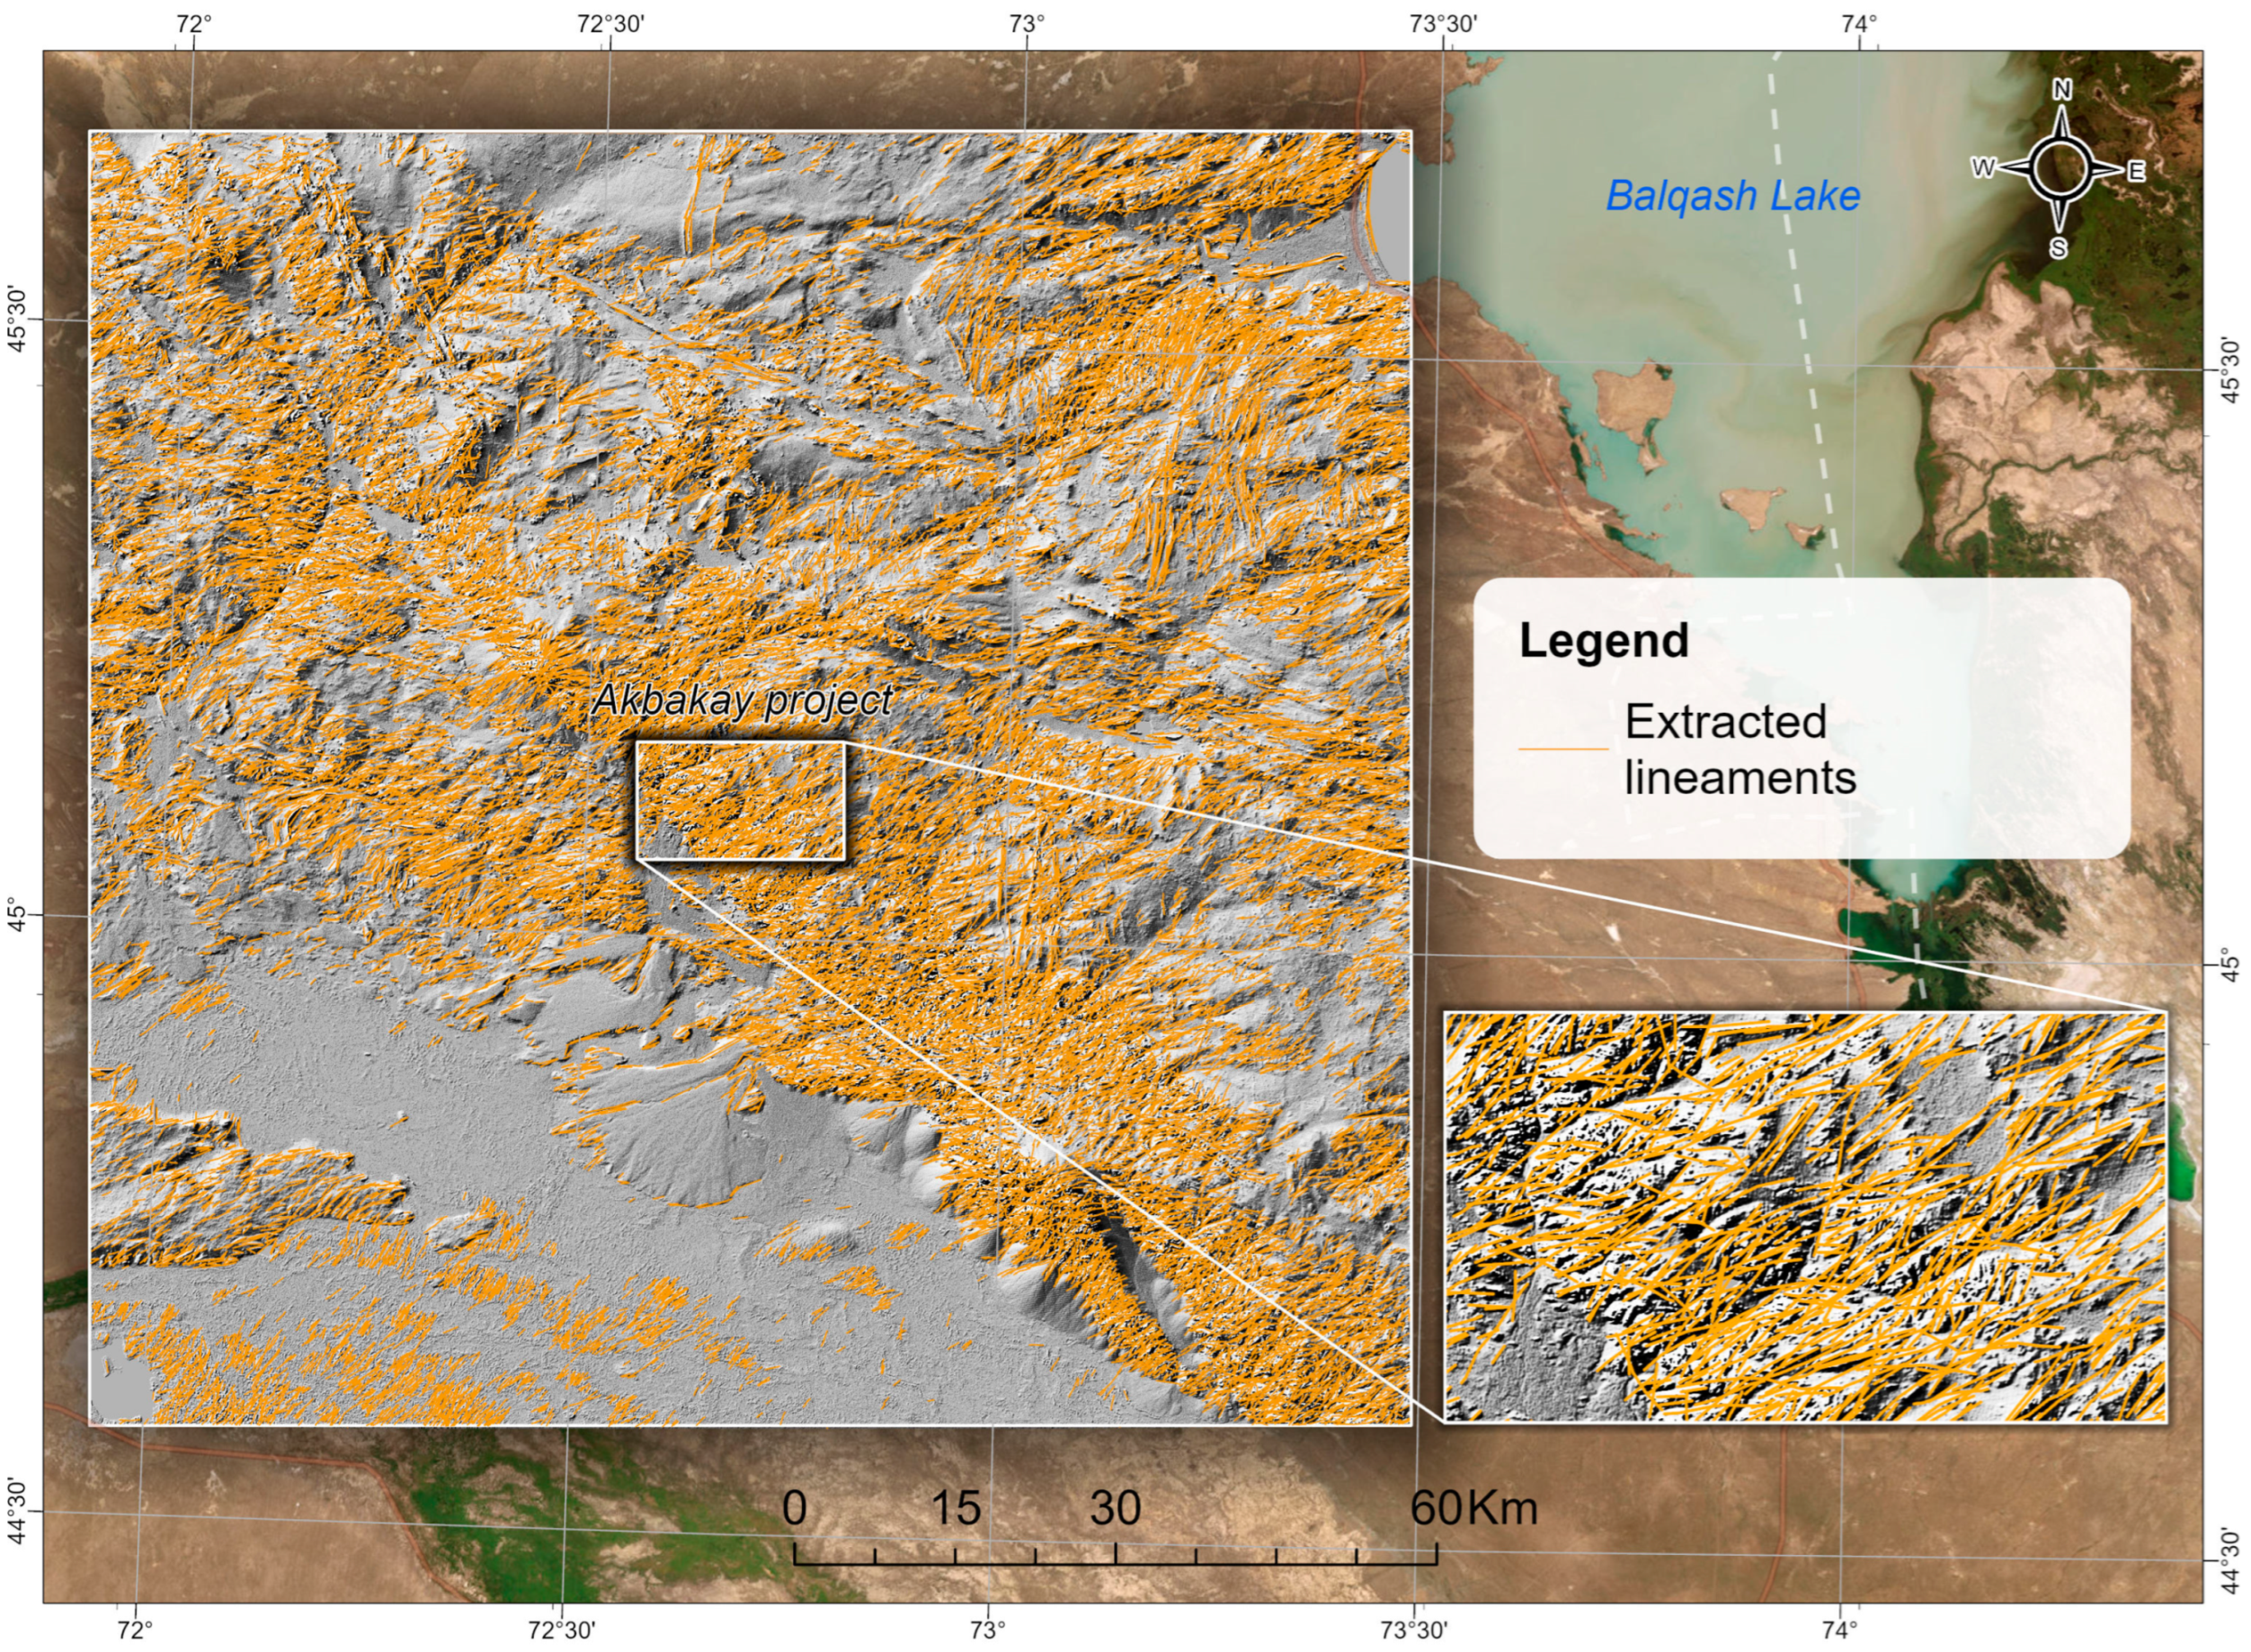
Lineament Density Map. Computer-based processing of satellite imagery enables the detection of lineaments—linear or elongated textures often invisible to the naked eye. The visibility and distinction of lineaments on imagery primarily depend on the stress-deformation state of the Earth’s crust and the associated permeability. This is influenced by how these structures manifest in the landscape and by the physical-chemical properties of the Earth’s surface, including variations in moisture, temperature, oxidation, leaching, weathering, and other properties of soils, rocks, and vegetation. For lineament analysis, a hillshade raster (‘washing’) was created using the Hillshade Tool (Spatial Analyst extension) in ArcGIS, based on the digital elevation model. This tool simulates shaded relief from a raster surface by calculating illumination for each raster cell based on the angle of a hypothetical light source.
Given that lineaments may indicate aquifer zones, as well as buried valleys and erosional patterns, automatic lineament extraction was performed using the LINE module (Table 3) in the Geomatica 2018 (PCI Geomatics, Ontario, Canada) software suite. This tool detects linear features in imagery and generates vector polylines. Artificial objects unrelated to the natural terrain—such as roads, buildings, and other man-made infrastructure—were manually removed.
The following parameters were defined for satellite image processing:
-
RADI (Radius): The radius of the Gaussian kernel (in pixels) used as a filter during edge detection. A larger RADI value reduces noise and yields more detailed results.
-
GTHR (Gradient Threshold): Sets the threshold for the gradient image. This value must be in the range of 0–255. It is recommended to test multiple values to determine the most appropriate one.
-
LTHR (Length Threshold): Defines the minimum curve length (in pixels) to be considered as a lineament.
-
FTHR (Fit Threshold): Specifies the tolerance for joining line segments into a (curved) lineament. This value is specified in pixels. A lower value results in more short segments that closely match actual lineaments; a higher value better suppresses noise and results in longer, straighter lineaments. Typically, a value between 2 and 3 is ideal.
-
ATHR (Angular Threshold): Defines the maximum angle (in degrees) between two vectors for them to be joined.
-
DTHR (Distance Threshold): Specifies the maximum distance (in pixels) between two vectors for them to be connected.
In the terrain, lineaments manifest as regularly oriented zones characterised by straight boundaries or linearised segments of image texture. The layout of extracted local lineaments across the study area is shown in Figure 8. For the lineament analysis, lineament linear density was used as an indicator. The linear density of lineaments, expressed in km/km2, was calculated as the total length of all lineaments within each grid cell (see Figure 9) using the Line Density Tool (Spatial Analyst extension), based on:
D = i 1 n L i A
where Li is the total length of all lineaments of the i-th order (km), and A is the total area of the region (km2).
Elevated values of lineament linear density are considered indicative of groundwater transit and a marker of rock fracturing intensity. Data analysis revealed that fresh groundwater within the study area is most frequently confined to granite formations, which exhibit superior porosity and permeability properties. The lineament density in these zones is generally moderate to low, suggesting a higher degree of weathering. As a result, these areas are less affected by drainage processes, have reduced surface runoff, and present favourable conditions for groundwater storage (Figure 9).
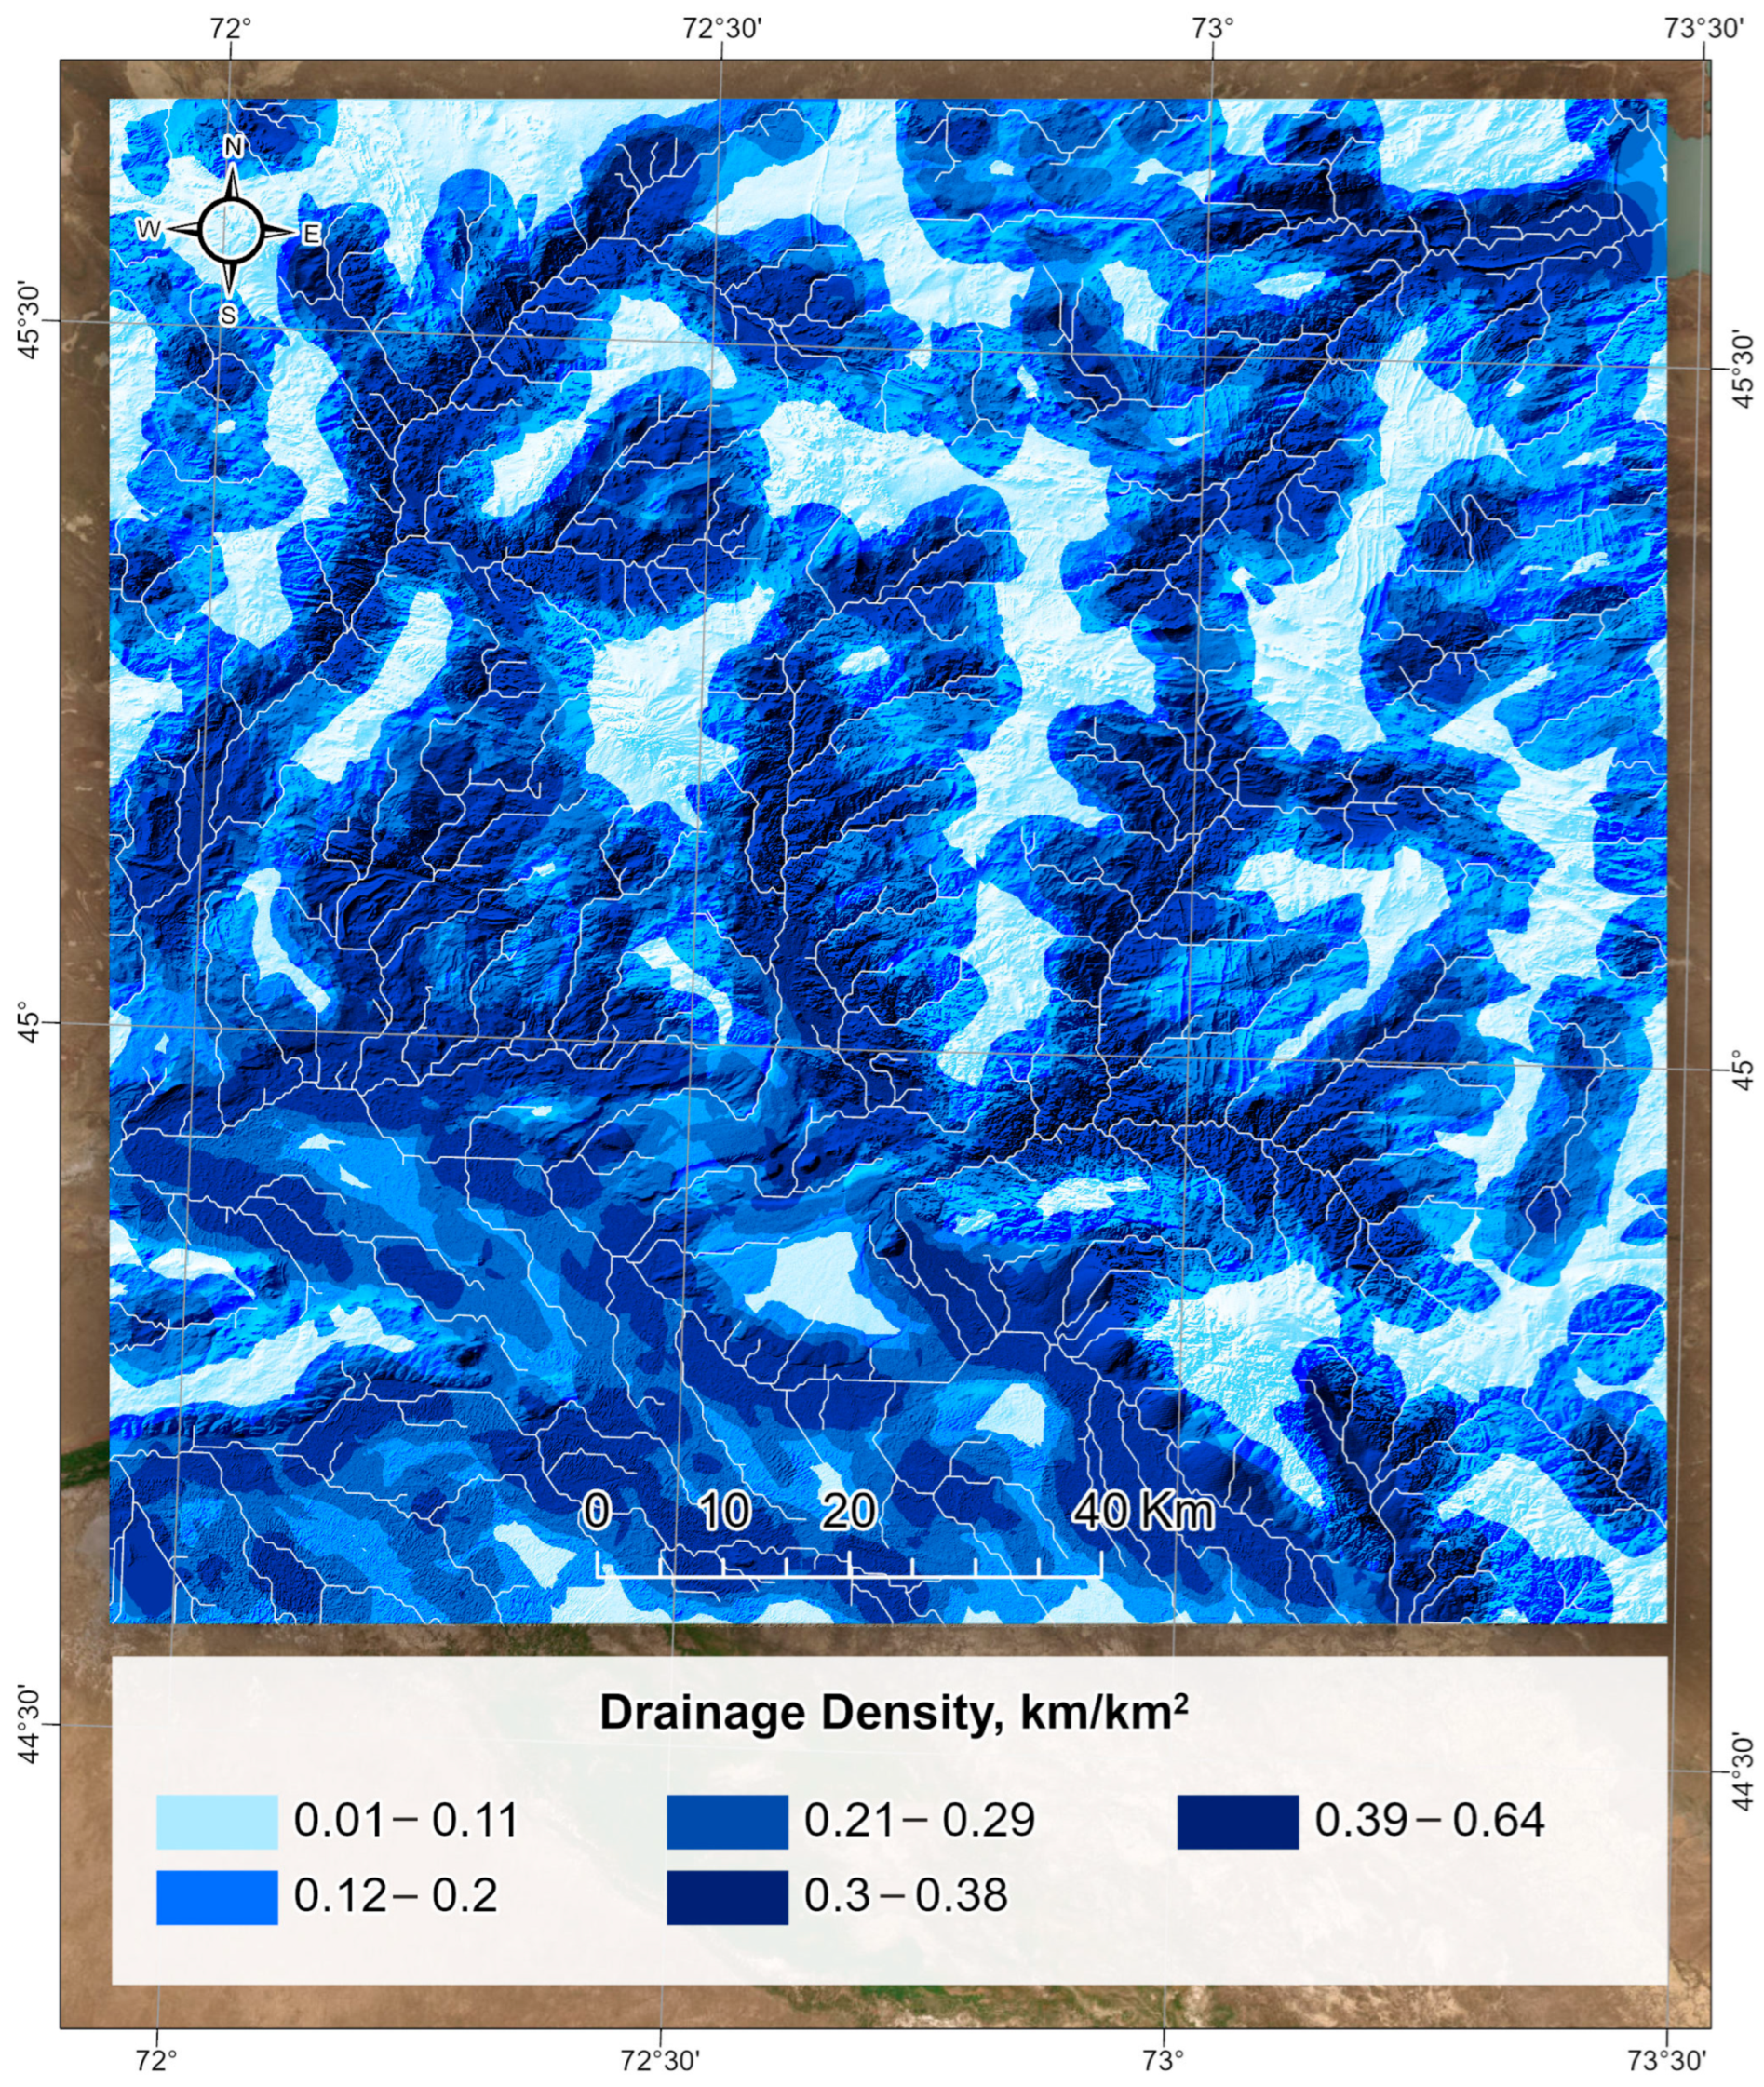
Figure 10 displays the drainage density map, derived from the DEM using the Line Density tool of ArcGIS. This geospatial method quantifies the density of linear features within a specified search radius, effectively identifying areas of high and low erosion and runoff potential. Density is expressed in units of length per unit area (km/km2), using:
D = i 1 n D i A
where Di is the total length of all drainage lines of the i-th order (km) and A is the total area of the region (km2).
The drainage density values across the study area range from 0.01 to 0.64 km/km2, and the map is classified into five equal intervals. Regions with low drainage density (0.01–0.11 km/km2), typically shown in light blue, indicate relatively permeable terrains with subdued relief, where infiltration is favored, and surface runoff is minimized. These zones are considered hydrogeologically favorable for groundwater recharge. In contrast, areas with high drainage density (0.39–0.64 km/km2), represented by dark blue tones, often correspond to steep slopes, resistant lithologies, or poorly infiltrating soils. Such zones tend to promote rapid runoff and reduced subsurface water accumulation. This map enables a preliminary delineation of recharge-susceptible zones and informs further multi-criteria groundwater potential modeling.
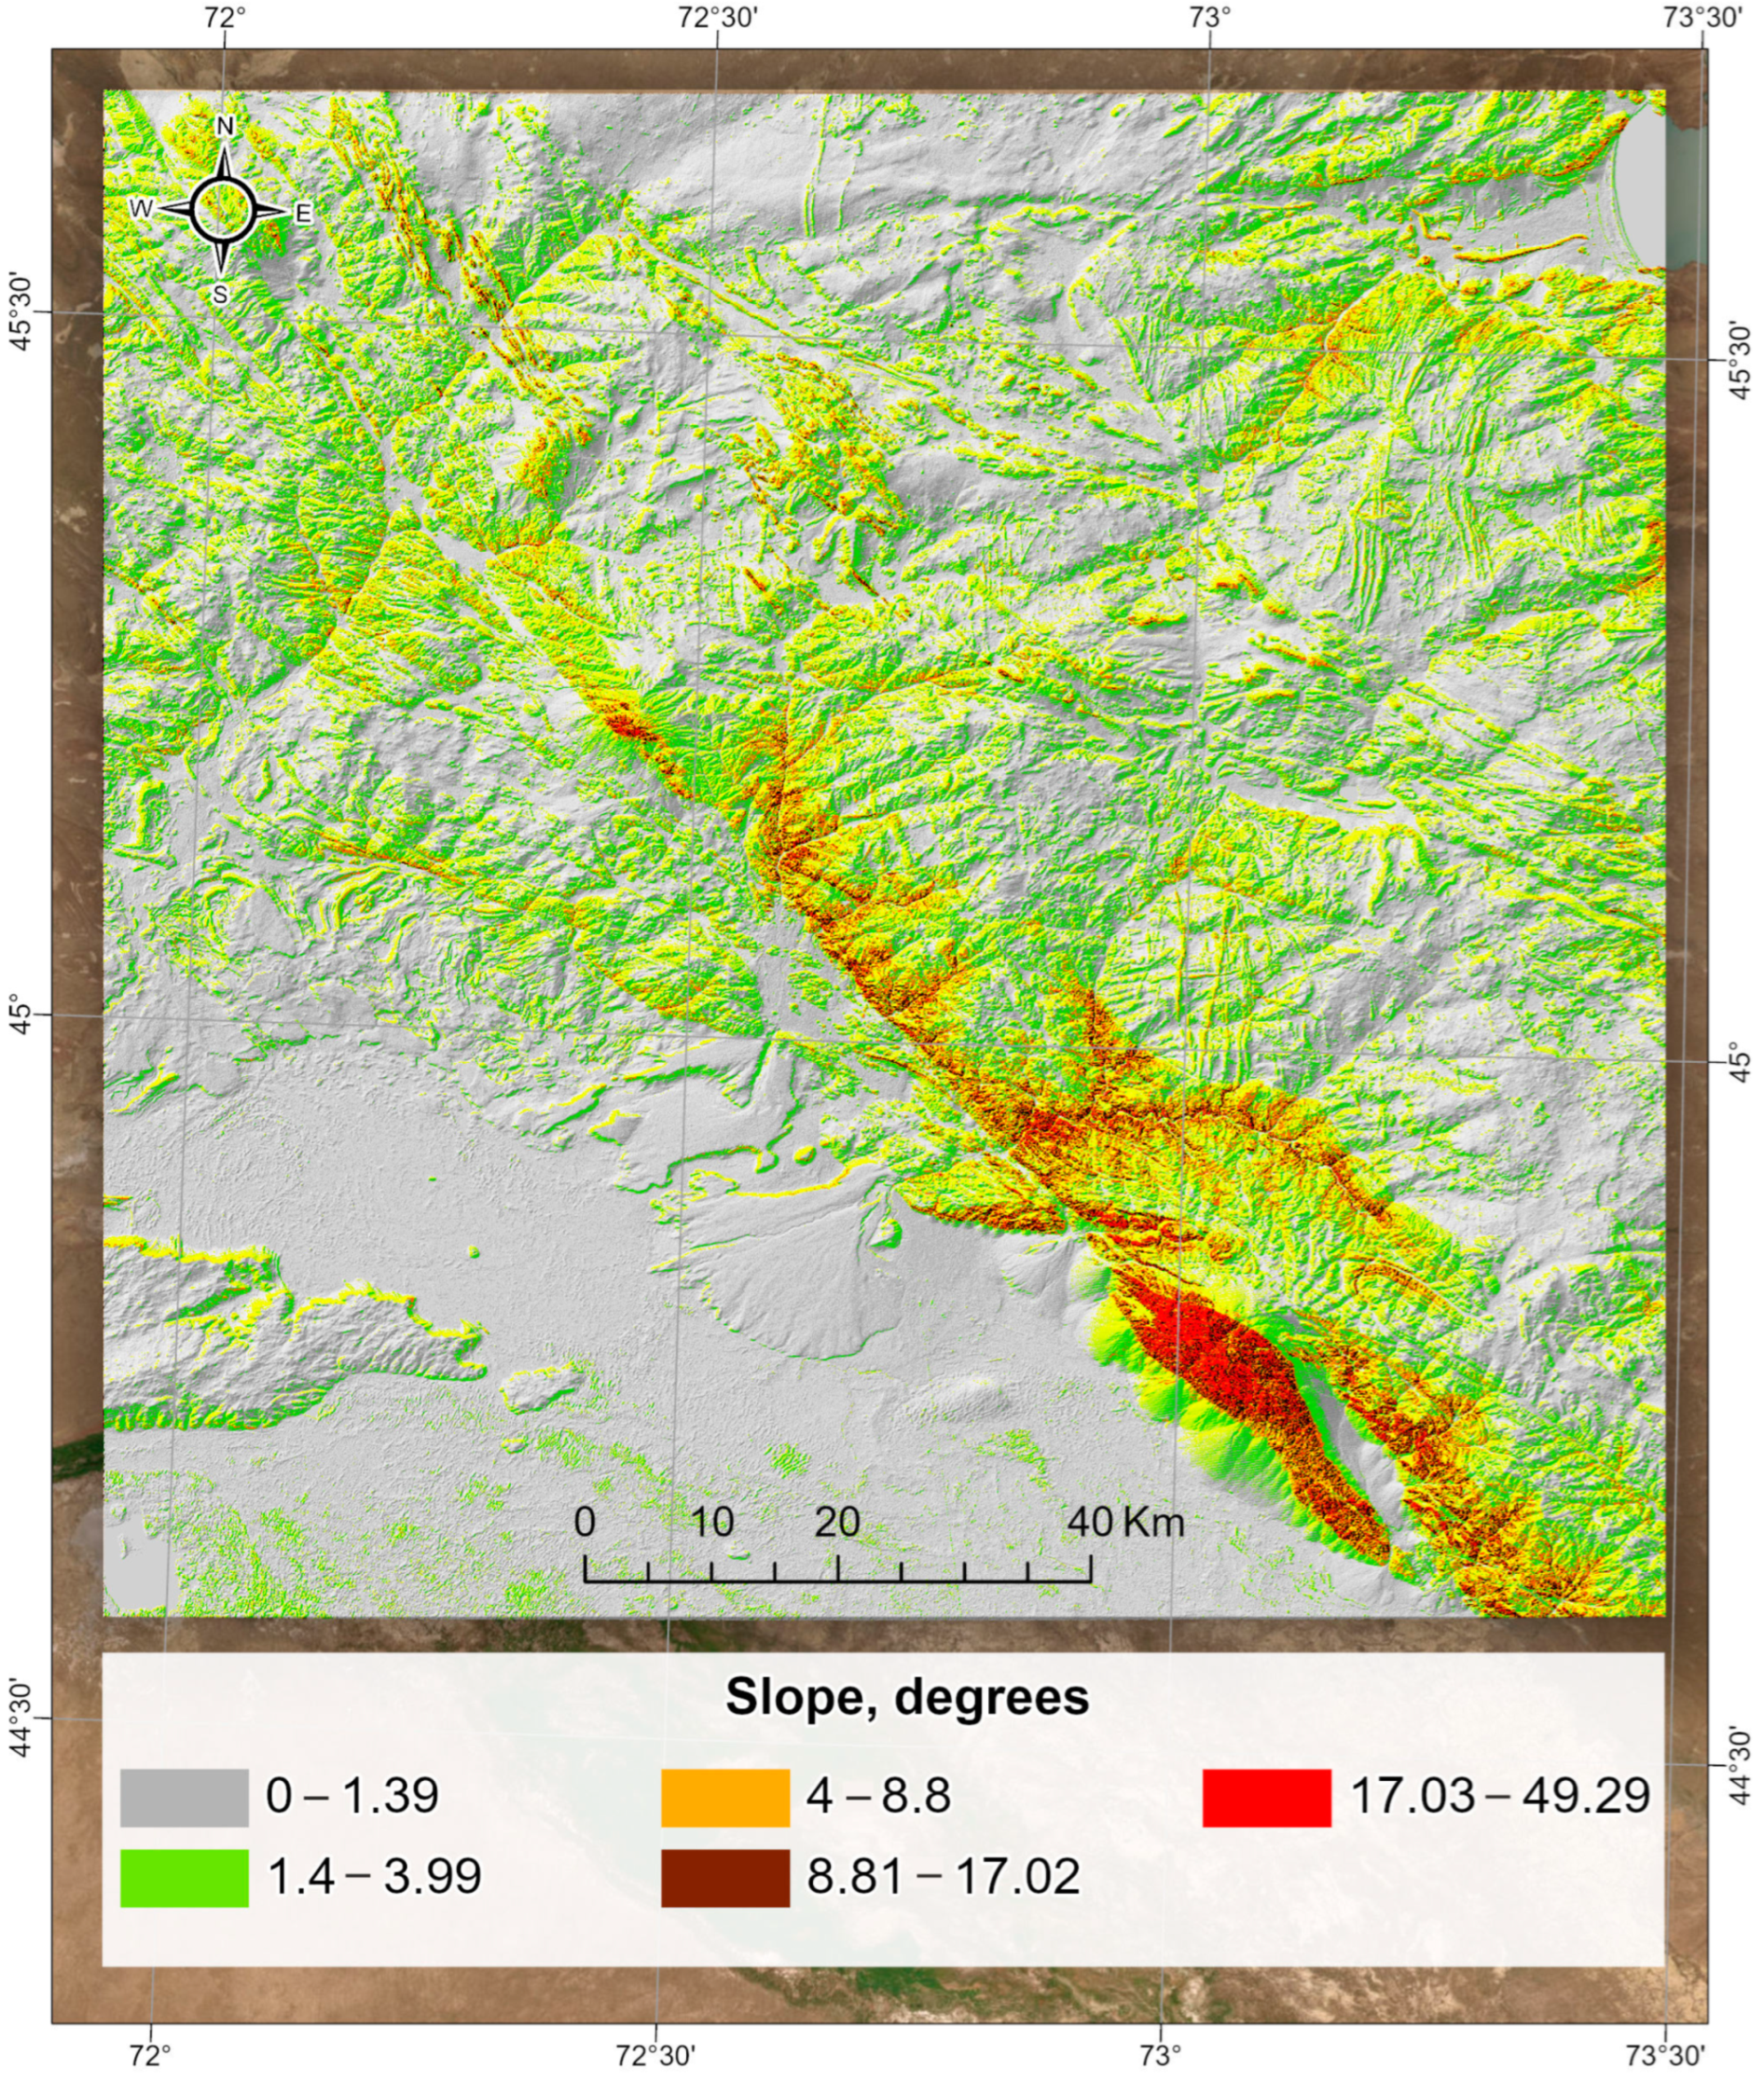
Slope Map. Surface slope is a key topographic factor that directly affects the dynamics of surface runoff and the potential for groundwater infiltration. It reflects the steepness of terrain relative to the horizontal plane and is expressed in degrees. Slope plays a critical role in determining the residence time of surface water, influencing whether precipitation will infiltrate into the subsurface or quickly run off the surface. Figure 11 presents the slope map of the study area, derived from the DEM using the Slope Tool within the ArcGIS Spatial Analyst extension. This tool calculates the gradient for each raster cell, enabling the classification of terrain into distinct slope categories. The slope values range from 0.0° to 49.29°, and have been grouped into five classes for interpretability:
-
0–1.39° (gray): Flat to nearly flat surfaces, which are highly favorable for infiltration and groundwater accumulation due to longer water residence times;
-
1.4–3.99° (light green): Gently sloping areas, also conducive to infiltration;
-
4–8.8° (yellow): Moderately sloping terrain with a balance between infiltration and runoff;
-
8.81–17.02° (brown): Steep slopes, where surface runoff becomes more dominant;
-
17.03–49.29° (red): Very steep terrain, associated with rapid runoff and minimal infiltration potential.
The map reveals that the flatter areas, particularly in the central and southwestern parts of the region, have the highest potential for water infiltration. Conversely, the southeastern and mountainous zones exhibit steep slopes that limit water retention and reduce the likelihood of groundwater recharge. The slope map serves as a crucial spatial layer for understanding hydrological processes and supports the identification of areas with contrasting recharge potentials when combined with lithological, drainage, and land use data.
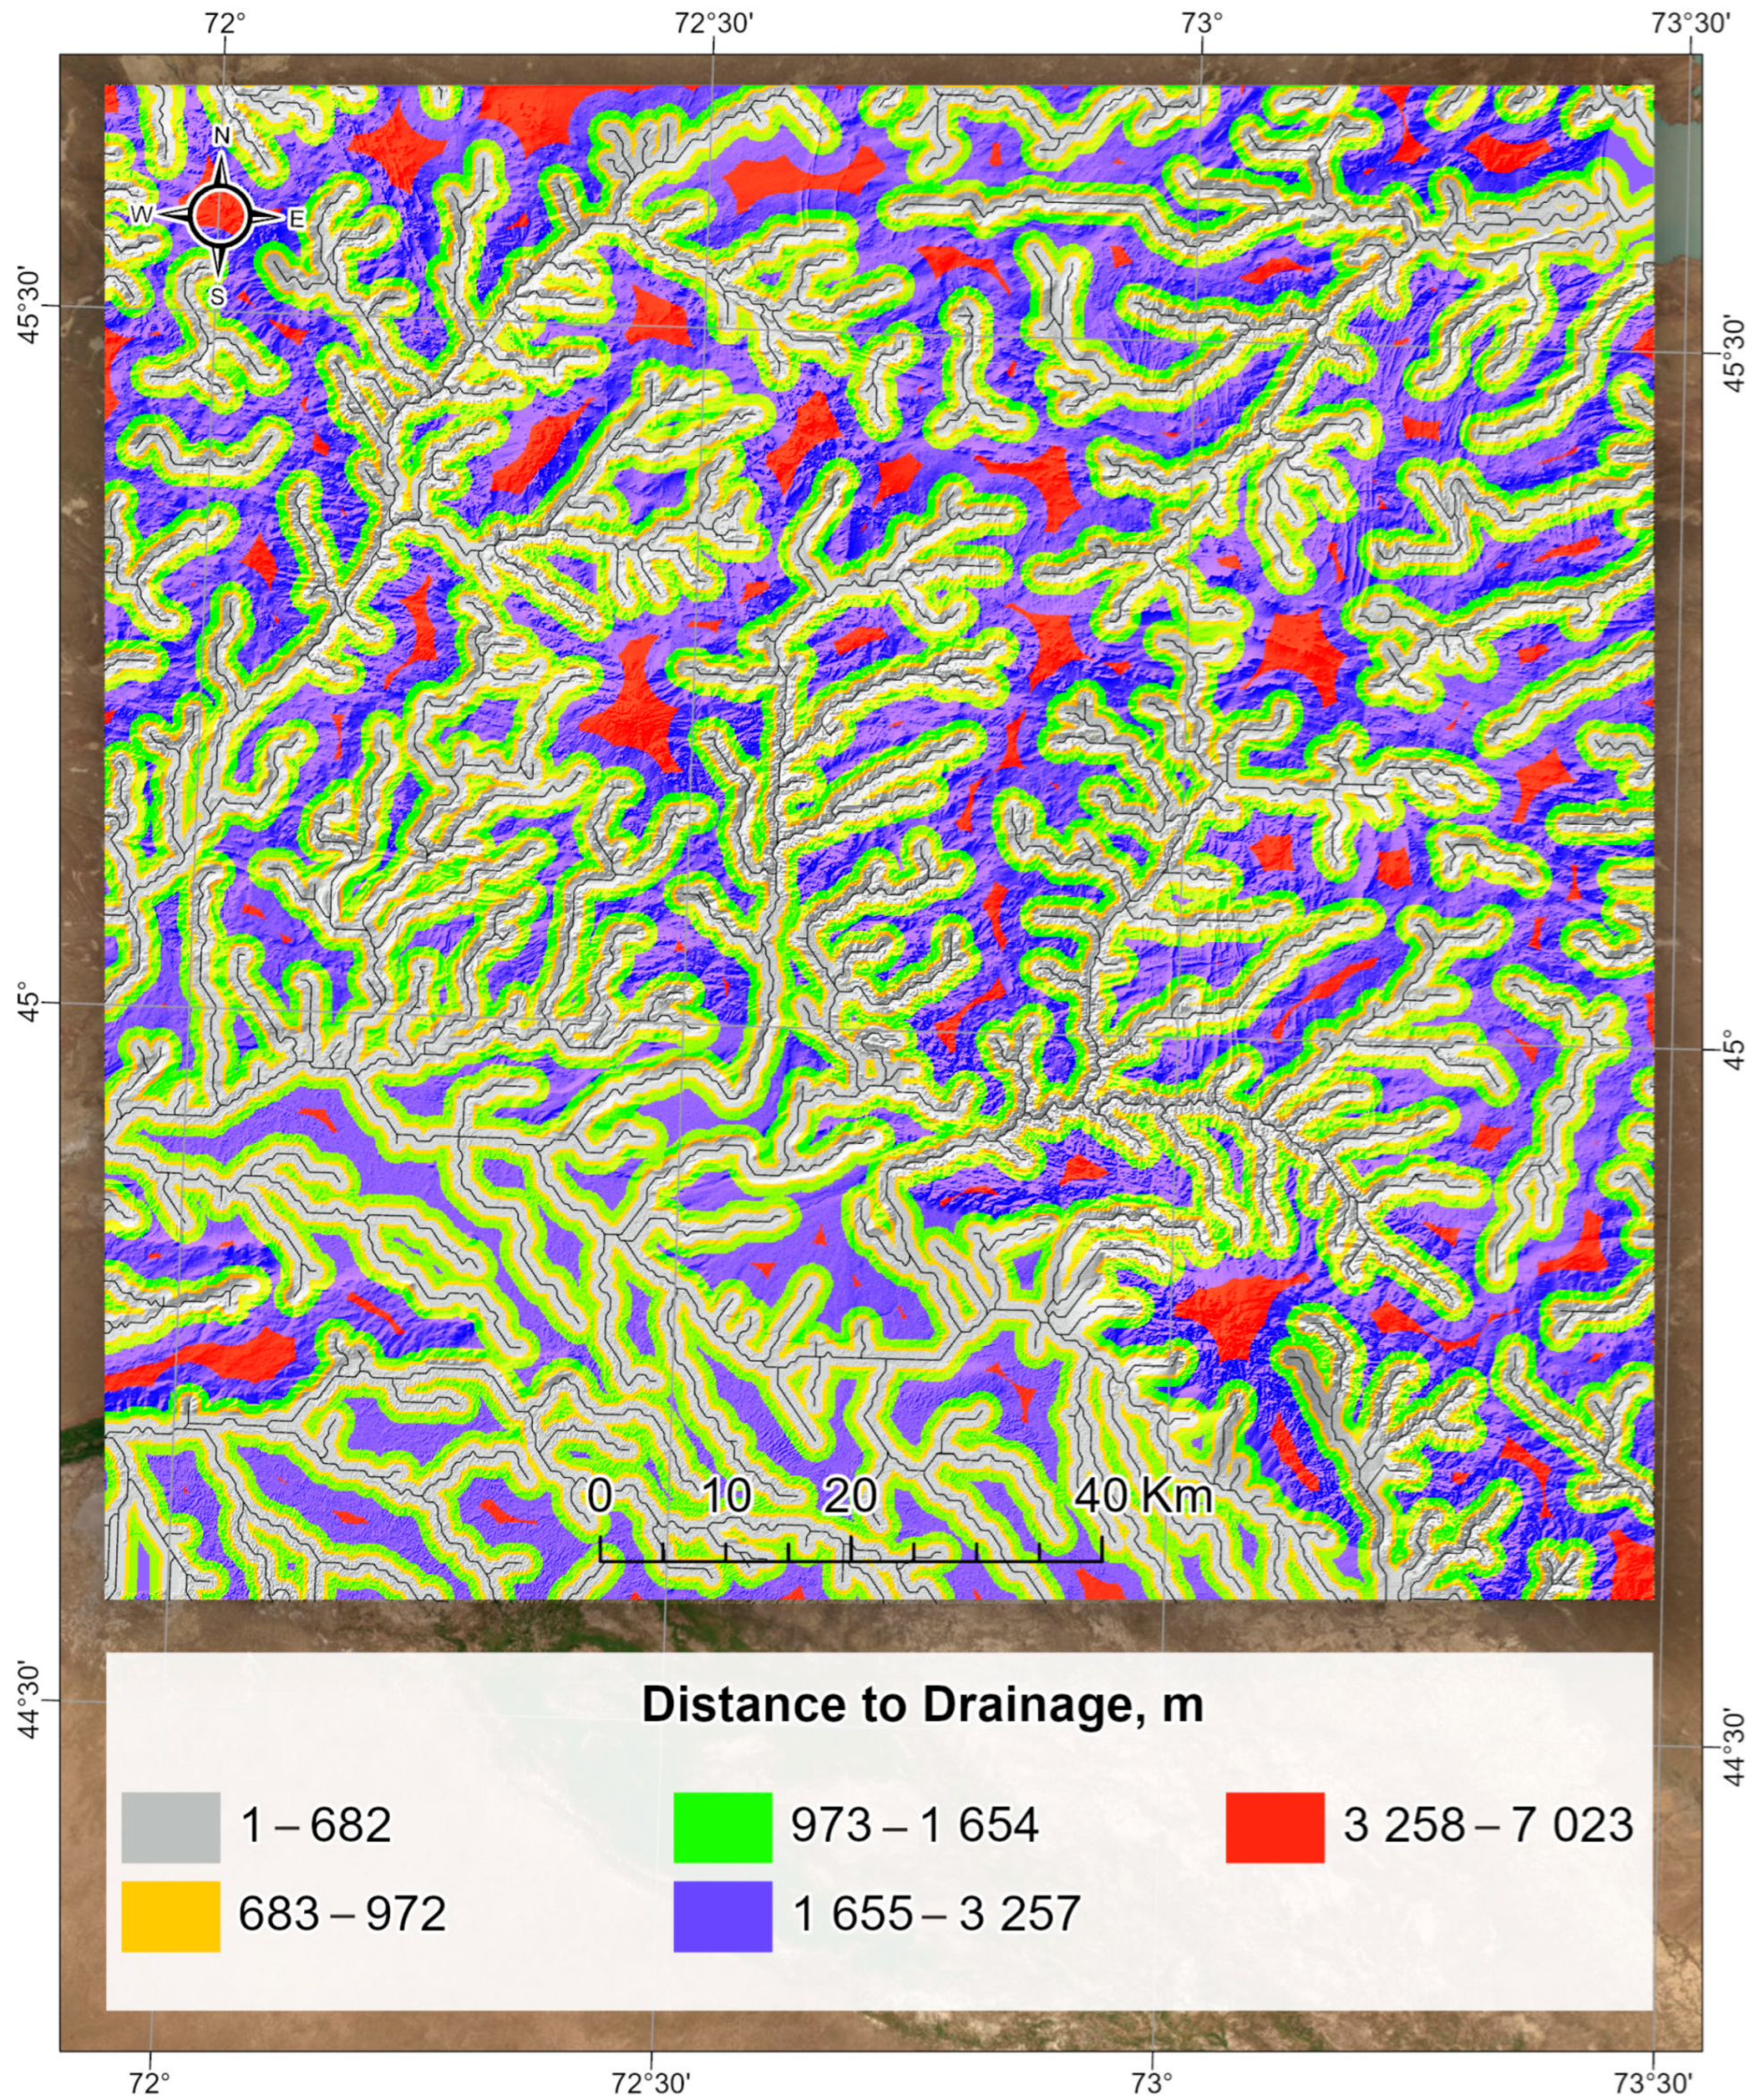
Distance-to-Erosion Map. The spatial distribution of potential zones for groundwater accumulation is closely linked to the geomorphological parameter of distance from drainage channels. Areas situated further from drainage lines generally exhibit lower runoff intensity and increased potential for water infiltration and subsurface storage. This relationship is particularly pronounced in relatively flat or gently undulating terrains, where lateral water movement is minimized, and infiltration dominates over surface flow. To quantify this parameter, a Distance-to-Drainage Map (Figure 12) was generated using the Euclidean Distance tool available in the Spatial Analyst extension of ArcGIS. The analysis was performed based on the high-resolution DEM.
The resulting map depicts the distance from the nearest drainage lines in m, classified into five intervals:
-
1–682 m (grey): Zones adjacent to drainage, typically associated with low accumulation potential due to high runoff.
-
683–972 m (yellow): Transitional zones with moderate surface runoff and limited infiltration.
-
973–1654 m (light green): Favorable zones for groundwater recharge under appropriate lithological and land cover conditions.
-
1655–3257 m (blue): Enhanced infiltration potential due to distance from concentrated drainage pathways.
-
3258–7023 m (red): The most favorable zones for subsurface water accumulation, assuming suitable permeability and hydrogeological conditions.
The spatial differentiation serves as a key input for identifying areas with high potential for Managed Aquifer Recharge (MAR) or natural groundwater replenishment. The classification provides a hydrologically relevant framework for further integration with geological, land use, and soil data layers in subsequent analyses.
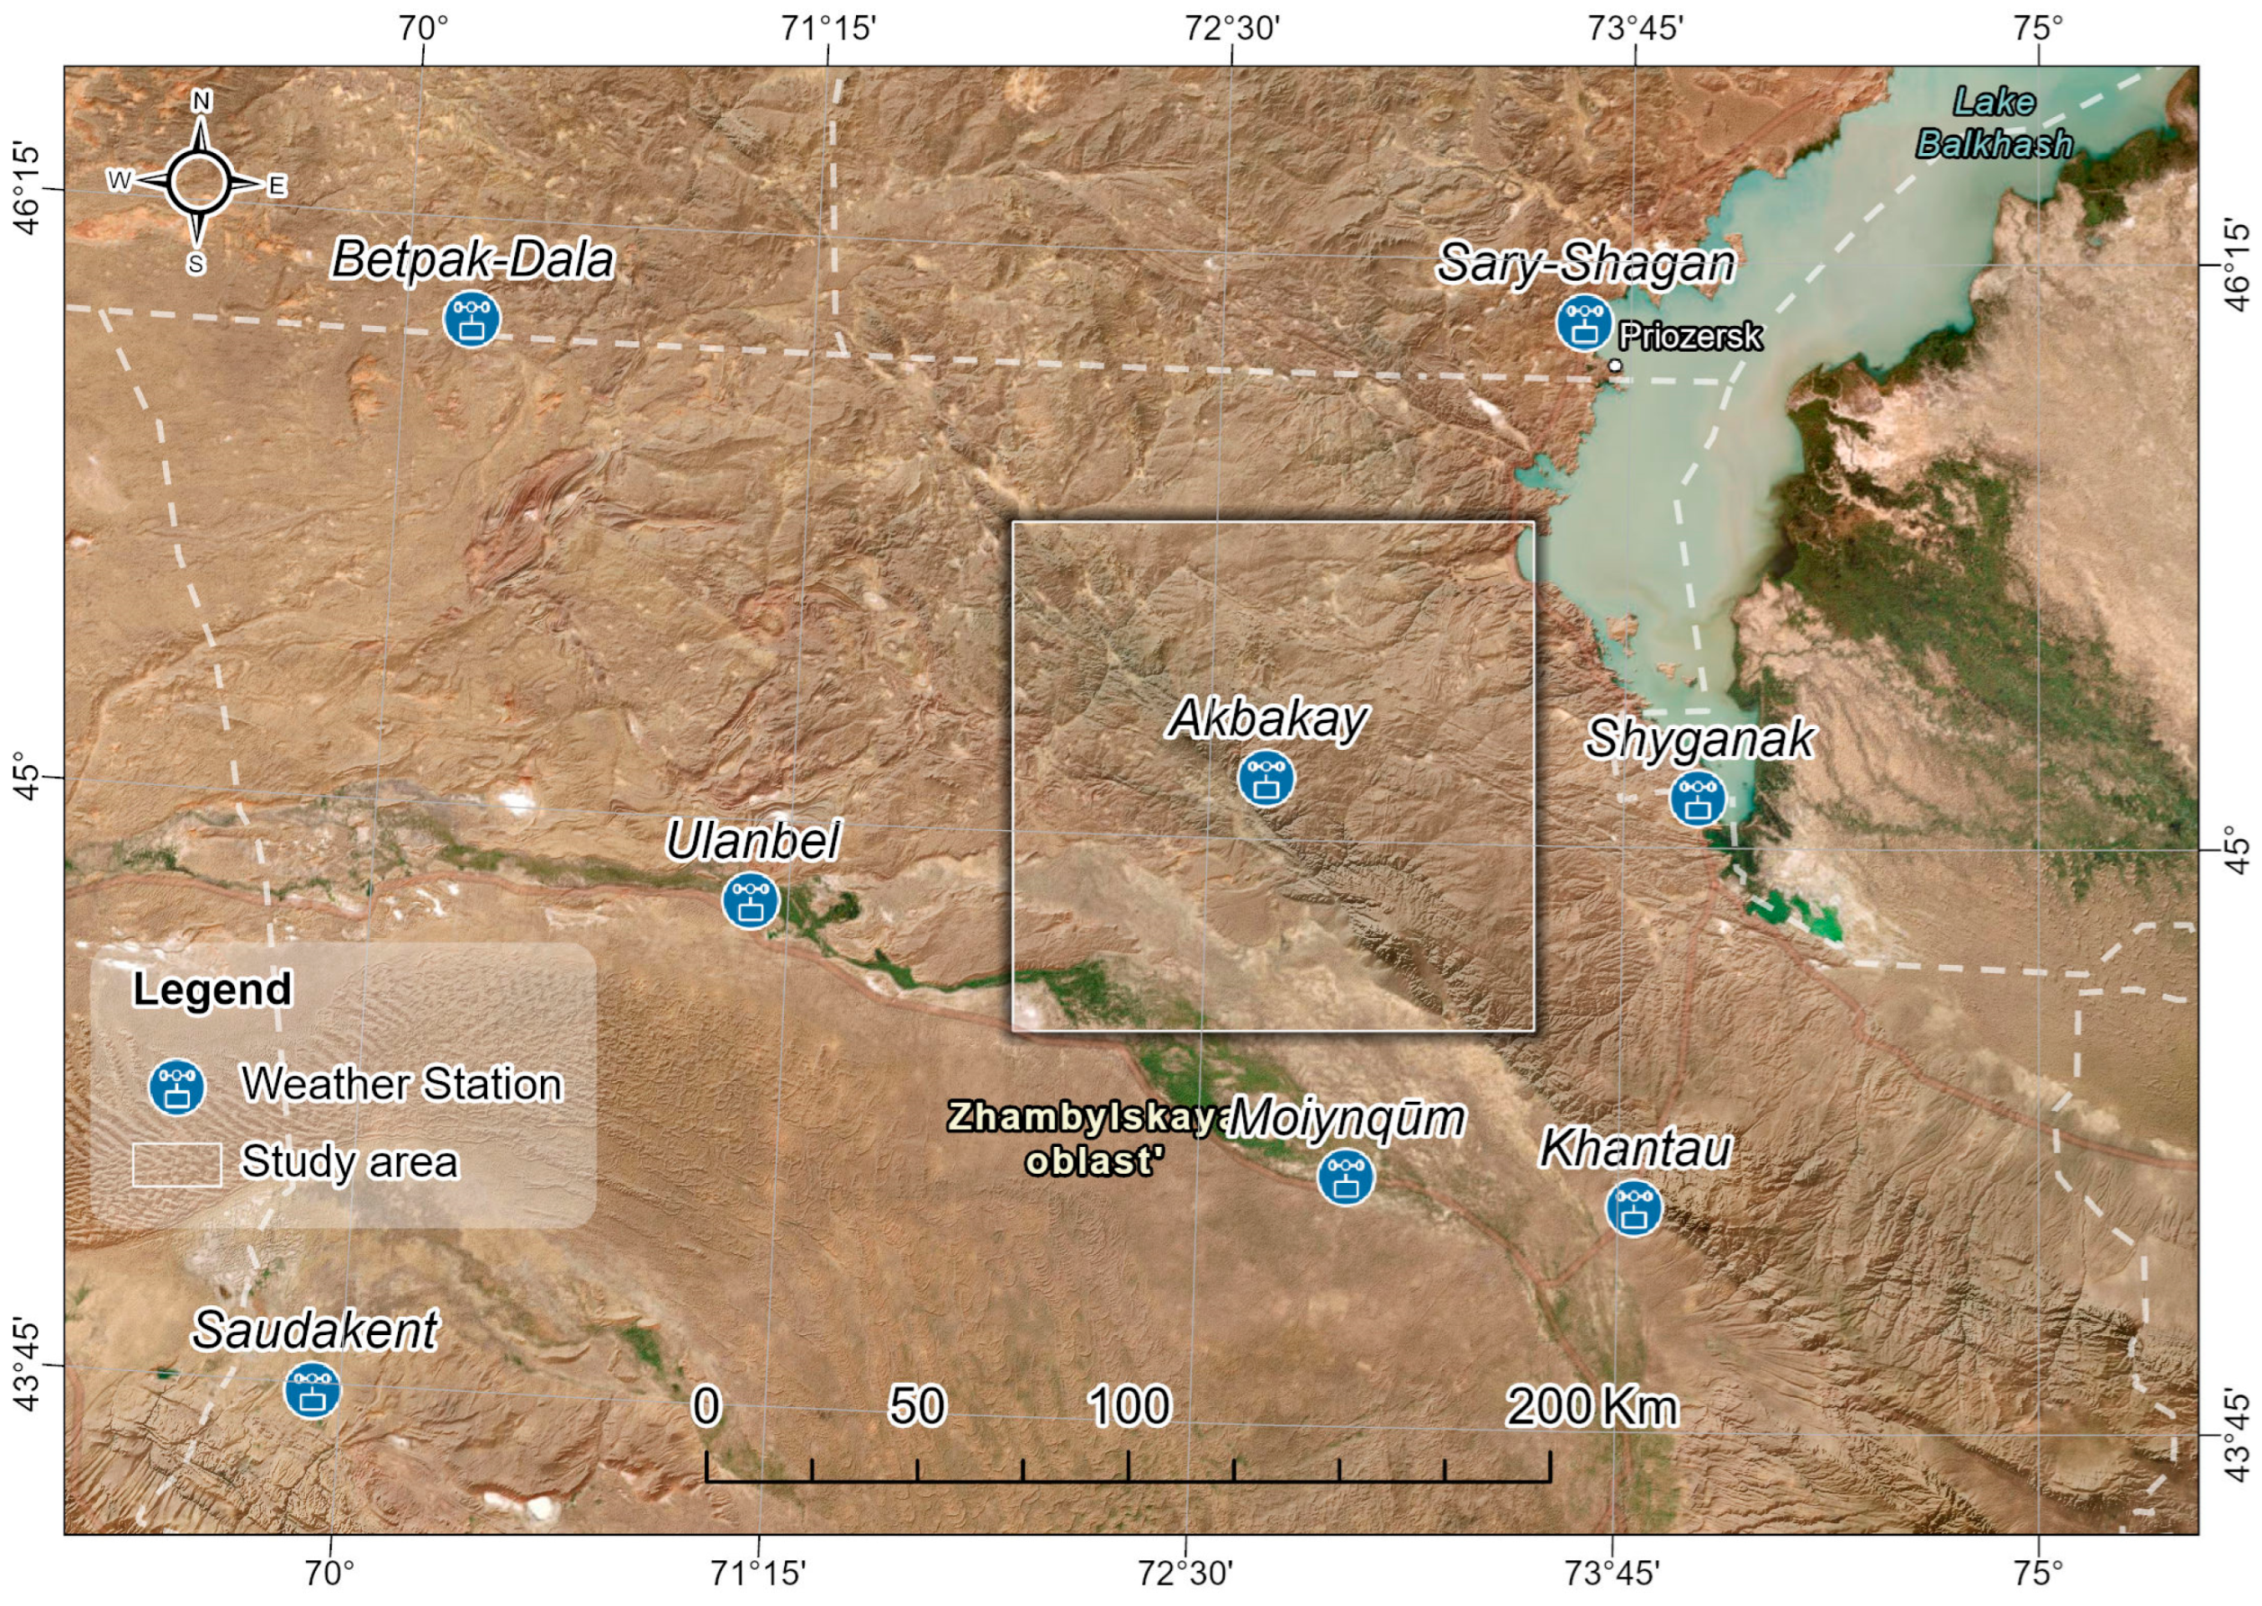
Precipitation Map. The study area is located within arid and semi-arid climatic zones, where precipitation serves as the primary source of natural groundwater recharge. In such regions, where evapotranspiration typically exceeds rainfall, even minor variations in precipitation can significantly influence groundwater availability. Therefore, a spatially detailed assessment of long-term precipitation patterns is essential for understanding recharge dynamics and informing groundwater management strategies. To develop a reliable spatial precipitation model, long-term average annual precipitation data (in mm/year) for the period 1936–2023 were obtained from the historical archives of the Weather and Climate reference portal [31]. These data are based on instrumental records from meteorological stations located in the vicinity of the Akbakay well field (see Figure 13), ensuring the representativeness of the input values relative to the hydrogeological setting.
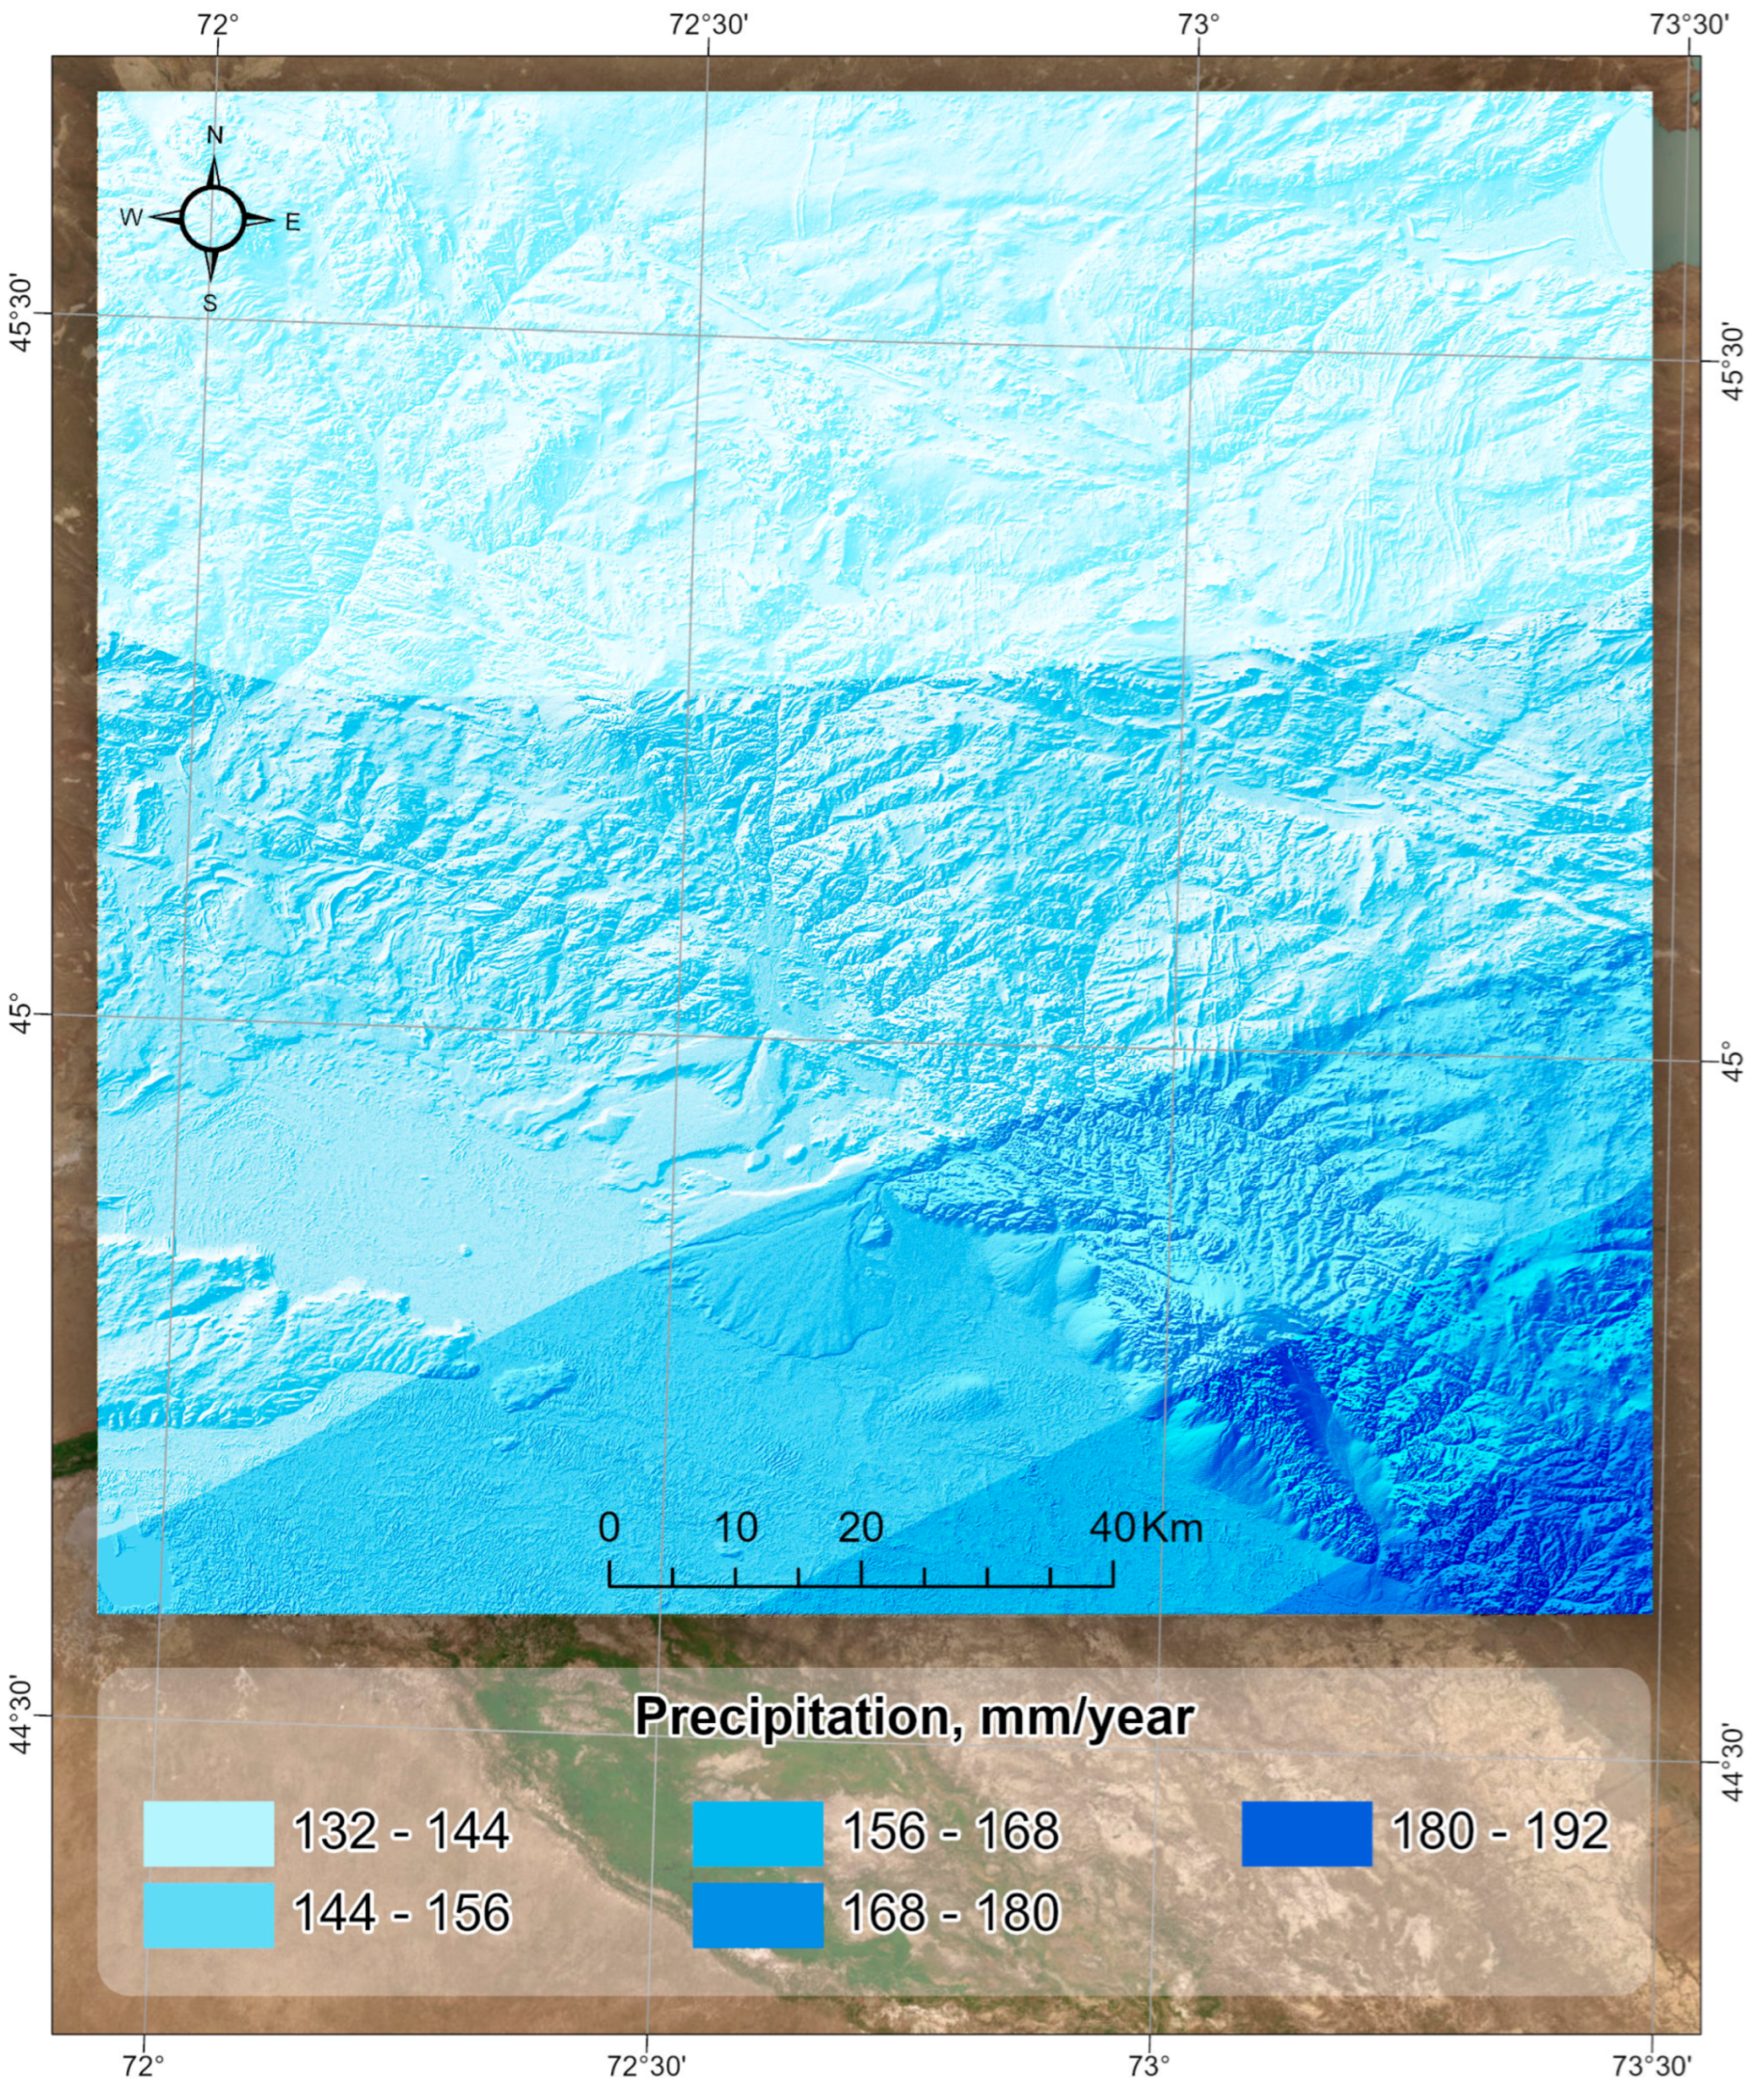
Based on these observations, a precipitation map was generated using ArcGIS 10.4 (ESRI, California, USA). The resulting surface (Figure 14) presents the spatial distribution of mean annual precipitation across the study area. Precipitation values were classified into six intervals for interpretability:
-
132–144 mm/year (very low);
-
144–156 mm/year (low);
-
156–168 mm/year (moderate);
-
168–180 mm/year (moderately high);
-
180–192 mm/year (relatively high for the region).
The map reveals a general south-to-north gradient, with relatively higher precipitation observed in the southeastern portion of the area, likely influenced by local topography and orographic factors.
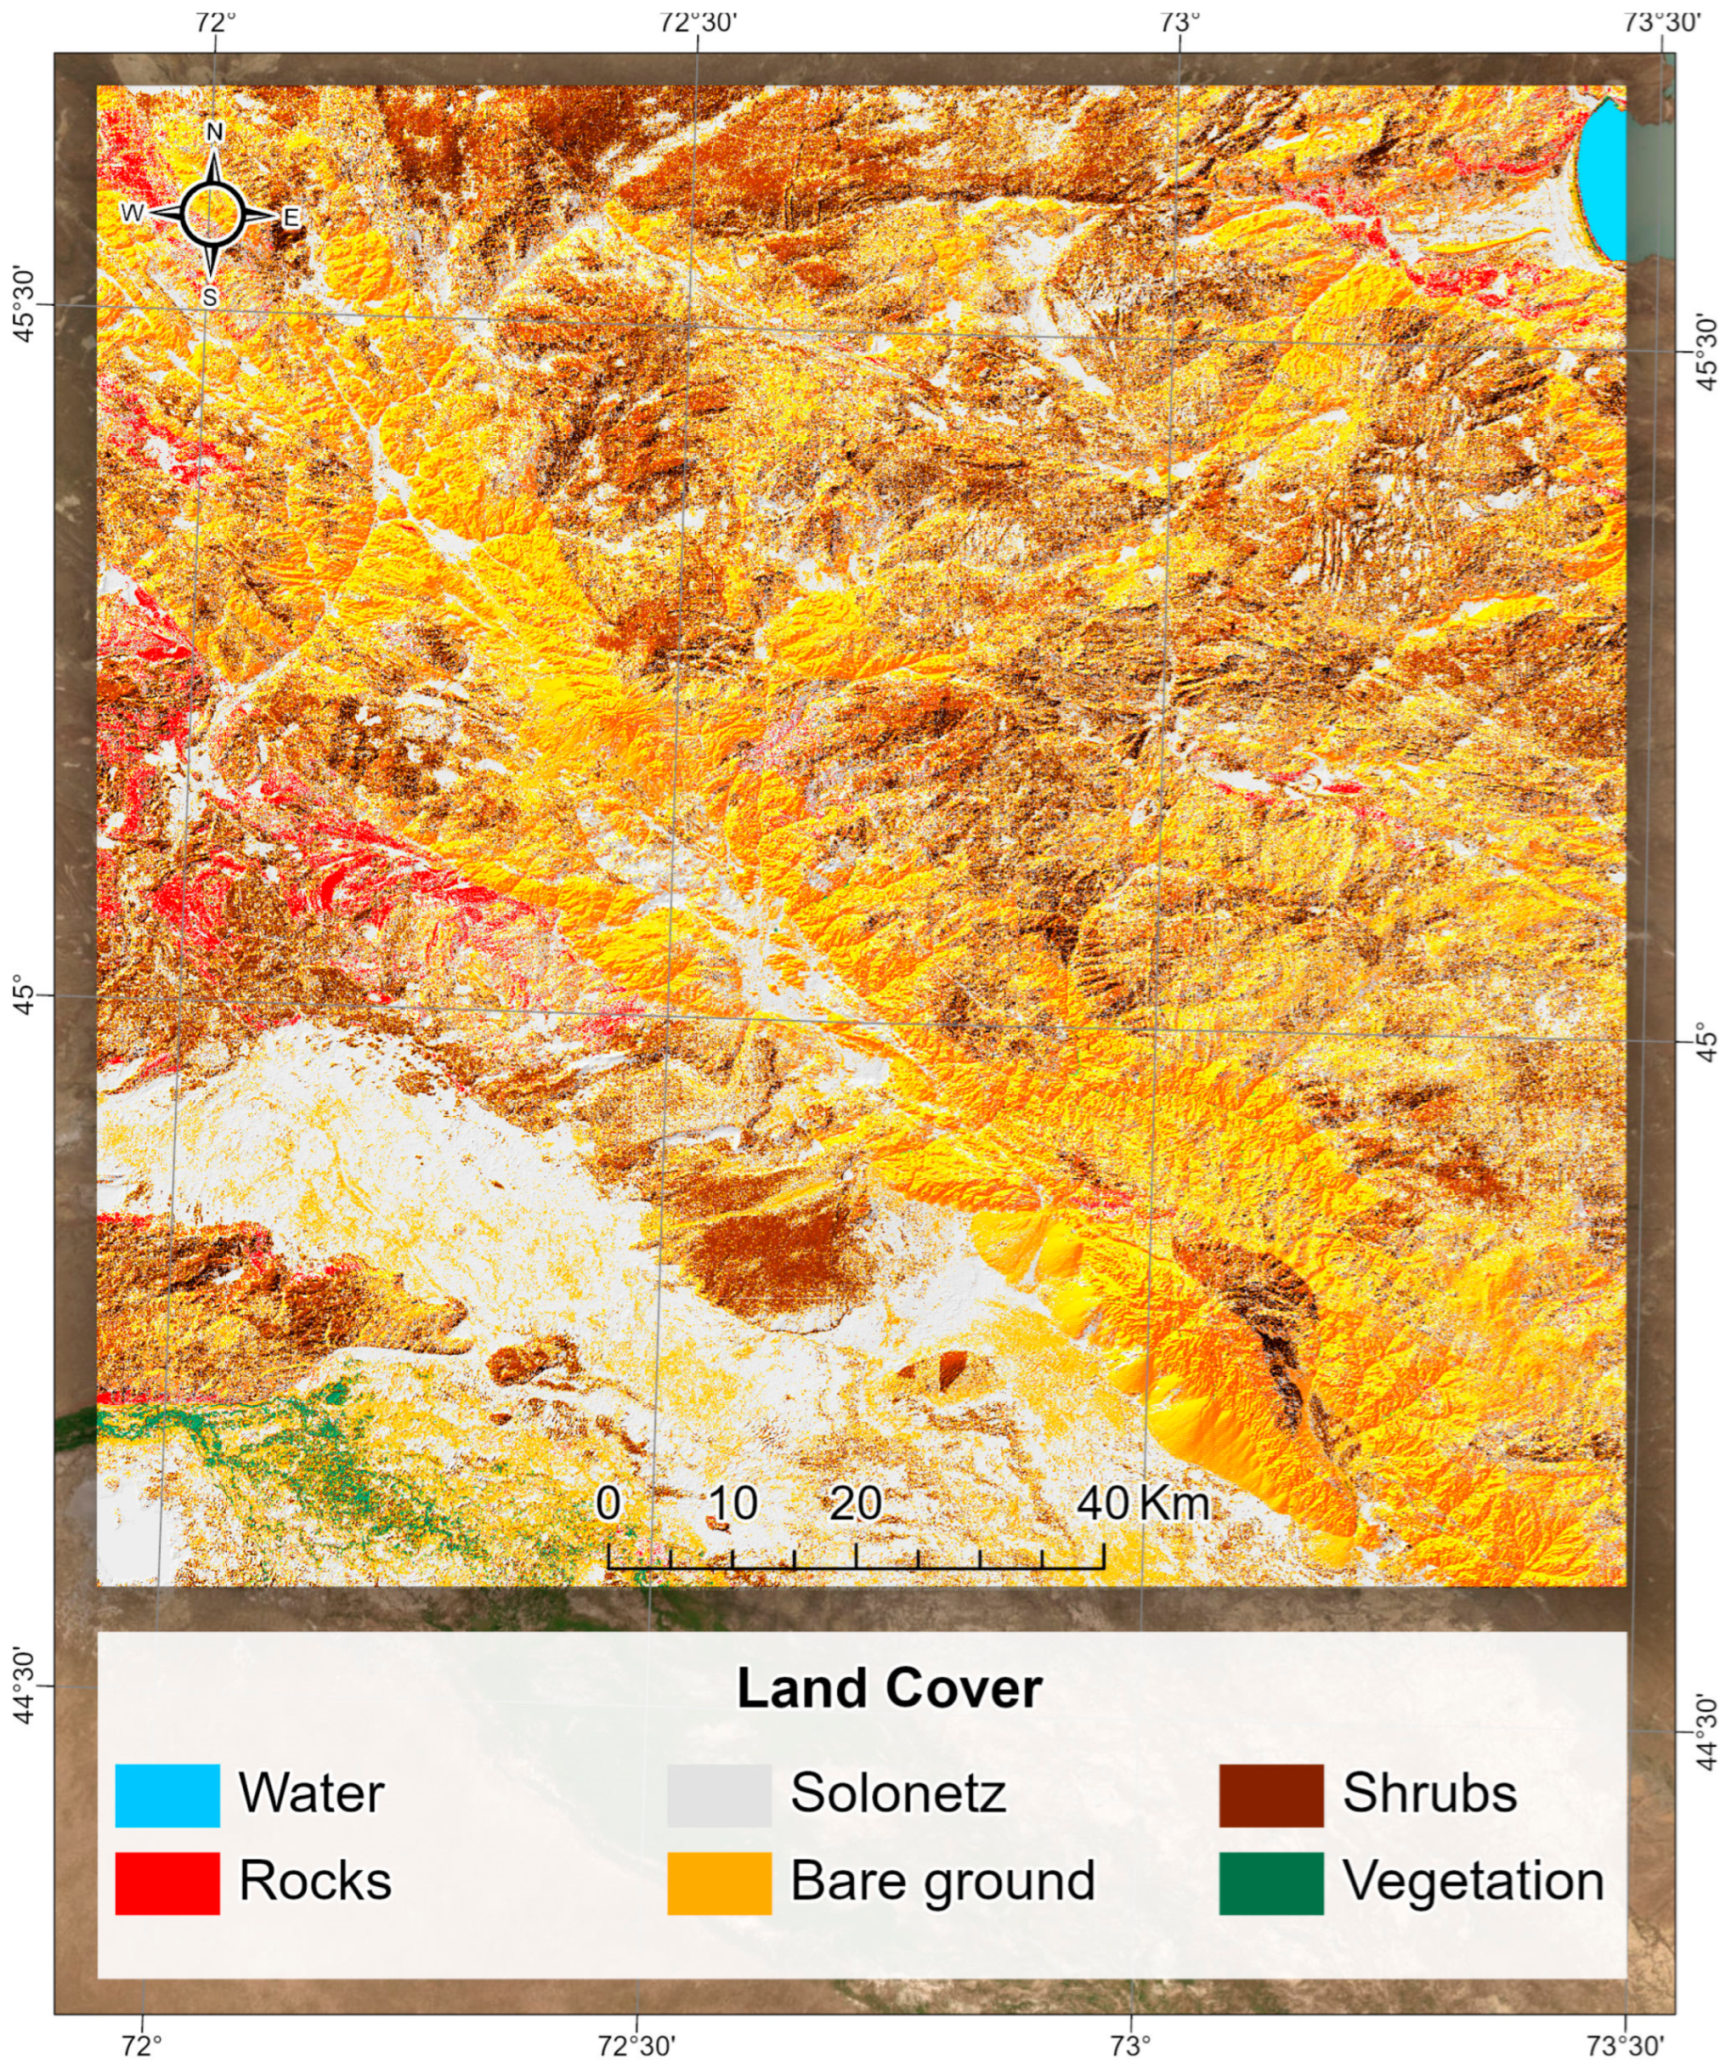
Land Cover Map (LandUse/LandCover). The land cover was assessed to evaluate the suitability of various zones for prospective groundwater exploration. Land cover data provide valuable insight into several processes within the study area, including zones of maximum or minimum evaporation, salinization, vegetation condition, runoff, and groundwater recharge potential. The analysis was based on data from the Sentinel-2 satellite mission of the European Space Agency, designed for monitoring land use, vegetation, forest resources, and water bodies (Sentinel-2 Data). The initial stage involved a visual assessment of a mosaic compiled from four satellite images covering the entire study area. The combination of Sentinel-2 L2A bands—full-colour range (True Colour B4/B3/B2) and colour infrared range (False Colour B8/B4/B3)—provided a general overview of land cover characteristics across the region.
Subsequently, pixel groups within the multi-band remote sensing imagery were classified into specific land cover classes using raster image classification techniques. The classification process was performed in the ArcGIS environment, employing the Image Classification Wizard. To maintain consistency with other thematic maps, for the land use/land cover (LULC) analysis, cloud-free Sentinel-2 L2A satellite images with a spatial resolution of 10 × 10 m were selected. A mosaic was created from four scenes with the following tile identification numbers: T42TYR; T43TCL; T42TYQ; T43TCK. The acquisition date of the images was 14 August 2022. The resulting land cover map is presented in Figure 15.

3.2. Geoinformation Model

To evaluate the study area and delineate potential groundwater storage zones, we integrated historical records, remote sensing outputs, and cartographic data into a geoinformation model composed of multi-layered raster and vector datasets.
The core layers of the model include cartographic data, thematic remote sensing outputs, and the DEM. Data layering (combining) and subsequent analysis were carried out in a 3D environment using ArcGIS Pro and the ArcScene application. All spatial datasets with differing coordinate systems were reprojected and displayed in the WGS84 / UTM Zone 43N coordinate system with a spatial resolution of 30 × 30 m.
Each spatial object within the model is linked to a record in the database containing a set of attribute information. GIS stores data as a collection of thematic layers that are combined based on their geographical location to provide the capability to identify and query datasets. Spatial analysis was performed through the overlay and combination of different data layers, allowing for the comparison of objects based on their spatial relationships. The geoinformation model served as the foundation for subsequent mathematical modelling of the hydrogeological conditions of the study area.

3.3. Potential Groundwater Storage Zones

Following the assignment of weights using the AHP, and to ensure standardisation across all raster layers, rating values (ranks) from 1 to 5 were allocated to each class of input data, corresponding to very low, low, moderate, high, and very high, respectively. These assigned ranks reflect the prospects of zones for groundwater storage and the feasibility of conducting prospecting and assessment activities. The weighting coefficients for each thematic map layer, along with the ranking of individual classes, are presented in Table 4. Once the weights were assigned in ArcGIS, the Groundwater Potential Index (GWPI) was calculated using:
GWPI = ((Ltw)(Ltwi) + (Ldw)(Ldwi) + (Ddw)(Ddwi) + (Slw)(Slwi) + (Ddstw)(Ddstwi) + (Prw)(Prwi) + (LULCw)(LULCwi))
where Lt—lithology; Ld—lineament density; Dd—erosion network density; Sl—day surface slopes; Ddst—distance from erosion network; Pr—precipitation; LULC—land cover; w—importance of thematic maps; wi—importance of classes.
Equation (3) is formulated on the basis of the Weighted Linear Combination (WLC) technique, which constitutes the theoretical foundation of the Weighted Overlay procedure implemented in ArcGIS. Within this framework, each thematic layer is assigned a weight (w) that reflects its relative contribution to groundwater potential, while the individual classes of each layer are attributed standardized ranks (wi) to capture intra-layer variability. The Groundwater Potential Index (GWPI) is then obtained by aggregating the weighted contributions of all thematic layers, expressed as the summation of the products of layer weights and class ranks. The linear additive model has been extensively applied in the context of groundwater potential assessment and multi-criteria decision analysis, ensuring methodological consistency and comparability across diverse study contexts [32].
The map of potential groundwater storage zones was generated using classification of groundwater potential zones and their spatial distribution across the study area summarised in Table 5. The Weighted Overlay tool combines multiple raster layers using a unified measurement scale, applying weightings to each layer based on its assigned importance.
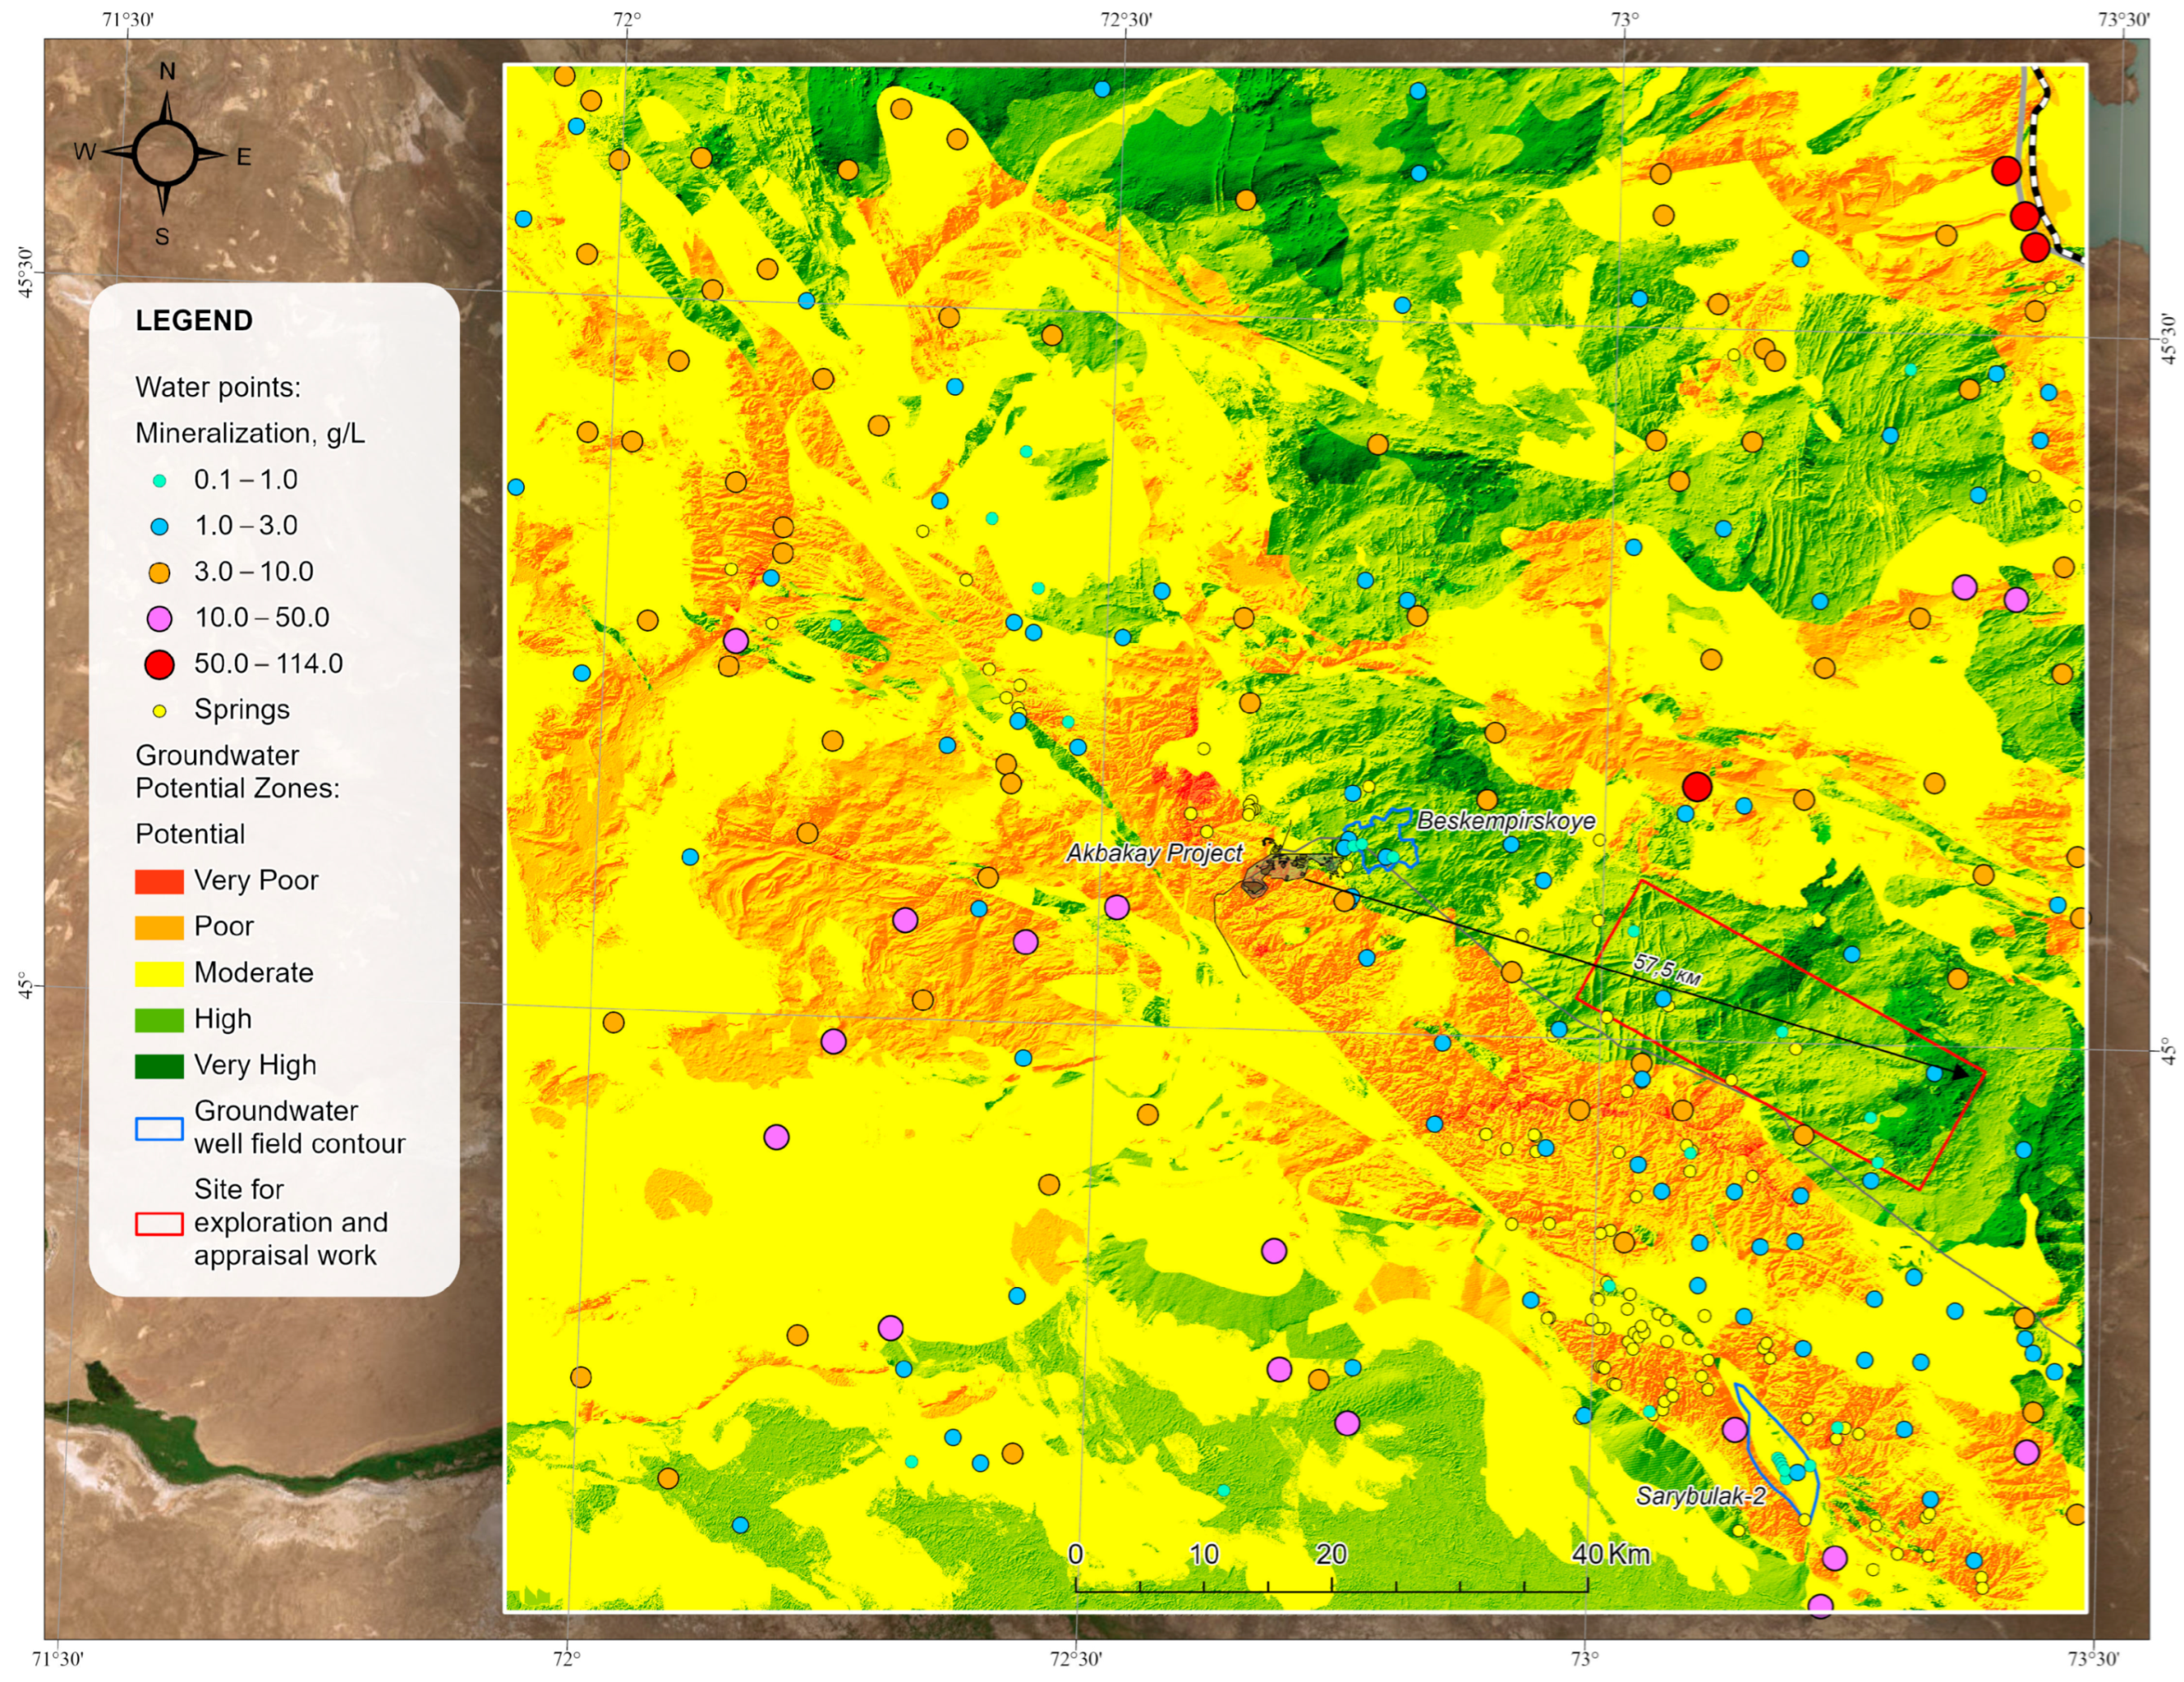
In the Weighted Overlay analysis, input rasters were reclassified to a 1–3 scale and weighted by influence percentages. Cell values were multiplied by their weights, summed, and rounded to produce the output raster. This geoinformation modelling identified zones most favorable for groundwater accumulation. Model validation was performed by superimposing 201 groundwater sampling points from different periods onto the potential groundwater map, confirming correspondence between predicted recharge potential and observed water quality (Figure 16).
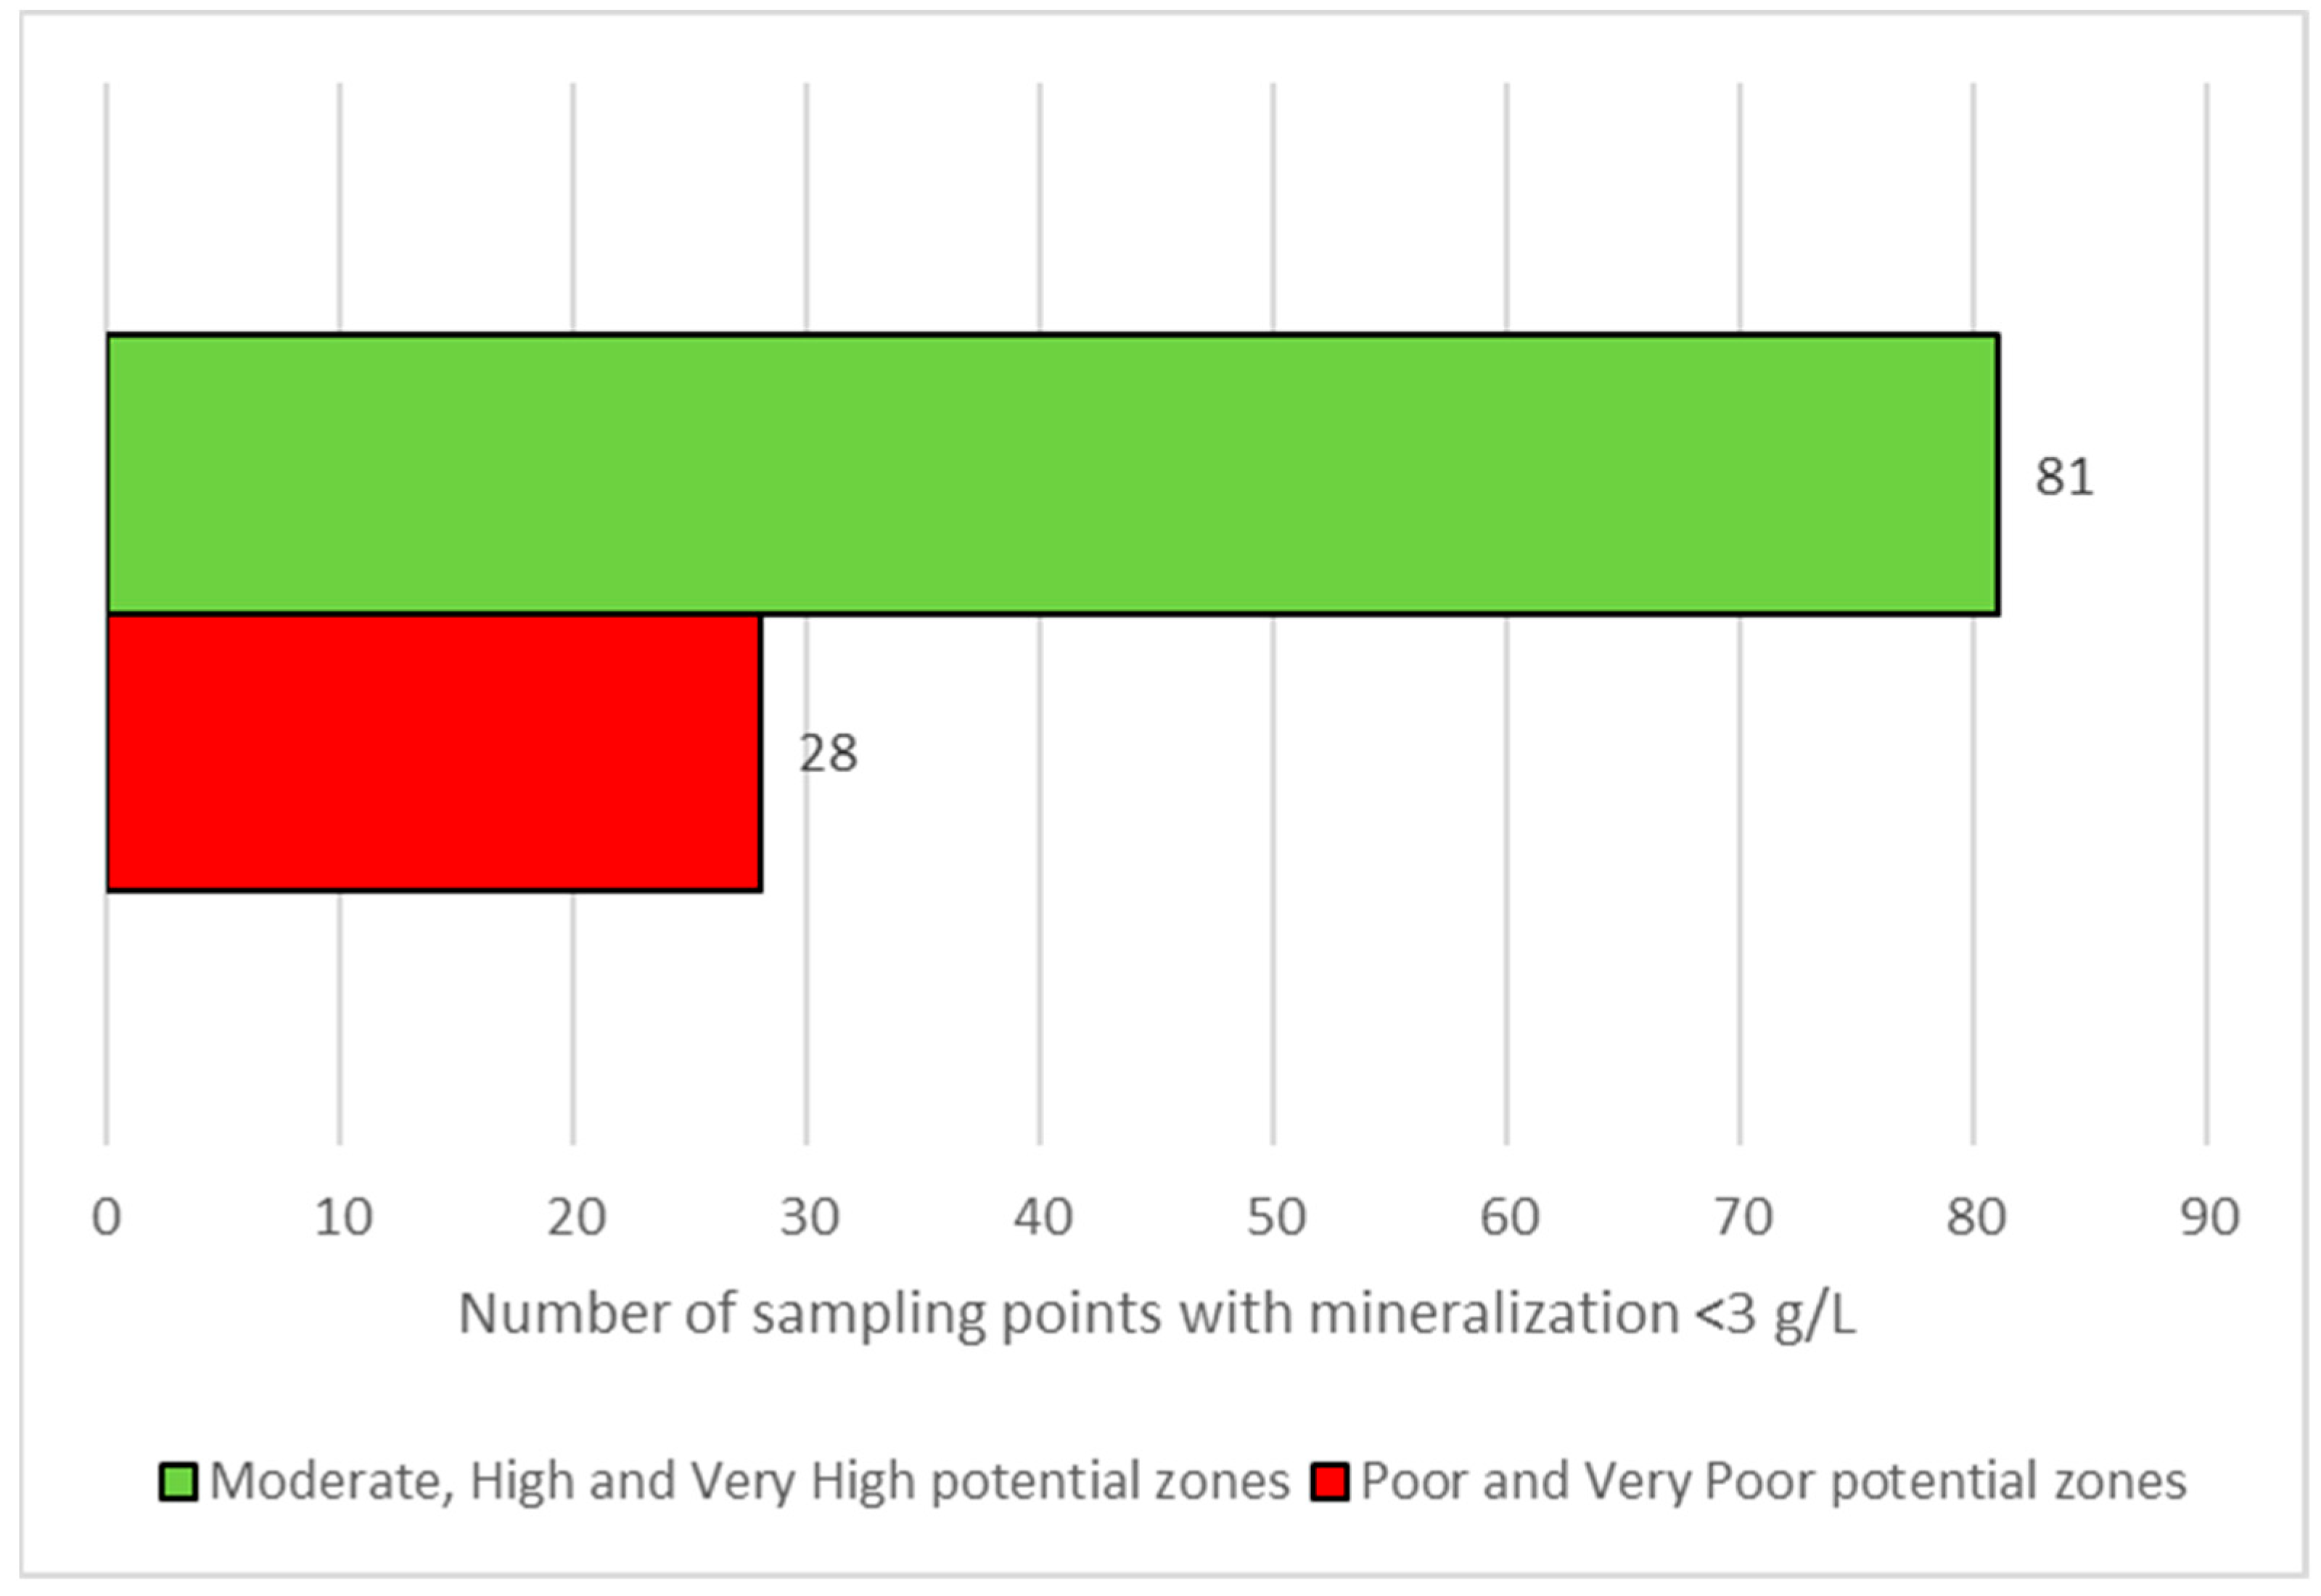
Statistical analysis of the 201 groundwater observation points classified by water salinity (mineralization g/L, 0–1; 1–3; 3–10; 10–50; 50–114) and aquifer recharge potential (very poor; poor; moderate; high; very high) reveals a strong spatial relationship between groundwater quality and recharge conditions. Specifically, 83.3% of freshwater wells (15 out of 18) and 76.0% of brackish wells (79 out of 104) are situated within zones of moderate to very high recharge potential. In contrast, highly mineralized waters, including brines, are predominantly concentrated in zones with low recharge potential (very poor and poor), with 71% of brines occurring in these areas (Figure 17). This distribution pattern supports the hypothesis that zones with higher recharge potential serve as active accumulation areas for surface runoff and infiltration, contributing to the dilution (freshening) of groundwater. Conversely, the prevalence of saline and brine waters in low-potential zones suggests minimal recharge from precipitation, indicating stagnant or poorly renewed groundwater systems. These findings not only confirm the predictive value of recharge potential mapping for identifying freshwater-prone areas and distinguishing zones vulnerable to salinization, but also empirically validate the effectiveness of the AHP-based model derived from remote sensing data for delineating groundwater potential zones.
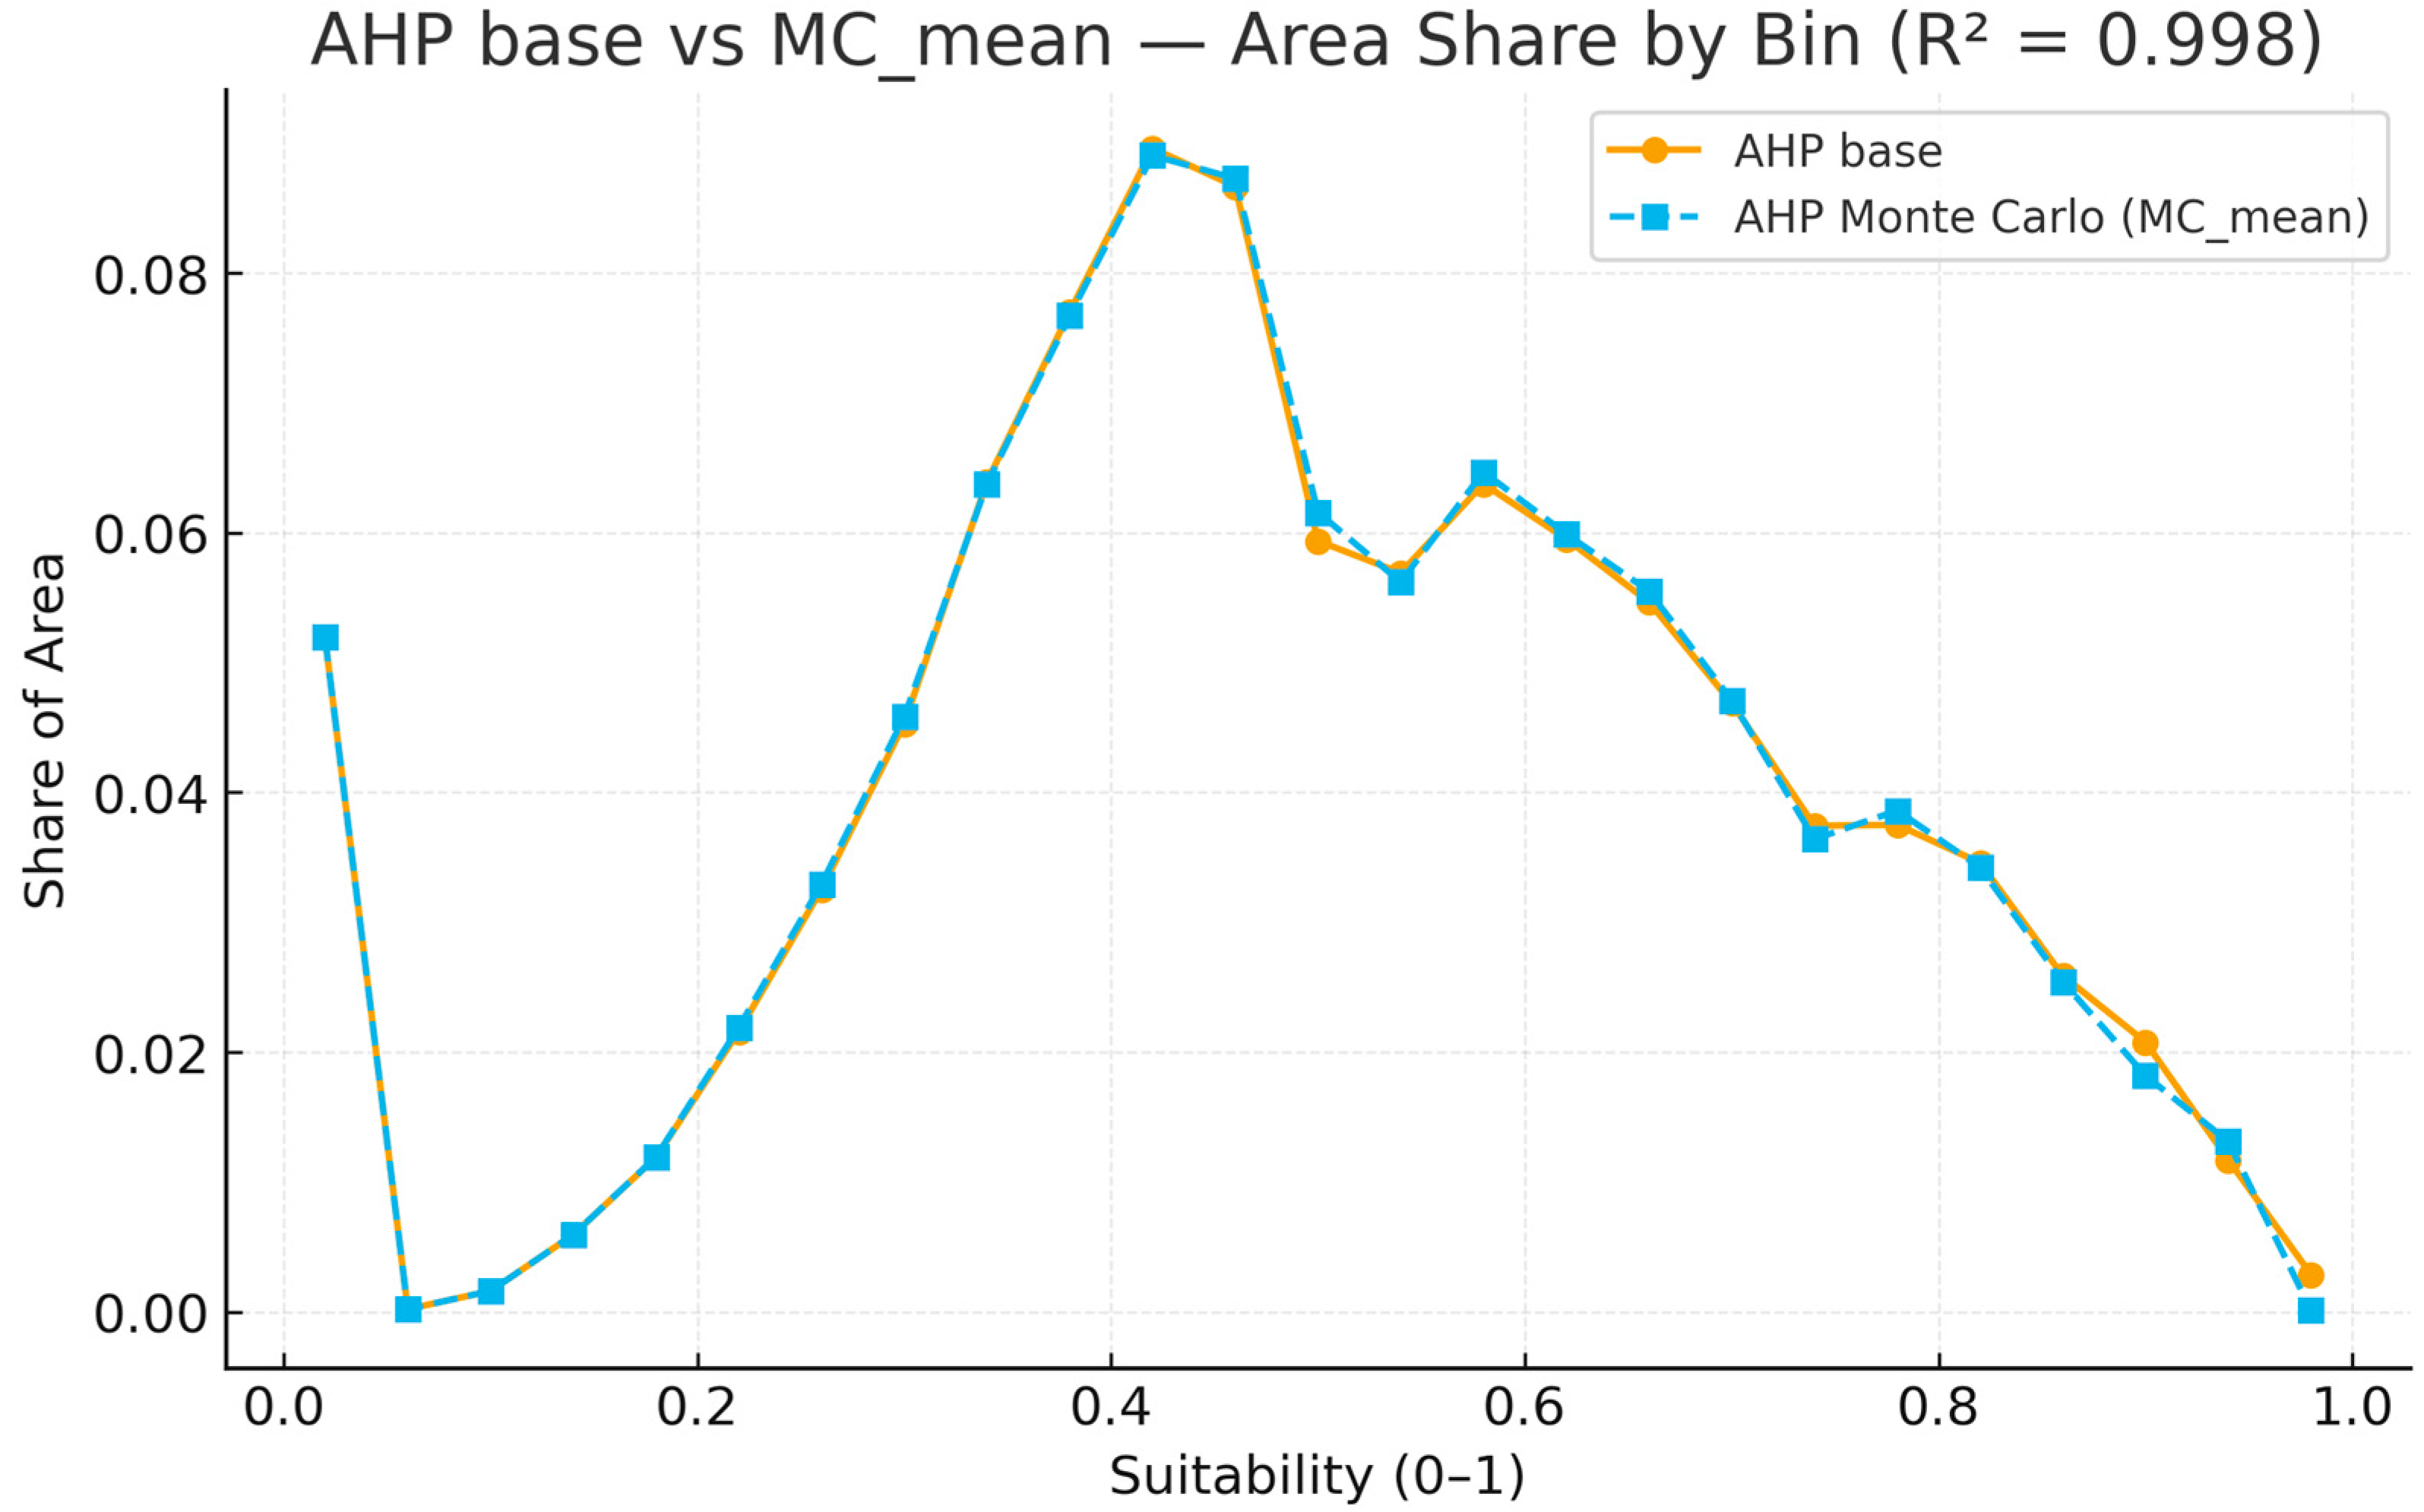
In addition to the conventional AHP approach (Figure 18a), extended methods were applied to address uncertainty and enhance the novelty of the study. Monte Carlo simulations with random perturbations of the AHP weights (±10%) were performed to generate the mean suitability map (Figure 18b), the probability of exceeding the high-suitability threshold of 0.70 (Figure 18c), and the standard deviation across simulations (Figure 18d). These outputs not only reproduce the traditional AHP results but also provide a quantitative assessment of model robustness. The high similarity between the baseline AHP map and MC_mean (Figure 19) confirms the reliability of the weighting scheme, while the probability and variability maps highlight core stable zones versus areas of high uncertainty.
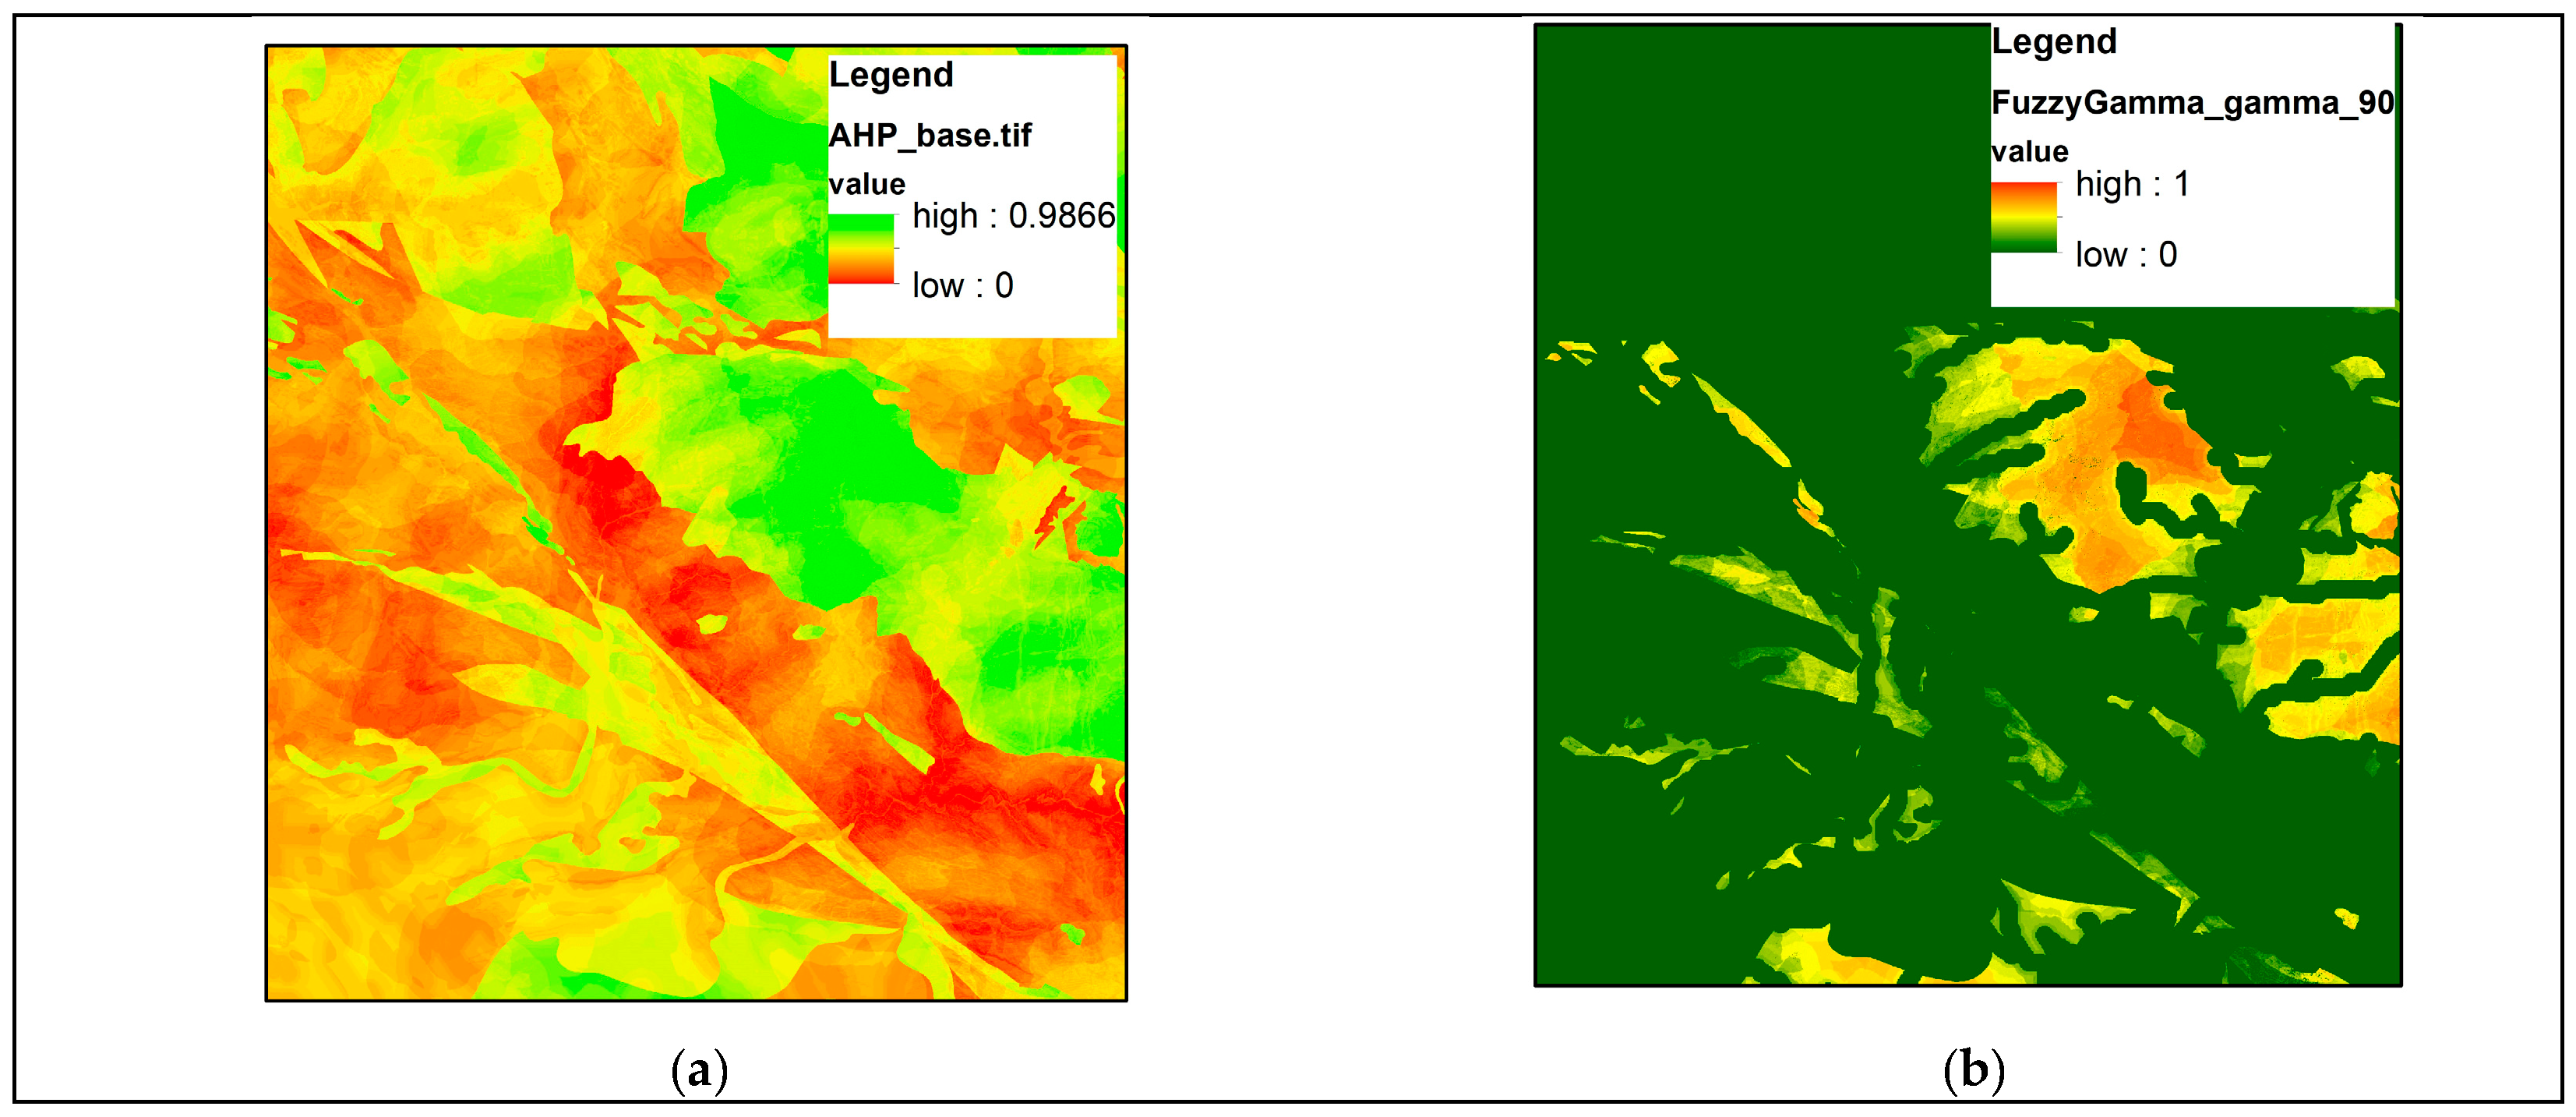
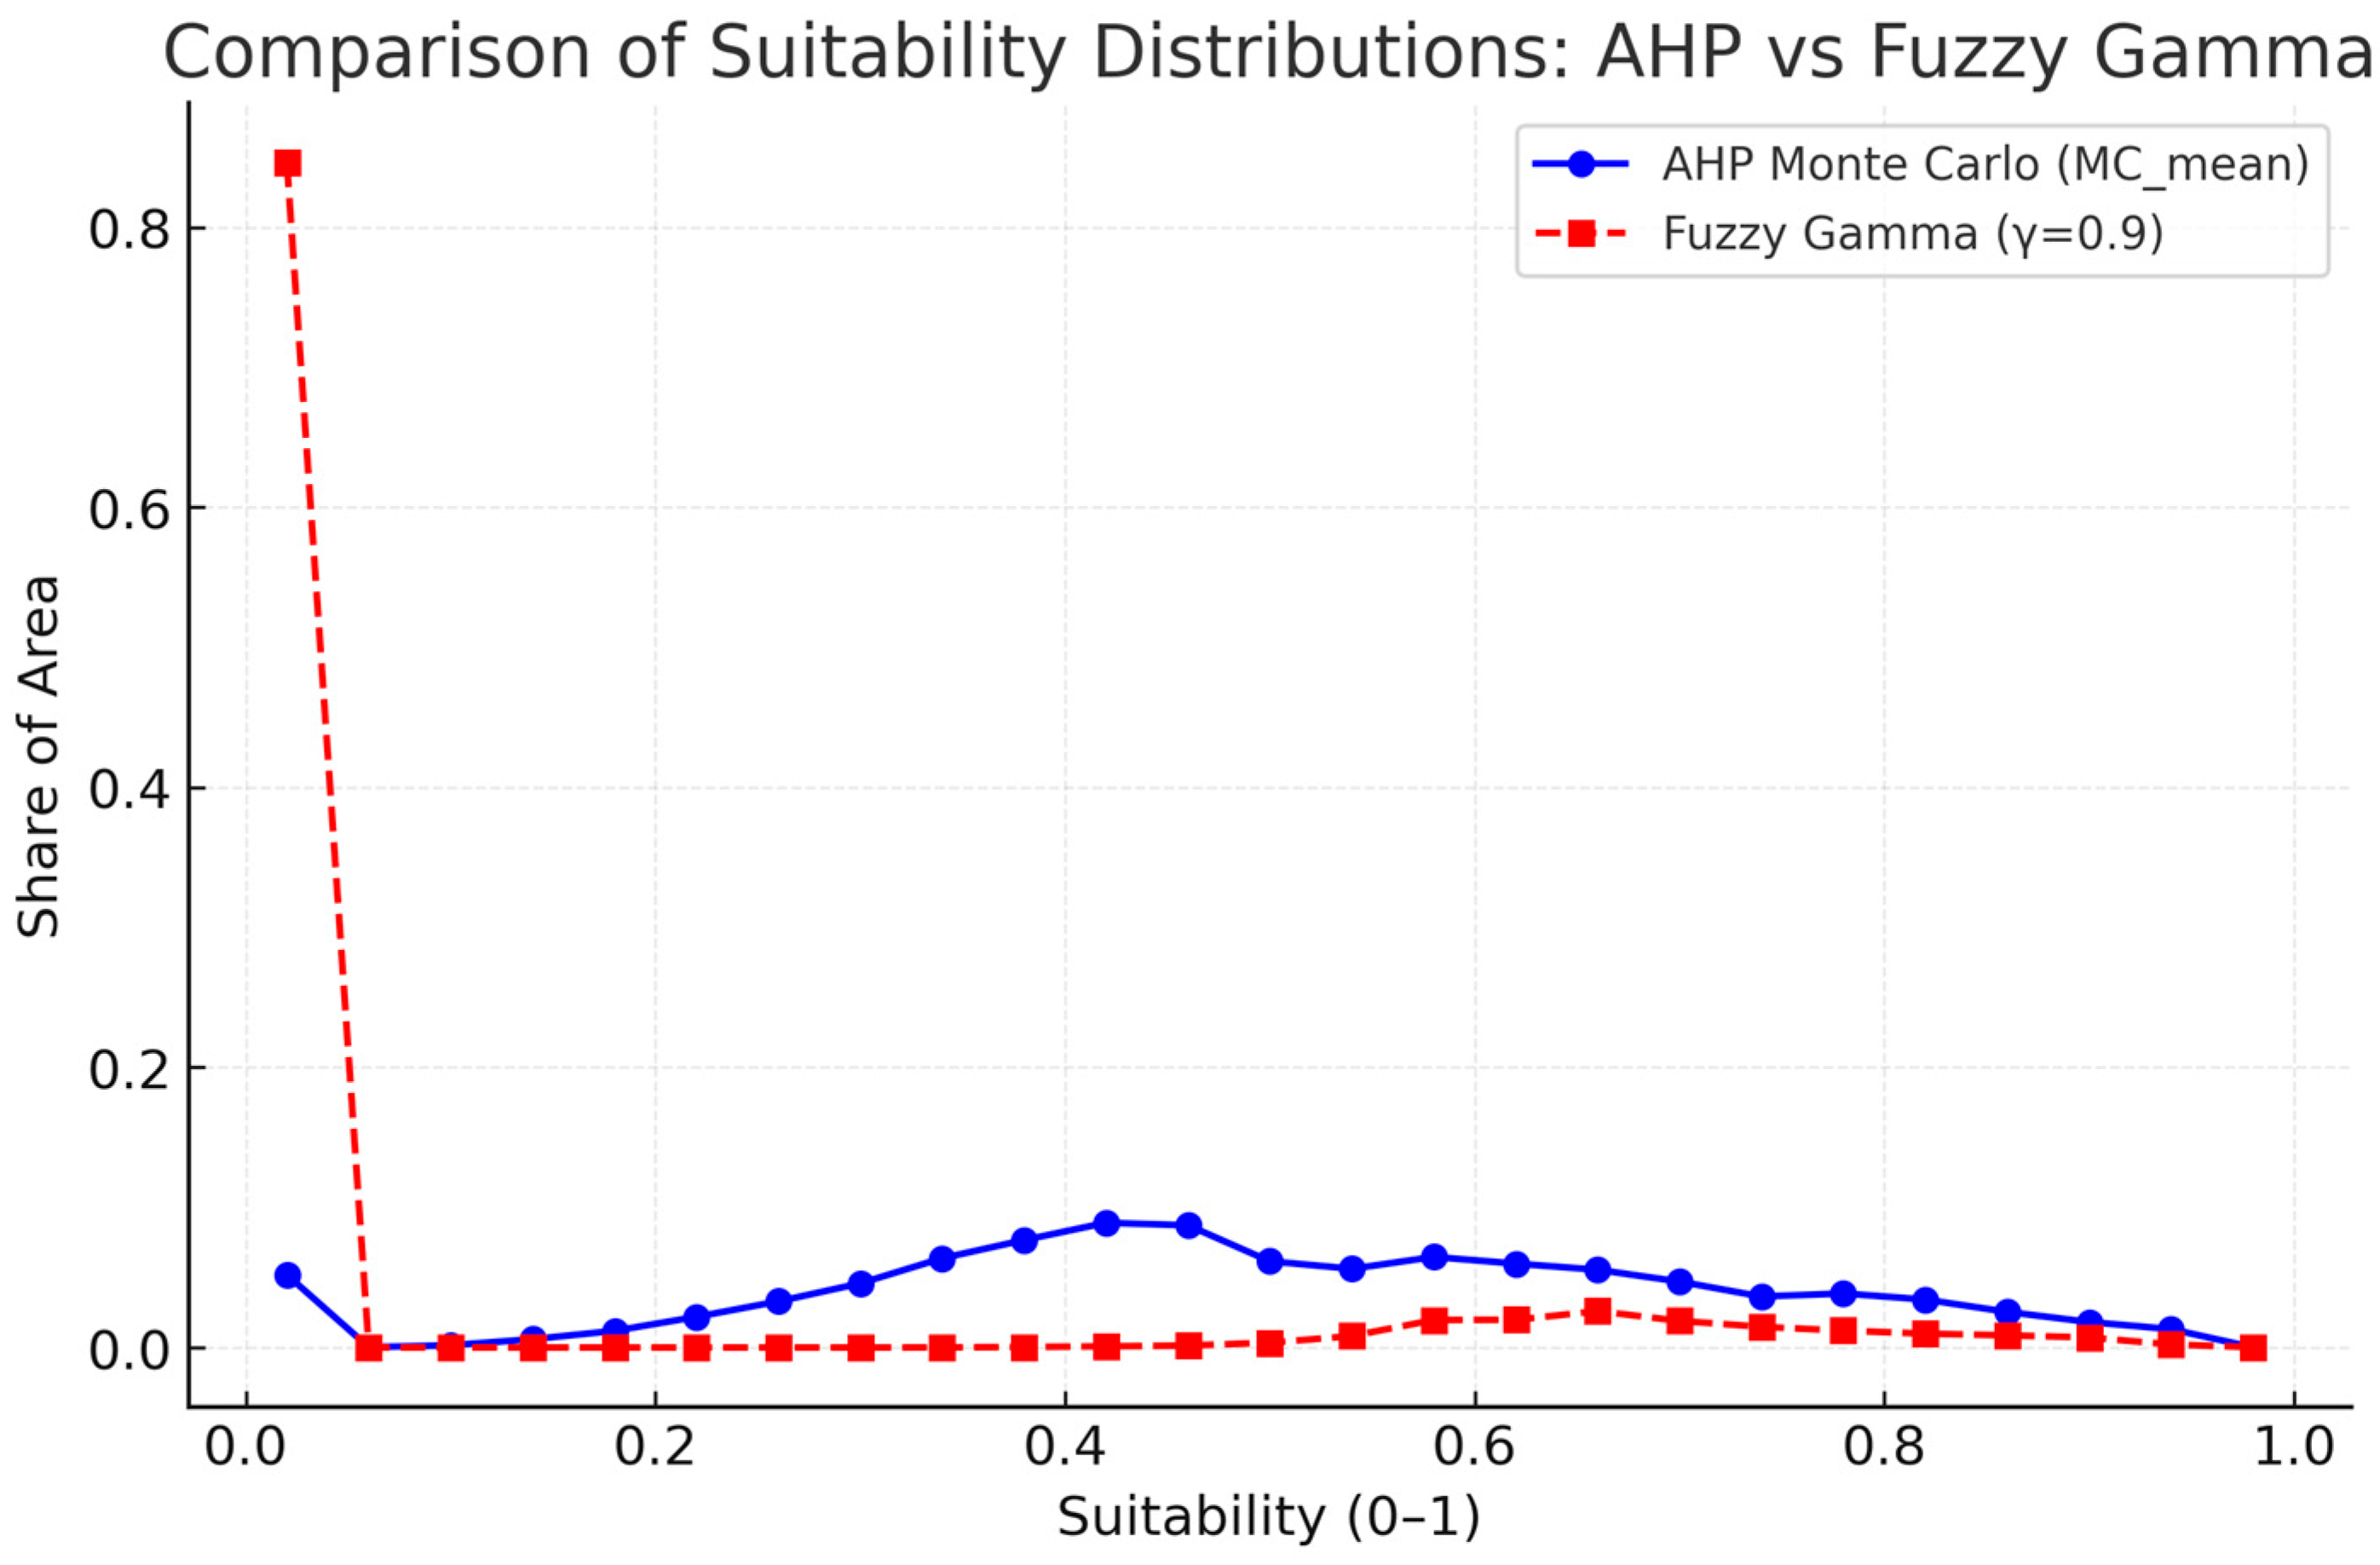
Furthermore, fuzzy aggregation was introduced using the Fuzzy Gamma operator (γ = 0.9). Comparison with the baseline AHP (Figure 20) demonstrates that Fuzzy Gamma amplifies the influence of favorable factors, leading to a greater share of territory falling into the high and very high suitability classes. This shift is further illustrated in the class area statistics (Figure 21), where the dominance of “high” and “very high” categories becomes evident, forming priority zones for the MAR (Figure 22).
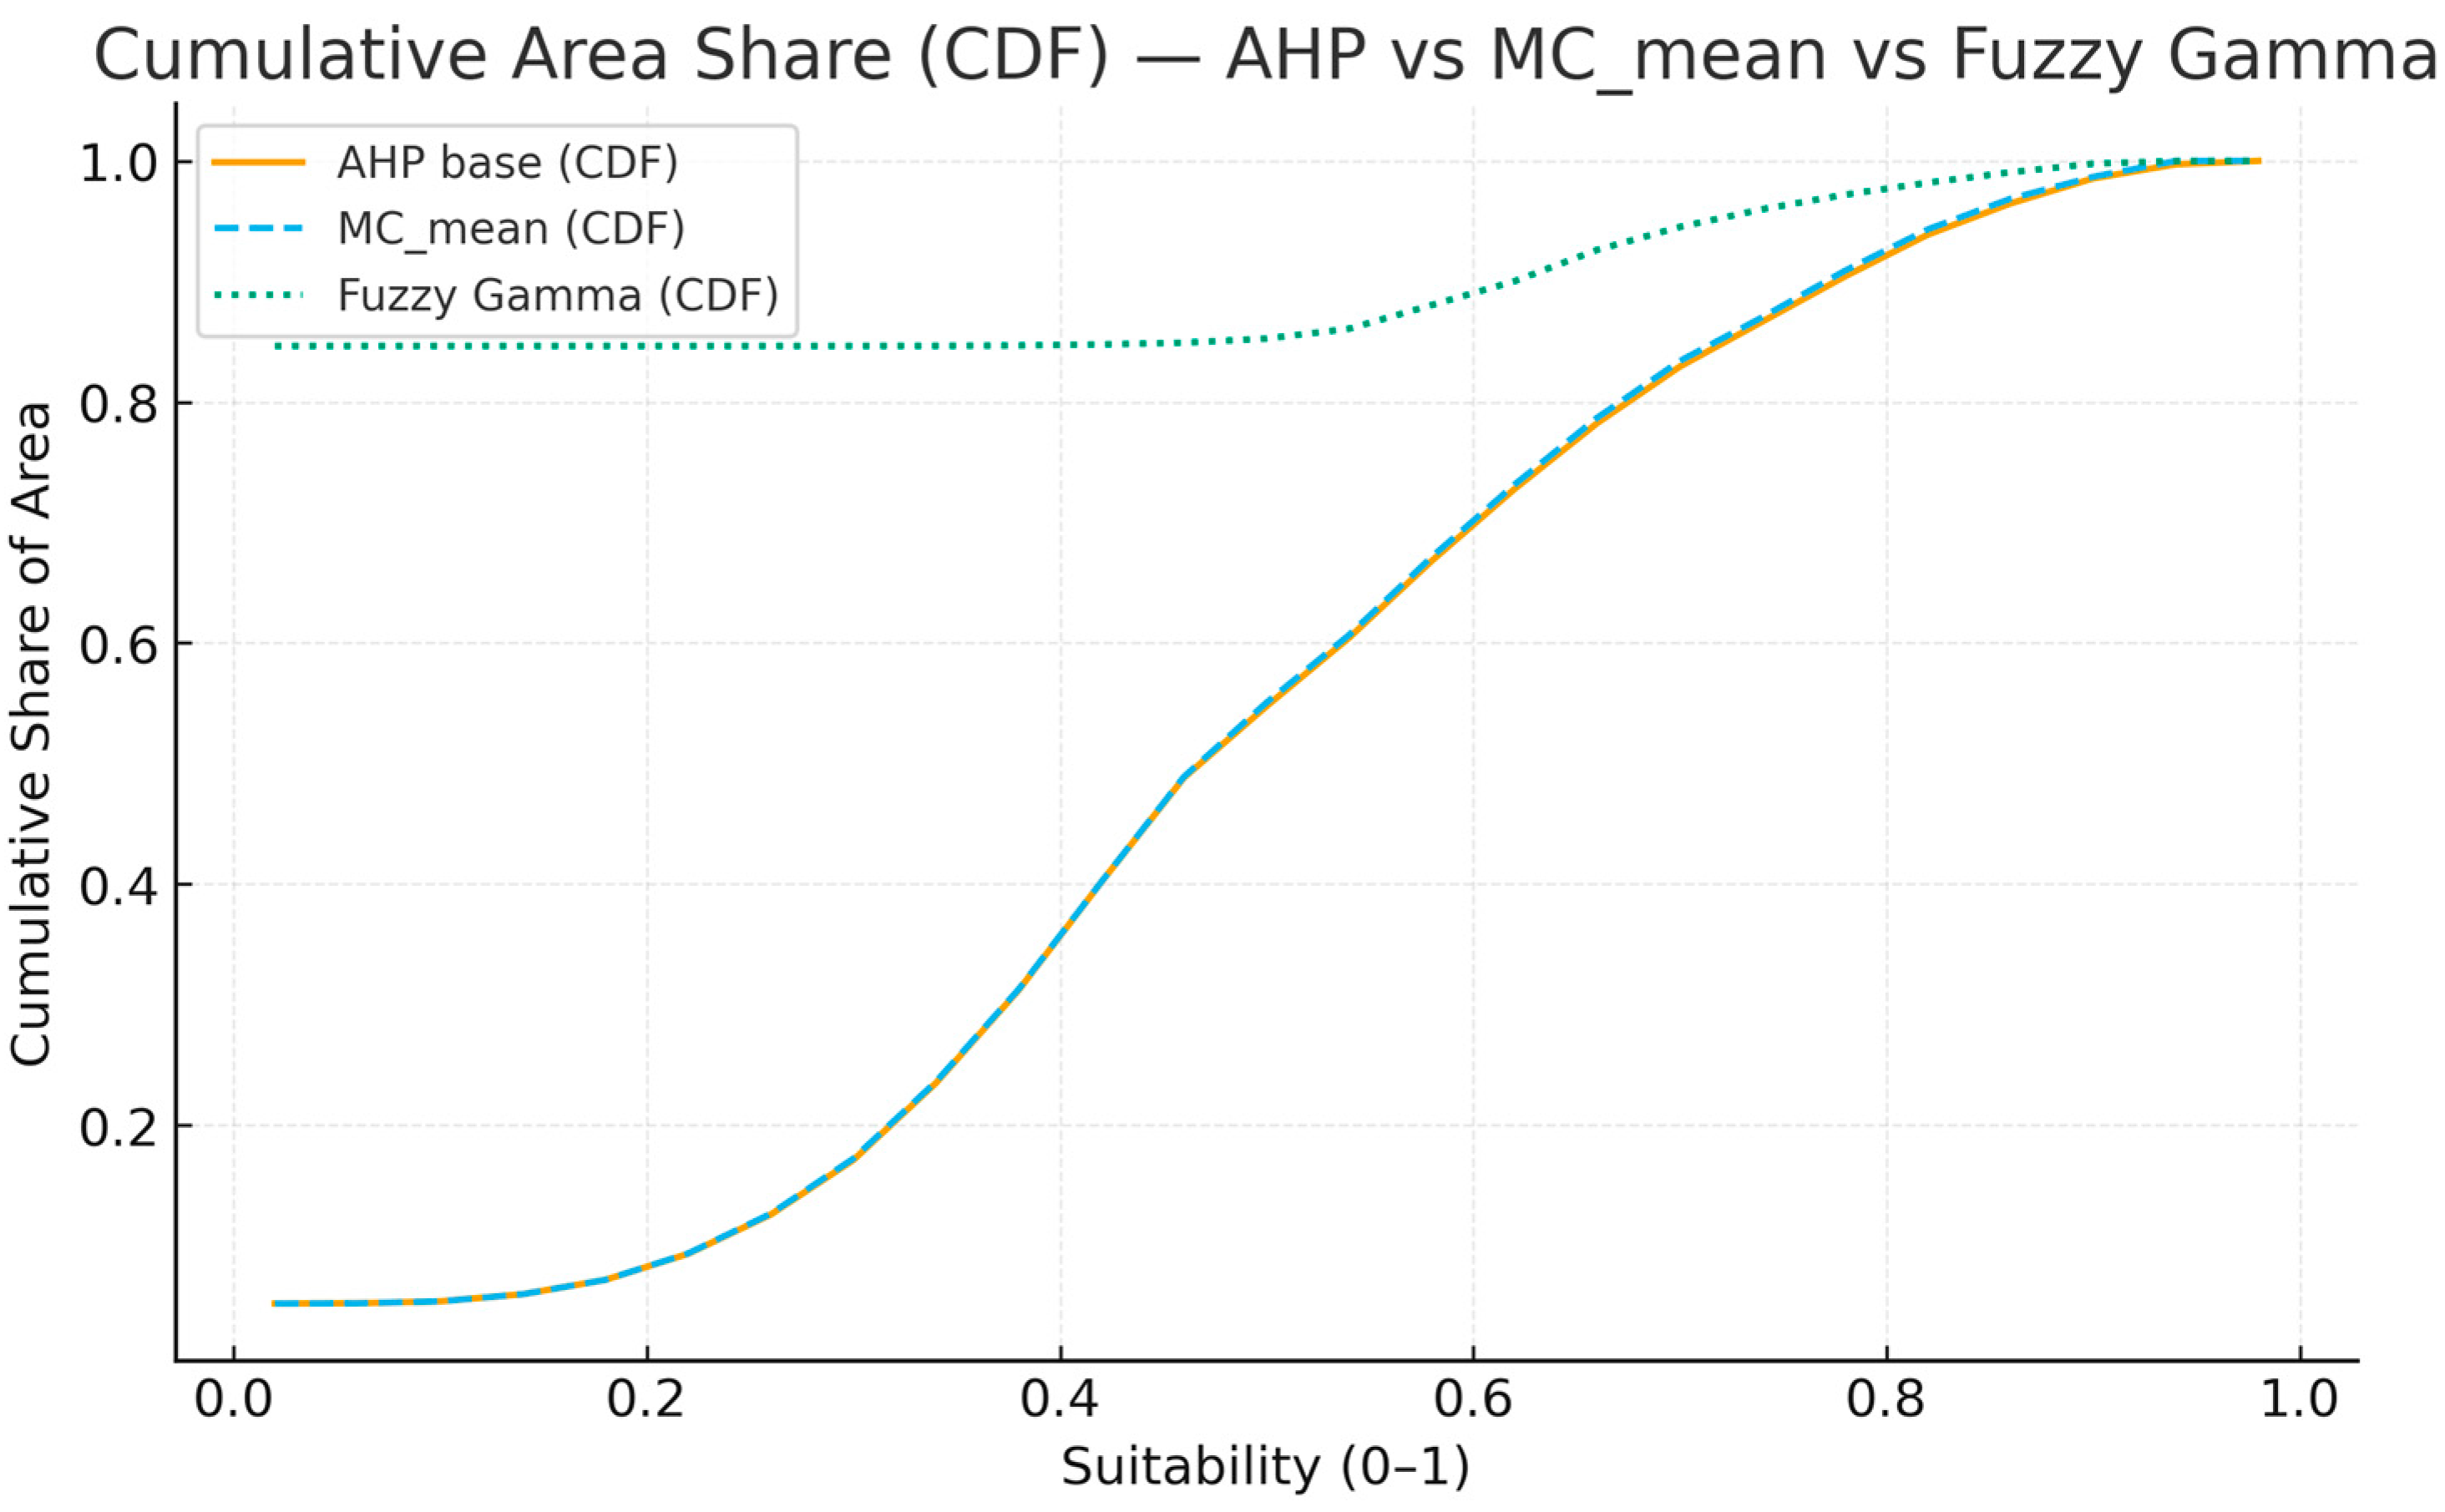
Finally, cumulative distribution functions (Figure 22) provide a concise view of the differences among the three approaches: while AHP and MC_mean indicate a balanced distribution, the Fuzzy Gamma curve is shifted toward higher suitability values, underscoring its role in prioritizing the most favorable areas. Overall, the integration of Monte Carlo analysis and fuzzy aggregation extends the conventional GIS–AHP framework by introducing probabilistic mapping, robustness evaluation, and fuzzy logic–based prioritization.

4. Discussion

This study demonstrates the potential of integrating remote sensing and GIS-based multi-criteria decision analysis (MCDA) to delineate groundwater potential zones in arid Central Asia, a region where systematic hydrogeological assessments remain limited. The developed geo-information model successfully identified favourable zones characterised by high lineament density, permeable lithologies, and low drainage density. These results are consistent with earlier applications of similar methods in Iran, India, and North Africa, where thematic integration proved to be effective for groundwater potential mapping [39,40]. The novelty of this study lies in adapting and extending these methods to the Central Asian context, where comprehensive groundwater assessments remain scarce despite acute water scarcity and climate variability.
A significant methodological contribution of this research is the integration of Monte Carlo simulations and the Fuzzy Gamma operator into the GIS–AHP framework. Monte Carlo simulations were utilised to provide a probabilistic assessment of weight variability, thereby confirming the robustness of the model while identifying zones of high uncertainty. Fuzzy Gamma was responsible for the reshaping of suitability distributions by means of amplification of favourable conditions, with the result that areas for managed aquifer recharge (MAR) were given priority. Collectively, these methodologies address the well-documented limitations of conventional AHP, namely the reliance on fixed expert-derived weights and the inability to capture uncertainty [22,23,24,25]. The benefits of probabilistic and fuzzy methods for groundwater modelling have been reported in recent studies [41,42,43].
Notwithstanding the contributions outlined above, this study is subject to several limitations. Firstly, the resolution of input datasets—particularly digital elevation models (DEMs), precipitation grids, and land cover classifications—limits the capacity to capture small-scale heterogeneities in hydrogeological conditions. Recent research has demonstrated that higher-resolution digital elevation models (DEMs), such as those derived from LiDAR technology, offer substantial improvements in the delineation of recharge-related microtopography [44,45,46]. Secondly, although Monte Carlo simulations reduce subjectivity, the initial thematic ranking still relies on expert judgment, which may introduce bias. Thirdly, the geographical restriction of field validation to selected sites is a key finding of the study. In order to enhance the robustness of the model, broader ground-truthing, incorporating systematic aquifer testing and isotopic analyses, is recommended. Furthermore, the impact of climate change on groundwater recharge was not explicitly addressed, despite the evidence that altered precipitation and evapotranspiration patterns are already influencing recharge patterns in arid Central Asia.
It is recommended that future research address the limitations identified by integrating higher-resolution datasets. Such datasets include LiDAR DEMs, Sentinel-1/2 time series, and downscaled climate projections. The employment of the hybrid modelling frameworks, which integrates MCDA with machine learning methodologies (e.g., Random Forest, Gradient Boosting, XGBoost), has the potential to diminish reliance on expert judgement and facilitate more data-driven weight estimation. Such approaches have already been applied successfully in groundwater studies in South and Southeast Asia, the Middle East, and Africa, showing superior predictive performance compared to conventional MCDA alone [47,48,49]. The expansion of the field validation network through well-yield testing, isotopic tracing, and long-term groundwater monitoring will provide the necessary empirical basis for further refinement. In conclusion, the integration of climate change scenarios with hydrogeological models, in conjunction with socio-economic and governance analyses, will facilitate the formulation of actionable, climate-resilient groundwater management strategies.
In summary, while the GIS–AHP framework remains a useful baseline for groundwater potential mapping, its integration with probabilistic and fuzzy approaches substantially improves robustness and interpretability. The extension of the framework with high-resolution data and machine learning has the potential to propel future research in the field of groundwater mapping towards a dynamic, uncertainty-aware, and decision-support system, thereby transcending the limitations of static suitability assessments. This approach provides valuable insights for both scientific inquiry and water resource governance, thereby contributing to the development of more resilient groundwater strategies in arid and semi-arid regions.

5. Conclusions

The present study demonstrates that the integration of remote sensing data with GIS-based analysis provides a reliable framework for the mapping of groundwater potential in arid regions of Central Asia. The developed geo-information model successfully delineated zones with favourable hydrogeological conditions, which were subsequently validated through field investigations.
The integration of the Analytic Hierarchy Process (AHP), Monte Carlo simulations, and fuzzy gamma analysis led to a substantial enhancement in the robustness of the results. Monte Carlo simulations were utilised to confirm the stability of the AHP-derived suitability map, while the fuzzy gamma operator expanded the extent of high-potential zones, thereby improving the prioritisation of areas for managed aquifer recharge (MAR).
For the first time in the arid regions of the Shu-Ile Mountains (Central Asia), where evaporation exceeds precipitation, available data were systematically analysed in order to identify and localise the areas favourable for freshwater accumulation. The results indicate that the primary concentration of fresh groundwater occurs within fractured granite massifs, particularly in areas adjacent to watershed zones. The formation of groundwater is chiefly ascribed to the infiltration of winter precipitation.
It was further established that approximately 72% of the study area is unsuitable for groundwater accumulation due to unfavorable hydrogeological conditions. This enables the optimization of exploration efforts and a reduction in associated costs.
The integration of deterministic, probabilistic, and fuzzy approaches has been demonstrated to provide a more reliable scientific basis for groundwater exploration and resource planning. These insights can directly support water authorities and planners in developing sustainable groundwater management strategies in the face of increasing water scarcity. The results of this study offer actionable guidance for policymakers and water managers, in order to facilitate the prioritisation of groundwater development zones, the optimisation of MAR initiatives, and the design of climate-resilient water resource strategies in arid and semi-arid environments.

Author Contributions

E.S. was responsible for data curation, formal analysis, methodology and writing the manuscript; Z.O. was responsible for conceptualization, data curation; K.K. was responsible for data curation, formal analysis, methodology and writing the manuscript; R.B. was responsible for writing—review and editing; V.R. was responsible for writing—original draft, editing and preparation of tables; O.M. was responsible for the computation, supervision and digitization of graphics; S.G. was responsible for visualization of research results; K.T. was responsible for methodology and project administration. All authors have read and agreed to the published version of the manuscript.

Funding

This research has been funded by the Science Committee of the Ministry of Science and Higher Education of the Republic of Kazakhstan (“Groundwater resources as the main reserve of sustainable irrigated agriculture in Kazakhs/tan” No. BR21882211).

Data Availability Statement

The original contributions presented in this study are included in the article. Further inquiries can be directed to the corresponding author.

Conflicts of Interest

Author Kanat Kanafin was employed by the company Hydrogeology Consulting Group LLP. The remaining authors declare that the research was conducted in the absence of any commercial or financial relationships that could be construed as a potential conflict of interest.

Appendix A

Table A1. Monitoring Well Data.
No.Well No.Depth to Groundwater Level from the Wellhead, mBorehole Depth, mCasing Diameter, mmHead DrawDown at Q = 0.2 L/sWellhead HeightpH (Field)
132n3.8220.3127120.87.18
221n4.3322.5312751.267.08
331n15.3643.789613.780.697.8
430n8.6512.64960.30.927.2
520n18.9836.94961.2107.47
634n7.4728963.20.537.5
733n8.4337.159625.31-
8253.7916.47961.210.927.2
92716.9227965.00.757.6
1035519.7935.76961.571.097.46
11269.9423.46968.261.017.44
12195.7115.85960.21.17.33
133r3.0547.3621911.607.72
1422-12.4196-0.89-
1523-36.7196-0.9-
1611n5.2416960.021.97.65
177r5.533.62190.507.6
182s9.3836962.820.417.91
19533-1.096-0.5-
Table A2. Annual Precipitation Data.
YearMonth
JanuaryFebruaryMarchAprilMayJuneJulyAugustSeptemberOctoberNovemberDecemberTotal, mm/Year
19557.29.612.18.29.61.310.60.00.70.00.313.973.5
19566.723.71026.714.6160.060.115.32.26.2127.5
195711.77.3201.50.07.717.22.110.516.830.815.8141.4
195829.51128.852.519.24.73.525.90.010.715.216.7217.7
19593.21123.625.76.316.36.30.30.00.93610.3139.9
196013.817.123.510.8252.224.10.71.216.31.18.3144.1
1961 0.0
1962149.92.817.1257.416.24.81.816.67.526.5149.6
19632.85.35.120.655.7178.40.25.80.69.729.6160.8
19645.71.617.451.120.512.524.60.00.05.117.45.1161
19651616.624.7240.59.614.90.05.113.925.14.8155.2
196620.43.718.5418.25.811.561.74.91129161.7
19674.830.419.617.613.74.222.31.43.18.67.86.3139.8
196810.86.936.922.224.58.68.852.322.812.219.4180.4
196916.41.936.435.722.22.214.33.73.546122.6196.9
197077.312.48.910.61.1319.40.04.813.929.4135.8
1971510.13.633.515.30.04.82.53.320.15.625.8129.6
197215.94.5217.710.189.40.83.125.27.322.4135.4
19739.114.817.83027.43.34.90.62.514.75.35.1135.5
19749.984.242.751.59.83.32.40.04292.8
197513.131.329.90.44.20.50.05.73.567.514.8116.9
1976428.410.741.59.320.67.40.52.955.49.114.4204.2
2010 2110810.63192284.6
2011131613722311436153023211
201211.623.518.812.812.116.515.34.21.62.814.34.4137.9
20131113172520234171620139
201441131511210.00.00.0436197167
2015301321.11019.6200.3911245253263
20162.5241.769.345.559.71940.7432524336.4
2017143219342510525271127211
2018618382341176424457193
2019351228221232192151126205
20201730.62.01.00.80.30.50.00.027653
20217691230.30.07100.9449.9
202211226675150.43827166231.4
20231512582027 0.00.0 132

Appendix B

Table A3. Table of Hydrochemical Analysis Results.
StationIDSample DateрН (Lab)TDSHardnessHardness CONaKCaMgNH4Fe2+HCO3ClSO4NO3NO2FBCoMnCuNiPO43−CrZn
32n17/10/237.327308.0058.005.001697.509.38880.88170.24<0.05<0.1305.102528.082395.51238.00<0.010.860.5430.0450.060.050.1070.0360.008
Koshkenbaisai stream17/10/237.814732.0032.004.451178.0029.55352.35175.10<0.05<0.1271.531574.291767.82<0.2<0.011.300.830.800.040.060.060.100.04
21n17/10/237.334859.0052.403.15858.107.90768.80170.20<0.05<0.1192.201442.001743.00267.00<0.010.700.391.370.030.070.070.190.040.01
31n17/10/237.692664.0022.6010.80474.102.26324.3277.823.12<0.1659.01422.001010.00121.00<0.010.970.210.670.050.050.040.240.030.03
30n17/10/237.742734.0023.604.85577.840.67248.25136.19<0.05<0.1295.94236.001600.0048.00<0.012.740.42 0.020.050.050.140.040.00
20n17/10/237.908785.0038.402.402588.0313.07472.47179.97<0.05<0.1146.451394.004646.00<0.2<0.013.231.24 0.030.050.050.090.03
34n17/10/237.953594.0018.003.701056.230.60212.2189.98<0.05<0.1225.77483.001983.00<0.2<0.013.231.02 0.050.040.050.040.03
33n17/10/237.974174.0026.401.551091.557.72360.36102.143.90<0.194.58607.002261.00128.00<0.012.860.590.770.350.060.060.030.04
25n18/10/237.673743.0031.802.60514.442.14444.44116.74<0.05<0.1158.65242.001733.00253.00<0.011.300.253.320.030.060.05 0.35
25n18/10/237.603234.0031.602.60520.211.73460.46104.58<0.05<0.1158.65243.001748.00253.00<0.011.300.333.830.040.060.06 0.04
27n18/10/237.783434.0027.601.50658.543.69392.3997.282.50<0.191.53170.002158.00162.00<0.012.320.333.830.040.060.06 0.04
Kletinsky open pit18/10/237.9412,130.0068.802.903124.0010.32776.78364.806.91<0.1176.963488.003381.00912.00<0.012.131.00 364.800.180.010.01499.00
35518/10/237.962534.0017.102.85600.901.54250.2555.94<0.05<0.1173.90110.001530.0083.00<0.012.320.33 0.040.040.04 0.03
35518/10/237.892735.0016.902.90565.141.39244.2457.15<0.05<0.1176.96109.001475.0067.00<0.012.320.27 0.040.040.04 0.03
26n18/10/237.921534.0011.503.65346.932.63164.1640.13<0.05<0.1222.7266.00890.0052.00<0.013.510.28 0.170.030.03 0.02
19n18/10/237.743050.0029.402.20600.905.30424.4099.70<0.05<0.1134.20755.001282.0085.00<0.013.510.24 0.050.050.05 0.03
19n18/10/237.693116.0029.802.25606.665.38388.39126.46<0.05<0.1137.29795.001307.0090.00<0.012.130.22 0.060.060.06 0.04
3r18/10/237.72634.007.403.2576.748.0288.0936.481.89<0.1198.31120.00189.0031.00<0.012.860.010.070.850.020.02 0.01
Spring19/10/237.933534.0022.005.40894.856.70300.3085.12<0.05<0.1329.50845.001306.00<0.2<0.015.790.49 0.020.050.050.030.03
11n(9c)19/10/238.09850.005.602.55196.333.6584.0817.02<0.05<0.1155.60107.00361.0027.00<0.013.510.090.040.010.010.01 0.01
11n(9c)19/10/238.10895.005.602.60196.333.1282.0818.24<0.05<0.1158.65107.00363.0027.00<0.013.660.200.040.010.010.01 0.01
7r19/10/238.001114.007.002.50277.573.9994.0927.97<0.05<0.1152.55173.00464.0027.00<0.013.510.120.070.010.020.02 0.01
2c19/10/237.97934.005.102.20236.852.3772.0718.24<0.05<0.1134.24150.70357.0018.00<0.012.630.110.050.030.010.01 0.01
4r20/10/238.06914.007.002.50190.942.4894.0927.97<0.05<0.1152.55120.00412.0034.00<0.012.740.100.060.010.020.02 0.01
4r20/10/238.08925.006.602.45221.292.5290.0925.54<0.05<0.1149.50120.00408.0034.00<0.012.860.13 0.0490.012 311
6r20/10/237.971534.0010.202.50381.144.52146.1535.26<0.05<0.1152.55305.00658.0028.00<0.013.230.160.080.010.010.02 0.01
2r20/10/237.821734.0013.802.50365.853.88190.1952.29<0.05<0.1152.55315.00738.0034.00<0.012.740.150.0150.019 3150.02
Akbakay mine19/10/237.565789.0029.200.401152.1010.77484.4860.80<0.05<0.124.411423.001507.00<0.2<0.013.231.09 0.120.060.05 0.04
Akbakay mine19/10/237.565789.0040.000.451297.768.89656.6687.55<0.05<0.127.462066.001507.00<0.2<0.012.981.09 0.120.060.05 0.04
Akbakay mine19/10/237.215997.0040.800.301386.2411.03688.6977.82<0.05<0.118.311984.001748.0084.00<0.012.861.240.010.360.060.060.050.04
Akbakay mine19/10/237.635685.0038.000.701351.6513.78648.6568.103.53<0.142.711670.001889.0084.00<0.012.861.32 0.150.070.060.080.04
Akbakay mine19/10/237.876000.0039.200.901386.2422.93624.6297.2832.10<0.154.921757.001963.00204.00<0.012.741.27 0.380.070.070.080.040.00
Beskempir mine20/10/237.929189.0043.202.002403.0041.39528.53204.29<0.05<0.1122.042402.002402.001232.00<0.012.230.49 0.180.040.050.040.030.01
Beskempir mine20/10/238.196889.0044.001.701562.899.68360.36316.16<0.05<0.1103.731756.001992.00716.00<0.012.050.62 0.040.030.050.040.030.02
Notes: Water sampling procedures were performed according to the Republic of Kazakhstan’s standard methods for monitoring and assessing irrigated land reclamation conditions. All chemical analyses were performed by the chemical laboratory of the Ahmedsafin Institute of Hydrogeology and Environmental Geoscience (Accreditation Certificate No. KZ.T.02.0782, valid until 27.11.2025). Chemical water sample analysis was conducted via a Mettler-Toledo liquid analyzer to measure the pH, conductivity, and dry residue. The sodium and potassium levels were determined with a PFP-7 flame photometer. Dissolved calcium, magnesium, nitrite, nitrate, sulfate, chloride, and fluoride were measured using a Capel 105M capillary electrophoresis [37].
Electrolytes were prepared using the following reagents: potassium tetra chlorochromate (KTA-OH), diethylamino (DEA), tartaric acid, hydrochloric acid, and sodium hydroxide. The calibration results are expressed in mg/L. Boron (B) and silicon (Si) concentrations were measured using the KFK-2 photo colorimeter. The metals were analyzed using an ICPE-9820 emission spectrometer by International Standard ISO 17294-2:2003 [50]. Prior to analysis, samples were treated with nitric acid and filtered.
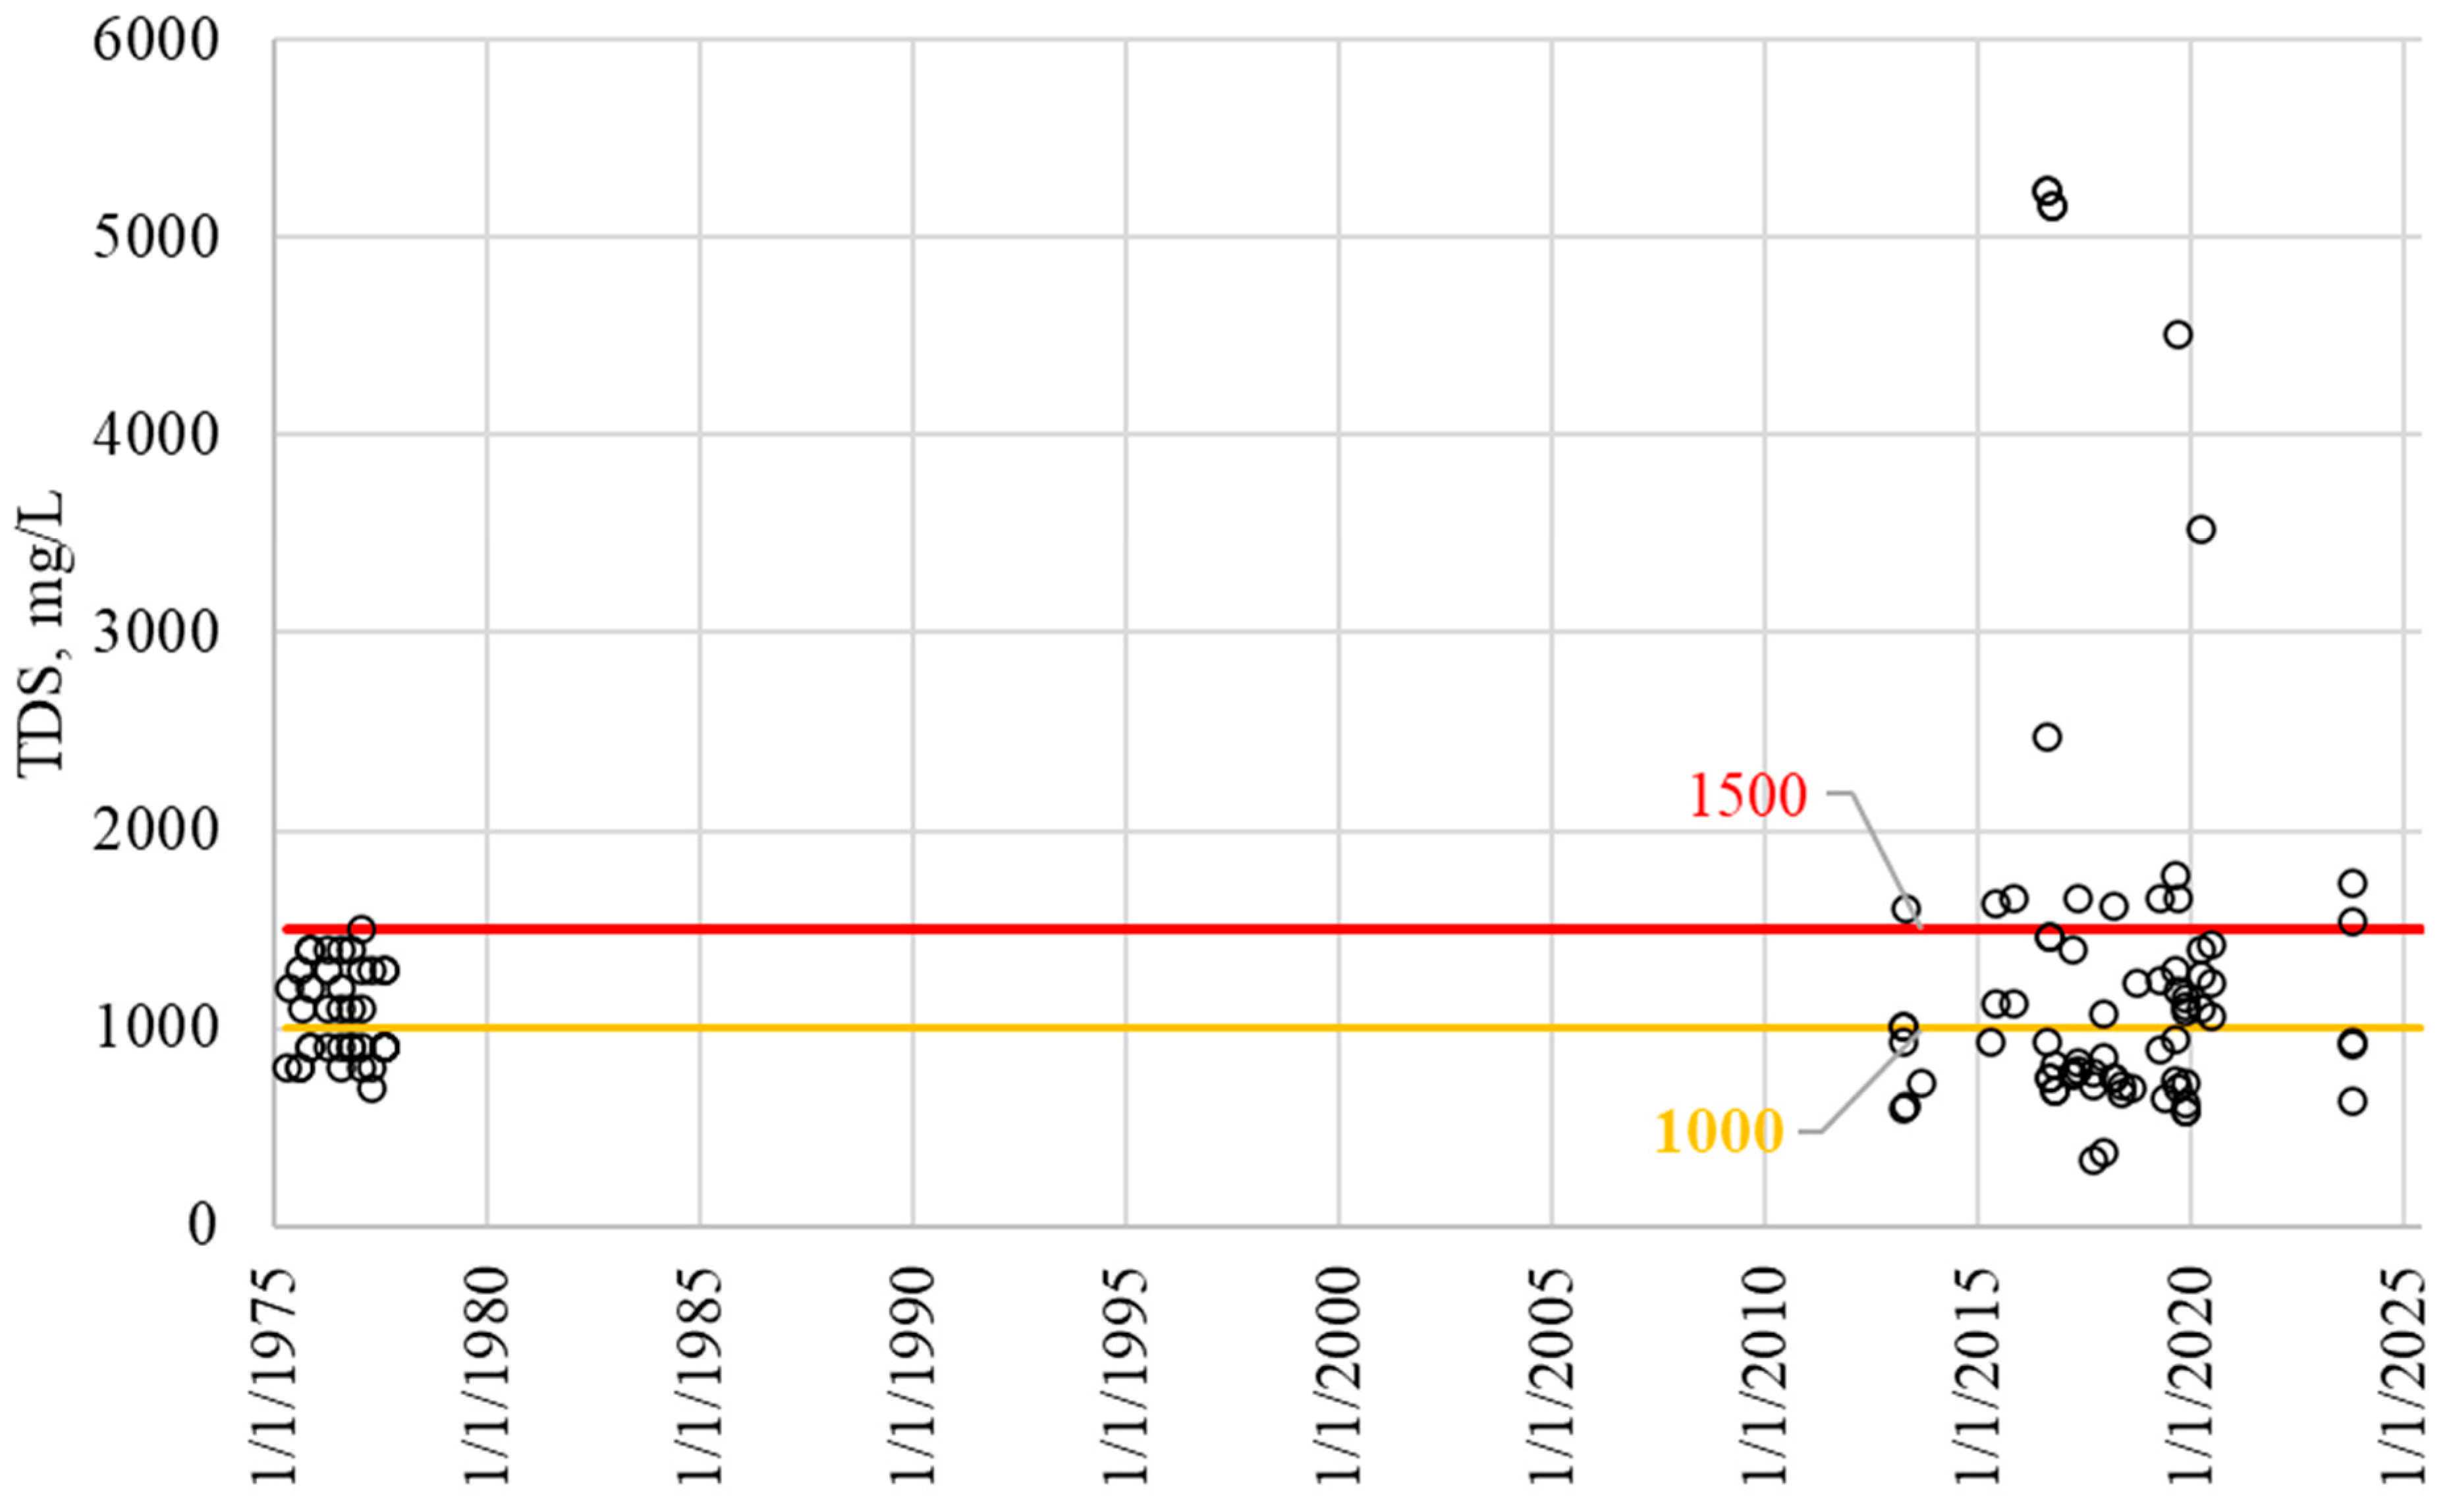
Figure A1. Long-Term Trend of Groundwater Mineralization in Wells No. 2r–6r, Beskempir Deposit (1975–2025).
Water 17 02985 g0a1
Figure A2. Long-Term Trend of Groundwater Sulfate Concentrations in Wells No. 2r–6r, Beskempir Deposit (1975–2025).
Water 17 02985 g0a2
Figure A3. Long-Term Trend of Groundwater Chloride Concentrations in Wells No. 2r–6r, Beskempir Deposit (1975–2025).
Water 17 02985 g0a3
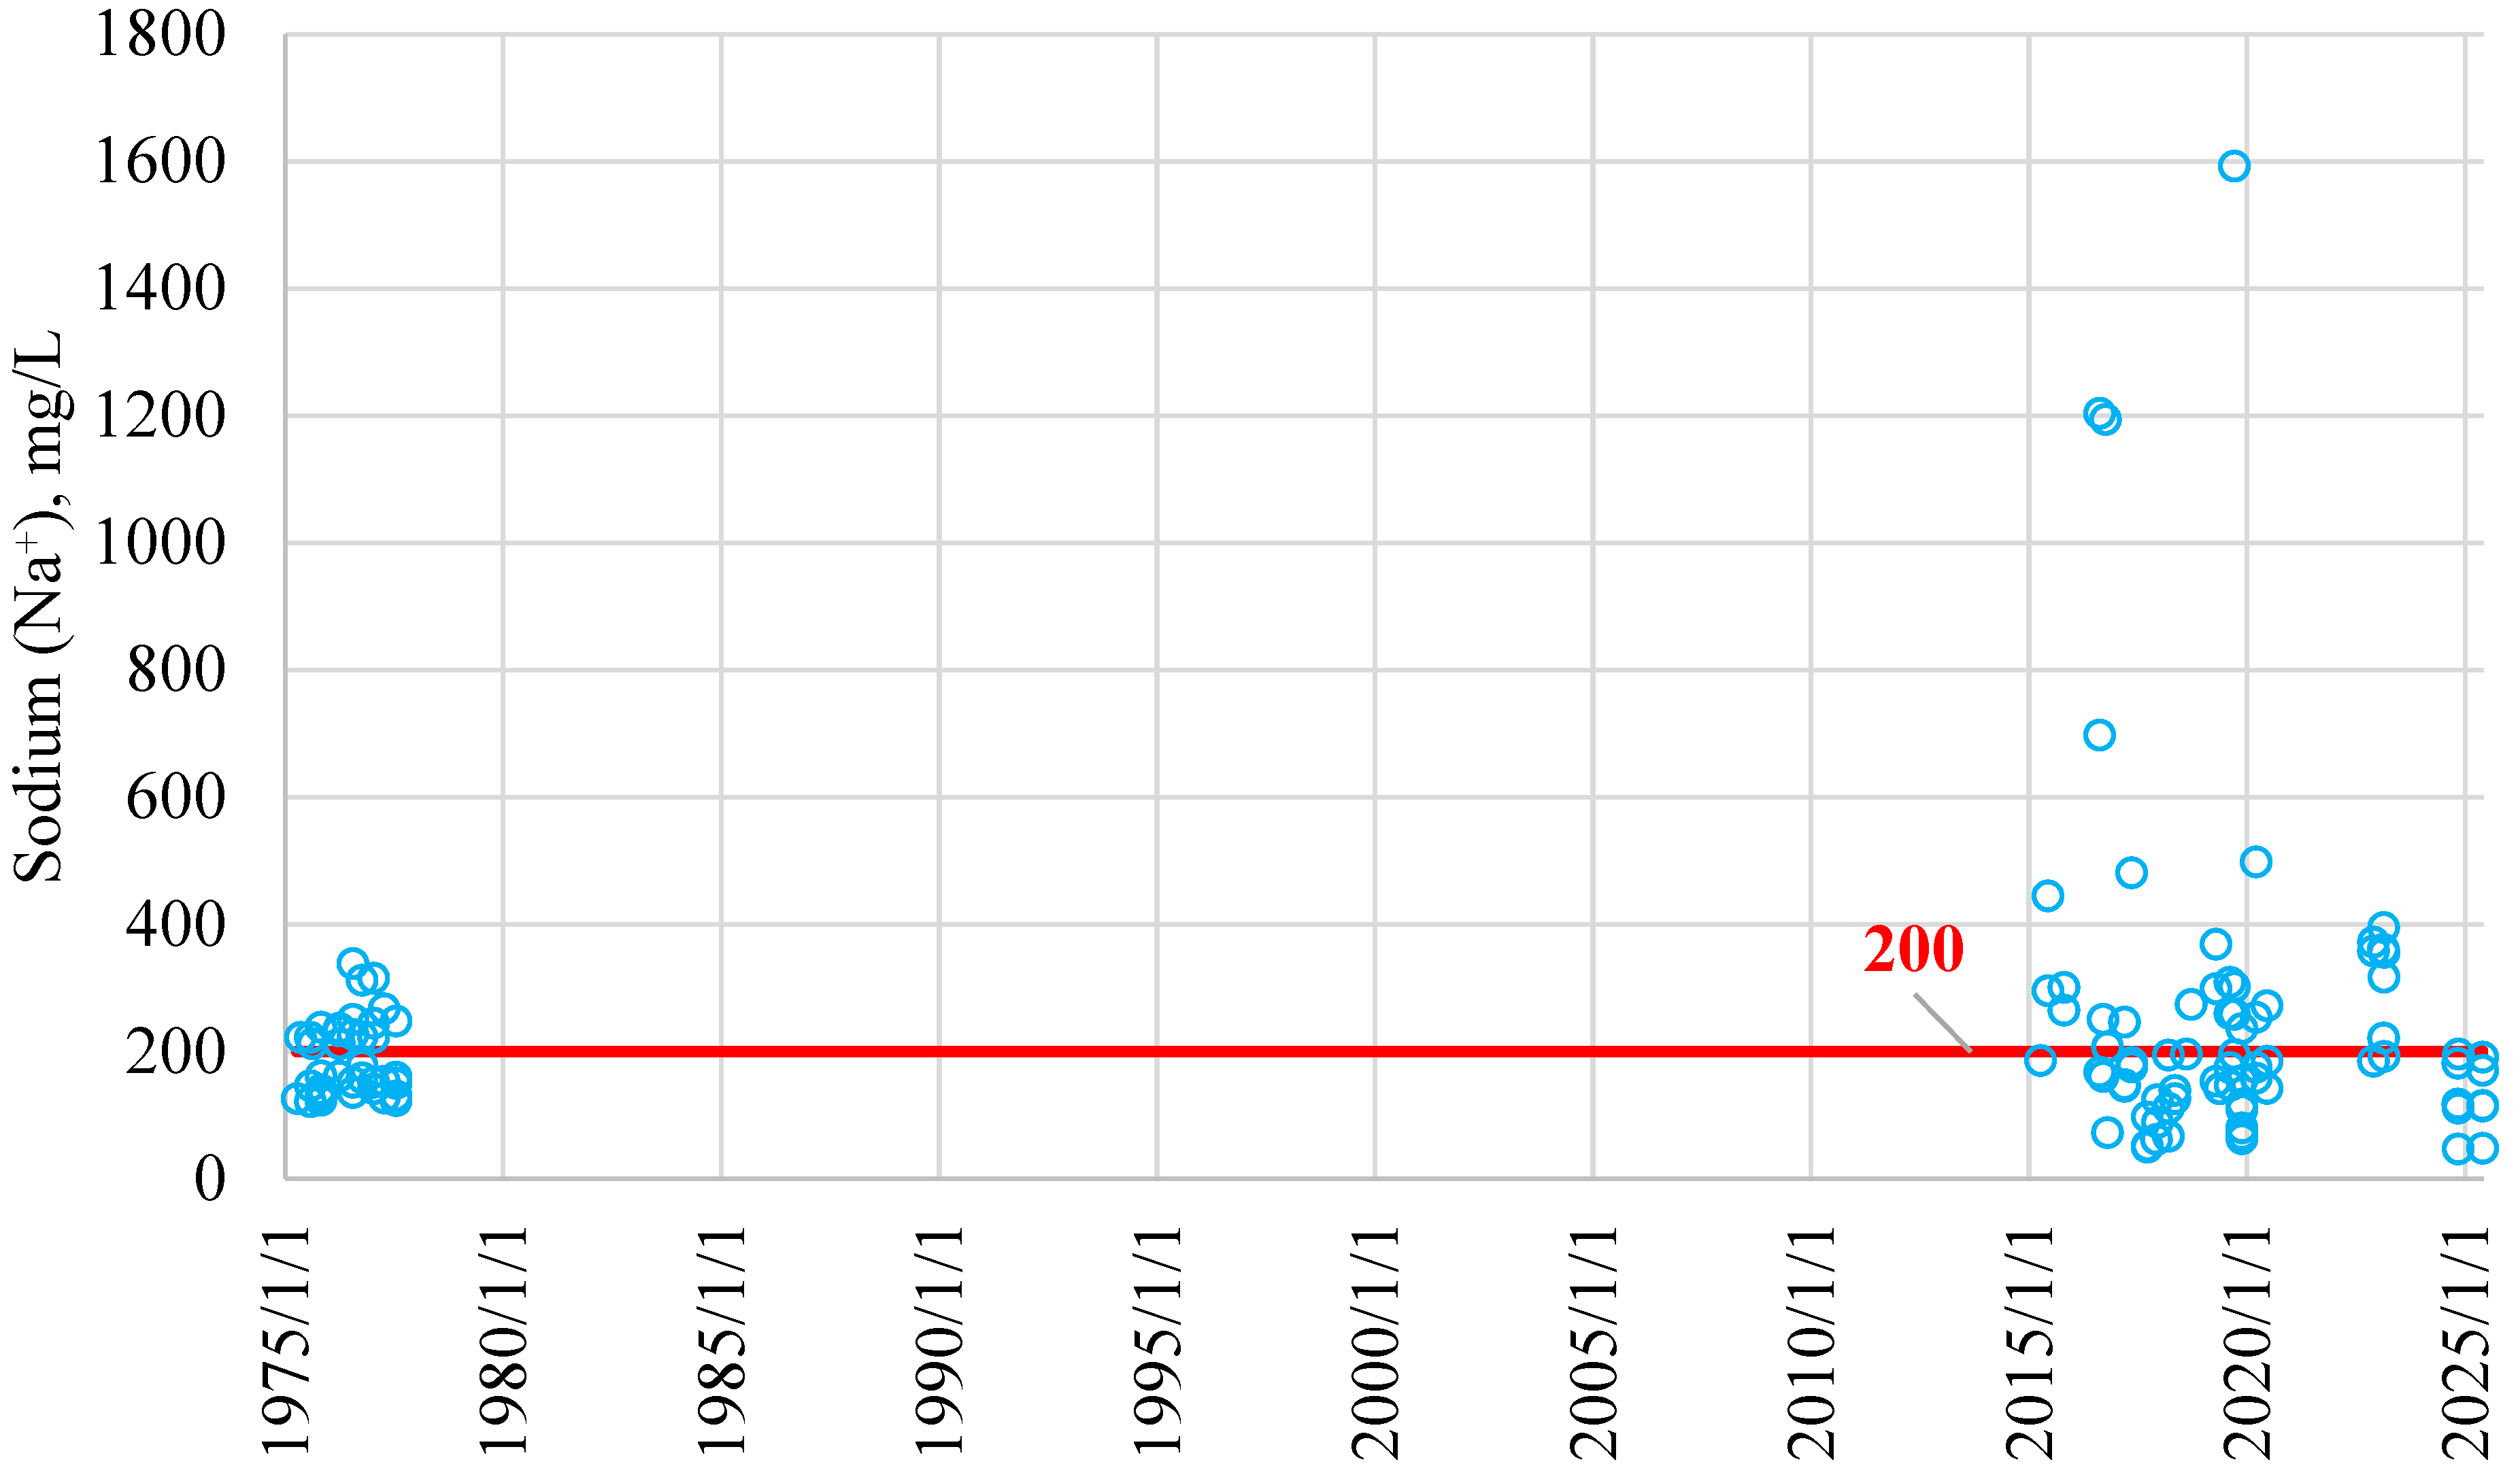
Figure A4. Long-Term Trend of Groundwater Sodium Concentrations in Wells No. 2r–6r, Beskempir Deposit (1975–2025).
Water 17 02985 g0a4
Figure A5. Long-Term Trend of Groundwater Fluoride Concentrations in Wells No. 2r–6r, Beskempir Deposit (1975–2025).
Water 17 02985 g0a5

References

  1. UNESCO. The United Nations World Water Development Report 2025: Mountains and Glaciers—Water Towers; United Nations Educational, Scientific and Cultural Organization: Paris, France, 2025; Available online: https://www.unwater.org/publications/un-world-water-development-report-2025 (accessed on 3 September 2025).
  2. Rao, P.V.; Subrahmanyam, M.B.; Raju, B.A. Groundwater exploration in hard rock terrains of East Godavari district, Andhra Pradesh, India using AHP and WIO analyses together with geoelectrical surveys. AIMS Geosci. 2021, 7, 244. [Google Scholar] [CrossRef]
  3. Chen, J.; Xue, L. Is ground-water in arid inland drainage basins a resource for sustainable development? J. Arid Environ. 2003, 55, 389. [Google Scholar] [CrossRef]
  4. Onglassynov, Z.A.; Shagarova, L.V.; Muratova, M.M. Satellite data spectral analysis under critical hydrogeological amelioratory conditions of Golodnostepsky irrigation lands. E3S Web Conf. 2023, 407, 02005. [Google Scholar] [CrossRef]
  5. Abdekareem, M.; Al-Arifi, N.; Abdalla, F.; Mansour, A.; El-Baz, F. Fusion of Remote Sensing Data Using GIS-Based AHP-Weighted Overlay Techniques for Groundwater Sustainability in Arid Regions. Sustainability 2022, 14, 7871. [Google Scholar] [CrossRef]
  6. Agarwal, R.; Garg, P. Remote Sensing and GIS Based Groundwater Potential & Recharge Zones Mapping Using Multi-Criteria Decision Making Technique. Water Resour. Manag. 2015, 30, 243–260. [Google Scholar] [CrossRef]
  7. Srivastava, P.; Bhattacharya, A. Groundwater assessment through an integrated approach using remote sensing, GIS and resistivity techniques: A case study from a hard rock terrain. Int. J. Remote Sens. 2006, 27, 4599–4620. [Google Scholar] [CrossRef]
  8. Waters, P.; Greenbaum, D.; Smart, P.L.; Osmaston, H. Applications of remote sensing to groundwater hydrology. Remote Sens. Rev. 1990, 4, 223. [Google Scholar] [CrossRef]
  9. Ostanin, O.; Dyakova, G.; Lebedeva, A.S. The Application of GIS Technologies and Remote Sensing Data to Determine the Morphometric Features of the River Basin: The Case of the Upper Part of the Charysh River. IOP Conf. Ser. Earth Environ. Sci. 2021, 670, 12061. [Google Scholar] [CrossRef]
  10. Kumari, L. Delineation of Potential Groundwater Zone Using RS and GIS: A Review. Int. J. Curr. Microbiol. Appl. Sci. 2018, 7, 196. [Google Scholar] [CrossRef]
  11. Niraula, R.R.; Sharma, S.; Pokharel, B.K.; Paudel, U. Spatial prediction of spring locations in data poor region of Central Himalayas. Hydrol. Res. 2020, 52, 492. [Google Scholar] [CrossRef]
  12. Khan, U.; Faheem, H.; Jiang, Z.; Wajid, M.; Younas, M.; Zhang, B. Integrating a GIS-Based Multi-Influence Factors Model with Hydro-Geophysical Exploration for Groundwater Potential and Hydrogeological Assessment: A Case Study in the Karak Watershed, Northern Pakistan. Water 2021, 13, 1255. [Google Scholar] [CrossRef]
  13. Chalkias, C.; Stathopoulos, N.; Kalogeropoulos, K.; Karymbalis, E. Applied Hydrological Modeling with the Use of Geoinformatics: Theory and Practice; InTech eBooks: London, UK, 2016. [Google Scholar] [CrossRef]
  14. Mondal, S. Remote Sensing and GIS Based Ground Water Potential Mapping of Kangshabati Irrigation Command Area, West Bengal. J. Geogr. Nat. Disasters 2012, 1, 1–8. [Google Scholar] [CrossRef]
  15. Alshehri, F.; Abd El-Hamid, H.T.; Mohamed, A. Mapping Coastal Groundwater Potential Zones Using Remote Sensing-Based AHP Model in Al Qunfudhah Region along Red Sea, Saudi Arabia. Heliyon 2024, 10, e28186. [Google Scholar] [CrossRef]
  16. Masoud, A.M.; Koike, K.; Ghoneim, E.; Hassan, A.M. Efficiency of Geospatial Technology and MCDA for Groundwater Potential Mapping in Arid Regions: A Case Study from Egypt. Water 2022, 14, 882. [Google Scholar] [CrossRef]
  17. Ashraf, M.U.; Mushtaq, M.; Awan, A.; Iqbal, S.; Hussain, M.; Riaz, M.T.; Gul, S. Ascertainment of the Most Suitable Water Harvesting Sites in an Arid Region of Pakistan Using PROMETHEE-II and AHP within a GIS Environment. Water Pract. Technol. 2024, 19, 796–811. [Google Scholar] [CrossRef]
  18. Rawat, A.; Bera, A.; Prusty, B.K.; Sahoo, S. Scaling Up Indigenous Rainwater Harvesting for Sustainable Agriculture in Rajasthan Using GIS-Based AHP. Water 2023, 15, 2042. [Google Scholar] [CrossRef]
  19. Halder, S.; Dutta, S.; Chattopadhyay, P.; Mondal, S.; Sharma, A.; Singh, R. Ground–Surface Water Assessment in a Semi-Arid Basin: Integrating SWAT and VIKOR for Sustainable Land and Water Management. Water 2025, 17, 880. [Google Scholar] [CrossRef]
  20. Nathawat, R.; Singh, S.; Pandey, A.; Sharma, K.; Sharma, P. Urban Green Infrastructure Planning in Semi-Arid Cities Using GIS-Based MCDA: A Case from Jaipur, India. Sustainability 2025, 17, 2420. [Google Scholar] [CrossRef]
  21. Valjarević, A.; Šiljeg, A.; Šiljeg, S.; Vujović, F.; Sahay, A. GIS-Based Water Stress Analysis in North African Drylands. J. Arid Environ. 2025, 230, 105427. [Google Scholar] [CrossRef]
  22. Dyer, J.S. Remarks on the Analytic Hierarchy Process. Manag. Sci. 1990, 36, 249–258. [Google Scholar] [CrossRef]
  23. Sallwey, J.; Bonilla Valverde, J.P.; Vásquez López, F.; Junghanns, R.; Stefan, C. Suitability Maps for Managed Aquifer Recharge: A Review of Multi-Criteria Decision Analysis Studies. Environ. Rev. 2019, 27, 138–150. [Google Scholar] [CrossRef]
  24. Li, T.; Bian, J.; Ruan, D.; Xu, L.; Zhang, S. Groundwater Health Risk Assessment and Its Temporal and Spatial Evolution Based on Trapezoidal Fuzzy Number–Monte Carlo Stochastic Simulation: A Case Study in Western Jilin Province. Ecotoxicol. Environ. Saf. 2024, 282, 116736. [Google Scholar] [CrossRef]
  25. Forootan, E. The Integrated Fuzzy AHP and Fuzzy Logic Techniques for Mapping and Prioritizing Groundwater Potential Zone Based on Water Quality. Environ. Monit. Assess. 2025, 197, 698. [Google Scholar] [CrossRef]
  26. Gupta, M.; Srivastava, P.K. Integrating GIS and remote sensing for identification of groundwater potential zones in the hilly terrain of Pavagarh, Gujarat, India. Water Int. 2010, 35, 233. [Google Scholar] [CrossRef]
  27. Kumar, V.; Mondal, N.; Mondal, N.; Ahmed, S. Identification of Groundwater Potential Zones Using RS, GIS and AHP Techniques: A Case Study in a Part of Deccan Volcanic Province (DVP), Maharashtra, India. J. Indian Soc. Remote Sens. 2020, 48, 497–511. [Google Scholar] [CrossRef]
  28. Arulbalaji, P.; Padmalal, D.; Sreelash, K. GIS and AHP Techniques Based Delineation of Groundwater Potential Zones: A case study from Southern Western Ghats, India. Sci. Rep. 2019, 9, 2082. [Google Scholar] [CrossRef]
  29. Ni, B.; Wang, D.; Deng, Z.; Xu, H.; Wang, D.; Jiang, X. Review on the Groundwater Potential Evaluation Based on Remote Sensing Technology. IOP Conf. Ser. Mater. Sci. Eng. 2018, 394, 52038. [Google Scholar] [CrossRef]
  30. Indhulekha, K.; Mondal, K.C.; Jhariya, D.C. Groundwater prospect mapping using remote sensing, GIS and resistivity survey techniques in Chhokra Nala Raipur district, Chhattisgarh, India. J. Water Supply Res. Technol. AQUA 2019, 68, 595. [Google Scholar] [CrossRef]
  31. Weather and Climate Reference Portal. Available online: http://www.pogodaiklimat.ru/history.php?id=kz (accessed on 15 September 2025).
  32. Saaty, T.L. The Analytic Hierarchy Process: Planning, Priority Setting, Resource Allocation; McGraw-Hill: New York, NY, USA, 1980; p. 287. [Google Scholar]
  33. Saaty, T.L. How to Make a Decision: The Analytic Hierarchy Process. Aestimum 1994, 24, 19–43. [Google Scholar] [CrossRef]
  34. Goepel, K.D. AHP Excel Template Version 2022.07.08. Business Performance Management Singapore. Available online: https://bpmsg.com/new-ahp-excel-template-with-multiple-inputs/ (accessed on 15 September 2025).
  35. Saaty, T.L. The Analytic Hierarchy Process: What is it and how it is used. Math. Model. 1987, 9, 161–176. [Google Scholar] [CrossRef]
  36. Kasymbekov, D.A. The Formation of Groundwater in the Chu-Ili Mountain-Fold Region (Southeastern Part and Its Surroundings) and Prospects for Its Use. Ph.D. Thesis, Kazakh National Technical University, Almaty, Kazakhstan, 1990. [Google Scholar]
  37. National Standard ST RK GOST R 51232., 2003. Drinking Water General Requirements for the Organization and Methods of Quality Control. In Proceedings of the Committee for Standardization, Metrology and Certification, Astana, Kazakhstan, 29 September 2003; Available online: https://waterservice.kz/downloads/rd/gst7.pdf?ysclid=ld3fpwacho899490449 (accessed on 15 September 2025). (In Kazakh and Russian Languages).
  38. Soller, D.R. U.S. Geological Survey Open-File Report 2012–1171. Digital Mapping Techniques ‘10—Workshop Proceedings, 2012; 178p. Available online: https://pubs.usgs.gov/of/2012/1171/pdf/usgs_of2012-1171.pdf (accessed on 15 September 2025).
  39. Monir, M.M.; Sarker, S.C.; Islam, A.R.M.T. A critical review on groundwater level depletion monitoring based on GIS and data-driven models: Global perspectives and future challenges. HydroResearch 2024, 7, 285. [Google Scholar] [CrossRef]
  40. Jagadeesh, B.R.; Veni, K.K. Flood Plain Modelling of Krishna Lower Basin Using Arcgis, Hec-Georas and Hec-Ras. IOP Conf. Ser. Mater. Sci. Eng. 2021, 1112, 12024. [Google Scholar] [CrossRef]
  41. Flora, F.M.I. A GIS-based on application of Monte Carlo and multi-criteria decision-making approach for site suitability analysis of solar-hydrogen production: Case of Cameroon. Heliyon 2025, 11, e41541. [Google Scholar] [CrossRef] [PubMed]
  42. Thongley, T.; Choki, T.; Choden, K. Groundwater Potential Mapping at Highly Populated Sub-districts of Thimphu District Using Fuzzy Analytic Hierarchy Process. Appl. Environ. Res. 2023, 45. [Google Scholar] [CrossRef]
  43. Shao, Z.; Huq, M.; Cai, B.; Altan, O.; Li, Y. Integrated remote sensing and GIS approach using Fuzzy-AHP to delineate and identify groundwater potential zones in semi-arid Shanxi Province, China. Environ. Model. Softw. 2020, 134, 104868. [Google Scholar] [CrossRef]
  44. Ågren, A.M.; Larson, J.; Paul, S.S.; Laudon, H.; Lidberg, W. Use of Multiple LiDAR-Derived Digital Terrain Indices and Machine Learning for High-Resolution National-Scale Soil Moisture Mapping of the Swedish Forest Landscape. Geoderma 2021, 404, 115280. [Google Scholar] [CrossRef]
  45. Xiong, H.; Yang, S.; Tan, J.; Wang, Y.; Guo, X.; Ma, X. Effects of DEM Resolution and Application of Solely DEM-Derived Indicators on Groundwater Potential Mapping in the Mountainous Area. J. Hydrol. 2024, 636, 131349. [Google Scholar] [CrossRef]
  46. Talukdar, S.; Mallick, J.; Sarkar, S.K.; Roy, S.K.; Islam, A.R.M.T.; Praveen, B.; Naikoo, M.W.; Rahman, A.; Sobnam, M. Novel Hybrid Models to Enhance the Efficiency of Groundwater Potentiality Model. Appl. Water Sci. 2022, 12, 62. [Google Scholar] [CrossRef]
  47. Nguyen, P.T.; Ha, D.H.; Jaafari, A.; Nguyen, H.D.; Van Phong, T.; Al-Ansari, N.; Prakash, I.; Le, H.V.; Pham, B.T. Groundwater Potential Mapping Combining Artificial Neural Network and Real AdaBoost Ensemble Technique: The DakNong Province Case-Study, Vietnam. Int. J. Environ. Res. Public Health 2020, 17, 2473. [Google Scholar] [CrossRef]
  48. Arabameri, A.; Roy, J.; Saha, S.; Blaschke, T.; Ghorbanzadeh, O.; Tien Bui, D. Application of Probabilistic and Machine Learning Models for Groundwater Potentiality Mapping in Damghan Sedimentary Plain, Iran. Remote Sens. 2019, 11, 3015. [Google Scholar] [CrossRef]
  49. Madani, A.; Niyazi, B. Groundwater Potential Mapping Using Remote Sensing and Random Forest Machine Learning Model: A Case Study from Lower Part of Wadi Yalamlam, Western Saudi Arabia. Sustainability 2023, 15, 2772. [Google Scholar] [CrossRef]
  50. ISO 17294-2; Water Quality—Application of Inductively Coupled Plasma Mass Spectrometry (ICP-MS)—Part 2: Determination of 62 Elements. ISO: Geneva, Switzerland, 2003. Available online: https://cdn.standards.iteh.ai/samples/36127/5395f5b265b64455bb9890d9d161cf95/ISO-17294-2-2003.pdf (accessed on 15 June 2025).
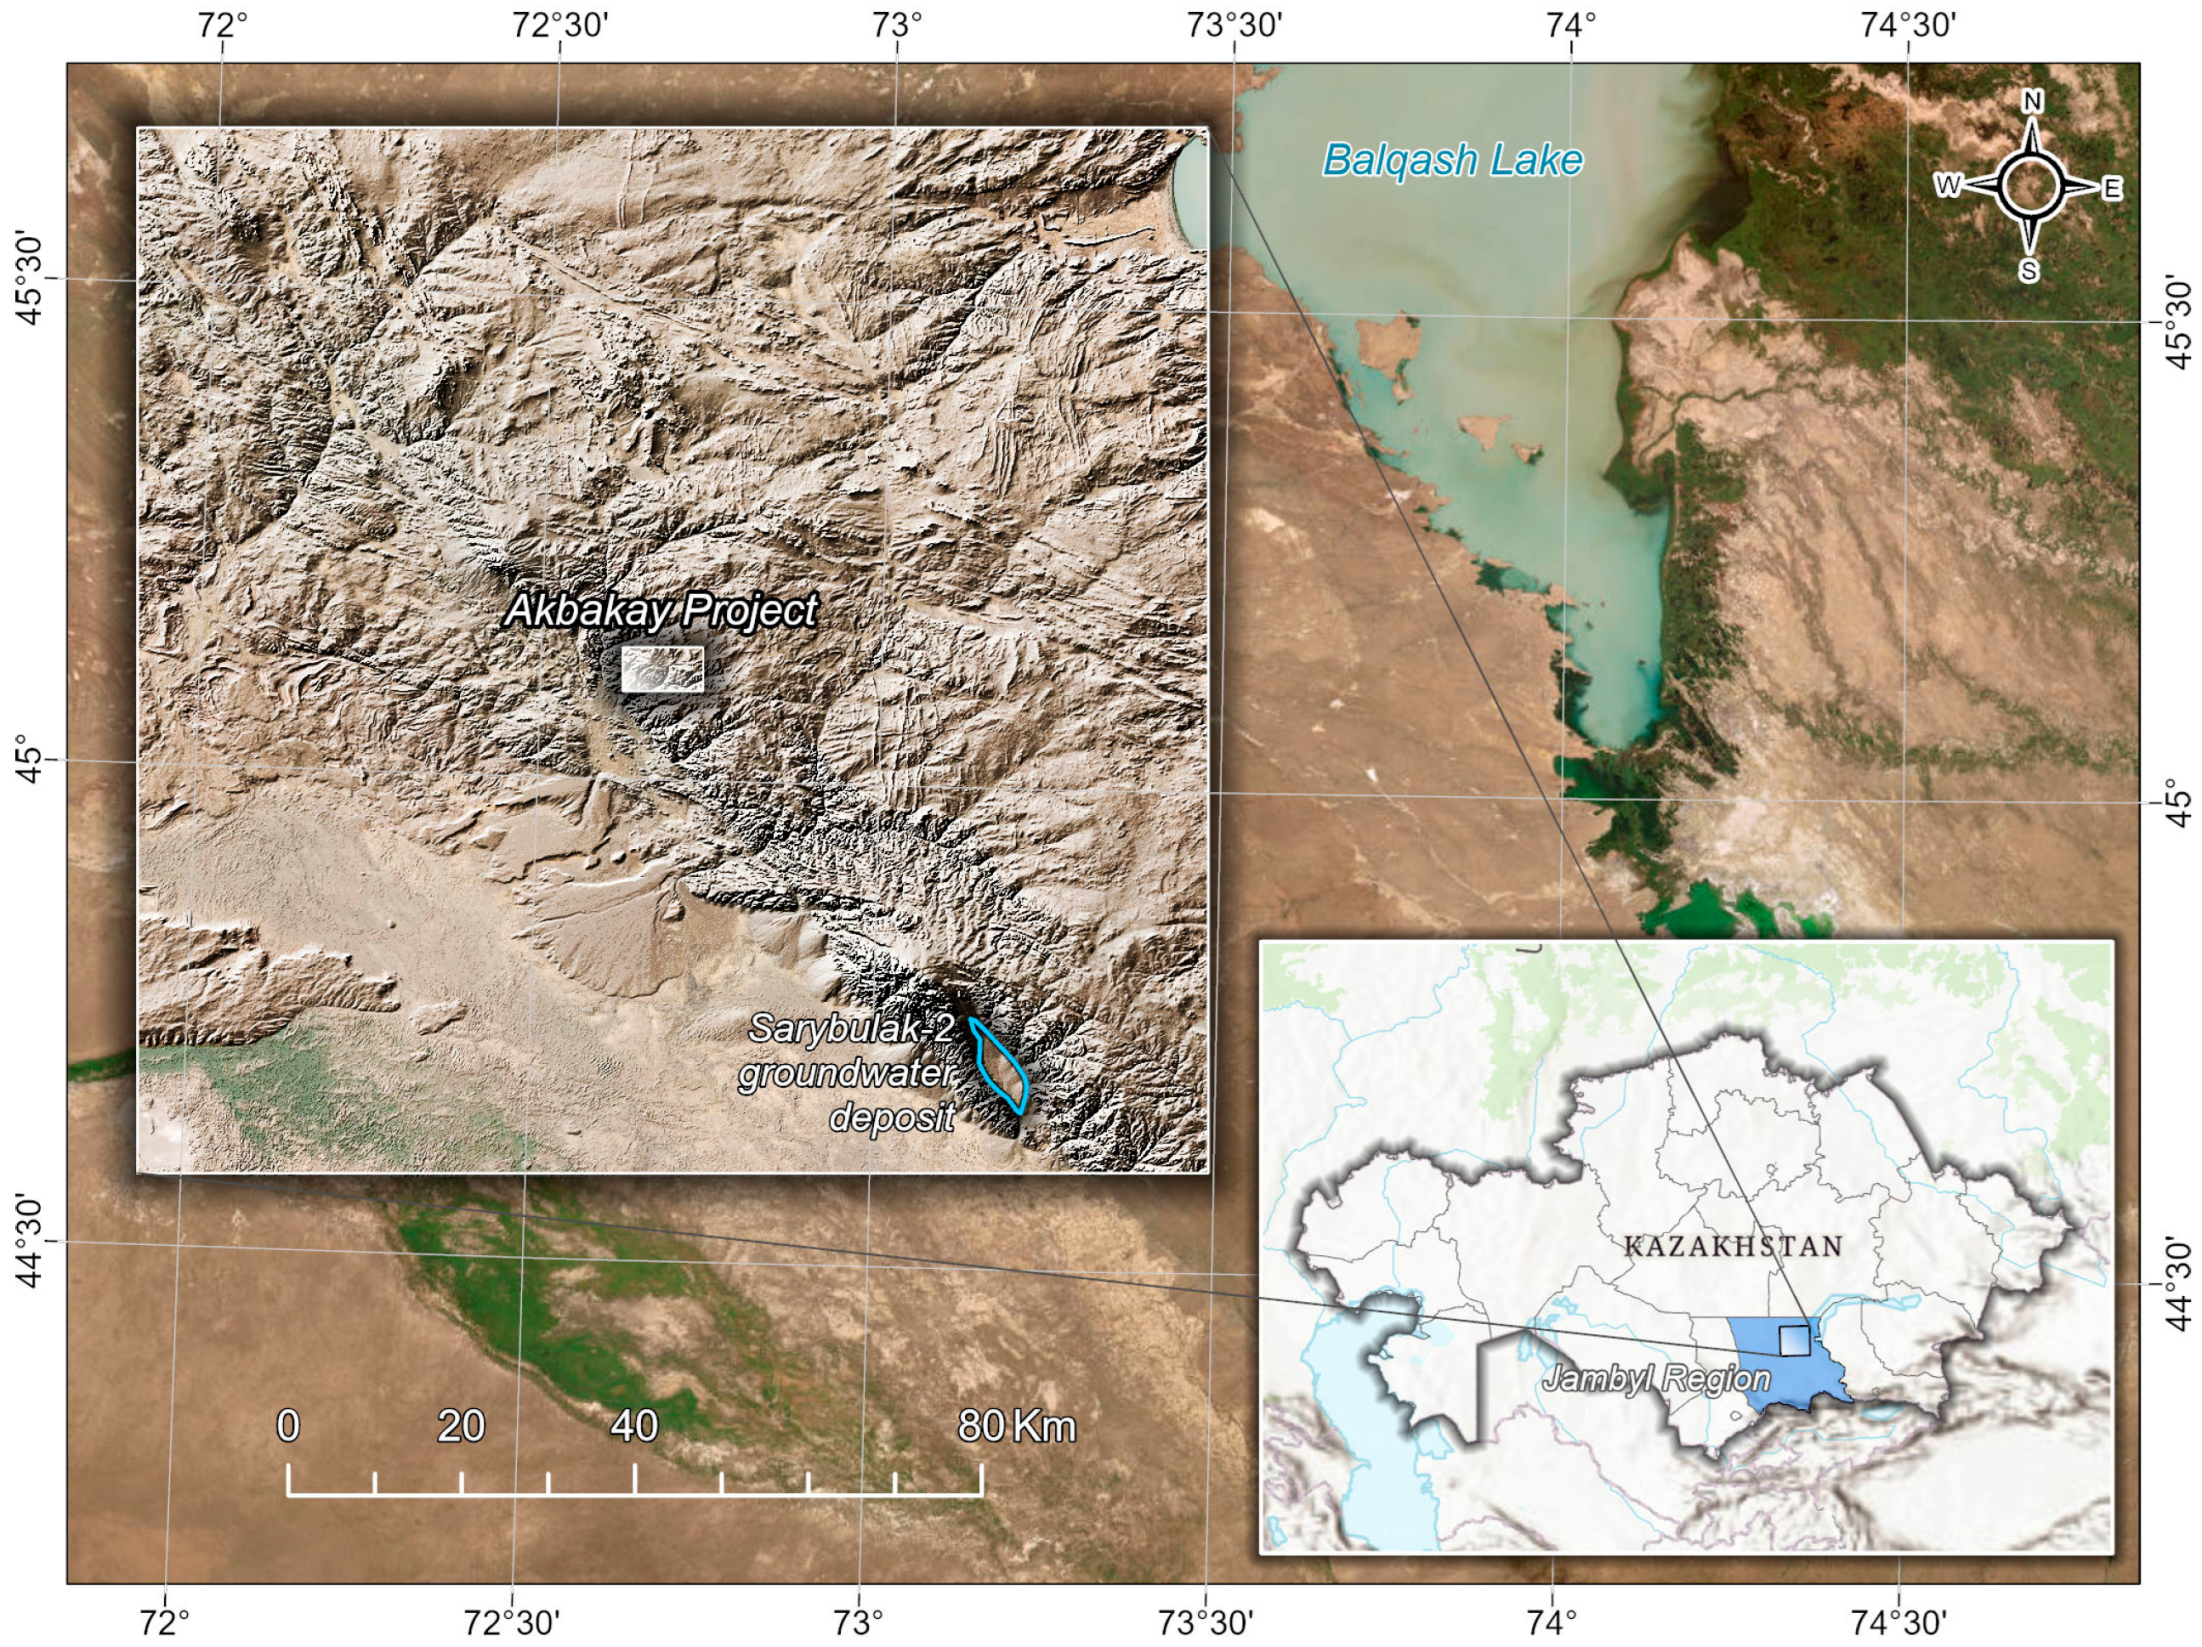
Figure 1. Location of the study area, the Akbakay region in Kazakhstan. The figure was prepared using ArcGIS.
Water 17 02985 g001
Figure 2. Digital elevation model for the study area.
Water 17 02985 g002
Figure 3. Catchment area and drainage network of the study area.
Water 17 02985 g003
Figure 4. Methodology and data used.
Water 17 02985 g004
Figure 5. Durov diagram of chemical composition of groundwater in the study area based on previously conducted investigations.
Water 17 02985 g005
Figure 6. Durov diagram of the chemical composition of groundwater samples collected in the study area during the field survey.
Water 17 02985 g006
Figure 7. Lithology map of the study area.
Water 17 02985 g007
Figure 8. Extracted lineaments of the study area.
Water 17 02985 g008
Figure 9. Lineament density map of the study area. Erosional Pattern Density Map. The spatial distribution of drainage density serves as a vital indicator of landscape hydrodynamics, surface permeability, and subsurface recharge potential. Drainage density, defined as the total length of all drainage channels per unit area (km/km2), reflects the interplay between climate, topography, vegetation cover, soil type, and lithological structure. It directly influences surface runoff patterns and, therefore, the potential for groundwater recharge.
Water 17 02985 g009
Figure 10. Drainage network density map of the study area.
Water 17 02985 g010
Figure 11. Surface slope map of the study area.
Water 17 02985 g011
Figure 12. Distance-to-drainage map of the study area.
Water 17 02985 g012
Figure 13. Map scheme of weather stations.
Water 17 02985 g013
Figure 14. Precipitation map of the study area.
Water 17 02985 g014
Figure 15. Land cover map of the study area.
Water 17 02985 g015
Figure 16. Spatial distribution of groundwater observation points classified by salinity and aquifer recharge potential.
Water 17 02985 g016
Figure 17. Groundwater salinity and aquifer recharge potential across observation points with mineralization < 3 g/L.
Water 17 02985 g017
Figure 18. Suitability maps derived from AHP and uncertainty analysis: (a) baseline AHP suitability map; (b) mean suitability from Monte Carlo simulations (MC_mean); (c) probability of belonging to the high-suitability class (MC_prob ≥ 0.70); (d) standard deviation of suitability across simulations (model variability).
Water 17 02985 g018
Figure 19. Area distribution across suitability classes for AHP and MC_mean.
Water 17 02985 g019
Figure 20. Comparison of AHP and Fuzzy Gamma: (a) baseline AHP suitability map; (b) suitability map obtained using Fuzzy Gamma (γ = 0.9).
Water 17 02985 g020
Figure 21. Area of suitability classes based on Fuzzy Gamma.
Water 17 02985 g021
Figure 22. Cumulative distribution functions (CDFs) of suitability for AHP, MC_mean, and Fuzzy Gamma.
Water 17 02985 g022
Table 1. Relative importance scale for AHP [33].
Relative Importance Intensity in PointsDefinitionExplanation
1Equal importance of the criteriaThe importance of objects (factors) is equal
3Moderate superiority of one over the otherExperience and judgement give slight superiority to one object (factor) over the other
5Substantial or strong superiorityEvidence suggests a marked superiority of one object (factor) over the other
7Very strong superiorityThe superiority of the object (factor) is obvious
9Absolute superiorityThe obviousness of superiority of the object (factor) is confirmed by all available signs
2, 4, 6, 8Intermediate judgements between two neighbouring judgementsUsed in compromise cases
1/3, 1/5, 1/7Inverse values show that the first
criterion is inferior in importance to the second criterion
Table 2. Pairwise map comparison matrix for the AHP method.
Thematic
Maps
Lithology Lineament Density Erosion Network
Density
Daylight Surface Slope Distance-to-ErosionPrecipitationLand CoverWeight
Lithology 133355737.32
Lineament Density 1/311355722.06
Drainage
Density
1/31/31133516.03
Slope 1/51/31/3133511.14
Distance
to drainage
1/51/31/31/31138.09
Precipitation1/71/51/51/51/5133.37
Land Cover1/91/71/71/71/71/311.99
Table 3. Parameters used for the LINE module.
ParameterStandard Value
(Default)
Accepted Value
RADI (Filter Radius)205
GTHR (Edge Gradient Threshold)205
LTHR (Curve Length Threshold)3020
FTHR (Line Fitting Threshold)3100
ATHR (Angular Difference Threshold)3015
DTHR (Linking Distance Threshold)2040
Table 4. Degree of importance and class ranking.
MapUnitWeight%ClassRank
Lithology-0.3737.321–6821
683–9722
973–16543
1655–32574
3258–70235
Lineament densitykm/km20.2222.06132–1441
144–1562
156–1683
168–1804
180–1925
Erosion network densitykm/km20.1616.030.01–1.285
1.29–2.574
2.58–3.853
3.86–5.132
5.14–6.611
Surface
slopes
degrees0.1111.14Water1
Sands, gravels, pebbles, loams3
Clays, loams, sandy loams, sands2
Loams, crushed stones4
Sandstones, limestones, conglomerates1
Conglomerates, sandstones, siltstones1
Sandstones, porphyries, tuffs1
Shales, sandstones, limestones3
Gneisses, marbles, quartzites2
Granites, granite porphyries, gneisses5
Dunite, diorite, gabbro4
Distance from erosion networkm0.088.090.0–1.395
1.4–3.994
4.0–8.83
8.81–17.022
17.03–49.291
Precipitationmm/year0.033.370.01–0.115
0.12–0.204
0.21–0.293
0.30–0.382
0.39–0.641
Land cover0.021.99Water1
Rocks1
Salt marshes2
Bare ground3
Shrubs4
Vegetation5
Table 5. Classification of potential map zones and their area.
ClassificationArea
km2%
Very Low35.360.2
Low3290.9822.1
Medium6922.7246.5
High4009.0826.9
Very High627.474.3
14,885.61100
Disclaimer/Publisher’s Note: The statements, opinions and data contained in all publications are solely those of the individual author(s) and contributor(s) and not of MDPI and/or the editor(s). MDPI and/or the editor(s) disclaim responsibility for any injury to people or property resulting from any ideas, methods, instructions or products referred to in the content.