Article

Modeling the Evolution of Mechanical Behavior in Rocks Under Various Water Environments

1
PowerChina HuaDong Engineering Corporation Limited, Hangzhou 310014, China
2
College of Civil Engineering and Architecture, Jiaxing University, Jiaxing 311122, China
3
College of Landscape Architecture, Zhejiang A&F University, Hangzhou 311300, China
*
Author to whom correspondence should be addressed.
Water 2025, 17(20), 2983; https://doi.org/10.3390/w17202983
Submission received: 11 September 2025 / Revised: 11 October 2025 / Accepted: 14 October 2025 / Published: 16 October 2025

Abstract

After reservoir impoundment, water infiltration weakens rock strength and accelerates creep deformation. Existing models seldom capture both strength degradation and creep behavior under prolonged saturation. This study develops a coupled hydro-mechanical creep model that integrates saturation-dependent elastic modulus reduction, cohesion decay with pore pressure, and a nonlinear creep law modified by a Heaviside function. Simulation of rock deformation during water infiltration reveals that water–creep coupling increases steady-state deformation by over 50% compared to strength degradation alone. A case study of a high arch dam reservoir slope demonstrates that models incorporating both water-weakening and creep effects predict significantly larger deformations than those ignoring these mechanisms. The model provides a practical tool for predicting long-term deformation in reservoir slopes under water–rock interaction.

1. Introduction

The complex and variable water environment is a key influence on the safety of water resource project construction and operation [1,2]. The presence of water environments and their variability are two of the main causes of changes in the long-term and short-term mechanical behavior of rocks, which can lead to serious geohazards such as landslides and dike breaking [3]. Researchers have conducted extensive studies, and it is generally accepted that water can weaken the mechanical properties of rocks.
The influence of saturation on rock mass strength has received significant attention, and extensive research has been conducted on this topic. A brief review is provided here. Masoumi et al. [4] established a comprehensive set of empirical relationships describing the influence of water content on the mechanical properties of Gosford sandstone. They observed a consistent reduction in all mechanical parameters with increasing water content. Celik et al. [5] suggested that the presence of water is one of the primary factors responsible for the deterioration of rock. Mechanisms such as capillary action, water adsorption, and salt crystallization can significantly influence the deterioration process of rock materials. Kim et al. [6,7] studied the mechanical properties of basalt, tuff, and breccia through compression tests and scanning electron microscope analysis, combined with the water absorption process. The results show that the elastic modulus, cohesion, and angle of internal friction of the rock show a significant decreasing trend with the prolongation of the water absorption time, while the change rule of Poisson’s ratio shows a non-monotonous characteristic. Therefore, it is well-established that saturation profoundly degrades the mechanical behavior of rocks through multiple mechanisms.
Significant attention has also been paid to the effects of water pressure on the strength of saturated rock masses. Liu et al. [8] conducted uniaxial compression tests on saturated sandstone under varying seepage pressures and observed a significant decline in uniaxial compressive strength and peak strain with increasing pressure. They attributed this strength degradation primarily to reductions in effective stress and cohesion due to seepage. Wang et al. [9] combined triaxial tests with CFD-DEM simulations to study hydrodynamic coupling in weathered granite, finding that rising confining and fluid pressures promote the initiation and expansion of stable microcracks, thereby accelerating rock deterioration. Ciantia et al. [10] incorporated physical and geotechnical indices across multiple time scales to model physicochemical responses to water saturation, noting a rapid and sharp short-term strength loss when pore saturation occurs. In summary, the studies reviewed above consistently indicate that, despite variations in the degree of influence across different rock types, increased water pressure consistently exacerbates the deterioration of mechanical behavior in saturated rock masses.
In addition to static strength, the creep behavior of rocks under hydro-mechanical coupling has also drawn increasing research interest. Liu et al. [11] carried out uniaxial compression tests, as well as graded loading and unloading creep tests for variable saturation yellow sandstone, and further investigated the reloading creep behavior of variable saturation rock under the condition of cyclic water intrusion. The research results provide theoretical guidance for the prevention and control of creep landslides on steep rocky slopes caused by cyclic water intrusion. Gotzen et al. [12] conducted drained multi-stage creep tests on saturated Opalinus Clay and demonstrated that creep strain rates increase exponentially with differential stress, identifying two distinct thresholds associated with stress-related long-term strength and the onset of tertiary creep. Yang et al. [13] found that the creep behavior of shale rock samples with different water content can be exacerbated by the increase in water content. Sawatsubashi et al. [14] demonstrated through modified direct-shear creep tests that immersion-induced creep deformation in gravelly mudstone increases with higher creep stress ratios and lower initial water content or compaction, ultimately contributing to the deterioration of slope stability alongside slaking effects. Liu et al. [15] proposed a creep parameter inversion method that integrates the water effect and the mechanical properties of the rock to solve the problems of creep parameter inversion and long-term deformation prediction of near-dam slopes. The method systematically considered the transient effect of pore water pressure and the strength degradation characteristics of the water level fluctuation zone and saturated zone. Nara et al. [16] developed a method to evaluate the long-term strength (LTS) of rock under changing environmental conditions and demonstrated that LTS decreases sharply upon transition from air to water, approaching values observed under continuous water saturation.
After reservoir impoundment, water infiltration weakens rock strength and promotes time-dependent creep deformation. The underlying mechanisms involve three main aspects: saturation of initially unsaturated rock leading to strength reduction, pore water pressure increase that significantly diminishes cohesion while leaving the internal friction angle largely unaffected, and elevated saturation levels that accelerate creep deformation. To capture these coupled processes, this study develops a comprehensive model incorporating saturation-dependent strength degradation and a nonlinear creep law modified by a Heaviside function. The model is implemented in ABAQUS through user subroutines USDFLD and CREEP and validated against triaxial creep tests under varying moisture conditions. Furthermore, the model is applied to simulate rock specimen deformation during water infiltration and is extended to a practical engineering application, specifically assessing long-term deformation of a high arch dam reservoir slope under impoundment. This application confirms the model’s effectiveness in quantifying the combined effects of water-induced weakening and creep acceleration in slope stability analysis.

2. Experimental Data

The constitutive model and numerical implementation developed in this study are grounded in experimental data from the literature. This section summarizes the key experimental findings that form the basis of our theoretical framework.
The influence of saturation on rock mass strength has received significant attention [17]. Masoumi et al. [4] established a comprehensive set of empirical relationships describing the influence of water content on the mechanical properties of Gosford sandstone, observing a consistent reduction in all mechanical parameters with increasing water content. The experimental results show that the saturation degree has little effect on the angle of internal friction [18,19], so it is assumed that the angle of internal friction is constant when the saturation degree changes.
Significant attention has also been paid to the effects of water pressure. Liu et al. [8] conducted uniaxial compression tests on saturated sandstone under varying seepage pressures and observed a significant decline in uniaxial compressive strength and peak strain with increasing pressure, attributing this primarily to reductions in effective stress and cohesion. The cohesion-pore water pressure relationship curves for rock under high water pressure conditions [19] reveal that the angle of internal friction does not change significantly, whereas the cohesion c shows a linear attenuation tendency with the increase in the pore water pressure as shown in Figure 1.
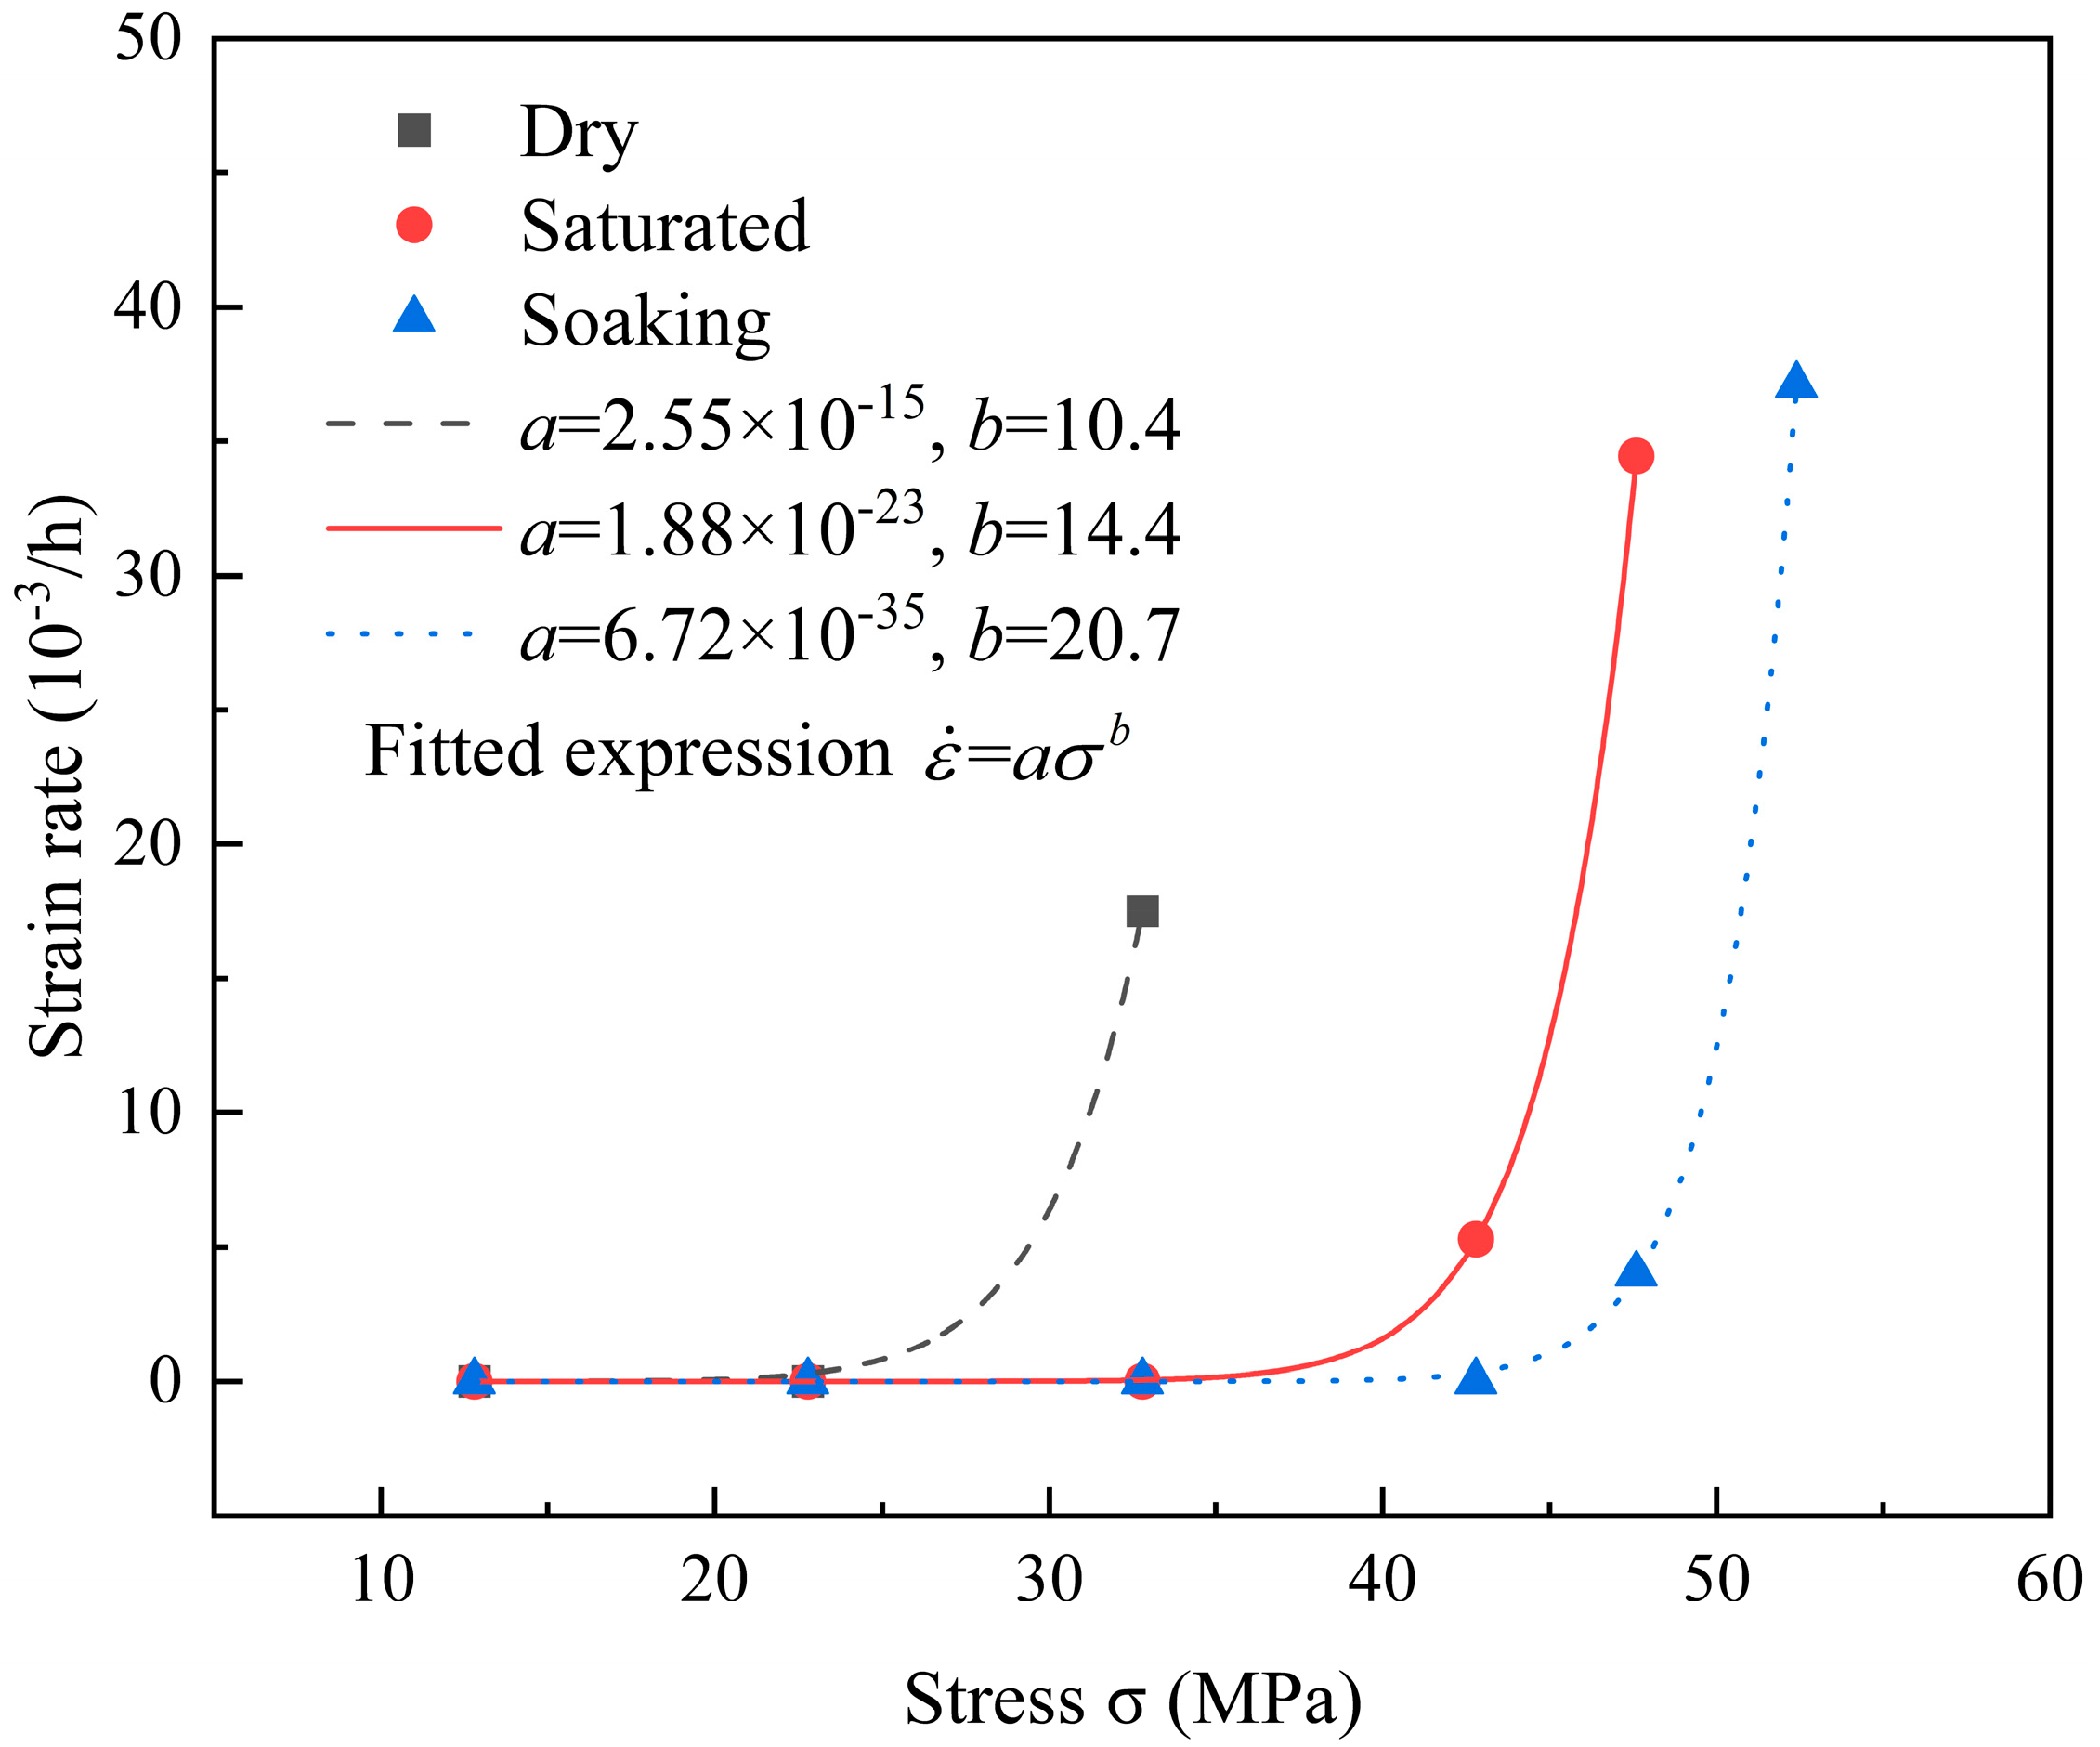
Regarding creep behavior, Yang et al. [13] conducted tests on shale with different water contents, systematically revealing the regulatory mechanism of water content on rock creep, which forms the primary validation dataset for our model. Yu et al. [20] demonstrated through red sandstone tests that the creep stress threshold in the saturated state can be up to twice that in the dry state, as shown in Figure 2, a key mechanism incorporated into our nonlinear creep model.

3. Theoretical Background

3.1. Saturation Effects on Rock Strength

The deterioration behavior of uniaxial compressive strength and modulus of elasticity for various rocks (e.g., sandstone, granodiorite) can be quantitatively characterized by the following functions [4,17,20,21]:
y = a e b s + m
where y is the uniaxial compressive strength or modulus of elasticity; s is the degree of saturation; and a, b, and m are the experimental fitting parameters. Crucially, experimental results indicate that the saturation degree has little effect on the angle of internal friction [18,19].
According to Equation (1), the variation rule of elastic modulus with saturation degree is as follows:
E = a e b s + m
where E is the modulus of elasticity when the rock is saturated with s. The above equation can be organized as:
E = 1 a a + m 1 e b s a + m
When the saturation degree is 0, the elastic modulus is E 0 = a + m , and the following expression for the decay of the elastic modulus with saturation degree is obtained:
E = 1 a E 0 1 e b s E 0
The shape of the yield surface in the meridional plane in the extended Drucker–Prager yield criterion is described by a linear function. The material parameters in the Drucker–Prager yield criterion can be converted by the Mohr–Coulomb criterion. The Mohr–Coulomb criterion and the parameter transformation for the three-dimensional problem are as follows:
tan β = 6 sin φ 3 sin φ
σ c = 2 c cos φ 1 sin φ
In order to obtain the evolution law of material parameters in the Drucker–Prager yield criterion under different water environments, the variation rule of material parameters with saturation for the Mohr–Coulomb criterion is first given:
τ = σ tan φ + c
where τ is the shear stress in any plane within the rock mass, σ is the normal compressive stress in that plane, c is the cohesive force, and φ is the angle of internal friction.
Express the positive and shear stresses on the sliding or shear surface in terms of the major and minor principal stresses σ 1 and σ 3 as follows:
τ = σ 1 σ 3 2 sin 2 α σ = σ 1 + σ 3 2 + σ 1 σ 3 2 cos 2 α
where α is the angle between the direction of the maximum principal stress σ 1 and the normal to the sliding surface.
For the damage surface, we have sin 2 α = cos φ and cos 2 α = sin φ , substituting Equation (8) into Equation (7):
σ 1 = 2 c cos φ + σ 3 1 + sin φ 1 sin φ
In the case of uniaxial compression, the stress σ 3 = 0 , and the uniaxial compressive strength σ c can be expressed as:
σ c = 2 c cos φ 1 sin φ
Since the angle of internal friction does not change with saturation, Equation (10) shows that the cohesion c is positively proportional to the uniaxial compressive strength σ c . Therefore, the decay law of cohesion c with the saturation s can also be expressed by Equation (1):
c = 1 a c 0 1 e b s c 0
where c is the cohesion of the rock with saturation degree s, the cohesion with saturation degree 0 is c 0 , a and b are the test fitting parameters. The relationship between uniaxial compressive strength σ c and saturation degree s can be obtained by substituting Equation (11) into Equation (10).
The shape of the yield surface in the meridional plane for the extended Drucker–Prager yield criterion is described by a linear function:
F = q p tan β d = 0
where q = 3 J 2 is the bias stress, J 2 = S 1 S 2 S 2 S 3 S 3 S 1 is the second invariant of the stress bias; p = 1 3 I 1 is the average stress, also known as the equivalent compressive stress, and I 1 = σ 1 + σ 2 + σ 3 is the first invariant of the stress tensor. β and d are material parameters related to the material cohesion c and the angle of internal friction φ . where d can be defined from the uniaxial compressive strength σ c :
d = 1 1 3 tan β σ c
Since the angle of internal friction φ does not vary with saturation, Equation (5) is a constant and Equation (13) decay relationship with saturation s can be expressed as:
d = 2 cos φ 1 sin φ 1 2 sin φ 3 sin φ c
where c is valued according to Equation (11).

3.2. Effects of Water Pressure on Rock Strength

The water-force coupled triaxial compression test [8,18] shows that the pore water pressure has a significant effect on the cohesion c of the rock and structural face, while the effect on the angle of internal friction f of the rock and structural face is relatively weak. The cohesion-pore water pressure relationship curves [19] for the rock under the high water pressure condition shown in Figure 1 further reveal that the angle of internal friction of rock does not change significantly with the fluctuation of the pore water pressure, whereas the cohesion c shows a linear attenuation tendency with the increase in the pore water pressure.
Based on the above test results, the relationship between cohesion c and pore water pressure u w after saturation of the rock is as follows:
c = k u w + c 1
where c is the cohesion at pore water pressure u w . The cohesion at 0 pore water pressure after saturation of the rock is c 1 , and k is the test fitting parameter.

3.3. Nonlinear Creep Modeling of Rock Under Water Action

Different improvements of the power function model can be used to describe thecreep deformation of mudstone [20]. Its basic form is:
ε ¯ ˙ t = A σ ¯ e q n t m
where ε ¯ ˙ t is the creep strain rate at creep time t, σ ¯ e q m is the equivalent creep stress, and A, m and n are the creep test fitting parameters.
For the basic form of the power function model, the creep strain at time t is when the stress is held constant:
ε ¯ = A σ ¯ e q n 1 m + 1 t m + 1
Further study reveals that the threshold is rock state dependent: as shown in the red sandstone tests [20] (Figure 2), the creep stress threshold in the saturated state can be up to twice that in the dry state. This mechanism is an important revelation for the extra-high arch dam project: the infiltration of reservoir water into the rock of the bank slope after impoundment leads to the transformation of the unsaturated zone to the saturated zone, which in turn induces the continuous time-lapse contraction and deformation of the valley amplitude in the dam site area, a phenomenon that is directly related to the evolution of the creep behavior due to the migration of the threshold value.
On the basis of the above analysis, the Heaviside function, which takes into account the saturation of the rock mass, is introduced:
H σ e q σ e q * s , t t * = 1 ,   σ e q σ e q * s , t t * s H σ e q σ e q * s , t t * = 0 ,   σ e q σ e q * s , t > t * s H σ e q σ e q * s , t t * = 1 ,   σ e q > σ e q * s
where σ e q * s is the equivalent creep stress threshold at saturation s, t is the creep duration, and t * s is the time for the creep rate to decay to 0 when the equivalent creep stress is less than the threshold σ e q * s .
The nonlinear creep model of rock under water action is as follows:
ε ¯ ˙ t = A σ ¯ e q n t m H σ e q σ e q * s , t t * s m = F s = B s + C
where A, B, C, m and n are creep material parameters that can be determined by fitting creep experimental data.
In the case of constant creep stress and constant rock saturation, m can reflect the change in creep rate: when m > 0 , it describes the accelerated creep; when m = 0 , it indicates the steady state creep; when 1 < m < 0 , it presents the attenuated creep. In this paper, the function F s = B s + C is used to describe the evolution of m with the saturation of the rock mass.

4. Numerical Implementation

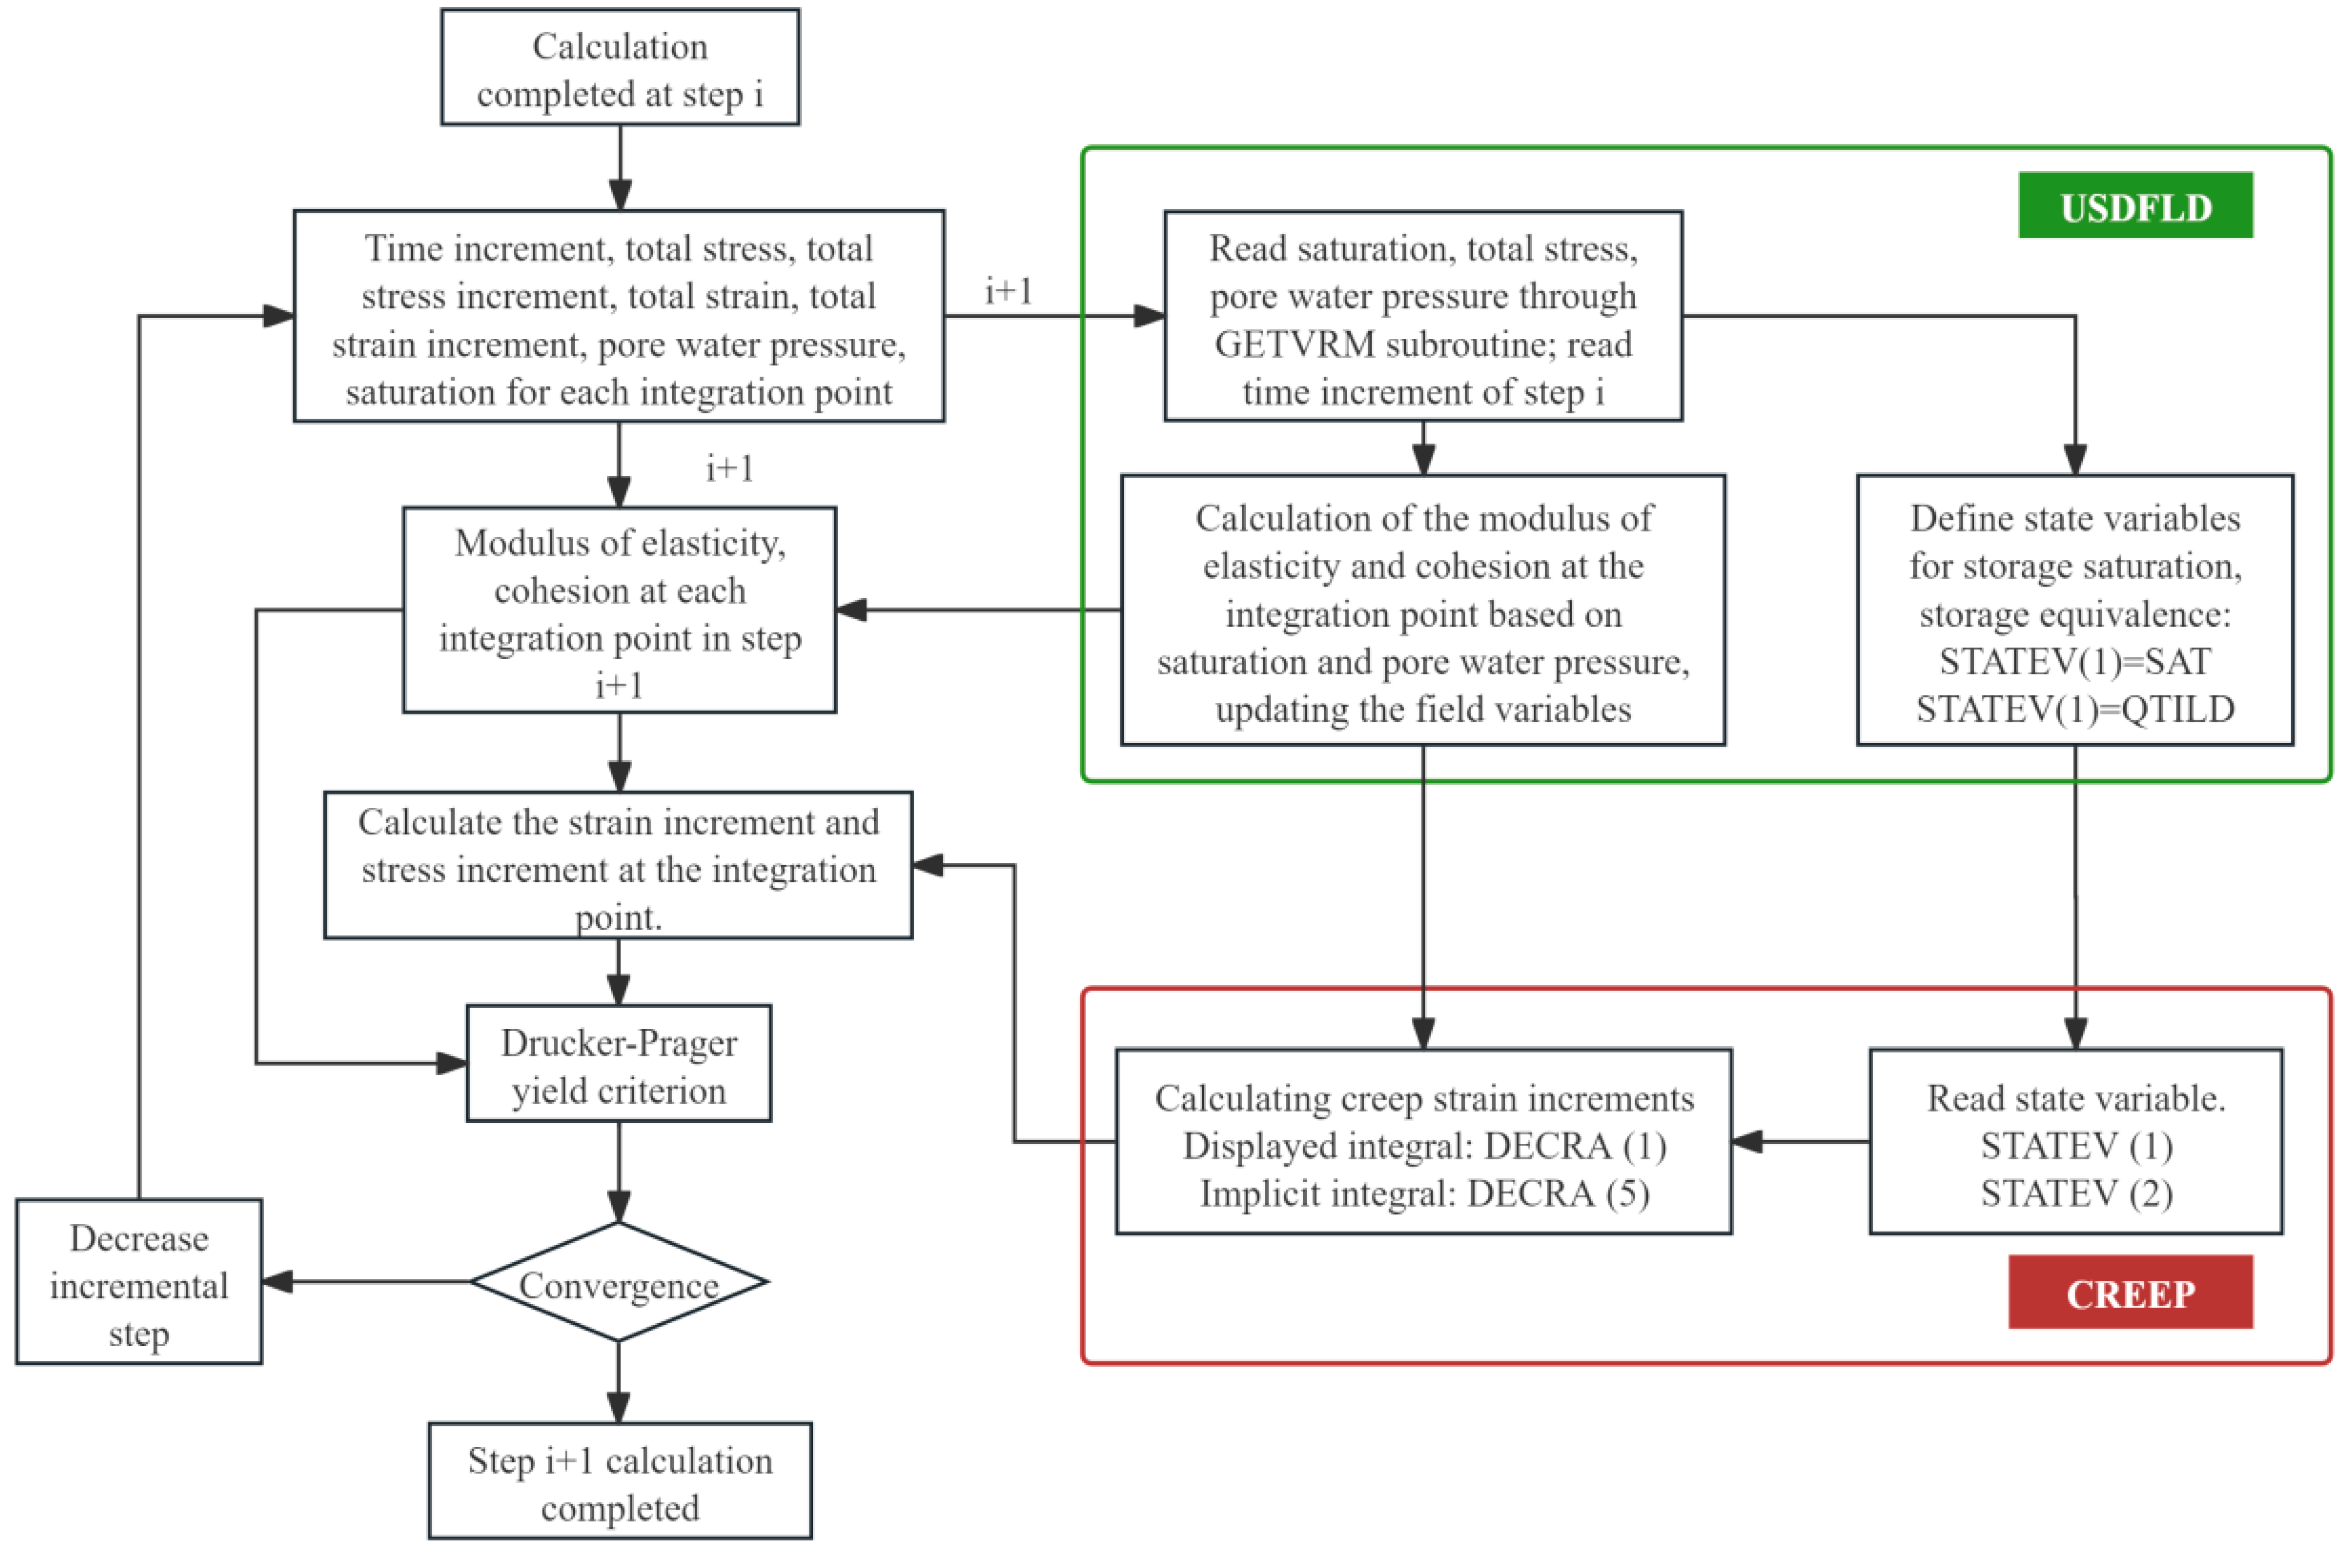
Based on the user-defined CREEP subroutine interface provided by ABAQUS, coupled with the USDFLD field variable updating function, a nonlinear creep model can be constructed to dynamically evolve with saturation and characterize the continuous degradation behaviors of elastic modulus, cohesion, and other parameters with saturation. CREEP subroutine-related variables are defined as follows:
QTILD: equivalent creep stress, selected according to different plasticity modes.
STATEV: state variable, sharing data with the USDFLD subroutine, e.g., evolution of creep material parameters with saturation.
DECRA: equivalent creep strain rate, selected according to different plasticity modes. When the power function basic model Equation (16) is used, for displaying the integral DECRA (1):
Δ ε ¯ = A 1 + m σ ¯ e q n t m + 1 t Δ t m + 1
For the implicit integral DECRA (5):
Δ ε ¯ σ ¯ e q = n A 1 + m σ ¯ e q n 1 t m + 1 t Δ t m + 1
The deterioration process of the rock under different water environments is implemented as follows:
(1)
In step i, the ABAQUS main program provides the following at each integration point: time increment, total stress and its increment, total strain and its increment, pore water pressure, and saturation.
(2)
In step i+1, the USDFLD subroutine retrieves saturation and pore water pressure from step i via the GETVRM utility. Depending on saturation (SAT): if SAT < 1, elastic modulus and cohesion are degraded per Equation (4) and Equation (14); if SAT = 1, elastic modulus remains unchanged and cohesion is updated via Equation (15). The saturation is stored as STATEV (1) = SAT, and equivalent stress as STATEV (2) = QTILD for sharing with the CREEP subroutine.
(3)
Material parameters (elastic modulus and cohesion) are updated at each integration point based on the current saturation.
(4)
The CREEP subroutine reads saturation and equivalent stress from STATEV (1) and STATEV (2), assigns creep model parameters, and computes strain increments (e.g., DECRA (1) and DECRA (5)).
(5)
Total strain and stress increments are computed using updated material parameters and creep strain increments.
(6)
The main program performs equilibrium iteration using the D-P yield criterion. If convergence is achieved, it proceeds to the next step; otherwise, the step size is reduced and iterated until the i+1th step is completed.
The implementation process is shown in Figure 3.

5. Numerical Results

5.1. Model Validation

The triaxial creep test of shale with variable water content was carried out in the literature [13]. The reliability of the proposed nonlinear creep model for unsaturated rocks under continuous saturation gradient is verified by numerically reproducing this test process.
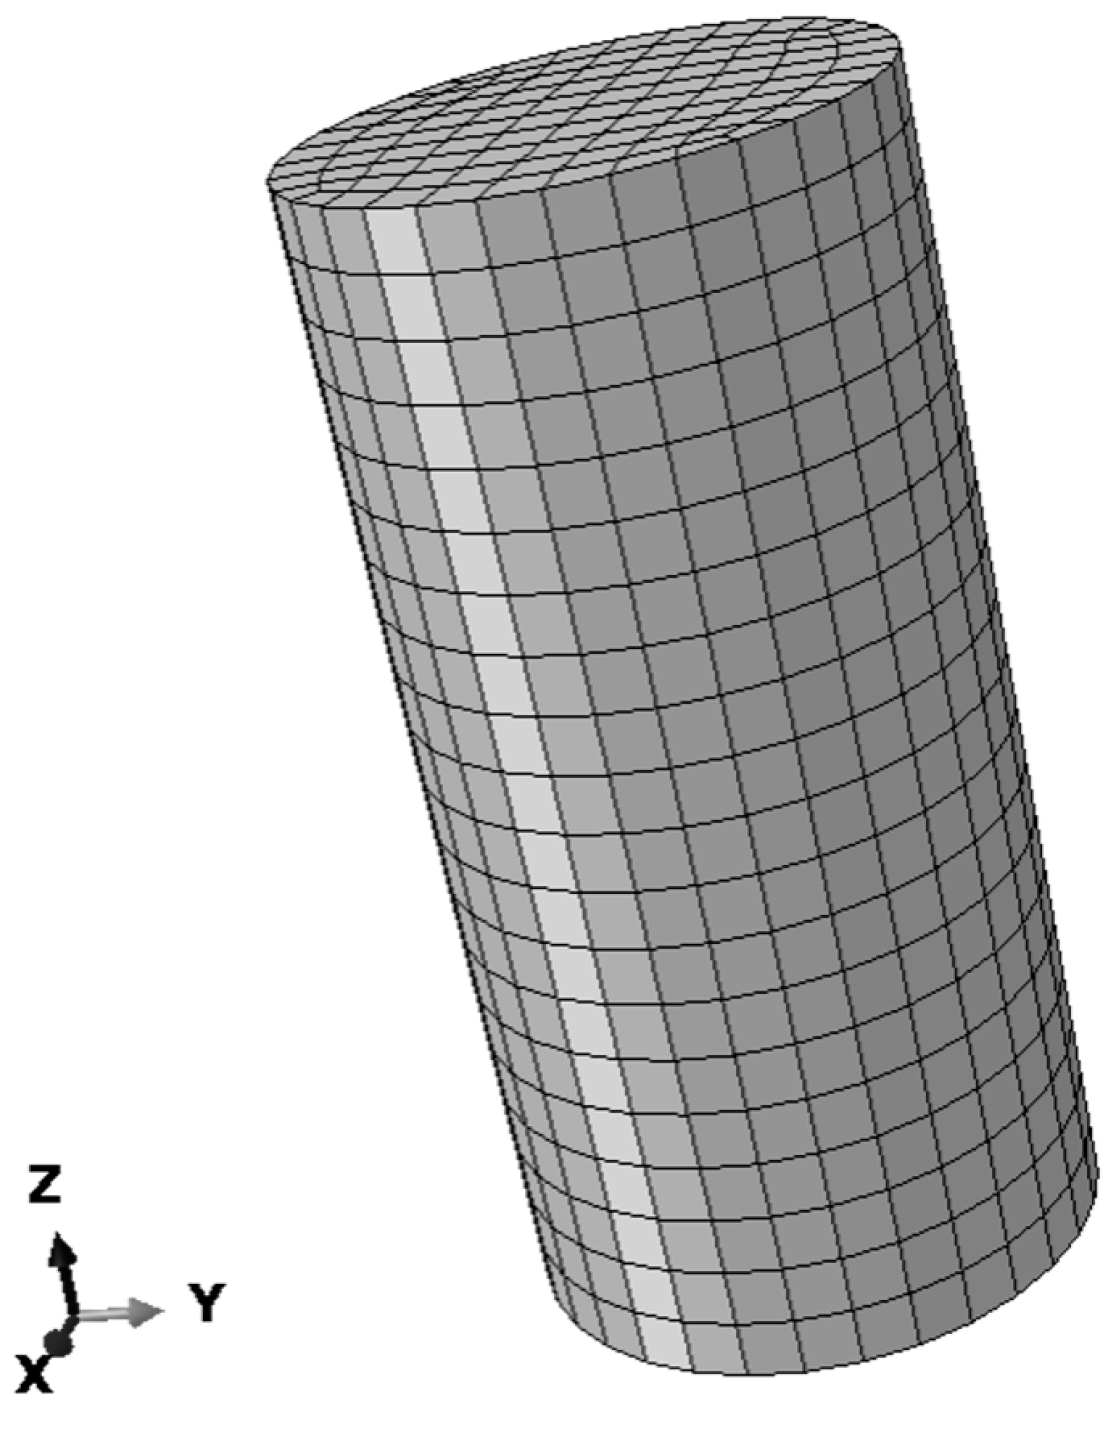
The numerical specimen was discretized into 1920 C3D8P elements (2373 nodes) with a cylindrical geometry (Diameter 50 mm × Height 100 mm), as shown in Figure 4. The boundary conditions for the numerical specimen were set as follows: a fixed displacement constraint at the bottom; and the application of confining pressure, top mechanical load, and top water pressure as specified in the subsequent cases. Simulations addressed three saturation states: dry (s = 0), partially saturated (s = 0.34%), and saturated (s = 2.1%). Material properties were assigned as follows: Elastic modulus: 27.16 GPa (dry), 18.52 GPa (partial), 22.96 GPa (saturated); Uniaxial compressive strength: 117.26 MPa (dry), 106.83 MPa (partial), 77.39 MPa (saturated); Poisson’s ratio: 0.25; Friction angle: 23.21°; Density: 2700 kg/m3; Initial saturation distribution: 0.1%; Initial void ratio: 0.03. The compressibility of the solid material is neglected, meaning that volumetric changes in the porous medium are attributed solely to changes in pore volume.
Under the loading conditions of the test conditions, none of the simulations showed σ e q > σ e q * s , which can be taken as σ e q * = 100 MPa. According to the results of the creep tests with different water contents, the saturation degree can be converted from the water content, defined t * s = D s + F where D and F are the experimental fitting parameters.
The parameters of the nonlinear creep model of the rock under different water contents are shown in Table 1.
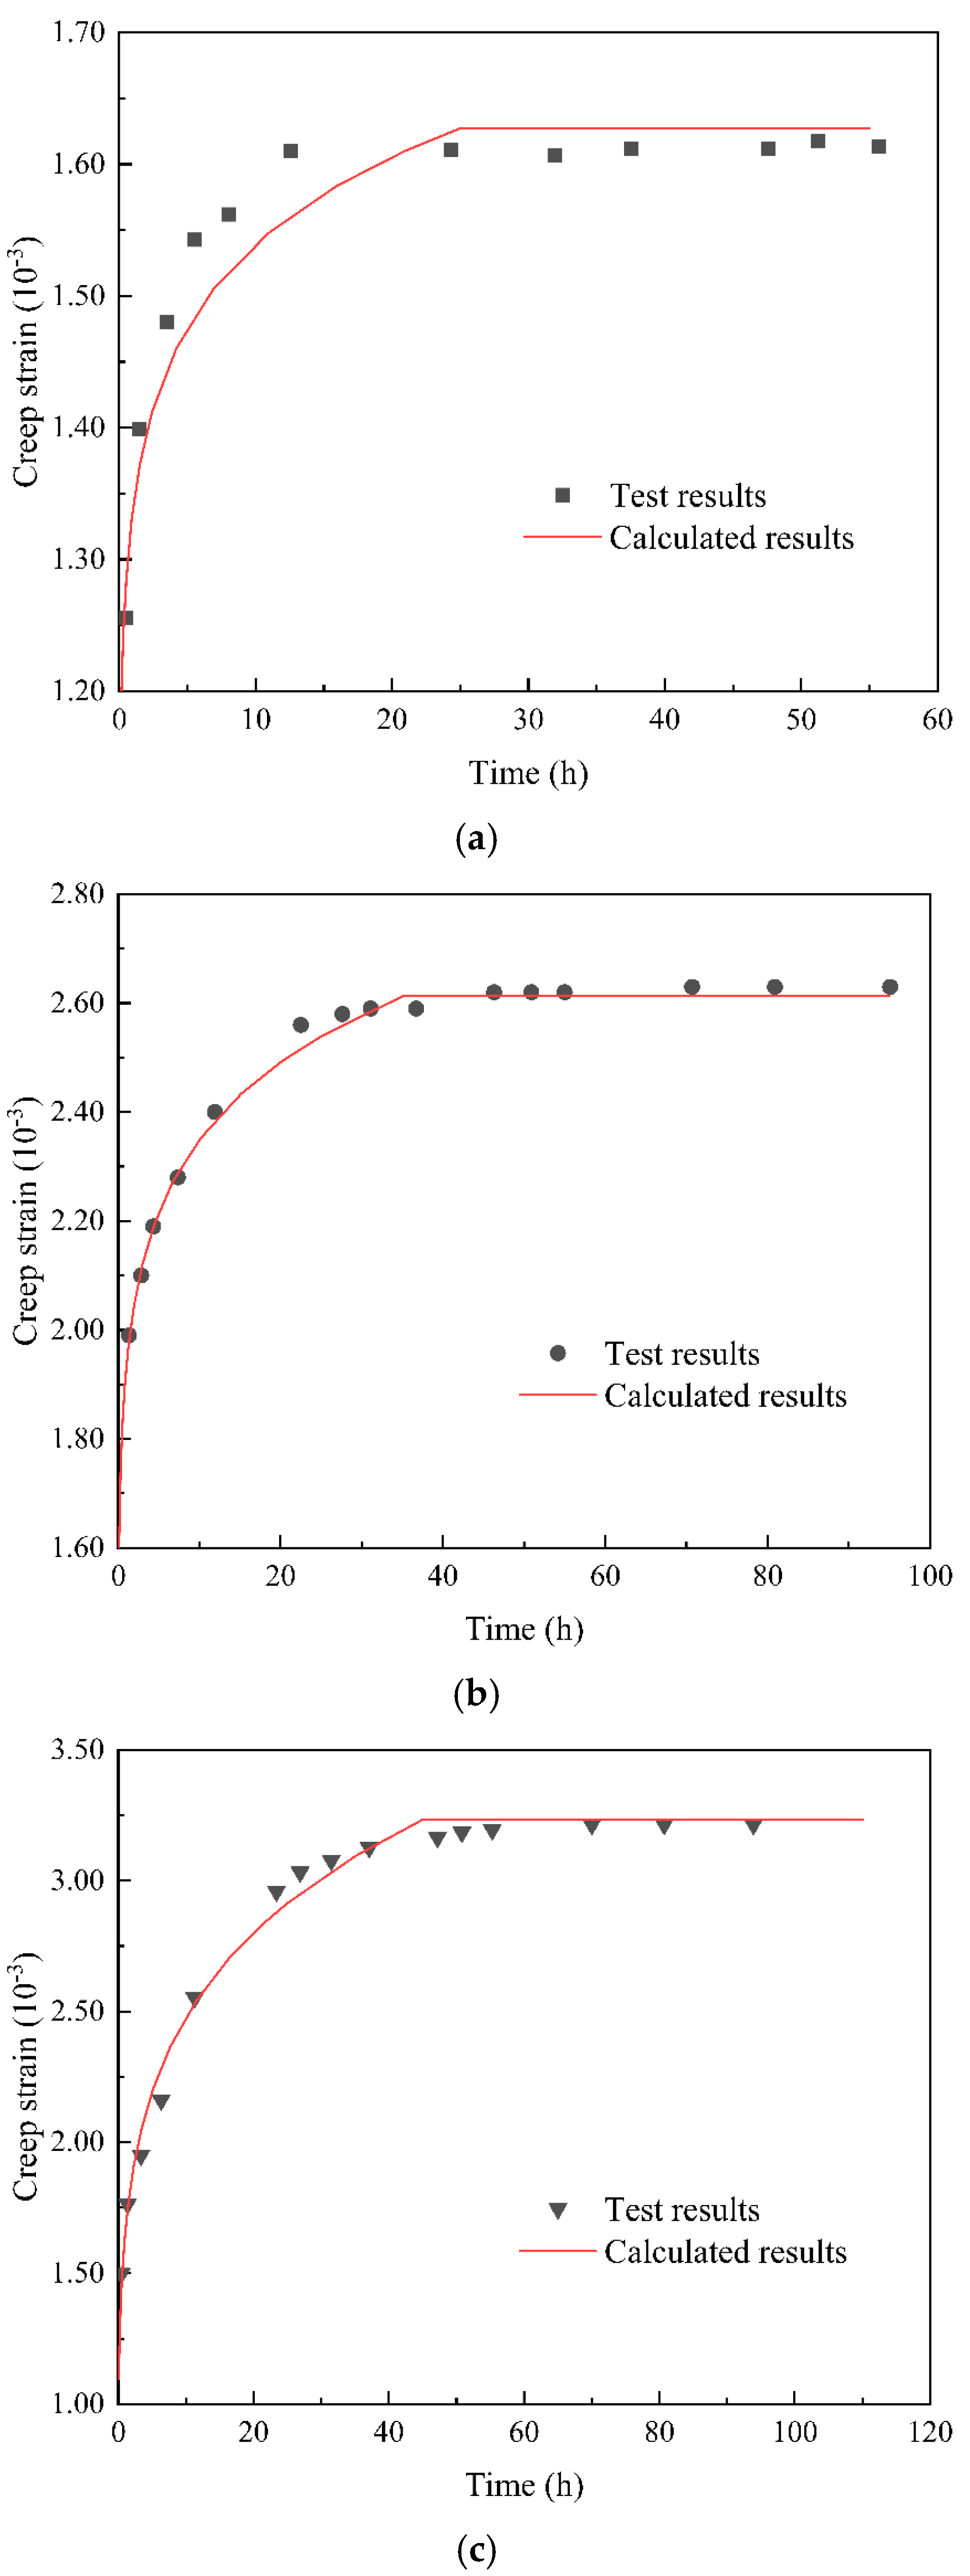
The numerical simulation results of creep with the test results [13] at axial pressure of 34 MPa and peripheral pressure of 2 MPa are shown in Figure 5. The experimental data points in Figure 5 were digitized from the published creep curves of Yang et al. [13], who conducted triaxial creep tests under controlled saturation and loading conditions. The data represent discrete measurements of axial strain over time, as recorded by the testing apparatus. The model effectively captures the creep behavior across different saturation levels. The observed trends, where higher saturation leads to increased creep strain, align with established experimental findings [20]. A minor discrepancy is noted in Figure 5a for the dry specimen between 3 and 20 h, where the model predicts a slightly faster decay of the creep rate than observed experimentally. This is likely due to simplified assumptions in the model regarding the microstructural adjustments in dry rock during the early transient creep phase, which could be refined in future work. In this test, the modulus of elasticity shows a weakening trend with the increase in saturation, and the compressive strength also decreases with the increase in saturation. The values of modulus of elasticity and compressive strength in the test are used in the numerical calculations.
As shown in Figure 5, the numerical simulation results are in high agreement with the experimental data, confirming the effective ability of the proposed nonlinear creep model to characterize the creep behavior of rock with variable saturation. Under loading, the rock first generates transient elastic strain; when the external load is lower than the equivalent creep stress threshold, the creep deformation rate decreases with time and decays to the steady state after time t * s (dry state: t = 26 h; partially saturated state: t = 33 h; saturated state: t = 45 h), which is consistent with the experimental observation. This result verifies the rationality of the creep constitutive model of unsaturated rock under the full saturation condition.

5.2. Rock Deformation During Water Infiltration Process

Modulus of elasticity 300 MPa, Poisson’s ratio 0.25, angle of internal friction 18°, cohesion 0.3 MPa, A = 1.02 × 10 21 , n = 3 , m = 3 . The equivalent creep stress threshold is defined to vary linearly with the saturation degree σ e q * = D s + F . The relevant parameters for the evolution of the material parameters are shown in Table 1.
Set the initial saturation degree to 0.1, with the top having unpressurized water immersion and the bottom and surrounding area being impermeable, the axial pressure to 0.6 MPa, and the peripheral pressure to 0.1 MPa. Three scenarios were analyzed:
Condition 1: The elastic modulus of the rock mass was reduced by water, while creep deformation remained unaffected.
Condition 2: The elastic modulus of the rock mass was reduced by water, and creep deformation was water-independent.
Condition 3: Both water-induced reduction in the elastic modulus and water-dependent creep deformation were considered.
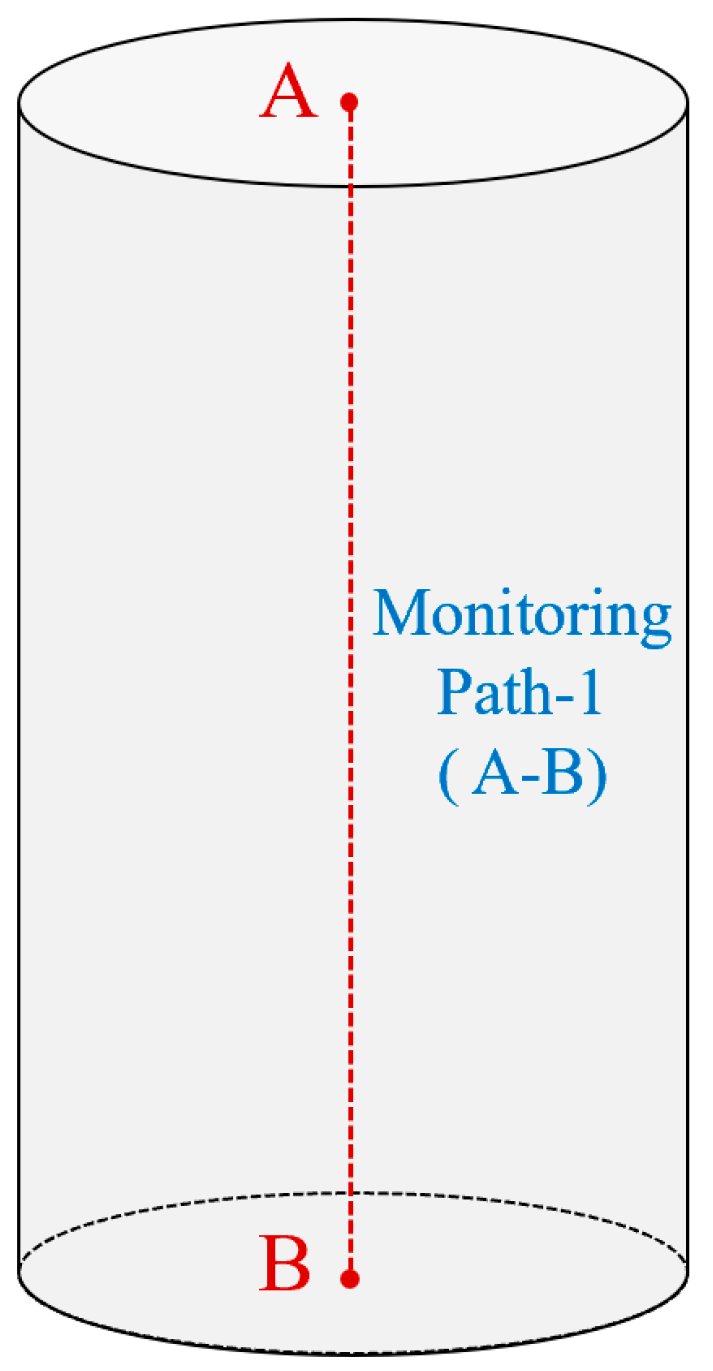
Monitoring Path-1 (A–B) was arranged along the central axis of the cylindrical specimen, with monitoring point A located at the center of the top surface and point B at the center of the bottom surface, as shown in Figure 6.
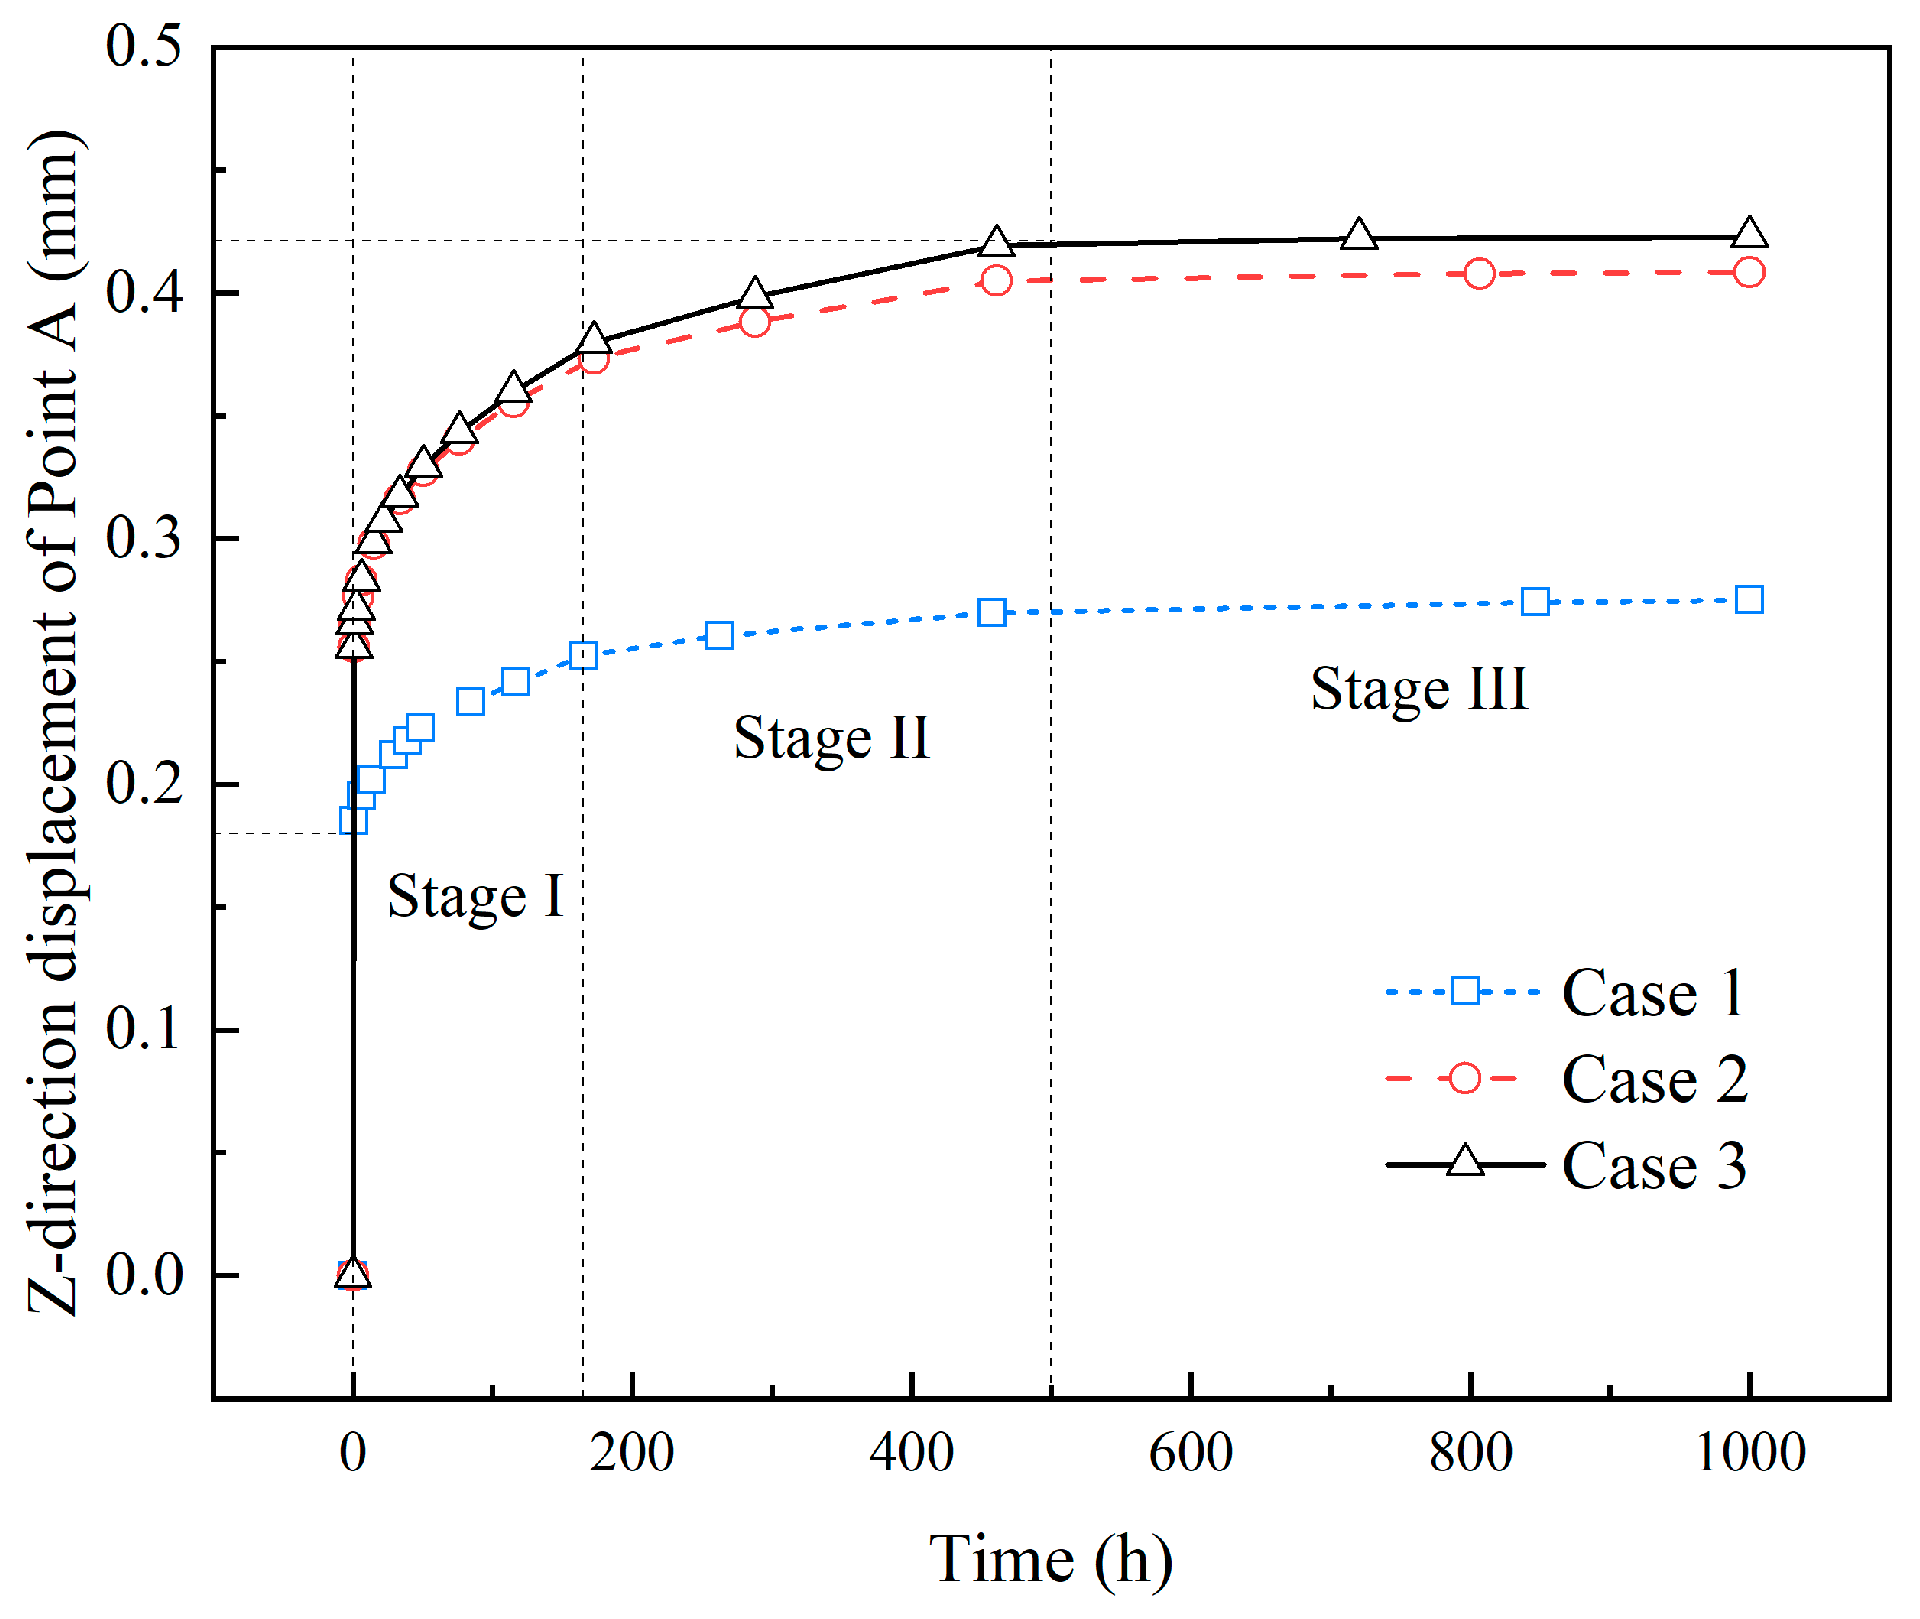
The Z-displacement at Point A under different working conditions is shown in Figure 7. Overall, in Condition 1, where creep behavior was not considered, long-term water immersion resulted in a deterioration of the elastic modulus. Macroscopically, this was reflected as a gradual increase in axial deformation, which eventually stabilized after a certain period, with a recorded final deformation of 0.27 mm. On the basis of Condition 1, Condition 2 incorporated the inherent time-dependent deformation mechanism of the rock (i.e., creep). The superposition of creep led to a significant increase in total deformation, with the final stabilized value reaching 0.40 mm. Furthermore, Condition 3 took into account the enhancing effect of water on the creep behavior of the rock. Under this water-creep coupling effect, the axial deformation became more pronounced than in Condition 2, and the final stabilized deformation further increased to 0.42 mm.
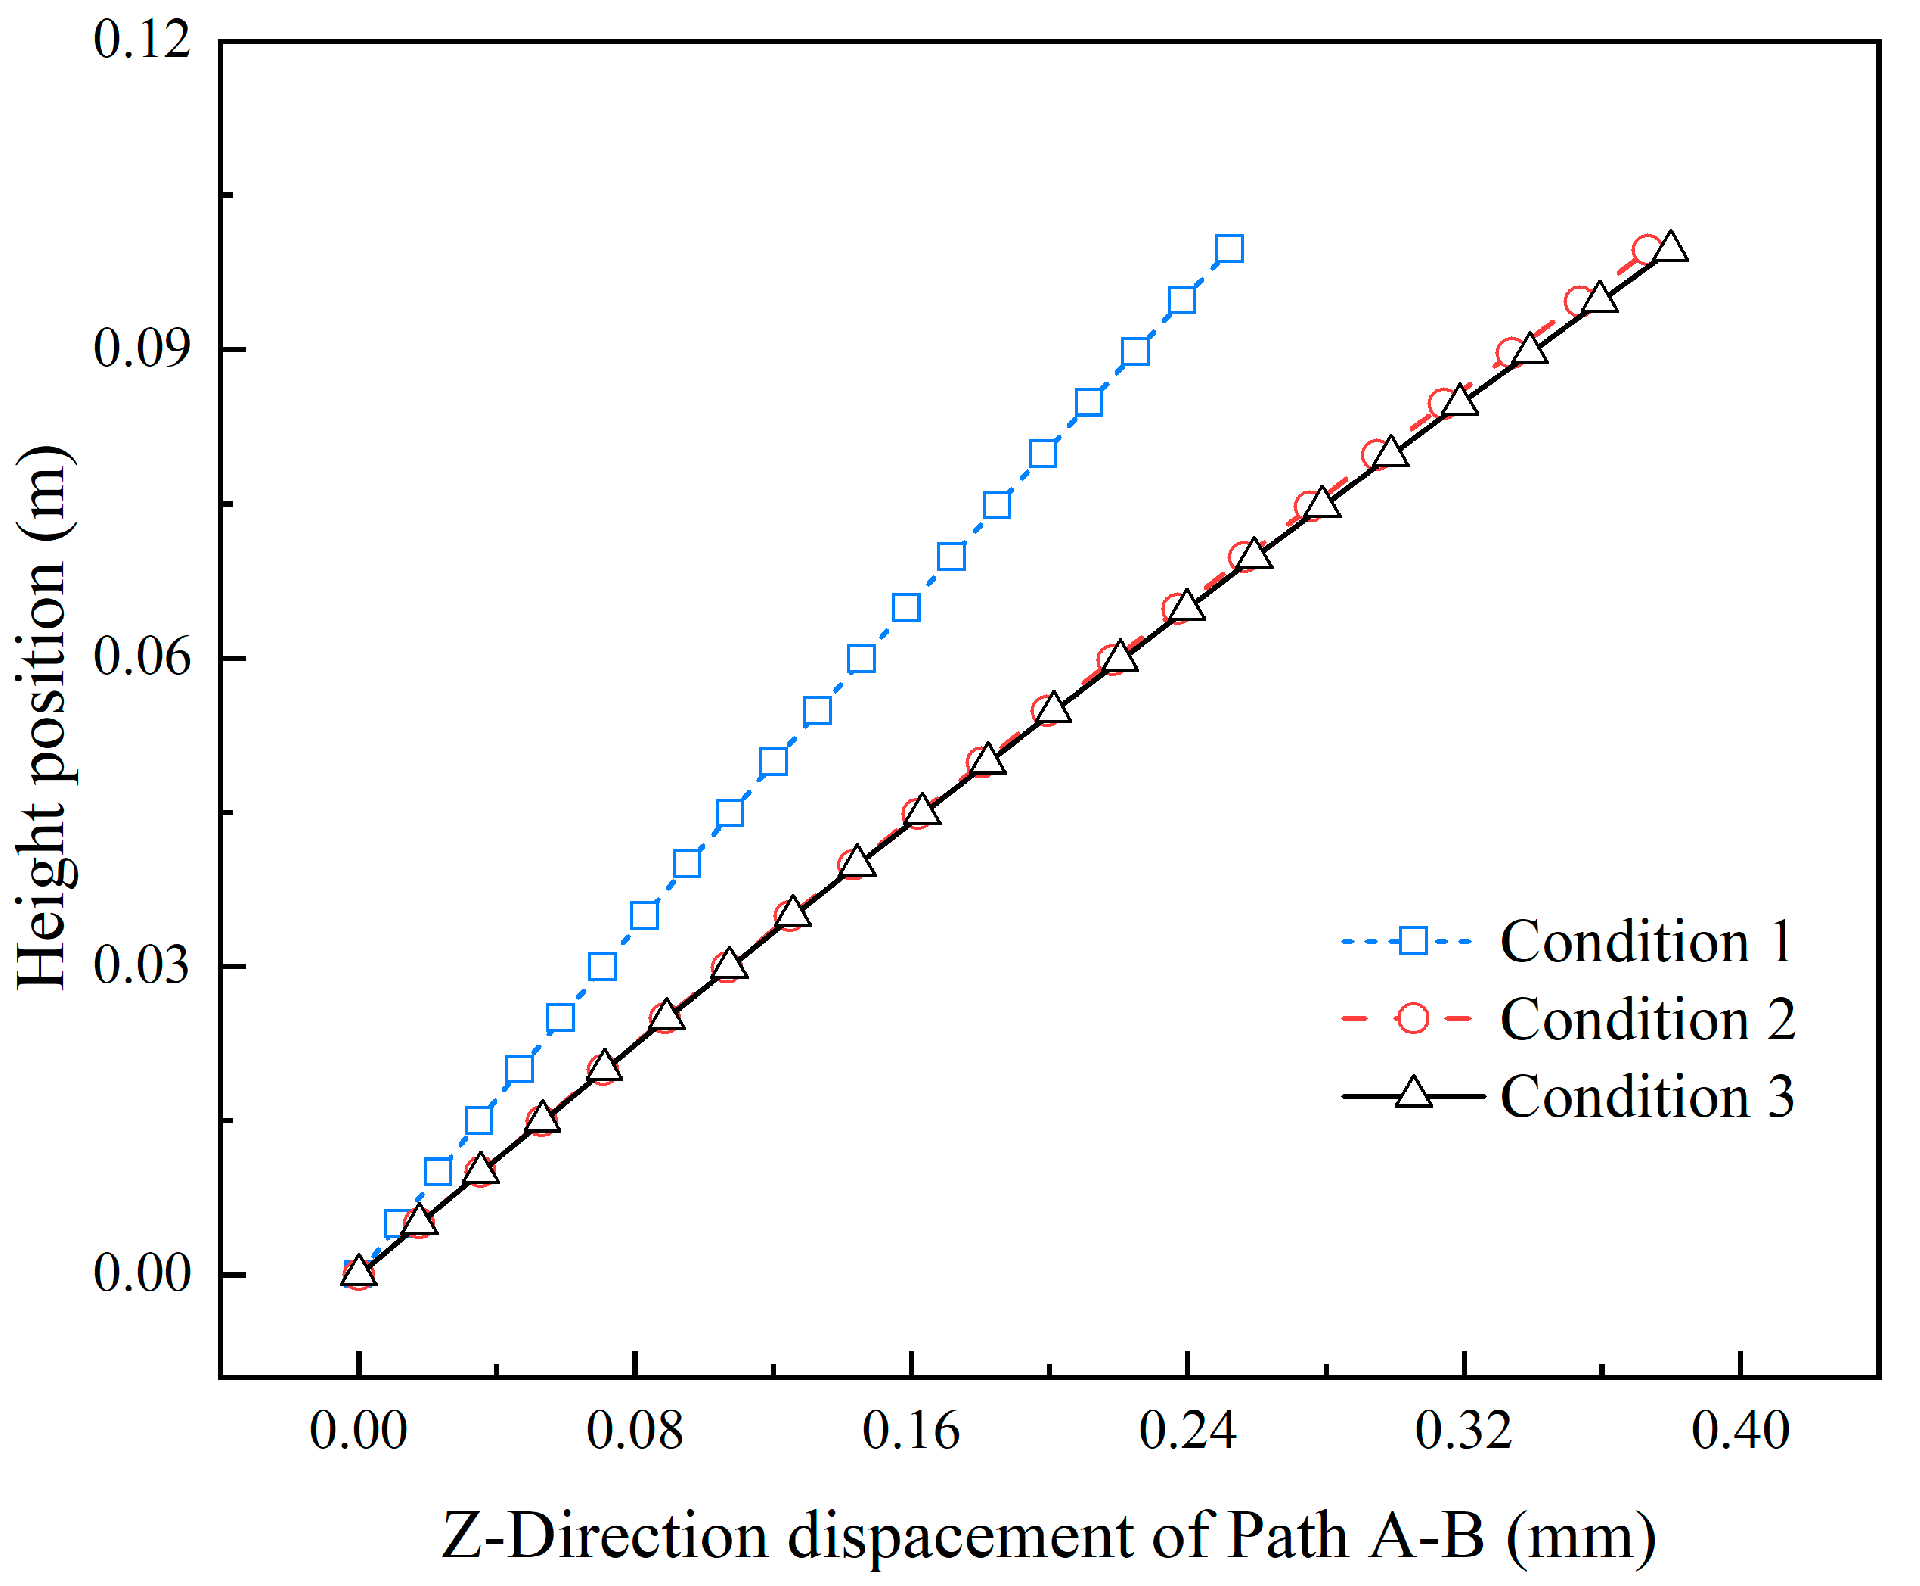
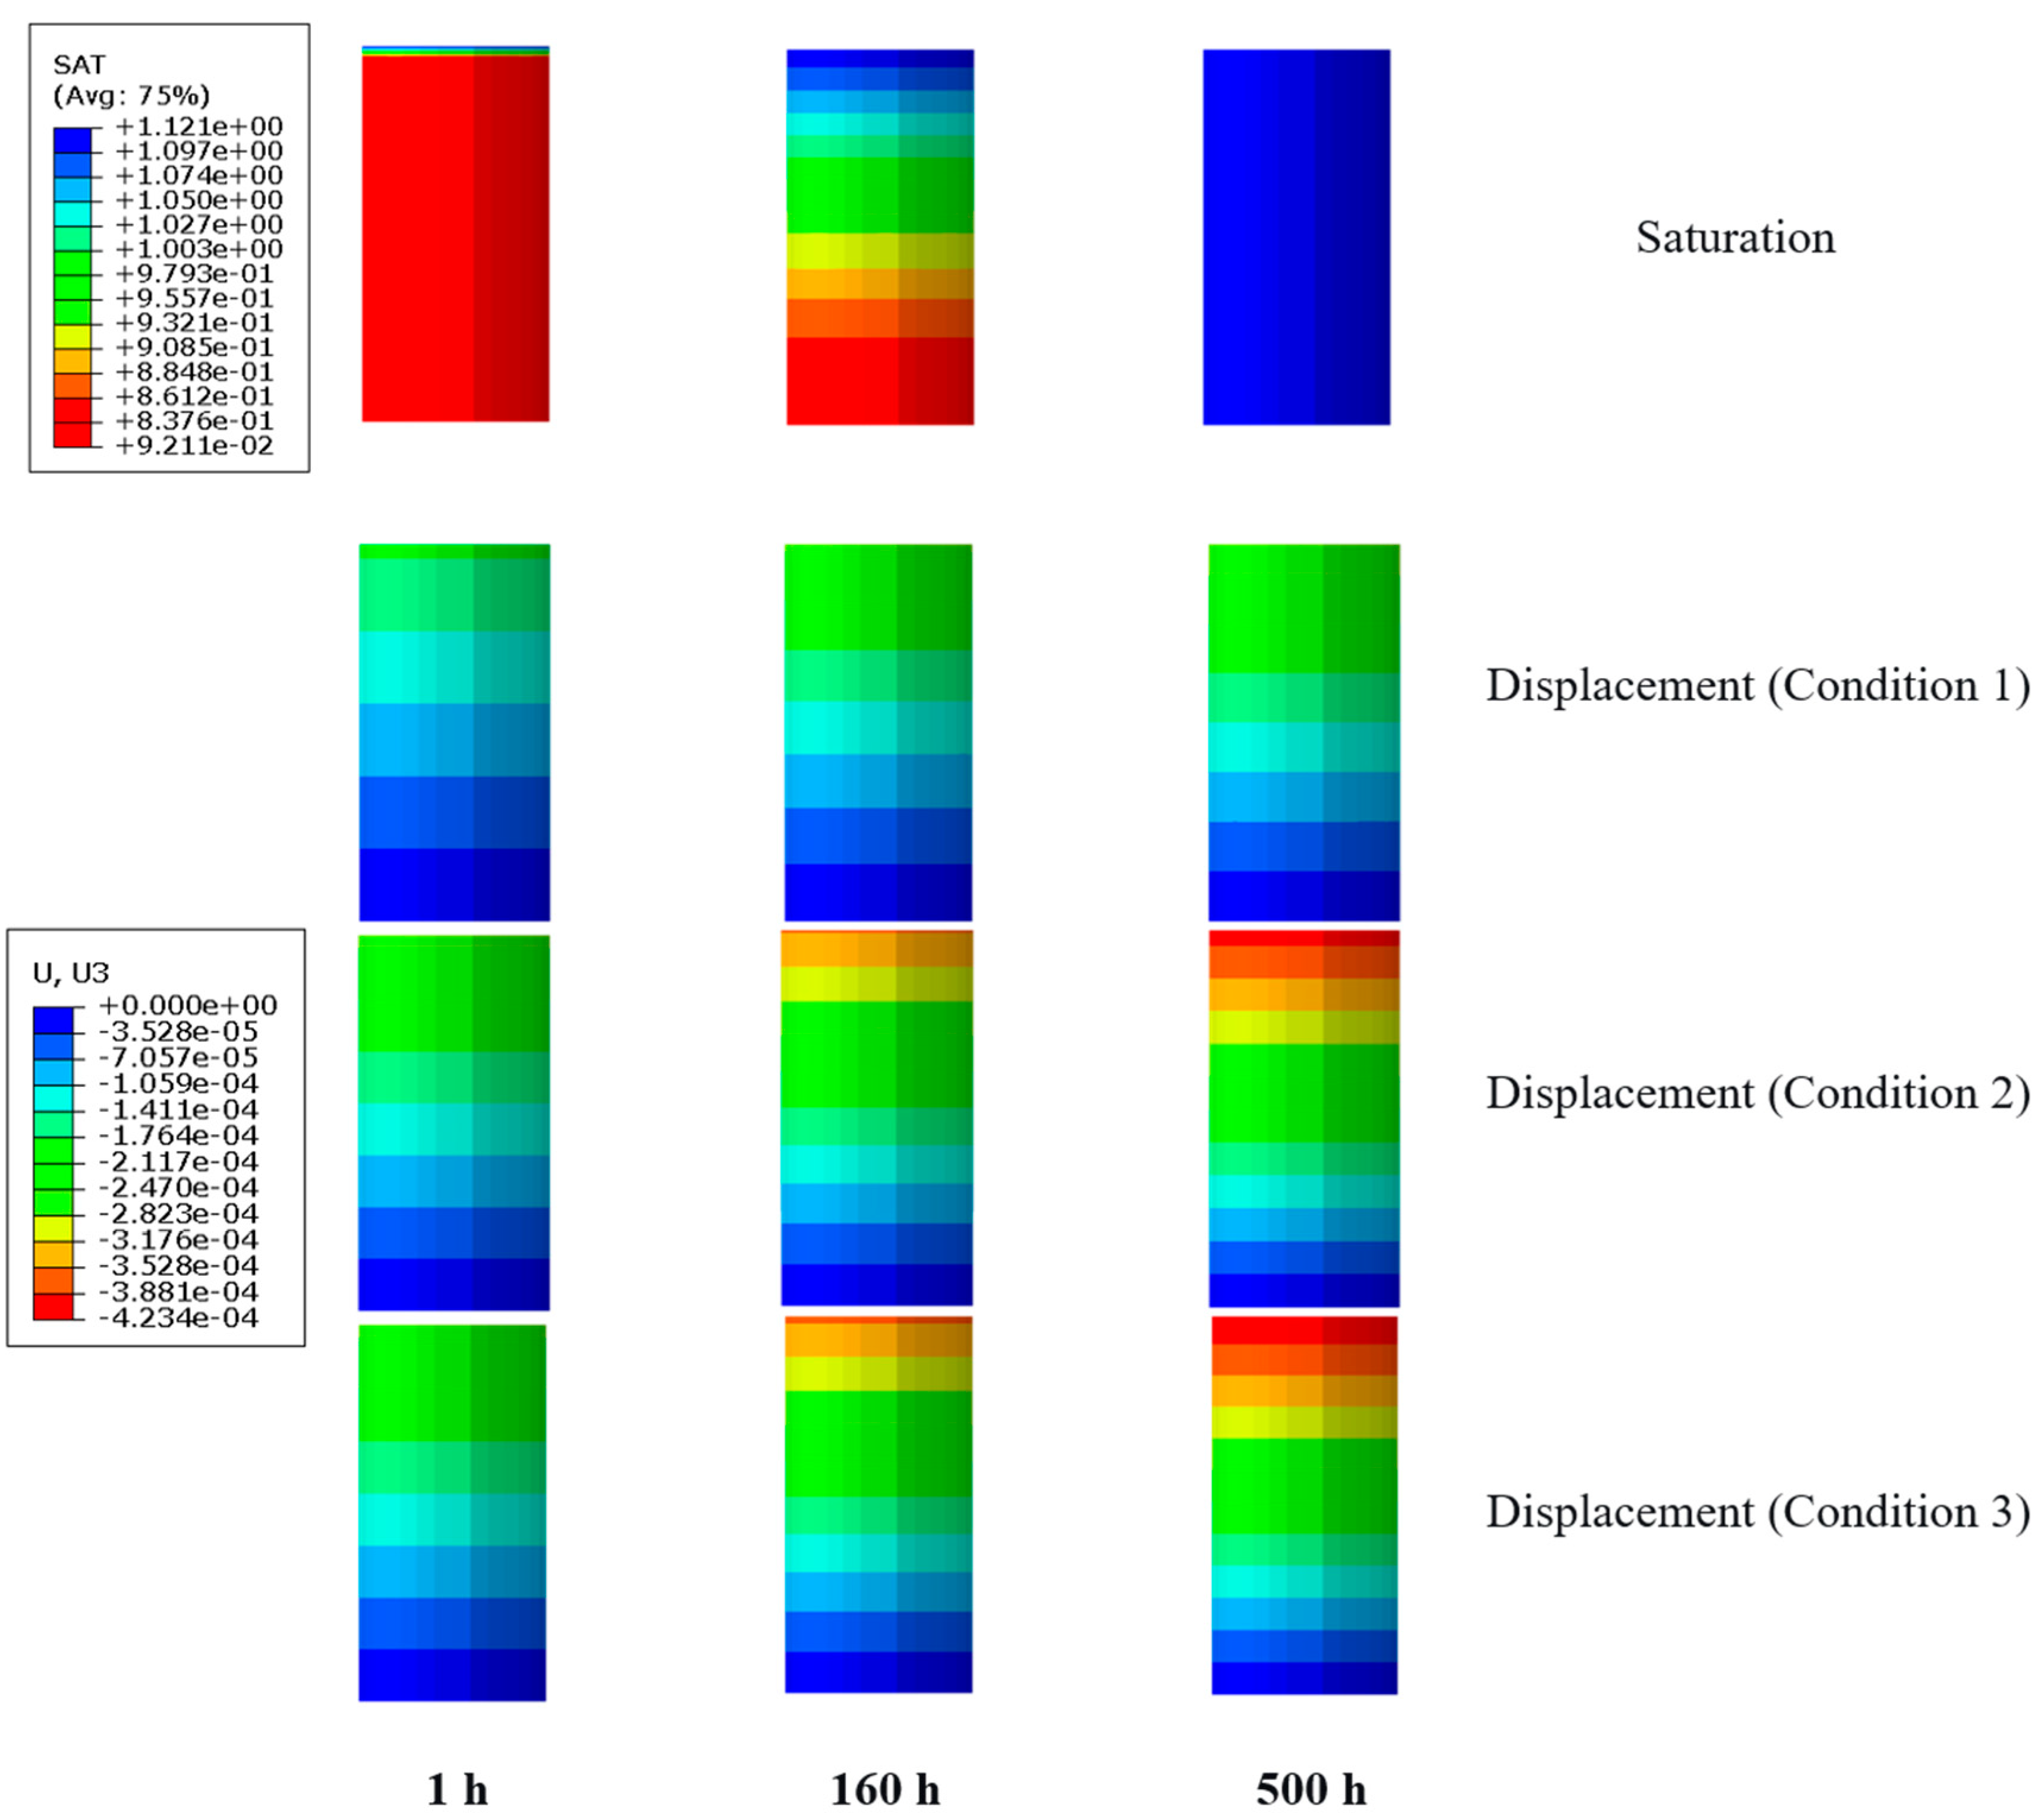
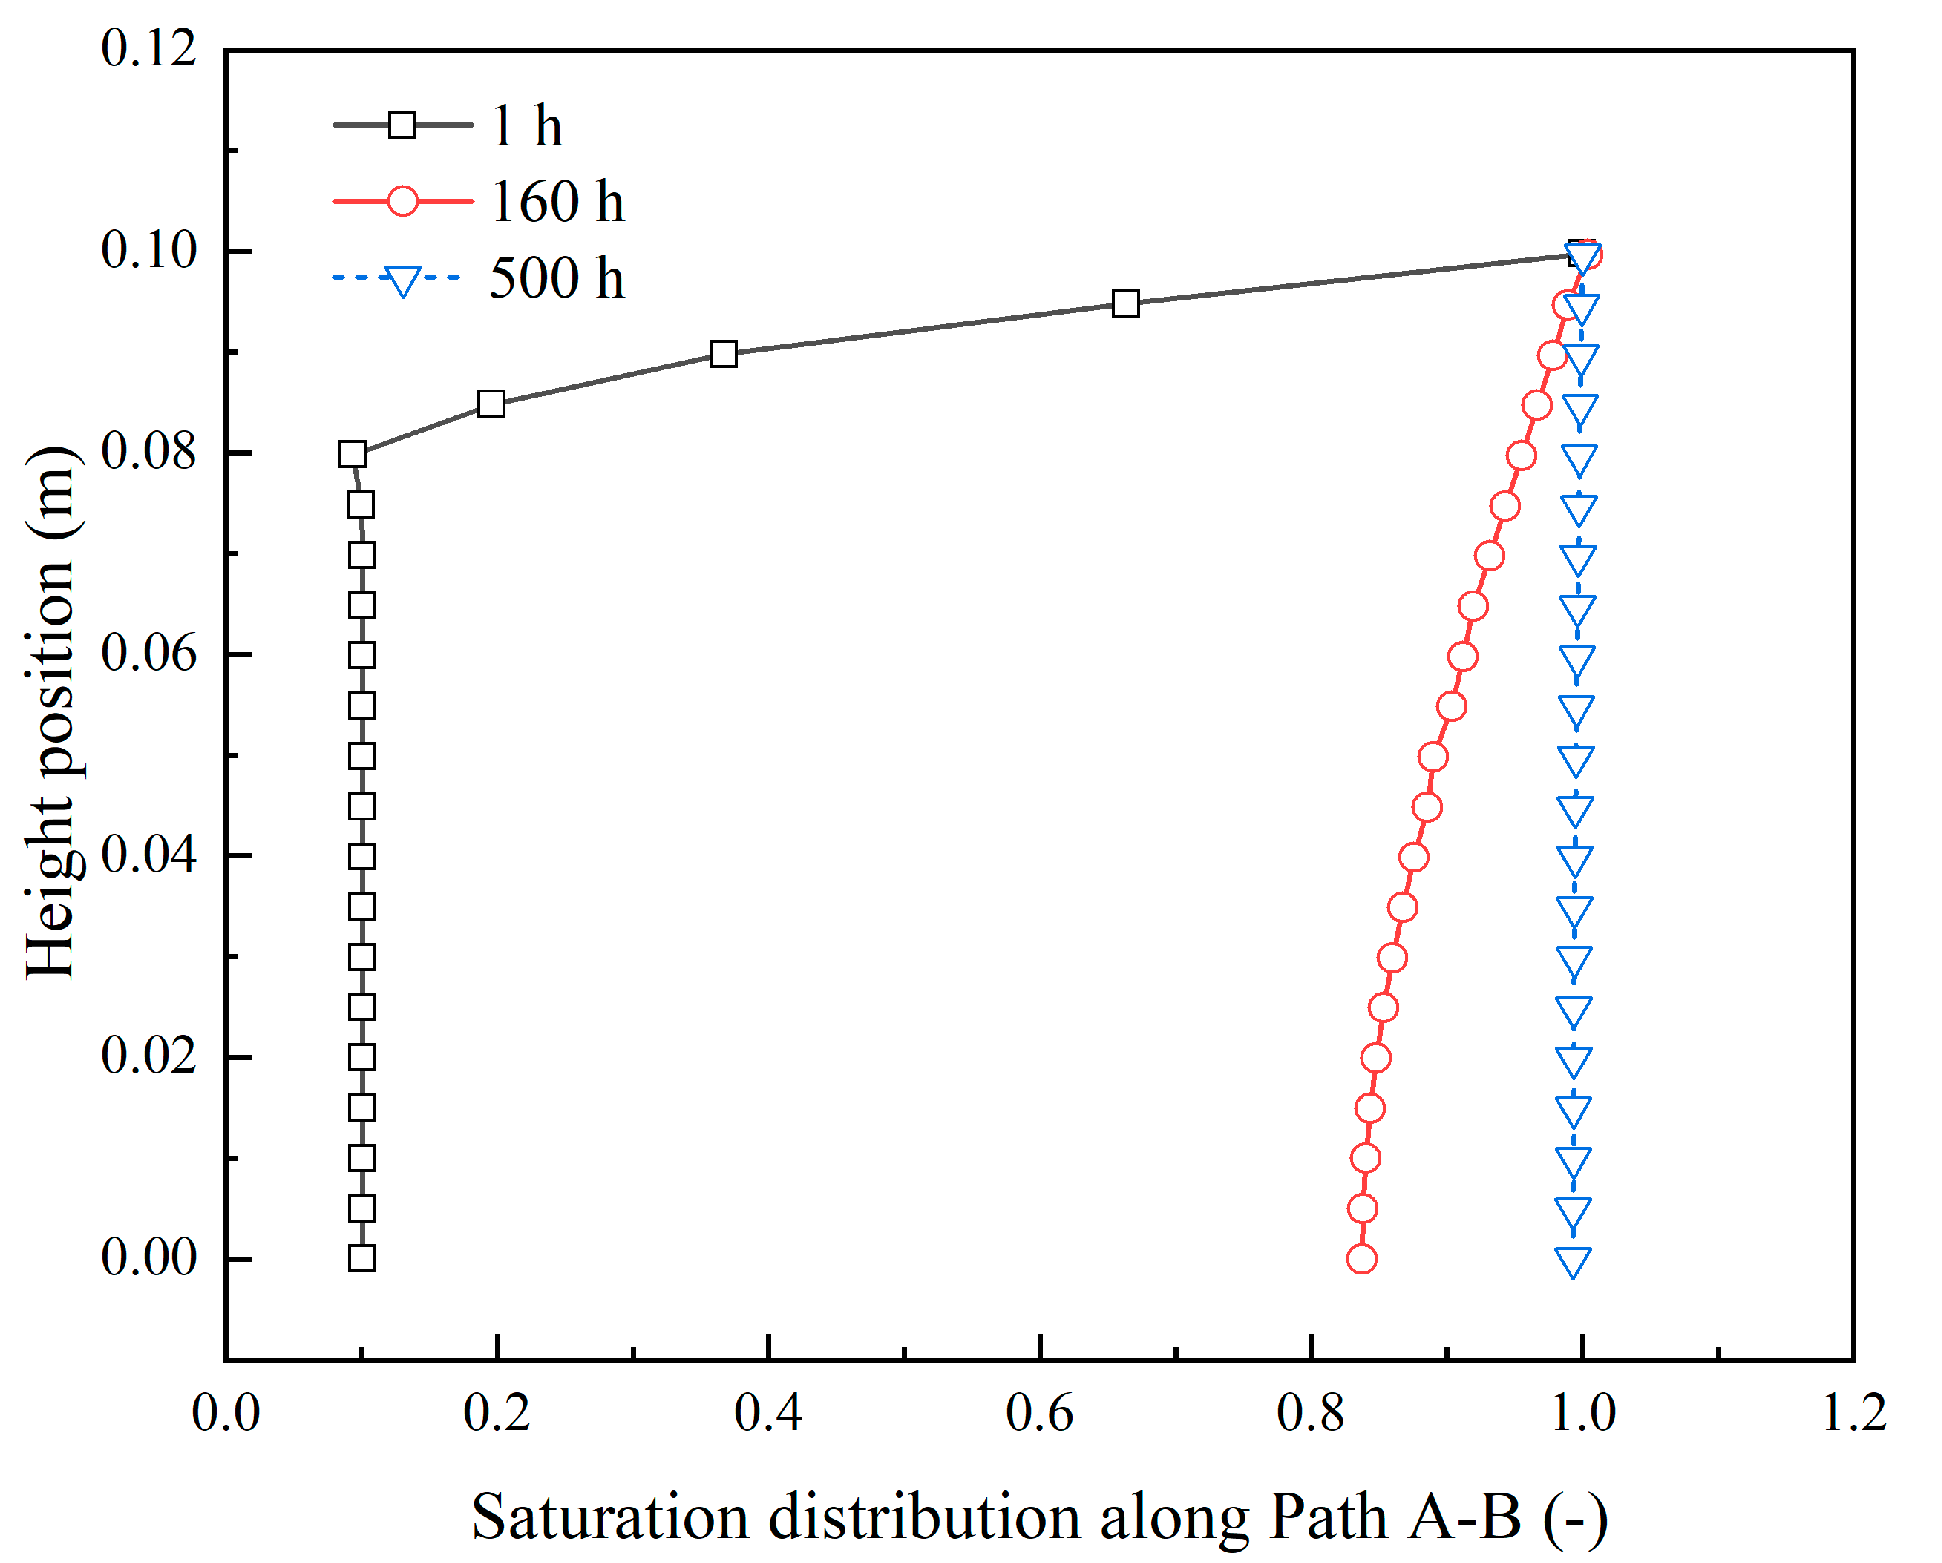
Figure 8 shows the displacement distribution along Path A–B at 160 h, Figure 9 presents contours of saturation and displacement within the specimen at different times, and Figure 10 illustrates the saturation distribution along Path A–B at various time instants. Under constant load, as water infiltrates the rock specimen from the top, the deformation process is characterized by three distinct stages based on the magnitude and rate of deformation:
Stage I (0–160 h): Rapid time-dependent deformation.
Immediately upon loading, an instantaneous displacement of 0.18 mm occurred at the top surface, primarily due to elastic deformation, during which neither elastic modulus weakening nor creep had yet developed, and water infiltration had just begun. As water continued to infiltrate, the overall saturation degree increased from 0.1 to over 0.8 by the end of this stage (Figure 9). In Condition 1, the elastic modulus weakened with increasing saturation, resulting in an increased deformation of 0.25 mm. In Condition 2, both modulus weakening and creep deformation occurred, leading to a top displacement of 0.37 mm. In Condition 3, where creep was further accelerated by higher saturation, the displacement reached 0.38 mm. The difference between Conditions 2 and 3 during this stage was relatively small (Figure 8).
Stage II (160–500 h): Decelerated deformation.
The rate of time-dependent deformation decreased in this stage. By the end of this period, the overall saturation increased from 0.8 to 1.0 (Figure 10). The displacement increased to 0.27 mm in Condition 1, 0.40 mm in Condition 2, and 0.42 mm in Condition 3. The reduced deformation rate—compared to Stage I—was attributed to the specimen approaching full saturation (Figure 9).
Stage III (beyond 500 h): Stabilization of deformation.
Deformation essentially stabilized as the specimen became fully saturated (Figure 9 and Figure 10), and the influence of saturation on deformation diminished (Figure 7). It should be noted that the Heaviside function introduced in Equation (18) was defined such that the creep rate decays to zero by this time. Therefore, in Condition 3, creep deformation also stabilized after 500 h.
The deformation process of the rock specimen under constant load and water infiltration exhibits three distinct stages (Figure 7, Figure 8, Figure 9 and Figure 10), characterized by decreasing deformation rates over time. This three-stage pattern (rapid increase, deceleration, stabilization) is closely aligned with the saturation process and has been observed in previous experimental studies on saturated rocks [11,20]. Our findings reinforce that the coupled influence of water-induced weakening of the elastic modulus and time-dependent creep deformation is critical for accurate long-term prediction.
The comparative analysis of working conditions confirms that while water-induced weakening of the elastic modulus contributes to initial deformation, the acceleration of creep by saturation is the dominant mechanism leading to increased long-term deformation. This underscores the significance of incorporating water-creep coupling, as models considering only strength degradation (Condition 1) may significantly underestimate final deformations.
In summary, the deformation process of the rock specimen under constant load and water infiltration exhibits three distinct stages, characterized by decreasing deformation rates over time. Saturation plays a critical role in the early and intermediate stages, while deformation stabilizes upon full saturation, indicating the cessation of further water-mechanical interactions under the given conditions.

5.3. Deformation of a Typical Reservoir Slope Under Water Infiltration

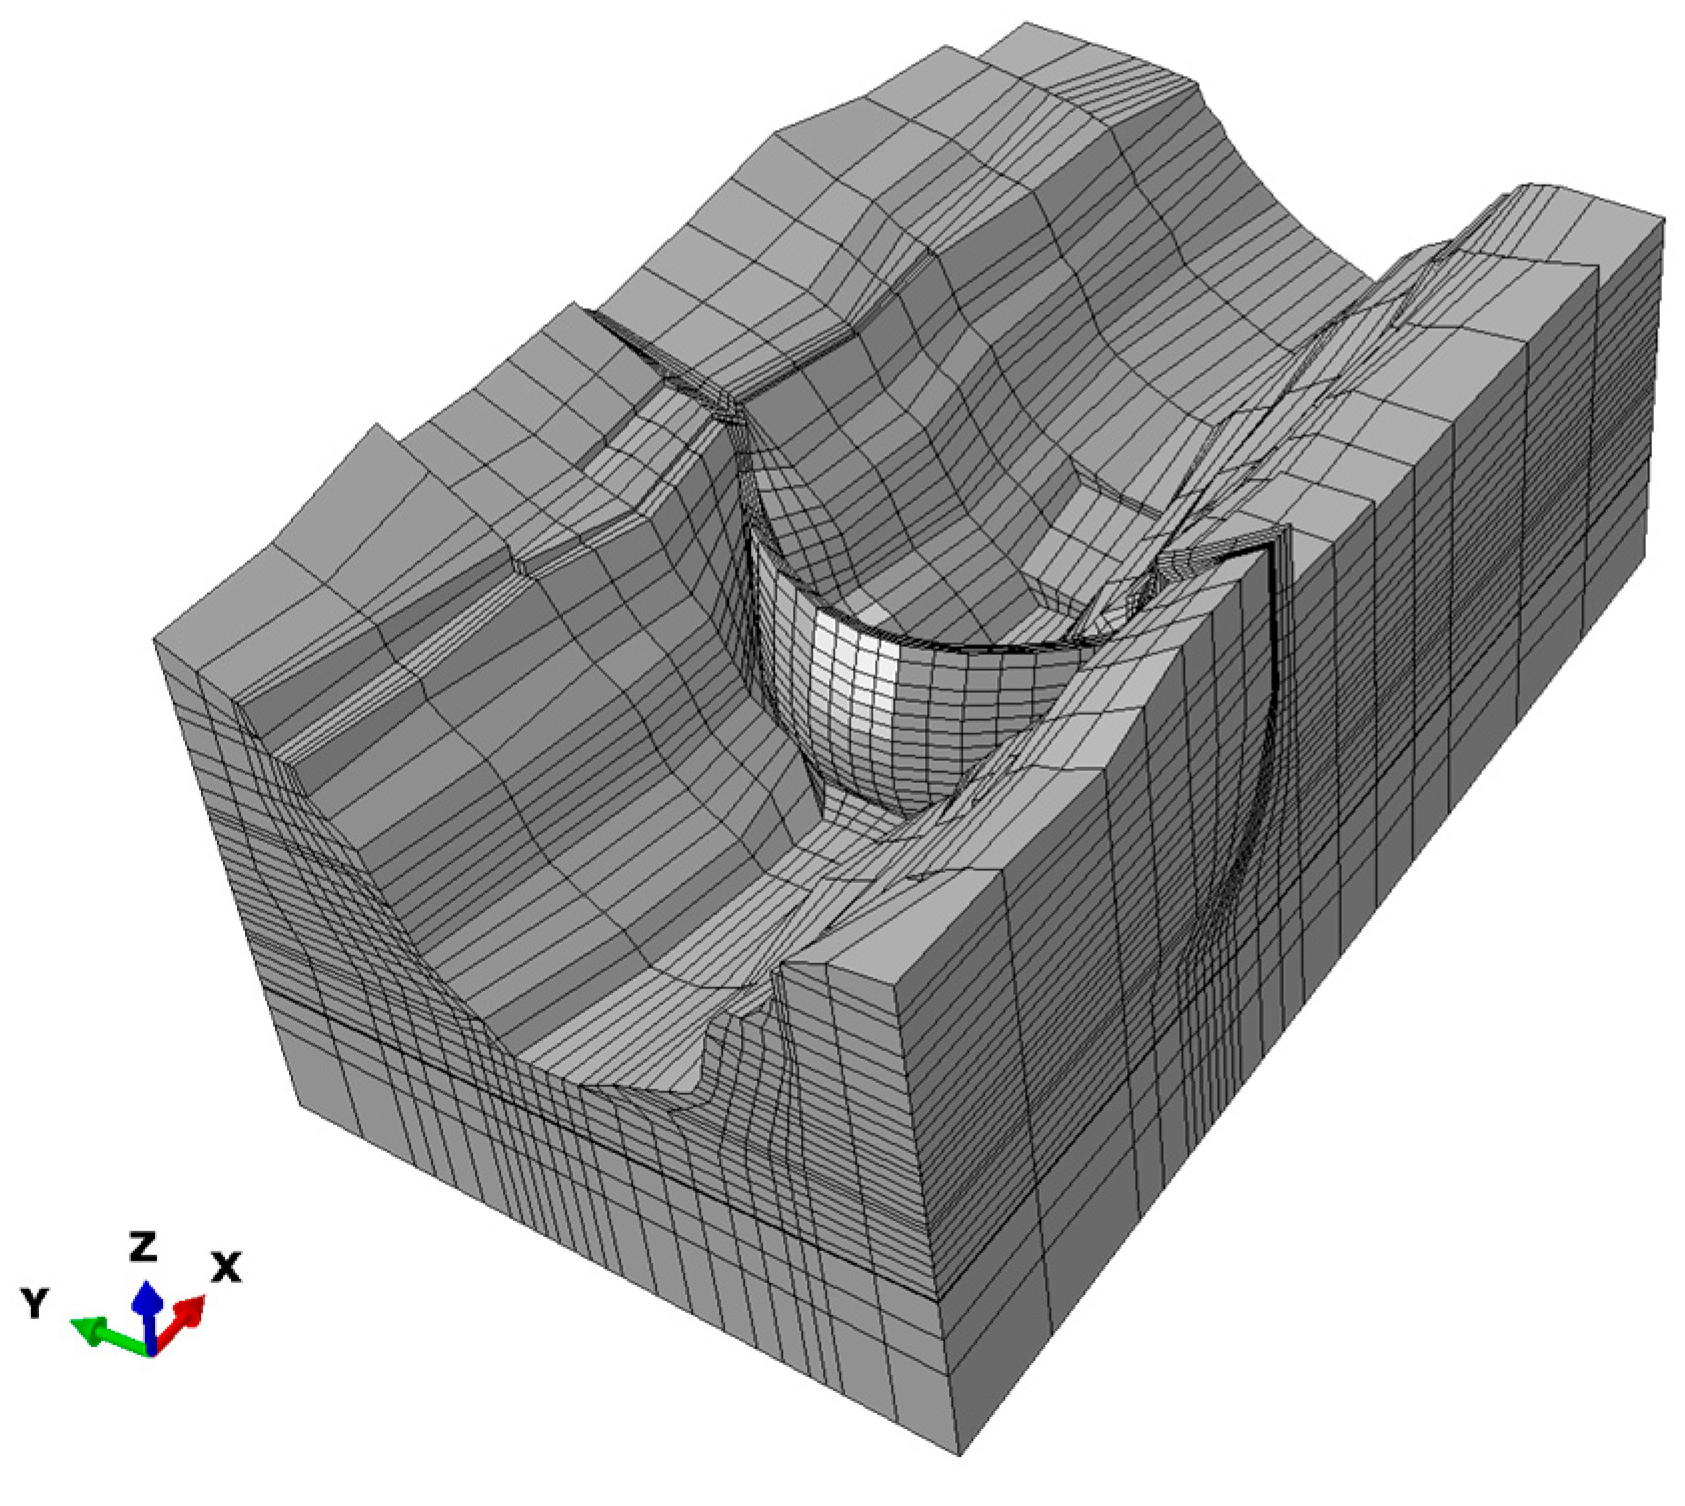
This section presents a case study of a reservoir slope adjacent to a double-curvature concrete arch dam. The dam has a height of 285.5 m and a crest elevation of 610 m. The numerical model extends 1800 m in the X-direction (streamwise), 1050 m in the Y-direction (cross-stream), and 840 m in the Z-direction (elevation). The finite element mesh is shown in Figure 11. The coordinate origin is located at the arch crown of the dam crest, with the positive X-axis directed downstream, the positive Y-axis toward the left bank, and the positive Z-axis vertically upward. Displacement boundary conditions were applied as follows: the base was fixed in the Z-direction, the outer lateral boundaries (left and right banks) were constrained in the Y-direction, and the upstream and downstream extents were constrained in the X-direction.
The initial material parameters used in the model are listed in Table 2. The elastic modulus and cohesion of the rock mass upon saturation were reduced by 10% from their initial values. The initial creep parameters were set as A = 1.1 × 10 17 , B = 0.32 , C = 0.89 and n = 3.0 .
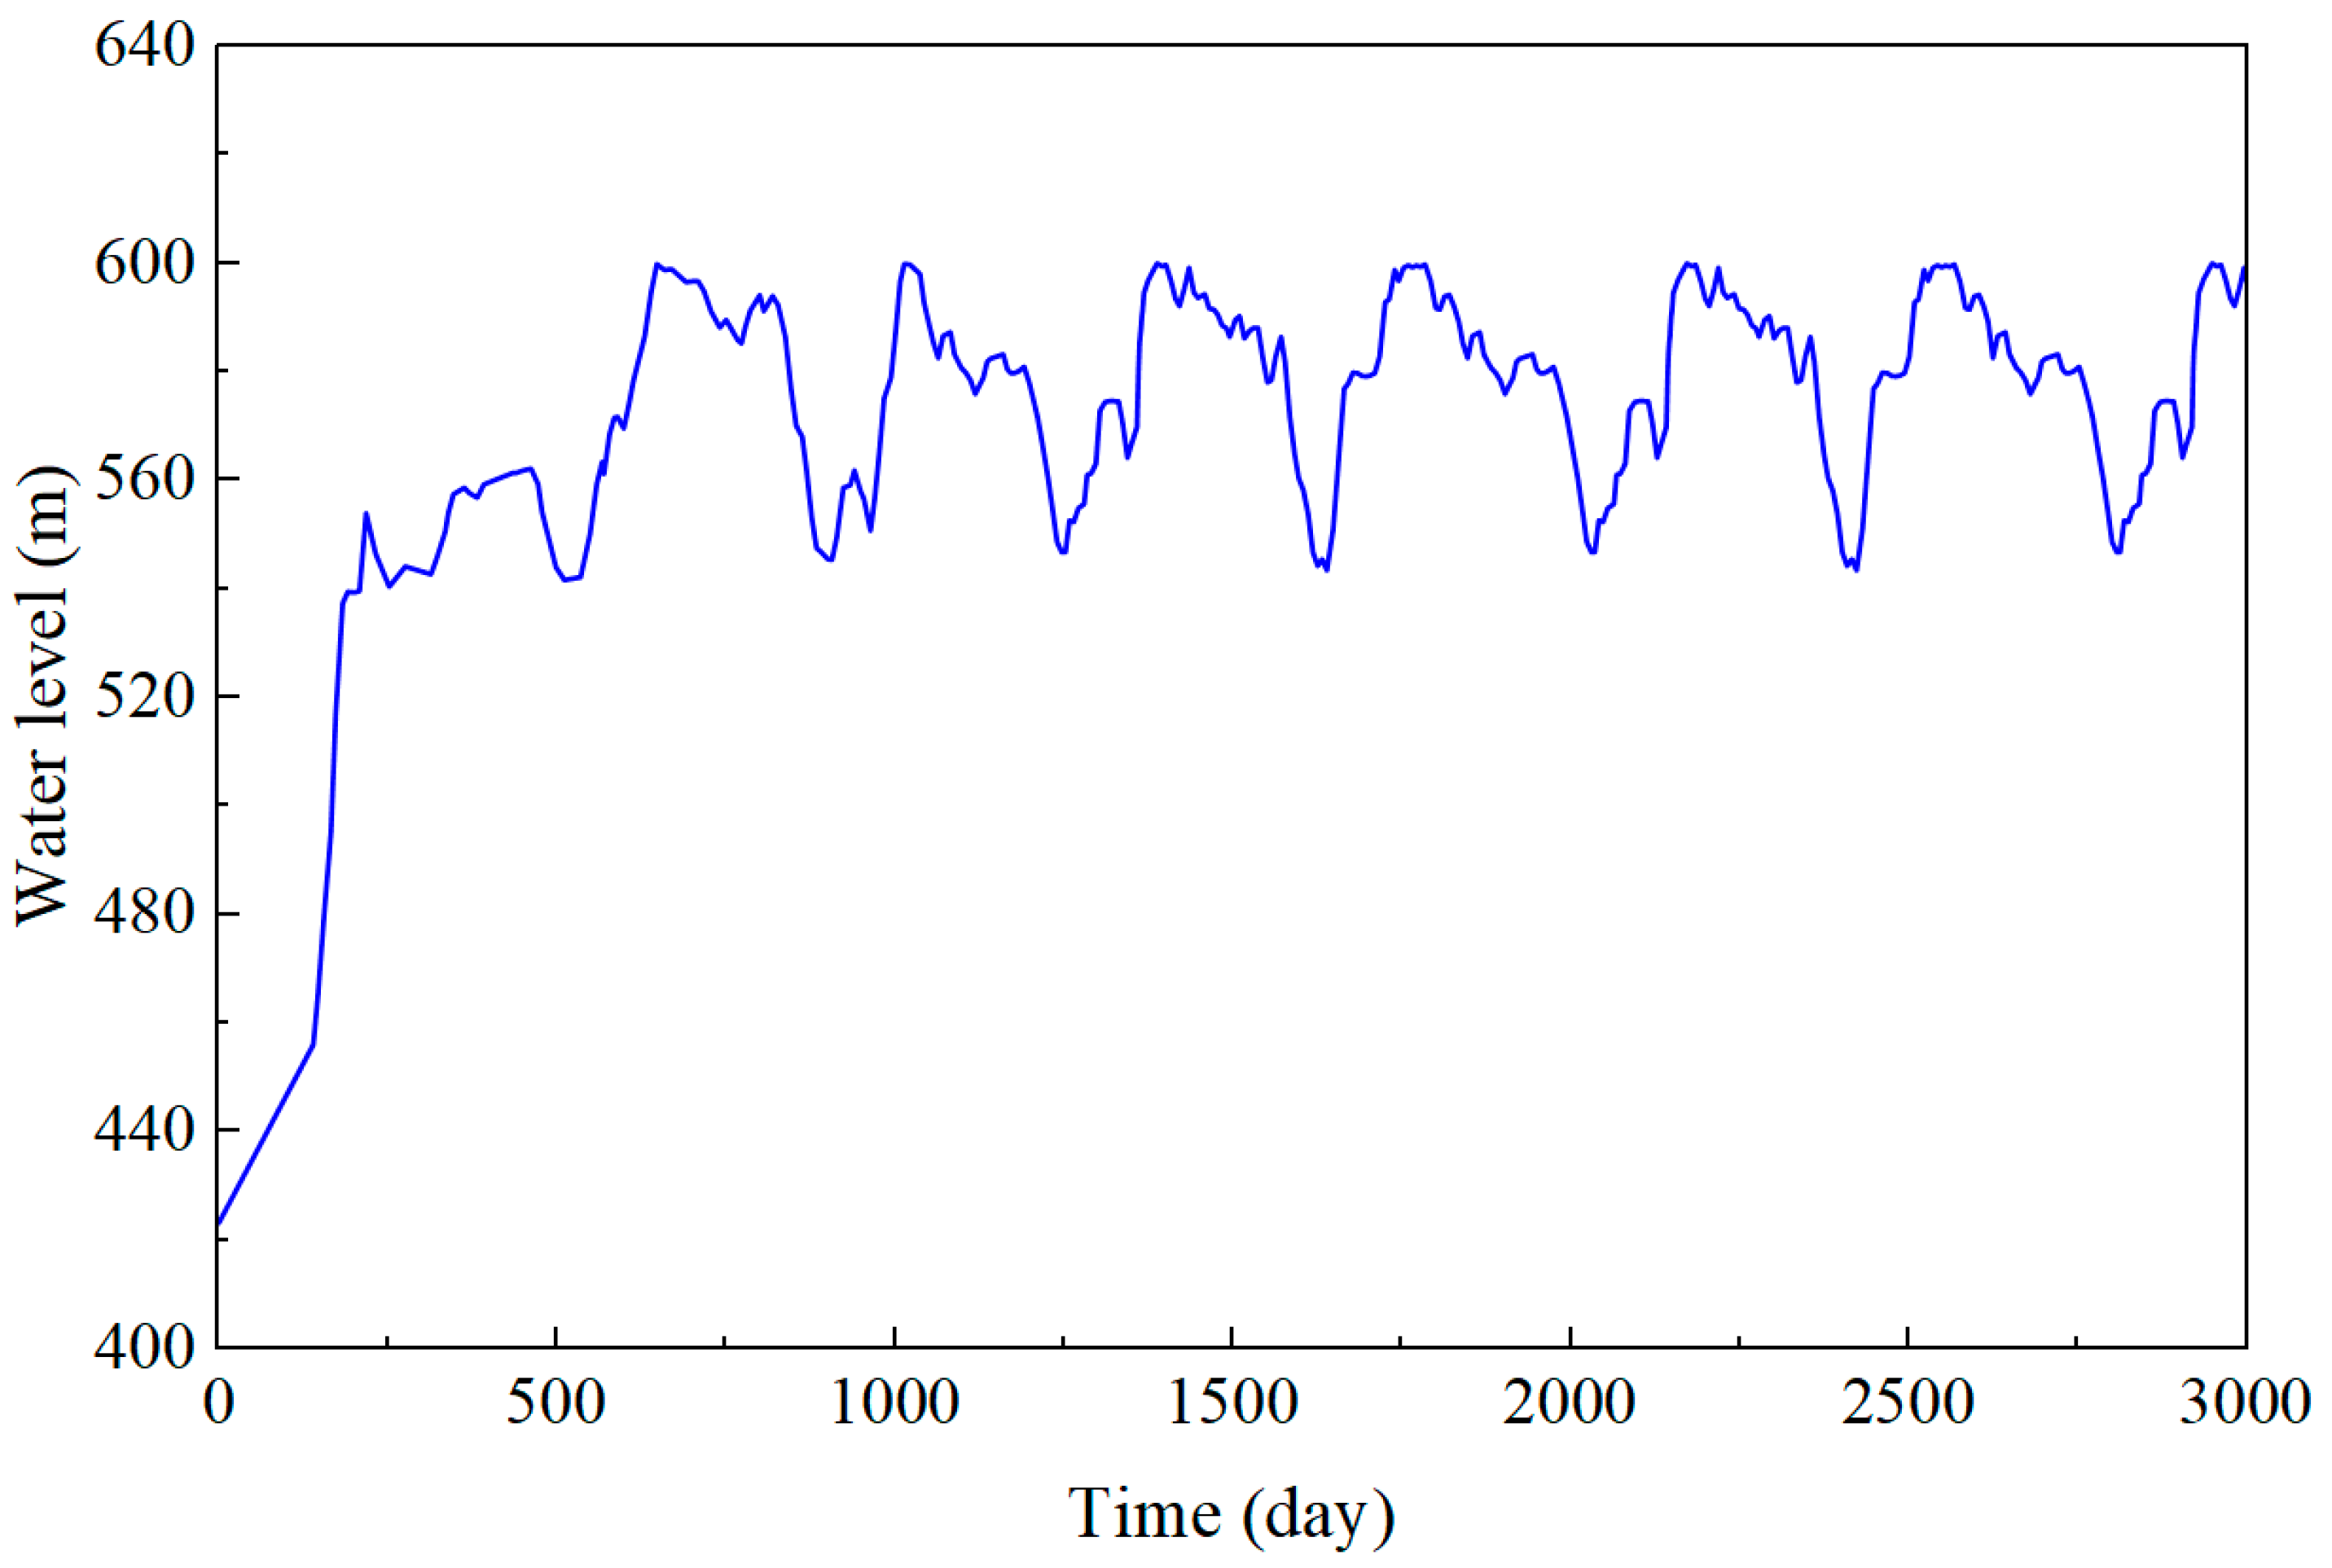
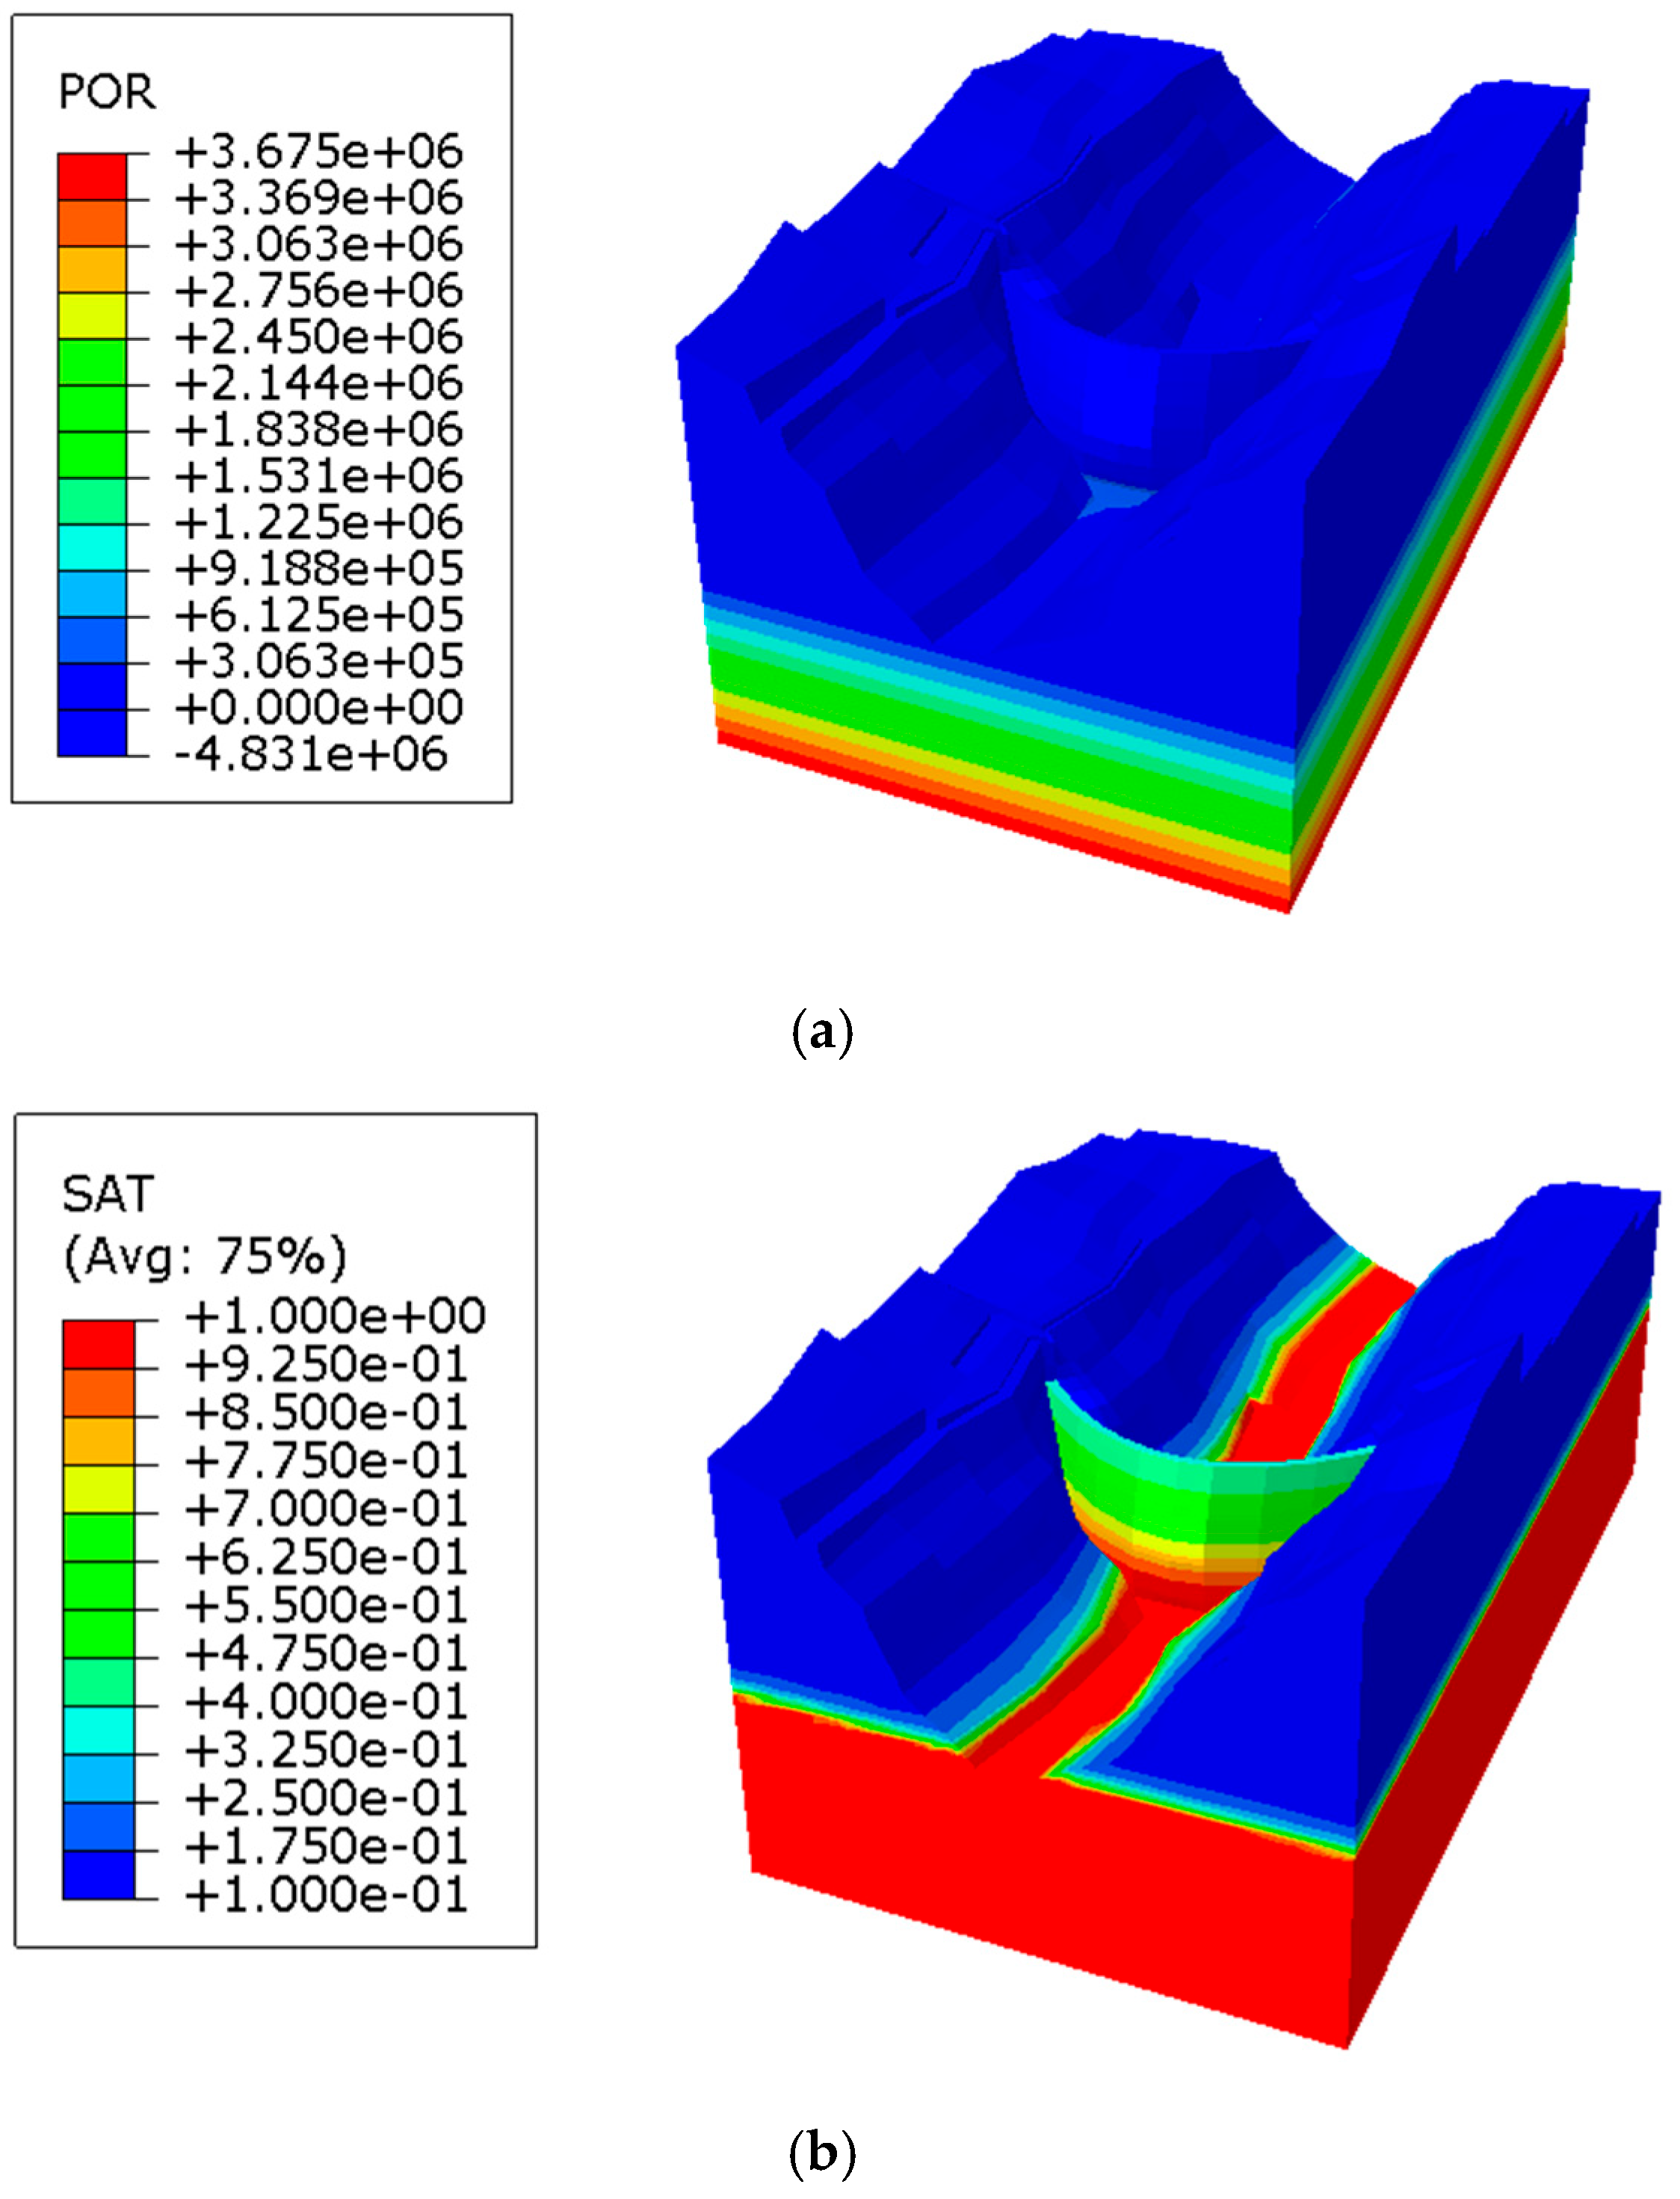
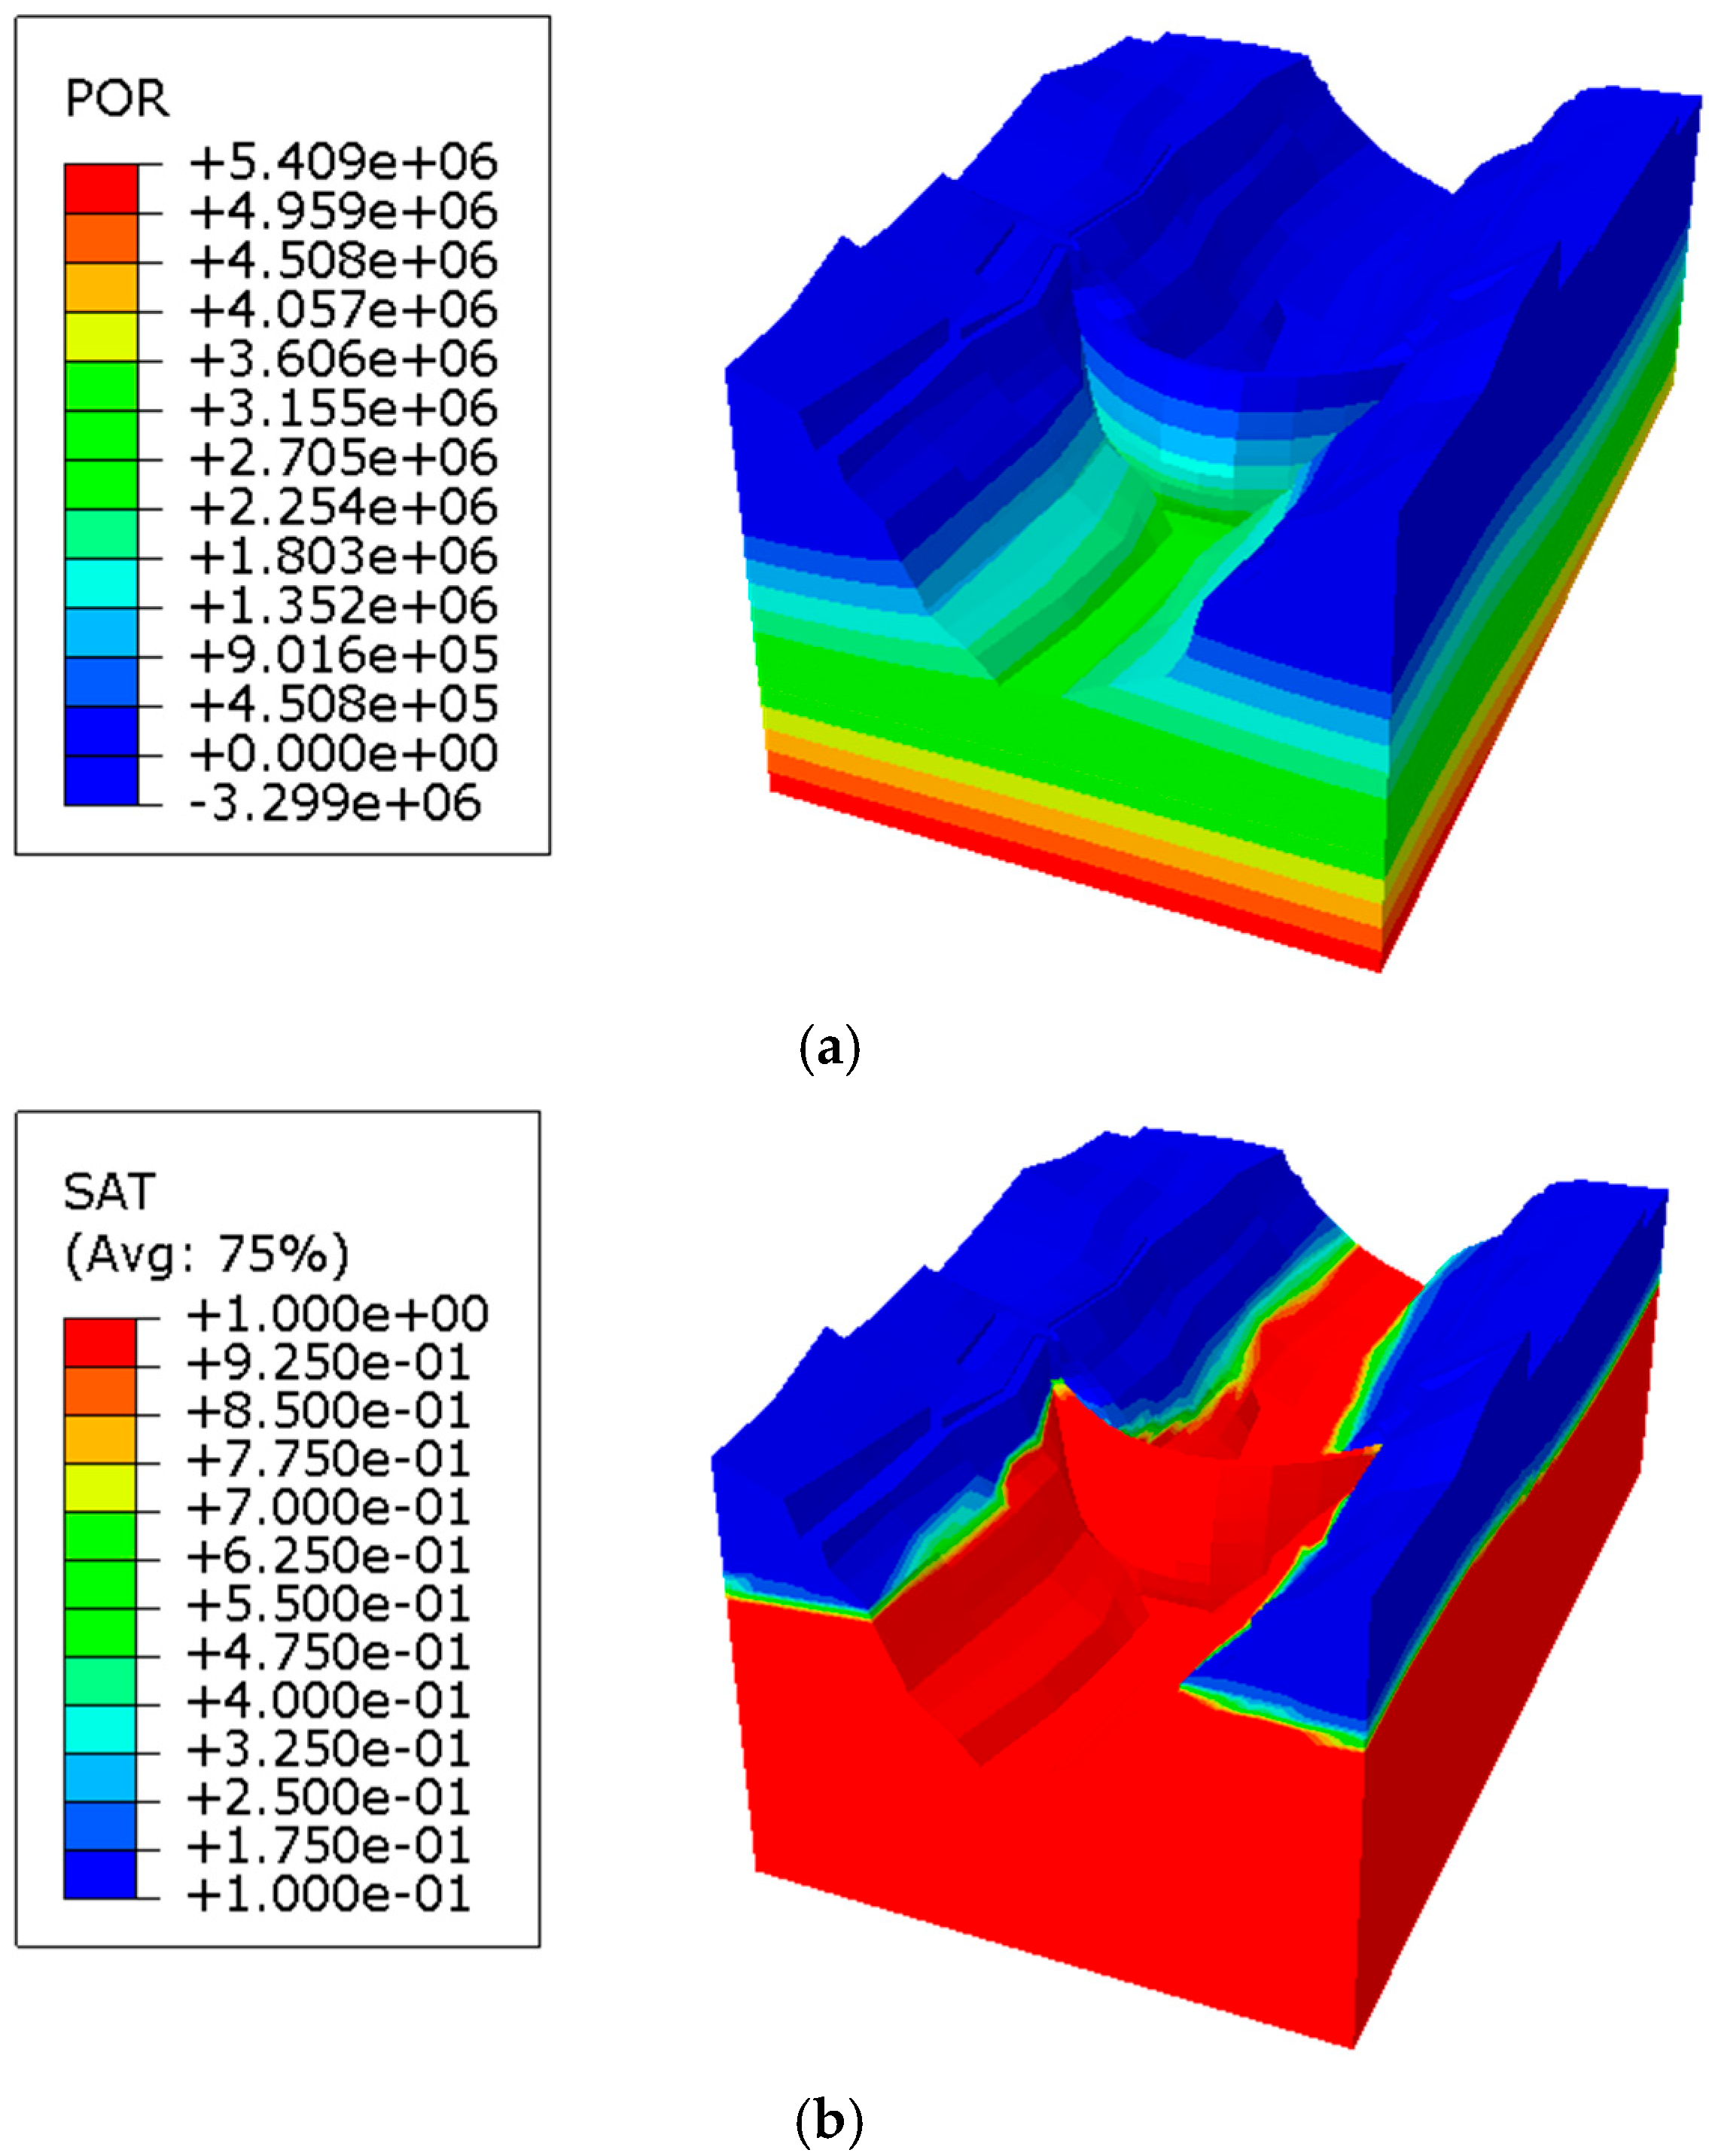
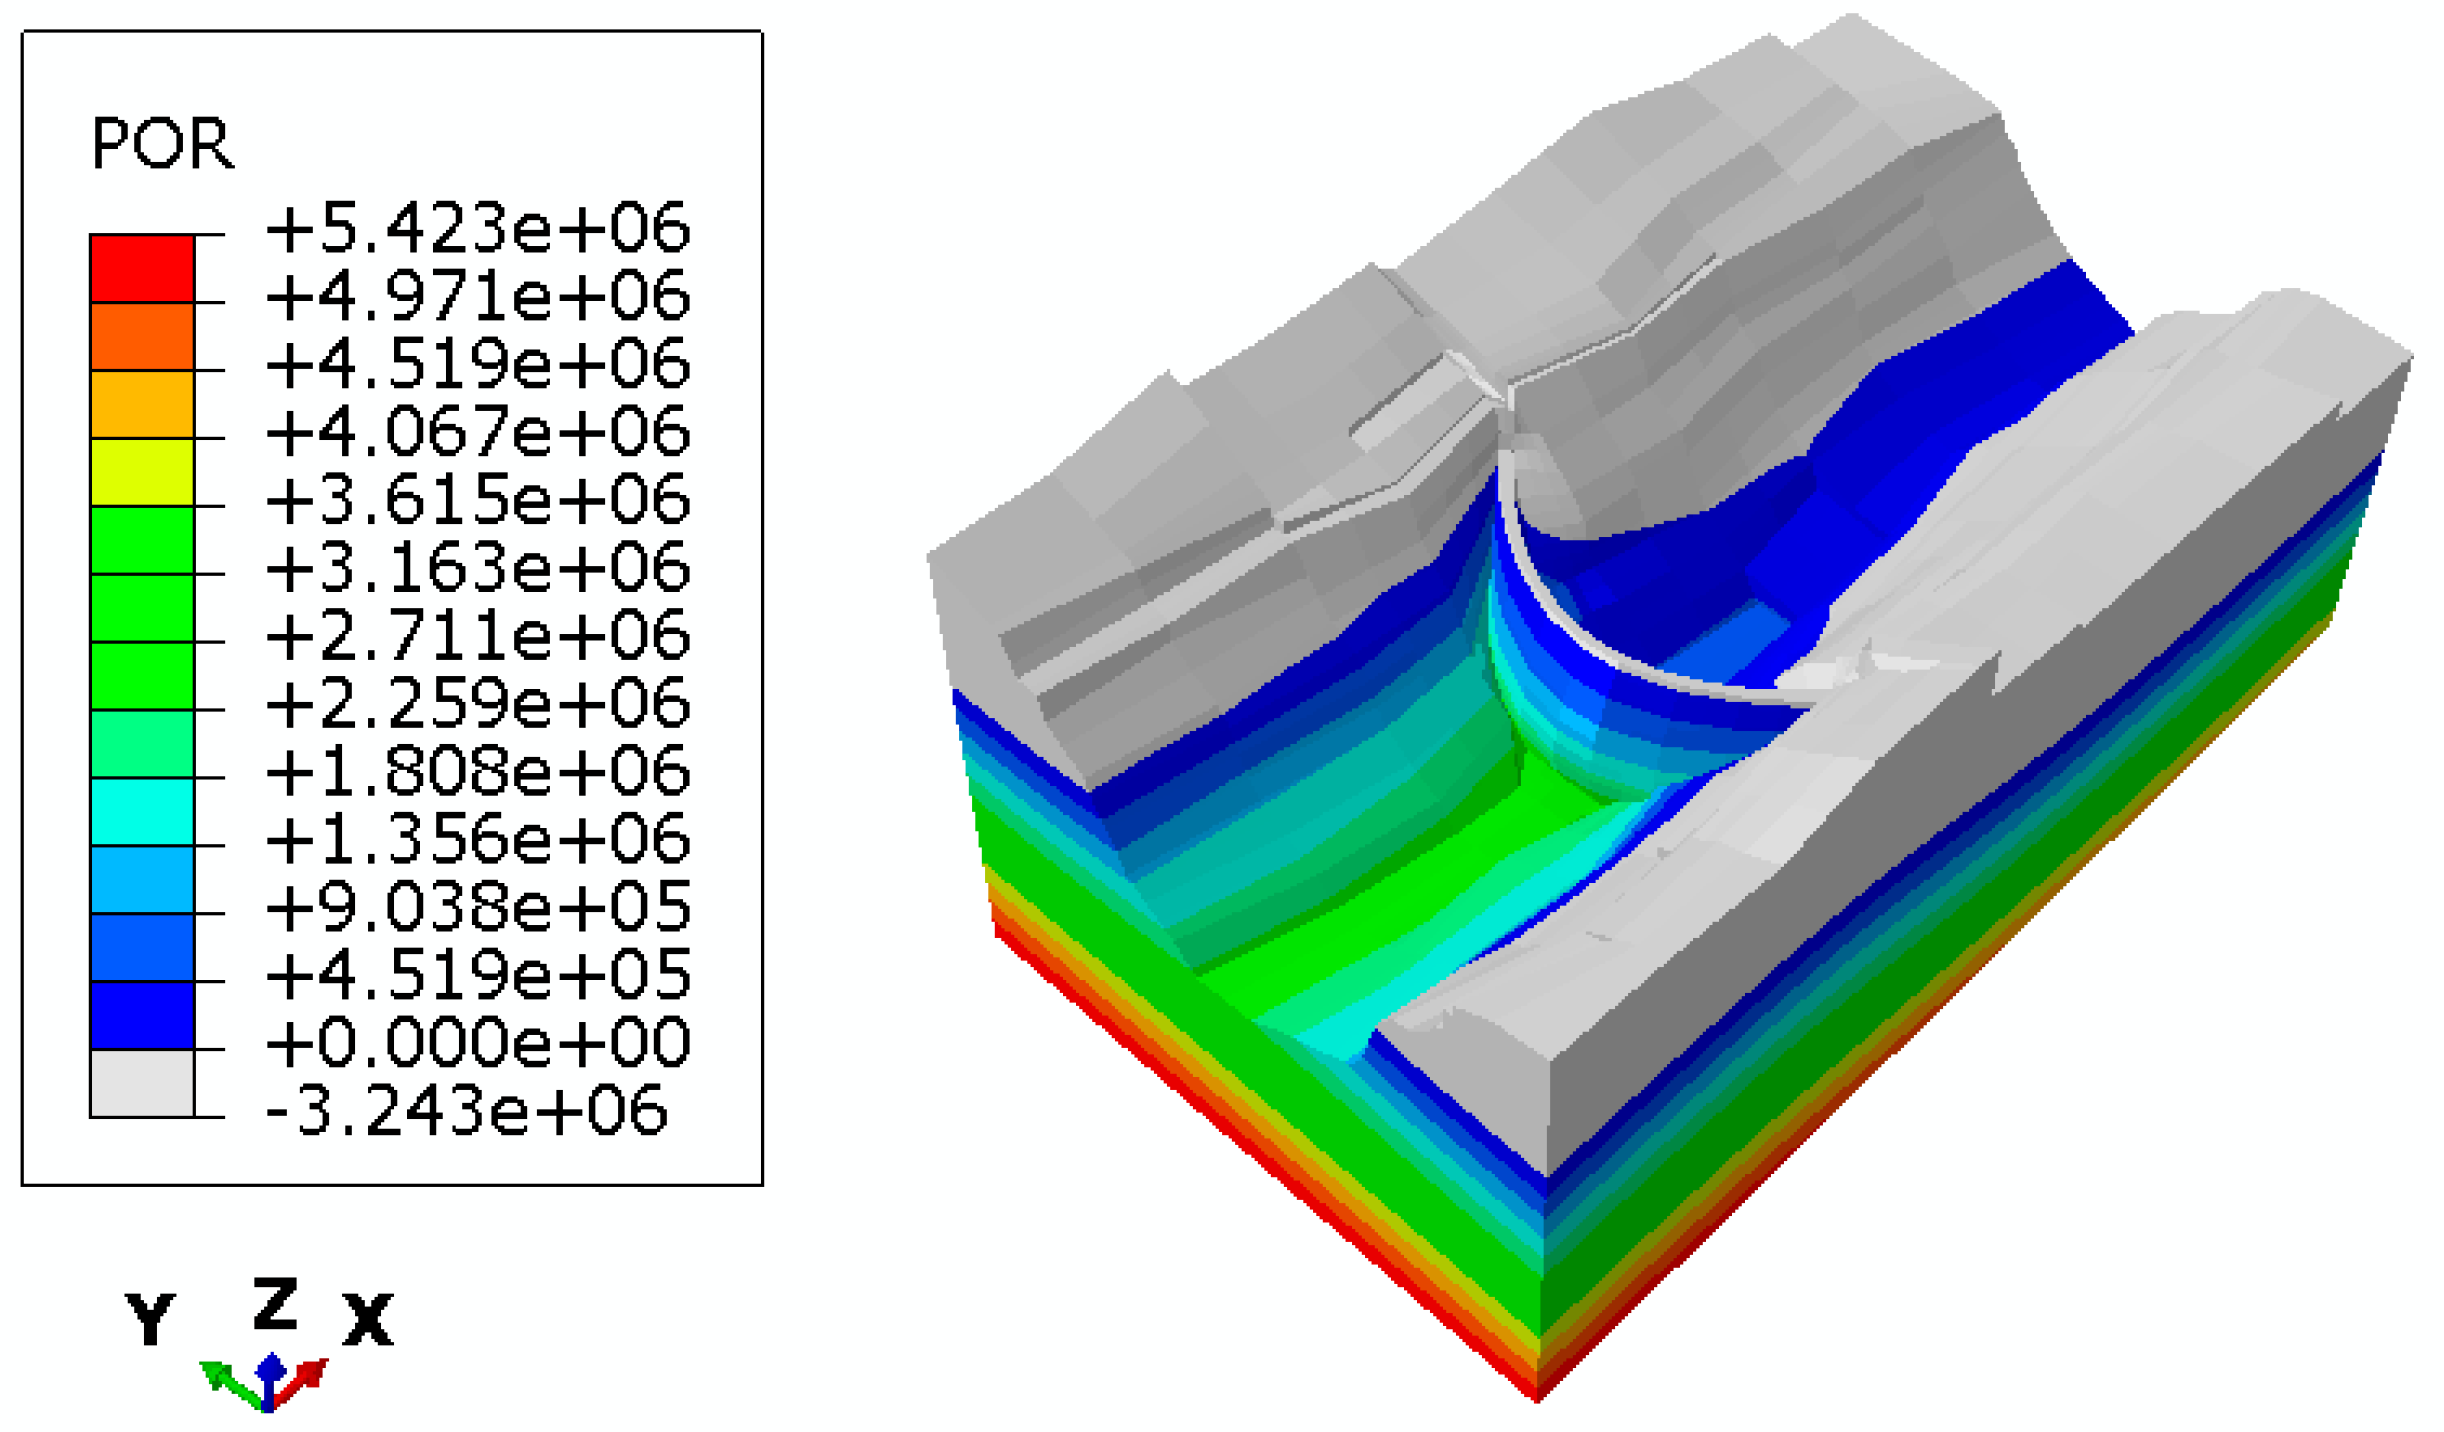
The impoundment process of the reservoir is illustrated in Figure 12. The distributions of pore water pressure and saturation before impoundment and after 5 years with the reservoir level at 610 m are shown in Figure 13 and Figure 14, respectively.
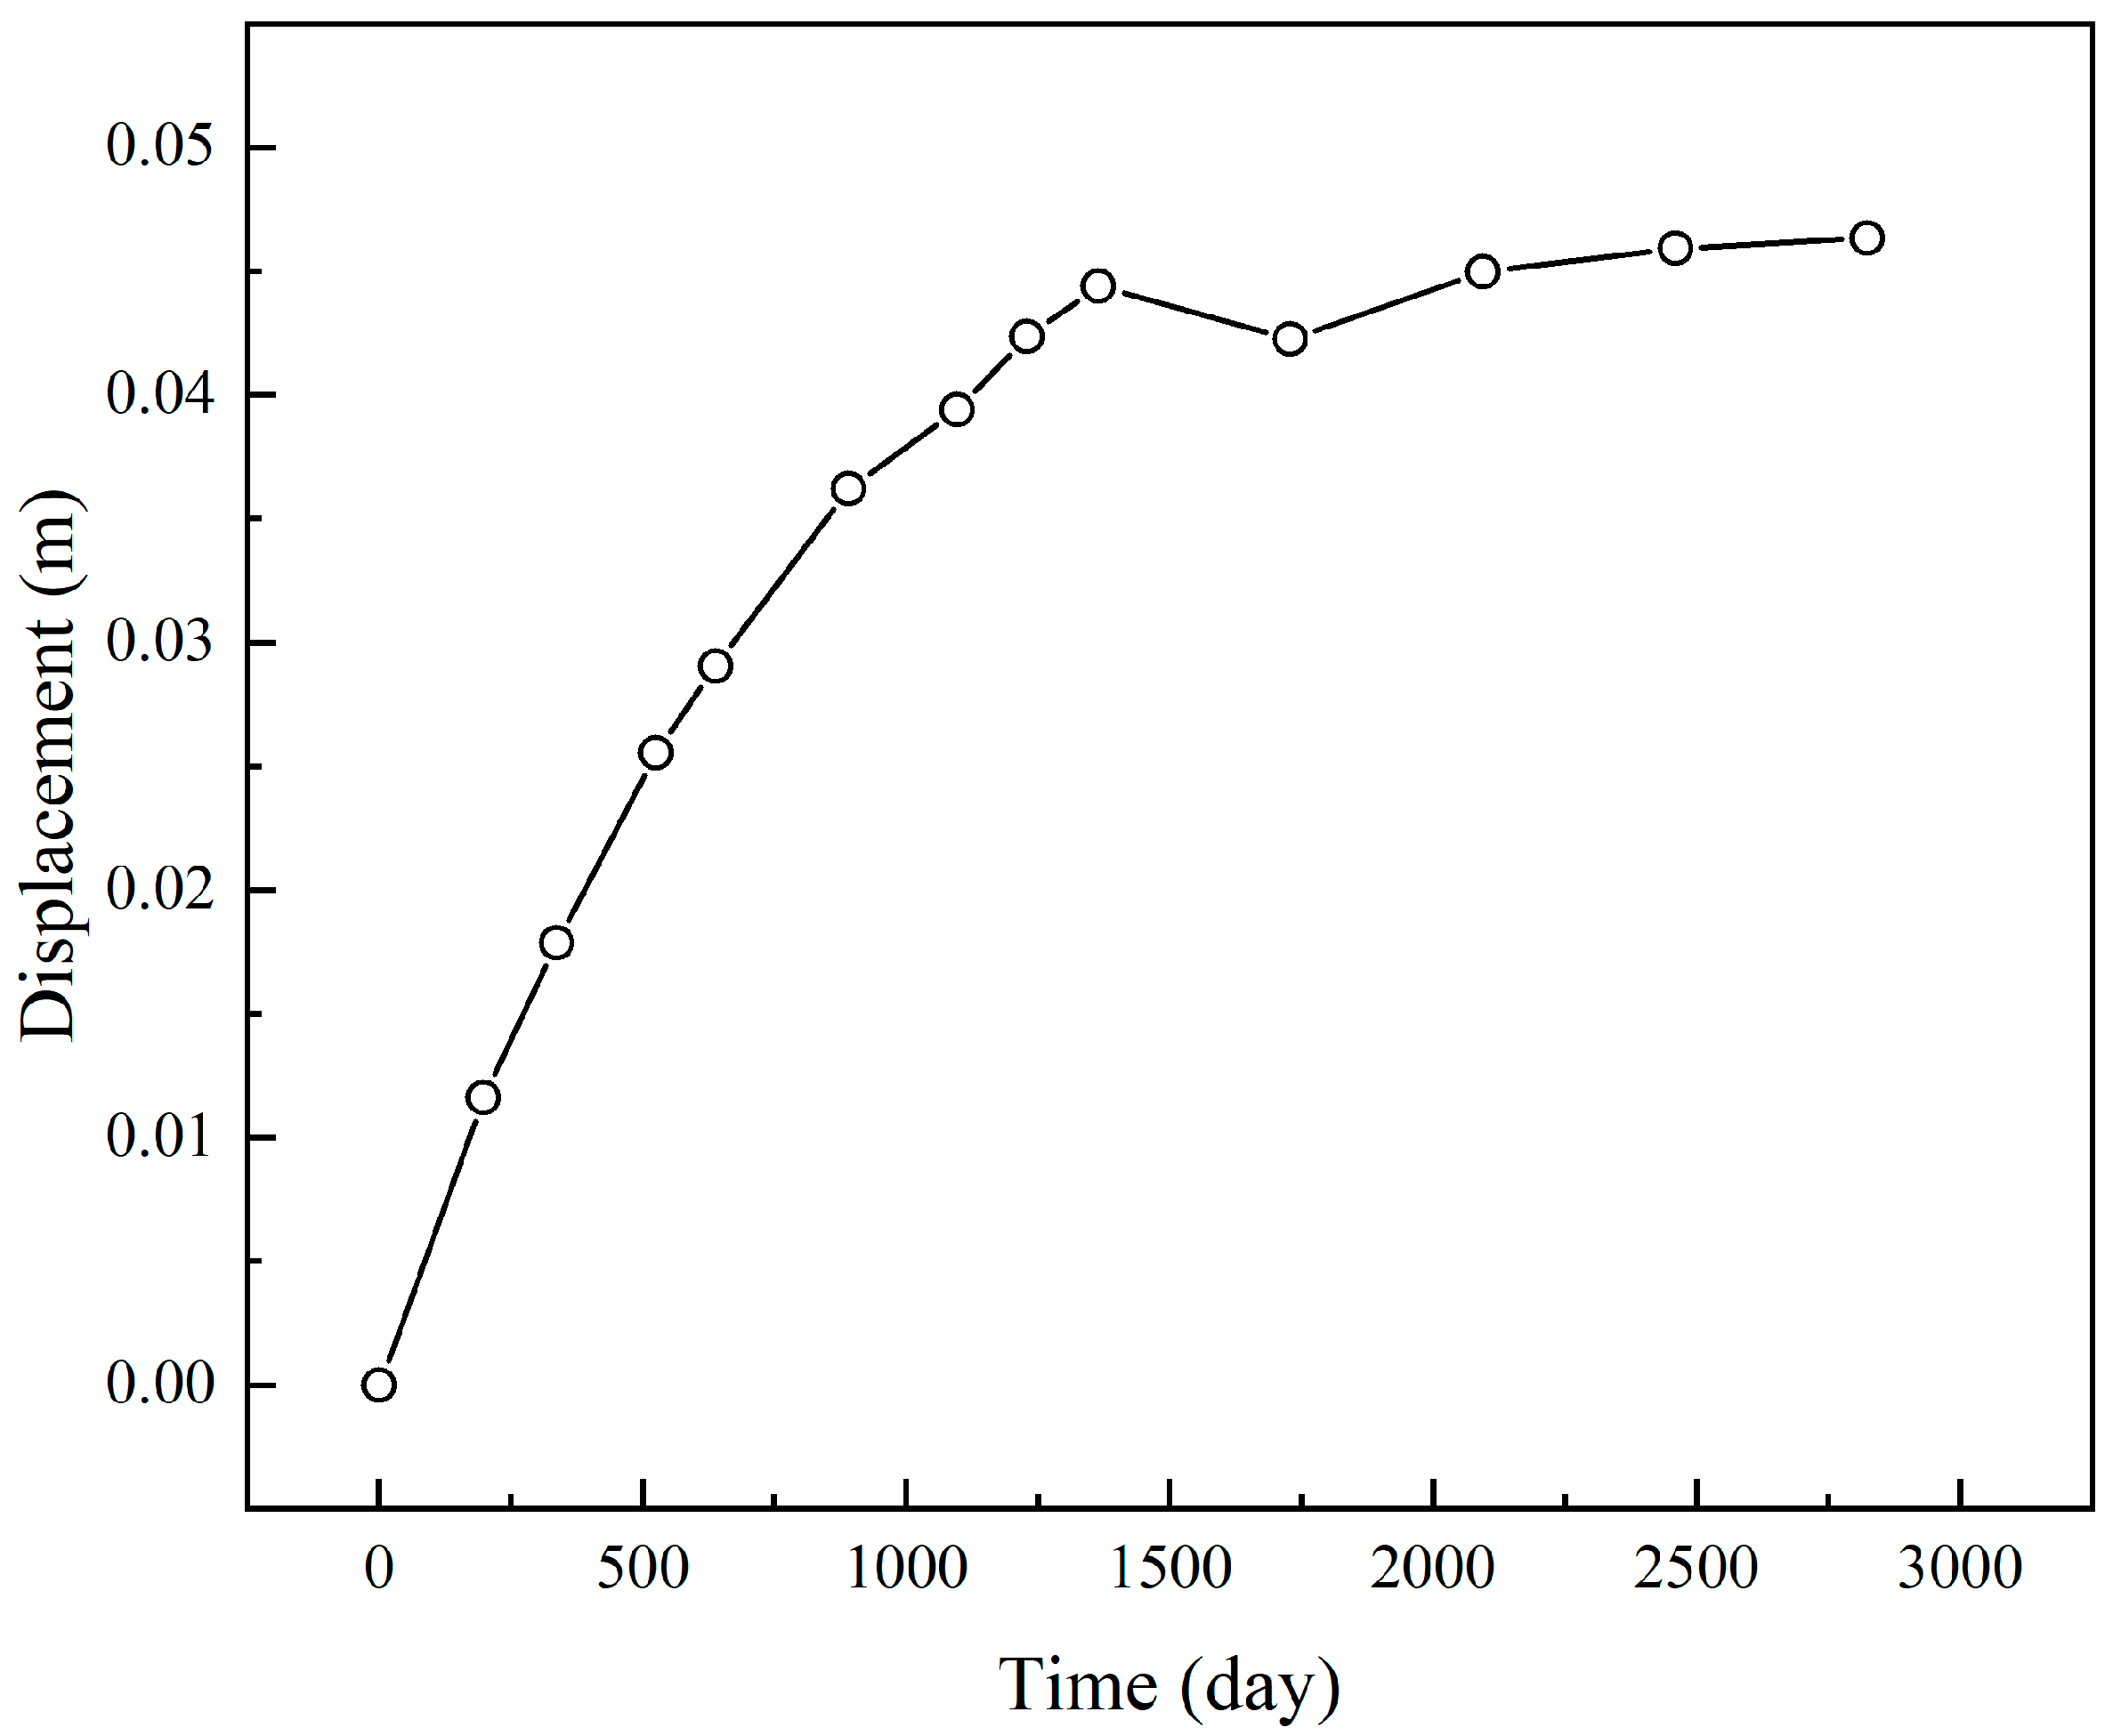
The deformation at elevation 611 m on the upstream slope after approximately 3000 days of impoundment, considering factors such as water-induced weakening of the elastic modulus and cohesion (exemplified here by a 10% reduction), impoundment-accelerated creep, and seepage forces, is presented in Figure 15.
It should be noted that the deformation curve in Figure 15 is not smooth and exhibits kinks at specific impoundment stages. This is a result of the simplified numerical simulation of the impoundment process, where the hydraulic load corresponding to a new water level was applied instantaneously in discrete steps. This rapid application of surface force caused a temporary alteration in the deformation rate, leading to the observed kinks and slight rebounds. However, as pore water progressively infiltrated the rock mass and the seepage field stabilized, these transient effects diminished and had a negligible impact on the overall long-term deformation trend. The phreatic surface at the normal water level after 3000 days is indicated by the gray–blue interface in the figure. Downstream, the phreatic surface declines with distance from the dam, converging to the downstream water level, as shown in Figure 16.
Three simulation cases were defined to isolate the effects of different mechanisms: Case 1 (baseline, no weakening/creep), Case 2 (water-weakening only), and Case 3 (full model with water-weakening and creep). The computed deformations at elevation 611 m after 3000 days were 9.0 mm, 46.9 mm, and 52.1 mm, respectively. The results demonstrate that deformation remains minimal (<10 mm) if water-induced weakening and creep are neglected. The incorporation of creep leads to a significant increase in deformation. Comparing Case 2 and Case 3 shows that adding water-induced weakening to the creep model further amplifies the deformation, although the effect of creep acceleration is more dominant. This confirms the model’s capability to simulate slope deformation driven by both water-induced strength degradation and impoundment-accelerated creep, highlighting the critical role of the latter. This predicted pattern of impoundment-accelerated creep is consistent with field observations and conclusions from relevant case studies [22,23], providing validation that the model successfully captures this critical physical process.
It is important to note that the predicted deformation values are contingent upon the specific rock mass properties and other potential influencing factors (e.g., temperature, rainfall). Acquiring a comprehensive set of experimental data and accounting for all influencing factors in practice is challenging. The model presented herein provides a methodological framework for analyzing the time-dependent deformation of rock masses under various hydro-environmental conditions. For specific engineering applications, the model can be adapted, potentially by neglecting secondary factors based on required precision and data availability, to yield a practical and acceptable computational tool.

6. Conclusions

This study investigates the hydro-mechanical evolution of reservoir bank rocks during impoundment and develops an integrated modeling framework that captures the coupled processes of rock strength degradation and time-dependent creep under varying saturation levels and pore water pressures. The principal contributions and findings are summarized as follows:
(1)
A coupled hydro-mechanical creep model was developed and implemented in ABAQUS, capable of simulating the dynamic evolution of rock deformation under variable saturation and pore pressure. Validation against experimental data confirmed its accuracy in capturing saturation-dependent creep behavior.
(2)
Numerical simulations revealed that water–creep coupling increases steady-state deformation by over 50% compared to strength degradation alone, with the deformation process progressing through three distinct stages aligned with saturation.
(3)
Application to a high arch dam reservoir slope demonstrated that models incorporating both water-weakening and creep effects predict significantly larger deformations than those ignoring these mechanisms, underscoring the importance of coupled hydro-mechanical–creep analysis in slope stability assessment.
This study has certain limitations. The model assumes a constant internal friction angle and does not explicitly account for the evolution of material porosity or damage during loading. Furthermore, the current validation and application are under axisymmetric loading conditions. Future work will focus on validating the model under more complex stress paths, including shear loading conditions, which are highly relevant for slope stability analysis.

Author Contributions

Conceptualization, L.Z. and X.J.; methodology, L.L., X.L. and X.L.; software, S.F.; validation, S.F. and X.J.; formal analysis, L.L.; investigation, L.L.; resources, L.Z. and X.L.; data curation, L.L.; writing—original draft preparation, L.L.; writing—review and editing, L.Z.; visualization, S.F.; supervision, X.J. and X.L.; project administration, L.Z.; funding acquisition, L.Z. and X.L. All authors have read and agreed to the published version of the manuscript.

Funding

This work was supported by the National Natural Science Foundation of China (Grant No. 52478371, 51739006, 52508422) and the Zhejiang A&F University Scientific Research Development Fund (Grant No. 2024LFR040).

Data Availability Statement

The data are restricted to protect intellectual property for potential patent and copyright applications. They can be provided by the corresponding author upon request.

Acknowledgments

All individuals included in this section have consented to the acknowledgement.

Conflicts of Interest

Authors Lixiang Liu, Sai Fu and Xianlin Jia were employed by the company PowerChina HuaDong Engineering Corporation Limited. The remaining authors declare that the research was conducted in the absence of any commercial or financial relationships that could be construed as a potential conflict of interest.

References

  1. Ding, S.; Tang, S. Mechanical behavior evolution and failure characteristics of saturated and dry rocks under different water pressure environments. Int. J. Rock Mech. Min. Sci. Géoméch. Abstr. 2024, 178, 105777. [Google Scholar] [CrossRef]
  2. Wasantha, P.; Ranjith, P.; Permata, G.; Bing, D. Damage evolution and deformation behaviour of dry and saturated sandstones: Insights gleaned from optical measurements. Measurement 2018, 130, 8–17. [Google Scholar] [CrossRef]
  3. Frenelus, W.; Peng, H. Effects of temperature, water content, hydraulic pressure, stress level and damage on rock creep and the prolonged stability of deep underground structures. Rock Mech. Lett. 2025, 2, 79–89. [Google Scholar] [CrossRef]
  4. Masoumi, H.; Horne, J.; Timms, W. Establishing Empirical Relationships for the Effects of Water Content on the Mechanical Behavior of Gosford Sandstone. Rock Mech. Rock Eng. 2017, 50, 2235–2242. [Google Scholar] [CrossRef]
  5. Çelik, M.Y.; Kaçmaz, A.U. The investigation of static and dynamic capillary by water absorption in porous building stones under normal and salty water conditions. Environ. Earth Sci. 2016, 75, 1–19. [Google Scholar] [CrossRef]
  6. Zhang, Q.; Ran, J.; Fan, X.; Yang, B.; Zhao, P.; Chen, Y.; Huang, P.; Zhang, M.; He, L. Mechanical properties of basalt, tuff and breccia in the Permian system of Sichuan Basin after water absorption–implications for wellbore stability analysis. Acta Geotech. 2022, 18, 2059–2080. [Google Scholar] [CrossRef]
  7. Kim, E.; Changani, H. Effect of water saturation and loading rate on the mechanical properties of Red and Buff Sandstones. Int. J. Rock Mech. Min. Sci. Géoméch. Abstr. 2016, 88, 23–28. [Google Scholar] [CrossRef]
  8. Liu, X.; Chen, J.; Liu, B.; Wang, S.; Liu, Q.; Luo, J. Effects of seepage pressure on the mechanical behaviors and microstructure of sandstone. J. Rock Mech. Geotech. Eng. 2024, 16, 2033–2051. [Google Scholar] [CrossRef]
  9. Wang, H.; Wu, Y.; Qu, X.; Wang, W.; Liu, Y.; Xie, W.-C. Experimental and numerical investigations on failure process and permeability evolution of weathered granite under hydro-mechanical coupling. Int. J. Rock Mech. Min. Sci. Géoméch. Abstr. 2025, 191, 106117. [Google Scholar] [CrossRef]
  10. Ciantia, M.O.; Castellanza, R.; di Prisco, C. Experimental Study on the Water-Induced Weakening of Calcarenites. Rock Mech. Rock Eng. 2014, 48, 441–461. [Google Scholar] [CrossRef]
  11. Liu, Y.; Zhang, H.; Qin, Z.; Chen, X.; Liu, W. Energy evolution and deformation features of re-loading creep failure in yellow sandstone after cyclic water intrusion. Int. J. Rock Mech. Min. Sci. Géoméch. Abstr. 2025, 186, 106019. [Google Scholar] [CrossRef]
  12. Gotzen, L.; Winhausen, L.; Jalali, M.; Khaledi, K.; Amann, F. The long-term strength and creep behavior of fully saturated shaly Opalinus Clay. Eng. Geol. 2025, 348, 107961. [Google Scholar] [CrossRef]
  13. Yang, C.H.; Wang, Y.Y.; Li, J.G.; Gao, F. Testing study about the effect of different water content on rock creep law. China Coal Soc. 2007, 32, 695–699. (In Chinese) [Google Scholar] [CrossRef]
  14. Sawatsubashi, M.; Kiyota, T.; Katagiri, T. Effect of initial water content and shear stress on immersion-induced creep deformation and strength characteristics of gravelly mudstone. Soils Found. 2021, 61, 1223–1234. [Google Scholar] [CrossRef]
  15. Liu, Y.; Zhuang, W.; Gao, C.; Wei, C.; Xue, L.; Yang, Q. Creep parameter inversion and long-term deformation prediction of a near-dam slope considering spatio-temporal deformation data during construction and impoundment period. Eng. Geol. 2025, 351, 108043. [Google Scholar] [CrossRef]
  16. Nara, Y.; Tanaka, M.; Harui, T. Evaluating long-term strength of rock under changing environments from air to water. Eng. Fract. Mech. 2017, 178, 201–211. [Google Scholar] [CrossRef]
  17. Hawkins, A.B.; McConnell, B.J. Sensitivity of sandstone strength and deformability to changes in moisture content. Q. J. Eng. Geol. 1992, 25, 115–130. [Google Scholar] [CrossRef]
  18. Yang, B.Q.; Zhang, L.; Chen, Y.; Chen, J.; Dong, J.; Liu, E. Experimental study on HM coupling effect of weak structural planes for high arch dam abutment. Disaster Prev. 2017, 37, 636–643. (In Chinese) [Google Scholar] [CrossRef]
  19. Li, T.Y.; Xu, J.; Wang, L.; Ran, J. Experimental research on mechanical characteristics of weak structural plane(zone) under high pore water pressure. Rock Mech. 2012, 31, 3936–3941. (In Chinese) [Google Scholar]
  20. Yu, C.; Tang, S.; Tang, C.; Duan, D.; Zhang, Y.; Liang, Z.; Ma, K.; Ma, T. The effect of water on the creep behavior of red sandstone. Eng. Geol. 2019, 253, 64–74. [Google Scholar] [CrossRef]
  21. Erguler, Z.A.; Ulusay, R. Water-induced variations in mechanical properties of clay-bearing rocks. Int. J. Rock Mech. Min. Sci. 2009, 46, 355–370. [Google Scholar] [CrossRef]
  22. Liu, B.; Zhao, Z.; Chen, S.; Yang, Q. Numerical Modeling on Deformation of Fractured Reservoir Bank Slopes During Impoundment: Case Study of the Xiluodu Dam. Rock Mech. Rock Eng. 2023, 57, 527–543. [Google Scholar] [CrossRef]
  23. Li, M.; Selvadurai, A.P.S.; Zhou, Z. Observations and Computational Simulation of River Valley Contraction at the Xiluodu Dam, Yunnan, China. Rock Mech. Rock Eng. 2023, 56, 4109–4131. [Google Scholar] [CrossRef]
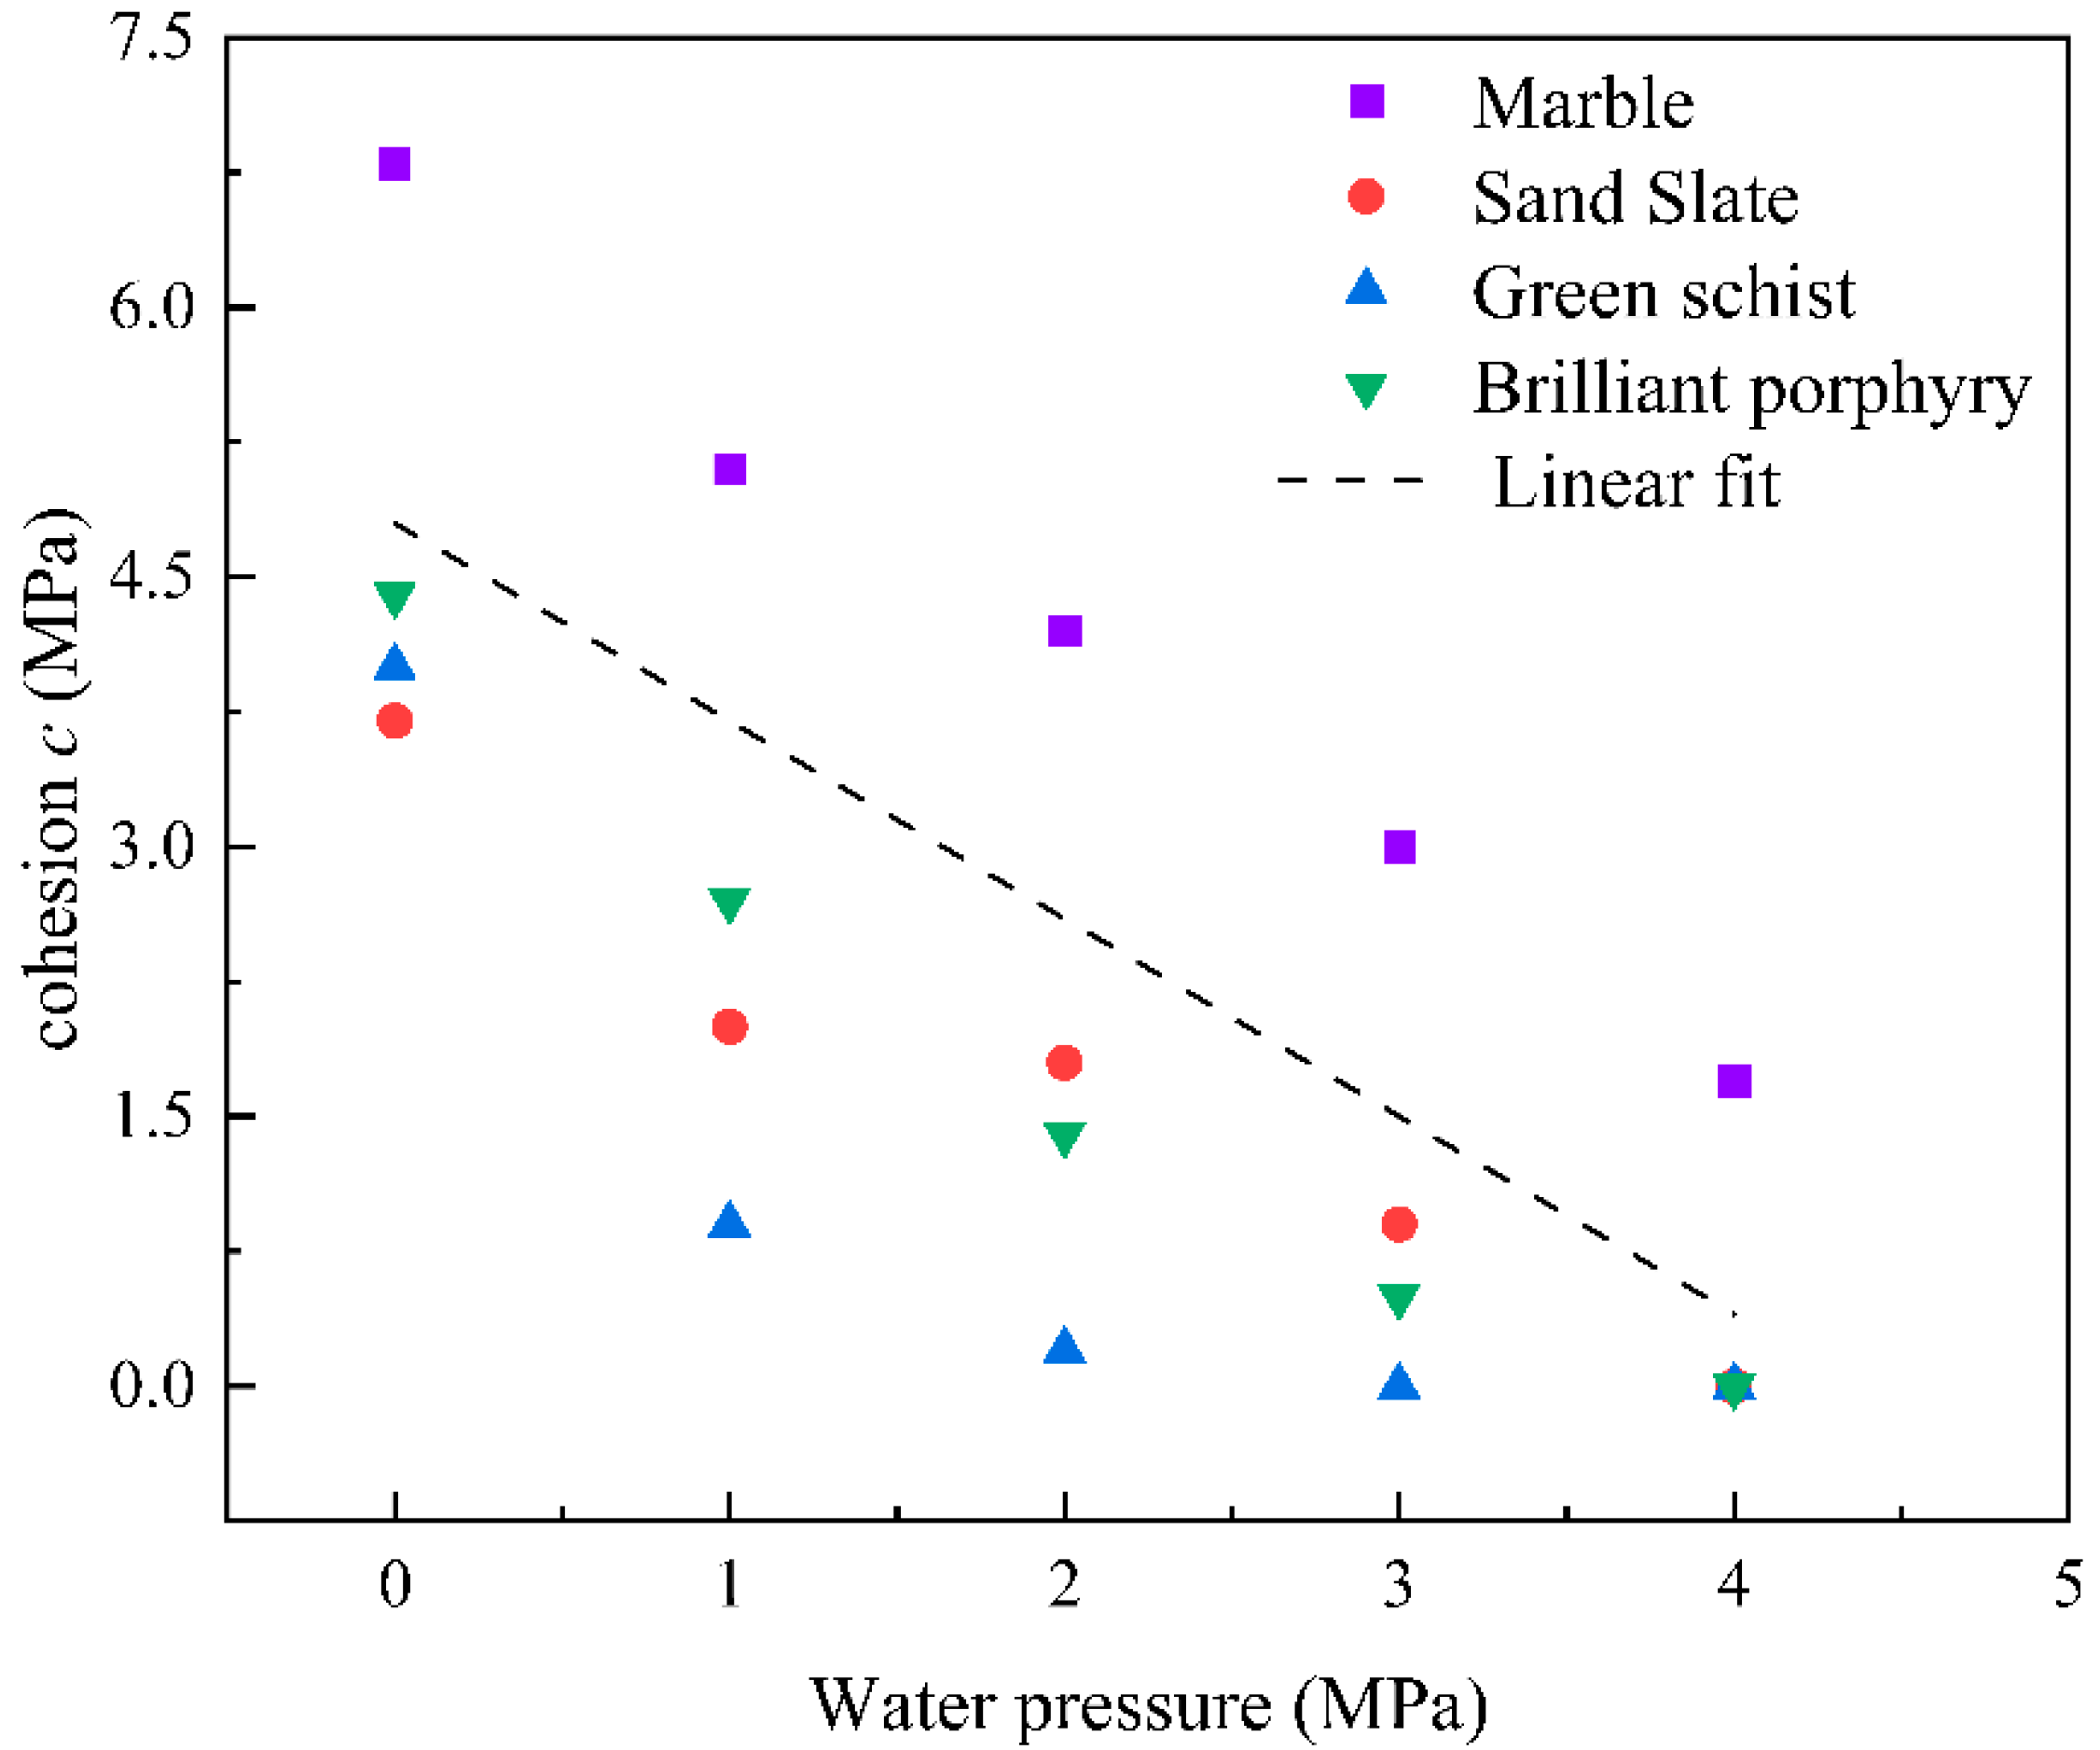
Figure 1. Cohesion (c) versus water pressure.
Water 17 02983 g001
Figure 2. Creep rate of red sandstone with different saturation.
Water 17 02983 g002
Figure 3. Implementation process.
Water 17 02983 g003
Figure 4. Finite element mesh.
Water 17 02983 g004
Figure 5. Comparison of creep experiment and numerical simulation results: (a) dry (s = 0); (b) partially saturated (s = 0.34%); (c) saturated (s = 2.1%).
Water 17 02983 g005
Figure 6. Layout of monitoring path and points.
Water 17 02983 g006
Figure 7. The top axial displacement under different cases.
Water 17 02983 g007
Figure 8. Displacement distribution along Path A–B at 160 h.
Water 17 02983 g008
Figure 9. Contours of saturation and displacement in the specimen at different times.
Water 17 02983 g009
Figure 10. Saturation distribution along Path A–B at various time instants.
Water 17 02983 g010
Figure 11. Finite element model.
Water 17 02983 g011
Figure 12. Reservoir impoundment process.
Water 17 02983 g012
Figure 13. Initial state of the reservoir slope before impoundment. (a) Pore water pressure distribution (Unit: Pa). (b) Saturation distribution.
Water 17 02983 g013
Figure 14. State of the reservoir slope after 5 years of impoundment. (a) Pore water pressure distribution (Unit: Pa). (b) Saturation distribution.
Water 17 02983 g014
Figure 15. Slope deformation curve.
Water 17 02983 g015
Figure 16. Phreatic surface position after 3000 days of impoundment (Unit: Pa).
Water 17 02983 g016
Table 1. Material parameters.
a (MPa) b (-) a (MPa) b (-) k (-) B (-) C (-) D (s) F (s) D (s) F (s)
10020.13−0.010.1−0.91300500−1.36.2
Note: Parameters a, b, m are from Equation (1) for strength degradation; k is from Equation (15) for cohesion decay with pore pressure; A, B, C, n are from Equation (19) for the creep model; D, F are fitting parameters for the relationship between water content and saturation degree. All parameters are dimensionless unless specified otherwise.
Table 2. Material parameters of rock and water.
MaterialElastic Modulus
(GPa)
Poisson RatioVoid RatioDensity
(kg/m3)
Permeability Coefficient
(m/s)
Basalt220.180.0527005 × 10−7
Sedimentary Layer100.30.0526001 × 10−8
Limestone150.220.2025001 × 10−6
Grouted Curtain280.180.0527501 × 10−9
Water---1000-
Disclaimer/Publisher’s Note: The statements, opinions and data contained in all publications are solely those of the individual author(s) and contributor(s) and not of MDPI and/or the editor(s). MDPI and/or the editor(s) disclaim responsibility for any injury to people or property resulting from any ideas, methods, instructions or products referred to in the content.