Article

Comparison of Eukaryotic Community Structures Across Different Habitat Types in the Nearshore Waters of Ma’an Archipelago Based on Environmental DNA Technology

1
College of Oceanography and Ecological Science, Shanghai Ocean University, Shanghai 201306, China
2
Engineering Technology Research Center of Marine Ranching, Shanghai Ocean University, Shanghai 201306, China
3
Comprehensive Workstation for Marine Ranching in the East China Sea Region, Expert Consultative Committee on Marine Ranching Construction, Ministry of Agriculture and Rural Affairs, Shanghai 201306, China
*
Author to whom correspondence should be addressed.
Water 2025, 17(20), 2970; https://doi.org/10.3390/w17202970
Submission received: 15 September 2025 / Revised: 11 October 2025 / Accepted: 13 October 2025 / Published: 15 October 2025
(This article belongs to the Section Oceans and Coastal Zones)

Abstract

Coastal zones are critical areas of marine ecosystems, where biodiversity is a key ecological element for maintaining ecosystem stability and ensuring the sustainability of fishery resources. The Shengsi Ma’an Archipelago Marine Special Reserve features heterogeneous habitats such as rocky reefs, seaweed beds, and artificial aquaculture areas, which are significantly affected by human activities. This study focused on the nearshore waters of Lvhua Island within the reserve. Based on the degree of human disturbance, the study area was divided into five typical habitat types: cage culture area (A), intertidal seaweed bed (B), marine platform area (C), open waters (D), and mussel culture area (E). Environmental DNA (eDNA) technology was employed to analyze the characteristics of eukaryotic community structures across these habitats and their coupling mechanisms with environmental factors. The results showed that a total of 767,360 valid sequences were obtained from 15 seawater samples. Clustering into operational taxonomic units (OTUs) yielded 811 OTUs, taxonomically covering 50 phyla, 104 classes, 220 orders, 334 families, 435 genera, and 530 species. The number of OTUs shared across all habitats was 387. The intertidal seaweed bed (B) had the highest proportion of unique OTUs (4.8%) and showed significant differences (0.01 < p < 0.05) in OTU composition compared to the marine platform area (C) and the mussel culture area (E). Among the major dominant phyla, the abundance of Dinoflagellata across sites was A (74.56%) > E (68.32%) > B (62.15%) > C (58.74%) > D (55.21%). The abundance of Arthropoda across sites was D (27.34%) > C (19.98%) > B (17.89%) > E (9.17%) > A (8.25%). Each of the other sites had 1-2 dominant phyla. Among the major dominant genera, the abundance of an unclassified genus of Dinophyceae was B (41.39%) > C (23.31%) > D (22.03%) > E (19.27%) > A (18.56%). The genus Noctiluca was endemic to Site A, with an abundance of 39.98%. The genus Calanus was dominant in site D (26.17%). The genus Meganyctiphanes was unique to sites C (12.12%) and D (8.76%). The genus Ectopleura was unique to site A. The genus Botrylloides was unique to site E. The remaining genera were evenly distributed across sites without significant habitat specificity. Alpha diversity analysis revealed that the marine platform area (C) had the highest Shannon index (3.32 ± 0.22) and Pielou index (0.54 ± 0.04), while the mussel culture area (E) had the highest Chao1 index (578.96 ± 10.25). All diversity indices were lowest in the cage culture area (A). Principal coordinate analysis (PCoA) and ANOSIM tests indicated significant differences (p < 0.05) in eukaryotic community structures among different habitats. Samples from the seaweed bed clustered separately and were distant from other habitats. Redundancy analysis (RDA) showed that pH was the key environmental factor driving the differentiation of eukaryotic community structure. Temperature was negatively correlated with dissolved oxygen, while salinity was positively correlated with pH. The combined differences in environmental factors were the main drivers of eukaryotic community structure differentiation. In conclusion, this study clarifies the regulatory role of habitat type on the eukaryotic community structure in the nearshore waters of Ma’an Archipelago, confirming a negative correlation between human activity intensity and biodiversity, and a positive correlation between natural habitat complexity and biodiversity. The research findings provide scientific support for assessing the health of the marine ecosystem and formulating ecological conservation and management strategies in this region.

1. Introduction

Coastal zones are critical regions globally, characterized by high productivity, rich biodiversity, and intense interactions between human activities and natural processes [1]. Nearshore waters serve as essential habitats for various marine organisms to complete key life processes such as reproduction, feeding, and growth [2]. Changes in the structure of biological communities in these areas are directly linked to the stability of ecosystem functions [3]. Under the dual pressures of human development and climate change, shifts in biodiversity often act as sensitive indicators of early ecosystem risks [4,5]. Therefore, research on nearshore biodiversity plays a crucial early-warning role in accurately assessing regional ecological health and identifying potential ecological risks [6]. Island and reef waters, with their rich biodiversity and complex habitats, are not only natural gene banks and nursery grounds for numerous economically important species but also key areas for implementing resource restoration measures such as stock enhancement and marine ranching [7]. Studying the composition and dynamics of biodiversity in these regions helps elucidate the mechanisms of fishery resource replenishment, providing a basis for sustainable resource use and adaptive ecological management [8]. Furthermore, biodiversity, as a core indicator for assessing ecosystem health and environmental quality [9,10], plays an irreplaceable role in supporting key ecological processes such as primary production, nutrient cycling, and water purification [11], and is directly related to the continuous provision of ecosystem services [12,13].
Environmental DNA (eDNA) technology is an emerging biological monitoring method [14] that utilizes DNA information from environmental samples such as water to achieve high-throughput, low-disturbance detection of species composition across multiple taxonomic groups [15]. Compared with traditional methods, this technique offers advantages such as high sensitivity and broad coverage, making it particularly suitable for rapid biodiversity assessment in complex nearshore habitats [14,16]. Applying eDNA technology to the study of nearshore biodiversity enables systematic analysis of species distribution and composition at community and trophic levels [17], providing data support for revealing the intrinsic links between ecosystem structure and function [18,19].
Research on coastal marine biodiversity is central to marine ecological conservation and resource management [20]. China’s long coastline and diverse coastal habitats support a variety of ecosystems [21]. Among them, the rocky reef-seaweed bed ecosystems, sustained by large brown algae such as Sargassum horneri and Hizikia fusiforme [22], play vital roles in maintaining biodiversity, providing critical habitats, and enhancing ocean carbon sequestration [23,24]. However, increasing human activities, such as aquaculture, while creating artificial habitats [25], have also led to the fragmentation of natural habitats and increased heterogeneity in water environmental factors [26], profoundly influencing the composition and dynamic succession of biological communities [27]. The gradients formed by the coexistence of natural and artificial habitats provide an ideal template for studying the response of coastal biodiversity to multiple environmental pressures [28].
The coastal waters of Shengsi Lvhua Island, characterized by diverse habitat types and the presence of artificial structures like cage culture and mussel (Mytilus galloprovincialis) floating raft facilities, serve as a typical area for investigating the assembly mechanisms of biological communities under human disturbance [29,30]. Based on this, this study takes these waters as the research area and categorizes them into five typical habitats along a human disturbance gradient: cage culture area, intertidal seaweed bed, marine platform area, open waters, and mussel culture area. Focusing on the eukaryotic community, this research systematically analyzes species composition, diversity patterns, and community structure across these different habitats, and investigates their relationships with environmental factors. The aim is to reveal the impact mechanisms of habitat types on coastal biodiversity, thereby providing a scientific basis for the health assessment, resource management, and conservation restoration of coastal ecosystems.

2. Materials and Methods

2.1. Study Area and Sample Collection

This study was conducted in the waters around Shengsi Lvhua Island (Figure 1). Based on human activity levels, the area was divided into five stations: A, B, C, D, and E. Station A was the cage culture area; Station B was an intertidal seaweed bed dominated by Sargassum horneri; Station C was a marine platform area used for cargo transport, with regular ship traffic; Station D was open waters with minimal human disturbance; Station E was a mussel culture area.
The experiment was conducted in June 2021, a period of increased species richness, more complex community structure, and more diverse food web relationships [31], where interspecific interactions (competition, predation, symbiosis, etc.) are more fully expressed, often providing a more comprehensive reflection of the true potential and characteristics of eukaryotic diversity in an ecosystem [32]. Three sampling points were set at each station, totaling 15 points. Seawater was collected from the surface (1 m below water), middle (5 m below water), and bottom (1 m above seabed) layers. 500 mL of seawater was collected from each layer. The mixed seawater sample was vacuum-filtered through a 0.22 μm pore size glass fiber filter to collect free DNA molecules in the water. The filters were placed in sterile centrifuge tubes and stored at −80 °C until DNA extraction. All site samplings were conducted on the same day.The on-site water environmental factor data were measured in parallel with sampling using a multi-parameter water quality meter (In-Situ, Fort Collins, CO, USA). Temperature, salinity, pH, and dissolved oxygen were measured at 0.5 m intervals from the surface to the bottom to understand the basic environmental conditions of the overall water body. The environmental factor measurements were all conducted at the sites.

2.2. 18S rRNA Gene Amplicon Sequencing and Bioinformatics Analysis

2.2.1. DNA Extraction

Total community genomic DNA extraction was performed using a E.Z.N.A™ Mag-Bind Soi DNA Kit (Omega, M5635-02, Norcross, GA, USA). Wemeasured the concentration of the DNA using a Qubit 4.0 (Thermo Fisher Scientific, Waltham, MA, USA) to ensure that adequate amounts of high-quality genomic DNA had been extracted.

2.2.2. 18S rRNA Gene Amplification by PCR

The target was the V4 conserved region of 18S rRNA gene. PCR was started immediately after the DNA was extracted. The 18S rRNA V4 amplicon was amplified using 2xHieff® Robust PCR Master Mix (Yeasen, 10105ES03, Shanghai, China). The universal 18S rRNA gene amplicon PCR primers (PAGE purified) was used: the amplicon PCR forwardprimer (GGCAAGTCTGGTGCCAG)and amplicon PCR reverse primer (ACGGTATCTRATCRTCTTCG). The reaction was set up as follows: DNA(10 ng/μL) 2 μL; amplicon PCR forward primer (10 μM) 1 μL; amplicon PCR reverse primer (10 μM) 1 μL; 2xHieff® Robust PCR Master Mix (Yeasen, 10105ES03, Shanghai, China) (total 30 μL). The plate was sealed and PCR performed in a thermal instrument (Applied Biosystems 9700, Waltham, MA, USA) using the following program: 1 cycle of denaturing at 94 °C for 3 min, first 5 cycles of denaturing at 94 °C for 30 s, annealing at 45 °C for 20 s, elongation at 72 °C for 30 s, then 20 cycles of denaturing at 94 °C for 20 s, annealing at 55 °C for 20 s, elongation at 72 °C for 30 s and a final extension at 72 °C for 5 min. The PCR products were checked using electrophoresis in 2% (w/v) agarose gels in TBE buffer (Tris, boric acid, EDTA) stained with ethidium bromide (EB) and visualized under UV light.

2.2.3. 18S Gene Library Construction, Quantification, and Sequencing

Used Hieff NGS™ DNA Selection Beads (Yeasen, 10105ES03, Shanghai, China) to purify the free primers and primer dimer species in the amplicon product. Samples were delivered to Sangon BioTech (Shanghai, China) for library construction using universal Illumina adaptor and index (San Diego, CA, USA). Before sequencing, the DNA concentration of each PCR product was determined using a Qubit® 4.0 Green double-stranded DNA assay and it was quality controlled using a bioanalyzer (Agilent 2100, Santa Clara, CA, USA). Depending on coverage needs, all libraries can be pooled for one run. The amplicons from each reaction mixture were pooled in equimolar ratios based on their concentration. Sequencing was performed using the Illumina MiSeq system (Illumina MiSeq, San Diego, CA, USA).

2.2.4. Sequence Processing, OTU Clustering, Representative Tags Alignment and Biological Classification

After sequencing, the two short Illumina readings were assembled by PEAR software (version 0.9.8) according to the overlap and fastq files were processed to generate individual fasta and qual files, use PRINSEQ (version 0.20.4) to remove the bases at the tail end of the reads whose quality values are below 20. Set a 10 bp window. If the average quality value within the window is lower than 20, cut off the bases at the end of the window. Filter the sequences containing N and short sequences after quality control. Finally, remove the sequences with low complexity. Then elect sequences with a length of 300 bp or more for analysis. The effective tags were clustered into operational taxonomic units (OTUs) of ≥97% similarity using Usearch software (version 11.0.667). Chimeric sequences and singleton OTUs (with only one read) were removed, after which the remaining sequences were sorted into each sample based on the OTUs. The tag sequence with the highest abun-dance was selected as a representative sequence within each cluster. 18S taxonomic OTU representative sequences were classified taxonomically by performing a Blast comparison with the Silva Database and NCBI 18S Database.

2.3. Data Statistics and Analysis

2.3.1. Biodiversity Indices

This study used the Shannon index, Chao1 index, and Pielou index to analyze the eukaryotic communities of different habitat types. Among them, the Shannon index reflects the diversity of the community, Chao1 reflects the richness of the community, and Pielou reflects the evenness of the community. The calculation formulas are as follows:
Shannon–Wiener diversity index:
H = i = 1 S P i × ln P i
Chao1 richness index:
S c h a o 1 = S o b s n 1 ( n 1 1 ) 2 ( n 2 + 1 )
Pielou evenness index:
J = H ln S
where S is the number of species; N is the total number of individuals; and Ni is the number of individuals of the ith species. Pi is the proportion of the number of individuals of the ith species to the total number of individuals. Sobs is the number of OTUs actually observed, n1 is the number of OTUs containing only one sequence, and n2 is the number of OTUs containing only two sequences.

2.3.2. Community Structure and Environmental Factors

Principal coordinates analysis (PCoA) based on the Bray–Curtis distance matrix and analysis of similarities (ANOSIM) were used to test community differences between different stations and different growth periods. Redundancy analysis (RDA) was used to analyze the relationship between the eukaryotic community and environmental factors (water temperature, salinity, pH, and dissolved oxygen) [33].
In the above data analysis, statistical processing of species data and analysis of variance (t-test) were performed in EXCEL and IBM SPSS Statistics 25.0, respectively, with the significance level set at α = 0.05 [34]. ArcGIS 10.7, Origin2022, and R 4.3.2 were used for plotting.

3. Results

3.1. Species Composition and Dominant Species

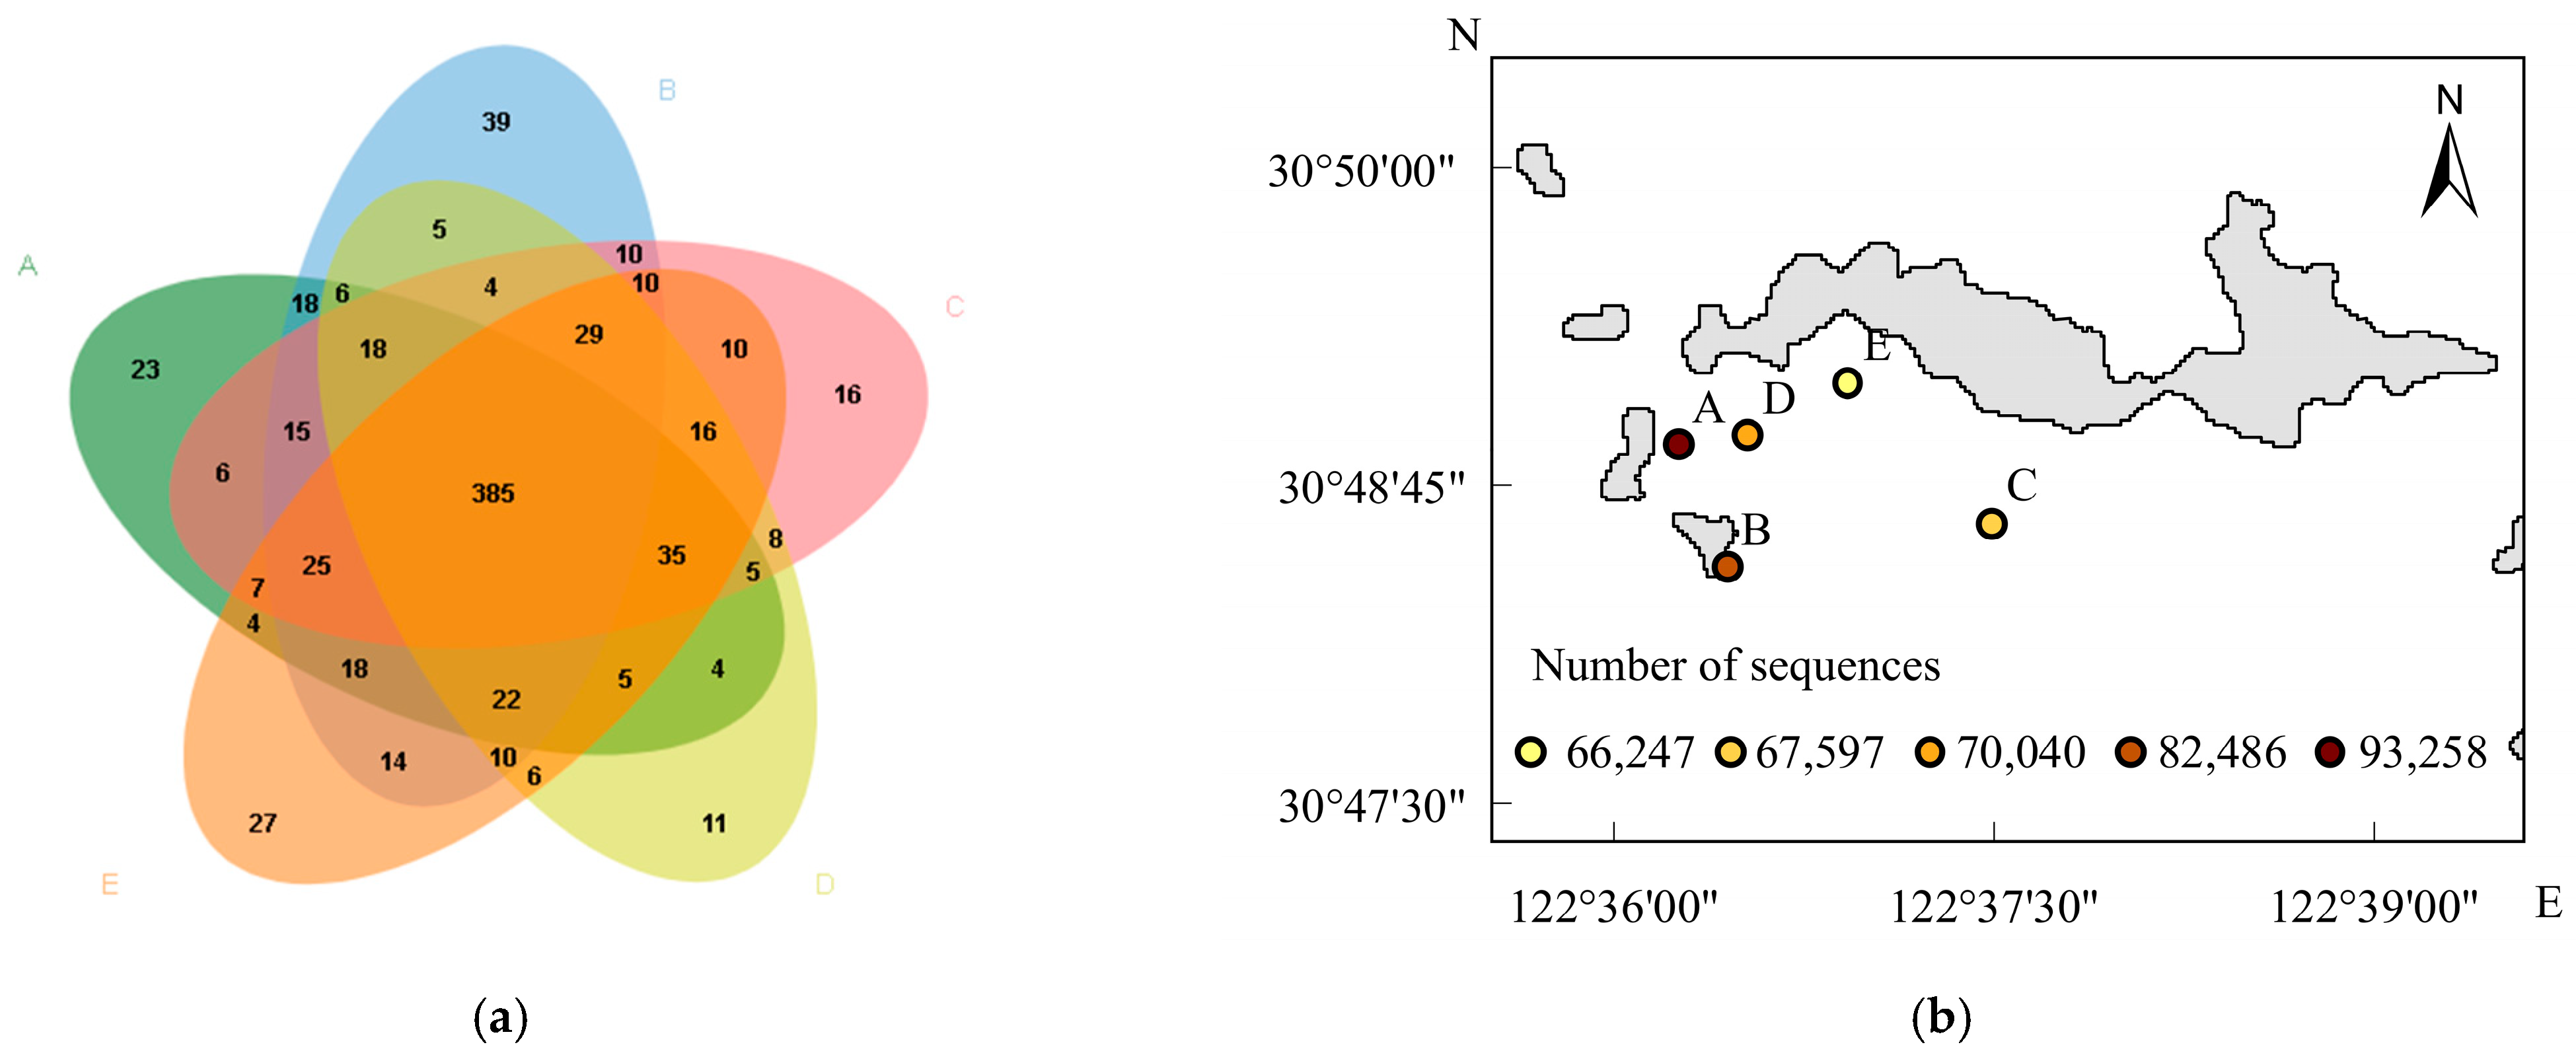
Using 18S rRNA high-throughput sequencing technology, a total of 767,360 biological sequences were obtained from 15 seawater samples collected in the nearshore waters of Ma’an Archipelago, with the number of sequences per sample ranging from 145,091 to 160,112. The valid sequences from the 5 stations were clustered into OTUs at 97% similarity for non-repetitive sequences (excluding singletons). Chimeras were removed during the clustering process to obtain representative sequences for OTUs. After clustering, a total of 811 OTU groups were obtained from all biological sequence stations (Figure 2b). After filtration such as biological classification and removal of unknown sequences, a total of 379,610 effective sequences were obtained for the analysis of the results.The biomass at each station is shown in Figure 2b. There were 385 common OTU groups across all sample groups (Figure 2a). The seaweed bed had the most unique OTUs (4.8%). t-test results showed significant differences (0.01 < p < 0.05) in OTU numbers between the seaweed bed and both the platform and mussel culture areas. There was also a significant difference (0.01 < p < 0.05) in OTU numbers between the open waters and the mussel culture area. There was no significant difference in OTU numbers between the cage culture area and other stations. The coverage of each sample group was ≥99.50%.
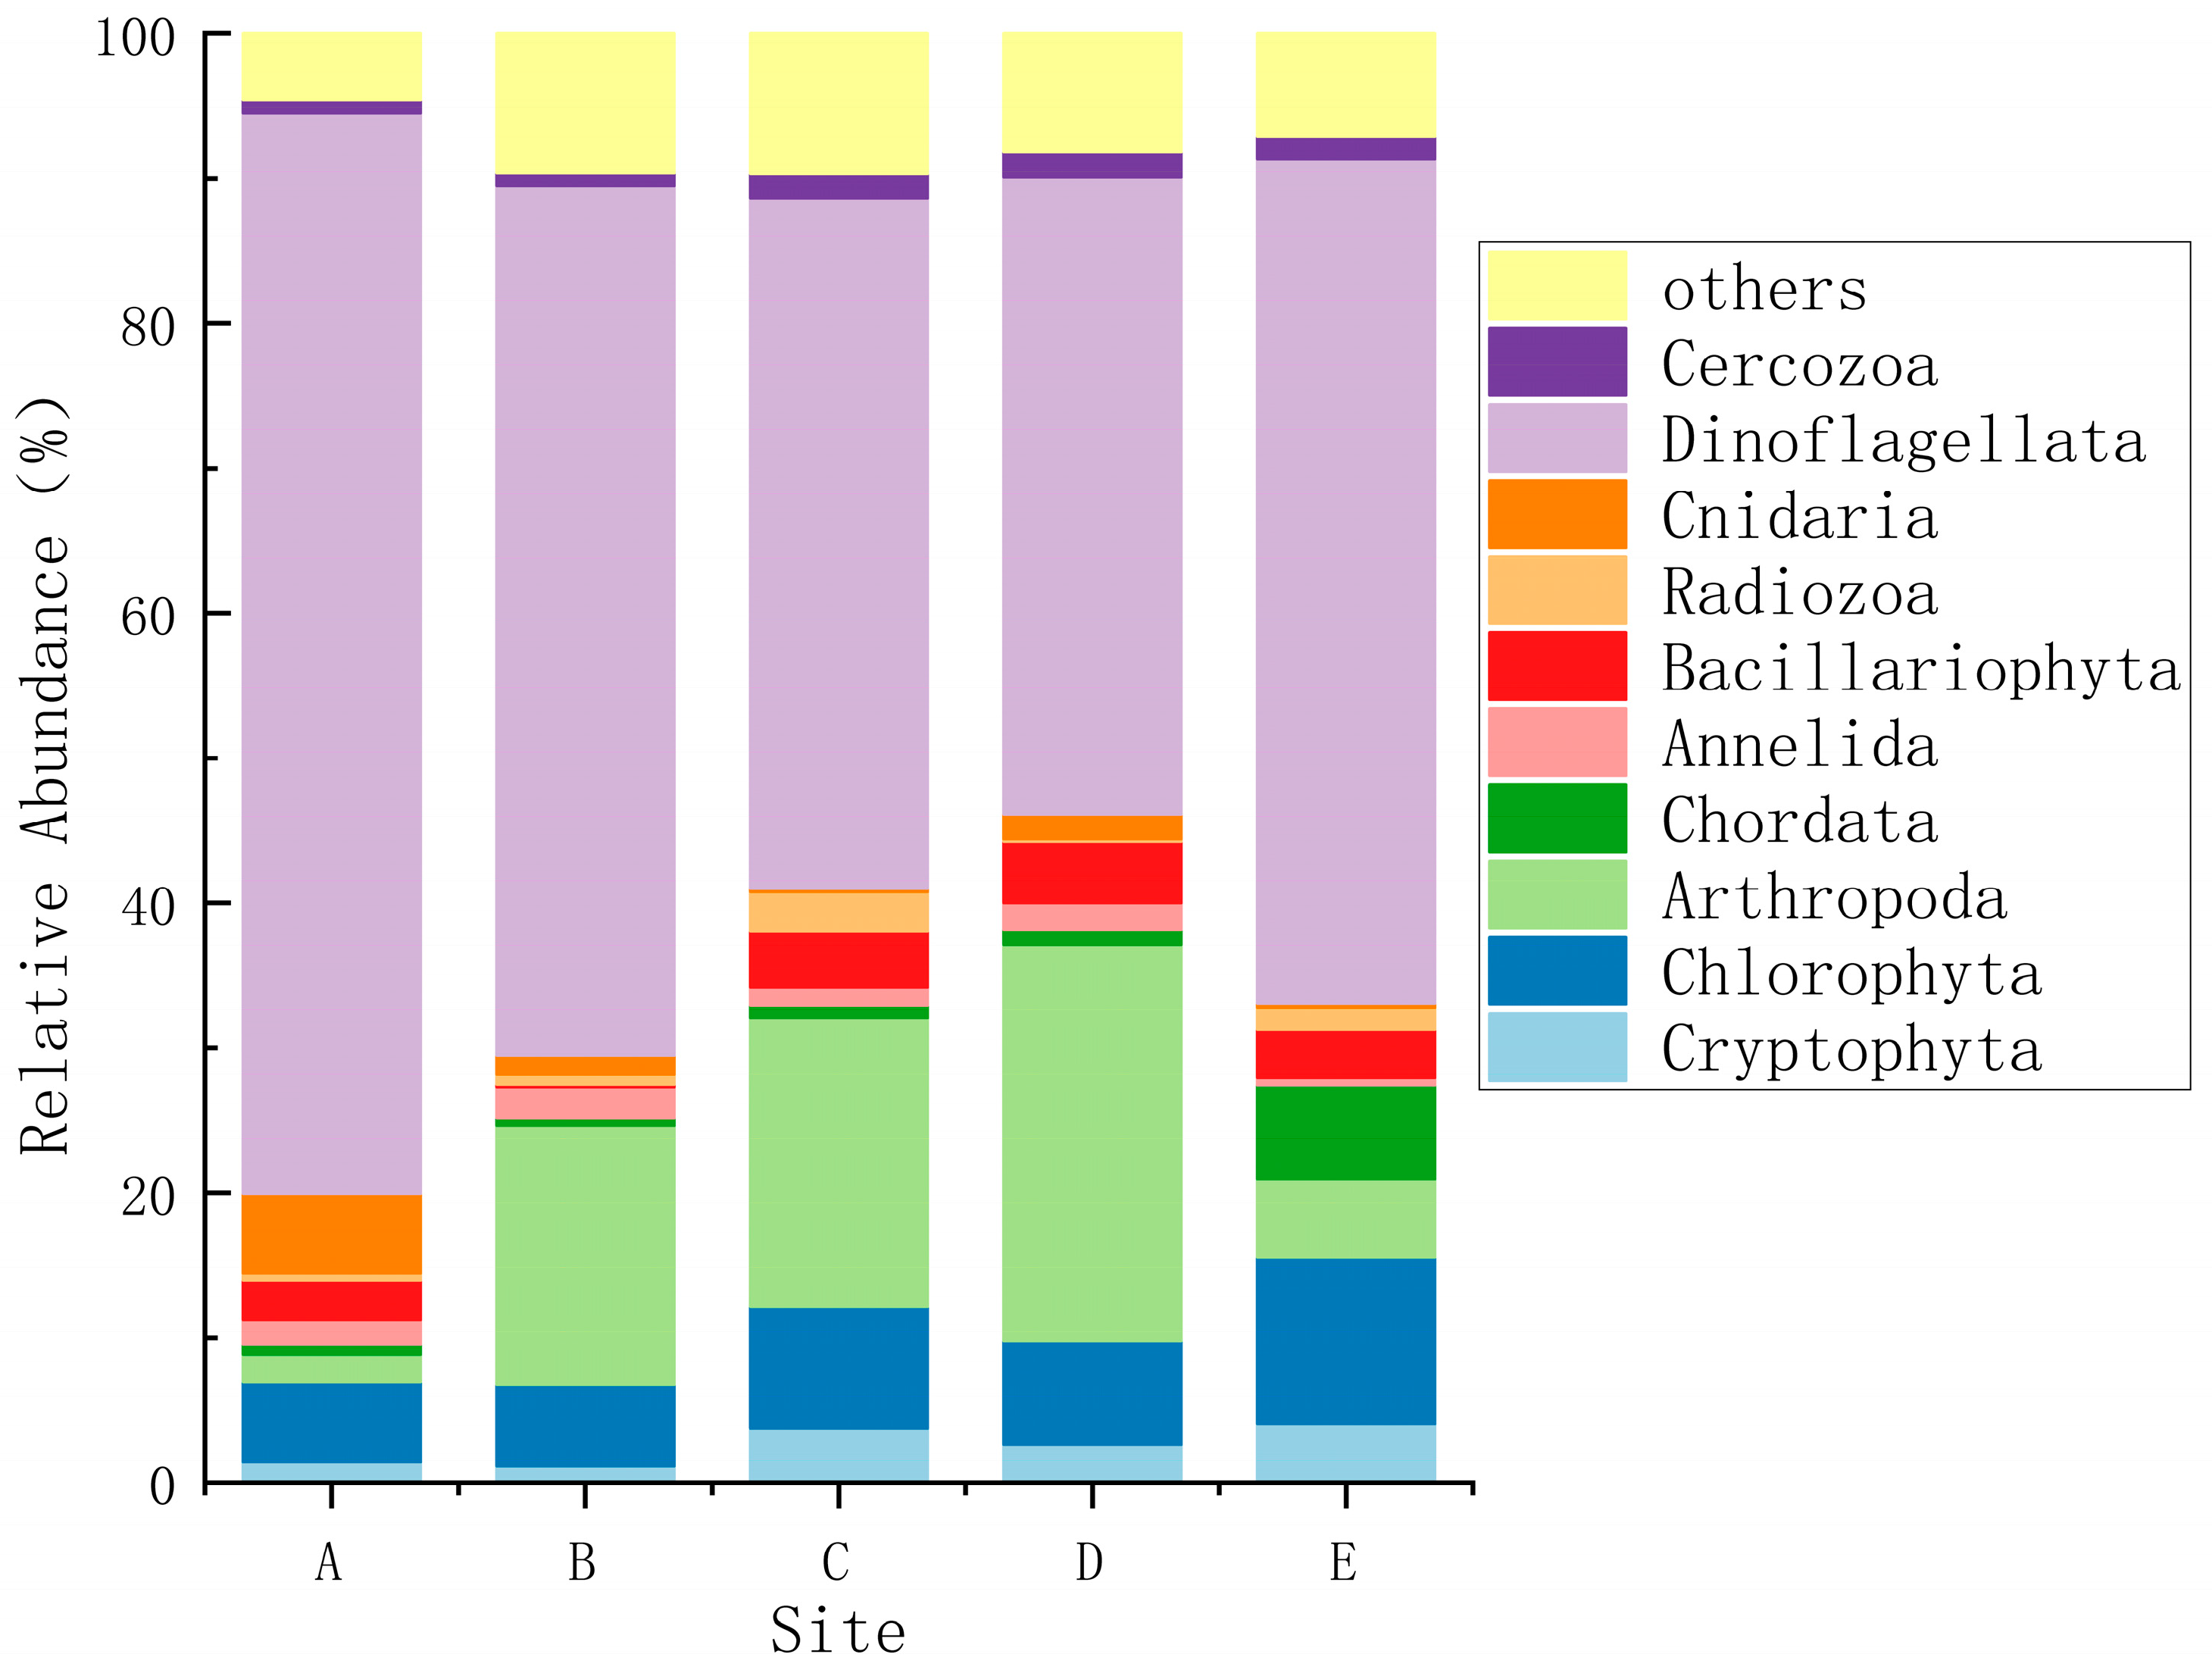
By comparing and annotating the sequencing results with databases, the 811 OTUs were classified into 50 phyla, 104 classes, 220 orders, 334 families, 435 genera, and 530 species. At the phylum level (Figure 3), the relative abundances of some species varied considerably between stations. Dinoflagellata, Chlorophyta, and Arthropoda were the main dominant biological groups. Dinoflagellata was the absolute dominant phylum at all stations, with the highest relative abundance in the cage culture area (A) (74.56%), followed by the mussel culture area (E, 68.32%), seaweed bed (B, 62.15%), platform area (C, 58.74%), and the lowest in open waters (D) (55.21%). This distribution characteristic is closely related to the adaptability of Dinoflagellates to eutrophic environments [35], with high nutrient input in the cage culture area providing favorable conditions for dinoflagellate proliferation. Arthropoda showed significant dominance in habitats with minimal natural disturbance, with the highest relative abundance in open waters (D) (27.34%), followed by the platform area (C, 19.98%) and seaweed bed (B, 17.89%). Relative abundances were significantly lower in the cage culture area (A, 8.25%) and mussel culture area (E, 9.17%), reflecting the preference of arthropods for clean water and natural food conditions. Chlorophyta was the second dominant phylum in the mussel culture area (E) (11.52%), with relative abundances < 5% in other habitats. This is directly related to the habitat characteristics of the mussel culture area, where rafts reduce water flow, facilitating the settlement and colonization of green algal spores. Meanwhile, the filter-feeding activity of mussels removes small plankton, reducing competitive pressure on green algae. Furthermore, the relative abundance of Chordata in the mussel culture area (E) reached 6.50%, much higher than in other samples (0.51–1.01%). Bacillariophyta had relatively high abundances in the platform area (C, 3.88%) and open waters (D, 4.22%), but was only 0.22% in the seaweed bed (B), possibly due to competition for nutrients with seaweeds. Cnidaria had the highest relative abundance in the cage culture area (A) (5.46%), while it was <0.3% at other stations, consistent with its ecological habit of relying on hard substrates of cages for attachment. Cryptophyta had overall low abundance (1.18–4.03%), highest in the mussel culture area (E) and lowest in the seaweed bed (B), indirectly indicating a generally low eutrophication level in the study area. Radiozoa had a relative abundance of 2.71% in the platform area but was less abundant at other stations. Cnidaria had the highest relative abundance in the cage aquaculture area, at 5.46%. The relative abundances in the platform area and the mussel aquaculture area were both less than 0.3%, which might be related to the rich nutrients in the water, the gentle current, and the ease of net cage attachment in this area. Cercozoa and Annelida had very low relative abundances at all stations with no significant differences.
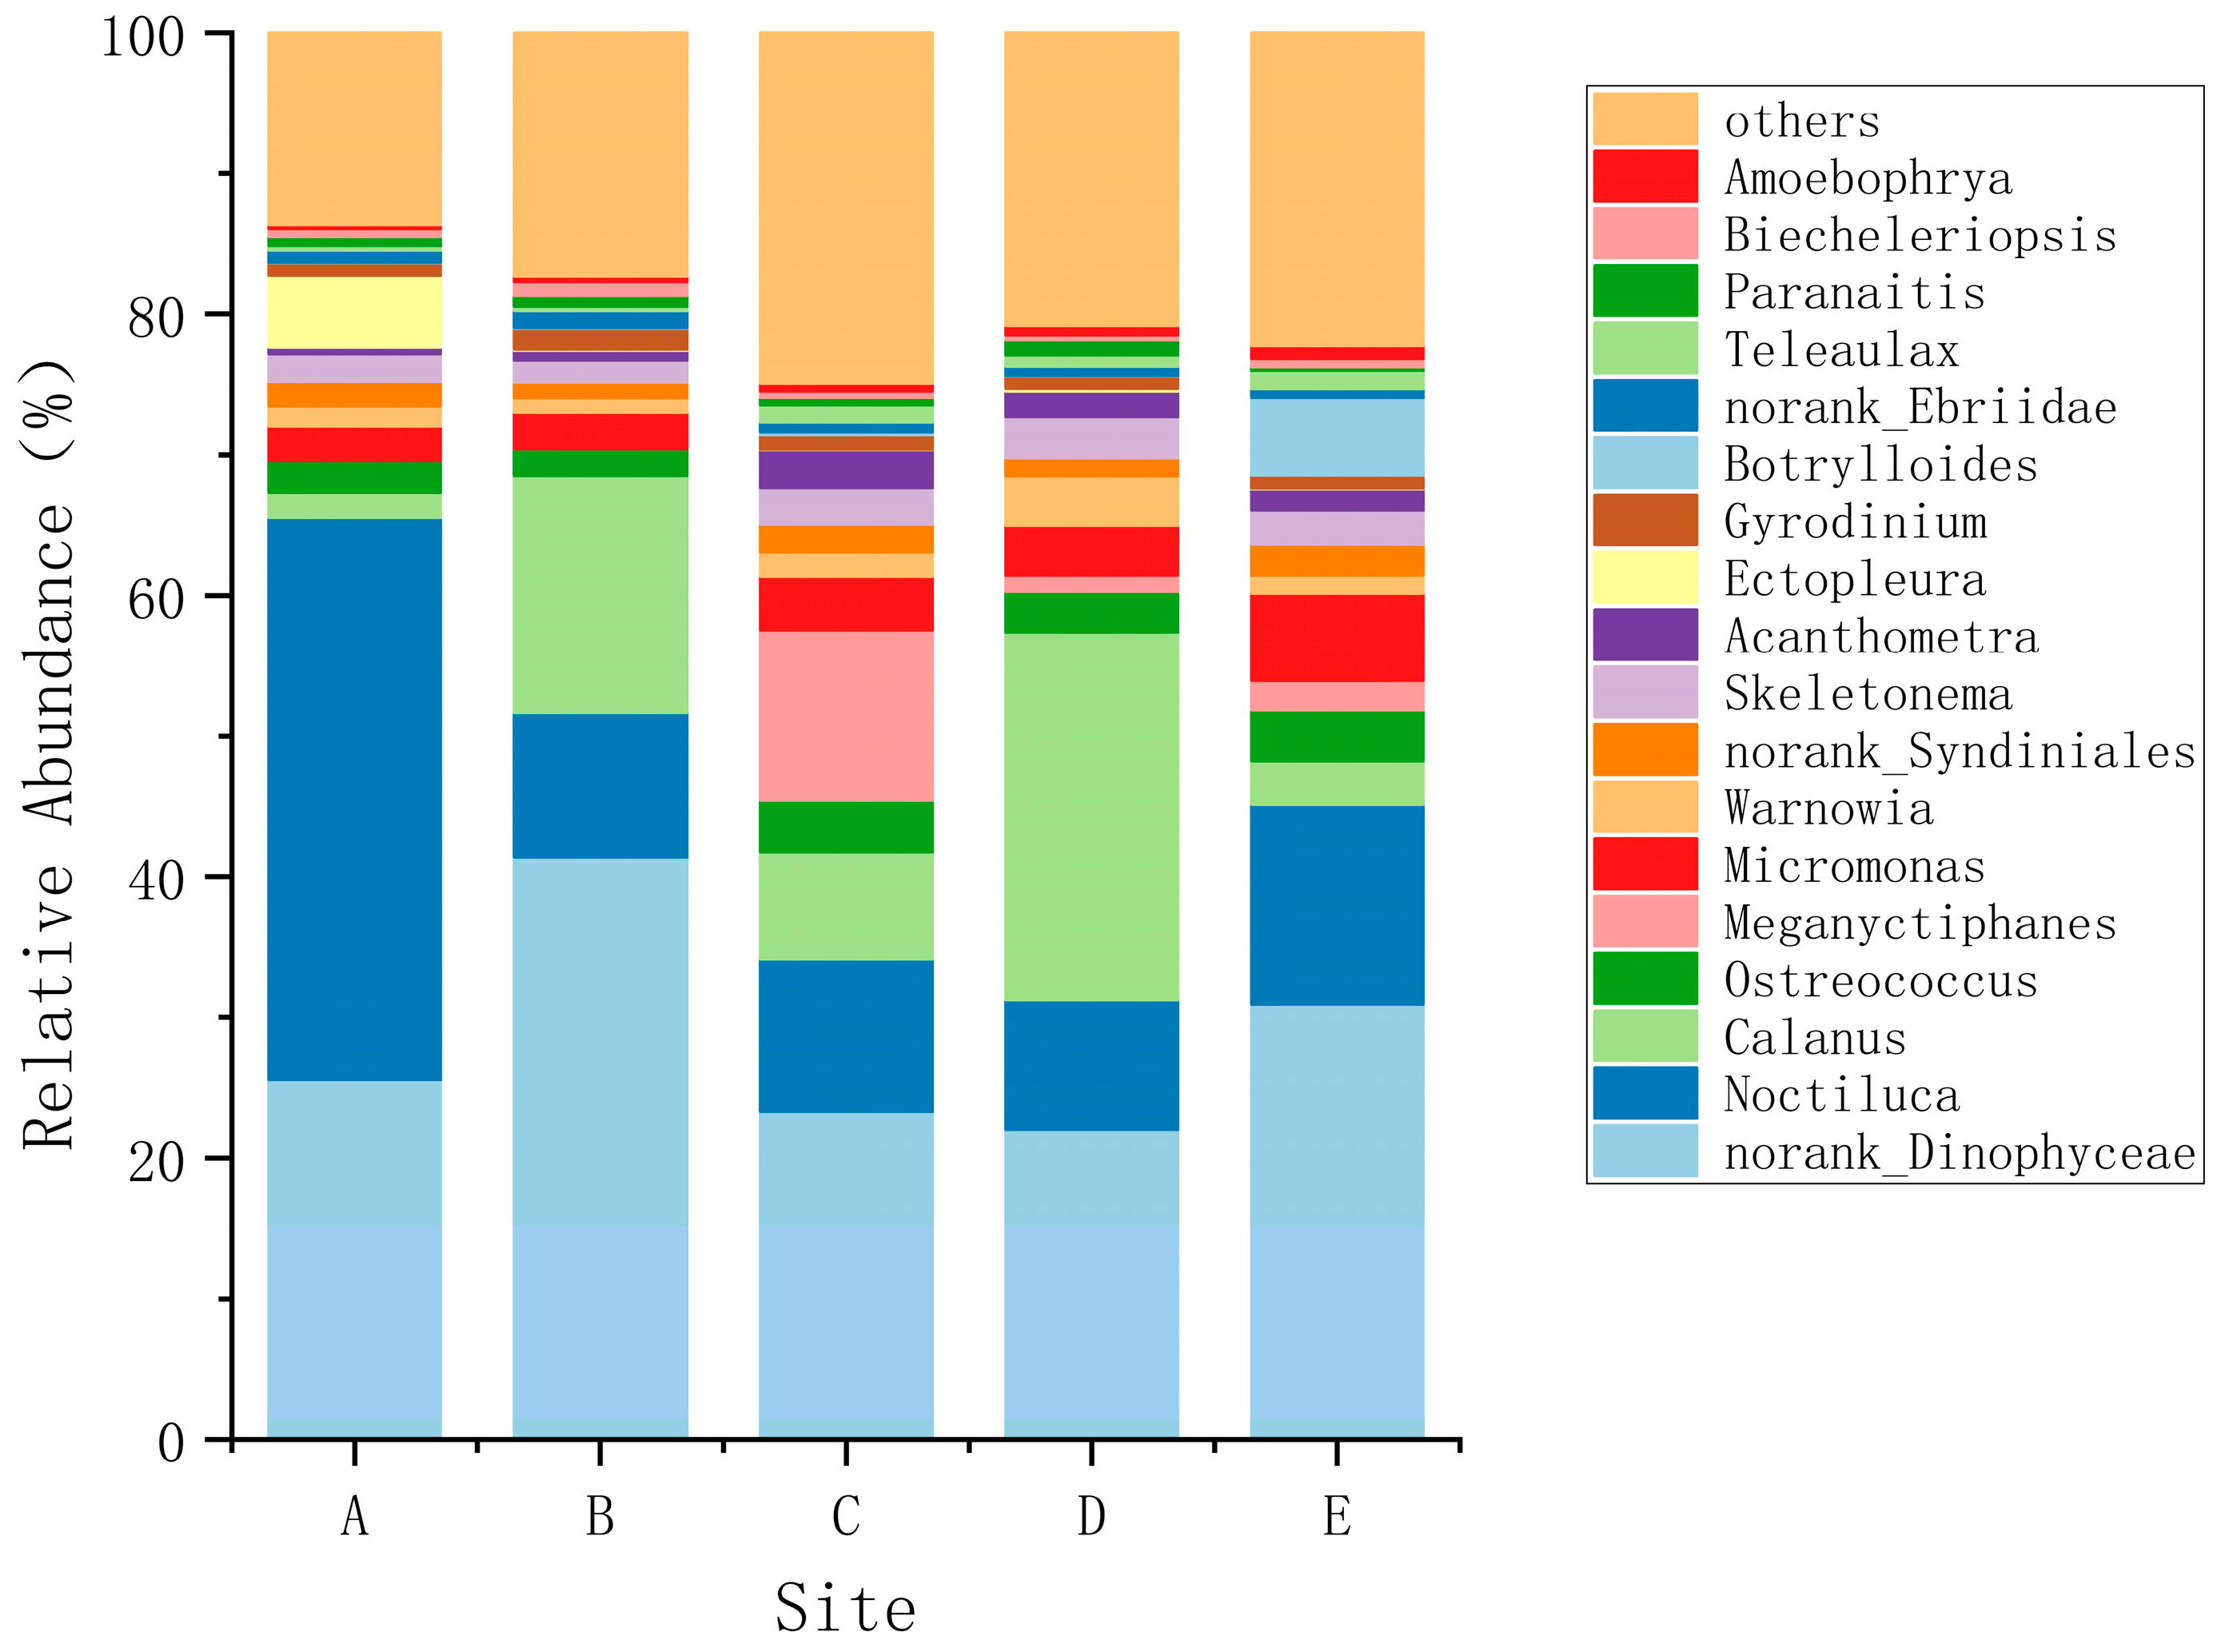
At the genus level (Figure 4), the differences in dominant genera among the various stations were further revealed. A certain genus of Dinophyceae (norank_Dinophyceae) and Noctiluca were the main dominant genera. The certain genus of Dinophyceae had the highest relative abundance in the seaweed field (B) at 41.39%, followed by the platform area (C, 23.31%) and the open sea (D, 22.03%), while the relative abundance was lower in the cage culture area (A, 18.56%) and the mussel culture area (E, 19.27%). Noctiluca was the characteristic dominant genus in the cage culture area (A), with a relative abundance of 39.98%, which was 3 to 8 times that of the other stations. As a typical indicator of eutrophication [36], its high abundance directly reflected the nutrient enrichment characteristics of the cage culture area. Calanus was significantly dominant in the open sea (D), with a relative abundance of 26.17%, while it was only 1.80% in the cage culture area (A), demonstrating the preference of plankton for clean water and abundant food in natural sea areas. In terms of endemic genera, Meganyctiphanes was only found in the platform area (C, 12.12%) and the open sea (D, 8.76%), with an abundance of 0 in the cage culture area (A), and only one sequence was detected in the seaweed field (B). It is speculated that this is related to the habitat space provided by artificial structures in the platform area and the natural environment of the open sea. Ectopleura had a relative abundance as high as 5.09% in the cage culture area, much higher than that of the other stations, which was consistent with the results at the phylum level. Botrylloides was the endemic dominant genus in the mussel culture area (E), with a relative abundance of 5.48%, while it was less than 0.5% in the other stations, which was in line with the habitat characteristics of the mussel culture area with abundant floating rafts and ropes as attachment substrates. Among the top 20 genera in terms of relative abundance, the remaining genera such as Ostreococcus, Micromonas, Warnowia, and Skeletonema were relatively evenly distributed among the stations, without significant habitat specificity, and were common groups in this sea area.
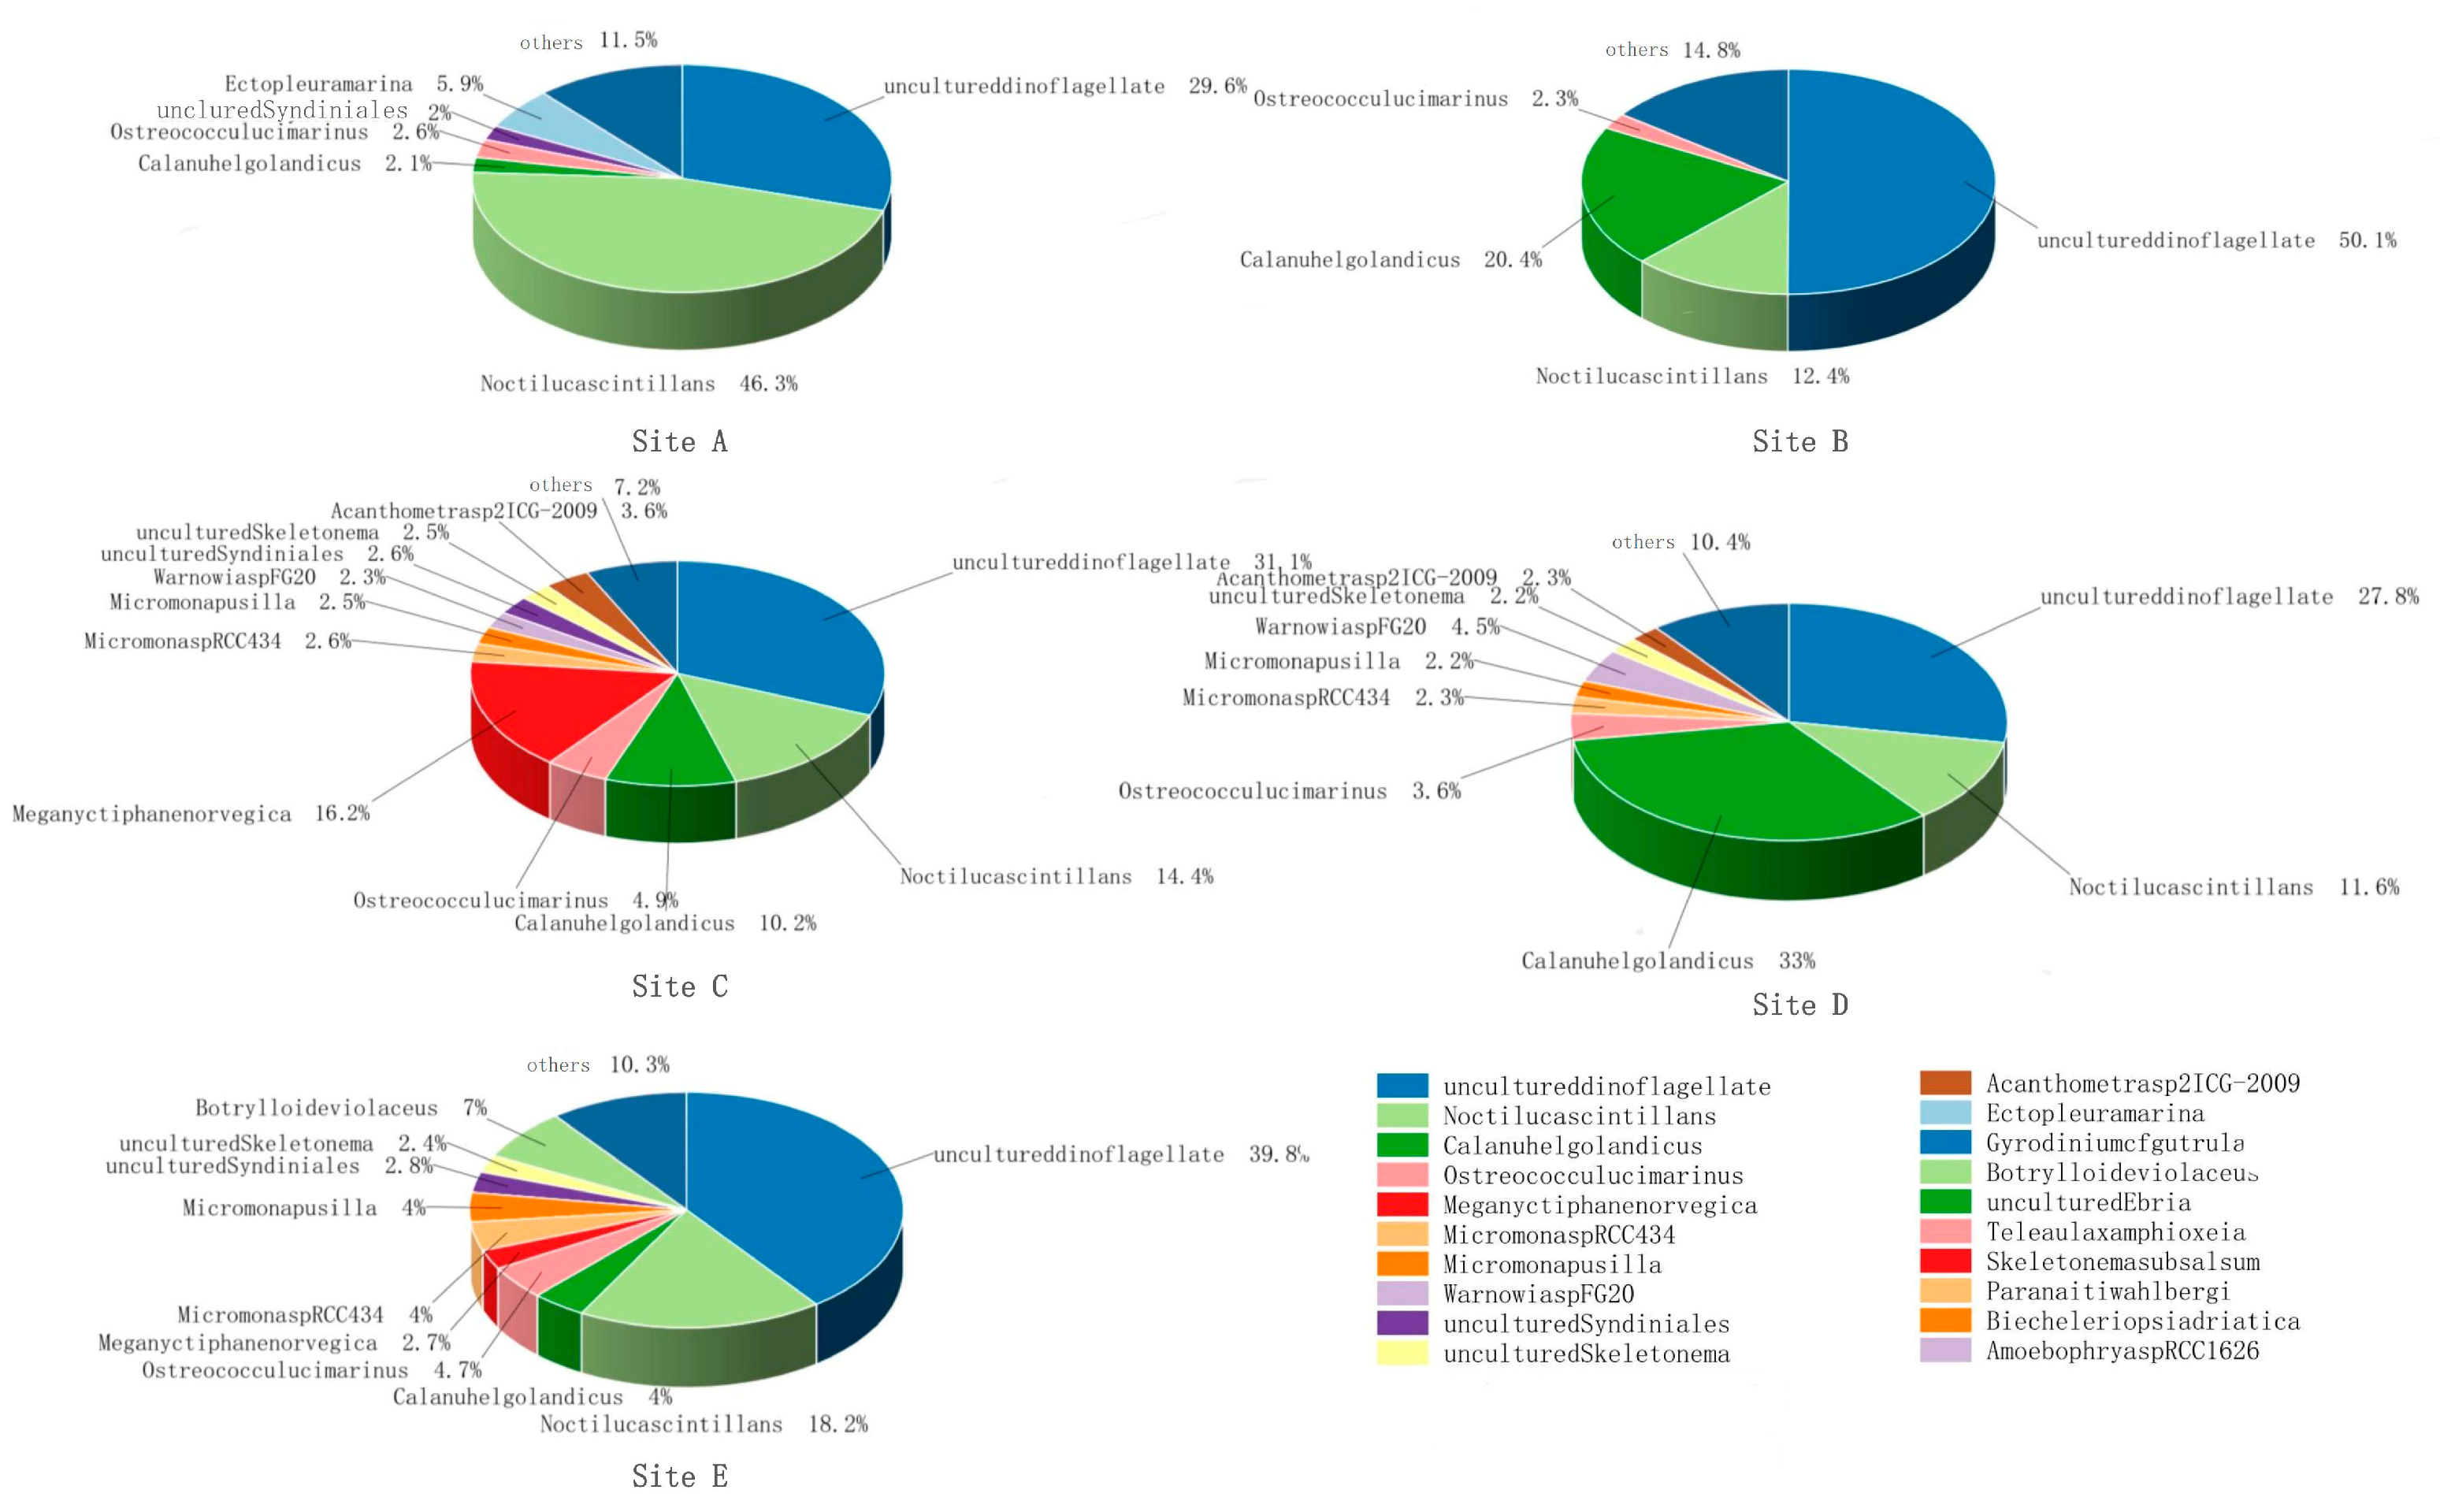
At the species level, each station has its own dominant and endemic species (Figure 5), and there are significant differences among the sites. In the cage culture area (A), the dominant species are an uncultureddinoflagellate (34.58%), Noctilucascintillans (39.98%), and Ectopleuramarina (5.09%). Among them, Noctilucascintillans and Ectopleuramarina are the endemic dominant species of this habitat, which are respectively related to high nutrient input and the hard substrate of the cage. In the kelp bed (B), the dominant species are an uncultureddinoflagellate (41.39%) and Calanushelgolandicus (17.89%). The high abundance of Calanushelgolandicus is closely related to the food provided by kelp (microorganisms, organic debris) and the shelter space. In the platform area (C), the dominant species are an uncultureddinoflagellate (23.31%), Calanushelgolandicus (19.98%), and Meganyctiphanesnorvegica (12.12%). Meganyctiphanesnorvegica is the endemic dominant species of this habitat and relies on the platform structure to aggregate and inhabit. In the open sea (D), the dominant species are an uncultured dinoflagellate (22.03%) and Calanushelgolandicus (26.17%). The species composition is simple and the dominant species are stable, reflecting the community characteristics of the natural sea area. In the mussel culture area (E), the dominant species are an unculturedinoflagellate (19.27%) and Botrylloideviolaceus (5.48%). Botrylloideviolaceus is the endemic dominant species of this habitat and is a typical representative of raft-attached organisms.

3.2. Biodiversity Characteristics

The richness, diversity, and evenness among stations in different habitats of the Ma’an Archipelago nearshore waters are shown in Table 1. There were no significant differences between stations (p > 0.05). Shannon diversity index: The platform area had the highest value, followed by open waters, mussel culture area, seaweed bed, and the cage culture area (A, 2.45 ± 0.50) had the lowest. Higher human disturbance intensity correlated with lower community diversity. The platform area had optimal diversity due to minimal artificial disturbance and the presence of additional attachment space. Chao1 richness index: The mussel culture area had the highest value, followed by the seaweed bed. The platform area and open waters were similar, and the cage culture area had the lowest. This reflects that although the mussel culture area is artificially disturbed, the attachment space provided by rafts significantly increased species richness. Pielou evenness index: The platform area had the highest value, followed by open waters and the mussel culture area. The seaweed bed and cage culture area had the lowest values. The over-concentration of the dominant species Noctiluca in the cage culture area resulted in the poorest community evenness, while species distribution was more balanced in the platform area.

3.3. Relationship Between Community Composition and Environmental Factors

The planar distribution of major ecological environmental factors in the surface waters is shown in Table 2, indicating significant spatial heterogeneity. Coastal stations (A, B, E) had higher temperatures (21.22~21.48 °C), while open waters (D, 20.93 °C) and the platform area (C, 20.77 °C) had lower temperatures, showing a gradual decrease from the coast to open waters, related to the thermal effect of land on the coast and sufficient water exchange in open waters. Open waters (D) and the platform area (C) had higher salinity (32.37 psu), while coastal stations (A, B, E) had lower salinity (30.87~30.93 psu), consistent with the hydrological characteristics of coastal waters influenced by Yangtze River Diluted Water, which carries freshwater lowering coastal salinity. pH was highest in the mussel culture area (E, 9.22 ± 0.15) and open waters (D, 9.20 ± 0.25), followed by the platform area (C, 9.10 ± 0.17), and lowest at coastal stations (A, B, 8.93 ± 0.05), showing a gradual decrease from east to west. Stronger phytoplankton photosynthesis in the eastern waters led to higher pH values. Dissolved oxygen was highest in the seaweed bed (B, 5.67 ± 0.43 mg/L) and cage culture area (A, 5.67 ± 0.43 mg/L), followed by open waters (D, 5.35 ± 0.37 mg/L) and the mussel culture area (E, 5.24 ± 0.43 mg/L), and lowest in the platform area (C, 4.99 ± 0.46 mg/L). High dissolved oxygen in the seaweed bed is closely related to oxygen production from photosynthesis by Sargassum horneri, while the lowest dissolved oxygen in the platform area is due to consumption by ship traffic and microbial activity.
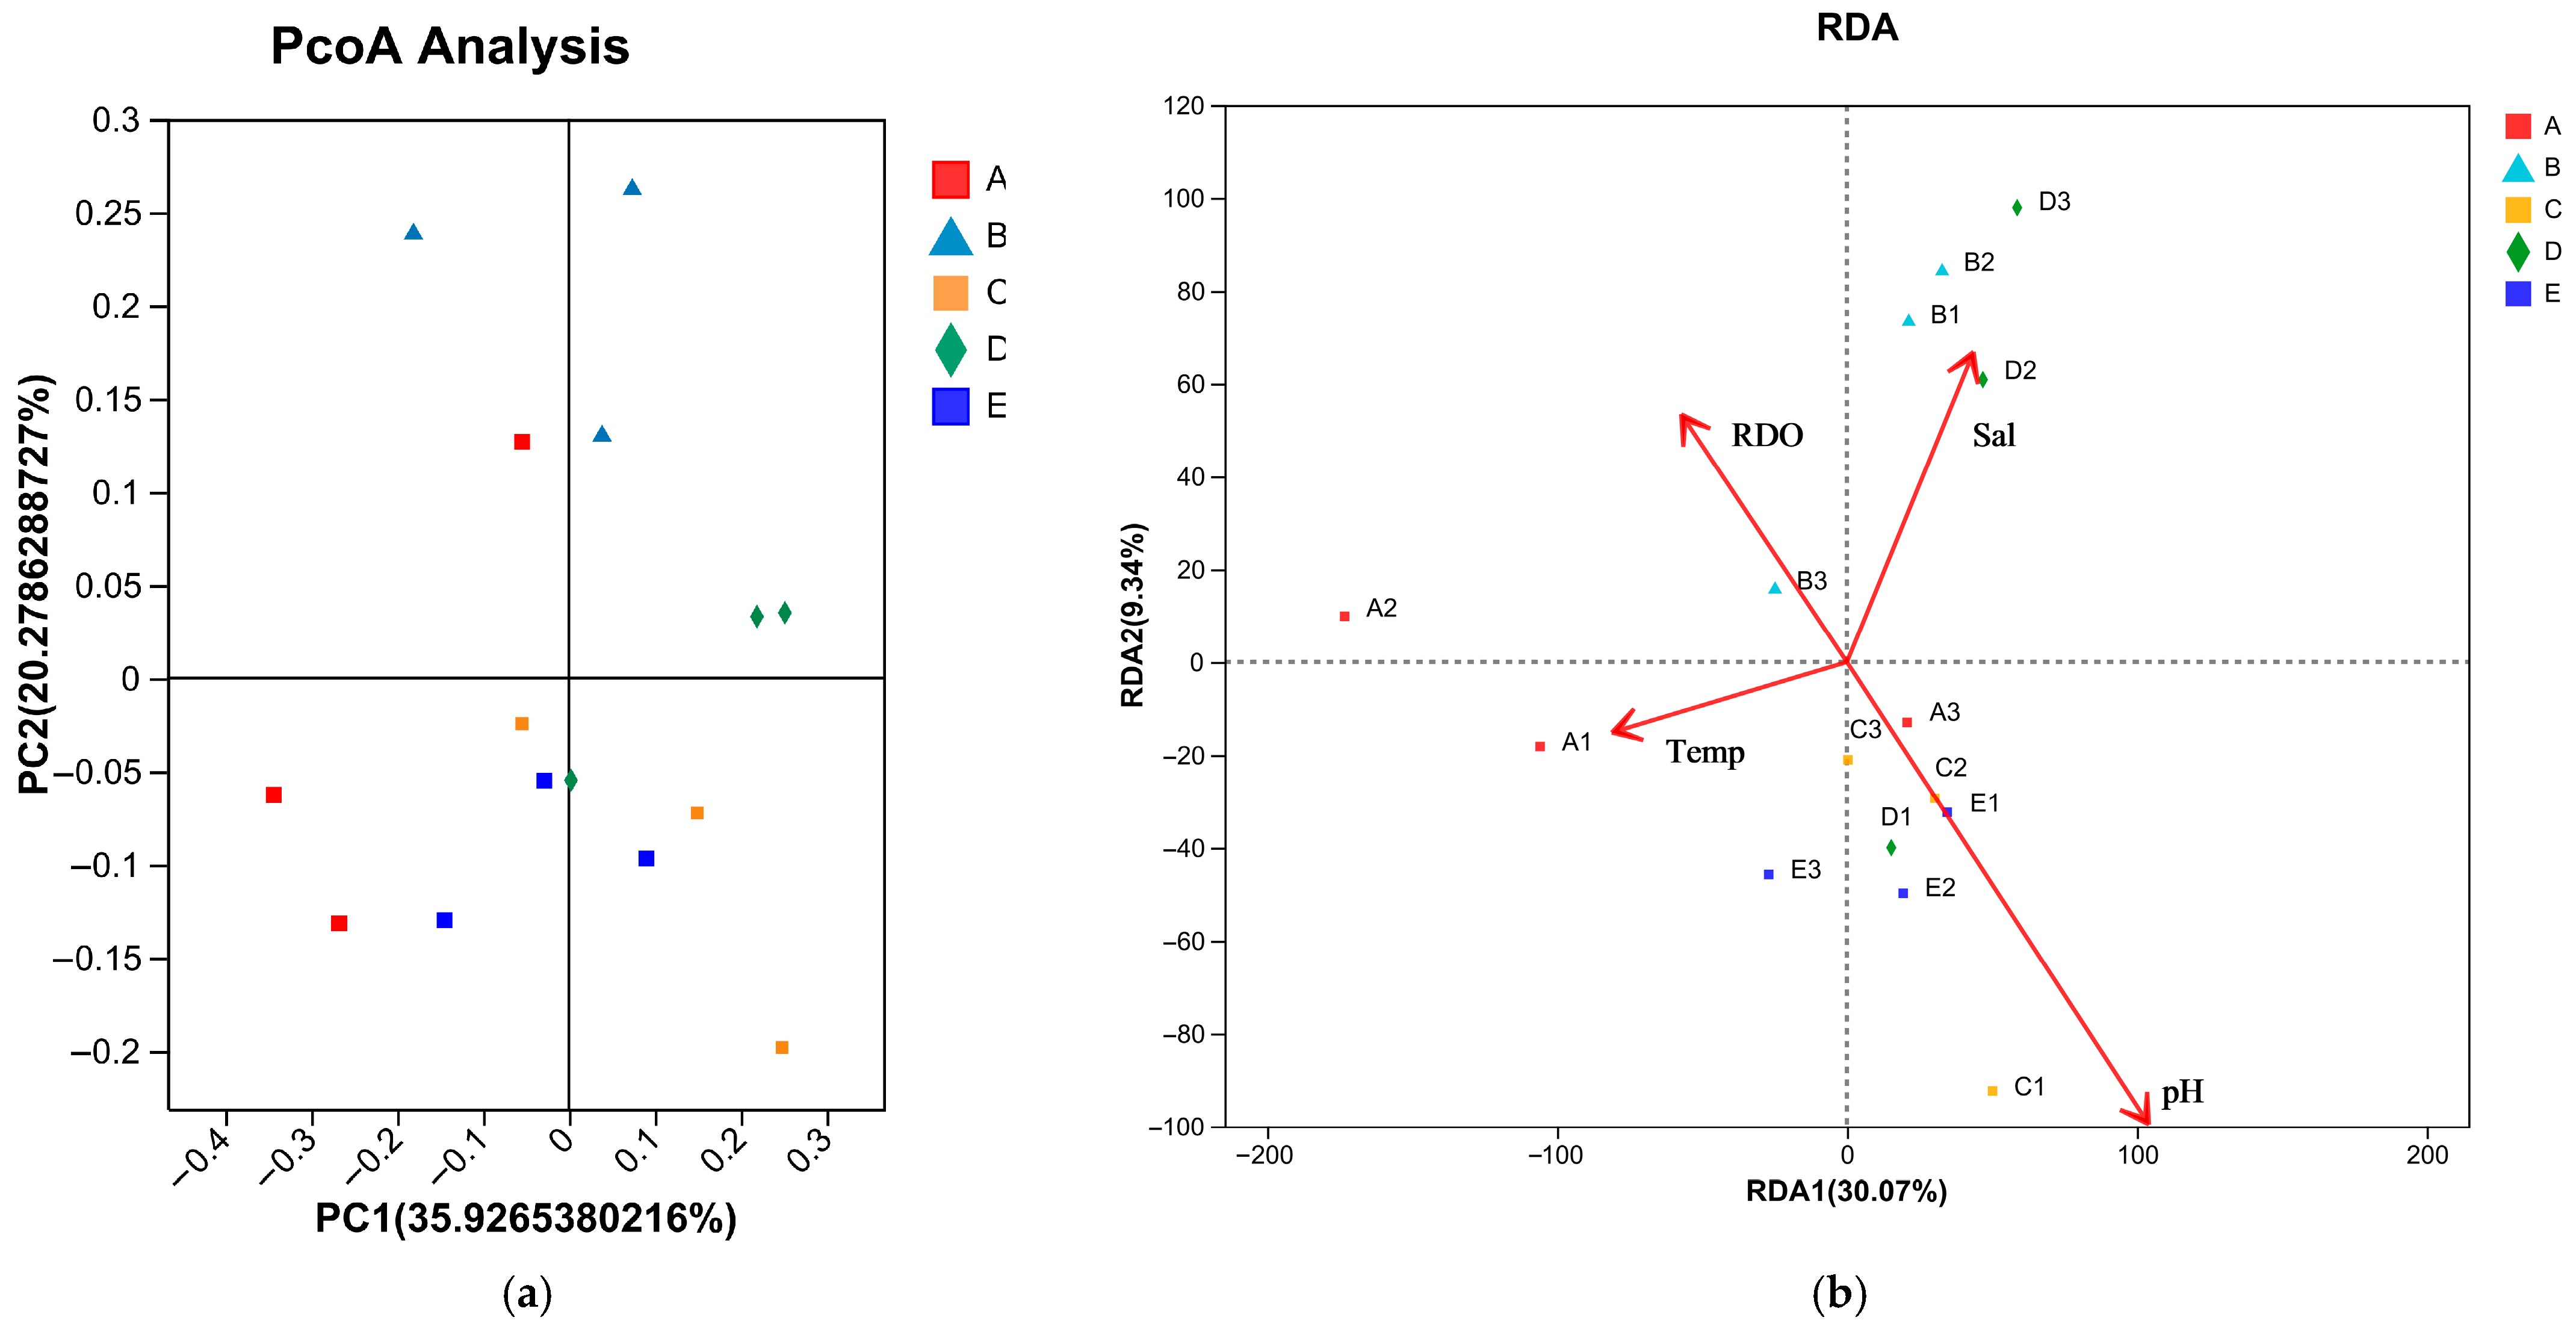
Principal coordinate analysis based on the Bray–Curtis distance showed significant differences in eukaryotic community structures among different habitats in the Ma’an Archipelago nearshore waters, and different habitats could be clearly distinguished on the PCoA plot (Figure 6a). As shown in Figure 6a, the contribution rates of the first and second coordinates to sample differences were 35.93% and 20.28%, respectively. Samples from the rocky seaweed bed clustered separately and were distant from samples from the mussel culture area and platform area, indicating differences in biological community structure between the seaweed bed and other stations. There was only slight overlap among other stations, indicating differences between them as well. Further analysis using ANOSIM showed significant differences in biological community structure among stations (p < 0.05), with differences between groups being significantly greater than those within groups.
RDA results for different stations showed that the contribution rates of the first and second coordinates to sample differences were 30.07% and 9.34%, respectively (Figure 6b). Biological distribution was highly correlated with all four environmental factors. On the RDA1 axis, temperature and dissolved oxygen showed a complete negative correlation with species distribution, with similar contribution degrees to community variation. pH and salinity showed a complete positive correlation with species distribution. The distance between sample points and arrows indicated that pH had the greatest influence on the samples. On the reduced RDA2 axis, various influencing factors also determined the differences in species distribution at different stations to varying degrees. Judging from the contribution of environmental factors, pH had the greatest impact on community variation. The distribution of sample points from different groups in different environmental gradient zones might also be related to the geographical location and region of the sea area, indicating large differences in the combination of environmental factors among different station groups, leading to significant differentiation in biological community composition.

4. Discussion

4.1. Habitat Specificity of Species and Dominant Species Composition

This study found that the species composition of eukaryotic communities in different habitats in the coastal area of Ma’an Archipelago exhibited a high degree of similarity (the proportion of common OTUs was 47.72%), but the types and abundances of dominant species showed significant habitat specificity. This result is consistent with the finding of Weiher, E. & Keddy, P.A. in 1995 that the environment has an impact on community formation [37]; that is, habitats select dominant groups that are adapted to the local environment by altering physical, chemical environments and resource conditions.
In terms of species composition, Dinoflagellata was the absolute dominant group in all habitats, closely related to the geographical location and seasonal characteristics of the study area. Lvhua Island is located near the Yangtze River estuary. In spring and summer, the Yangtze River diluted water brings abundant nutrients, while the Taiwan Warm Current and upwelling intensify [23], providing sufficient nutritional conditions for the growth and reproduction of dinoflagellates [38]. Furthermore, June is the peak growth season for dinoflagellates, hence their dominance across habitats, consistent with reports of this region being a high-risk area for red tides in China’s coastal waters [39]. However, the relative abundance of Dinoflagellata in the cage culture area (74.56%) was significantly higher than in other habitats, primarily due to the enrichment of nitrogen and phosphorus nutrients resulting from feed input and fish excretion during cage culture [40], providing an ideal growth environment for dinoflagellates (especially Noctiluca). As a eutrophication indicator species, the high abundance of Noctiluca (39.98%) further confirms the nutrient enrichment issue in the cage culture area [41]. The results of this study clearly show that the net-cage aquaculture area has become a habitat with high nutrient input and significant human interference under the influence of human activities. Such habitats often have high biological abundance but low diversity [42], low ecological stability, and are easily disturbed by various factors. In such a simplified community structure habitat, only a few “opportune species” that are tolerant to pollution and can quickly utilize resources will “explode” [43]. The marine exocoetids detected in this study usually attach to hard substrates and provide attachment bases for them in the net-cage aquaculture area [44]. This further reflects the instability of the community in this area.
The high abundance of arthropods in natural habitats (open seas, platform areas, algal fields) reflects the adaptability of this group to the natural ecosystem. Open seas are far from human interference, with sufficient water exchange and abundant phytoplankton such as diatoms [45], providing ample food for arthropods (such as calanoid copepods), forming a complete food chain of “diatoms-zooplankton”, demonstrating the ecological balance of natural seas [46]. At the same time, open seas have sufficient and unobstructed light, providing ideal conditions for diatom photosynthesis [47], further enhancing their numerical superiority. The “three-dimensional habitat” formed by diatoms in the kelp beds not only provides sheltered spaces for arthropods to avoid predators [2], but also the microorganisms and organic debris attached to the surface offer diverse food sources for arthropods, further increasing their abundance [48]. Although the platform area is disturbed by human activities, the large and hard structure of the artificial platform provides a gathering habitat for arthropods (such as northern krill), similar to the aggregation effects observed in offshore oil platforms and other places [49]. Moreover, the water exchange conditions are better than those in coastal farming areas, so the abundance of arthropods remains at a relatively high level.
The high abundances of Chlorophyta and Chordata in the mussel culture area are direct ecological responses to the artificial aquaculture activities in this habitat. Floating raft culture slows water flow, facilitating the settlement and colonization of green algal spores. Meanwhile, the filter-feeding activity of mussels removes small plankton, reducing competitive pressure on green algae, leading to increased Chlorophyta abundance [50]. The raft structures provide shelter for fish, and mussel excretions and residual feed provide food for fish, forming a “aquaculture–fishery” symbiotic system, thereby increasing Chordata abundance [51]. Furthermore, the high abundance of Botrylloides in the mussel culture area is consistent with the widespread biofouling issue in global shellfish farming areas [52]. Hard substrates like rafts and ropes provide abundant attachment space for ascidians, making them unique dominant groups in this habitat [53]. Ecosystems dominated by a single attaching species, like the mussel area, are typical consequences of habitat alteration and resource monopoly, often leading to decreased local biodiversity [54].
In summary, the habitat characteristics of sites A to E, by altering factors such as water nutrient content, light, water flow, substrate type, and food conditions, have selectively screened the marine species. light, flow, substrate type, and food conditions: aquaculture areas form high-nutrient environments due to human activities, favoring eutrophic biological groups; natural habitats support richer primary producers and consumers due to habitat structure and natural balance conditions; disturbed habitats form special “disturbance-adaptation” type biological communities due to human traffic and artificial structures. This result further validates the ecological theory that “habitat determines biological community structure” and provides precise basis for marine ecological management of different habitat types—such as controlling aquaculture feed input to reduce the risk of dinoflagellate blooms or protecting raft structures to maintain the diversity of unique ascidians and chordates.

4.2. Driving Factors of Community Structure Differences

Alpha diversity analysis indicated a negative correlation between human activity intensity and biodiversity, and a positive correlation between natural habitat complexity and biodiversity [55], a conclusion consistent with relevant domestic and international research results [56,57]. The cage culture area, due to high-intensity artificial disturbance (feed input, water pollution) and over-concentration of the dominant species (Noctiluca), had the lowest Shannon, Chao1, and Pielou indices, with a simplified community structure and poor ecological stability. The platform area and open waters, with minimal human disturbance and stable environmental conditions, had higher species richness and evenness. Particularly in the platform area, artificial structures provided additional attachment space without causing severe water pollution, hence the highest Shannon and Pielou indices. Although the mussel culture area is artificially disturbed, the diverse attachment space provided by rafts increased species richness (highest Chao1 index), but the competitive advantage of the single cultured species (mussel) resulted in lower community evenness. As a natural habitat, the complex habitat structure formed by Sargassum horneri in the seaweed bed supported relatively high species richness, but influenced by the coastal environment and tides, community diversity was slightly lower than in the platform area and open waters.
PCoA and ANOSIM analyses further confirmed significant differences in eukaryotic community structures among different habitats, and these differences were primarily determined by habitat type and human activity intensity. For example, the seaweed bed, as an ecosystem supported by large seaweeds, provides good habitat and abundant living resources for various organisms, supporting more species occupying effective ecological niches [58]. It not only forms a high-diversity balanced community supporting classic food webs with its high productivity, capable of sustaining high population densities of key high-trophic-level species like Calanushelgolandicus, but also forms a relatively stable and efficient classic grazing food chain, as Calanus feeds on small phytoplankton [59]. In contrast, the artificial mussel and cage culture areas showed significant differences from open waters, indicating that under artificial selection conditions, species can be richer than in natural waters. The extremely high artificial nutrient input (residual feed, feces) from aquaculture activities, while providing ample nourishment for local organisms [60], also brings water eutrophication that provides conditions for blooms of classic opportunistic species and red tide organisms like Noctiluca [61]. Such species, living by phagocytizing other microorganisms and organic particles and directly utilizing aquaculture waste for rapid population expansion, can cause abnormal and unstable community structures when a single species becomes overly dominant [62]. Thus, under frequent human disturbance, they become eutrophic communities with opportunistic species blooms, where only species like Ectopleuramarina or Botrylloidesviolaceus that can use aquaculture equipment as attachment bases survive, leading to the high abundance of their larvae in the water body, which is direct evidence of their populations’ massive reproduction and dispersal on aquaculture facilities [63]. This is also a typical manifestation of the common biofouling problem in global shellfish aquaculture, often leading to decreased local biodiversity, replacement by single dominant species, and the natural replacement of community structures under natural backgrounds [64].
In summary, it shows that waters with more human intervention have certain diversity but lower evenness. Aquaculture interference can make one dominant species particularly prominent, resulting in low evenness, making it difficult to maintain stability under external disturbances and requiring constant human intervention for ecosystem maintenance. Luo Minbo et al.’s ecological research on the waters around Yangshan Island found that environmental changes caused by marine engineering correspondingly altered macrobenthic community structures, manifested as decreased species diversity indices and increased simplicity, which is consistent with the results of this paper [65].

4.3. Regulatory Role of Environmental Factors on Community Structure

RDA showed that pH, temperature, salinity, and dissolved oxygen collectively regulated eukaryotic community structure, with pH having the greatest influence, closely related to the hydrological characteristics and habitat types of the study area. The gradual decrease in pH from east to west is related to the influence intensity of Yangtze River Diluted Water. The eastern open waters are less affected by diluted water, have higher salinity, stronger phytoplankton photosynthesis, and higher pH. The western coastal waters are more affected by diluted water [66], have lower salinity, and organic pollution from aquaculture activities reduces phytoplankton photosynthesis, leading to lower pH. The difference in pH directly affects the physiological metabolism of eukaryotes (such as enzyme activity, cell membrane permeability), thereby screening out species that are adapted to different pH environments, leading to the differentiation of community structure [55,67].
Environmental changes in different habitats are also necessarily linked to differences in biological community structure. The cage culture area has high temperature and low salinity. Feed input during farming easily leads to local nutrient enrichment and decreased pH. Simultaneously, cage shading and biological metabolic consumption result in relatively low dissolved oxygen (RDO). Such an ecological environment leads to a decrease in the species richness of the community and a single dominant species. This is consistent with the results of Wang Yunlong et al.’s study in 2019, which showed that the biodiversity of attached organisms and plankton in the cage fish farming area of black mackerel was significantly lower than that in the natural sea area [68]. The seaweed bed has low temperature, high salinity, and high dissolved oxygen because this station is located in the intertidal zone, influenced by tides, with high stability [69]. Furthermore, the rocky terrain and the living space and nutrients provided by Sargassum horneri support community complexity [70]. The marine platform area is characterized by the superposition of human factors and natural influences, and the biodiversity is at a medium level. The communities of marine artificial facilities (platforms, docks) usually exhibit the pattern of “predominantly sessile organisms, with a greater number of species than bare sea but fewer than those in natural habitats” [53]. Open waters are the habitat with the least human disturbance among the five, where biological communities are driven by natural succession, with high species richness and diverse dominant species [46]. The mussel culture area has high pH and low RDO. Mussel filter-feeding significantly alters water nutrient structure, creating environmental differences from other sea areas [54]. Although culture raft frames can provide space for attached organisms, excessively high population density of a single species often limits the survival of other species, resulting in single dominant species and low diversity.
Overall, human activity intensity is negatively correlated with biodiversity, while natural habitat complexity is positively correlated with biodiversity [56]. Research shows that the formation of community structure differences is influenced by the combined action of multiple environmental factors rather than a single factor [71]. In terms of structural complexity, the more complex the physical structure of a habitat, the richer the ecological niches it can provide for organisms. The lush blades of large seaweeds in seaweed beds provide attachment substrates for various organisms, further causing ecological niche differentiation. Therefore, the gradient habitat in seaweed beds ensures an ecosystem with high species richness and diverse functional groups, providing strong support for the stability of nearshore marine ecosystems [72]. Although the marine platform area and aquaculture areas also provide attachment substrates, the former has simple structures, and the latter has homogenized species, leading to “ecological niche monopoly” [73], severely insufficient living space for other species, simple community structure, and single dominant species. In terms of resource input methods, most energy in artificial aquaculture areas comes from human activities like feed input. Although productivity increases in the short term, it easily causes water quality problems like eutrophication, affecting community structure, and is insufficient to support complex community structures. Resources in open waters rely on natural current exchange and primary producers, with even resource distribution and vast space. Species competition tends towards natural selection, resulting in stable community structure [74] and the ability to withstand certain pressures. Large seaweeds in seaweed beds provide sustainable basic resources for the community through “photosynthetic carbon fixation and nutrient absorption” [75,76]. Meanwhile, the detritus decomposition of seaweeds provides food for benthic organisms, forming a complete “producer–decomposer–consumer” food chain. Resources are evenly distributed among different trophic levels, supporting species richness at all trophic levels of the community [77].
The use of eDNA still has limitations in this research process, and the inherent complexity and diversity of biological communities have also increased the difficulty of this study. For example, in the sequencing data analysis stage, the abundance of rare populations is easily ignored, which may affect the overall understanding of the community structure. In addition, the primer sequencing process also has high requirements for bioinformatics analysis and biostatistical methods. Different algorithm choices, parameter settings, or data filtering standards may all lead to significant differences in the final analysis results, increasing the uncertainty of result interpretation. In summary, to effectively address the above challenges, subsequent research needs to optimize multi-dimensional technologies and combine them with theories to improve the reliability and scientific nature of the research results on biological community structure.

5. Conclusions

This study focused on five typical habitats (cage culture area, intertidal seaweed bed, marine platform area, open waters, mussel culture area) in the nearshore waters of Lvhua Island, Ma’an Archipelago. Using environmental DNA (eDNA) technology, it systematically analyzed the characteristics of eukaryotic community structure and its association with environmental factors. It was found that species composition in the nearshore waters of Ma’an Archipelago has significant habitat specificity, and community structures differ markedly. This is because biodiversity in different habitats is greatly affected by human activities. Simultaneously, significant environmental gradient differences between high-temperature, low-salinity areas and low-temperature, high-salinity areas directly lead to community composition differentiation. These environmental gradient differences are closely related to the combined effects of Yangtze River Diluted Water, the Taiwan Warm Current, and human aquaculture activities.
Based on the above conclusions, to protect the ecosystem health of the nearshore waters of Ma’an Archipelago, it is recommended to strengthen environmental regulation in cage culture areas, reduce feed input to mitigate nutrient enrichment and the risk of dinoflagellate blooms; prioritize the protection of intertidal seaweed beds to maintain their complex habitat structure supporting high biodiversity; rationally plan the scale of mussel cultivation to avoid simplification of community structure caused by excessive biofouling; and establish a long-term monitoring system to continuously track community structure dynamics, providing scientific support for the rational use of marine resources and ecological conservation in this region.

Author Contributions

Conceptualization, A.D. and K.W.; methodology, A.D. and X.Z.; resources, K.W.; data curation, A.D.; writing—original draft preparation, A.D.; writing—review and editing, K.W., X.Z. and Y.W.; visualization, A.D.; supervision, project administration, and funding acquisition, K.W. All authors have read and agreed to the published version of the manuscript.

Funding

The project was supported by the National Key R&D Program of China [grant numbers 2019YFD0901303, 2018YFD0900904], the National Natural Science Foundation of China [grant number 41406153, 41876191] and the Fund of Fujian Key Laboratory of Island Monitoring and Ecological Development (Island Research Center, MNR) (NO:2022ZD03), and Southern Marine Science and Engineering Guangdong Laboratory(Zhuhai) [SML2024SP002].

Data Availability Statement

The original contributions presented in this study are included in the article. Further inquiries can be directed to the corresponding author.

Conflicts of Interest

The authors declare no conflicts of interest.

References

  1. Liu, Z.; Hu, F.; Xiao, K.; Chen, X.; Ye, S.; Sun, L.; Qin, S. Progress in research on delineation of the extent and boundaries of coastal zone. J. Appl. Oceanogr. 2025, 44, 15–20. [Google Scholar] [CrossRef]
  2. Gao, W.; Song, Q.; Zhang, H.; Wang, S. Selection of priority protected areas based on ecosystem service functions and habitat suitability evaluation for protected animals: A case study of the Sanjiangyuan Region. J. Ecol. Environ. 2024, 33, 1318–1328. [Google Scholar] [CrossRef]
  3. Graham, N.A.J.; Chong-Seng, K.M.; Huchery, C.; Januchowski-Hartley, F.A.; Nash, K.L. Coral reef community composition in the context of disturbance history on the Great Barrier Reef, Australia. PLoS ONE 2014, 9, e101204. [Google Scholar] [CrossRef]
  4. Trindade-Santos, I.; Moyes, F.; Magurran, A.E. Global change in the functional diversity of marine fisheries exploitation over the past 65 years. Proc. R. Soc. B 2020, 287, 20200889. [Google Scholar] [CrossRef]
  5. Gsell, A.S.; Scharfenberger, U.; Özkundakci, D.; Walters, A.; Hansson, L.; Janssen, A.; Nõges, P.; Reid, P.; Schindler, D. Evaluating early-warning indicators of critical transitions in natural aquatic ecosystems. Proc. Natl. Acad. Sci. USA 2016, 113, E8089–E8095. [Google Scholar] [CrossRef]
  6. Astles, K.L. Linking risk factors to risk treatment in ecological risk assessment of marine biodiversity. ICES J. Mar. Sci. 2015, 72, 1116–1132. [Google Scholar] [CrossRef]
  7. Yuan, H.; Zhang, S.; Chen, P. Research progress and prospects on benefit assessment of marine ranching. South China Fish. Sci. 2024, 20, 1–13. [Google Scholar] [CrossRef]
  8. Lotze, H.K.; Guest, H.; O’Leary, J.; Tuda, A.; Wallace, D. Public perceptions of marine threats and protection from around the world. Ocean Coast. Manag. 2018, 152, 14–22. [Google Scholar] [CrossRef]
  9. Pieretti, N.; Danovaro, R. Acoustic indexes for marine biodiversity trends and ecosystem health. Philos. Trans. R. Soc. B 2020, 375, 20190447. [Google Scholar] [CrossRef] [PubMed]
  10. Lurgi, M.; López, B.C.; Montoya, J.M. Novel communities from climate change. Philos. Trans. R. Soc. B Biol. Sci. 2012, 367, 2913–2922. [Google Scholar] [CrossRef] [PubMed]
  11. Isbell, F.; Gonzalez, A.; Loreau, M.; Cowles, J.; Díaz, S.; Hector, A.; Mace, G.; Wardle, D.; O’Connor, M.; Duffy, J.; et al. Linking the influence and dependence of people on biodiversity across scales. Nature 2017, 546, 65–72. [Google Scholar] [CrossRef]
  12. Amaral Camara Lima, M.; Bergamo, T.F.; Ward, R.D.; Joyce, C.B. A review of seagrass ecosystem services: Providing nature-based solutions for a changing world. Hydrobiologia 2023, 850, 2655–2670. [Google Scholar] [CrossRef]
  13. Bennett, N.J.; Blythe, J.; White, C.S.; Campero, C. Blue growth and blue justice: Ten risks and solutions for the ocean economy. Mar. Policy 2021, 125, 104387. [Google Scholar] [CrossRef]
  14. Ruppert, K.M.; Kline, R.J.; Rahman, M.S. Past, present, and future perspectives of environmental DNA (eDNA) metabarcoding: A systematic review in methods, monitoring, and applications of global eDNA. Glob. Ecol. Conserv. 2019, 17, e00547. [Google Scholar] [CrossRef]
  15. Shan, X.; Li, M.; Wang, W. Application of Environmental DNA Technology in Aquatic Ecosystem. Prog. Fish. Sci. 2018, 39, 23–29. [Google Scholar] [CrossRef]
  16. Couton, M.; Hürlemann, S.; Studer, A.; Alther, R.; Altermatt, F. Groundwater environmental DNA metabarcoding reveals hidden diversity and reflects land-use and geology. Mol. Ecol. 2023, 32, 3497–3512. [Google Scholar] [CrossRef]
  17. Yamamoto, S.; Masuda, R.; Sato, Y.; Sado, T.; Araki, H.; Kondoh, M.; Minamoto, T.; Miya, M. Environmental DNA metabarcoding reveals local fish communities in a species-rich coastal sea. Sci. Rep. 2017, 7, 40368. [Google Scholar] [CrossRef]
  18. Shu, L.; Chen, S.; Li, P.; Li, X.; Song, R.; Zhang, X.; Li, C.; Li, Y. Environmental DNA metabarcoding reflects fish DNA dynamics in lentic ecosystems: A case study of freshwater ponds. Fishes 2022, 7, 257. [Google Scholar] [CrossRef]
  19. Ramírez-Amaro, S.; Bassitta, M.; Picornell, A.; Ramon, C.; Terrasa, B. Environmental DNA: State-of-the-art of its application for fisheries assessment in marine environments. Front. Mar. Sci. 2022, 9, 1004674. [Google Scholar] [CrossRef]
  20. Sun, J.; Song, Y.; Shi, Y.; Zhai, J.; Yan, W. Progress of marine biodiversity studies in China seas in the past decade. Biodivers. Sci. 2022, 30, 22526. [Google Scholar] [CrossRef]
  21. Zhang, Z.; Bi, M.; Wu, H. Challenges and Development Strategies of Coastal and Marine Tourism in China. China Ecotourism 2021, 11, 536–547. [Google Scholar]
  22. Xia, Y.; Zhang, S.; Zhang, S.; Wang, K.; Xu, P.; Li, N.; Li, X. Decomposition and sedimentation of two species of macro algae detritus at the Gouqi Island seaweed beds. Acta Fish. Sin. 2023, 47, 039307-1–039307-10. [Google Scholar]
  23. Yang, G.; Lin, J.; Zhang, S.; Li, N. Study on Offshore Transport of Organic Detritus in Seaweed Field Based on Lagrange Method. Prog. Fish. Sci. 2022, 43, 49–60. [Google Scholar]
  24. Zhang, S.; Liu, S.; Zhou, X.; Wang, Z.; Wang, K. Ecological Functions of Large seaweed habitats and their application in Marine ranches. Acta Fish. Sin. 2019, 43, 2004–2014. [Google Scholar]
  25. Zhang, G.; Sun, J. State of environmental pollution in the Bohai Sea, China: A review. Environ. Chem. 2023, 42, 918–930. [Google Scholar]
  26. Lu, X.; Wang, Y.; Zhang, S. Effects of mariculture on benthic microbial communities in the Yellow Sea, China. Mar. Pollut. Bull. 2018, 135, 845–853. [Google Scholar]
  27. Stadler, J.; Klotz, S.; Brandl, R.; Knapp, S. Species richness and phylogenetic structure in plant communities: 20 years of succession. Web Ecol. 2017, 17, 37–46. [Google Scholar] [CrossRef]
  28. Heery, E.C.; Bishop, M.J.; Critchley, L.P.; Bugnot, A.B.; Airoldi, L.; Mayer-Pinto, M.; Sheehan, E.V.; Coleman, R.A.; Loke, L.H.L.; Johnston, E.L.; et al. Identifying the consequences of ocean sprawl for sedimentary habitats. J. Exp. Mar. Biol. Ecol. 2017, 492, 31–48. [Google Scholar] [CrossRef]
  29. Hu, Y.; Liu, M.; Li, L.; Fang, T.; Li, W. Risk Assessment of Heavy metals in Sediments near the Luhua Offshore Bulk Cargo Unloading Platform. J. Shanghai Ocean Univ. 2015, 24, 249–255. [Google Scholar]
  30. Yang, H. Construction of marine ranching in China: Reviews and prospects. J. Fish. China 2016, 40, 1133–1140. [Google Scholar] [CrossRef]
  31. Li, X. Research and Prospect of Marine Macrobenthic Biodiversity in China: A Case Study of the Yellow Sea. Biodiversity 2011, 19, 676–684. [Google Scholar]
  32. Jiang, Z.; Dong, C.; Zhan, P.; Zhao, J.; Zhao, C.; Tang, F.; Han, Y. Community structure and biodiversity of zooplankton in Kai Lake, Daxing. J. Dalian Ocean Univ. 2003, 18, 292–295. [Google Scholar]
  33. Fu, H.; Zhang, Y.; Huang, S.; Chu, L.; Yan, Y.; Ge, Y. Seasonal dynamics and construction mechanism of benthic animal community structure in Hui River. Resour. Environ. Yangtze River Basin 2024, 33, 1239–1249. [Google Scholar]
  34. Zhang, W.; Qi, Y. Randomized Test and Calculation Software for Significance of Biodiversity and uniformity (English). Biodiversity 2002, 10, 431–437. [Google Scholar]
  35. Sala-Pérez, M.; Lattuada, M.; Flecker, R.; Anesio, A.; Leroy, S.A. Dinoflagellate cyst assemblages as indicators of environmental conditions and shipping activities in coastal areas of the Black and Caspian Seas. Reg. Stud. Mar. Sci. 2020, 39, 101472. [Google Scholar] [CrossRef]
  36. Xu, Z. Annual Variations of Noctiluca scintillans in the Yangtze River Estuary and the Trend of Water eutrophication. Oceanol. Limnol. 2009, 40, 793–798. [Google Scholar]
  37. Weiher, E.; Keddy, P.A. The assembly of experimental wetland plant communities. Oikos 1995, 73, 323–335. [Google Scholar] [CrossRef]
  38. Zhou, M.; Shen, Z.; Yu, R. Responses of a coastal phytoplankton community to increased nutrient input from the Changjiang (Yangtze) River. Cont. Shelf Res. 2008, 28, 1483–1489. [Google Scholar] [CrossRef]
  39. Chen, B.; Dong, D.; Qin, X.; Xu, M.; Chen, X.; Shi, M. Relationship between the occurrence of red tides and the dynamic response mechanisms in the northern Beibu Gulf. J. Coast. Res. 2019, 93, 185–193. [Google Scholar] [CrossRef]
  40. Su, J. Research on Red Tides in China. Bull. Chin. Acad. Sci. 2001, 16, 340–342. [Google Scholar]
  41. Wang, T.; Shan, S.; Yang, C.; Wu, Z.; Chen, Z. Effects of the manure collection equipment on growth performance and nitrogen and phosphorus budgets of Cyprinus carpio var. specularis cage culture in reservoir. J. Fish. China 2016, 40, 218–224. [Google Scholar] [CrossRef]
  42. Hillebrand, H.; Bennett, D.M.; Cadotte, M.W. Consequences of dominance: A review of evenness effects on local and regional ecosystem processes. Ecology 2008, 89, 1510–1520. [Google Scholar] [CrossRef] [PubMed]
  43. Daufresne, M.; Lengfellner, K.; Sommer, U. Global warming benefits the small in aquatic ecosystems. Proc. Natl. Acad. Sci. USA 2009, 106, 12788–12793. [Google Scholar] [CrossRef]
  44. Chou, L.M. Enhancing Marine Biodiversity with Artificial Structures. In Sustainable Engineering Technologies and Architectures; AIP Publishing LLC: Melville, NY, USA, 2021. [Google Scholar]
  45. Beaugrand, G.; Edwards, M.; Legendre, L. Marine biodiversity, ecosystem functioning, and carbon cycles. Proc. Natl. Acad. Sci. USA 2010, 107, 10120–10124. [Google Scholar] [CrossRef]
  46. Gamfeldt, L.; Lefcheck, J.S.; Byrnes, J.E.K.; Cardinale, B.J.; Duffy, J.E.; Griffin, J.N. Marine biodiversity and ecosystem functioning: What’s known and what’s next? Oikos 2015, 124, 252–265. [Google Scholar] [CrossRef]
  47. Falkowski, P.G.; Raven, J.A. Aquatic Photosynthesis; Princeton University Press: Princeton, NJ, USA, 2013. [Google Scholar]
  48. Smith, R.S.; Johnston, E.L.; Clark, G.F. The role of habitat complexity in community development is mediated by resource availability. PLoS ONE 2014, 9, e102920. [Google Scholar] [CrossRef]
  49. Fowler, A.M.; Jørgensen, A.M.; Svendsen, J.C.; Macreadie, P.I.; Jones, D.O.; Boon, A.R.; Booth, D.J.; Brabant, R.; Callahan, E.; Claisse, J.T.; et al. Environmental benefits of leaving offshore infrastructure in the ocean. Front. Ecol. Environ. 2018, 16, 571–578. [Google Scholar] [CrossRef]
  50. Smaal, A.C.; Ferreira, J.G.; Grant, J.; Petersen, J.K.; Strand, Ø. Goods and Services of Marine Bivalves; Springer Nature: Berlin/Heidelberg, Germany, 2019. [Google Scholar]
  51. Ysebaert, T.; Walles, B.; Haner, J.; Hancock, B. Habitat modification and coastal protection by ecosystem-engineering reef-building bivalves. In Goods and Services of Marine Bivalves; Springer International Publishing: Cham, Switzerland, 2018; pp. 253–273. [Google Scholar]
  52. Koivisto, M.E.; Westerbom, M. Habitat structure and complexity as determinants of biodiversity in blue mussel beds on sublittoral rocky shores. Mar. Biol. 2010, 157, 1463–1474. [Google Scholar] [CrossRef]
  53. Degraer, S.; Carey, D.A.; Coolen, J.W.P.; Hutchison, Z.L.; Kerckhof, F.; Rumes, B.; Vanaverbeke, J. Offshore wind farm artificial reefs affect ecosystem structure and functioning. Oceanography 2020, 33, 48–57. [Google Scholar] [CrossRef]
  54. Crawford, C.M.; Macleod, C.K.A.; Mitchell, I.M. Effects of shellfish farming on the benthic environment. Aquaculture 2003, 224, 117–140. [Google Scholar] [CrossRef]
  55. Gissi, E.; Manea, E.; Mazaris, A.D.; Fraschetti, S.; Almpanidou, V.; Bevilacqua, S.; Coll, M.; Guarnieri, G.; Lloret-Lloret, E.; Pascual, M.; et al. A review of the combined effects of climate change and other local human stressors on the marine environment. Sci. Total Environ. 2021, 755, 142564. [Google Scholar] [CrossRef]
  56. Halpern, B.S.; Walbridge, S.; Selkoe, K.A.; Kappel, C.A.; Micheli, F.; D’Agrosa, C.; Bruno, J.F.; Casey, K.S.; Ebert, C.; Fox, H.E.; et al. A global map of human impact on marine ecosystems. Science 2008, 319, 948–952. [Google Scholar] [CrossRef]
  57. Fu, S.-f.; Wu, H.-y.; Cai, X.-q. Determination of the Benthic Biodiversity Protection Targets in Xiamen Sea Area. J. Ecol. Rural Environ. 2021, 37, 1264–1270. [Google Scholar] [CrossRef]
  58. Christie, H.; Norderhaug, K.M.; Fredriksen, S. Macrophytes as habitat for fauna. Mar. Ecol. Prog. Ser. 2009, 396, 221–233. [Google Scholar] [CrossRef]
  59. Thompson, R.M.; Brose, U.; Dunne, J.A.; Hall, R.O.; Hladyz, S.; Kitching, R.L.; Martinez, N.D.; Rantala, H.; Romanuk, T.N.; Stouffer, D.B.; et al. Food webs: Reconciling the structure and function of biodiversity. Trends Ecol. Evol. 2012, 27, 689–697. [Google Scholar] [CrossRef] [PubMed]
  60. Read, P.; Fernandes, T. Management of environmental impacts of marine aquaculture in Europe. Aquaculture 2003, 226, 139–163. [Google Scholar] [CrossRef]
  61. Glibert, P.M.; Icarus Allen, J.; Artioli, Y.; Beusen, A.; Bouwman, L.; Harle, J.; Holmes, R.; Holt, J. Vulnerability of coastal ecosystems to changes in harmful algal bloom distribution in response to climate change: Projections based on model analysis. Glob. Change Biol. 2014, 20, 3845–3858. [Google Scholar] [CrossRef] [PubMed]
  62. Stachowicz, J.J.; Bruno, J.F.; Duffy, J.E. Understanding the effects of marine biodiversity on communities and ecosystems. Annu. Rev. Ecol. Evol. Syst. 2007, 38, 739–766. [Google Scholar] [CrossRef]
  63. Adams, T.P.; Miller, R.G.; Aleynik, D.; Burrows, M.T. Offshore marine renewable energy devices as stepping stones across biogeographical boundaries. J. Appl. Ecol. 2014, 51, 330–338. [Google Scholar] [CrossRef]
  64. Forrest, B.M.; Keeley, N.B.; Hopkins, G.A.; Webb, S.C.; Clement, D.M. Bivalve aquaculture in estuaries: Review and synthesis of oyster cultivation effects. Aquaculture 2009, 298, 1–15. [Google Scholar] [CrossRef]
  65. Luo, M.; Lu, J.; Shen, X.; Wang, Y.; Xu, Z.; Zhu, J. The Impact of Large-scale Marine Engineering on the Ecological Distribution of Large Benthic Animals in the Surrounding Waters of Yangshan Island. J. Agric. Environ. Sci. 2007, 26, 97–102. [Google Scholar]
  66. Besemer, K. Biodiversity, community structure and function of biofilms in stream ecosystems. Res. Microbiol. 2015, 166, 774–781. [Google Scholar] [CrossRef]
  67. Luo, M.; Jian, T.; Wang, Y.; Zhang, H.; Ying, Y.; Zhang, H.; Yang, J. Analysis of Ecological Characteristics and Influencing Factors of Phytoplankton Communities in Spring and Summer in the East China Sea. Mar. Fish. 2022, 44, 589–597. [Google Scholar]
  68. Wang, Y.; Li, S.; Jiang, Y.; Zhang, S.; Hu, Q.; Shen, T.; Jiao, H. Construction of the Xiangshan Port Marine Fishery Farm and Techniques for the Enhancement and Conservation of Biological Resources. Chin. J. Aquat. Sci. 2019, 43, 1972–1980. [Google Scholar]
  69. Britton, D.; Schmid, M.; Revill, A.T.; Virtue, P.; Nichols, P.D.; Hurd, C.L.; Mundy, C.N. Seasonal and site-specific variation in the nutritional quality of temperate seaweed assemblages: Implications for grazing invertebrates and the commercial exploitation of seaweeds. J. Appl. Phycol. 2021, 33, 603–616. [Google Scholar] [CrossRef]
  70. Duffy, J.E. Biodiversity and ecosystem function in the sea. Mar. Ecol. Prog. Ser. 2006, 311, 253–265. [Google Scholar] [CrossRef]
  71. Chen, Z.; Ren, Q.; Liu, C.; Xian, W. Seasonal and spatial variations in fish assemblage in the Yangtze estuary and adjacent waters and their relationship with environmental factors. J. Mar. Sci. Eng. 2022, 10, 1679. [Google Scholar] [CrossRef]
  72. Steneck, R.S.; Graham, M.H.; Bourque, B.J.; Corbett, D.; Erlandson, J.M.; Estes, J.A.; Tegner, M.J. Kelp forest ecosystems: Biodiversity, stability, resilience and future. Environ. Conserv. 2002, 29, 436–459. [Google Scholar] [CrossRef]
  73. Li, N.; Wang, Z. Evolution of Bohai Rim Port City Cluster Based on Niche Theory: Pattern Changes and Symbiosis Strategies. Geogr. Geogr. Inf. Sci. 2024, 40, 80. [Google Scholar]
  74. Worm, B.; Barbier, E.B.; Beaumont, N.; Duffy, J.M.; Folke, C.; Halpern, B.S.; Jackson, J.B.C.; Lotze, H.K.; Micheli, F.; Palumbi, S.R.; et al. Impacts of biodiversity loss on ocean ecosystem services. Science 2006, 314, 787–790. [Google Scholar] [CrossRef]
  75. Ortega, A.; Geraldi, N.R.; Alam, I.; Kamau, A.A.; Acinas, S.G.; Logares, R.; Gasol, J.M.; Massana, M.; Krause-Jensen, D.; Duarte, C.M. Important contribution of macroalgae to oceanic carbon sequestration. Nat. Geosci. 2019, 12, 748–754. [Google Scholar] [CrossRef]
  76. Cheng, A.; Lim, W.Y.; Lim, P.E.; Yang Amri, A.; Poong, S.W.; Song, S.L.; Ilham, Z. Marine autotroph-herbivore synergies: Unravelling the roles of macroalgae in marine ecosystem dynamics. Biology 2022, 11, 1209. [Google Scholar] [CrossRef] [PubMed]
  77. Krumhansl, K.A.; Scheibling, R.E. Production and fate of kelp detritus. Mar. Ecol. Prog. Ser. 2012, 467, 281–302. [Google Scholar] [CrossRef]
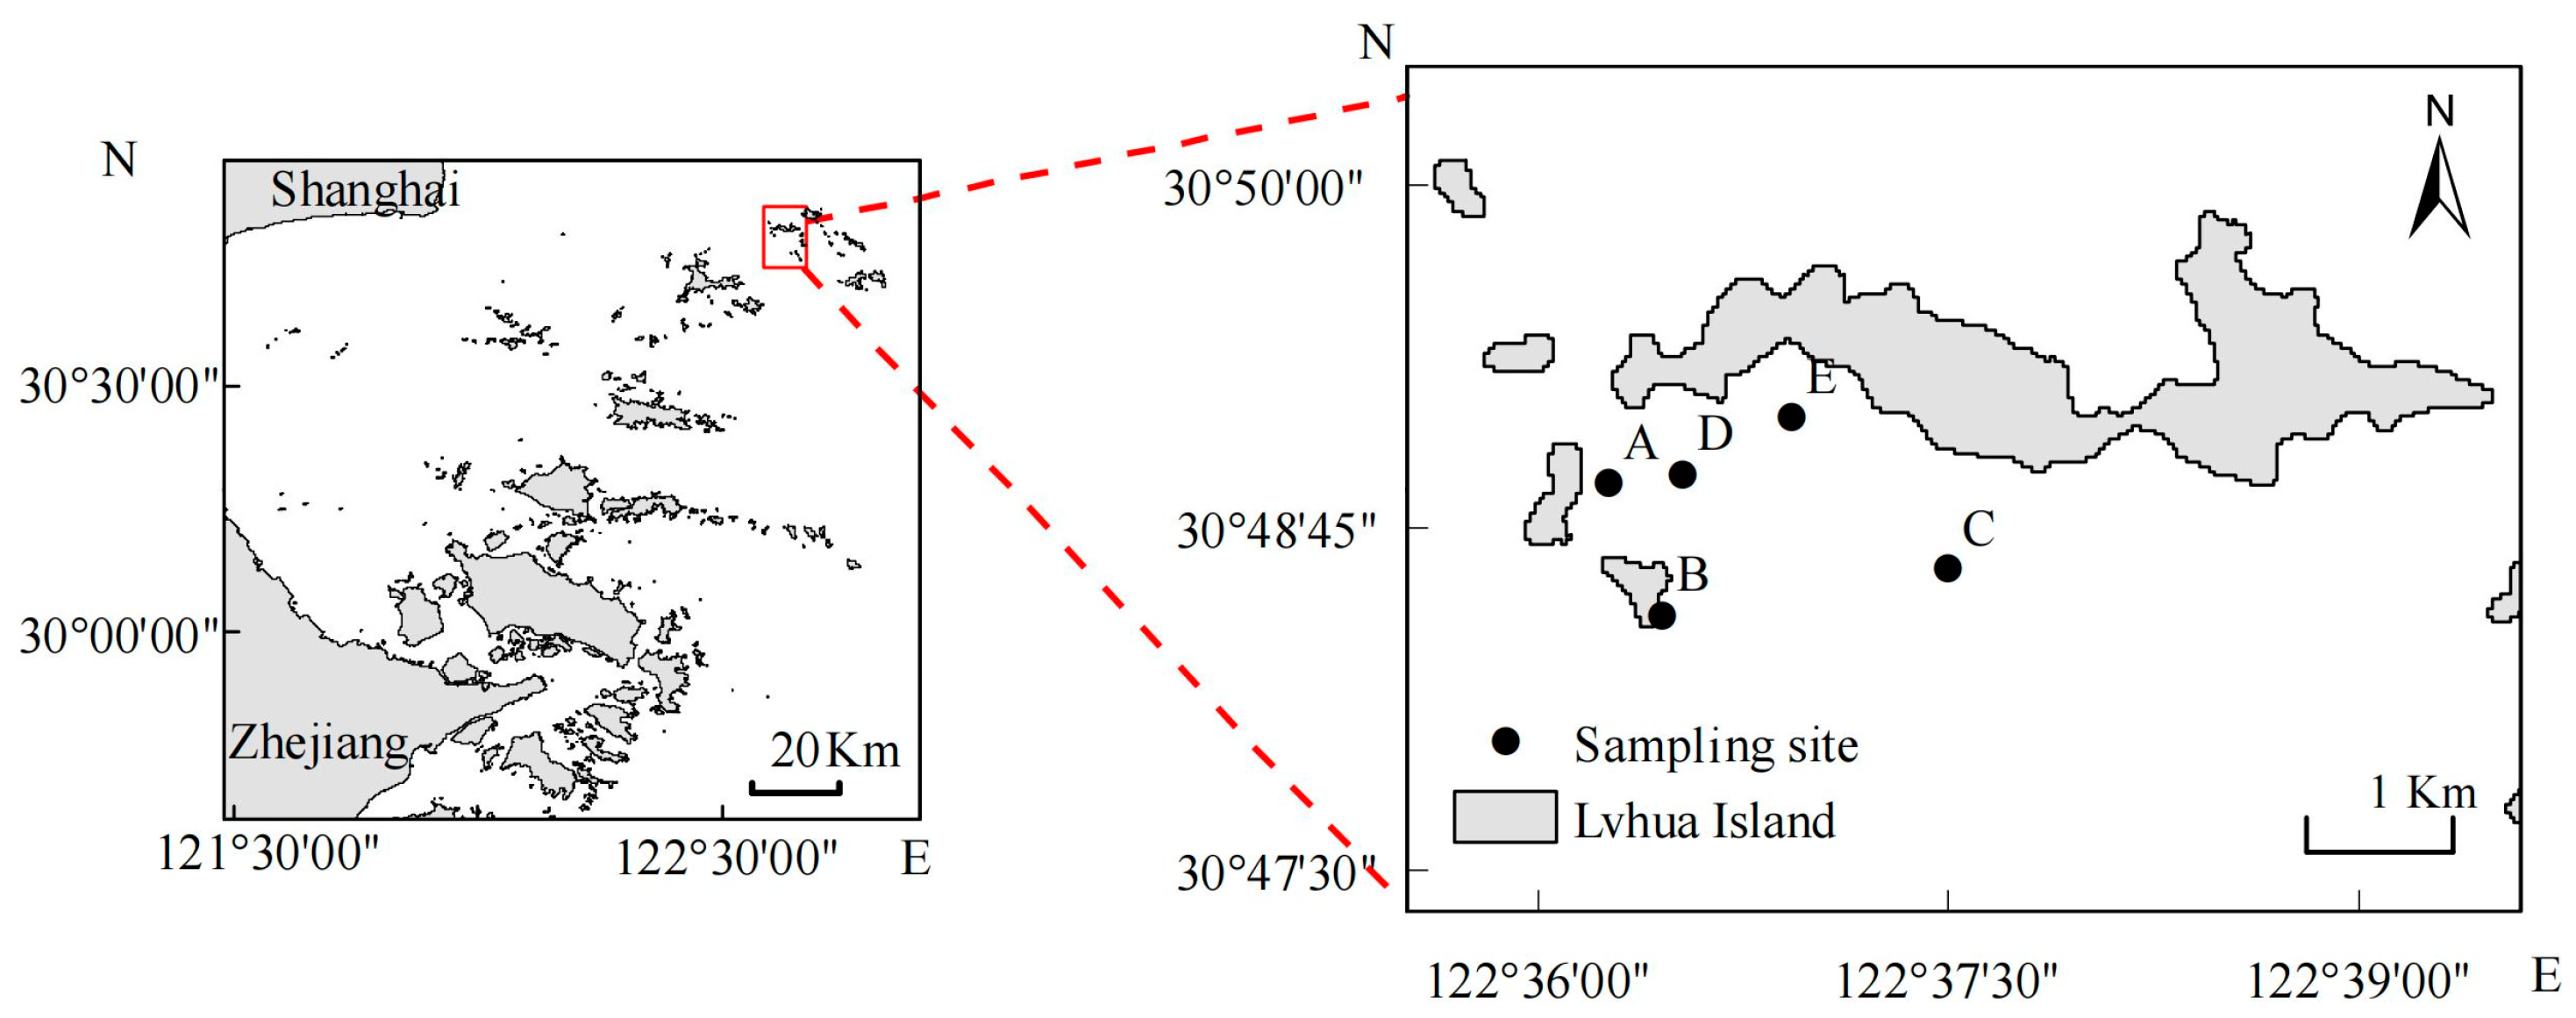
Figure 1. Sampling site map.
Water 17 02970 g001
Figure 2. Venn diagram (a) and distribution of sequence numbers at each station (b).
Water 17 02970 g002
Figure 3. Community structure composition based on phylum level.
Water 17 02970 g003
Figure 4. Community structure composition based on genus level.
Water 17 02970 g004
Figure 5. Pie charts of species relative abundance at each station.
Water 17 02970 g005
Figure 6. (a) Principal coordinate analysis at different sites. (b) Redundancy analysis of biological communities at different sites.
Water 17 02970 g006
Table 1. Alpha diversity indices for different stations.
SiteShannonChao1Peilou
A2.45 ± 0.50509.09 ± 61.140.41 ± 0.08
B2.57 ± 0.29566.72 ± 31.420.42 ± 0.05
C3.32 ± 0.22539.64 ± 25.500.54 ± 0.4
D3.28 ± 0.28540.42 ± 13.670.50 ± 0.05
E3.22 ± 0.21578.96 ± 10.250.52 ± 0.03
Table 2. Environmental factors at different stations.
SiteTemp (°C)RDO (mg/L)pH (pH)
A21.48 ± 0.655.67 ± 0.438.93 ± 0.05
B21.48 ± 0.655.67 ± 0.438.93 ± 0.05
C20.77 ± 0.584.99 ± 0.469.1 ± 0.17
D20.93 ± 0.525.35 ± 0.379.2 ± 0.25
E21.22 ± 0.495.24 ± 0.439.22 ± 0.15
Disclaimer/Publisher’s Note: The statements, opinions and data contained in all publications are solely those of the individual author(s) and contributor(s) and not of MDPI and/or the editor(s). MDPI and/or the editor(s) disclaim responsibility for any injury to people or property resulting from any ideas, methods, instructions or products referred to in the content.