Article

Performance Evaluation of Diverse Filter Media Combinations Under Different Pollution and Hydraulic Loads in Constructed Wetlands

1
Zhejiang Key Laboratory of the Development and Utilization of Underground Space, Institute of Geotechnical Engineering, Zhejiang University, Hangzhou 310000, China
2
Zhejiang Institute of Mechanical & Electrical Engineering Co., Ltd., Hangzhou 310051, China
3
MOE Key Laboratory of Soft Soils and Geoenvironmental Engineering, Institute of Geotechnical Engineering, Zhejiang University, Hangzhou 310000, China
*
Author to whom correspondence should be addressed.
These authors contributed equally to this work.
Water 2025, 17(20), 2969; https://doi.org/10.3390/w17202969
Submission received: 15 September 2025 / Revised: 10 October 2025 / Accepted: 13 October 2025 / Published: 15 October 2025

Abstract

During rapid social and economic growth, large amounts of organic matter, nitrogen, and phosphorus are released into the environment with wastewater, and constructed wetlands (CWs) play a key role in water pollution prevention and control. This study employed six test columns to evaluate the pollutant removal performance of various filter media combinations in CWs when treating synthetic sewage under different pollution and hydraulic loads. The results showed that all columns containing bio-ceramsite exhibited superior pollutant removal performance, especially for organics and phosphorus. A synergistic effect was observed between bio-ceramsite and volcanic rock in enhancing pollutant removal, with average removal rates of 88.02%, 69.69%, 62.96%, and 88.22% for COD, NH4+, TN, and TP, respectively, under the nine experimental conditions. Scanning Electron Microscopy (SEM), BET surface area testing, and microbial community structure analysis were conducted to investigate the reasons for the differences in pollutant removal efficiency among the columns. The results showed that bio-ceramsite exhibits a highly microporous structure and a large surface area of 1.3816 m2/g, which provides abundant adsorption sites for microorganisms and pollutant molecules. The microbial community structure on bio-ceramsite remained highly consistent across all column tests, with dominant microbial species playing a key role in enhancing pollutant removal efficiency. The conclusions of this study indicate the potential application of some filter media combinations in CW design for environmental conservation.

1. Introduction

Water resource quality is fundamental to ecological equilibrium and human health, making water pollution prevention and control a critical global priority that requires concerted efforts [1,2]. Contaminated water sources, including untreated rural sewage, agricultural runoff, and stormwater, pose severe risks to biodiversity and public health upon entering rivers and lakes [3,4,5]. While conventional treatment facilities are essential for effective contaminant removal, enabling water reuse and aquifer replenishment [6,7], their widespread implementation in rural areas is significantly hindered by substantial construction investments and high operational costs [8,9]. Consequently, there is an urgent need to explore cost-effective and highly efficient decentralized wastewater treatment technologies, vital for environmental protection and securing sustainable water resources for agriculture and domestic use [10].
In recent years, CWs have emerged as a widely promoted, economical, and eco-friendly innovative wastewater treatment technology [11,12]. These engineered systems, requiring regular maintenance, utilize synergistic physical (e.g., filtration, adsorption), chemical (e.g., precipitation, redox), and biological (primarily microbial decomposition) processes among plants, filter media, and microorganisms to treat sewage [13]. CWs effectively degrade pollutants including organic matter, nutrients (nitrogen and phosphorus), pathogens, and heavy metals [14], transforming nitrogen through processes like nitrification and denitrification [15], thereby improving water quality. Among CW designs, subsurface flow systems are predominant, with vertical flow (VSSF) offering distinct advantages over horizontal flow (HSSF): VSSF CWs require less space, benefit from enhanced oxygen transfer through the substrate due to intermittent feeding, and generally achieve superior BOD5 removal efficiency [16]. These advantages make VSSF a highly suitable and widely applied configuration for wastewater treatment.
Filter media constitute the majority of the volume within CWs and are critical for all removal processes (filtration, adsorption, and precipitation, serving as a microbial substrate) [17]. Commonly used materials include inorganic substrates like gravel, sand, volcanic rock, zeolite, and concrete, as well as organic substrates such as activated carbon, biochar, and wood chips [18,19,20]. Bai et al. [21] reported approximately 78.18% NH4+-N, 74% TN, and 75.34% COD removal with volcanic rock treating municipal effluent under C/N = 6–7. Gupta et al. [22] demonstrated remarkable efficiencies (91% COD, 58% TN, and 80% TP) using biochar. Jayabalan et al. [23] applied activated carbon for textile wastewater treatment, achieving removal rates exceeding 40% for both BOD and COD, effectively adsorbing and reducing organic matter and contaminants. Aylan et al. [24] used biochar and ceramic media for greywater treatment, with biochar achieving removal efficiencies of 75.60% for COD, 22.61% for TN, 90.37% for TP, and with ceramic media recording the highest removal of TSS (66.99%) and TDS (50.50%). Gopalakrishnan et al. [25] investigated the use of needle-felt coir fiber (NCM) as a viable alternative in vertical up-flow treatment wetlands, and the removal percentages for NCM were 73.21 ± 9.3%, 89.3 ± 0.6%, 48.38 ± 22.9%, and 50.21 ± 28.9%, respectively, for COD, BOD, TN, and TP. Comparative studies, like the one performed by Vispo et al. [26], highlight material-specific efficiencies (e.g., activated carbon overall, porous sand for TSS and TN). Despite extensive research on diverse single media like zeolite, limestone, nickel ore pebbles, concrete, and plastics, there remains a lack of comparative studies on the synergistic effects of different substrate combinations.
Microorganisms also play a crucial role in CWs, driving nutrient transformation and pollutant degradation, particularly within biofilms attached to the filter media. According to previous studies, key functional microbial phyla in CWs include Proteobacteria, Bacteroidetes, Actinobacteria, and Firmicutes [27]. Among them, Proteobacteria, Nitrospirae, Nitrospinae, and Thaumarchaeota are prominent in nitrification, while Proteobacteria, Bacteroidetes, Firmicutes, and Actinobacteria are key denitrifiers [28]. Furthermore, heterotrophic nitrification–aerobic denitrification (HN-AD) bacteria (e.g., genera Dechloromonas, Ferribacterium, Hydrogenophaga, Zoogloea, and Aeromonas) enable complete nitrogen removal [29]. For phosphorus removal, Proteobacteria are dominant [30], with genera like Pseudomonas (storing polyphosphates) and Acinetobacter (historically significant for high phosphorus removal capability) being particularly effective [31]. Other groups, such as Gemmatimonadaceae, also contribute to phosphate uptake [32]. Critically, the structure and function of these microbial communities are highly dependent on the physicochemical properties of their filter media habitat.
Although CWs show great potential, their effectiveness hinges on the complex interactions among filter media, microbial communities, and system design. Addressing the identified gap in understanding filter media combination synergies is crucial for optimization. This study designed six test columns based on three filter media to evaluate the pollutant removal efficiency of diverse filter media combinations in treating synthetic sewage under varying pollution and hydraulic loading rates. The novelty of this study is the creation of a “functional gradient” using differentiated filter media to investigate potential synergistic effects that could yield superior and more robust treatment performance compared to single-medium systems. Moreover, SEM and BET tests were conducted to characterize the surface microstructure of the filter media, and they were combined with microbial community structure analysis to investigate the underlying mechanisms responsible for the variations in removal efficiency among the different test columns. The conclusions might serve as a scientific basis and technical support for the application of constructed wetlands in environmental conservation.

2. Materials and Methods

2.1. The Physical Properties of the Filter Media

The filter media used in this study included bio-ceramsite, volcanic rock, and quartz sand, all purchased from Gongyi City Shengshi Water Purification Materials Co., Ltd. (located in Gongyi City, China), with diameters ranging approximately from 4 to 8 mm. The selection of three filter media was deliberate, based not only on their economic and environmental benefits (low cost, non-polluting, and renewable) but, more importantly, on their differentiated physicochemical properties (e.g., differences in specific surface area and chemical composition), with the aim of leveraging these differences to create a synergistic effect for comprehensive wastewater treatment. The main parameters of three filter media are listed in Table 1, including components, voidage, and bulk density. Additionally, Scanning Electron Microscopy (SEM) [33] and BET specific surface area tests [34] were conducted on the three filter media to visually characterize the surface morphology (e.g., roughness and pore size distribution) of the filter media and provide direct visual evidence that bridges the media’s physical properties with their observed performance.

2.2. Laboratory Column Testing

The experiment included 6 transparent acrylic columns with diameters and heights of 20 cm and 65 cm, respectively. The filter media types filled in each column are shown in Table 2: columns A1–A3 contained single filter media, while B1–B3 employed dual filter media combinations. All filter media were filled to a height of 60 cm in the columns. The schematic layout and real image of the experimental setup used for the column tests are shown in Figure 1. To effectively remove surface contaminants from the filter media, necessary cleaning procedures were performed [35], followed by drying the washed filter media in a 105 °C oven for 24 h [36]. The entire experimental process was conducted at indoor temperature (25 ± 3 °C).
The experimental water was artificially synthesized rural sewage with a low C/N ratio, which was prepared in a distribution reservoir with a volume of 150 L and pumped to six test columns by a peristaltic pump. During the entire experiment, the stirrer ran continuously to keep the synthetic sewage well-mixed. The microbial inoculum used in this experiment was sourced from the Qingshan Lake wetland system in Lin’an District, Hangzhou City, Zhejiang Province. Prior to the formal experiment, a quantified amount of this inoculum was added to each test column to facilitate rapid startup. The entire experiment was conducted from December 2023 to June 2025, and the wastewater treatment experiment was repeated twice under consistent conditions.
Herein, glucose was used as the carbon source to increase the chemical oxygen demand (COD), NH4Cl was used to increase the total nitrogen (TN), and KH2PO4 was used to increase the total phosphorus (TP), and three pollution loads (PL = low, medium, and high) were established as shown in Table 3 and Table 4. Meanwhile, combined with different hydraulic retention times (HRT = 1 d, 2 d, and 3 d), a total of nine operating conditions were formed, as shown in Table 5. Each operating condition ran for more than one month. After the experiment ran in a stable manner, water samples were collected for three consecutive days to detect the effluent water quality, and the average value was taken as the basis for evaluating the pollutant removal effect (the calculation method of the removal efficiency was to divide the difference between the influent and effluent concentrations by the influent concentration and then multiply by 100%). The detection indicators include the parameters pH, chemical oxygen demand (COD), ammonia nitrogen (NH4-N), total nitrogen (TN), and total phosphorus (TP). Specifically, pH was monitored using a HACH HQ40D multifunctional water quality analyzer, while COD, NH4-N, TN, and TP were analyzed using Chinese national standard testing methods [37].

2.3. High-Throughput Sequencing and Microbial Analysis

Sampling ports were set at depths of 15 cm and 45 cm from the filter media surface in each test column to obtain the filter media for microbial detection. The genomic DNA of microbial samples was extracted using the PowerSoil® DNA Isolation Kit (MO BIO Laboratories, Inc., Carlsbad, CA, USA). Subsequently, the purity and concentration of the DNA were detected by agarose gel electrophoresis. An appropriate amount of genomic DNA was taken as the template. According to the selection of the sequencing region, specific primers with barcodes, Phusion® High-Fidelity PCR Master Mix with GC Buffer (New England Biolabs, Inc., Ipswich, MA, USA), and a high-efficiency and high-fidelity enzyme were used for PCR amplification. The amplified primers were subjected to bacterial 16S diversity sequencing analysis on the Nextseq 2000 sequencing platform of Zhejiang Tianke High-Tech Development Co., Ltd., Hangzhou, China. Then, the Uparse software (Uparse V8.1.1861) was used to cluster all the Effective Tags of all samples. By default, the sequences were clustered into OTUs (operational taxonomic units) with 97% identity. The uclust method was used to conduct species alignment and annotation with the silva database, and the community composition of each sample was statistically analyzed at each taxonomic level (kingdom, phylum, class, order, family, genus, and species). In addition, the top 35 genera in abundance and the top 50 pieces of functional annotation information of the microbial community were clustered, and heat maps were drawn.

2.4. Statistical Analysis

All water quality data in this study were presented as mean ± standard deviation. Statistical analyses were conducted using SPSS 23.0 (IBM Corp., Armonk, NY, USA) and Origin 2024. T-test, one-way ANOVA, and Dunn’s post hoc test were performed to determine significant differences in removal efficiencies and microbial community structures under different filter media combinations. The water quality purification data and high-throughput sequencing results were visualized using Origin 2024.

3. Results and Discussion

3.1. Changes in Water Quality

The pH of the influent water in the experiment was 7.65 ± 0.27. After passing through test columns A3, B2, and B3, the effluent pH increased significantly to approximately 10.21 ± 0.32, which is related to the presence of certain proportions of K2O and Na2O in the bio-ceramsite. Hence, a terminal pH adjustment tank for neutralization would be required in a practical constructed wetland. Meanwhile, the effluent pH showed almost no change after passing through test columns A1, A2, and B1. Typically, these variations in pH can be attributed to differences in chemical composition and the buffering capacity of the filter media [38].
The removal efficiencies of COD, NH4+, TN, and TP by different test columns under nine operating conditions are shown in Figure 2, presented as mean ± standard deviation.
For COD removal, the average efficiencies of test columns A1 to B3 were 75.65%, 77.06%, 84.53%, 74.22%, 80.61%, and 88.02%, respectively. Notably, columns A3 and B3 exhibited significantly higher COD removal rates than the other groups, followed by column B2, while columns A1, A2, and B1 remained at relatively lower levels. It is worth emphasizing that columns A3, B2, and B3 all contained at least 50% (by volume) of bio-ceramsite, whereas the other three columns had none. This phenomenon suggested a strong correlation between the high COD removal efficiency and the large specific surface area of bio-ceramsite, which provides more attachment sites for microorganisms and nutrients. Furthermore, the results indicated a clear upward trend in COD removal efficiency across all columns with increasing hydraulic retention time [39]. However, under the same HRT conditions, the average COD removal rates of the six columns were significantly lower at low-to-medium pollutant concentrations than at high concentrations. A possible explanation is that, at low/medium concentrations, the substrate only meets the maintenance metabolism of microorganisms, resulting in slow proliferation. In contrast, higher pollutant concentrations provide sufficient carbon sources and energy, stimulating microbial growth (particularly specialized degraders) and enhancing removal capacity through population effects such as biofilm formation [40].
In terms of TP removal efficiency, the difference between test columns A3, B2, and B3 and columns A1, A2, and B1 was highly significant. Specifically, column A3, which was entirely filled with bio-ceramsite, achieved an average removal rate of 97.1% across nine operating conditions, while columns B2 and B3, filled halfway with bio-ceramsite, also reached high rates of 90.80% and 88.22%, respectively. These values far exceeded the removal rates of 12.32%, 38.08%, and 28.31% in columns A1, A2, and B1, which contained no bio-ceramsite. This demonstrates that the large specific surface area of bio-ceramsite and the alkaline aqueous environment it creates play a crucial role in phosphorus removal.
Additionally, the TP removal rate did not significantly increase with hydraulic retention time (p > 0.05). As adsorption and precipitation are the primary pathways for phosphorus removal in wetland systems [41], these processes can rapidly adsorb and remove phosphorus in a short time, reaching a relative equilibrium state, and some of the adsorption–precipitation reactions are reversible [39]. On the other hand, the TP removal rate under high-concentration conditions was higher compared to that in the medium- and low-concentration groups. A possible reason is that, under high concentrations, metal ions such as Fe3+, Al3+, and Ca2+ more easily reach the solubility product with phosphates, forming stable precipitates (e.g., FePO4, Ca5(PO4)3OH) [42].
Under the nine operating conditions, the average NH4+ removal rates for test columns A1–B3 were 15.65%, 32.03%, 57.90%, 24.53%, 35.12%, and 69.69%, respectively. Column B3 exhibited the highest NH4+ removal rate, followed by A3, with both significantly outperforming the other columns. However, the overall NH4+ removal performance across all six columns was relatively modest. This limited efficiency is partly attributed to the absence of planted vegetation in the study design. Without plant root-zone oxygen release, a favorable aerobic microzone conducive to nitrification could not develop in the upper layer of the columns. Consequently, the primary mechanisms for NH4+ removal were likely ion exchange or physical adsorption [43].
Similarly to TP, hydraulic retention time (HRT) had no significant impact on NH4+ removal (p > 0.05), because an excessively prolonged hydraulic retention time would induce severely anoxic conditions in the columns, consequently inhibiting nitrification processes. Additionally, some pollutants may have been released back into the water or undergone reversible reactions [44]. Furthermore, pollutant concentration also showed no significant effect on NH4+ removal (p > 0.05), possibly due to repeated adsorption–desorption processes, leading to system instability.
Finally, regarding TN removal efficiency, the average removal rates for test columns A1–B3 under the nine operating conditions were 12.09%, 28.20%, 49.54%, 21.47%, 33.43%, and 62.96%, respectively. Columns A3 and B3 still maintained relatively high removal performance. Similarly to NH4+, TN removal did not increase significantly with extended hydraulic retention time (HRT), nor did it exhibit a clear correlation with pollutant concentration.
The removal efficiencies of COD, TN, and TP in this study were not particularly high. However, the use of bio-ceramsite, volcanic rock, and quartz sand as filter media not only is low-cost and non-polluting but also allows for renewable utilization, aligning with the principles of a circular economy.

3.2. SEM and BET Tests

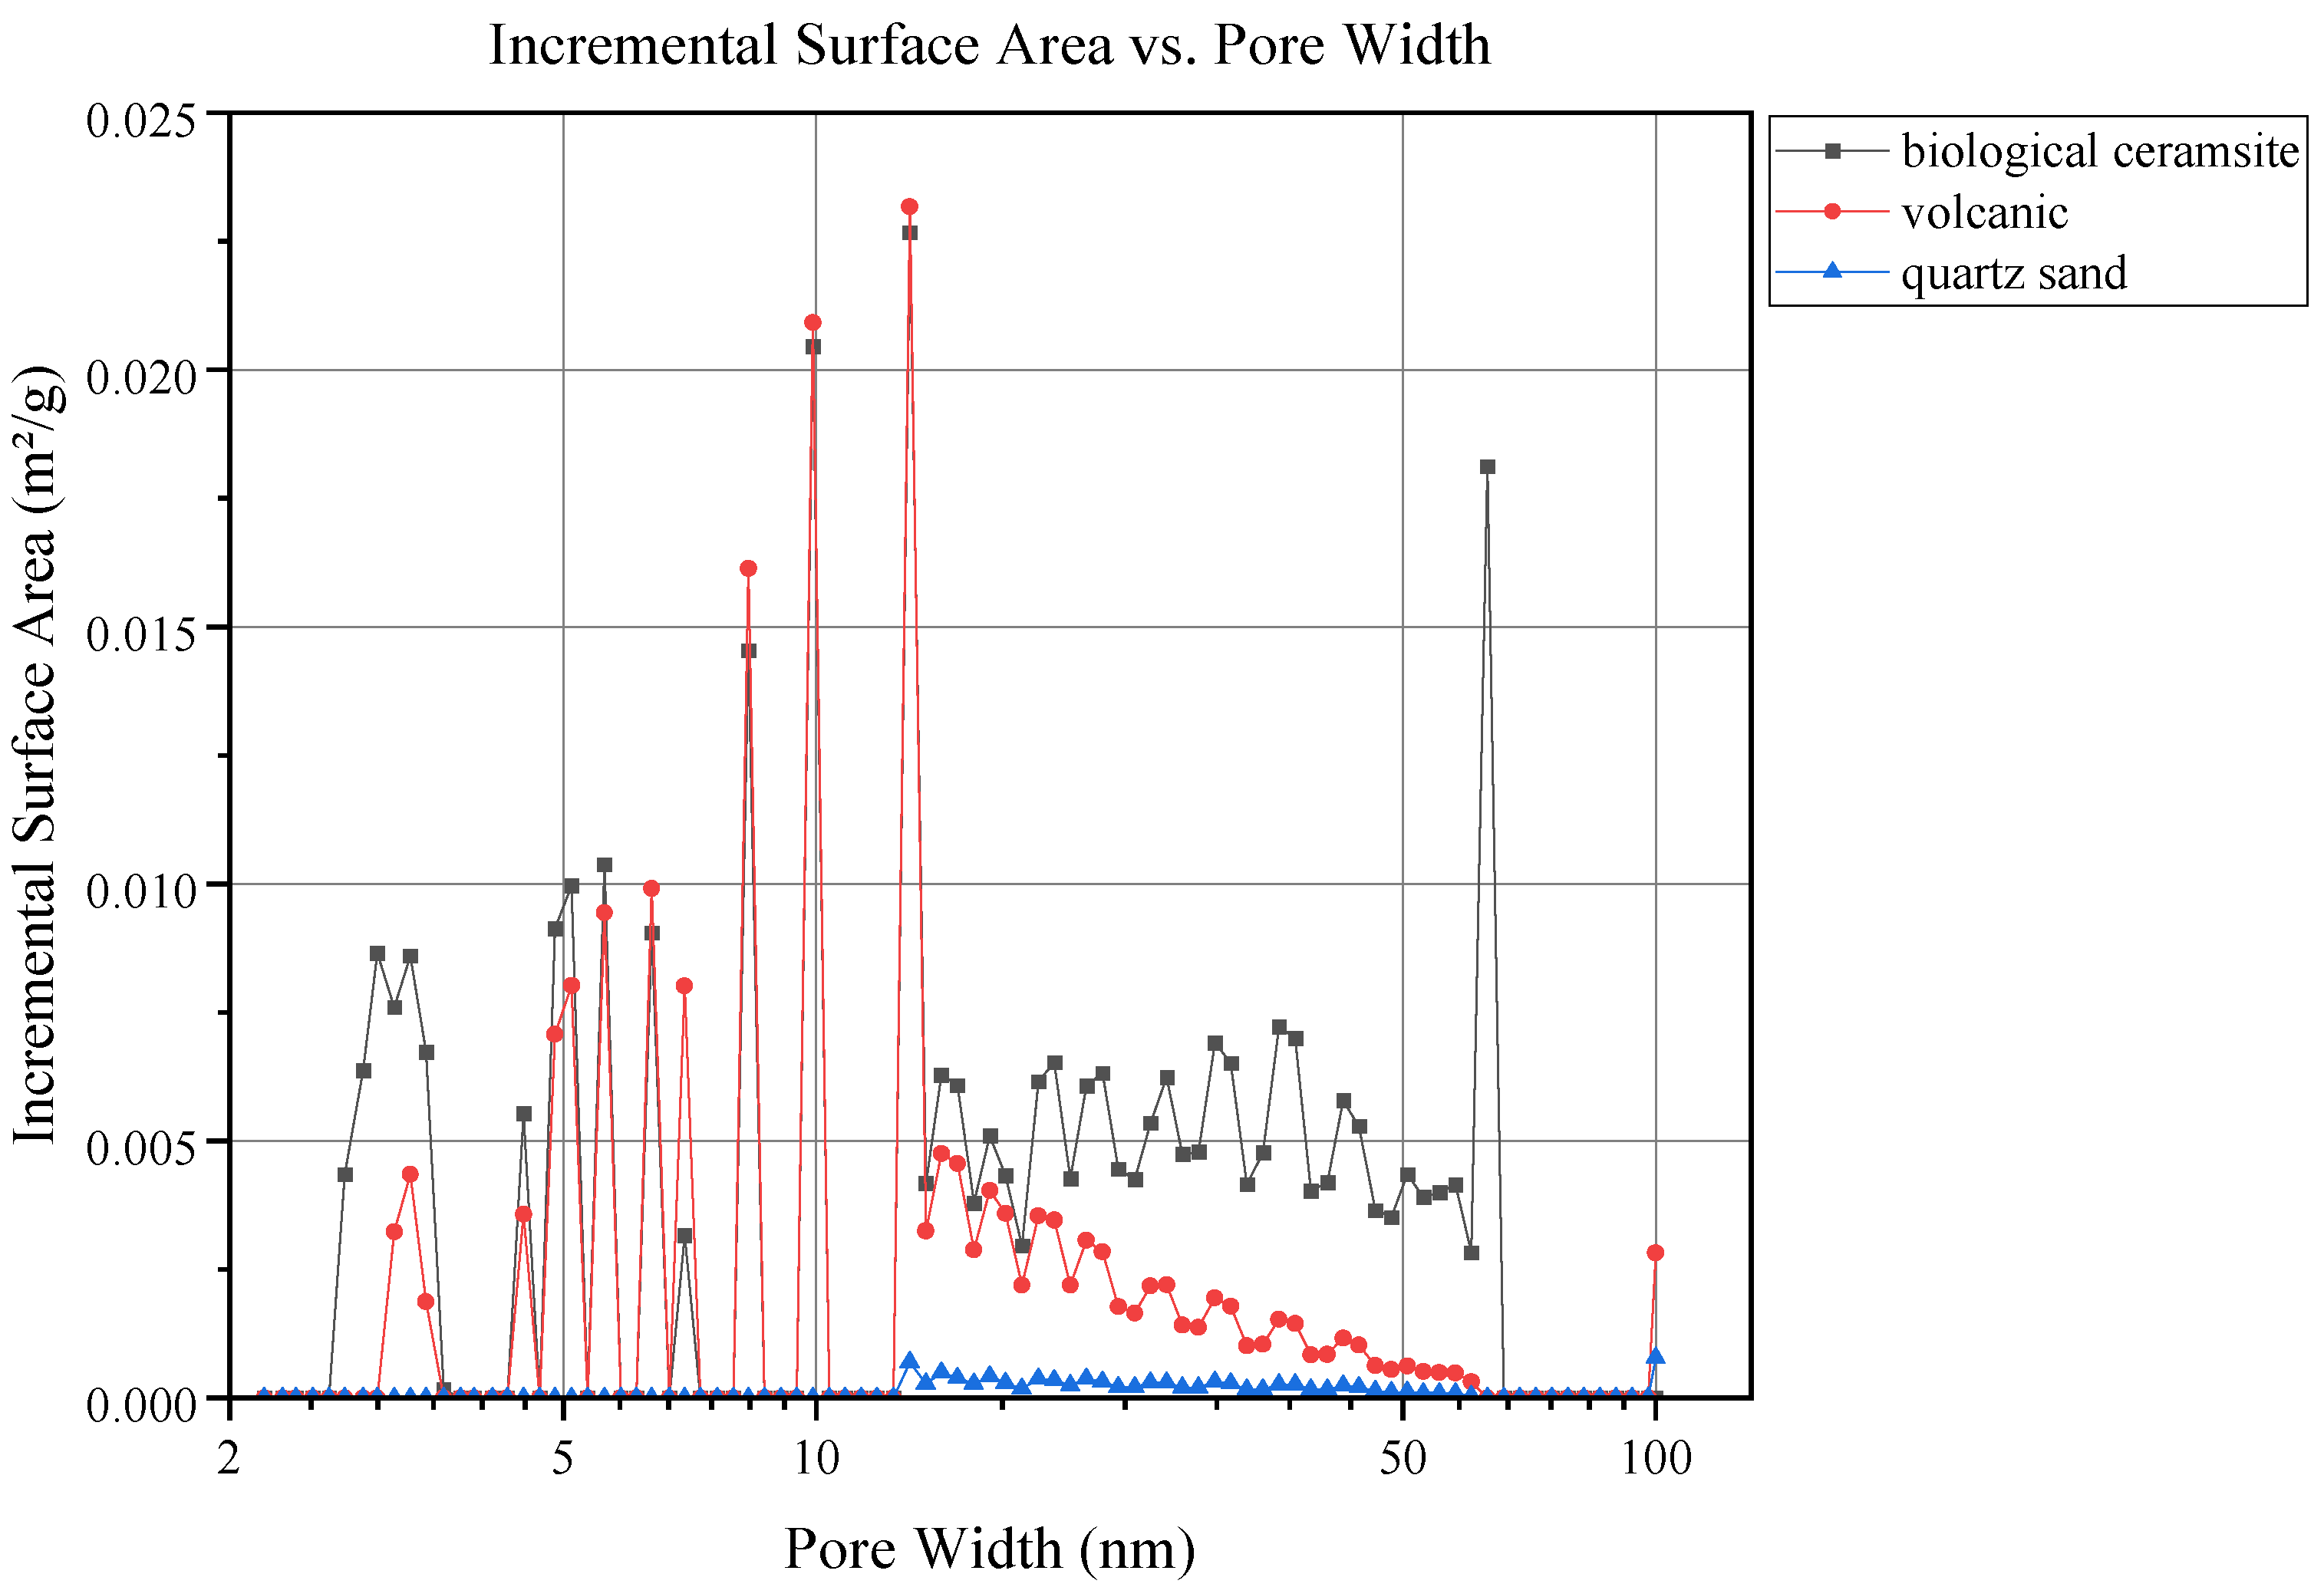
Table 6 shows the BET test results of three filter media; from the results, it is evident that the total specific surface area of bio-ceramsite and volcanic rock significantly exceeds that of quartz sand, with the total specific surface area of bio-ceramsite being nearly twice that of volcanic rock. Additionally, the micropore specific surface area and micropore volume of the three filter media showed the same regularity as the total specific surface area. Therefore, bio-ceramsite possesses more adsorption sites compared to volcanic rock and quartz sand. One characteristic of bio-ceramsite is that it provides more attachment points for microbial biofilm formation, thereby enhancing the degradation efficiency of organic matter and ammonia nitrogen, as well as enabling more effective adsorption of small molecules such as phosphate ions [45].
Figure 3 shows the incremental surface area of the filter media with the pore width. It was obvious that the incremental surface area of bio-ceramsite, whether microporous (≤2 nm) or mesoporous (2–55 nm), was significantly higher than that of volcanic rock, especially in the range of about 2.5 nm and 15–55 nm in pore size. On the other hand, quartz sand has almost no micropores or mesopores below 15 nm, and the corresponding incremental surface area is also almost zero. In addition, the specific surface area generated by mesopores above 15 nm is not in the same order of magnitude as that of bio-ceramsite and volcanic rock.
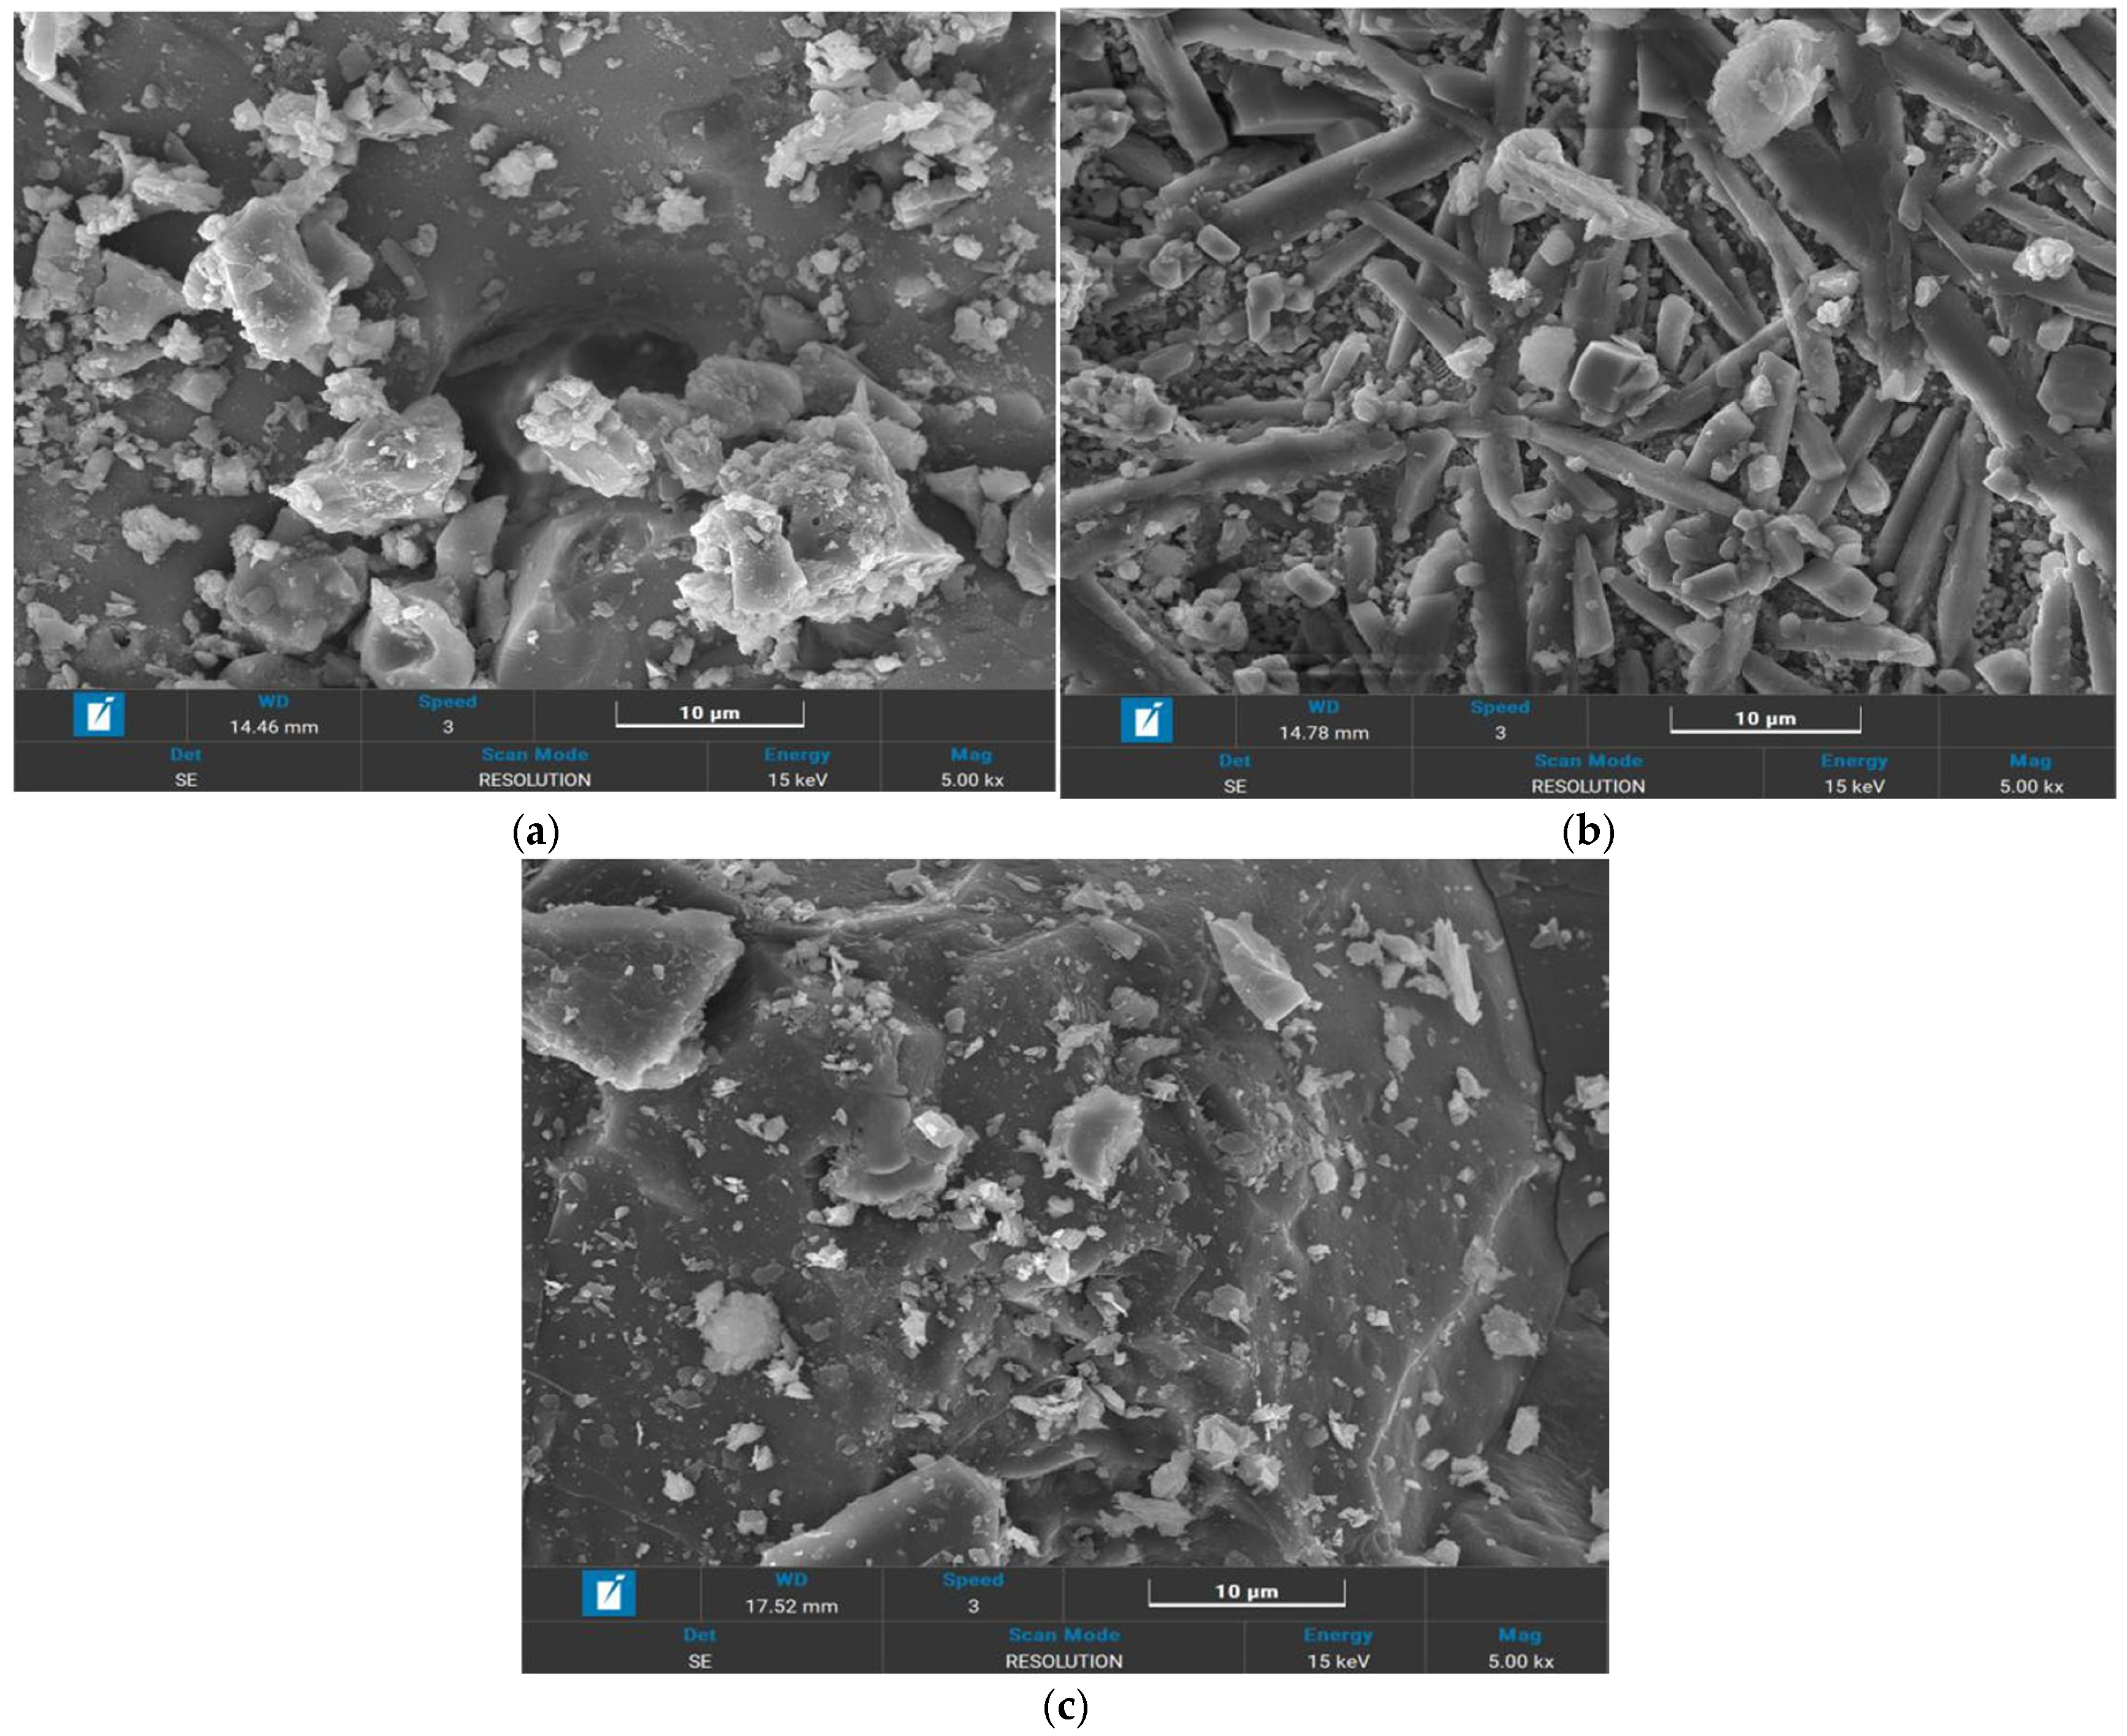
Figure 4 shows the SEM scanning results of the filter media at 5 K× magnification. It could be observed that the surface morphology and microstructure of bio-ceramsite and volcanic rock were more complex compared to quartz sand. On the surface of bio-ceramsite, distinct pore structures were visible, with numerous granular substances densely distributed around the pores. The volcanic surface predominantly exhibited rod-shaped substances; in contrast, quartz sand displayed a significantly simpler and more enclosed surface morphology, which might be related to its formation conditions. Overall, the significant differences in the micro-surface structures of bio-ceramsite, volcanic rock, and quartz sand fundamentally stem from their distinct formation mechanisms as well as their chemical compositions [46,47].

3.3. Microbial Analysis

Microbial samples were collected at different depths from six test columns under three operating conditions—Condition 3 (HRT = 1 d, PL = high), Condition 5 (HRT = 2 d, PL = medium), and Condition 7 (HRT = 1 d, PL = low)—and the average pollutant concentrations during the operation of these three conditions were the highest, median, and lowest among the nine operating conditions, respectively. The sampling depths were set at 15 cm and 45 cm below the filter media surface, representing the upper and lower layers of the experimental columns. The sample numbering rules were as follows: the first digit represents the number of operating conditions, the middle letter plus number combination represents the test column number, and the last digit represents the upper level if it is 1, and the lower level if it is 2. For instance, 3A21 represents the microbial samples in the upper layers of the A2 numbered experimental column under the third working condition.

3.3.1. Microbial Community Structure

Proteobacteria exhibited the highest relative abundance among all microbial samples across the three operating conditions (Figure 5), averaging over 50%. No significant differences were observed between samples (p > 0.05). The average relative abundance of Proteobacteria showed a declining trend as the average pollutant concentration decreased. Proteobacteria are the most common and indispensable phyla microorganisms in various wastewater treatment processes, including many microorganisms capable of degrading organic matter and removing total nitrogen [27]. Moreover, significant differences were identified between Sample Group 1 (A31, A32, B22, B31, and B32) and Sample Group 2 (A11, A12, A21, A22, B11, B12, and B21). Under all three conditions, the relative abundances of Actinomycetota and Deinococcota were significantly higher in Group 1 compared to Group 2 (p < 0.05), while the relative abundance of Acidobacteriota was significantly lower in Group 1 (p < 0.05). It was worth noting that the filter media of samples A31, A32, B22, and B31 in Group 1 were bio-ceramsite, and though sample B32 used volcanic rock, its position directly beneath the bio-ceramsite layer of B31 resulted in attachment of biofilms sloughed from the upper layer, leading to similar microbial communities to the bio-ceramsite samples. The observed divergence in microbial community structures between the two groups reveals that the relative abundance of Actinomycetota, Deinococcota, and Acidobacteriota is highly correlated with the bio-ceramsite. This correlation may be linked to the alkaline-rich nature of the bio-ceramsite; the release of alkaline components elevated the aquatic pH, consequently shaping distinct microecological environments that ultimately drove microbial community differentiation. This discovery has been confirmed by previous studies, which have shown that materials with alkaline pH values can have an impact on microbial populations [48].
Moreover, it is worth noting that distinct phylum-level abundance patterns emerged, closely linked to filter media and operating conditions: (1) Nitrospirota abundance significantly increased in samples B31 and B32 across all conditions, highlighting a strong association with the synergistic effect of bio-ceramsite and volcanic rock. The primary function of Nitrospirota is nitrification; hence, a relatively high nitrogen removal efficiency was observed in column B3. In practical engineering, the combination of bio-ceramsite and volcanic rock can be strategically placed in areas where nitrification needs to be enhanced. (2) Firmicutes thrived under higher organic loads (Conditions 3 and 5) in samples A31, A32, and B22 but declined sharply, falling below dominant levels, under the low organic load of Condition 7. A possible reason was that the extremely low concentration of organic matter in Condition 7 was not conducive to the proliferation of Firmicutes, and they could not become the dominant community. (3) Chloroflexi abundance across all conditions showed a clear preference for volcanic rock (highest in A21, A22). (4) Finally, the significantly higher Bacteroidetes abundance in Group 1 was observed under Conditions 3 and 5, highlighting a strong association with bio-ceramsite, but disappeared under Condition 7′s low organic load, indicating that the extremely low organic matter concentration under Condition 7 was unfavorable for the proliferation of Bacteroidetes, preventing them from becoming a dominant community.
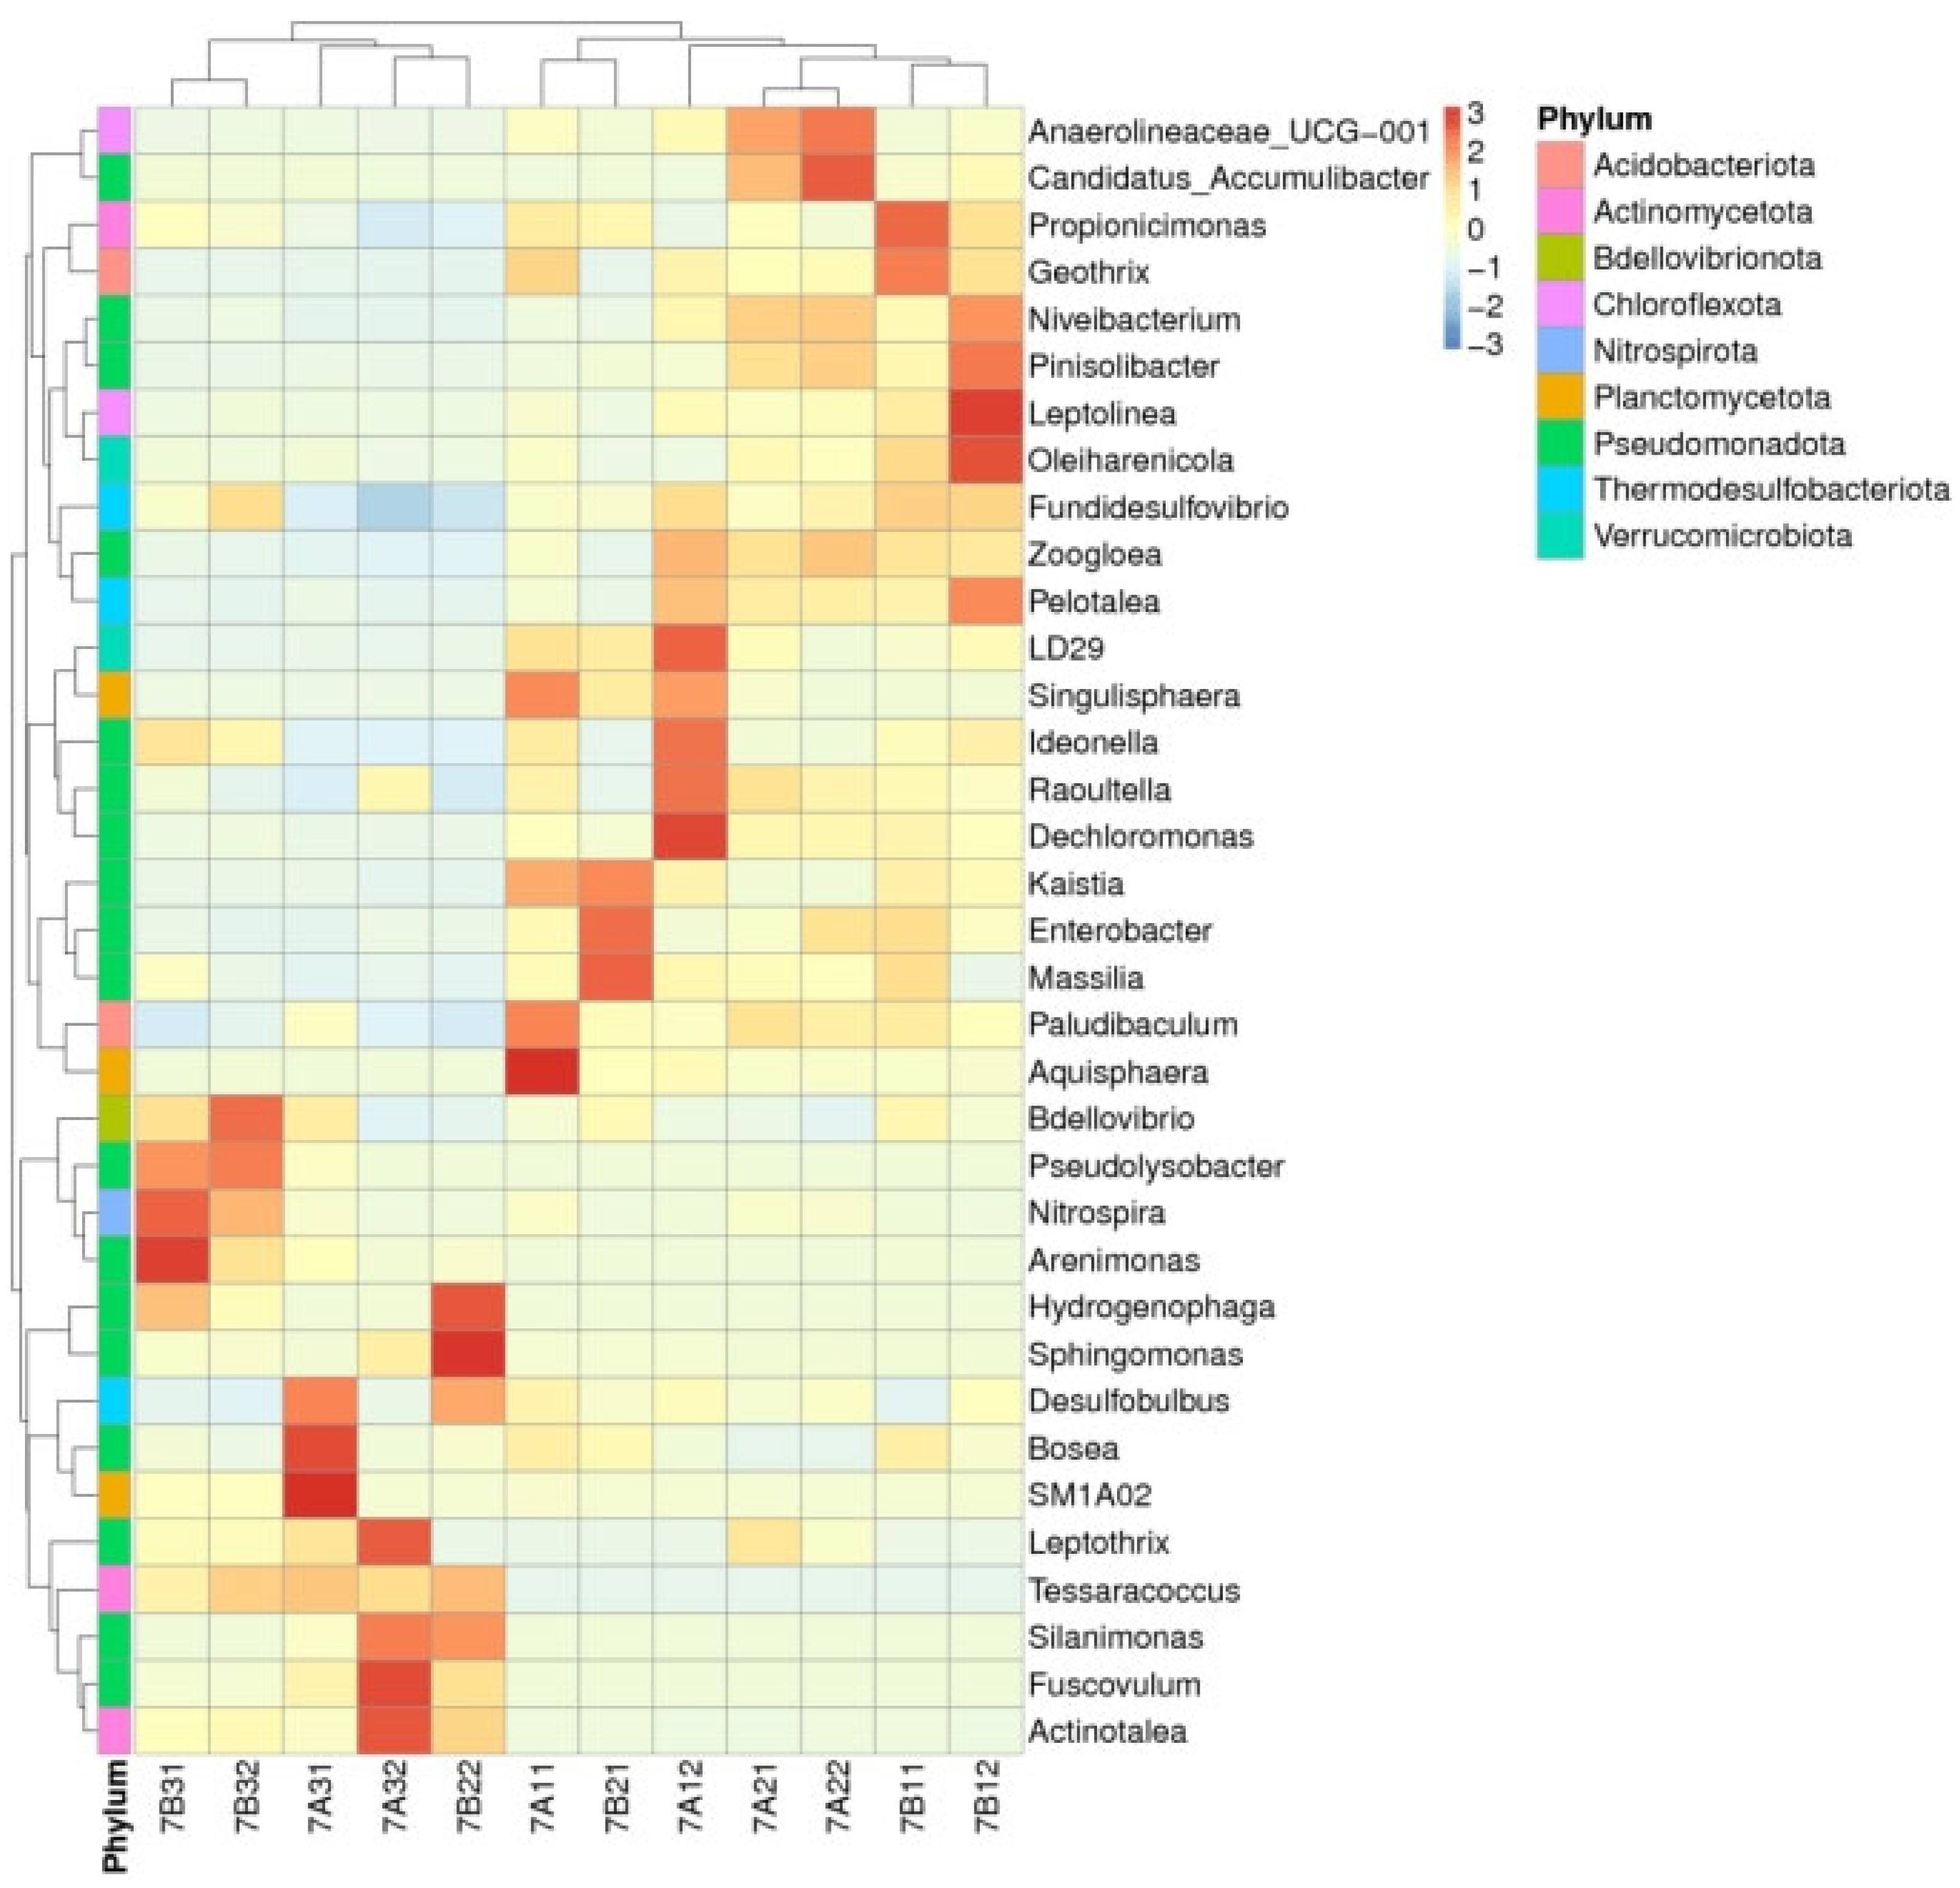
Hierarchical clustering at the genus level (Condition 3 shown in Figure 6; Conditions 5 and 7 shown in Figure A1 and Figure A2) confirmed the distinctiveness of Group 1 (A31, A32, B22, B31, and B32), with samples within this group exhibiting high similarity and preferentially clustering together, consistent with phylum-level patterns. Strikingly, the genera Nitrospira, Sphingomonas, Leptothrix, Desulfobulbus, Tessaracoccus, Silanimonas, and Actinotalea were absolutely dominant within Group 1 samples under every operating condition, highlighting a strong association with bio-ceramsite. Among them, Nitrospira play a key role in nitrification, with certain species (e.g., Comammox Nitrospira) capable of completely oxidizing ammonia to nitrate, which explains the high removal efficiencies of TN and NH3-N in columns A3, B2, and B3 [49]. Meanwhile, Sphingomonas contribute to organic pollutant degradation through diverse metabolic pathways—including hydrolysis, dealkylation, and oxidation—and can utilize the Entner–Doudoroff pathway for glucose metabolism, yielding metabolites such as ethanol and lactate [50]. This accounts for the high COD removal rates observed in Group 1.

3.3.2. Microbial α-Diversity and PCoA

Significant variation in α-diversity (Shannon and Simpson indices; Table 7) was observed across all samples. Notably, sample A32 consistently exhibited the lowest diversity under the three operating conditions. Samples A31 and B22 also demonstrated relatively low diversity. Critically, these three low-diversity samples exclusively contained bio-ceramsite as their filter media; one possible reason is that the alkaline water environment leads to a reduction in microbial diversity [51]. Conversely, samples B31 and B32 displayed the highest α-diversity indices, which may be attributed to the synergistic effects of bio-ceramsite and volcanic rock.
PCoA analysis based on Weighted Unifrac distance in Condition 3 (Figure 7) and Conditions 5 and 7 (shown in Figure A3 and Figure A4) revealed that the first two principal coordinate axes accounted for 71.47% of the observed microbial community variation. Samples originating from the same experimental column generally clustered together, indicating greater within-column community similarity. Furthermore, samples associated with bio-ceramsite (B22, A31, A32, B31, and B32) consistently formed a distinct cluster positioned closely along the PC1 axis across all three operating conditions.

3.3.3. Tax4Fun Prediction

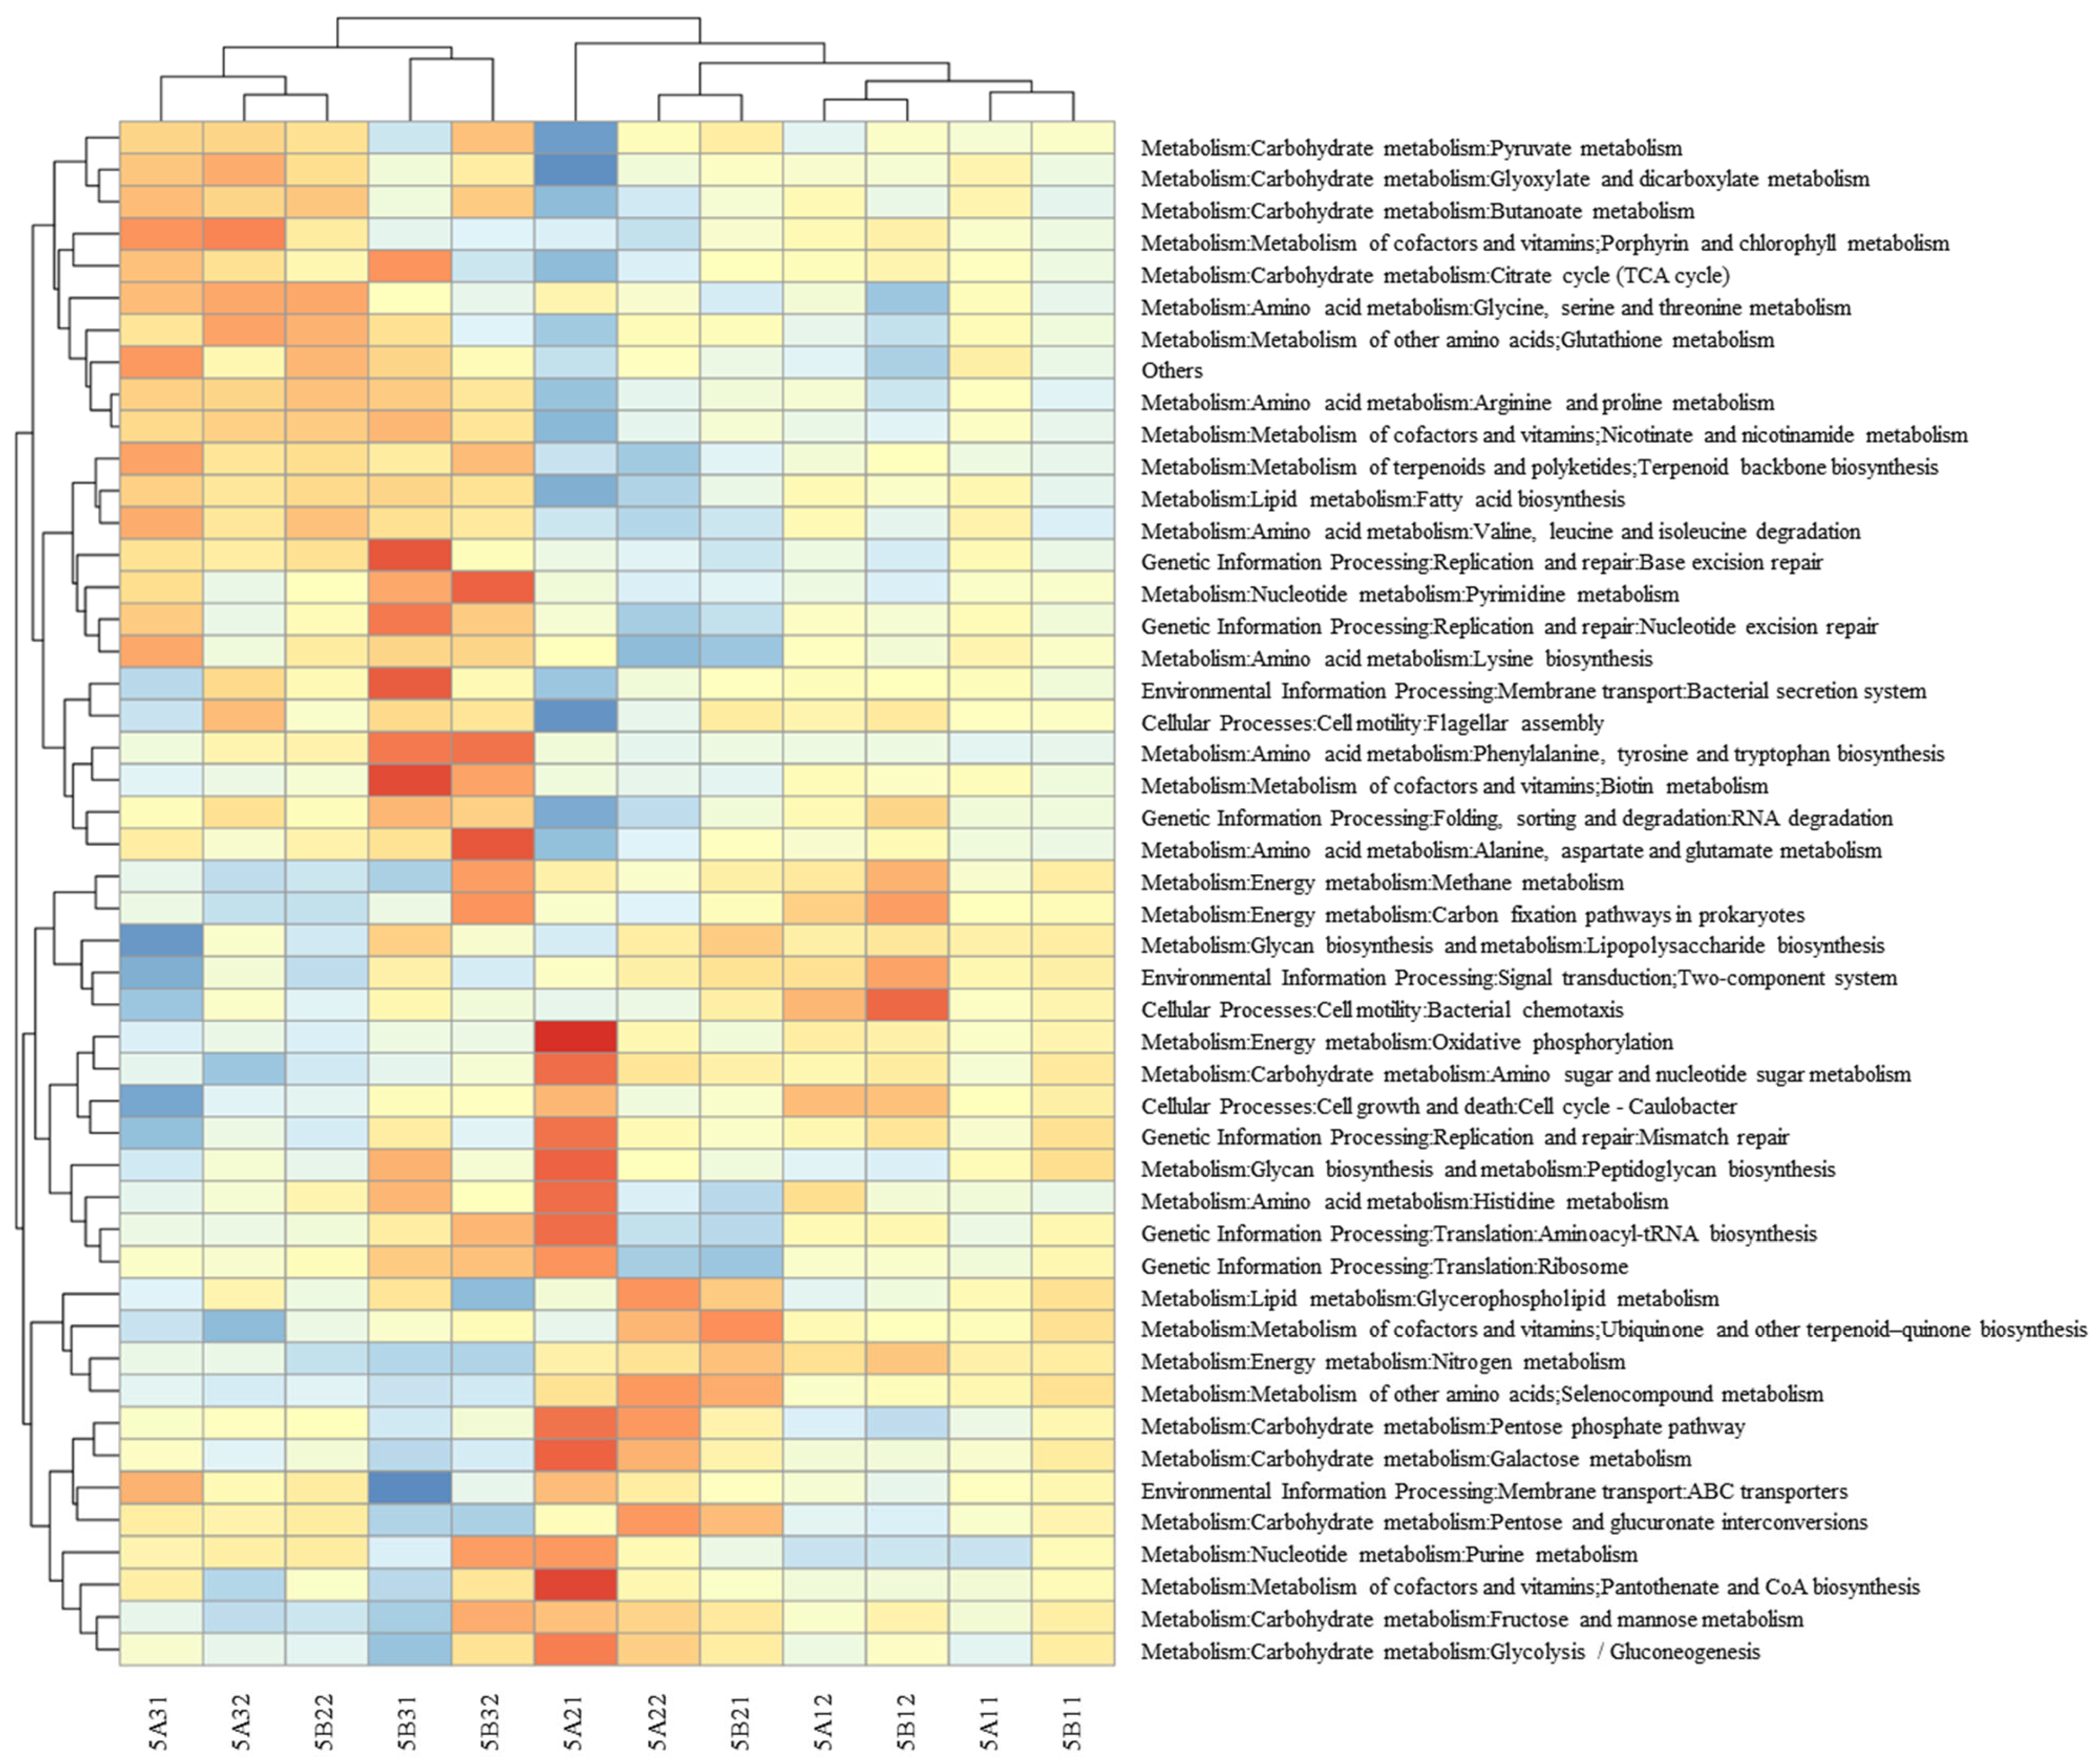
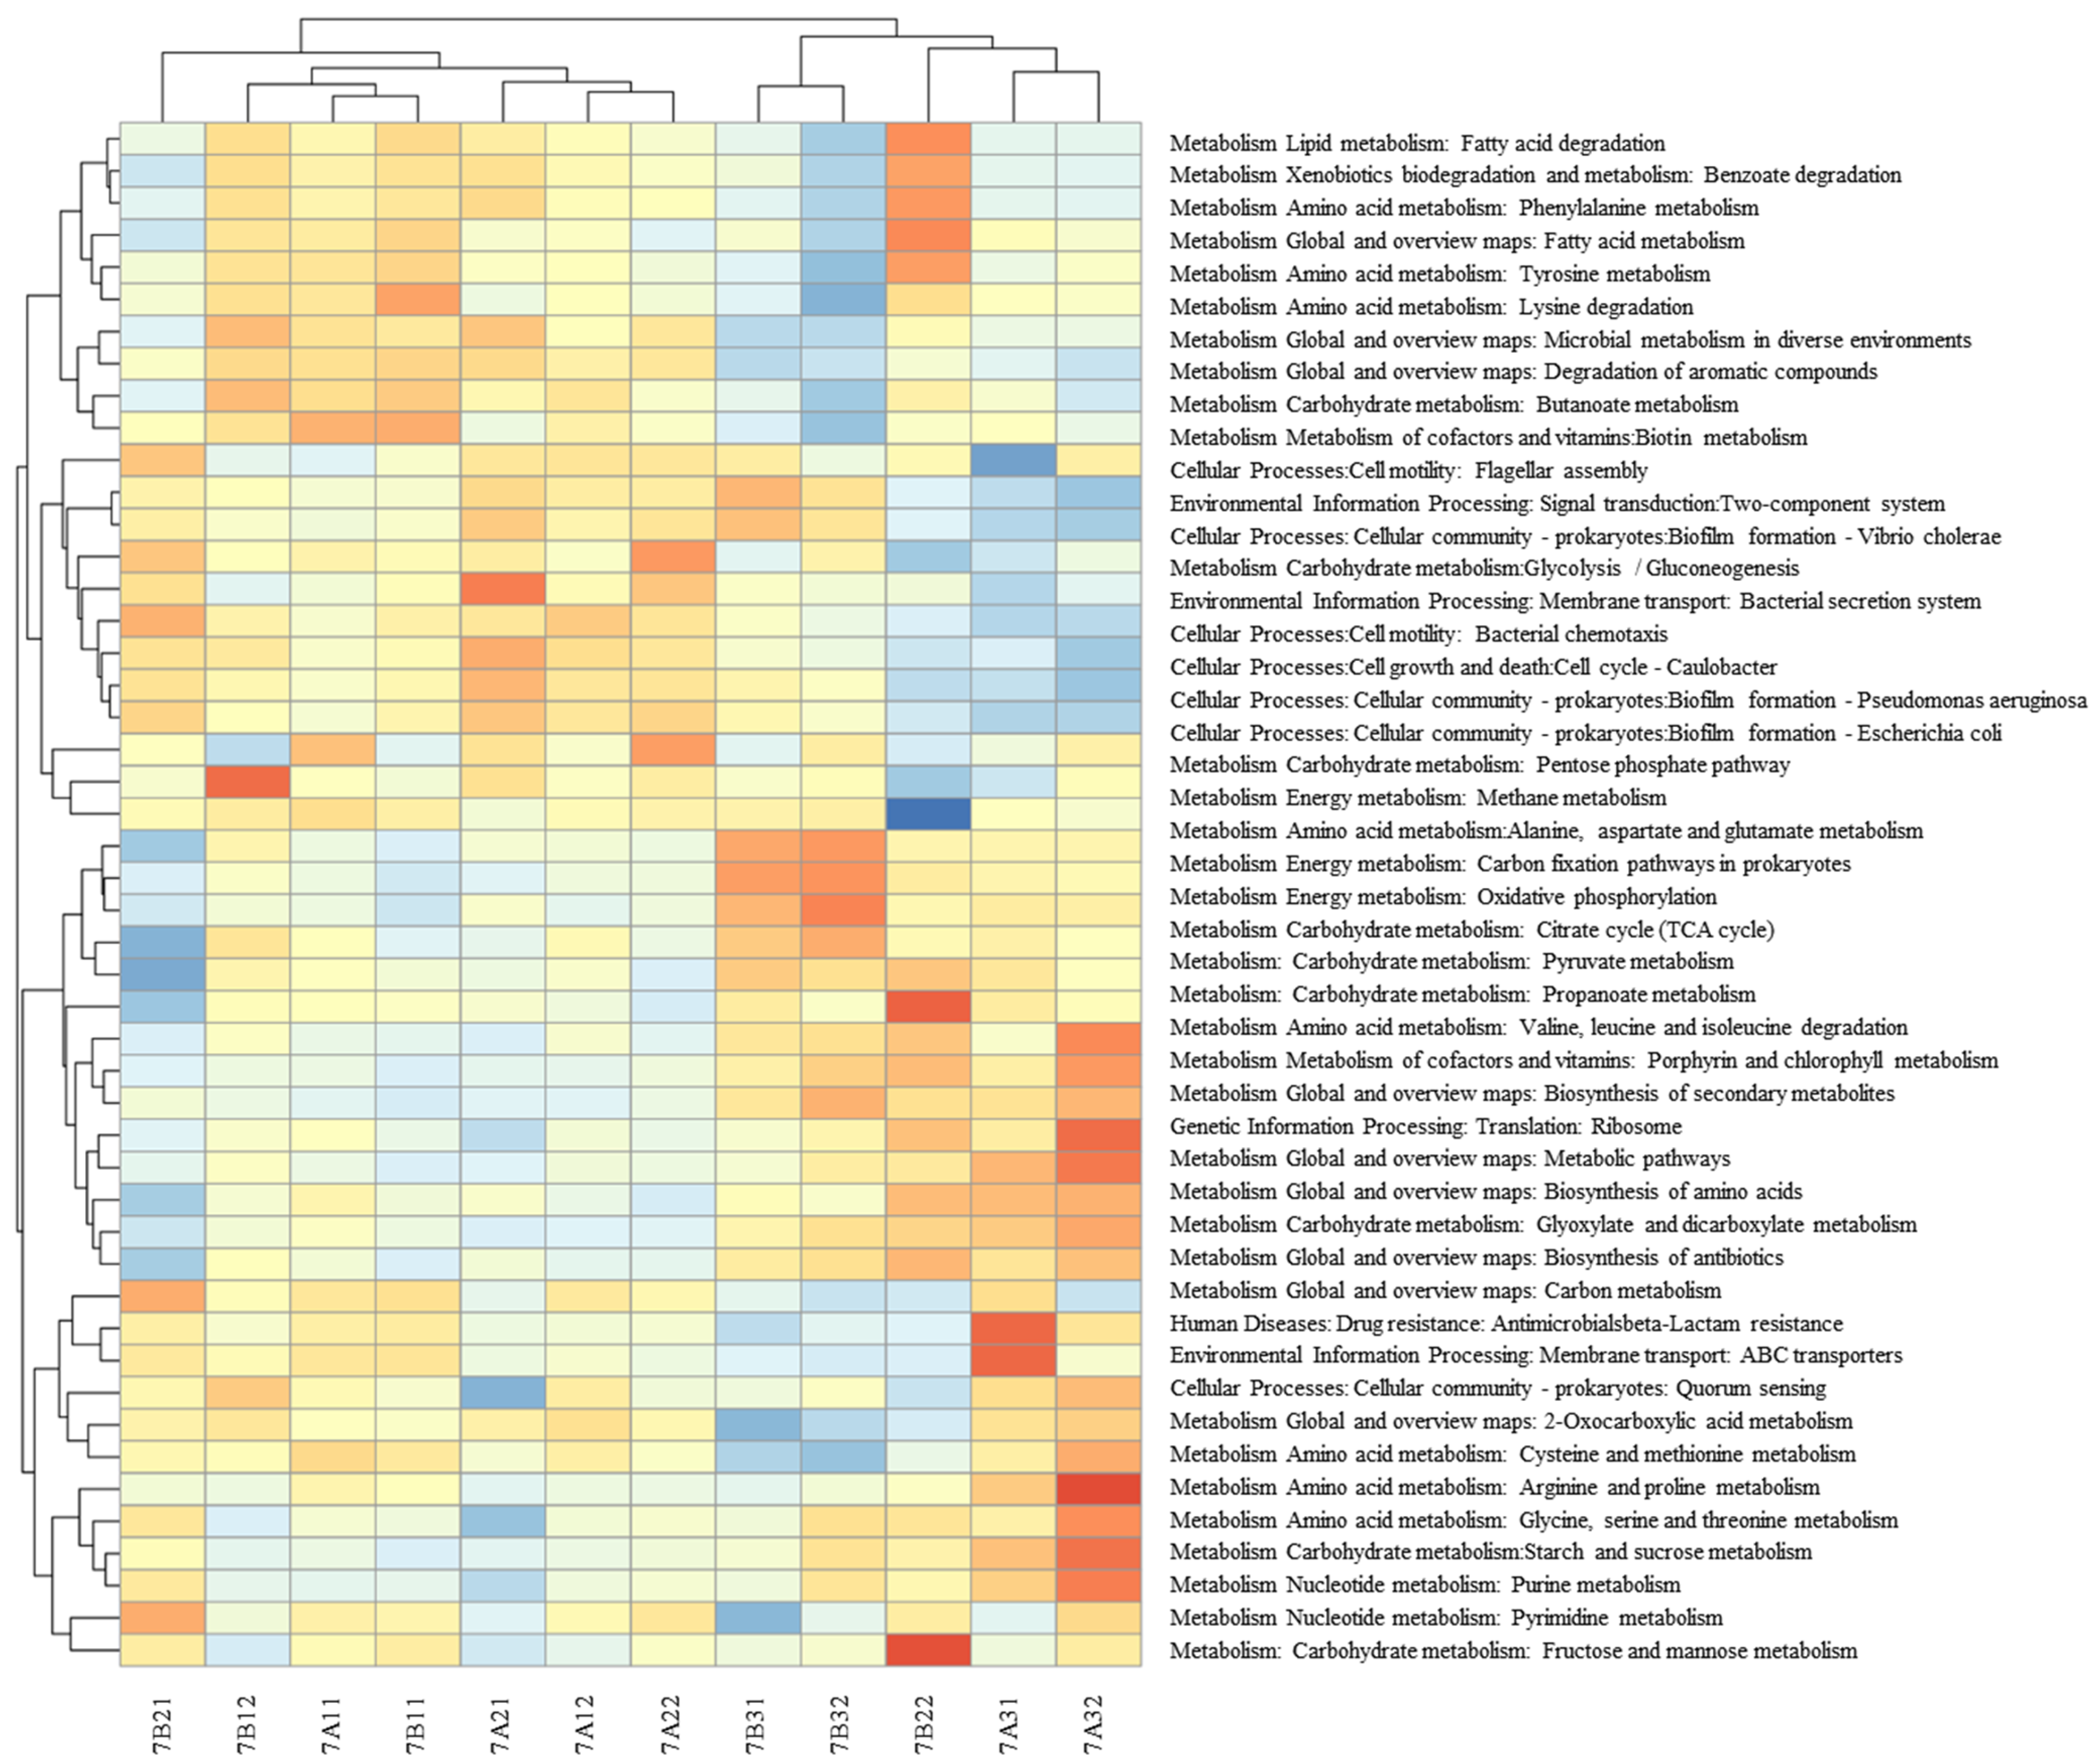
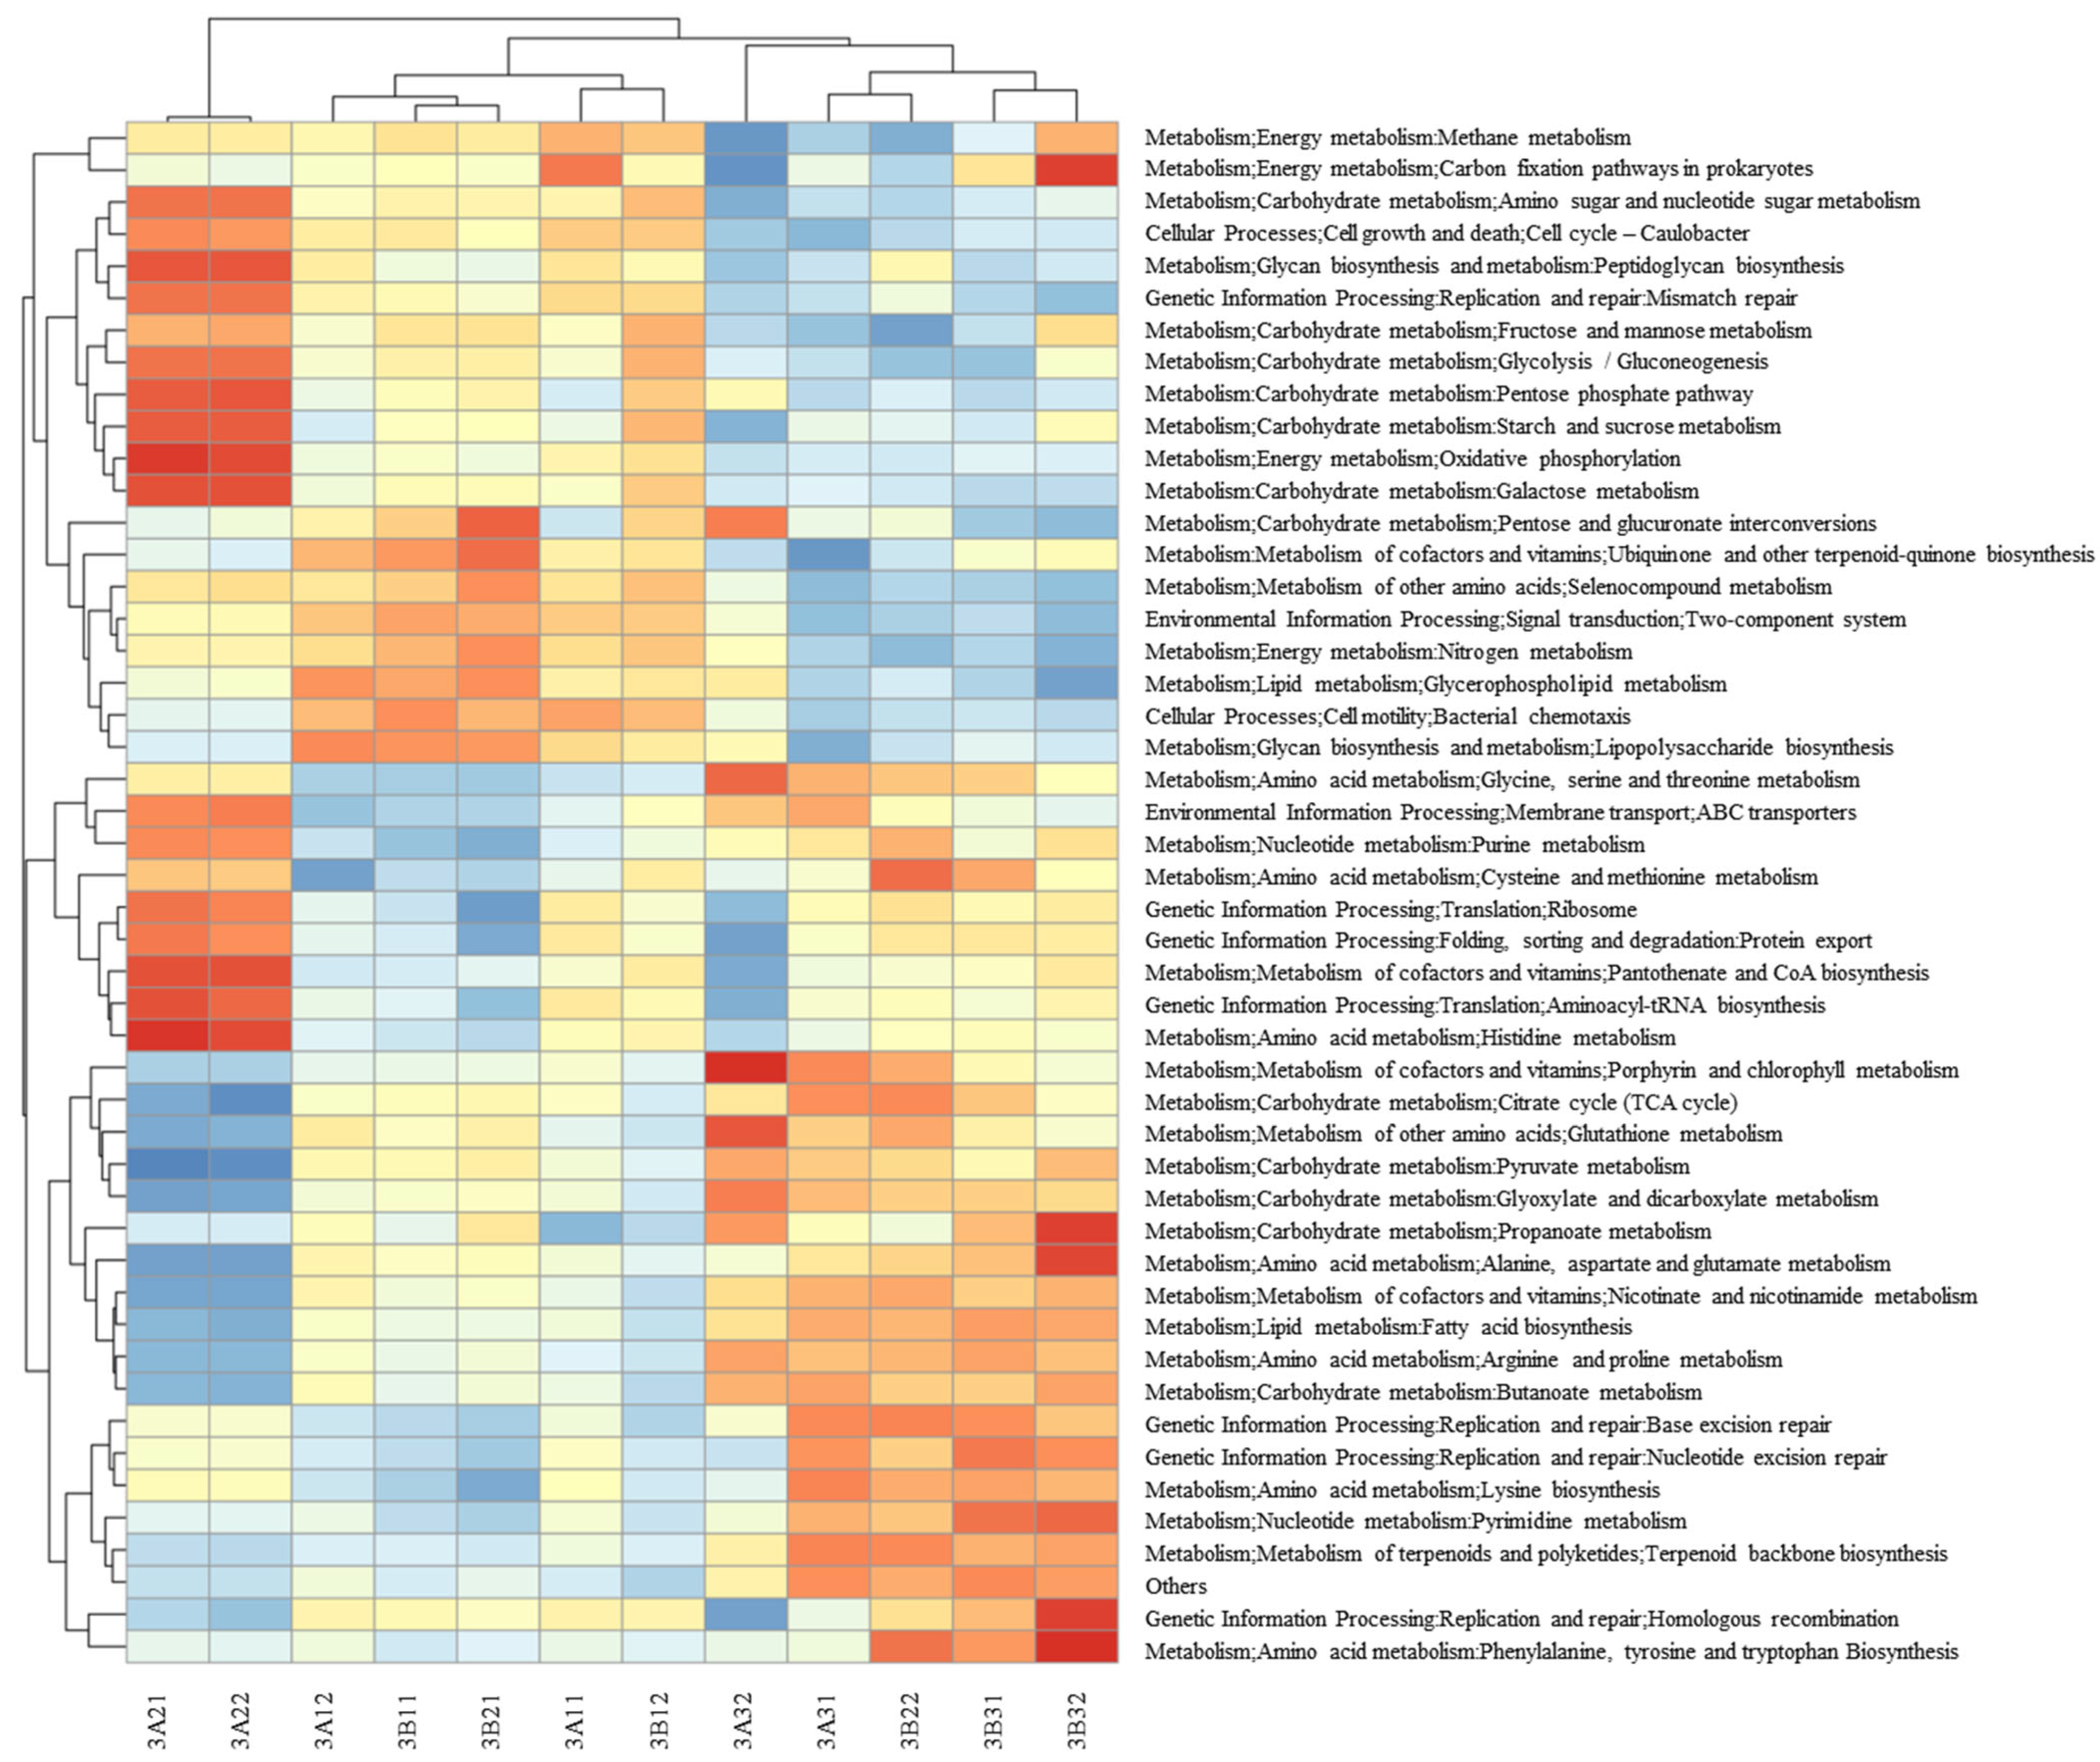
Tax4Fun functional analysis of microorganisms (Condition 3 shown in Figure 8; Conditions 5 and 7 shown in Figure A5 and Figure A6) found significant functional divergence between Groups 1 and 2. Group 1 consistently exhibited significantly stronger predicted activity for core carbohydrate metabolism pathways compared to Group 2 across all conditions, including the TCA cycle, pyruvate metabolism, oxalic acid metabolism, and dicarboxylic acid metabolism, highlighting a strong association with bio-ceramsite; this also served as one of the main reasons for the high COD removal rates in the experimental columns A3, B2, and B3. Among these, the TCA cycle is a ubiquitous metabolic pathway in aerobic organisms that serves not only as the common terminal oxidation pathway for carbohydrates, lipids, and amino acids, but also as the central hub connecting their metabolism and interconversion [52]. Additionally, glucose can be converted into pyruvate through either glycolysis under anaerobic conditions or the HMP pathway (pentose phosphate pathway) under aerobic conditions [53]. The robust pyruvate metabolism suggests that a greater flux of glucose is being channeled through glycolysis to pyruvate.

3.4. Synergistic Effects Between Filter Media

Among the six test columns, the bio-ceramsite in columns A3, B2, and B3 leverages its large specific surface area and alkali-releasing properties to create a unique microenvironment, achieving efficient removal of COD, TN, and TP. Moreover, the combination of volcanic rock and bio-ceramsite in column B3 exhibited synergistic effects in pollutant removal, with its performance being even slightly superior to that of column A3.
One possible reason is that the addition of volcanic rock in column B3 partially mitigates the suppression of microbial diversity caused by bio-ceramsite’s strong selective pressure, as column B3 exhibited the highest α-diversity (Shannon/Simpson indices). This indicates that the volcanic rock provides richer potential ecological niches, thereby improving the system’s resilience to fluctuating loads. Another possible reason is that the high-voidage volcanic layer in B3 effectively retains biofilms sloughed off from the upper bio-ceramsite layer. As a result, the aqueous environment in the lower section of the column accumulates a significant amount of suspended flocculent sludge, maintaining a higher overall microbial biomass than column A3 [54].
Based on their intrinsic physicochemical properties, the superior performance of bio-ceramsite and its synergistic combination with volcanic rock are expected to be maintained in real wastewater treatment. Although the introduction of real wastewater will increase the complexity of the microbial community, the functional advantages of the established communities are likely to persist under the selective pressure exerted by the filter media. Furthermore, indigenous microorganisms play a dual role: they act as a beneficial supplement that can enhance degradation efficiency and system stability, while also serving as competitors—a challenge that the optimized media combination is well-adapted to withstand and integrate, thereby ensuring robust treatment performance [55].

4. Conclusions

This study created a “functional gradient” using differentiated filter media to investigate potential synergistic effects that could yield superior and more robust treatment performance compared to single-medium systems. The results demonstrated that test columns containing bio-ceramsite exhibited superior pollutant removal efficiency. SEM, BET, and other tests demonstrated that bio-ceramsite’s superior removal efficiency stems from its distinct microporous structure, large surface area, and alkaline characteristics. In particular, the combination of bio-ceramsite and volcanic rock demonstrated superior pollutant removal performance, revealing potential synergistic effects between the two filter media, which led to enhanced microbial diversity, enrichment of functional genera (e.g., Nitrospira), and more stable and effective pollutant removal.
The findings underscore the potential of optimized filter media combinations in designing efficient and sustainable CWs for wastewater treatment, offering a cost-effective solution for environmental conservation. Future research could further explore its long-term performance and scalability at the pilot scale and under real-world conditions, taking into account the influence of plants.

Author Contributions

Conceptualization, H.C. and H.Y.; methodology, J.Y.; writing—original draft preparation, H.C. and H.Y.; writing—review and editing, H.Y. and J.Y.; supervision, H.K. and X.Z.; project administration, A.H. All authors have read and agreed to the published version of the manuscript.

Funding

This research was supported by the National Natural Science Foundation of China [Grant number 52478368].

Data Availability Statement

The original contributions presented in this study are included in the article. Further inquiries can be directed to the corresponding authors.

Conflicts of Interest

Authors Huaiwei Chen, Huaqi Yao and Jialei Yuan were employed by the company Zhejiang Institute of Mechanical & Electrical Engineering Co., Ltd. The remaining authors declare that the research was conducted in the absence of any commercial or financial relationships that could be construed as a potential conflict of interest.

Abbreviations

The following abbreviations are used in this manuscript:
CWsconstructed wetlands
SEMScanning Electron Microscopy
BETBrunauer–Emmett–Teller
VSSFvertical subsurface flow
HSSFhorizontal subsurface flow

Appendix A

Figure A1. Hierarchical clustering at the genus level in Condition 5.
Water 17 02969 g0a1
Figure A2. Hierarchical clustering at the genus level in Condition 7.
Water 17 02969 g0a2
Figure A3. PCoA analysis based on Weighted Unifrac distance in Condition 5.
Water 17 02969 g0a3
Figure A4. PCoA analysis based on Weighted Unifrac distance in Condition 7.
Water 17 02969 g0a4
Figure A5. Tax4Fun functional profiling in Condition 5.
Water 17 02969 g0a5
Figure A6. Tax4Fun functional profiling in Condition 7.
Water 17 02969 g0a6

References

  1. Biswas, A.K.; Tortajada, C. Water quality management: A globally neglected issue. Int. J. Water Resour. Dev. 2019, 35, 913–916. [Google Scholar] [CrossRef]
  2. Grizzetti, B.; Lanzanova, D.; Liquete, C.; Reynaud, A.; Cardoso, A.C. Assessing water ecosystem services for water resource management. Environ. Sci. Policy 2016, 61, 194–203. [Google Scholar] [CrossRef]
  3. Chen, X.; Chao, L.; Wan, Y.; Wang, X.; Pu, X. Study of the characteristics of pollutants in rural domestic sewage and the optimal sewage treatment process: A Chengdu Plain case study. Water Sci. Technol. 2023, 87, 2373–2389. [Google Scholar] [CrossRef]
  4. Hou, F.; Tian, Z.; Peter, K.T.; Wu, C.; Gipe, A.D.; Zhao, H.; Alegria, E.A.; Liu, F.; Kolodziej, E.P. Quantification of organic contaminants in urban stormwater by isotope dilution and liquid chromatography-tandem mass spectrometry. Anal. Bioanal. Chem. 2019, 411, 7791–7806. [Google Scholar] [CrossRef]
  5. Li, X.; Zhang, X.; Zhao, M.; Zheng, X.; Wang, Z.; Fan, C. Application of Decentralized Wastewater Treatment Technology in Rural Domestic Wastewater Treatment. Sustainability 2024, 16, 8635. [Google Scholar] [CrossRef]
  6. Somma, S.; Reverchon, E.; Baldino, L. Water Purification of Classical and Emerging Organic Pollutants: An Extensive Review. ChemEngineering 2021, 5, 47. [Google Scholar] [CrossRef]
  7. Zekri, S.; Ahmed, M.; Chaieb, R.; Ghaffour, N. Managed aquifer recharge using quaternary-treated wastewater: An economic perspective. Int. J. Water Resour. Dev. 2013, 30, 246–261. [Google Scholar] [CrossRef]
  8. Deng, Y.; Wheatley, A. Wastewater Treatment in Chinese Rural Areas. Asian J. Water Environ. Pollut. 2016, 13, 1–11. [Google Scholar] [CrossRef]
  9. Massoud, M.A.; Tarhini, A.; Nasr, J.A. Decentralized approaches to wastewater treatment and management: Applicability in developing countries. J. Environ. Manag. 2009, 90, 652–659. [Google Scholar] [CrossRef] [PubMed]
  10. Masi, F.; Rizzo, A.; Regelsberger, M. The role of constructed wetlands in a new circular economy, resource oriented, and ecosystem services paradigm. J. Environ. Manag. 2018, 216, 275–284. [Google Scholar] [CrossRef] [PubMed]
  11. Alufasi, R.; Parawira, W.; Zvidzai, C.J.; Stefanakis, A.I.; Musili, N.; Lebea, P.; Chakauya, E.; Chingwaru, W. Performance Evaluation of a Pilot-Scale Constructed Wetland with Typha latifolia for Remediation of Domestic Wastewater in Zimbabwe. Water 2024, 16, 8635. [Google Scholar] [CrossRef]
  12. García-Valero, A.; Acosta, J.A.; Faz, Á.; Gómez-López, M.D.; Carmona, D.M.; Terrero, M.A.; El Bied, O.; Martínez-Martínez, S. Swine Wastewater Treatment System Using Constructed Wetlands Connected in Series. Agronomy 2024, 14, 143. [Google Scholar] [CrossRef]
  13. Gorgoglione, A.; Torretta, V. Sustainable Management and Successful Application of Constructed Wetlands: A Critical Review. Sustainability 2018, 10, 3910. [Google Scholar] [CrossRef]
  14. Rahman, M.E.; Bin Halmi, M.I.E.; Samad, M.Y.B.A.; Uddin, M.K.; Mahmud, K.; Shukor, M.Y.A.; Abdullah, S.R.S.; Shamsuzzaman, S.M. Design, Operation and Optimization of Constructed Wetland for Removal of Pollutant. Int. J. Environ. Res. Public Health 2020, 17, 8339. [Google Scholar] [CrossRef]
  15. Wu, H.; Zhang, J.; Ngo, H.H.; Guo, W.; Hu, Z.; Liang, S.; Fan, J.; Liu, H. A review on the sustainability of constructed wetlands for wastewater treatment: Design and operation. Bioresour. Technol. 2015, 175, 594–601. [Google Scholar] [CrossRef] [PubMed]
  16. Zhang, D.Q.; Jinadasa, K.B.; Gersberg, R.M.; Liu, Y.; Tan, S.K.; Ng, W.J. Application of constructed wetlands for wastewater treatment in tropical and subtropical regions (2000–2013). J. Environ. Sci. 2015, 30, 30–46. [Google Scholar] [CrossRef] [PubMed]
  17. Ramírez, L.E.F.; Zamora-Castro, S.A.; Sandoval-Herazo, L.C.; Herrera-May, A.L.; Salgado-Estrada, R.; De La Cruz-Dessavre, D.A. Technological Innovations in the Application of Constructed Wetlands: A Review. Processes 2023, 11, 3334. [Google Scholar] [CrossRef]
  18. Wang, S.; Teng, Y.; Cheng, F.; Lu, X. Application Potential of Constructed Wetlands on Different Operation Mode for Biologically Pre-Treatment of Rural Domestic Wastewater. Sustainability 2023, 15, 1799. [Google Scholar] [CrossRef]
  19. Hube, S.Z.; Zaqout, T.; Ögmundarson, Ó.; Andradóttir, H.Ó.; Wu, B. Constructed Wetlands with Recycled Concrete for Wastewater Treatment in Cold Climate: Performance and Life Cycle Assessment. Sci. Total Environ. 2023, 904, 166778. [Google Scholar] [CrossRef]
  20. Zamora, S.; Marín-Muñíz, J.L.; Nakase-Rodríguez, C.; Fernández-Lambert, G.; Sandoval, L. Wastewater Treatment by Constructed Wetland Eco-Technology: Influence of Mineral and Plastic Materials as Filter Media and Tropical Ornamental Plants. Water 2019, 11, 2344. [Google Scholar] [CrossRef]
  21. Bai, X.; Li, J.; Chang, S. Effects of Different Carbon and Nitrogen Ratios on Nitrogen Removal Efficiency and Microbial Communities in Constructed Wetlands. Water 2023, 15, 4272. [Google Scholar] [CrossRef]
  22. Gupta, P.; Ann, T.W.; Lee, S.M. Use of Biochar to Enhance Constructed Wetland Performance in Wastewater Reclamation. Environ.Eng. Res. 2016, 21, 36–44. [Google Scholar] [CrossRef]
  23. Jayabalan, J.B.; Amirthalingam, S.; Sekar, S.; Santhanam, N.K.; Manoharan, S. Treatment of Textile Effluent Using Sub Surface Flow Constructed Wetlands. AIP Conf. Proc. 2020, 2240, 130001. [Google Scholar] [CrossRef]
  24. Aylan, R.A.; Al-Abbawy, D.A.H.; Yaseen, D.A. Greywater treatment using constructed wetlands modified with biochar and ceramic media. Environ. Technol. 2025, 29, 1–25. [Google Scholar] [CrossRef]
  25. Gopalakrishnan, S.; Aparna, V.L.; Shende, A.D.; Bhaskaran, K. Comparative evaluation of needle-felt coir fibre with conventional media in treatment wetlands. J. Water Process Eng. 2025, 72, 107525. [Google Scholar] [CrossRef]
  26. Vispo, C.; Geronimo, F.K.; Jeon, M.; Kim, L.-H. Performance Evaluation of Various Filter Media for Multi-Functional Purposes to Urban Constructed Wetlands. Sustainability 2024, 16, 287. [Google Scholar] [CrossRef]
  27. Wang, J.; Long, Y.; Yu, G.; Wang, G.; Zhou, Z.; Li, P.; Zhang, Y.; Yang, K.; Wang, S. A Review on Microorganisms in Constructed Wetlands for Typical Pollutant Removal: Species, Function, and Diversity. Front. Microbiol. 2022, 13, 845725. [Google Scholar] [CrossRef] [PubMed]
  28. Wang, W.; Su, Y.; Wang, B.; Wang, Y.; Zhuang, L.; Zhu, G. Spatiotemporal shifts of ammonia-oxidizing archaea abundance and structure during the restoration of a multiple pond and plant-bed/ditch wetland. Sci. Total Environ. 2019, 684, 629–640. [Google Scholar] [CrossRef] [PubMed]
  29. Tan, X.; Yang, Y.-L.; Liu, Y.-W.; Li, X.; Zhu, W.-B. Quantitative ecology associations between heterotrophic nitrification-aerobic denitrification, nitrogen-metabolism genes, and key bacteria in a tidal flow constructed wetland. Bioresour. Technol. 2021, 337, 125449. [Google Scholar] [CrossRef]
  30. Si, Z.; Song, X.; Wang, Y.; Cao, X.; Zhao, Y.; Wang, B.; Chen, Y.; Arefe, A. Intensified heterotrophic denitrification in constructed wetlands using four solid carbon sources: Denitrification efficiency and bacterial community structure. Bioresour. Technol. 2018, 267, 416–425. [Google Scholar] [CrossRef]
  31. Huang, J.; Xiao, J.; Guo, Y.; Guan, W.; Cao, C.; Yan, C.; Wang, M. Long-term effects of silver nanoparticles on performance of phosphorus removal in a laboratory-scale vertical flow constructed wetland. J. Environ. Sci. 2020, 87, 319–330. [Google Scholar] [CrossRef]
  32. Wang, Q.; Ding, J.; Xie, H.; Hao, D.; Du, Y.; Zhao, C.; Xu, F.; Kong, Q.; Wang, B. Phosphorus removal performance of microbial-enhanced constructed wetlands that treat saline wastewater. J. Clean. Prod. 2021, 288, 125119. [Google Scholar] [CrossRef]
  33. Metzger, Z.; Teperovich, E.; Cohen, R.; Zary, R.; Paque, F.; Hulsmann, M. The self-adjusting file (SAF). Part 3: Removal of debris and smear layer-A scanning electron microscope study. J. Endod. 2010, 36, 697–702. [Google Scholar] [CrossRef] [PubMed]
  34. Gibson, N.; Kuchenbecker, P.; Rasmussen, K.; Hodoroaba, V.-D.; Rauscher, H. Volume-specific surface area by gas adsorption analysis with the BET method. In Characterization of Nanoparticles; Elsevier: Amsterdam, The Netherlands, 2020; pp. 265–294. [Google Scholar]
  35. Guerra, H.B.; Yuan, Q.; Kim, Y. Filter media washing prior to installation in stormwater treatment facilities. Desalination Water Treat. 2018, 109, 64–71. [Google Scholar] [CrossRef]
  36. Reddy, K.R.; Xie, T.; Dastgheibi, S. Evaluation of Biochar as a Potential Filter Media for the Removal of Mixed Contaminants from Urban Storm Water Runoff. J. Environ. Eng. 2014, 140, 04014043. [Google Scholar] [CrossRef]
  37. Technical Specifications for Wastewater Monitoring; China Standard Press: Beijing, China, 2002.
  38. Guerra, H.B.; Kim, Y. An Investigation into the Release of Chemical Oxygen Demand in Organic Filter Media. J. Wetl. Res. 2020, 22, 171–177. [Google Scholar] [CrossRef]
  39. Zhang, Y.; Cao, C.; Ren, L.; Tian, S.; Li, N.; An, S.; Leng, X. Research on Pollutants Removal Effect of Different Combined Substrate under Different Hydraulic Retention Time in Vertical Flow Constructed Wetlands. Ecol. Environ. Sci. 2016, 25, 292–299. [Google Scholar] [CrossRef]
  40. Zhao, L.; Fu, G.; Tang, J.; Wu, J.; Pang, W.; Guo, Z. Efficient nitrogen removal of mangrove constructed wetlands: Enhancing heterotrophic nitrification-aerobic denitrification microflora through quorum sensing. Chem. Eng. J. 2022, 430, 133048. [Google Scholar] [CrossRef]
  41. Vymazal, J. Removal of Nutrients in Various Types of Constructed Wetlands. Sci. Total Environ. 2007, 380, 48–65. [Google Scholar] [CrossRef]
  42. Mohammed, S.; Shanshool, H. Phosphorus Removal from Water and Waste Water by Chemical Precipitation Using Alum and Calcium Chloride. Iraqi J. Chem. Pet. Eng. 2009, 10, 35–42. [Google Scholar] [CrossRef]
  43. Azreen, I.; Lija, Y.; Zahrim, A.Y. Ammonia nitrogen removal from aqueous solution by local agricultural wastes. IOP Conf. Ser. Mater. Sci. Eng. 2017, 206, 012077. [Google Scholar] [CrossRef]
  44. Ho, K.F.; Lee, S.; Louie, P.; Zou, S. Seasonal variation of carbonyl compound concentrations in urban area of Hong Kong. Atmos. Environ. 2002, 36, 1259–1265. [Google Scholar] [CrossRef]
  45. Chen, D.; Wang, H.Y.; Ji, B.; Yang, K.; Wei, L.; Jiang, Y. A high-throughput sequencing study of bacterial communities in an autohydrogenotrophic denitrifying bio-ceramsite reactor. Process Biochem. 2015, 50, 1904–1910. [Google Scholar] [CrossRef]
  46. Wei, X.L.; Zhang, Y.F.; Ma, B.; Li, D.Q.; Chen, W.W.; Cheng, H.W.; Wang, L.; Tao, Y.Q.; Lu, L.; Li, M.Y.; et al. An investigation of hollow NiCrAl metal fiber porous material for high-temperature sealing. J. Alloys Compd. 2023, 947, 169493. [Google Scholar] [CrossRef]
  47. Jiang, C.; Jia, L.Y.; Zhang, B.; He, Y.L.; Kirumba, G. Comparison of quartz sand, anthracite, shale and biological ceramsite for adsorptive removal of phosphorus from aqueous solution. J. Environ. Sci. 2014, 26, 466–477. [Google Scholar] [CrossRef]
  48. Agyei, N.M.; Strydom, C.A.; Potgieter, J.H. The removal of phosphate ions from aqueous solution by fly ash, slag, ordinary Portland cement and related blends. Cem. Concr. Res. 2002, 32, 1889–1897. [Google Scholar] [CrossRef]
  49. Zhang, M.P.; Wang, Z.J.; Huang, J.C.; Sun, S.S.; Cui, X.J.; Zhou, W.L.; He, S.B. Salinity-driven nitrogen removal and its quantitative molecular mechanisms in artificial tidal wetlands. Water Res. 2021, 202, 117446. [Google Scholar] [CrossRef] [PubMed]
  50. Rani, A.; Chauhan, M.; Kumar Sharma, P.; Kumari, M.; Mitra, D.; Joshi, S. Microbiological dimensions and functions in constructed wetlands: A review. Curr. Res. Microb. Sci. 2024, 7, 100311. [Google Scholar] [CrossRef] [PubMed]
  51. Bååth, E.; Anderson, T.H. Comparison of soil fungal/bacterial ratios in a pH gradient using physiological and PLFA-based techniques. Soil Biol. Biochem. 2003, 35, 955–963. [Google Scholar] [CrossRef]
  52. Bi, J.; Zhang, L.R.; He, Y.P. Metabolomics and microbiome provide new insights into mechanisms of the variations between the larva and adult stages of the Model Beetle Tribolium castaneum (Herbst). J. ASIA-Pac. Entomol. 2024, 27, 102241. [Google Scholar] [CrossRef]
  53. Huang, L.J.; Tao, S.K.; Zhu, Y.; Pan, Y.G.; Zhang, Z.K.; Yu, Z.Q.; Chen, Y.Z. Regulation of Embden-Meyerhof-Parnas (EMP) Pathway and Tricarboxylic Acid (TCA) Cycle Concerning Aberrant Chilling Injury Behavior in Postharvest Papaya (Carica papaya L.). Int. J. Mol. Sci. 2023, 24, 13898. [Google Scholar] [CrossRef] [PubMed]
  54. Mateus, D.M.R.; Pinho, H.J.O. Evaluation of solid waste stratified mixtures as constructed wetland fillers under different operation modes. J. Clean. Prod. 2020, 253, 119986. [Google Scholar] [CrossRef]
  55. Wang, H.J.; Li, Y.Y.; Zhang, S.Q.; Li, D.; Liu, X.C.; Wang, W.J.; Liu, L.; Wang, Y.L.; Kang, L. Effect of influent feeding pattern on municipal tailwater treatment during a sulfur-based denitrification constructed wetland. Bioresour. Technol. 2020, 315, 123807. [Google Scholar] [CrossRef] [PubMed]
Figure 1. Experimental device: (a) schematic layout; (b) real image.
Water 17 02969 g001
Figure 2. Pollutant removal efficiency analysis of diverse filter media combinations under different pollution and hydraulic loads.
Water 17 02969 g002
Figure 3. Incremental surface area vs. pore width.
Water 17 02969 g003
Figure 4. SEM scanning result (5 K×) of three filter media: (a) bio-ceramsite; (b) volcanic rock; (c) quartz sand.
Water 17 02969 g004
Figure 5. Phylum level microbial community distribution: (a) Condition 3; (b) Condition 5; (c) Condition 7.
Water 17 02969 g005
Figure 6. Genus-level microbial cluster heat map in Condition 3.
Water 17 02969 g006
Figure 7. PCoA analysis based on Unweighted Unifrac distance in Condition 3.
Water 17 02969 g007
Figure 8. Tax4Fun abundance cluster heat map in Condition 3.
Water 17 02969 g008
Table 1. Main parameters of quartz sand, volcanic rock, and bio-ceramsite.
ComponentsVoidageBulk Density (g/cm3)
quartz sand98.5% SiO2, 0.6% A12O3
0.4% Fe2O3
0.371.5
volcanic rock43% SiO2, 15% A12O3,
12% Fe2O3, 10% CaO
0.480.8
bio-ceramsite69~88% SiO2, 10~15% A12O3,
1% Fe2O3, 3.5% CaO,
2% MgO, 3.2% K2O + Na2O
0.390.8–1.0
Table 2. Filter media combination of each test column.
Number of the Test ColumnFilter Media Combination
A160 cm quartz sand
A260 cm volcanic rock
A360 cm bio-ceramsite
B130 cm quartz sand + 30 cm volcanic rock
B230 cm quartz sand + 30 cm bio-ceramsite
B330 cm bio-ceramsite + 30 cm volcanic rock
Table 3. Concentration of pollutants in synthetic wastewater.
COD (mg/L)TN (mg/L)TP (mg/L)
Low50 ± 2.515 ± 0.52 ± 0.1
Medium100 ± 530 ± 14 ± 0.2
High200 ± 1060 ± 28 ± 0.4
Table 4. Concentration of added constituents in synthetic wastewater.
Synthetic Constituents
Glucose (mg/L)NH4Cl (mg/L)KH2PO4 (mg/L)
Low46.957.38.8
Medium93.7114.517.6
High187.4229.135.2
Table 5. Nine groups of operating conditions.
Conditions123456789
HRT1 d1 d1 d2 d2 d2 d3 d3 d3 d
PLLowMediumHighLowMediumHighLowMediumHigh
Table 6. BET test results.
Quartz SandVolcanic RockBio-Ceramsite
BET Surface Area (m2/g)0.03300.65101.3816
t-Plot Surface Area (m2/g)0.04020.32210.6118
t-Plot micropore volume (cm3/g)0.0000150.0001340.000253
BJH Desorption average pore
diameter (4 V/A) (nm)
23.53736.911123.0527
Table 7. The α-diversity of different samples.
SampleShannon/Simpson
Condition 3Condition 5Condition 7
A115.570/0.9136.444/0.9796.509/0.976
A124.851/0.8925.836/0.9636.065/0.966
A215.672/0.9426.222/0.9666.439/0.975
A225.834/0.9445.230/0.9005.890/0.954
A314.826/0.9245.255/0.9455.498/0.946
A323.436/0.7913.049/0.7404.136/0.892
B115.266/0.9036.362/0.9735.988/0.953
B124.956/0.8906.095/0.9676.215/0.970
B215.685/0.9425.546/0.9465.000/0.886
B224.156/0.8475.097/0.9434.536/0.912
B316.698/0.9716.330/0.9616.435/0.970
B326.787/0.9806.914/0.9836.449/0.974
Disclaimer/Publisher’s Note: The statements, opinions and data contained in all publications are solely those of the individual author(s) and contributor(s) and not of MDPI and/or the editor(s). MDPI and/or the editor(s) disclaim responsibility for any injury to people or property resulting from any ideas, methods, instructions or products referred to in the content.