Article

Limitation of Phytoplankton Primary Production by Biogenic Elements in the Coastal Waters of the Azov-Black Sea Basin as a Natural Factor in Conditioning the Marine Environment

1
A. O. Kovalevsky Institute of Biology of the Southern Seas Russian Academy of Sciences (IBSS), Sevastopol 299011, Russia
2
Federal State Budgetary Institution of Science «Federal Research Centre the Southern Scientific Centre of the Russian Academy of Sciences» (SSC RAS), Rostov-on-Don 344006, Russia
*
Author to whom correspondence should be addressed.
Water 2025, 17(20), 2968; https://doi.org/10.3390/w17202968
Submission received: 18 August 2025 / Revised: 11 October 2025 / Accepted: 11 October 2025 / Published: 15 October 2025
(This article belongs to the Section Water Quality and Contamination)

Abstract

The study focuses on determining the concentrations of nitrites, nitrates, ammonium, and mineral phosphorus in the waters of the Azov-Black Sea basin. It investigates the limitation of primary phytoplankton production in the region, and evaluates the impact of bifurcation (switching of limiting factors) on the natural conditioning of the marine environment concerning biogenic elements. The research was conducted during 2023–2024 in Streletskaya Bay (Sevastopol), coastal areas of the northeastern Black Sea, and the Sea of Azov. The limiting function was assessed using the Redfield equation. The key findings indicate that the dependencies of the Redfield parameter on phosphate (PO4) concentration and total nitrogen compounds are described by power functions. A rule for natural regulation of phytoplankton communities was established: whenever the concentration of biogenic elements in the aquatic environment deviates from the region-specific stoichiometric ratio, the functioning of photosynthetic systems always acts to restore it. The validity of this rule was confirmed using a mathematical model and was supported by annual observational data on biogenic element concentrations in Streletskaya Bay.

1. Introduction

Large-scale studies in the Azov-Black Sea basin have shown that its ecosystems are adversely impacted by oil pollution, heavy metals, organochlorines, unstable organic compounds, secondary input of long-lived radionuclides into its areas, and hyper-eutrophication from an excess of biogenic elements [1,2,3,4,5]. Although the Sea of Azov and the Black Sea exhibit differences in hydrometeorological and hydrodynamic characteristics, their biogeochemical parameters are largely similar. This is due to water exchange through the straits which functions like a system of communicating vessels.
A significant ecological factor in the region is the hyper-eutrophication of its waters caused by biogenic elements. In the Azov-Black Sea basin, since the 1980s and in the 1990s, the oligotrophic trophic status of the Black Sea shelf with primary production of 64–89 gC·m−2·year−1 shifted to mesotrophic with primary production of 138–190 gC·m−2·year−1 [4,6,7]. Based on satellite and remote sensing data, phytoplankton primary production in the Sea of Azov was estimated to be 250–317 gC·m−2·year−1 [8,9]. Concurrently, areal extent of water “blooming” in the Black Sea increased multifold [1] between 1950 and 1980.
Almost every year, the shallow waters of the Taganrog Bay (Sea of Azov) experienced algal blooms nearly every summer. Between 2003 and 2018, a pronounced response by lower trophic levels to changing environmental conditions was documented, indicating a potential decline in ecosystem resilience [10]. Modern research suggests [11] that the regime of biogenic elements in the Sea of Azov is governed by a complex combination of factors, including riverine and slope runoff, hydrodynamics, and thermal conditions [12].
A study on the transformation of inorganic nutrients in the mixing zone of the Danube River and the northwestern Black Sea, conducted in July 1995 and during the winter–spring transition in 1997, revealed [13] that the winter distribution of inorganic nutrients along the salinity gradient was conservative, with low phytoplankton productivity resulting from insufficient physiologically active radiation (PAR). The increase in phytoplankton uptake of carbon and inorganic nutrients in early spring and summer was related to the hydrodynamics of the mixing between the Danube and the Black Sea waters. Within the 0–10‰ salinity range, an increase in diatom production was observed, which drastically diminished the flux of inorganic nutrients to the coastal zone, and affected their distributional balance across the shelf. These shifts had significant implications for phytoplankton dynamics and species dominance at salinities exceeding 10‰. Diatom growth appears to be limited by phosphorus in spring and by nitrogen in summer. This research revealed the complexity of the mechanisms through which eutrophication spreads beyond the Danube River.
Bacterial utilization of organic matter was investigated during two expeditions to the northwestern Black Sea in the summer of 1995 and during the winter–spring transition (April–May 1997) [14]. Bacterial biomass, enzymatic activity, and production, along with sources of organic carbon for bacteria, were measured at high resolution along salinity gradients in the Danube–Black Sea mixing zone and in adjacent Black Sea waters. Bacterial production peaked within the Danube–Black Sea mixing zone in July 1995. In April 1997, the bacterial carbon demand could only be met by allochthonous organic matter discharged by the Danube. By May 1997, the contribution of autochthonous organic carbon derived from phytoplankton was anticipated to increase, coinciding with a general rise in biological activity. In July 1995, the available direct sources of organic carbon were scarcely sufficient to meet bacterial demand. It is presumed that excess dissolved organic carbon (DOC) accumulated during the winter–spring period subsequently supported the high bacterial carbon demand in summer. Indirect estimates indicated that the delayed utilization of labile dissolved organic matter may be linked to phosphorus (PO4) limitation of bacterial growth.
It has been established [15] that in the Black Sea, the hydrographic front of the Danube was located within the salinity range of 12–14‰, at a distance of approximately 8–14 km from the river mouth, while that of the Chorokh River was observed within salinities of 12–17‰, at a distance of 25–33 km from the coast. The intensity of phosphorus exchange in the suspended matter was more than an order of magnitude higher in the Chorokh estuarine zone compared to that of the Danube. The turnover time of mineral phosphorus ranged from 2.9 to 14.3 h in the Chorokh estuary and from 2.9 to 8.8 days in the Danube estuary. Phosphorus exchange in the biotic component of suspended matter followed first-order reaction kinetics in the Danube estuarine zone, but zero-order kinetics in the Chorokh estuarine zone. For the Chorokh estuary, within the salinity range of 9.3 to 17.9‰, the micro- and nano-fractions (>1.2 μm) of suspended matter were responsible for the majority (>83%) of mineral phosphorus uptake. In contrast, for the Danube estuary, the pico-fraction of suspended matter (<2 μm) contributed 18–42% to mineral phosphorus uptake within the salinity range of 0.3 to 12.3‰, and 61–84% within the range of 12.3 to 17.5‰.
Based on observations conducted in 2020, the concentrations of dissolved inorganic nitrogen (DIN) and dissolved inorganic phosphorus (DIP) were investigated in the estuary of the Vodopadnaya River, which discharges into the Black Sea near Yalta [16]. The study found that the input of these nutrients via river discharge can shift the limiting factor for primary phytoplankton production from nitrogen to phosphorus. River runoff was identified as a key factor influencing the degree of eutrophication in the marine waters of Yalta’s recreational zone. Model estimates indicate that the annual nutrient load from the Vodopadnaya River could lead to summer hyper-eutrophication. Under phosphorus-limited conditions, this affected area could cover 150 × 103 m2 of the urban beach area, expanding to 310 × 103 m2 under nitrogen-limited conditions.
Studies conducted between 2017 and 2019 highlighted the significance of atmospheric deposition and slope runoff as pathways for nutrient input into the coastal waters of Cape Martyan [17]. Throughout the year, nutrient concentrations generally remained below the threshold for hyper-eutrophication. Phytoplankton production was subject to potential limitation by either nitrogen or phosphorus. Under phosphorus-limiting conditions, the relationship between changes in primary production (PP) and dissolved inorganic phosphate (PO43−) concentration was strong, with a coefficient of determination of R2 = 0.960. An increase in primary production was associated with a decrease in the Redfield ratio. Summer and autumn maxima in atmospheric precipitation were found to potentially trigger bifurcation processes, leading to shifts in the nutrient limitation regime of primary production.
Between 2012 and 2018, studies of primary (Phytoplankton) and secondary (Zooplankton) production were conducted in the coastal waters of Crimea using the radiocarbon (14C) method [15,16,18]. In the waters off Cape Martyan, the Vodopadnaya River estuary, and Sevastopol Bay, phytoplankton primary production (PP) was low in winter and was not limited by nutrient availability. In spring, PP increased but remained below the eutrophication threshold of 100 mgC·m−3·day−1, with biosynthesis processes limited primarily by dissolved inorganic nitrogen (DIN). During summer, PP off Cape Martyan reached the eutrophication threshold (112.8 mgC·m−3·day−1) under nitrogen-limiting conditions. In the Vodopadnaya River estuary, summer PP was twice the eutrophication threshold (201.0 mgC·m−3·day−1), also under nitrogen limitation. In contrast, within Sevastopol Bay, summer PP exceeded the sanitary standard for eutrophication by nearly an order of magnitude (931.3 mgC·m−3·day−1), a condition associated with phosphorus limitation.
The presented findings indicate that the intensity of eutrophication in the coastal zones of the Azov-Black Sea basin is influenced by a combination of meteorological, hydrodynamic, microbiological, and biogeochemical factors. Nevertheless, the primary factor is the limitation of phytoplankton primary production by nutrients.
Biogens are chemical elements that can limit the primary production processes in ecosystems. Biogenic inorganic substances primarily include organogenic elements (N, P, Si, S). The growth of hydrobionts can also be limited by a lack of microelements (Zn, Mn, Co, Mo, Fe) in the environment [19,20]. The ratio between the concentrations of limiting elements is characterized by the stoichiometric ratio, the use of which allows for the determination of the intensity of production–destruction processes in the ocean [21]. According to Cooper’s and Redfield’s estimates [22,23,24] for phytoplankton and zooplankton communities, the stoichiometric ratio of N:P can vary widely from 1 to 60. Disturbances in the stability of their values are usually associated with climatic or anthropogenic influences: aerosol precipitation, fluxes of biogenic elements with river runoff, technogenic and agricultural activities on the coasts, and precipitation and slope runoff. In the Azov-Black Sea basin, the N:P ratio, determined by the influence of the main sources of water eutrophication, is as follows: for the Don River—5.0–6.6, for the Kuban River—9.5, for atmospheric precipitation—31.0, and for the Black Sea—13.0 [25].
It is known from the literature [24,26] that the main biogenic elements limiting primary production are nitrogen and phosphorus. For cell protoplasm, the normal ratio of the weights of the main structural chemical elements is
1P:7N:40C
According to the literature data [27], the ratio between nitrogen and phosphorus in photosynthesis and respiration is described by the equation
106 C O 2 + 16 N O 3 + H P O 4 2 + 122 H 2 O + 18 H + C 106 H 263 O 110 N 16 P + 138 O 2
from which it follows that for each newly formed piece of organic matter with a mass of 1000 g, 80 g of carbon, 2 g of phosphorus, and 14 g of nitrogen are required. Therefore, the limiting factor for phytoplankton primary production is the biogenic element whose proportion in the aquatic environment is less than the stoichiometric ratio (1) N:P = 16:1 by molar concentration or 7:1 by weight concentration.
It has been established that when the stoichiometric ratio deviates from the equilibrium level, bioproductive systems switch to bifurcation modes of limiting primary production by biogenic elements that are at a minimum [25]. Bifurcation systems are those that have the property of transitioning to different stable states when their parameters change. This is especially true for enzymatic and bioproductive systems [28,29], in which feedback for homeostasis realization is formed through metabolic and trophic reactions [30].
It has been proposed that fast-growing phytoplankton exhibits lower cellular N:P ratios and reduced stoichiometric flexibility, with growth rates approaching their maximum at an N:P supply ratio close to the Redfield ratio of 16:1 [31]. However, recent modeling and empirical analyses have challenged this paradigm. These studies indicate that the optimal N:P ratio for growth increases with the availability of nutrients, specifically under conditions of phosphorus (P) limitation. Few other consistent differences were observed, with the exception that cyanobacteria generally exhibited a higher optimal N:P ratio than diatoms.
Phytoplankton elemental composition is a critical factor governing primary production and nutrient cycling. Increased anthropogenic nutrient loading into freshwater and marine ecosystems alters phytoplankton community structure and its stoichiometry [32,33].
Analysis of the longest available time series (1991–2011) on nutrient ratios (N:P, Si:N, Si:P) in the open Mediterranean Sea revealed anomalous values compared to other oceanic regions [34]. The molar nutrient ratios exhibited seasonal variability. The N:P ratio increased under stratified conditions, presumably due to a strong influence from external nutrient sources. Over the 1991–2011 period, significant decadal trends were identified in deep waters: nitrate concentrations increased at a rate of +0.23% per year, while phosphate concentrations decreased at −0.62% per year, respectively. These changes resulted in increasing tendencies in the N:P (+1.14% per year) and Si:P (+0.85% per year) ratios.
Analysis of the phytoplankton community in the Bay of Brest, France, from February to July 2011, indicated a consistent state of phosphorus (P) limitation from March through July [35]. Nitrogen (N) limitation was observed transiently for only one week in early March. Subsequent biological analyses confirmed that primary production was primarily limited by phosphorus. This finding suggests that P limitation in North Atlantic coastal ecosystems like the Bay of Brest is not readily predictable based on nutrient loading alone.
Analysis of the literature as a whole showed [36,37] that the N:P ratio decreases during the growing season. However, the biotic mechanism behind this phenomenon is still unknown.
The aim of this study was to investigate the bifurcation characteristics of the phytoplankton production system depending on changes in the concentration of biogenic elements in the coastal areas of the Azov-Black Sea basin. The following tasks were set.
The first was to determine the current content of nitrites (NO2), nitrates (NO3), ammonium (NH4), and mineral phosphorus in the waters of the Azov-Black Sea basin.
The second was to estimate by using the Redfield parameter [24] the degree of limitation of phytoplankton primary production in the region by mineral phosphorus and nitrogen compounds.
To last was determine the peculiarities of bifurcations in the primary water production system, and its influence on marine environment conditioning in terms of biogenic elements.

2. Materials and Methods

The research was conducted in 2023–2024 in seven areas of the Black Sea and the Sea of Azov (Figure 1). Area (I) was located in Streletskaya Bay, Sevastopol, and the others were in the coastal waters of the Azov-Black Sea basin, widely used for recreational purposes. In Streletskaya Bay, observations were carried out using the mode of monthly monitoring from small vessels. Water samples were collected in darkened 1.0–1.5 L containers at a depth of 0.5–1.0 m, with the water temperature measured at a depth of 0.3 m using a Lourence Hook-5 echo sounder with a GPS navigator. Tidal and seiche phenomena not exceeding 0.2–0.4 m were recorded, and meteorological conditions and atmospheric precipitation were monitored. In the Black Sea and the Sea of Azov, samples were taken at a depth of 0.5–1 m, with the salinity and pH of the water being recorded.
The hydrochemical parameters of the samples were determined in three replicates in unfiltered water in a certified hydrochemical laboratory, following the relevant working methods [38,39]. The samples were preserved for subsequent processing by rapid freezing. The content of dissolved inorganic phosphorus in the samples was determined colorimetrically using a modified Morphy and Riley method [40] by measuring the optical density in 50 mm cuvettes at a wavelength of 885 nm. Nitrite nitrogen was determined using the Bendschneider and Robinson method at a wavelength of 543 nm and with a 50 mm cuvette. Nitrate nitrogen was measured at a wavelength of 543 nm in 10 and 50 mm cuvettes, and ammonium nitrogen was measured using the Grasshoff–Johansen method at a wavelength of 630 nm in 30 mm cuvettes. Calibration solutions were prepared when reagents were changed or at least once a year. Optical density was measured using a KFK-3-01 ZOMZ photometer. The results of determining the concentrations of biogenic elements in water had average relative errors: nitrate ions—in the range of 5–500 μg·L−1, error 2.7–7.39%; nitrite ions—in the range of 0.5–1000 μg·L−1, error 1.53–18.02%; ammonium nitrogen—in the range of 15–1500 μg·L−1, error 1.69–11.4%; and phosphate ions—in the range of 5–100 μg·L−1, error—4.6%. To determine the limiting biogenic factor in water under conditions where different chemical forms of mineral nitrogen are present—nitrites (NO2), nitrates (NO3) and ammonium (NH4)—Redfield’s stoichiometric ratio (Rat) [24] was used, which, when expressed in terms of its parameter dimensions in μg·L−1, takes the following form:
R a t ( N / P ) = 1.53 ( 1.35 N O 2 + N O 3 + 3.44 N H 4 ) / P O 4
In accordance with (3), when Rat > 16 in the study water area, limitation by phosphorus is observed, while at Rat < 16, limitation by nitrogen is recorded.
The approximation of the observation results by power functions was performed on a logarithmic scale along the ordinate axes. Statistical processing of data with the determination of the standard deviation (σ) and the coefficient of determination (R2) was carried out applying methods for radioecologists and chemoecologists [41]. The significance of the regression coefficients and the linearity of the dependencies were determined in accordance with Student’s criterion.

3. Results

The materials of the field studies are presented in Table 1.
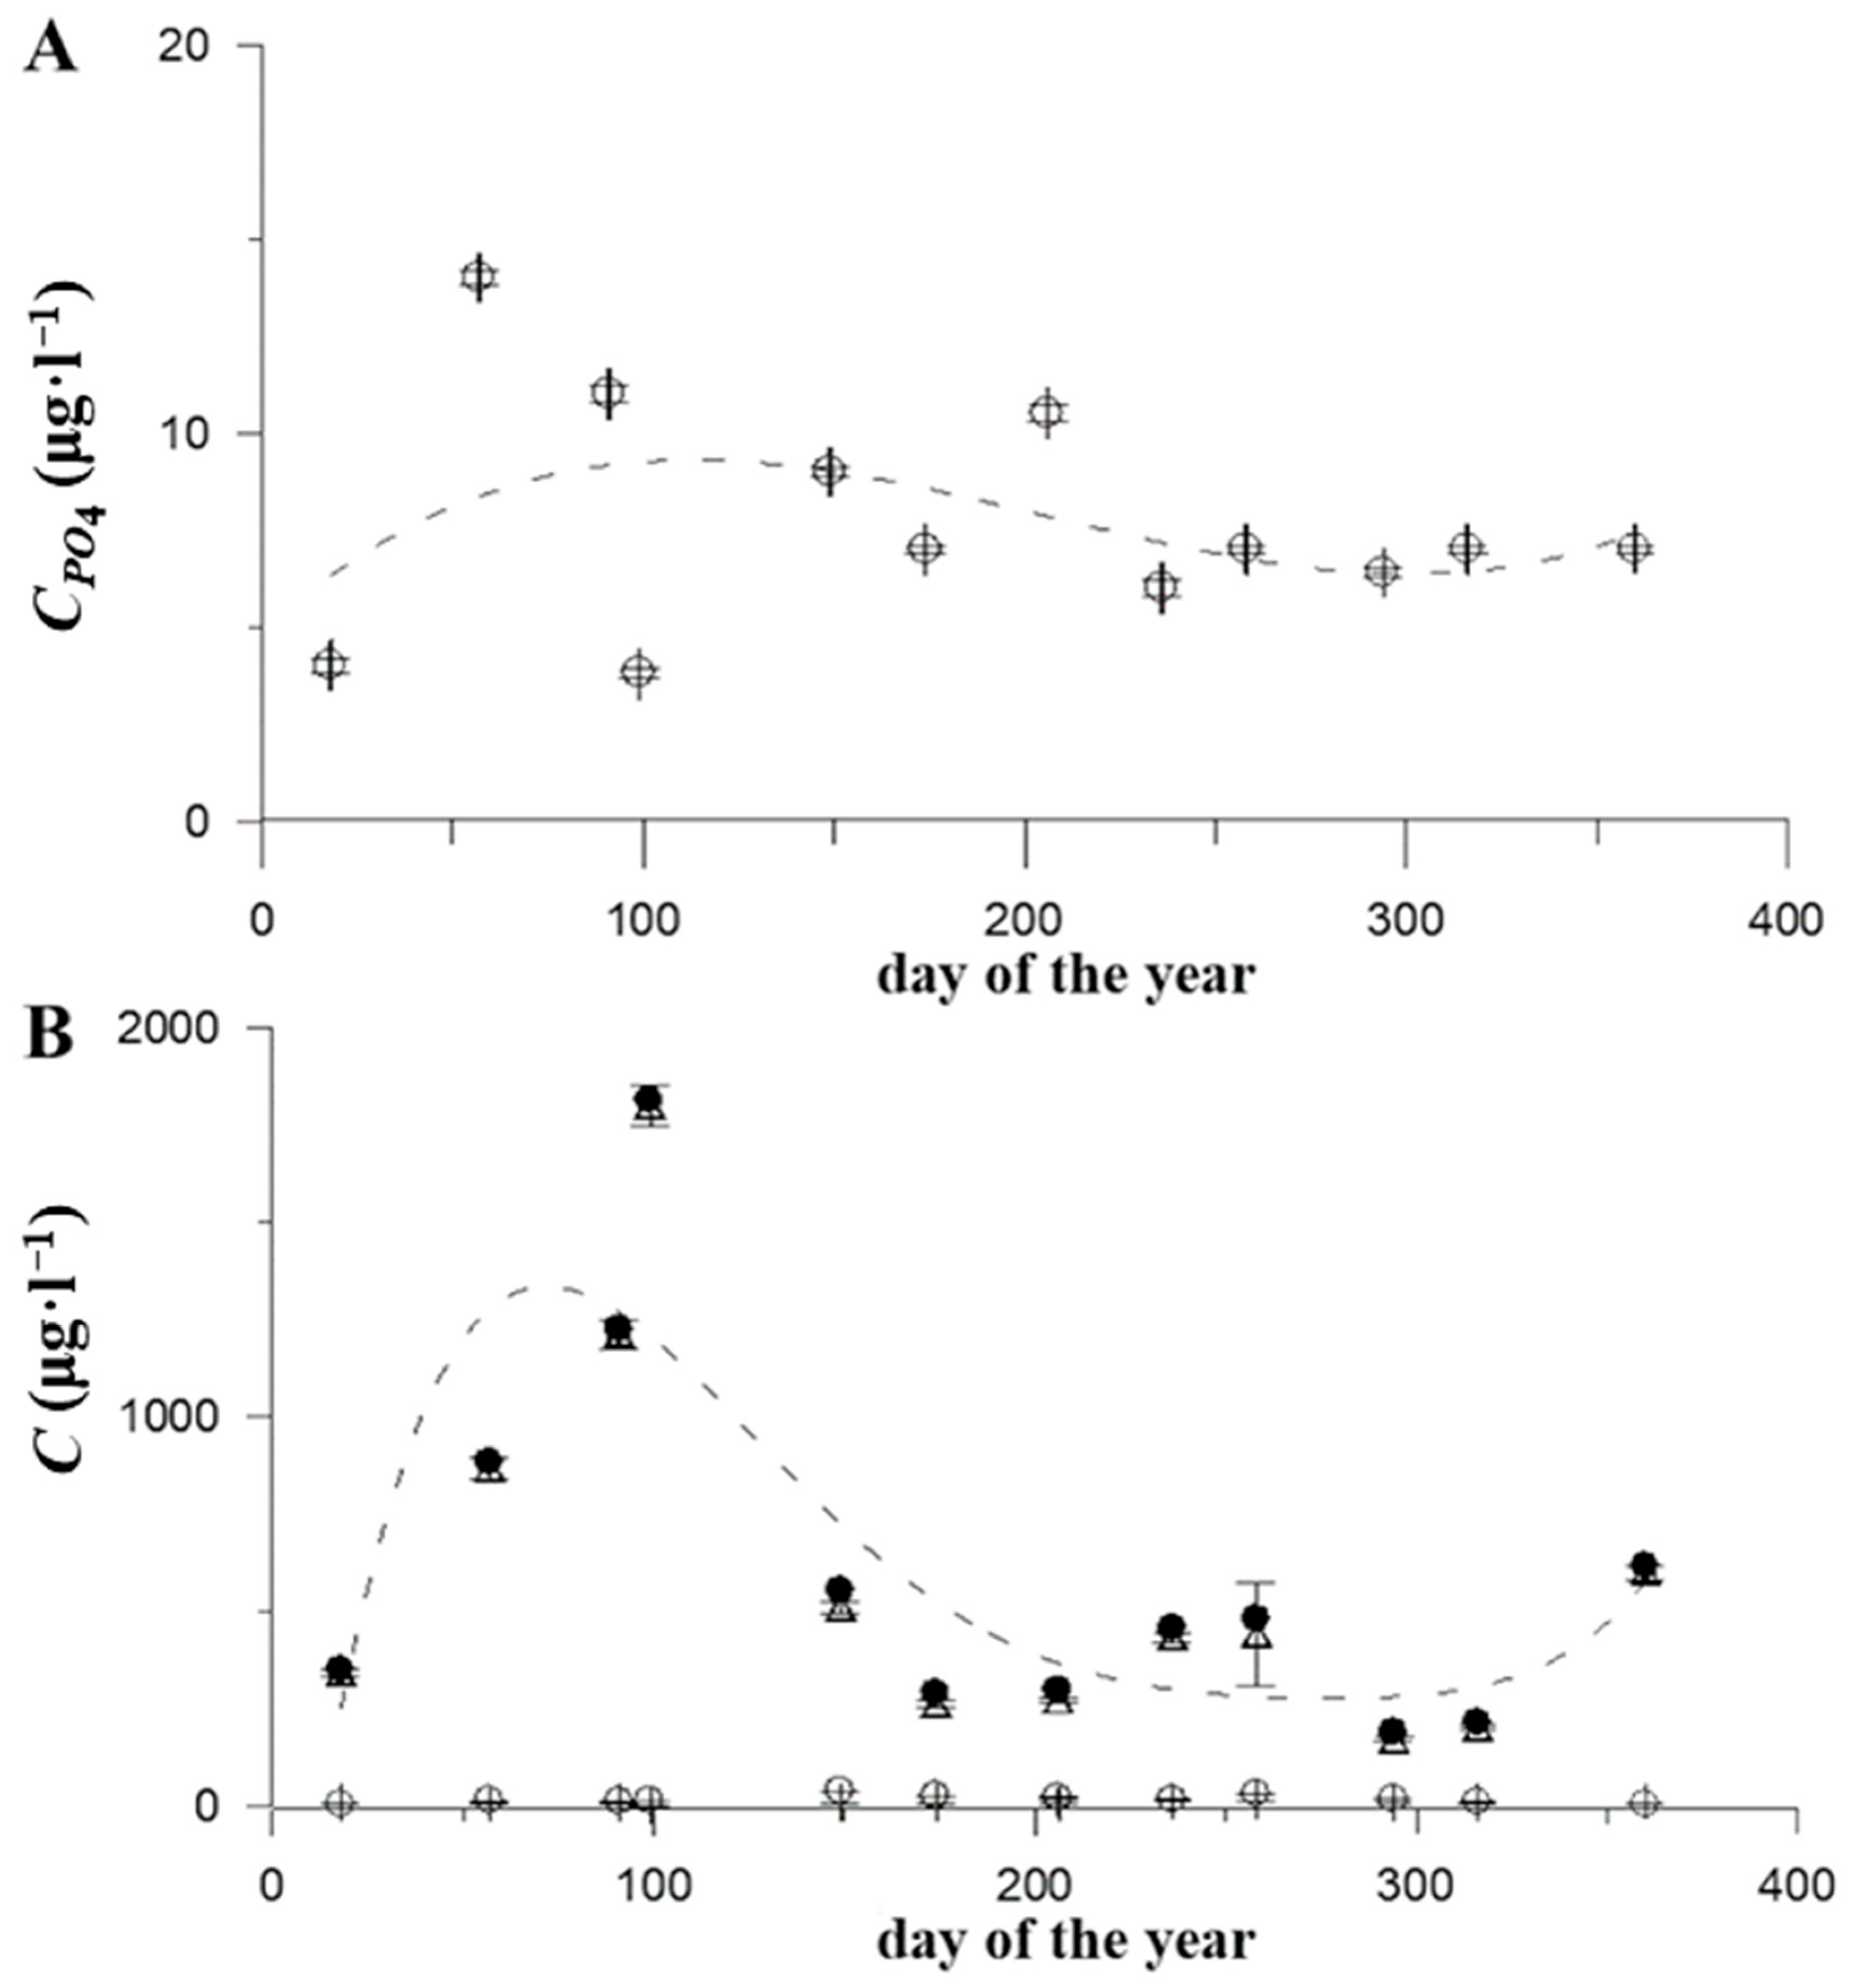
According to observations in the waters of Streletskaya Bay (Sevastopol) (Table 1; region 1 in Figure 1), it was established that during 2023–2024, the surface water temperature ranged from 8.8 to 25.6 °C, the NH4 concentration varied from 2.0 to 36.7 μg·L−1, NO2 was 0.9–9.8 μg·L−1, NO3 was 170.0–1800.0 μg·L−1, and the sum of nitrogen compounds (∑Ni) was 188.0–1813.0 μg·L−1, PO4 3.8–14.0 μg·L−1. Trends in biogenic element concentration in the waters of Streletskaya Bay are illustrated in Figure 2.
The analysis showed (Figure 2) that the maximum concentrations of biogenic elements in the water of Streletskaya were observed in spring, and subsequently, their concentrations decreased until the end of the vegetation season. The main factor contributing to water eutrophication was the influx of nitrates in the winter–spring period. An analysis of the trend with the Redfield parameter (Rat) showed that primary production was limited by mineral phosphorus throughout the entire year (see column 14 in Table 1).
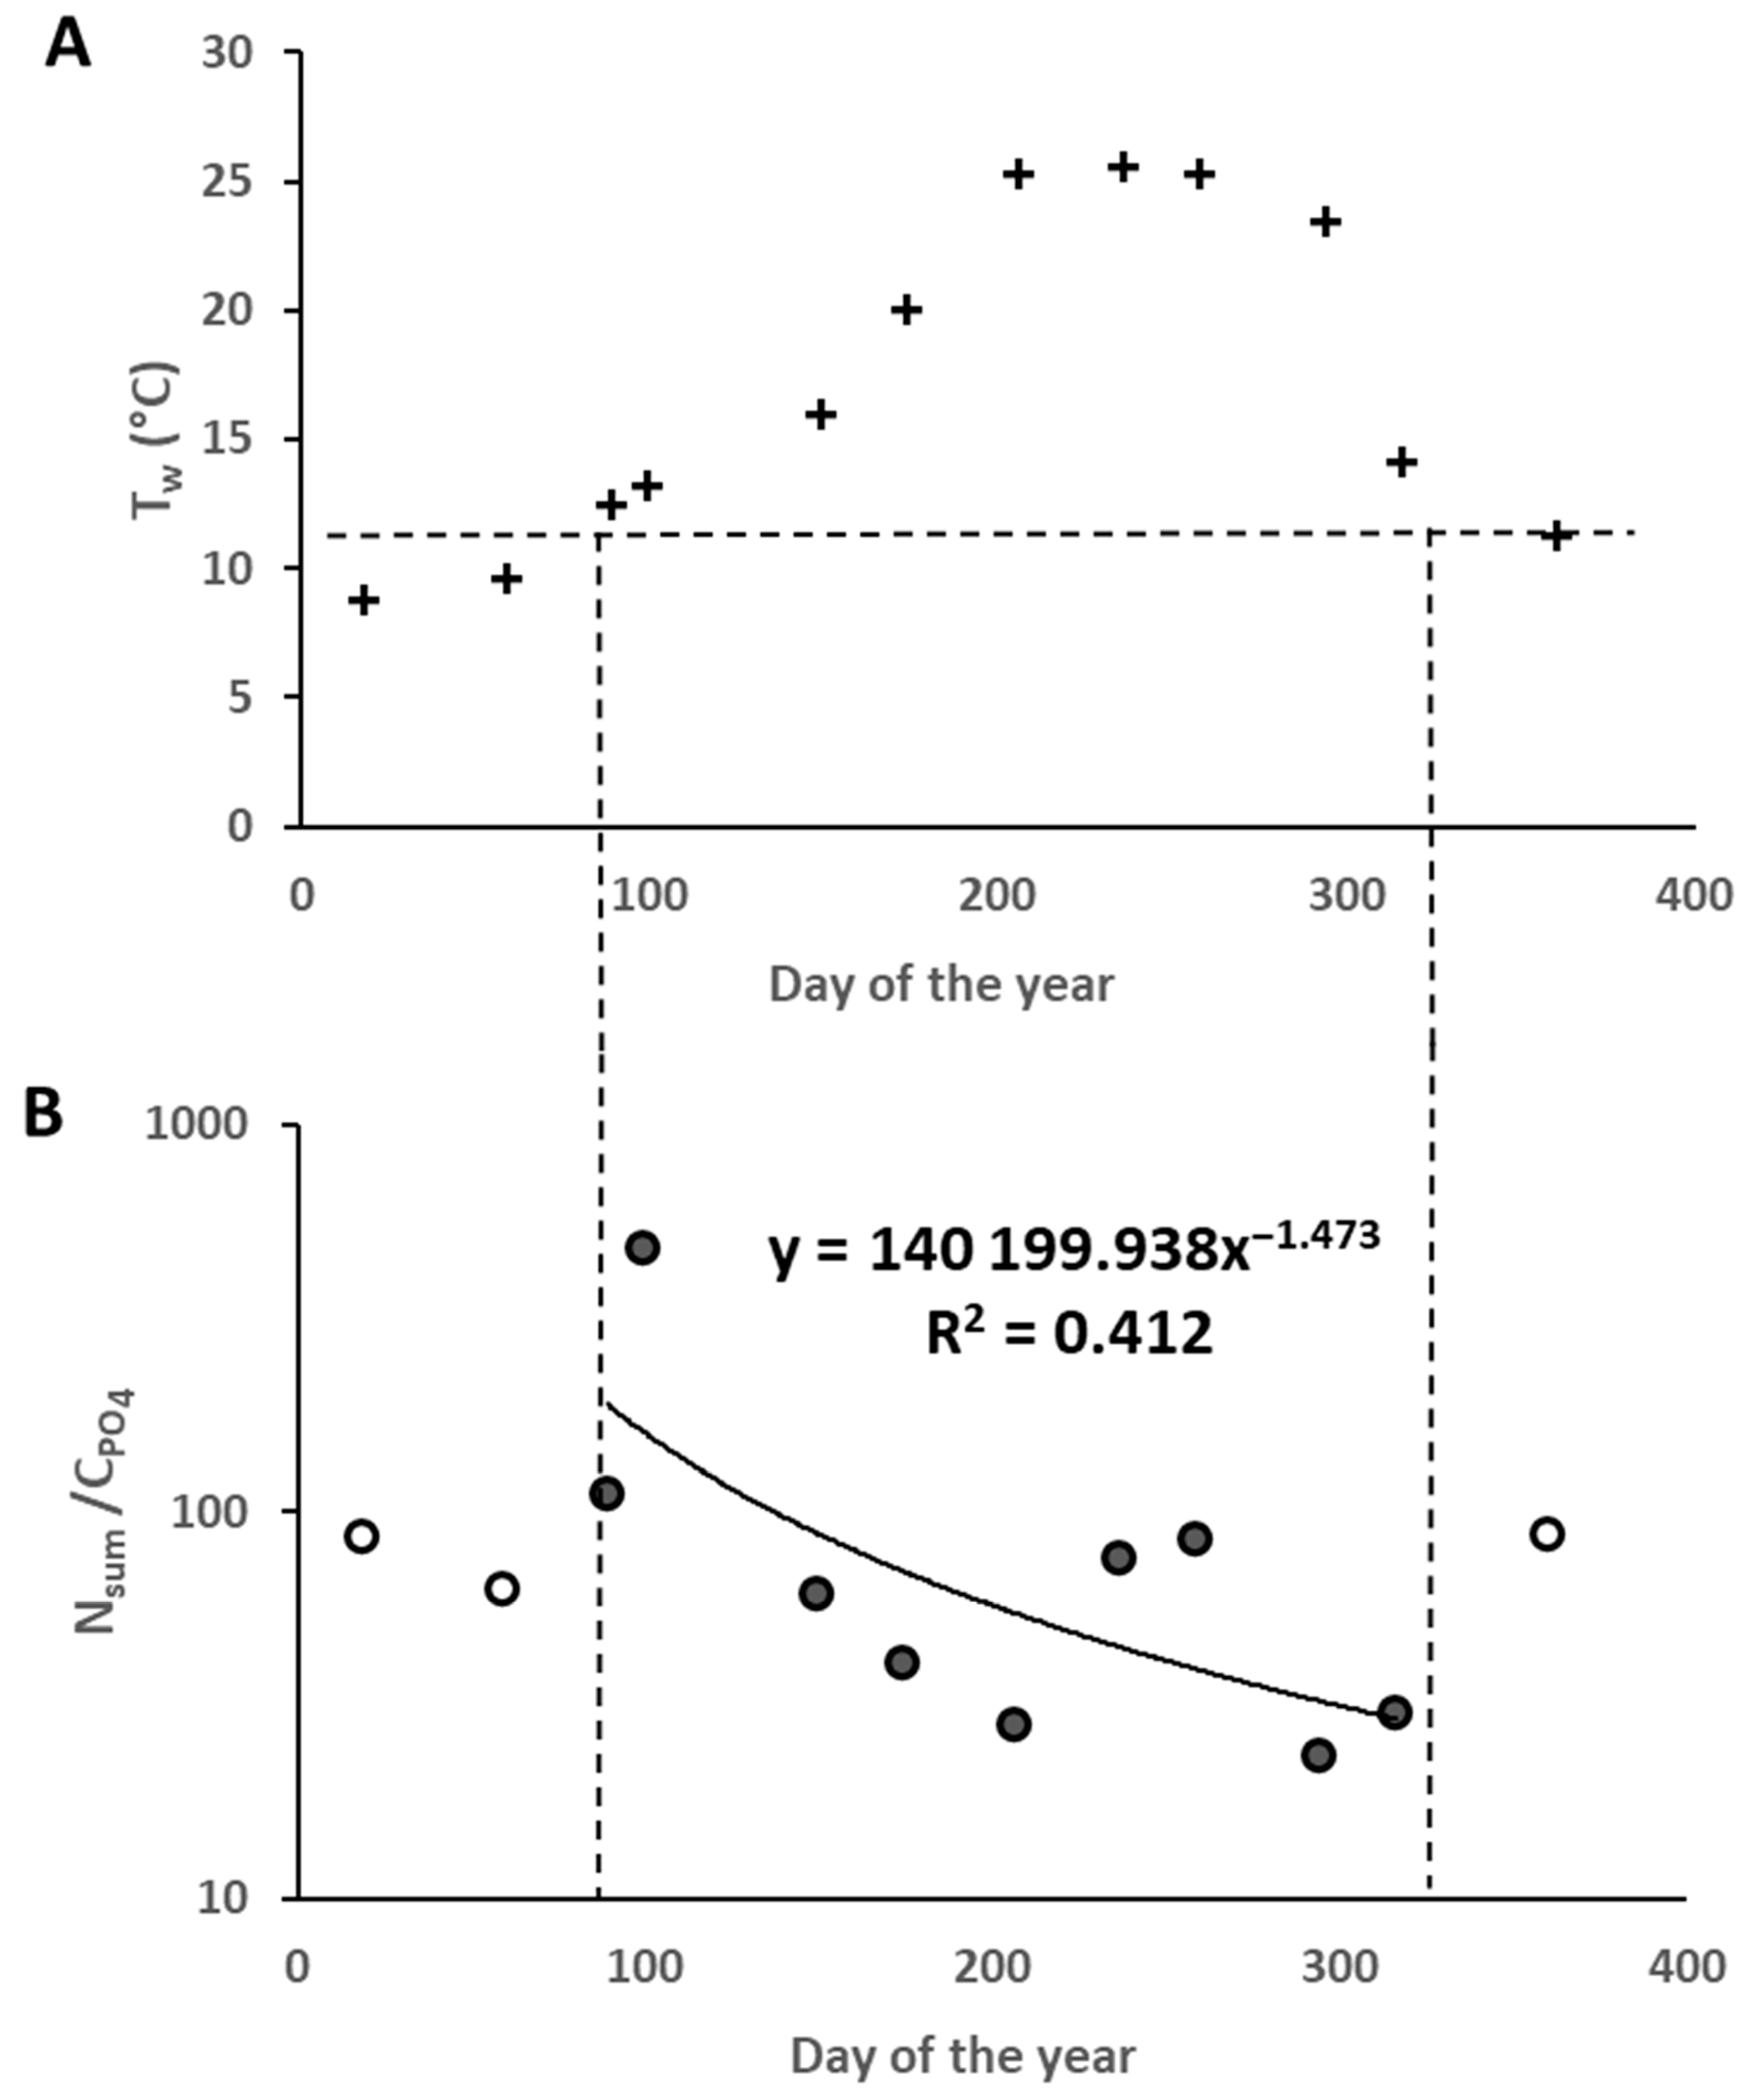
The annual trend of temperature change and the trend of change for the ratio of the total concentration of nitrogen compounds to the specific content of mineral phosphorus in the water of Streletskaya Bay are shown in Figure 3. The horizontal dotted line in Figure 3A shows the minimum temperature level at which primary production processes begin in the marine waters of Sevastopol [18].
The data presented in Figure 3 show that the ratio of specific nitrogen content to phosphorus concentration in water decreased with a confidence level characterized by a discrimination coefficient of R2 = 0.412 during the growing season. The calculated value of the Student’s t-test was 2.093, and the critical value of p = 0.1 was 1.863. This indicates that the reliability of the pattern presented in Figure 3B was at least 90%.
The results obtained in 2024 (see Table 1) showed that in terms of salinity and pH, the coastal waters belonged to the desalinated Black Sea waters or to the waters of the Sea of Azov, which were salinated through the Kerch Strait. The concentration of NH4 in the study areas varied between 2.5 and 48.3 μg·L−1, NO2: 0.4–11.8 μg·L−1, NO3: 4.8–500.0 μg·L−1, total nitrogen compounds (∑Ni): 10.4–512.0 μg·L−1, PO4: 4.5–125.8 μg·L−1. Nitrates in the estuary of the Don River (500.0 μg·L−1) and the water area of the Glazovsky settlement in Crimea (331.0 μg·L−1) contributed most to water eutrophication. It was established (column 14 of Table 1) that in the coastal waters of the Azov-Black Sea basin, primary production can be limited by both mineral phosphorus and nitrogen compounds, with nitrogen limitation prevailing.
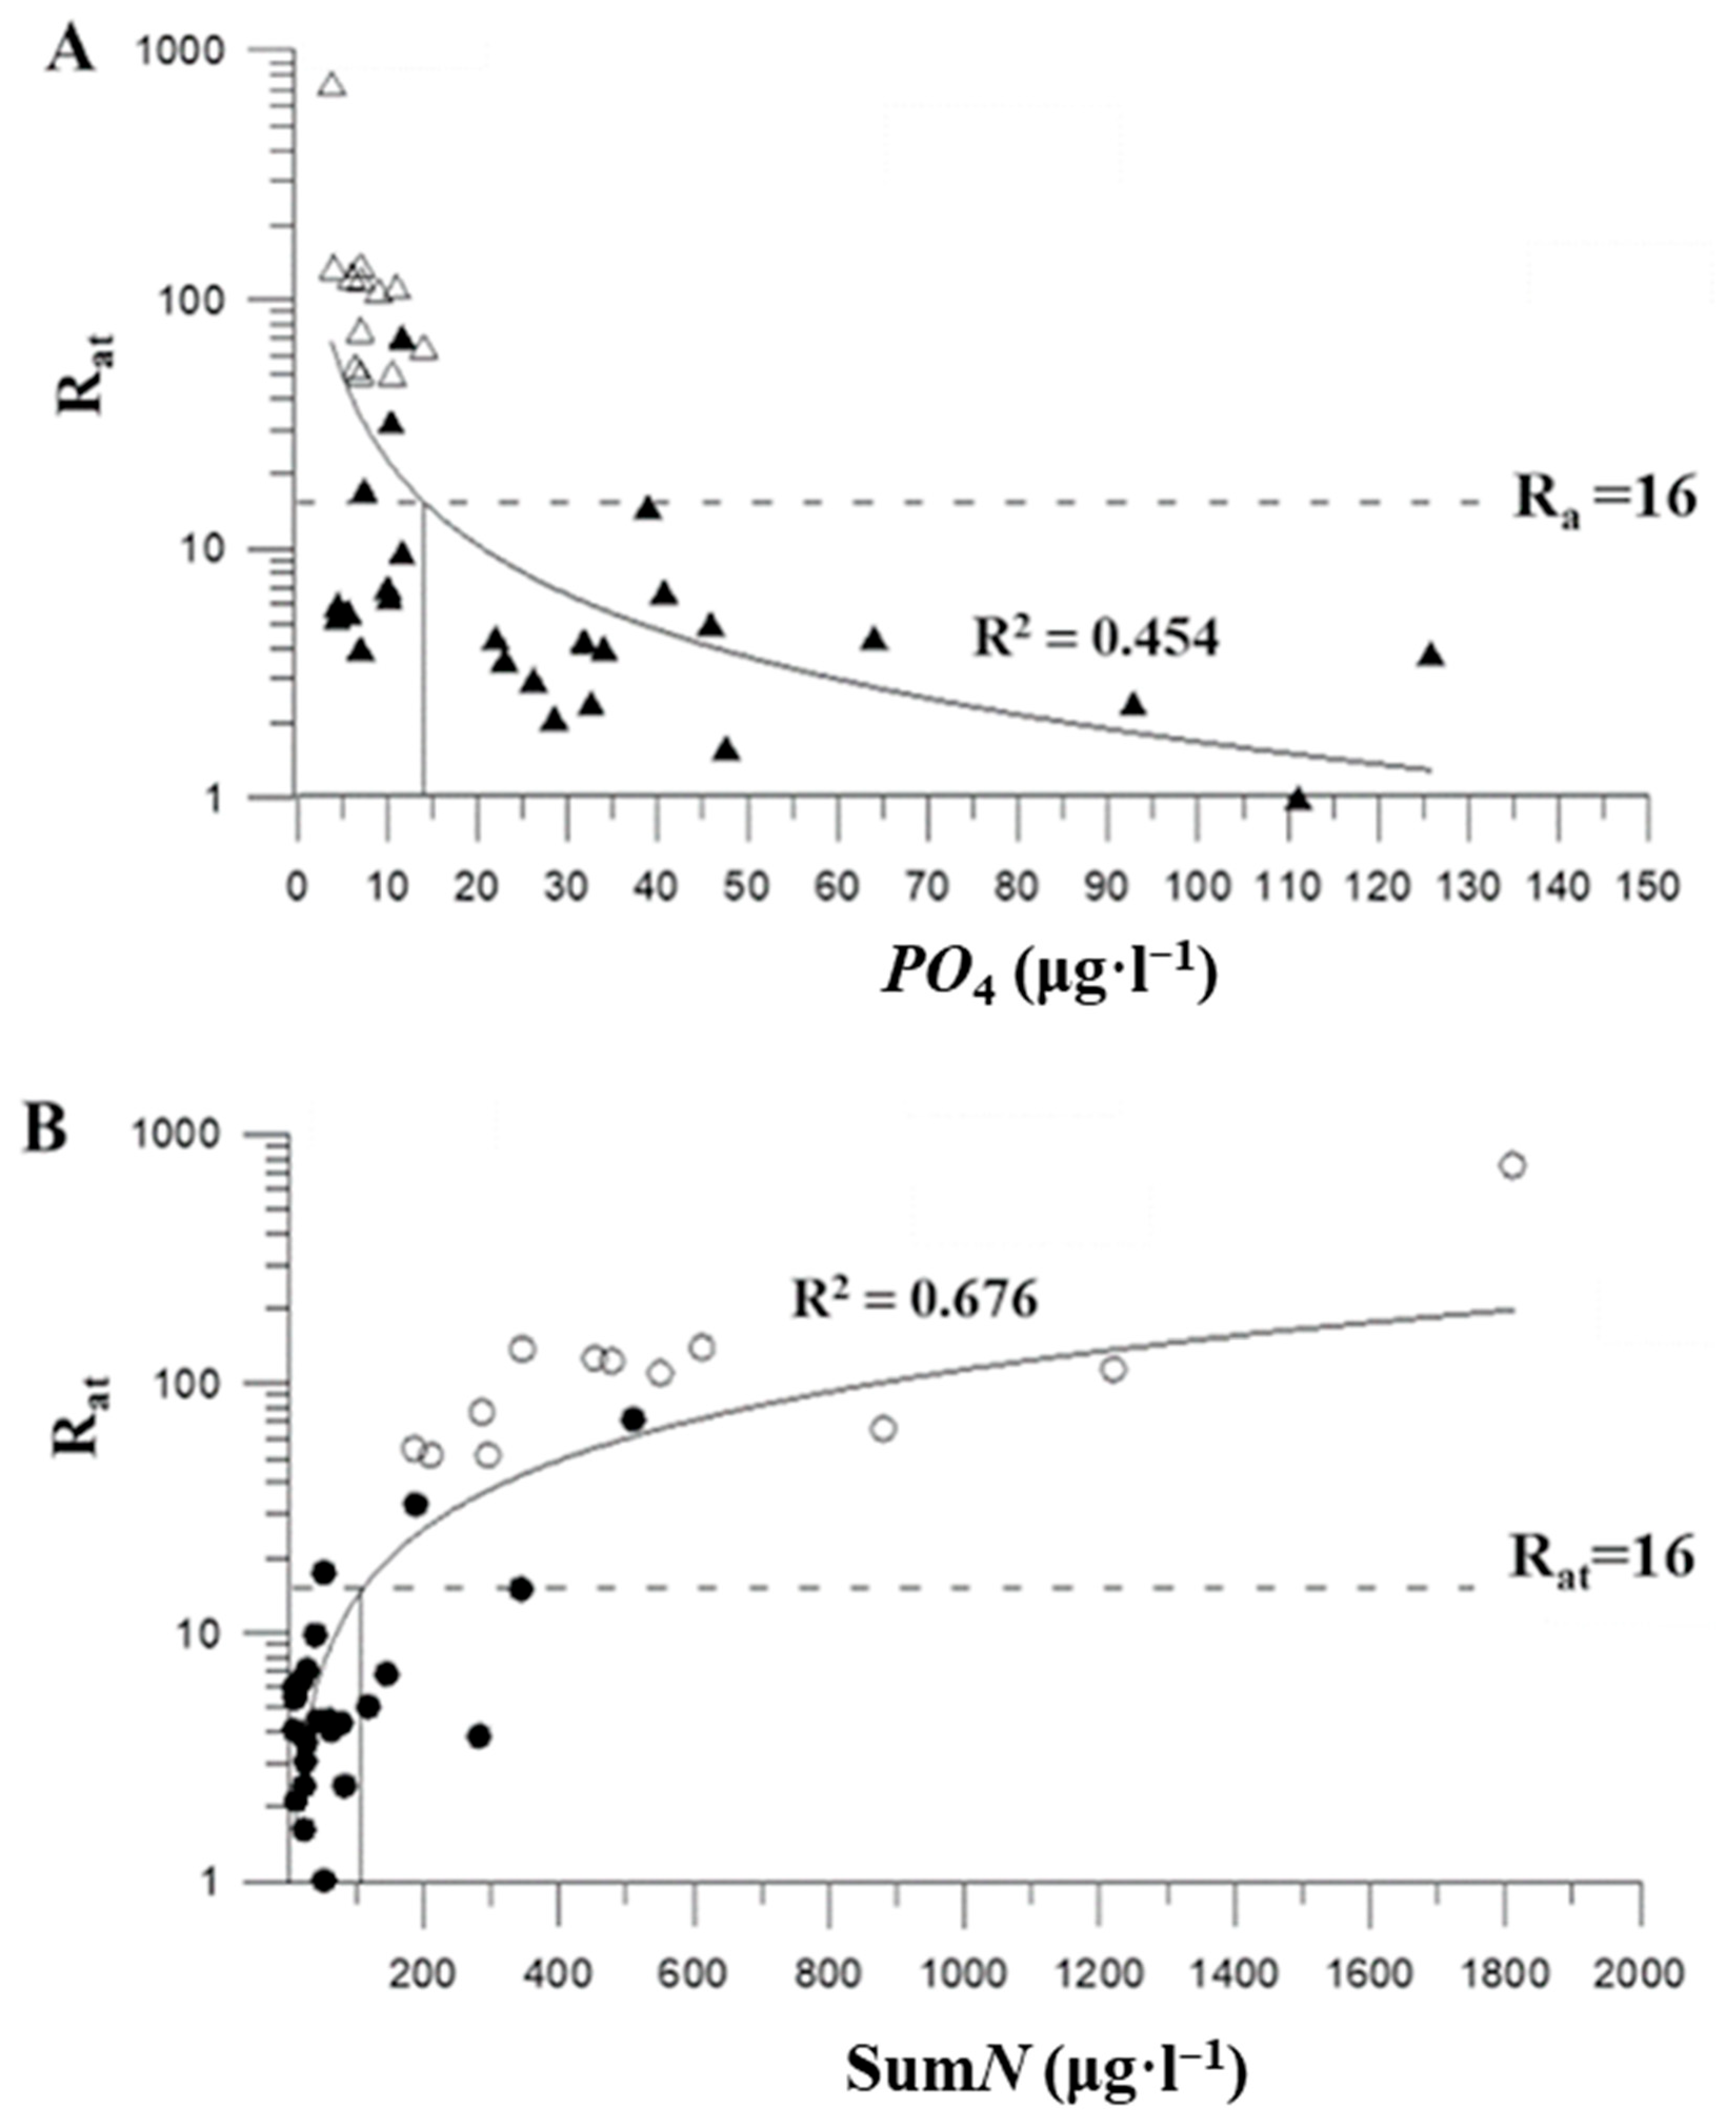
The dependence of the Redfield parameter on the concentration of biogenic elements in the waters of Streletskaya Bay and the study areas of the Azov-Black Sea basin is shown in Figure 4.
Figure 4 shows that when approximating the observation results with a power function, taking into account their variability (R2 = 0.454 for mineral phosphorus and R2 = 0.676 for the sum of nitrogen compounds), the system for limiting phytoplankton primary production for each of the biogenic elements for the waters of the entire Azov-Black Sea basin shows a uniform trend. Statistical analysis of the relationship between the concentration of mineral phosphorus in water and the Redfield parameter for the entire sample of n = 37 measurements using the Student’s t-test showed that at R2 = 0.454, its observed value is tobserv = 5.390, and its critical value tc = 2.021, determined from the tables at p = 0.05 and n = 37 − 2 = 35. Similarly, for the functional relationship between the Redfield parameter and the concentration of total nitrogen compounds in water, tobserv = 8.540 and tc = 2.021, respectively. It follows that the parameters of the power functions shown in Figure 4 are statistically significant at a significance level of p = 0.05.
This means that in 95% of cases, the parameters of the power dependencies
Rat (PO4) = 306.52 Sw(PO4)−1.13  at R2 = 0.454
and
Rat (SumN) = 0.197 Sw(SumN)0.921  at R2 = 0.676
determined from the sample data, fall within the confidence intervals of the parameters of the general population.

4. Discussion

Thus, the results of observations in 2023–2024 of the concentrations of biogenic elements in the study areas of the Azov-Black Sea basin showed the following: in Streletskaya Bay, the main factor of water eutrophication was the influx of nitrates in the winter–spring period. Phytoplankton primary production in all seasons of the year was limited by mineral phosphorus in summer and autumn seasons, and the ratio of specific nitrogen content to phosphorus concentration in water decreased with 90% confidence. In the Azov-Black Sea basin, the relationships between the Redfield parameter (Rat) and the concentration of mineral phosphorus, and the sum of nitrogen compounds was reliably described by power functions, and phytoplankton primary production could be limited by both mineral phosphorus and nitrogen compounds.
Estimates of the average values of the bifurcation boundaries (Figure 4) showed that the switch from phosphorus to nitrogen limitation occurred on average when the phosphorus concentration in water exceeded 14.5 μg·L−1. The bifurcation of nitrogen limitation to phosphorus occurred when the concentration of mineral nitrogen compounds in water exceeded 110 μg·L−1 (Figure 4B). Based on these data, for a stationary level of Rat = 16, the following was obtained: when switching from nitrogen to phosphorus limitation, N:P ≈ 110:14, and when switching from phosphorus to nitrogen, N:P ≈ 8:1. The estimates of this ratio fall within the experimentally determined ranges of stoichiometric ratios (N:P) for phytoplankton in the Sea of Azov, which are 5.00 for diatom algae, 6.96 for pyrophytes, and 8.75 for blue–green algae [25]. This indicates the existence of natural mechanisms for conditioning the marine environment with regard to biogenic elements.
The influence of phytoplankton on aquatic nutrient concentrations is fundamentally linked to the problem of the biotic conditioning of the marine environment. According to Academician V.I. Vernadsky [42], the reproduction of living matter also reproduces the physicochemical conditions necessary for its survival. Living matter participates in biogeochemical processes through its mass, energy, and chemical composition. Consequently, the study of these processes requires the consideration of their metabolic, trophic, and production characteristics across all levels of marine ecosystem organization. Given the inherent complexity of this task, it necessitates the use of mathematical models constrained by the balances of matter, energy, and the nutrients that limit production processes by biogenic elements. Research in this direction has led to the development of a semi-empirical theory of mineral metabolism in aquatic organisms and, based on its parameters, a theory of radioisotopic and chemical homeostasis in marine ecosystems [30].
The sedimentation capacity of the photic zone was investigated using a two-dimensional dynamic model of its ecosystem [43]. Model components included phytoplankton, bacteria and small (bacterivorous and herbivorous) and large (predatory) zooplankton, as well as dissolved and particulate organic matter. The model was constrained by balances of matter, energy, nutrients, and mineral contaminants. The vertical distribution of ecosystem components was resolved into 10 discrete layers (boxes). Dynamic processes within each layer were described by a system of 24 differential equations. Two-dimensional modeling was performed by sequentially solving a system of 240 differential equations under identical initial conditions for adjacent layers, with an integration step size constrained by the kinetics of fast processes.
The halostatic zone of the western Black Sea was used as the prototype for this photic zone ecosystem model. Its biogeochemical parameters were derived from field observations during multiple expeditions of the R/V Professor Vodyanitsky across different seasons, supplemented by laboratory experiments and theoretical estimates. Numerical experiments determined that when energy processes were limited by PAR and production processes were limited by nutrients, the model consistently established quasi-steady oscillations with a period corresponding to seasonal ecosystem succession, independent of initial conditions [43]. Simultaneously, the vertical distributions of model components produced profiles that matched naturally observed patterns of dissolved inorganic phosphorus concentration and primary production in both summer and winter (see Figure 4.2.2, p. 212 in [30]).
According to current understanding, stoichiometric relationships reflect the fact that in photosynthetic ecosystems, the consumption of different biogenic elements per unit of production varies. Therefore, shifts (bifurcations) in the system limiting production processes also lead to changes in the biogeochemical patterns of marine ecosystem functioning. As is known, the processes of mineral nutrition of producers are associated with the absorption of chemical elements directly from the aquatic environment, their entry into the main structures synthesized during growth and metabolic pools of hydrobionts, and their removal as a result of metabolism, mineralization, and leasing [44].
It has been empirically established that single-celled algae can store biogenic elements under conditions of elevated concentrations in the environment and then use them for growth [45,46,47]. Experimental studies using the radioactive label 32P have shown that the kinetic patterns of phosphorus metabolism in single-celled algae, taking into account production processes, are adequately described by the following differential model [45]:
d C a d t = V m C w K m + C w p + μ m 1 q m i n C a C a
where Ca and Cw are the concentrations of phosphorus in single-celled algae (μg·kg−1) and in the aquatic environment (μg·L−1); Vm is the maximum rate of mineral phosphorus absorption by algae (μg·kg−1·day−1); Km is the Michaelis–Menten constant [48], numerically equal to the concentration of the element in the aquatic environment (μg·L−1) at a rate of its absorption by the hydrobiont equal to half of the maximum; p is the indicator of the rate of intracellular phosphorus metabolism by algae (day−1); μm is the specific growth rate of algae (day−1); qmin is the minimum intracellular phosphorus concentration ensuring the survival of algae (μg·kg−1); and t is time (days).
The general form of the balance equality of the right-hand side in expression (6) was justified in the work of Burmaster and Chisholm [49]. The first term on the right-hand side corresponds to the equation proposed by Monod [50] and Dugdale [51], who suggested describing the process of mineral phosphorus uptake by algae in accordance with the Michaelis–Menten equation [48]. The term in square brackets on the left side of the expression is the indicator of the rate of intracellular phosphorus exchange by algae (p), which reflects the intensity of metabolic processes in algae. Experimental studies with radioactive phosphorus (32P) have shown that the value of the rate index (p) is invariant with respect to different concentrations of mineral phosphorus in the aquatic environment [44,45]. The right-hand member in square brackets of Equation (6) includes the Droop ratio [52], which determines the relationship between the parameter μ and the concentration of the biogenic element directly in algae, and it is intended to account for the limiting function of production processes.
μ = μ m 1 q m i n C a
In expression (7), the value qmin/Ca reflects the degree of limitation in relation to the biogenic element under consideration. From relations (6) and (7) it follows that if, in an open system, the expenditure for production processes for one of the limiting elements leads to an approximate equality qmin ≈ Ca, the value µ in relation (7) reaches a minimum and the growth of algae either stops or is limited to the minimum available rate (µ). At the same time, for all other elements, the value of qmin/Ca will be obviously lower than that of the biogenic element limiting primary production. Therefore, the rate of removal of non-limiting elements will be higher. This, of course, also applies to the stoichiometric ratio N:P and other biogenic elements.
According to the analysis of modeling, the results using Equation (6), and taking into account ratio (7), it follows that any system is controlled by the limiting biogenic element. Under the influence of primary production processes, the concentrations of all non-limiting elements tend towards their steady-state stoichiometric values. Thus, negative feedback controlled by natural photosynthetic systems is realized, which consists of the following. With any deviation of the concentration of biogenic elements in the aquatic environment from the steady-state stoichiometric ratio for a given ecosystem, the functioning of natural photosynthetic systems is always directed towards their restoration.
The materials presented in Figure 2, Figure 3 and Figure 4 and the ratios (6), concerning the problem of marine environment biotic conditioning, showed the following. The general opinion of experts noted in the literature about an increase in the stoichiometric N:P ratio due to a wider influx of sulphate-containing chemical compounds into the water has not been confirmed. This is due to the fact that the change in the Redfield parameter indicated a limitation of primary production processes by mineral phosphorus throughout the year (Figure 4). The concentration of PO4 and the sum of nitrogen compounds in water increased in the winter season and decreased in summer and autumn (Figure 2). The Nsum/PO4 ratio decreased only during the vegetation season (Figure 3). Therefore, the hypothesis based on model (6) about the conditioning of the marine environment as a result of the functioning of phytoplankton primary production systems can be accepted with 90% probability.
With phytoplankton primary production of 100 mgCorg·m−3·day−1 and specific production Pf/Bf = 1, taking into account ratio (1), the intracellular phosphorus PO4 pool will be approximately 2 μg·L−1, and the nitrogen pool will be 14 μg·L−1. These data indicate high contribution of the pool of biogenic elements in phytoplankton to the formation of homeostasis in the marine environment.
Based on the results of Egorov et al. [18], it was established that the natural homeostasis of marine ecosystems in the photic zone, with respect to nutrients, is regulated by a negative feedback mechanism analogous to the Le Chatelier (or Le Chatelier–Braun) principle. The study demonstrated that the ecosystem’s response to a perturbation from equilibrium, caused by an influx of nutrients, involves a shift in the mechanisms governing primary productivity. This shift aims to restore equilibrium by altering the intensity of suspended matter turnover and the cycling of the chemical elements that limit biosynthesis and cause the initial imbalance.
The results presented in Figure 3, combined with the application of theoretical concepts (6) and (7), further indicate the existence of an additional environmental conditioning mechanism. This mechanism operates through the metabolic differentiation of nutrient uptake flux ratios by phytoplankton.

5. Conclusions

It is recognized that nearly all natural processes are investigated by analyzing samples drawn from general populations. The application of statistical tests never serves to prove the underlying patterns themselves. Rather, these tests determine the probability with which parameters, estimated from sample data, reflect the general patterns proposed by the hypotheses. From this standpoint, the statistical analysis of the data presented in Figure 3 and Figure 4 indicates that the established principle of biotic limitation for production processes holds with a probability of at least 90%. Furthermore, the power function models provide an adequate description of the RatPO4 and RatNsum relationships with 95% confidence.
In Streletskaya Bay, the concentration of NH4 varied between 2.0 and 36.7 μg·L−1, NO2 between 0.9 and 9.8 μg·L−1, NO3 between 170.0 and 1800 μg·L−1, total nitrogen compounds (∑Ni) between 188 and 1813 μg·L−1, and PO4 between 3.8 and 14 μg·L−1. Limitation of phytoplankton primary production by mineral phosphorus was recorded throughout the year. In the waters of the Azov-Black Sea region, the concentration of NH4 varied between 2.5 and 48.3 μg·L−1, the concentration of NO2 from 0.4 to 11.8 μg·L−1, NO3 from 4.8 to 500.0 μg·L−1, total nitrogen compounds (∑Ni) from 10.4 to 512.0 μg·L−1, and PO4 from 4.5 to 125.8 μg·L−1. Except for certain areas, the prevalence of limiting phytoplankton primary production by the sum of nitrogen compounds was registered.
The dependence of the Redfield parameter on the concentration of mineral phosphorus and the sum of nitrogen compounds in the water of the coastal areas of the Sea of Azov and the Black Sea with a significance level of p = 0.05 is described by power functions. During the bifurcation transition of the phytoplankton production system from nitrogen to phosphorus limitation, the stoichiometric ratio is N:P ≈ 110:14, and from phosphorus to nitrogen N:P ≈ 8:1.
A previously unknown principle governing the natural regulation of phytoplankton community production has been established. Whenever the concentration of biogenic elements in the aquatic environment deviates from the region-specific stoichiometric ratio, the functioning of photosynthetic systems always acts towards its restoration. This restoration is achieved through a metabolic differentiation in the uptake and turnover rates of nutrients by phytoplankton.

Author Contributions

Conceptualization, V.E.; methodology, V.E.; validation, V.E.; investigation, N.B.; formal analysis, Y.M.; writing—original draft preparation, V.E.; writing—review and editing, E.S., S.A. and N.M.; visualization, S.A. and O.S. (Olga Soloveva); supervision, E.T., S.A. and V.E.; resources, O.S. (Oleg Stepanyan) and R.G.; project administration, G.M. and V.E.; funding acquisition, G.M. and O.S. (Oleg Stepanyan). All authors have read and agreed to the published version of the manuscript.

Funding

The publication was financially supported by the Ministry of Science and Higher Education of the Russian Federation (Agreement No. 075-15-2024-528 of 24 April 2024 on the implementation of a large-scale research project within the priority areas of scientific and technological development).

Informed Consent Statement

Not applicable.

Data Availability Statement

The original contributions presented in this study are included in the article. Further inquiries can be directed to the corresponding author.

Conflicts of Interest

The authors declare no conflicts of interest.

References

  1. Zaitsev, Y.P. The Bluest in the World; United Nations: New York, NY, USA, 1998; 142p. (In Russian) [Google Scholar]
  2. Gulin, S.B.; Mirzoeva, N.Y.; Egorov, V.N.; Polikarpov, G.G.; Sidorov, I.G.; Proskurnin, V.Y. Secondary radioactive contamination of the Black Sea after Chernobyl accident: Current levels, pathways and trends. Mar. Chem. 2012, 92, 1–18. [Google Scholar] [CrossRef]
  3. Zagranichny, K.A. On the issue of sources and volumes of oil components entering the Black Sea. Eng. Bull. Don 2014, 28, 80–92. (In Russian) [Google Scholar]
  4. Yunev, O.A.; Konovalov, S.K.; Velikova, V. Anthropogenic Eutrophication in the Pelagic Zone of the Black Sea: Long-Term Trends, Mechanisms, Consequences; Kovalevsky, A.O., Ed.; GEOS; Institute of Biology of the Southern Seas of the Russian Academy of Sciences: Sevastopol, Russia; Marine Hydrophysical Institute of the Russian Academy of Sciences: Moscow, Russia, 2019; 164p. (In Russian) [Google Scholar]
  5. Soloveva, O.; Tikhonova, E.; Alyomov, S.; Mirzoeva, N.; Skuratovskaya, E.; Matishov, G.; Egorov, V. Distribution and Genesis of Aliphatic Hydrocarbons in Bottom Sediments of Coastal Water Areas of the Crimea (the Black and Azov Seas). Water 2024, 16, 2395. [Google Scholar] [CrossRef]
  6. Finenko, Z.Z.; Churilova, T.Y.; Suslin, V.V. Assessment of phytoplankton biomass and primary products in the black sea from satellite data. In Fishing Resources of the Black and Azov Seas; Yeremeev, V.N., Gaevskaya, A.V., Shulman, G.E., Zagorodnaya, Y.A., Eds.; NAS of Ukraine, Institute of Biology of the Southern Seas named after A. O. Kovalevsky: Sevastopol, Russia; EKOSI-Hydrophysika Publ.: Sevastopol, Russia, 2011; pp. 237–248. (In Russian) [Google Scholar]
  7. Stelmakh, L.V. Patterns of Phytoplankton Growth and Its Consumption by Microzooplankton in the Black Sea: Abstract of the Dissertation. Ph.D. Thesis, A.O. Kovalevsky Institute of Marine Biological Research, Sevastopol, Russia, 2017; 42p. (In Russian). [Google Scholar]
  8. Matishov, G.G.; Povazhny, V.V.; Berdnikov, S.V.; Moses, V.J.; Gitelson, A.A. Assessment of chlorophyll a concentration and primary production in the Sea of Azov using satellite data. Rep. Acad. Sci. 2010, 432, 563–566. (In Russian) [Google Scholar]
  9. Berdnikov, S.V.; Dashkevich, L.V.; Kulygin, V.V.; Povazhny, V.V. Evaluation of the primary production of the Sea of Azov according to remote sensing data. Sci. S. Russ. 2018, 14, 55–65. (In Russian) [Google Scholar]
  10. Berdnikov, S.V.; Kleshchenkov, A.V.; Kreneva, K.V.; Glushchenko, G.Y.; Dashkevich, L.V.; Kulygin, V.V.; Karasyuk, V.S.; Saprykin, V.V.; Bulysheva, N.I. The results of marine scientific research at the Southern Scientific Center of the Russian Academy of Sciences (SSC RAS) in the Sea of Azov in 2003–2018. Part 2: Hydrobiology. Aquat. Bioresour. Habitat 2019, 2, 7–23. (In Russian) [Google Scholar]
  11. Filatova, T.B. The relationship of the regime of biogenic substances of the Sea of Azov with hydrometeorological factors // Izvestiya vuzov. The North Caucasus region. Nat. Sci. 2010, 157, 107–111. (In Russian) [Google Scholar]
  12. Mikhailenko, A.; Fedorov, Y.; Dotsenko, I.; Solodko, D. Water quality formation factors in the Azov Sea. Int. Multidiscip. Sci. GeoConf. SGEM 2020, 20, 871–878. [Google Scholar]
  13. Ragueneau, O.; Lancelot, C.; Egorov, V.N.; Vervulimmeren, J.; Cociasu, A.; Deliat, G.; Krastev, A.; Daoub, N.; Rousseau, V.; Popovichev, V.; et al. Biogeochemical transformations of inorganic nutrients in the mixing zone between the Danube river and the north-western Black Sea. Estuar. Coast. Shelf Sci. 2002, 54, 321–336. [Google Scholar] [CrossRef]
  14. Becquevort, S.; Bouvier, T.; Lancelot, C.; Deliat, G.; Egorov, V.N.; Popovichev, V. The seasonal modulation of organic matter utilization by bacteria in the Danube-Black Sea mixing zone. Estuar. Coast. Shelf Sci. 2002, 54, 337–354. [Google Scholar] [CrossRef]
  15. Popovichev, V.N.; Egorov, V.N. Phosphorus exchange of natural suspended matter in the estuaries of the Danube and Chorokh rivers. Mar. Ecol. J. 2003, 2, 83–97. (In Russian) [Google Scholar]
  16. Egorov, V.N.; Bobko, N.I.; Marchenko, Y.-G.; Sadogursky, S.E. The content of biogenic elements and the limitation of primary phytoplankton production in the estuary of the Vodopadnaya River (Southern coast of Crimea). Environ. Saf. Coast. Offshore Zones Sea 2021, 3, 37–51. [Google Scholar]
  17. Egorov, V.N.; Bobko, N.I.; Marchenko, Y.G.; Sadogursky, S.E. Content of nutrients and limitation of phytoplankton primary production in the specially protected natural area “Cape Martyan” (Black Sea). Mar. Biol. J. 2021, 6, 19–30. (In Russian) [Google Scholar] [CrossRef]
  18. Egorov, V.N.; Popovichev, V.N.; Gulin, S.B.; Bobko, N.I.; Rodionova, N.Y.; Tsarina, T.V.; Marchenko, Y.G. The influence of phytoplankton primary production on the cycle of biogenic elements in the coastal waters off Sevastopol, Black Sea. Russ. J. Mar. Biol. 2018, 44, 240–247. [Google Scholar] [CrossRef]
  19. Dobrolyubsky, O.K. Microelements and Life; Molodaya Gvardiya: Moscow, Russia, 1956; 124p. (In Russian) [Google Scholar]
  20. Turn, G.A.; Joshi, G.H.V.; Chauhan, V.D.; Rao, P.S. Effect of metal ions on the growth of Sargassum swartzii. Indian J. Mar. Sci. 1982, 11, 338. [Google Scholar]
  21. Sapozhnikov, V.V.; Metreveli, M.P. Stoichiometric model of organic matter-the basis for quantitative study of productive and destructive processes in the ocean. Proc. VNIRO 2015, 155, 135–145. (In Russian) [Google Scholar]
  22. Cooper, L.H.N. On the ratio of nitrogen to phosphorus in the Sea. J. Mar. Biol. Ass. 1937, 22, 177–182. [Google Scholar] [CrossRef]
  23. Cooper, L.H.N. Redifinition of the anomaly in the nitrate-phosphate ratio. Mar. Biol. Ass. 1938, 23, 171–178. [Google Scholar] [CrossRef]
  24. Redfield, A.C. The biological control of chemical factors in the environment. Am. Sci. 1958, 46, 205–221. [Google Scholar]
  25. Ilyichev, V.G.; Semin, V.L. Nitrogen “diabetes” of the Sea of Azov. Nature 2006, 11, 19–24. (In Russian) [Google Scholar]
  26. Hutchinson, D. Limnology; Mir: Moscow, Russia, 1969; 591p. (In Russian) [Google Scholar]
  27. Zilov, E.A. Hydrobiology and Aquatic Ecology (Organization, Functioning and Pollution of Aquatic Ecosystems); Publishing House of the Irkutsk State University: Irkutsk, Russia, 2009; 147p. (In Russian) [Google Scholar]
  28. Patton, A.E. Energy and Kinetics of Biochemical Processes; Mir Publ.: Moscow, Russia, 1968; 159p. (In Russian) [Google Scholar]
  29. Rubin, A.B. Biophysics; Higher school Publ.: Moscow, Russia, 1987; 319p. (In Russian) [Google Scholar]
  30. Egorov, V.N. Theory of Radioisotopic and Chemical Homeostasis of Marine Ecosystems; Springer: Cham, Switzerland, 2021; 320p. [Google Scholar]
  31. Hillebrand, H.; Steinert, G.; Boersma, M.; Malzahn, A.; Meunier, C.L.; Plum Ch Ptacnik, R. Goldman revisited: Faster-growing phytoplankton has lower N: P and lower stoichiometric flexibility. Limnol. Oceanogr. 2013, 58, 2076–2088. [Google Scholar] [CrossRef]
  32. Yang, Y.; Pan, J.Y.; Han, B.P.; Naselli-Flores, L. The effects of absolute and relative nutrient concentrations (N/P) on phytoplankton in a subtropical reservoir. Ecol. Indic. 2020, 115, 106466. [Google Scholar] [CrossRef]
  33. Mathew, T.; Prakash, S.; Baliarsingh, S.K.; Samanta, A.; Lakshmi, R.S.; Lotliker, A.A.; Chatterjee, A.; Nair, T.B. Response of phytoplankton biomass to nutrient stoichiometry in coastal waters of the western Bay of Bengal. Ecol. Indic. 2021, 131, 108–119. [Google Scholar] [CrossRef]
  34. de Fommervault, O.P.; Migon, C.; D’Ortenzio, F.; d’Alcalà, M.R.; Coppola, L. Temporal variability of nutrient concentrations in the northwestern Mediterranean sea (DYFAMED time-series station). Deep. Sea Res. Part I Oceanogr. Res. Pap. 2015, 100, 1–12. [Google Scholar] [CrossRef]
  35. Trommer, G.; Leynaert, A.; Klein, C.; Naegelen, A.; Beker, B. Phytoplankton phosphorus limitation in a North Atlantic coastal ecosystem not predicted by nutrient load. J. Plankton Res. 2013, 35, 1207–1219. [Google Scholar] [CrossRef]
  36. Howarth, R.W.; Marino, R. Nitrogen as the limiting nutrient for eutrophication in coastal marine ecosystems: Evolving views over three decades. Limnol. Oceanogr. 2006, 1, 364–376. [Google Scholar] [CrossRef]
  37. Ngatia, L.; Grace, J.M., III; Moriasi, D. Nitrogen and phosphorus eutrophication in marine. In Monitoring of Marine Pollution; Intech Open: London, UK, 2019; pp. 77–93. [Google Scholar]
  38. Grasshoff, K. (Ed.) Methods of Seawater Analysis; Verlag Chemie: Weinheim, Germany; New York, NY, USA, 1976; 317p. [Google Scholar]
  39. Sapozhnikov, V.V. (Ed.) Manual for the Chemical Analysis of Marine and Fresh Waters in the Environmental Monitoring of Fisheries Reservoirs and Prospective Fishing Areas of the World Ocean; VNIRO Publishing House: Moscow, Russia, 2003; 202p. (In Russian) [Google Scholar]
  40. Monbet, P.; McKelvie, I.D. Phosphates. In Handbook of Water Analysis; CRC Press: Boca Raton, FL, USA, 2007; pp. 233–266. [Google Scholar]
  41. Partchevskaya, D.S. Statistics for Radioecologists (A Practical Guide to Statistics and Experimental Planning in Radioecology); Naukova dumka: Kyiv, Ukraine, 1969; 115p. (In Russian) [Google Scholar]
  42. Vernadsky, V.I. Chemical Structure of the Earth’s Biosphere and Its Environment; Nauka Publ.: Moscow, Russia, 1965; 374p. (In Russian) [Google Scholar]
  43. Egorov, V.N.; Popovichev, V.N.; Burlakova, Z.P.; Krupatkina, D.K.; Kovalenko, T.P.; Alexandrov, B.G. Mathematical model of the biosedimentation function of the ecosystem of the photic layer of the Western chalistatics of the Black Sea. In Molismology of the Black Sea; Naukova Dumka: Kiev, Ukraine, 1992; pp. 50–62. (In Russian) [Google Scholar]
  44. Polikarpov, G.G.; Egorov, V.N. Marine Dynamic Radiochemoecology; Energoatomizdat: Moscow, Russia, 1986; 176p. (In Russian) [Google Scholar]
  45. Egorov, V.N.; Zesenko, A.Y.; Parkhomenko, A.V.; Finenko, Z.Z. Mathematical description of the kinetics of mineral phosphorus metabolism by unicellular algae. Hydrobiol. J. 1982, 18, 45–50. (In Russian) [Google Scholar]
  46. Brunel, L.; Dauta, A.; Guerri, M.M. Croissance algae: Validation d’un modele a stock l’aide de donnees experimentales. Ann. Limnol. 1982, 18, 91–99. [Google Scholar] [CrossRef]
  47. Giammatteo, P.A.; Schindler, J.E.; Waldron, M.C.; Speziale, B.J.; Freedman, M.L.; Zimmerman, M.J. Use of equilibrium programs in predicting phosphorus availability. In Environmental Biogeochemistry; Halberg, R., Ed.; Ecol Bull: Stockholm, Sweden, 1983; pp. 491–501. [Google Scholar]
  48. Michaelis, L.; Menten, M.L. Die kinetik der invertinwirkung. Biochem. Z. 1913, 49, 333–369. [Google Scholar]
  49. Burmaster, D.E.; Chisholm, S.W. A comparison of two methods for measuring phosphate uptake by Monochrysis lutheri Droop grown in continuous culture. J. Experim. Marine Ecol. 1979, 39, 187–202. [Google Scholar] [CrossRef]
  50. Jacques, M. Recherches Sur la Croissance des Cultures Bactériennes. Ph.D. Thesis, Université de Paris, Paris, France, 1942; pp. 1–210. [Google Scholar]
  51. Dugdale, R.C. Nutrient limitation in the sea: Dynamics, identification and significance. Limnol. Oceanogr. 1967, 12, 685–695. [Google Scholar] [CrossRef]
  52. Droop, M.R. The nutrient status of algae cells in continuous culture. J. Mar. Biol Assoc. 1974, 2, 541–555. [Google Scholar]
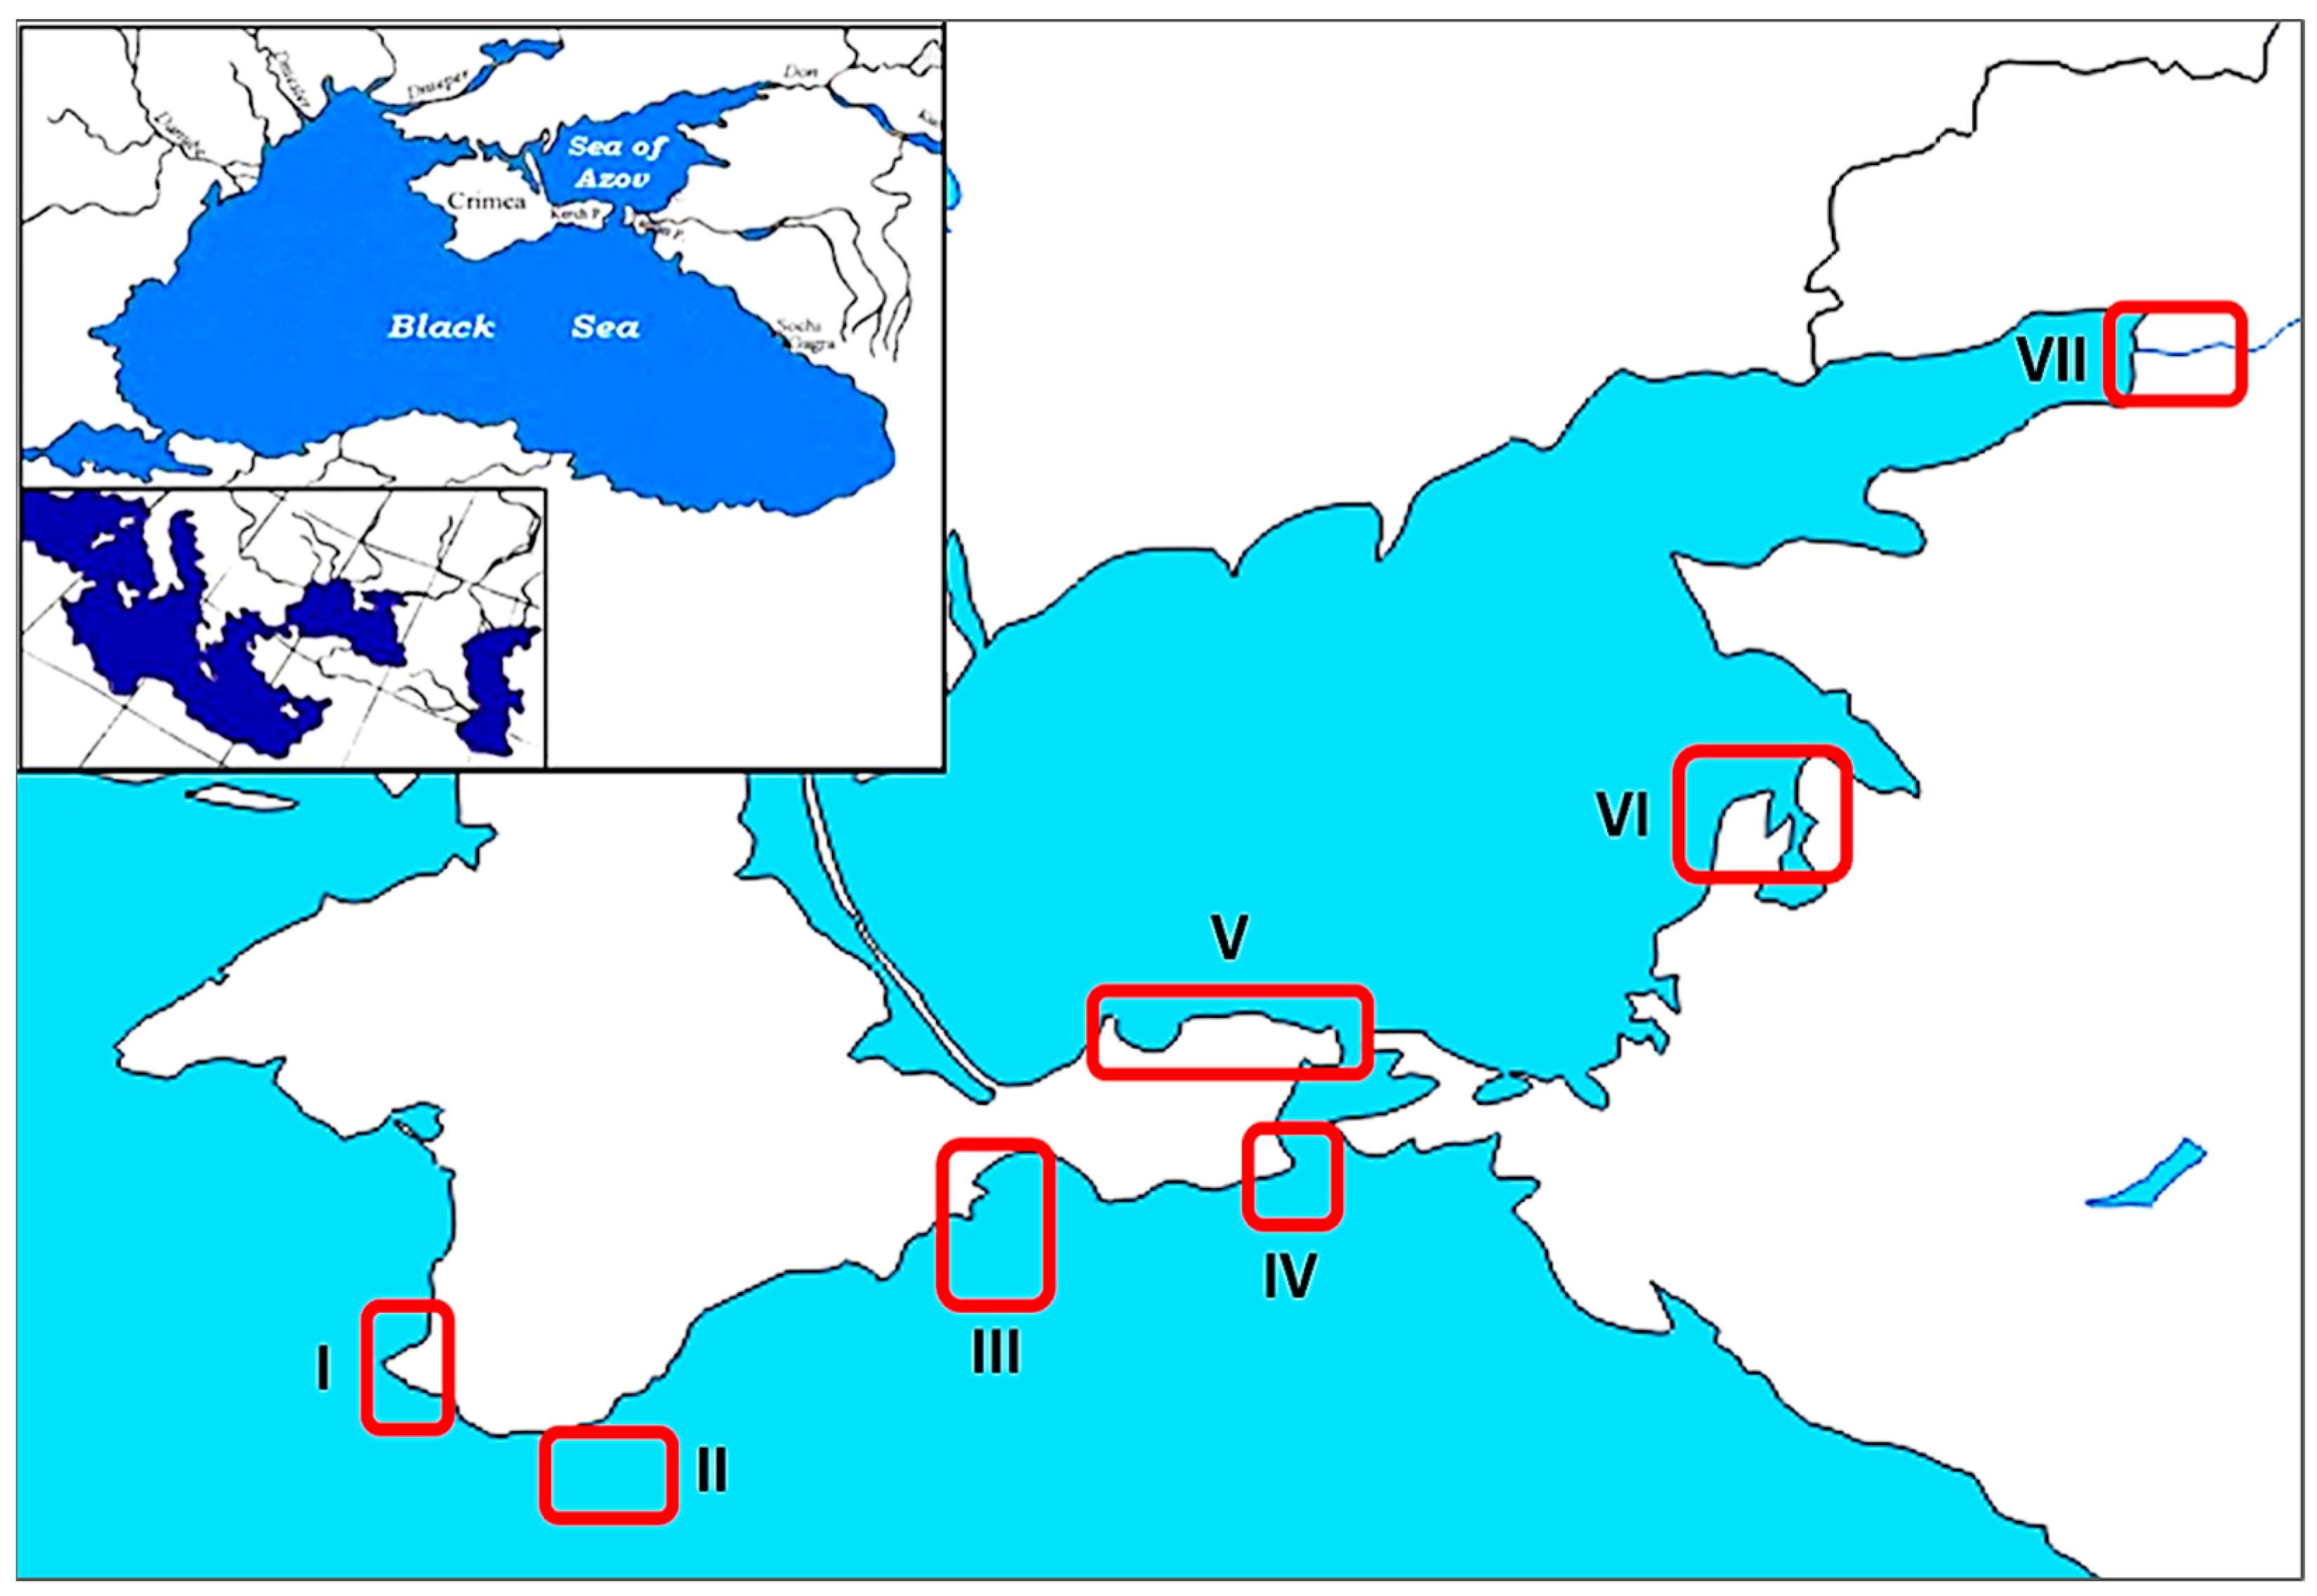
Figure 1. Location map of the study areas with the sampling stations marked by red rectangles.
Water 17 02968 g001
Figure 2. Changes in the concentration (μg·L−1) of phosphorus (A) and mineral forms of nitrogen (B) in the water of Streletskaya Bay on an annual observation cycle scale: (○—nitrites); (+—ammonium); (Δ—nitrates); (●—total). The figure shows the average values of the results of three repeated water sample measurements and standard deviations (SD). The dotted line shows the interpolation of data using 3rd (A) and 5th degree (B) polynomials.
Water 17 02968 g002
Figure 3. Trend in temperature change (A, +— in the figure), and trend (B) of change in the ratio of the total concentration of nitrogen compounds (Nsum) to the concentration of mineral phosphorus (PO4) in the surface waters of Streletskaya Bay (○—in spring and winter and ●—in summer and autumn).
Water 17 02968 g003
Figure 4. Characteristics of changes in the Redfield parameter (Rat) with changes in the concentration of mineral phosphorus (A) and the sum of nitrogen compounds in the waters of the Azov-Black Sea basin: (A)—Rat from PO4 concentration in the waters of Streletskaya Bay (Δ) and in areas II–VI (▲); (B)—Rat from the sum of nitrogen compounds in Streletskaya Bay (○) and in areas II–VI (●).
Water 17 02968 g004
Table 1. Results of determination of hydrochemical parameters in water in the coastal areas of the Azov-Black Sea basin.
NDateRegionCoordinatesDay Number of the YearWater Temperature,
°C
NH4 ± SD,
μg·L−1
NO2 ± SD,
μg·L−1
NO3 ± SD,
μg·L−1
Nsum,
μg·L−1
PO4 ± SD,
μg·L−1
S‰pHRat ± SD
19 April 2023I44.59597° N 33.46977° E9913.212.0 ± 0.50.9 ± 0.011800 ± 5418133.8 ± 0.1--742 ±
98.43
228 May 2023I44.59597° N 33.46977° E14916.036.7 ± 1.85.6 ± 0.10510 ± 155529.0 ± 0.1--109 ±
5.61
324 June 2023I44.59597° N 33.46977° E17420.024.0 ± 1.14.3 ± 0.20260 ± 82887.0 ± 0.1--76 ±
4.83
424 July 2023I44.59597° N 33.46977° E20625.320.0 ± 1.07.3 ± 0.10270 ± 829710.5 ± 0.2--51 ±
2.00
523 August 2023I44.59597° N 33.46977° E23625.614.0 ± 0.78.0 ± 0.10433 ± 134556.0 ± 0.2--125 ±
9.80
614 September 2023I44.59597° N 33.46977° E25825.330.0 ± 1.49.8 ± 0.10440 ± 1324807.0 ± 0.1--122 ±
8.10
720 October 2023I44.59597° N 33.46977° E29423.416.0 ± 0.82.2 ± 0.01170 ± 51886.4 ± 0.1--54 ±
3.59
822 November 2023I44.59597° N 33.46977° E31614.17.4 ± 0.44.4 ± 0.10200 ± 62127.0 ± 0.1--51 ±
3.00
925 December 2023I44.59597° N 33.46977° E36011.32.0 ± 0.17.4 ± 0.10600 ± 186147.0 ± 0.1--138 ±
9.05
1018 January 2024I44.59597° N 33.46977° E188.82.0 ± 0.14.8 ± 0.07342 ± 103484.0 ± 0.2--136 ±
16.18
1128 February 2024I44.59597° N 33.46977° E599.612.0 ± 0.63.1 ± 0.10867 ± 2688214.0 ± 0.2--65 ±
3.25
1231 March 2024I44.59597° N 33.46977° E8912.510.0 ± 0.53.6 ± 0.151210 ± 36122311.0 ± 0.2--113 ±
7.51
137 August 2024II44.32834° N
34.13334° E
-26.010.5 ± 0.51.48 ± 0.02500.0 ± 1551211.6 ± 0.217.87 ± 0.01-71.0 ±
2.68
1424 July 2024III44.35334° N 35.76167° E-26.012.2 ± 0.60.81 ± 0.01177.0 ± 519010.4 ± 0.217.69 ± 0.01 32.4 ±
1.13
1531 July 2024III44.96547° N
35.39734° E
-26.013.0 ± 0.60.44 ± 0.0128.0 ± 14111.6 ± 0.217.51 ± 0.01-9.7 ±
0.04
1620 August 2024IV45.06189° N 36.32576° E--11.6 ± 0.62.0 ± 0.0340.5 ± 1547.4 ± 0.117.00 ± 0.01-17.2 ±
0.57
1726 April 2024V45.37202° N 36.02468° E--8.9 ± 0.43.8 ± 0.0652.4 ± 26534.0 ± 0.5-7.904.0 ±
0.07
1826 April 2024V45.37202° N 36.02468° E--7.3 ± 0.42.5 ± 0.0434.7 ± 14522.0 ± 0.3-8.154.4 ±
0.10
1926 April 2024V45.37202° N 36.02468° E--10.0 ± 0.53.2 ± 0.0514.5 ± 12823.0 ± 0.3-8.173.6 ±
0.12
2030 July 2024V45.47090° N 36.35680° E--48.3 ± 2.34.00 ± 0.0610.0 ± 16264.0 ± 0.914.25 ± 0.017.904.4 ±
0.04
211 August 2024V45.47146° N
35.83910° E
--25.9 ± 1.23.03 ± 0.0556.0 ± 18592.8 ± 1.414.58 ± 0.017.902.4 ±
0.03
2220 August 2024V45.43143° N 36.59767° E--12.4 ± 0.62.7 ± 0.04331.0 ± 1034638.9 ± 0.614.65 ± 0.01-14.8 ±
0.08
2320 August 2024V45.47038° N 36.31504° E--13.0 ± 0.61.9 ± 0.03132.0 ± 414740.7 ± 0.614.29 ± 0.10-6.74 ±
0.03
2420 August 2024V45.47189° N 36.24817° E--15.1 ± 0.73.3 ± 0.0593.5 ± 312045.9 ± 0.714.20 ± 0.01-5.0 ±
0.04
2512 July 2024VI47.07845° N 39.30465° E--6.0 ± 0.331.8 ± 0.48246.2 ± 7284125.8 ± 3.6--3.8 ±
0.02
269 September 2024VI46.15524° N 38.26916° E--7.0 ± 0.36.5 ± 0.1018.0 ± 12547.6 ± 0.713.42 ± 0.01-1.6 ±
0.08
2710 September 2024VI45.86233° N 37.89013° E--8.0 ± 0.45.9 ± 0.207.1 ± 12110.2 ± 0.213.73 ± 0.01-6.4 ±
0.12
2810 September 2024VI46.16491° N 38.24925° E--8.0 ± 0.44.9 ± 0.1021.6 ± 13532.6 ± 0.513.42 ± 0.01-2.4 ±
0.10
2913 September 2024VI46.27268° N 38.28073° E--10.0 ± 0.52.4 ± 0.0414.0 ± 12626.2 ± 0.413.28 ± 0.01-3.0 ±
0.11
3013 September 2024VI46.27223° N 38.40142° E--7.0 ± 0.32.0 ± 0.0320.0 ± 13010.0 ± 0.337.76 ± 0.01-7.0 ±
0.09
3111 July 2024VII47.21737° N 39.80865° E--6.0 ± 0.311.8 ± 0.1836.2 ± 154111.0 ± 1.7--1.0 ±
0.04
Disclaimer/Publisher’s Note: The statements, opinions and data contained in all publications are solely those of the individual author(s) and contributor(s) and not of MDPI and/or the editor(s). MDPI and/or the editor(s) disclaim responsibility for any injury to people or property resulting from any ideas, methods, instructions or products referred to in the content.