Abstract
Pesticides have attracted widespread attention as significant factors affecting aquatic ecosystem diversity. Jiujiang Port, located at the confluence of the Yangtze River and Poyang Lake, is the largest hub port in Jiujiang City and also an important agricultural production area. However, the characteristics and ecological risks of pesticide pollution in this basin have rarely been reported. In this study, we investigated the contamination profiles of 49 typical pesticides in surface waters in the Jiujiang Port area and conducted a multi-level ecological risk assessment using the Risk Quotient (RQ) method, semi-probabilistic risk assessment (RQf), and Joint Probability Curve (JPC) approach. The results showed that the average concentrations of triazine, carbamate, neonicotinoid, and organophosphorus pesticides were 3.063 ng·L−1, 0.321 ng·L−1, 3.752 ng·L−1, and 1.554 ng·L−1, respectively. Among them, hexazinone was the most predominant contaminant, with an average concentration of 19.209 ng·L−1. Twenty pesticides were detected at frequencies exceeding 80%, and the overall pollution level was higher in the wet season than in the dry season. The RQ assessment indicated that 11 pesticides posed low or higher risks in either the wet or dry season, with imidacloprid, simazine, and terbutryn presenting moderate risks and hexazinone, chlorpyrifos, and diazinon posing high risks. The RQf values of hexazinone, chlorpyrifos, diazinon, imidacloprid, simazine, and terbutryn all exceeded 1 in both seasons, indicating substantial ecological risks to aquatic organisms in the Jiujiang Port basin. The JPC evaluation suggested that hexazinone may pose a moderate risk to 0.3–6% of aquatic species, while chlorpyrifos, imidacloprid, and terbutryn were associated with a low risk. This study elucidates the contamination characteristics, spatiotemporal distribution, and ecological risks of pesticides in surface water, providing a scientific basis for the protection of aquatic biodiversity and the management of pesticide pollution in the Jiujiang Port basin.
1. Introduction
Pesticides are a critical component of modern agricultural production systems [1,2,3], playing a vital role in pest control and ensuring food security [4,5]. However, the intensity of pesticide application in China is significantly higher than the global average, with the average usage per unit area reaching 13.1 kg/hm2—more than five times the global average of 2.6 kg/hm2 for farmland [6]. The “National Food Safety Standard—Maximum Residue Limits for Pesticides in Food” (GB 2763-2021) stipulates 10,092 maximum residue limits for 564 pesticides in 376 food categories [7]. Zhou et al. reported that the actual utilization rate of pesticides in major crops such as rice, wheat, and corn is only 40.6% [8]. A substantial portion of unused pesticides not only cause phytotoxicity to crops but are also prone to migrate into surrounding water bodies through surface runoff and rainwater erosion, posing a potential threat to aquatic ecosystems and human health [9,10,11]. Pesticide residues have been detected in surface waters in multiple river basins across the world [12,13,14,15,16]; these residues primarily include triazine pesticides (TPs), carbamate pesticides (CAs), neonicotinoid pesticides (NEOs), and organophosphorus pesticides (OPPs). The resulting ecological and health risks are becoming increasingly prominent, highlighting the urgent practical need to strengthen pollution control and conduct risk assessments for pesticides in surface waters.
As a major agricultural province in China, Jiangxi has seen continuous improvement in agricultural intensification since 2005. In 2024, its grain and vegetable yields reached 21.96 million tons and 19.312 million tons, respectively, alongside ongoing optimization of its agricultural structure. However, with the increasing agricultural output, issues including the excessive use of agricultural inputs such as pesticides and chemical fertilizers, low utilization efficiency, and inadequate emissions supervision remain pronounced [17]. These problems contribute to growing pressure from non-point source pollution [18]. Pesticide residues can enter rivers and lakes through rainfall runoff, posing a potential threat to the region’s abundant water resources. A study by Lv et al. [19] detected 13 organophosphorus pesticides in surface water in Poyang Lake, with total concentrations ranging from 38.44 to 428.94 ng/L and the Ganjiang River, its largest tributary, showing relatively high pollution levels. Research on chronic toxicity in fish demonstrated that OPP exposure leads to abnormal changes in superoxide dismutase activity in fish, alters malondialdehyde and glutathione levels, and increases reactive oxygen species production, ultimately causing oxidative stress damage to fish organs [20].
As one of the five major hub ports along the Yangtze River, Jiujiang Port is situated at the confluence of the Yangtze River, Poyang Lake, and the Beijing–Kowloon Railway. It not only serves as a vital hub for regional economic and agricultural development but also plays a key role in water and environmental security in the basin. In 2024, Jiujiang Port handled a cargo throughput of 222 million tons and a container throughput exceeding 10 million TEUs, representing significant year-on-year growth. The ecological health of the water environment around the port is directly linked to regional water security, sustainable agricultural development, and socioeconomic stability. Therefore, a systematic analysis of the pollution characteristics and spatiotemporal distribution of typical pesticides in the Jiujiang Port basin is imperative. To comprehensively evaluate the associated ecological risks, this study employs a multi-level assessment framework, which integrates the deterministic Risk Quotient (RQ) method [21,22], semi-probabilistic risk assessment (RQf), and Joint Probability Curves (JPCs). This study provides a theoretical basis and data support for the rational use of pesticides and the ecological and environmental protection of water bodies in this region. This work thus makes a key contribution to the promotion of coordinated and sustainable development in agriculture and the ecology of the basin environment.
2. Materials and Methods
2.1. Materials
The acetone, dichloromethane, methanol, acetonitrile, n-hexane, and ammonia water used in the experiments were all of chromatographical grade and purchased from Fisher Scientific (Waltham, MA, USA). Acetic acid and ammonium acetate were obtained from J&K Scientific. Ultra-pure water was prepared using a Milli-Q water purification system (Millipore Corporation, Burlington, MA, USA). The methanol and acetonitrile used for the preparation of standard stock solutions were stored frozen at −18 °C. Detailed information on pesticide standards and related pollutants is provided in Table 1.

Table 1.
Detailed information on typical pesticides.
Quantitative analysis of typical pesticides was performed using an ultra-performance liquid chromatography–tandem mass spectrometry system (UPLC-MS/MS, Xevo TQ-S micro IVD system; Waters, Milford, MA, USA) equipped with an Acquity UPLC BEH C18 column (2.1 mm × 50 mm, 1.7 μm; Waters, USA). An online solid-phase extraction system (Open Architecture on-line; Supelco, Darmstadt, Germany) was employed for the solid-phase extraction process. The SPE cartridges used included Oasis LC-18 (500 mg, 6 cc) and Oasis HLB (500 mg, 6 cc), both obtained from Waters (Milford, MA, USA). For sample pretreatment, solvent filters, nylon syringe filters (13 mm × 0.22 μm), and polyethersulfone (PES) syringe filters (13 mm × 0.22 μm) were purchased from Tianjin Jinteng Company (Tianjin, China). Glass fiber filters (GF/F, 47 mm × 0.7 μm) were acquired from Whatman (Maidstone, UK).
2.2. Study Area and Sampling
Water sampling was conducted in the Jiujiang Port area in August (wet season) and October (dry season) of 2024. The distribution of sampling sites is shown in Figure 1. The sampling sites are situated within, or immediately downstream of, major agricultural zones. Specifically, the central part of the study area (encompassing sites S4, S5, and S6) is dominated by a ‘rice–rice–rapeseed’ triple-cropping system, while the eastern and western regions also contain significant tracts of farmland dedicated to cotton, soybean, and vegetable production. This land use pattern is a primary factor in the release of pesticides into local water bodies via surface runoff. Samples were collected from a constant water layer 50 cm below the surface using a Plexiglass water sampler. To minimize photodegradation, water samples were immediately transferred into 4 L brown glass bottles after collection. All samples were stored in the dark at 4 °C to preserve their integrity and minimize environmental disturbance, and subsequent processing was strictly completed within 72 h. After standing for layer separation, the supernatant was extracted using a siphon method and filtered under negative pressure through 0.7 μm glass fiber filters to remove suspended particles. Subsequently, appropriate pretreatment methods were applied according to the physicochemical properties of different categories of pesticides, to ensure that satisfactory amounts of the target pollutants were recovered.
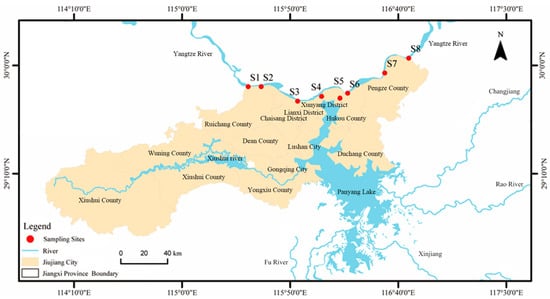
Figure 1.
Sampling sites in Jiujiang Port area.
2.3. Sample Pretreatment
Solid-phase extraction (SPE) was employed for the pretreatment of different pesticide categories. Specific extraction procedures were applied for NEOs, TPs, CAs, and OPPs, as detailed below:
- (1)
- Extraction of NEOs, TPs, and Cas: A 500 mL filtered water sample was spiked with 0.2 g of Na2EDTA and 5 ng of deuterated internal standards (including thiamethoxam-d3, imidacloprid-d3, thiacloprid-d3, clothianidin-d3, acetamiprid-d3, triadimefon-d4, atrazine-d3, and carbofuran-d3). The mixture was then loaded onto an Oasis HLB solid-phase extraction cartridge (6 cc, 500 mg) for enrichment and cleanup. Prior to extraction, the cartridge was conditioned with 5 mL of methanol followed by 5 mL of ultrapure water. The sample loading flow rate was maintained at approximately 3 mL/min. After loading, the cartridge was rinsed with 12 mL ultrapure water and dried under vacuum. Elution was performed using 6 mL of ammonia–methanol solution (5:95, v/v). The eluate was concentrated to near dryness under a gentle nitrogen stream at 40 °C, reconstituted in 1 mL of acetonitrile–water solution (10:90, v/v), and filtered through a 0.22 μm membrane into a brown glass vial for analysis.
- (2)
- Extraction of OPPs: A 500 mL filtered water sample was fortified with 5 ng of deuterated internal standard (fenthion-d6) and processed using an LC-18 solid-phase extraction cartridge (500 mg, 6 cc). The cartridge was preconditioned with 10 mL of methanol and 10 mL of ultrapure water. The sample was passed through the cartridge at a flow rate of approximately 3 mL/min. After sample loading, the cartridge was washed with 12 mL of ultrapure water, dried under vacuum, and eluted with 6 mL of methanol. The eluate was concentrated to near dryness under nitrogen at 40 °C, reconstituted in 1 mL of methanol–water solution (10:90, v/v), filtered through a 0.22 μm membrane, and transferred to a brown vial for subsequent analysis.
2.4. Sample Analysis
Concentrations of OPPs, NEOs, TPs, and CAs were determined and quantified using an ultra-performance liquid chromatography–tandem mass spectrometry system. Independent chromatographic methods were applied for each category, with the following shared conditions: the column temperature was maintained at 40 °C, the mobile phase flow rate was set at 0.4 mL·min−1, and the gradient elution program was that given in Table 2. The specific injection volumes and mobile phase compositions for each pesticide group were as follows: NEOs: injection volume, 5 µL; mobile phase A, water containing 0.1% formic acid; mobile phase B, acetonitrile; OPPs: injection volume, 10 µL; mobile phase A, water containing 0.1% formic acid; mobile phase B, methanol; TPs: injection volume, 5 µL; mobile phase A, aqueous solution of 10 mM ammonium acetate containing 0.1% formic acid; mobile phase B, acetonitrile; CAs: injection volume, 5 µL; mobile phase A, water containing 0.1% formic acid; mobile phase B, acetonitrile.
Table 2.
Chromatographic conditions.
Mass spectrometry analysis was conducted using electrospray ionization in positive mode (ESI+) with multiple reaction monitoring (MRM). Nitrogen was employed as both the desolvation and nebulizer gas. The capillary voltage was set at 0.5–1.00 kV, and the ion source temperature was maintained at 150 °C. The desolvation gas temperature was set to 400–500 °C, with a flow rate ranging from 800 to 1000 L·h−1.
2.5. Quality Control
To minimize potential contamination and external interference, procedural blank controls were implemented using ultrapure water for blank samples. Four replicate blank samples were processed in parallel following the same pretreatment and instrumental analysis procedures as those used for the actual samples to evaluate the reliability of the entire workflow. Calibration solutions were prepared by spiking surface water matrices with target standards, and the correlation coefficients (R2) of the linear calibration curves, as well as the recovery rates for each pesticide, were calculated (Table 3). Due to the relatively low water solubility of some organophosphorus pesticides (OPPs) and carbamate pesticides (CAs), their recovery rates were below 60%. To correct for the loss of target compounds during sample pretreatment, corresponding isotope-labeled internal standards were added prior to extraction. Isotope dilution was applied to compensate for deviations caused by adsorption, degradation, or other factors. The concentrations of target compounds were quantified using the internal standard method and further calibrated based on the recovery rates of the isotopes. The method detection limit (LOD) and quantification limit (LOQ) were determined based on signal-to-noise ratios (S/N) of 3 and 10, respectively. The LOD and LOQ values for each pesticide are listed in Table 1, Table 2 and Table 3. During data processing, concentrations below the LOD were treated as zero, and those between the LOD and LOQ were assigned a value of LOQ/2. Data acquisition and processing were performed using MassLynx software (version 4.2, Waters, USA).
Table 3.
LOD, LOQ, calibration curve data, and recovery rates of target pesticides.
2.6. Ecological Risk Assessment
2.6.1. Toxicity Data Screening
The toxicity data for pesticides were obtained from the ECOTOX database (https://cfpub.epa.gov/ecotox/search.cfm (accessed on 11 October 2024)), the relevant literature, and publicly available government reports. Chronic and acute toxicity data for sensitive aquatic organisms were screened based on the principles of accuracy, relevance, and reliability. Preferred toxicity endpoints included the no-observed-effect concentration (NOEC), maximum acceptable toxicant concentration (MATC), or 10% effect concentration (EC10). If these data were unavailable, then the lowest observed effect concentration (LOEC) or the median effect concentration (EC50) was used and adjusted with assessment factors (AFs) of 2 or 100, respectively. For compounds lacking experimental toxicity data, toxicity values were predicted using the Ecological Structure–Activity Relationship model (ECOSAR v2.0) developed by the United States Environmental Protection Agency. An assessment factor of 1000 was applied between acute and chronic toxicity data in this study.
2.6.2. Risk Quotient Method
The ecological risks of typical pesticides in the Jiujiang Port area were assessed using the RQ method, where the RQ is calculated as follows:
where MEC represents the measured environmental concentration (ng·L−1) and PNEC denotes the predicted no-effect concentration (ng·L−1). Based on the RQ values, ecological risks were classified into four levels: RQ < 0.1 indicates negligible risk; 0.1 ≤ RQ < 1 represents low risk; 1 ≤ RQ < 10 suggests moderate risk; and RQ ≥ 10 implies high risk.
RQ = MEC/PNEC
2.6.3. Semi-Probabilistic Risk Assessment
The conventional RQ assessment, typically based on the average or maximum environmental concentration as the MEC, may not fully reflect actual exposure scenarios and could potentially overestimate risks. The risk frequency method (RQf) reduces the influence of extreme values by incorporating the exceedance frequency. This method first calculates the frequency at which pesticide concentrations exceed the PNEC values across sampling sites to determine the exceedance rate, F (Formula (2)). The RQf value is then derived by combining the RQ and the exceedance frequency (Formula (3)):
where F denotes the frequency at which the pesticide concentration exceeds the PNEC, n represents the number of sampling sites where the concentration exceeds the PNEC, and N is the total number of sampling sites. The risk levels of RQf are classified into five categories: RQf = 0 indicates no risk; 0 < RQf < 0.01 represents negligible risk; 0.01 ≤ RQf < 0.1 suggests low risk; 0.1 ≤ RQf < 1 corresponds to moderate risk; and RQf ≥ 1 indicates high risk.
RQf = RQ × F
2.6.4. Joint Probability Curves
Since both the RQ and RQf methods rely on PNEC values derived from the toxicity data of a single species, their results entail a certain degree of uncertainty. The Joint Probability Curve (JPC) approach addresses this limitation by integrating multi-species toxicity data with environmental exposure distributions, enabling a probabilistic risk assessment. In a JPC plot, the x-axis represents the magnitude of adverse effects (the proportion of species affected) and the y-axis indicates the probability of the corresponding effect occurring. A curve closer to the x-axis signifies a lower probability of adverse effects on organisms, indicating a safer aquatic environment. The risk product (RP) is calculated as the product of the x and y values, providing a quantitative measure of risk levels. Risk is categorized into four tiers based on the maximum RP value: RP < 0.25% indicates the lowest risk; 0.25% ≤ RP < 2% represents low risk; 2% ≤ RP < 10% corresponds to moderate risk; and RP ≥ 10% indicates high risk.
3. Results and Discussion
3.1. Pollution Characteristics of Typical Pesticides in Jiujiang Port Area
A total of 49 pesticides were detected across eight sampling sites in the Jiujiang Port area, including 15 triazine pesticides, 11 carbamate pesticides, 9 neonicotinoid pesticides, and 14 organophosphorus pesticides. The detection rates for different pesticide categories are shown in Figure 2. Twenty pesticides had detection rates ≥ 80%, among which eighteen were detected at all sites (100% detection rate). These include cyromazine, simazine, simetryn, atrazine, terbuthylazine, cyanazine, ametryn, propazine, prometryn, terbutryn, and hexazinone (TPs), propamocarb (CAs), dinotefuran, acetamiprid, imidacloprid, and thiamethoxam (NEOs), and methamidophos and diazinon (OPPs). The widespread detection of these pesticides indicates their extensive use and persistence in the study area.
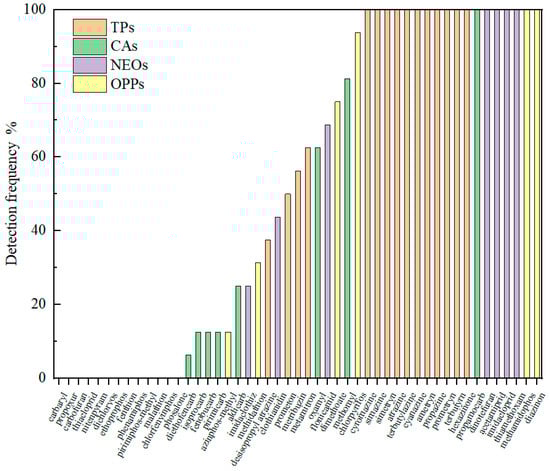
Figure 2.
Detection frequency of typical pesticides.
The concentration distributions of the four pesticide categories are illustrated in Figure 3. The concentration ranges were 0–31.897 ng·L−1 (mean: 3.063 ng·L−1; median: 0.359 ng·L−1) for TPs, 0–27.284 ng·L−1 (mean: 0.321 ng·L−1; median: 0 ng·L−1) for CAs, 0–69.952 ng·L−1 (mean: 3.752 ng·L−1; median: 0.794 ng·L−1) for NEOs, and 0–33.573 ng·L−1 (mean: 1.554 ng·L−1; median: 0 ng·L−1) for OPPs. Among the samples collected during both wet and dry seasons, hexazinone and cyromazine showed the highest mean concentrations in TPs, at 19.209 ng·L−1 and 9.825 ng·L−1, respectively. For CAs, aldicarb and methomyl had the highest mean concentrations, at 2.993 ng·L−1 and 0.259 ng·L−1, respectively. In NEOs, thiamethoxam and imidacloprid exhibited the highest mean concentrations, reaching 17.123 ng·L−1 and 7.403 ng·L−1, respectively. Among OPPs, methamidophos and chlorpyrifos were detected at the highest mean concentrations, measuring 17.850 ng·L−1 and 3.656 ng·L−1, respectively.
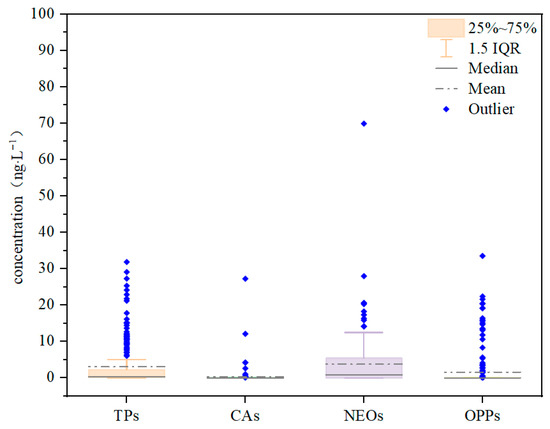
Figure 3.
Concentrations of four pesticide categories.
Of all the pesticides detected, hexazinone had the highest mean concentration (19.209 ng·L−1), which exceeded the previously reported average in the Weihe River Basin (2.95 ng·L−1) [23]. As a post-emergence contact herbicide, hexazinone is characterized by high stability, strong water solubility, and high soil mobility, along with a long residual period. These properties contribute to its high potential for environmental dispersion and ecological risk, underscoring the need for enhanced monitoring and assessment of this compound in water bodies. Additionally, thiamethoxam and methamidophos were also present at relatively high concentrations. The production, sale, and use of methamidophos are prohibited in China due to its high toxicity and the environmental risks that it poses. Its detection in this study suggests possible illegal application or historical residues in the region, highlighting the urgent need for stricter regulations to mitigate potential ecological harm.
3.2. Spatiotemporal Distribution
The concentrations of pesticides detected in the Jiujiang Port basin exhibited notable spatiotemporal variations, as shown in Figure 4. During the wet season, the average concentrations of the pesticide categories, in descending order, were as follows: NEOs (3.749 ng·L−1) > TPs (3.500 ng·L−1) > OPPs (1.571 ng·L−1) > CAs (0.537 ng·L−1). In the dry season, the order was as follows: NEOs (3.755 ng·L−1) > TPs (2.625 ng·L−1) > OPPs (1.538 ng·L−1) > CAs (0.104 ng·L−1). Overall, the pollution levels were slightly higher in the wet season than in the dry season.
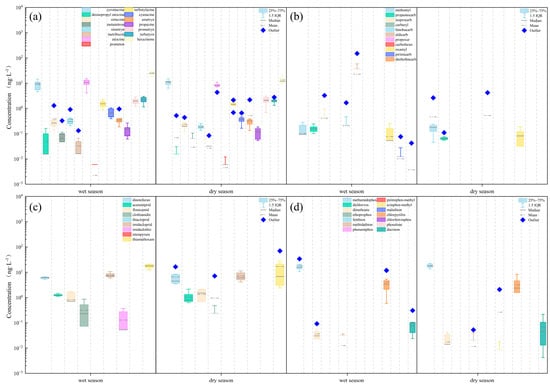
Figure 4.
Pesticide concentrations of (a) TPs, (b) CAs, (c) NEOs, (d) OPPs.
NEOs maintained relatively high residual concentrations in both seasons, while CAs showed consistently low levels. Pesticide residues in surface water are influenced by multiple factors, such as application intensity and geographical conditions. The Jiujiang area primarily employs a “rice–rice–rapeseed” triple-cropping system, which includes rice, rapeseed, cotton, and soybeans. This farming structure leads to the extensive use of herbicides (e.g., triazines) and insecticides (e.g., neonicotinoids). Precipitation runoff facilitates the transportation of these pesticides into water bodies, elevating contamination levels. As fourth-generation insecticides, NEOs are characterized by their systemic properties and broad-spectrum efficacy, leading to widespread use across China. Although the average concentration of NEOs was the highest among the four categories in this study, it remained lower than values reported in the Weihe River Basin (32.5 ng·L−1) and the Guangzhou section of the Pearl River (95.4 ng·L−1) [24]. Compared to major basins such as the Yangtze River and the Pearl River, the concentrations of TPs, CAs, and OPPs in the Jiujiang Port basin were generally lower. For instance, TP concentrations reached 106,000 ng·L−1 and 122,660 ng·L−1 in the Yangtze and Pearl Rivers, respectively, which are substantially higher than those in this study area. This discrepancy may be attributed to the relatively smaller area of agricultural land in the Jiujiang Port basin (approximately 3943.3 km2), compared to the Weihe River Basin (approximately 38,153.3 km2), the Yangtze River Basin (approximately 3,998,266.7 km2), and the Pearl River Basin (approximately 637,333.3 km2) [25].
Among the 49 pesticides analyzed, hexazinone showed significant concentration differences between hydrological seasons, with a mean concentration of 25.060 ng·L−1 during the wet season and 13.359 ng·L−1 during the dry season. The elevated concentration in the wet season may be attributed to increased application during the vigorous growth period of weeds. As an herbicide widely used to control both annual and perennial weeds, hexazinone is highly water-soluble and mobile, facilitating its transport into water bodies through runoff [26]. Furthermore, late October corresponds with the post-harvest period for major crops, resulting in a significant decline in pesticide application.
Spatially, pesticide residues generally exhibited a pattern of “high in the central area and low in the eastern and western regions” (Figure 5). Among the sampling sites, S5, located near Jiangzhou Island in Chaisang District, showed the highest concentrations. This area is characterized by fertile soil and favorable hydrothermal conditions, serving as a major agricultural zone primarily dedicated to coarse grains, vegetables, cotton, rapeseed, and Chinese medicinal herbs. During the dry season, the concentration of thiamethoxam at site S5 was notably high (69.952 ng·L−1). Thiamethoxam is commonly applied to control pests such as rice planthoppers, thrips, and aphids. Its elevated concentration is likely closely associated with local cropping patterns and pesticide application practices.
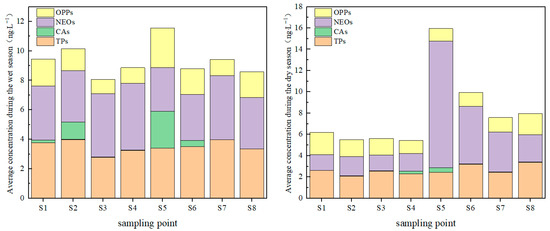
Figure 5.
Average concentration of each pesticide category at sampling sites across different periods.
3.3. Ecological Risk Assessment of Typical Pesticides
3.3.1. Results of Risk Quotient
The PNEC values for 49 pesticides were derived from the ECOTOX database or ECOSAR model predictions. Chronic toxicity data for the most sensitive species were selected, with priority given to the NOEC or EC10. If these were unavailable, the LOEC or EC50 was used. As shown in Figure 6, propamocarb had the highest PNEC value (920,000 ng·L−1), while diazinon had the lowest (0.005 ng·L−1). Ten pesticides exhibited PNEC values exceeding 1000 ng·L−1: cyromazine, isoprocarb, metamitron, oxamyl, prometon, nitenpyram, carbofuran, flonicamid, clothianidin, and propamocarb.
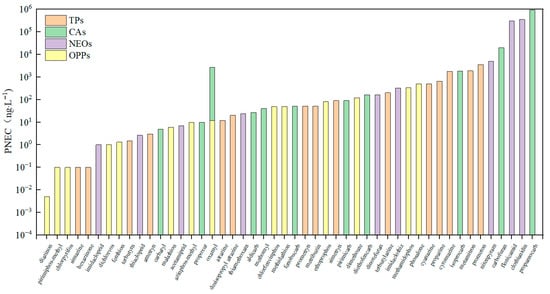
Figure 6.
Predicted no-effect concentration (PNEC) values for 49 pesticides.
An initial ecological risk assessment was conducted for the pesticides detected in the basin using the Risk Quotient method. As shown in Figure 7, eleven pesticides exhibited RQ values greater than 0.1 during the wet season, and ten did so during the dry season, indicating the presence of low risk or higher levels [27]. Imidacloprid, simazine, and terbutryn showed RQ values between 1 and 10 in at least one hydrological season, representing a moderate risk level. In contrast, hexazinone, chlorpyrifos, and diazinon demonstrated high risk, with RQ values exceeding 10. Hexazinone posed the highest risk, with an RQ value of 250.60 during the wet season, suggesting the greatest potential threat to aquatic organisms. Chlorpyrifos and diazinon followed, with maximum RQ values of 41.28 and 19.34, respectively. Wang et al. [28] reported that in the river network of the northwestern Taihu Lake Basin, pesticides such as parathion and carbendazim posed high risks to aquatic organisms during the dry season, whereas dimethomorph, difenoconazole, and azoxystrobin were associated with low risk levels. During the wet season, pesticides including phoxim, parathion, and carbendazim presented high risks, while triazophos, triadimefon, dimethomorph, and azoxystrobin fell into the low-risk category. Overall, the risk levels observed in this study are consistent with those reported in other regions, though certain substances, particularly hexazinone, stand out as being of greater concern.
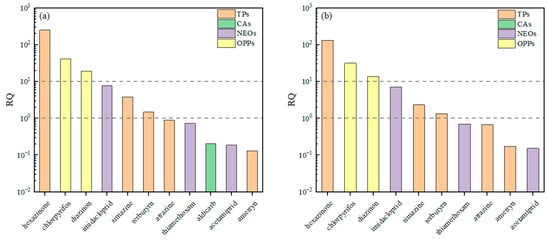
Figure 7.
RQ values for pesticides: (a) wet season, (b) dry season.
3.3.2. Results of Semi-Probabilistic Risk Assessment
The risk ranking of pesticides based on RQf values is shown in Figure 8. During the wet season, nine pesticides posed ecological risks, with RQf values ranging from 0.0128 to 250.5975. Among these, six pesticides had RQf values exceeding 1 (hexazinone, chlorpyrifos, diazinon, imidacloprid, simazine, and terbutryn). Similarly, during the dry season, nine pesticides showed ecological risks, with RQf values between 0.0012 and 133.5864, and six of them exhibited RQf values greater than 1 (hexazinone, chlorpyrifos, diazinon, imidacloprid, simazine, and terbutryn). These results indicate that hexazinone, chlorpyrifos, diazinon, imidacloprid, simazine, and terbutryn consistently posed relatively high ecological risks to aquatic organisms in the Jiujiang Port Basin during both seasons. Existing research has demonstrated that pesticide contamination can significantly impact macrozoobenthos, with independent effects of 18.46% on α-functional diversity and 14.6% on β-functional diversity [29]. Atrazine presented a moderate risk in both seasons, while thiamethoxam and aldicarb posed low or negligible risks. Compared with a study in the Dongting Lake Basin [30], hexazinone, simazine, and imidacloprid also demonstrated high risks, with product values for RQ and exceedance frequency (PI values) of 178.63, 83.89, and 39.60, respectively, suggesting that these pesticides pose significant ecological threat across multiple river basins.
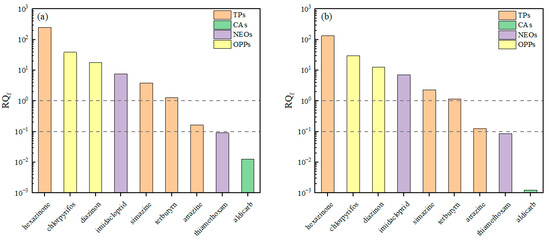
Figure 8.
RQf values for pesticides: (a) wet season, (b) dry season.
3.3.3. Results of Joint Probability Curves
JPCs were developed for six high-risk pesticides—hexazinone, chlorpyrifos, diazinon, imidacloprid, simazine, and terbutryn—to assess their ecological risks probabilistically (Figure 9). The maximum risk product (RP) for hexazinone was 3.29%, resulting in 0.3–6% of species being subject to moderate risk. Chlorpyrifos, imidacloprid, and terbutryn exhibited low risk, with maximum RP values of 0.25%, 1.40%, and 0.59%, respectively. Diazinon and simazine posed negligible risk. Compared to the RQf method, the JPC approach integrates toxicity data from multiple species and trophic levels, reducing assessment uncertainty through species sensitivity distributions and avoiding the over- or underestimation of risk based on the most sensitive endpoints. For instance, while diazinon was identified as high-risk using the RQf method (RQfmax = 18.13), the JPC evaluation indicated negligible overall risk (RP = 0.02%), suggesting that its high sensitivity in certain species does not translate to significant community-level risk. The JPC method offers greater ecological relevance for assessing contaminants with strong bioaccumulation potential and wide migration ranges, thereby providing a more scientifically robust basis for risk management decisions.
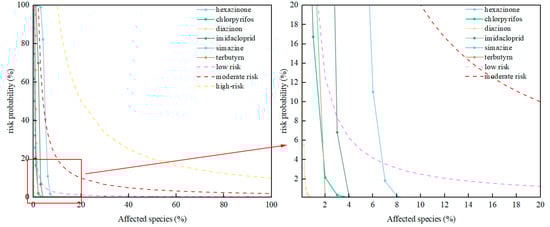
Figure 9.
Joint Probability Curves for high-risk pesticides.
3.4. Comparison with Regulatory Standards and Implications
The concentrations of pesticides detected were compared with the limit values stipulated in China’s key water quality standards, including the ‘Environmental Quality Standards for Surface Water (GB 3838-2002)’ [31] and the ‘Standards for Drinking Water Quality (GB 5749-2022)’ [32], which includes specific limits for centralized domestic drinking water source areas. Our analysis reveals a critical and multi-faceted disconnect between regulatory benchmarks and ecological risk. Among the 49 pesticides analyzed, only a handful are regulated. For instance, dichlorvos and malathion have a standard limit of 50 μg·L−1 in Class I-III surface waters (GB 3838-2002) and protected water sources (GB 18918-2002). Both of these compounds were undetected in our study, indicating compliance regarding these specific substances. Similarly, atrazine is regulated under GB 18918-2002, with a limit of 3 μg·L−1. While the concentrations of atrazine found in our study (mean: 9.375 ng·L−1) were well below this regulatory threshold, its 100% detection frequency, coupled with its known ecological impact, highlights its pervasive presence and potential to cause chronic effects.
A particularly revealing case is that of chlorpyrifos. Its maximum mean concentration in our study (3.656 ng·L−1) was orders of magnitude lower than the 30 μg·L−1 limit set for drinking water (GB 5749-2022), indicating no immediate concern for human health. However, our ecological risk assessment identified chlorpyrifos as posing a high ecological risk (RQ up to 41.3), demonstrating that standards designed to protect human health are insufficient to protect aquatic organisms. Most importantly, for other key pesticides identified as posing moderate-to-high ecological risks—such as hexazinone, imidacloprid, thiamethoxam, and diazinon—no mandatory environmental quality standards exist in China. This regulatory gap is alarming. The high RQ value for hexazinone (up to 250.6) signals a severe threat to aquatic ecosystem integrity that is entirely outside the scope of current regulations.
These discrepancies underscore the urgent need to update China’s water quality standards by incorporating ecology-based criteria and including more contemporary pesticides [33]. Our results show the pressing need for the prioritization and inclusion of compounds such as hexazinone, chlorpyrifos, certain neonicotinoids, and organophosphates in future revisions of the regulatory framework to enable more effective and proactive environmental protection.
4. Conclusions
This study revealed widespread pesticide contamination in the Jiujiang Port Basin, with 18 compounds detected at all sampling sites. Hexazinone, thiamethoxam, and methamidophos exhibited the highest residual concentrations—19.209, 17.123, and 17.850 ng·L−1, respectively—and should be prioritized in future management strategies. Residual levels were generally higher during the wet season, with neonicotinoids consistently dominating across both seasons. Regarding spatial distribution, elevated concentrations were detected in central agricultural zones such as site S5. Based on the risk assessment, 11 pesticides posed at least a low risk, with hexazinone, chlorpyrifos, and diazinon identified as high-risk using the RQ and RQf methods, while probabilistic JPC analysis indicated that hexazinone poses a moderate risk to 0.3–6% of aquatic species. Future studies should emphasize higher-spatiotemporal-resolution monitoring, GIS-supported risk mapping, assessing the synergistic toxicity effects of mixed pollutants, and the integration of climate and agricultural changes into predictive models for enhanced risk management and ecological protection. To effectively protect aquatic ecosystems, China’s water quality standards must be updated to incorporate ecology-based criteria, especially for pesticides that pose a high ecological risk but currently have no regulatory limits, such as hexazinone and chlorpyrifos.
Author Contributions
Methodology, D.G., Y.M. and M.C.; Formal analysis, Y.M.; Investigation, D.G., X.Z., H.R. and M.Y.; Data curation, X.Z., H.R. and M.Y.; Writing—original draft, D.G.; Writing—review & editing, D.G. and M.C.; Supervision, Y.M.; Project administration, M.C.; Funding acquisition, D.G. and M.C. All authors have read and agreed to the published version of the manuscript.
Funding
This work was funded by Projects of Key Scientific Research in Higher Education Institutions of Henan Province (23B610011), the Natural Science Foundation of Jiangxi Province (20242BAB20151, 20252BAC240303), the National Natural Science Foundation of China (42507391), and Central Plain’s Leading Scientific and Technological Innovators (244200510007).
Data Availability Statement
The original contributions presented in this study are included in the article. Further inquiries can be directed toward the corresponding author.
Conflicts of Interest
The authors declare no conflicts of interest.
References
- Gouin, N.; Bertin, A.; Snow, D.D.; Lozada, A.; Grandjean, F.; Kolok, A.S. Occurrence and environmental risk assessment of pesticides reveal important threats to aquatic organisms in precordilleran rivers of north-central Chile. Sci. Total Environ. 2025, 984, 179701. [Google Scholar] [CrossRef]
- Asefa, E.M.; Mergia, M.T.; Ayele, S.; Damtew, Y.T.; Teklu, B.M.; Weldemariam, E.D. Pesticides in Ethiopian surface waters: A meta-analytic based ecological risk assessment. Sci. Total Environ. 2024, 911, 168727. [Google Scholar] [CrossRef]
- AbuQamar, S.F.; El-Saadony, M.T.; Alkafaas, S.S.; Elsalahaty, M.I.; Elkafas, S.S.; Mathew, B.T.; Aljasmi, A.N.; Alhammadi, H.S.; Salem, H.M.; El-Mageed, T.A.A.; et al. Ecological impacts and management strategies of pesticide pollution on aquatic life and human beings. Mar. Pollut. Bull. 2024, 206, 116613. [Google Scholar] [CrossRef]
- Bu, C.; Chen, C.; Fu, X.; Zhang, W.; Zhang, R.; Hua, Y.; Jia, R.; Ruan, Y.; Leung, K.M.Y.; Ma, L. Spatial distribution, phase partitioning, and ecological risk assessment of typical pesticides in Yangtze River Basin. J. Hazard. Mater. 2025, 494, 138674. [Google Scholar] [CrossRef]
- Lv, L.; Cui, S.; Zhang, H.; Qi, W.; Liu, X.; Jiang, J.; Jiang, J.; Zhu, Z.; Gao, H. Spatial pattern and compositional distribution of organochlorine pesticides in the black soil region of Shenyang. Environ. Res. 2024, 263, 120228. [Google Scholar] [CrossRef] [PubMed]
- Zhu, W.; Wang, R.M. Impact of farm size on intensity of pesticide use: Evidence from China. Sci. Total Environ. 2021, 753, 141696. [Google Scholar] [CrossRef] [PubMed]
- GB 2763-2021; National Food Safety Standard—Maximum Residue Limits for Pesticides in Food. Standards Press of China: Beijing, China, 2021.
- Zhou, Y.; Zhang, Z.; Jing, J.; Bao, F.; Wu, L.; Du, Y.; Zhang, H. Integrating environmental carry capacity based on pesticide risk assessment in soil management: A case study for China. J. Hazard. Mater. 2023, 460, 132341. [Google Scholar] [CrossRef]
- Asefa, E.M.; Damtew, Y.T.; Ober, J. Pesticide water pollution, human health risks, and regulatory evaluation: A nationwide analysis in Ethiopia. J. Hazard. Mater. 2024, 478, 135326. [Google Scholar] [CrossRef] [PubMed]
- Chen, J.; Zhao, L.; Wang, B.; He, X.; Duan, L.; Yu, G. Uncovering global risk to human and ecosystem health from pesticides in agricultural surface water using a machine learning approach. Environ. Int. 2024, 194, 109154. [Google Scholar] [CrossRef]
- Li, W.; Mao, X.; Deng, W.; Wang, S. Prediction of pesticide runoff at the global scale and its key influencing factors. J. Hazard. Mater. 2025, 494, 138783. [Google Scholar] [CrossRef]
- Cai, F.; Shen, J.; Wang, X.; Feng, J.; Wang, T.; Wang, R. Pesticide dynamics and risk assessment in a plateau lake: Multiphase partitioning, drivers, and distribution in Southwestern China. J. Hazard. Mater. 2025, 487, 137171. [Google Scholar] [CrossRef]
- Cajas-Salazar, A.; Pérez-Rojas, G.; Vega-Guzmán, I.; Alfaro-Arrieta, E.; Beita-Sandí, W.; González-Pujol, M.; Rodríguez-Rodríguez, C.E.; Méndez-Rivera, M.; Castro-Gutiérrez, V. Occurrence and environmental risk assessment of pesticides in urban wastewater in Costa Rica. Environ. Pollut. 2025, 385, 127172. [Google Scholar] [CrossRef]
- Barbieri, M.V.; Peris, A.; Postigo, C.; Moya-Garcés, A.; Monllor-Alcaraz, L.S.; Rambla-Alegre, M.; Eljarrat, E.; de Alda, M.L. Evaluation of the occurrence and fate of pesticides in a typical Mediterranean delta ecosystem (Ebro River Delta) and risk assessment for aquatic organisms. Environ. Pollut. 2021, 274, 115813. [Google Scholar] [CrossRef]
- Brovini, E.M.; de Deus, B.C.T.; Vilas-Boas, J.A.; Quadra, G.R.; Carvalho, L.; Mendonça, R.F.; Pereira, R.d.O.; Cardoso, S.J. Three-bestseller pesticides in Brazil: Freshwater concentrations and potential environmental risks. Sci. Total Environ. 2021, 771, 144754. [Google Scholar] [CrossRef] [PubMed]
- Cao, R.; Sun, Y.; Sun, S.; Sun, X.; Meng, F.; Xia, Y.; Gao, Y.; Geng, N.; Zhang, H.; Chen, J. Organic micropollutants in surface water across China: Occurrence and ecological risk. Water Res. 2025, 281, 123616. [Google Scholar] [CrossRef]
- Yuan, L.; Wu, Y.; Shi, L.; Song, J.; Jiang, Y. Organochlorine pesticides and polychlorinated biphenyls in sediments of the Lanzhou reach of Yellow River (China): Spatial distribution, sources and risk assessment. Mar. Pollut. Bull. 2024, 208, 116962. [Google Scholar] [CrossRef] [PubMed]
- Li, W.; Xin, S.; Deng, W.; Wang, B.; Liu, X.; Yuan, Y.; Wang, S. Occurrence, spatiotemporal distribution patterns, partitioning and risk assessments of multiple pesticide residues in typical estuarine water environments in eastern China. Water Res. 2023, 245, 120570. [Google Scholar] [CrossRef]
- Lv, J.; Guo, C.; Luo, Y.; Liu, Y.; Deng, Y.; Sun, S.; Xu, J. Spatial distribution, receptor modelling and risk assessment of organophosphate esters in surface water from the largest freshwater lake in China. Ecotoxicol. Environ. Saf. 2022, 238, 113618. [Google Scholar] [CrossRef]
- Wu, C.; He, K.; Li, H.; Zhang, L.; Mao, L.; Zhu, L.; Jiang, J.; Liu, X. Transgenerational combined toxicity effects of neonicotinoids and triazole pesticides at environmentally relevant concentrations on D. magna: From individual to population level. J. Hazard. Mater. 2025, 486, 137023. [Google Scholar] [CrossRef]
- De Araújo, E.P.; Caldas, E.D.; Oliveira-Filho, E.C. Relationship between pesticide standards for classification of water bodies and ecotoxicity: A case study of the Brazilian Directive. Toxics 2022, 10, 767. [Google Scholar] [CrossRef] [PubMed]
- Iturburu, F.G.; Bertrand, L.; Soursou, V.; Scheibler, E.E.; Calderon, G.; Altamirano, J.C.; Amé, M.V.; Menone, M.L.; Picó, Y. Pesticides and PPCPs in aquatic ecosystems of the andean central region: Occurrence and ecological risk assessment in the Uco valley. J. Hazard. Mater. 2024, 465, 133274. [Google Scholar] [CrossRef]
- Fang, J.; Hou, L.; Guo, X.Y.; Jia, S.Q.; Ma, W.P.; Yang, Z.; Jin, X.W. Pollution characteristics and ecological risk assessment of typical pesticides in Weihe River Basin. Asian J. Ecotoxicol. 2025, 20, 1–16. [Google Scholar]
- Zhao, J.; Dai, Y.; Wang, L.; Lu, D.; Cui, X.; Lu, L.; Zhang, J.; Li, K.; Wang, X. Spatiotemporal distribution and fate of typical pesticides in the Bohai Sea and surrounding rivers, China. Environ. Pollut. 2025, 371, 125934. [Google Scholar] [CrossRef]
- Zhang, X.; Jiang, Y.; Zeng, Y.; Guo, J.; Long, L.; Pan, Z.; Tian, Y.; Zhang, Y.; Luo, X.; Peng, P.; et al. Seasonal bioaccumulation and biomagnification of typical organochlorine pesticides in the Pearl River Estuary, South China. Environ. Pollut. 2025, 383, 126855. [Google Scholar] [CrossRef] [PubMed]
- Ouyang, W.; Cai, G.; Tysklind, M.; Yang, W.; Hao, F.; Liu, H. Temporal-spatial patterns of three types of pesticide loadings in a middle-high latitude agricultural watershed. Water Res. 2017, 122, 377–386. [Google Scholar] [CrossRef] [PubMed]
- Li, X.; Song, S.; Wei, F.; Huang, X.; Guo, Y.; Zhang, T. Occurrence, distribution, and translocation of legacy and current-use pesticides in pomelo orchards in South China. Sci. Total Environ. 2024, 913, 169674. [Google Scholar] [CrossRef]
- Wang, T.; Zhong, M.; Lu, M.; Xu, D.; Xue, Y.; Huang, J.; Blaney, L.; Yu, G. Occurrence, spatiotemporal distribution, and risk assessment of current-use pesticides in surface water: A case study near Taihu Lake, China. Sci. Total Environ. 2021, 782, 146826. [Google Scholar] [CrossRef] [PubMed]
- Hou, L.; Xiong, W.; Chen, M.; Xu, J.; Johnson, A.C.; Zhan, A.; Jin, X. Pesticide Pollution Reduces the Functional Diversity of Macroinvertebrates in Urban Aquatic Ecosystems. Environ. Sci. Technol. 2025, 59, 8568–8577. [Google Scholar] [CrossRef]
- Guo, S.; Zhang, S.; Zhang, J.; Lei, J.; Chen, H. Occurrence, residue level, distribution and risk assessment of pesticides in the typical polder areas of Lake Dongting. J. Hazard. Mater. 2025, 496, 139530. [Google Scholar] [CrossRef]
- GB 3838-2002; Environmental Quality Standards for Surface Water. China Environmental Science Press: Beijing, China, 2002.
- GB 5749-2022; Standards for Drinking Water Quality. China Standards Press: Beijing, China, 2022.
- Xie, Y.; Liu, Q.; Xu, X.; Lin, L.; Wang, W.; Wang, D. Comprehensive Analysis of Pesticide Pollution across the Yangtze River Basin: Spatiotemporal Distribution, Socio-Economic Correlations, and Ecological Risk Assessment. ACS EST Water 2025, 5, 1971–1981. [Google Scholar] [CrossRef]
Disclaimer/Publisher’s Note: The statements, opinions and data contained in all publications are solely those of the individual author(s) and contributor(s) and not of MDPI and/or the editor(s). MDPI and/or the editor(s) disclaim responsibility for any injury to people or property resulting from any ideas, methods, instructions or products referred to in the content. |
© 2025 by the authors. Licensee MDPI, Basel, Switzerland. This article is an open access article distributed under the terms and conditions of the Creative Commons Attribution (CC BY) license (https://creativecommons.org/licenses/by/4.0/).